Attached files
| file | filename |
|---|---|
| EX-99.1 - EX-99.1 - Primis Financial Corp. | d161890dex991.htm |
| 8-K - 8-K - Primis Financial Corp. | frst-8k_20210429.htm |
First Quarter 2021 NASDAQ: FRST Exhibit 99.2
This presentation and certain of our other filings with the Securities and Exchange Commission contain statements that constitute “forward-looking statements” within the meaning of, and subject to the protections of, Section 27A of the Securities Act of 1933, as amended, and Section 21E of the Securities Exchange Act of 1934, as amended. All statements other than statements of historical fact are forward-looking statements. Such statements can generally be identified by such words as "may," "plan," "contemplate," "anticipate," "believe," "intend," "continue," "expect," "project," "predict," "estimate," "could," "should," "would," "will," and other similar words or expressions of the future or otherwise regarding the outlook for the Company’s future business and financial performance and/or the performance of the banking industry and economy in general. These forward-looking statements include, but are not limited to, our expectations regarding our future operating and financial performance, including our outlook and long-term goals for future growth; our expectations regarding net interest margin; expectations on our growth strategy, expense management, capital management and future profitability; expectations on credit quality and performance; statements regarding the potential effects of the COVID-19 pandemic on our business and financial results and conditions; and the assumptions underlying our expectations. Prospective investors are cautioned that any such forward-looking statements are not guarantees of future performance and involve known and unknown risks and uncertainties which may cause the actual results, performance or achievements of the Company to be materially different from the future results, performance or achievements expressed or implied by such forward-looking statements. Forward-looking statements are based on the information known to, and current beliefs and expectations of, the Company’s management and are subject to significant risks and uncertainties. Actual results may differ materially from those contemplated by such forward-looking statements. Factors that might cause such differences include, but are not limited to: the Company’s ability to implement its various strategic and growth initiatives, including its announced new digital bank; competitive pressures among financial institutions increasing significantly; changes in economic or political conditions, either nationally or locally, particularly in areas in which the Company conducts operations; interest rate risk; changes in applicable laws, rules, or regulations, including changes to statutes, regulations or regulatory policies or practices as a result of, or in response to the COVID-19 pandemic; changes in management’s plans for the future; credit risk associated with our lending activities; changes in interest rates, loan demand, real estate values, or competition; changes in accounting principles, policies, or guidelines; adverse results from current or future litigation, regulatory examinations or other legal and/or regulatory actions, including as a result of the Company’s participation in and execution of government programs related to the COVID-19 pandemic; the impact of the COVID-19 pandemic on the Company’s assets, business, cash flows, financial condition, liquidity, prospects and results of operations; potential increases in the provision for loan losses resulting from the COVID-19 pandemic; and other general competitive, economic, political, and market factors, including those affecting our business, operations, pricing, products, or services. Forward-looking statements speak only as of the date on which such statements are made. These forward-looking statements are based upon information presently known to the Company’s management and are inherently subjective, uncertain and subject to change due to any number of risks and uncertainties, including, without limitation, the risks and other factors set forth in the Company’s filings with the Securities and Exchange Commission, the Company’s Annual Report on Form 10-K for the year ended December 31, 2020, under the captions “Cautionary Note Regarding Forward-Looking Statements” and “Risk Factors,” and in the Company’s Quarterly Reports on Form 10-Q and Current Reports on Form 8-K. The Company undertakes no obligation to update any forward-looking statement to reflect events or circumstances after the date on which such statement is made, or to reflect the occurrence of unanticipated events. Readers are cautioned not to place undue reliance on these forward-looking statements. 2 Forward-Looking Statements
Statements included in this presentation include non-GAAP financial measures and should be read along with the accompanying tables. Primis uses non-GAAP financial measures to analyze its performance. The measures entitled pre-tax pre-provision operating earnings; pre-tax pre-provision operating return on average assets; tangible common equity; tangible common equity to tangible assets; tangible book value per share; and net interest margin excluding PPP loans are not measures recognized under GAAP and therefore are considered non-GAAP financial measures. A reconciliation of these non-GAAP financial measures to the most comparable GAAP measures is provided in the Reconciliation of Non-GAAP items table. Management believes that these non-GAAP financial measures provide additional useful information about Primis that allows management and investors to evaluate the ongoing operating results, financial strength and performance of Primis and provide meaningful comparison to its peers. Non-GAAP financial measures should not be considered as an alternative to any measure of performance or financial condition as promulgated under GAAP, and investors should consider Primis’s performance and financial condition as reported under GAAP and all other relevant information when assessing the performance or financial condition of Primis. Non-GAAP financial measures are not standardized and, therefore, it may not be possible to compare these measures with other companies that present measures having the same or similar names. Non-GAAP financial measures have limitations as analytical tools, and investors should not consider them in isolation or as a substitute for analysis of the results or financial condition as reported under GAAP. 3 Non-GAAP Measures
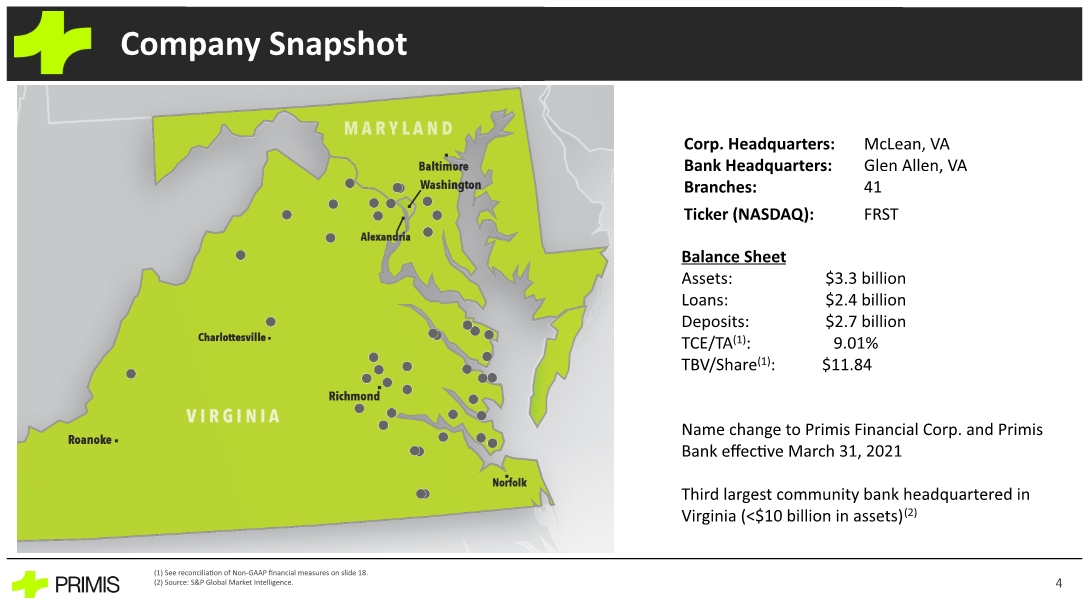
Company Snapshot 4 Corp. Headquarters: McLean, VA Bank Headquarters: Glen Allen, VA Branches: 41 Ticker (NASDAQ): FRST Balance Sheet Assets: $3.3 billion Loans: $2.4 billion Deposits: $2.7 billion TCE/TA(1): 9.01% TBV/Share(1): $11.84 Name change to Primis Financial Corp. and Primis Bank effective March 31, 2021 Third largest community bank headquartered in Virginia (<$10 billion in assets)(2) (1) See reconciliation of Non-GAAP financial measures on slide 18. (2) Source: S&P Global Market Intelligence.
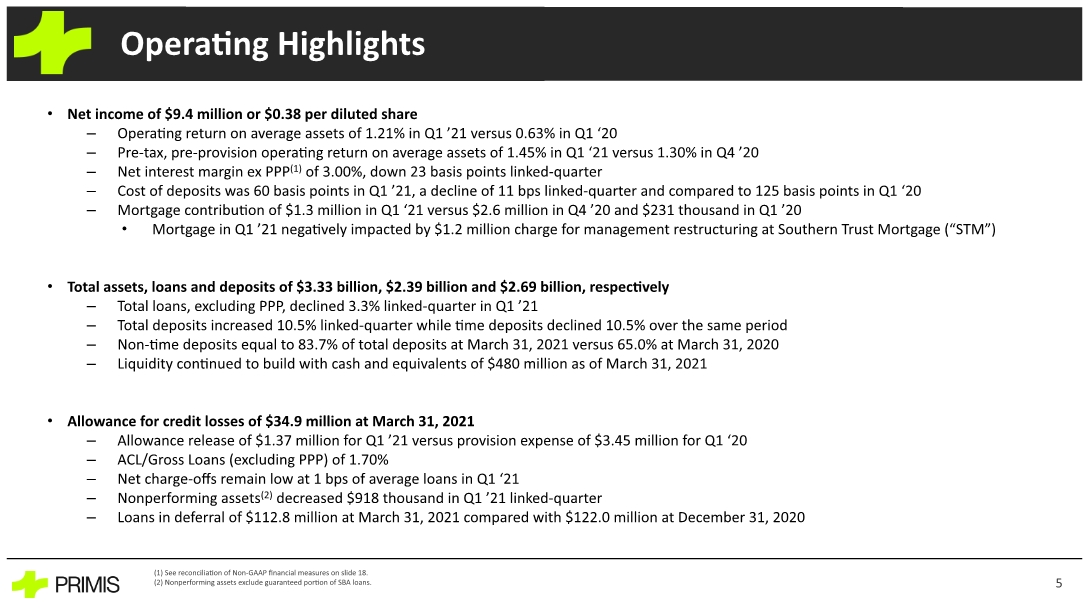
(1) See reconciliation of Non-GAAP financial measures on slide 18. (2) Nonperforming assets exclude guaranteed portion of SBA loans. Net income of $9.4 million or $0.38 per diluted share Operating return on average assets of 1.21% in Q1 ’21 versus 0.63% in Q1 ‘20 Pre-tax, pre-provision operating return on average assets of 1.45% in Q1 ‘21 versus 1.30% in Q4 ’20 Net interest margin ex PPP(1) of 3.00%, down 23 basis points linked-quarter Cost of deposits was 60 basis points in Q1 ’21, a decline of 11 bps linked-quarter and compared to 125 basis points in Q1 ‘20 Mortgage contribution of $1.3 million in Q1 ‘21 versus $2.6 million in Q4 ’20 and $231 thousand in Q1 ’20 Mortgage in Q1 ’21 negatively impacted by $1.2 million charge for management restructuring at Southern Trust Mortgage (“STM”) Total assets, loans and deposits of $3.33 billion, $2.39 billion and $2.69 billion, respectively Total loans, excluding PPP, declined 3.3% linked-quarter in Q1 ’21 Total deposits increased 10.5% linked-quarter while time deposits declined 10.5% over the same period Non-time deposits equal to 83.7% of total deposits at March 31, 2021 versus 65.0% at March 31, 2020 Liquidity continued to build with cash and equivalents of $480 million as of March 31, 2021 Allowance for credit losses of $34.9 million at March 31, 2021 Allowance release of $1.37 million for Q1 ’21 versus provision expense of $3.45 million for Q1 ‘20 ACL/Gross Loans (excluding PPP) of 1.70% Net charge-offs remain low at 1 bps of average loans in Q1 ‘21 Nonperforming assets(2) decreased $918 thousand in Q1 ’21 linked-quarter Loans in deferral of $112.8 million at March 31, 2021 compared with $122.0 million at December 31, 2020 Operating Highlights 5
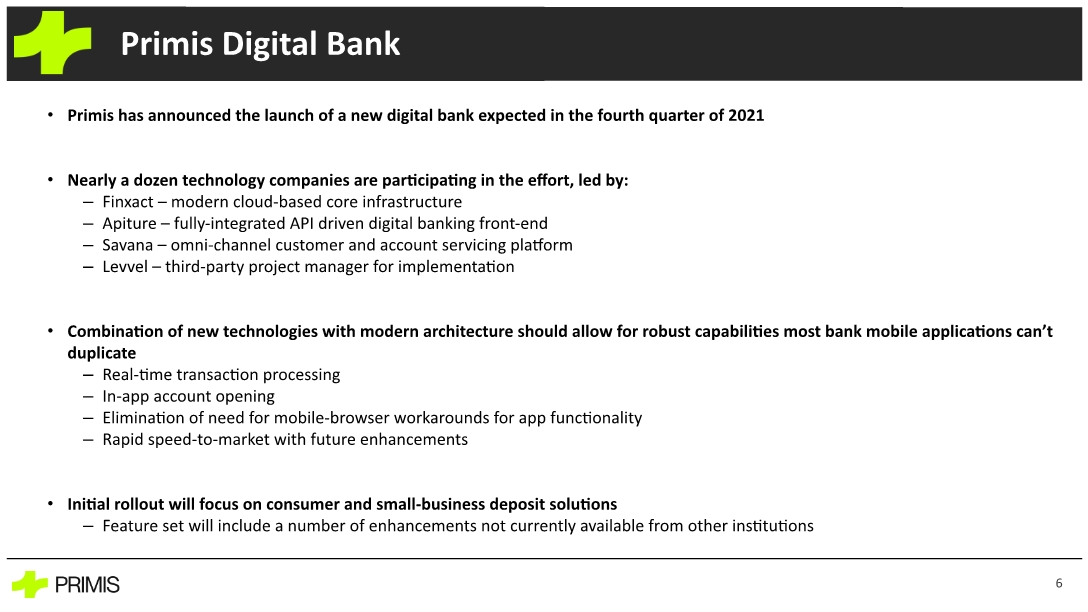
Primis has announced the launch of a new digital bank expected in the fourth quarter of 2021 Nearly a dozen technology companies are participating in the effort, led by: Finxact – modern cloud-based core infrastructure Apiture – fully-integrated API driven digital banking front-end Savana – omni-channel customer and account servicing platform Levvel – third-party project manager for implementation Combination of new technologies with modern architecture should allow for robust capabilities most bank mobile applications can’t duplicate Real-time transaction processing In-app account opening Elimination of need for mobile-browser workarounds for app functionality Rapid speed-to-market with future enhancements Initial rollout will focus on consumer and small-business deposit solutions Feature set will include a number of enhancements not currently available from other institutions Primis Digital Bank 6
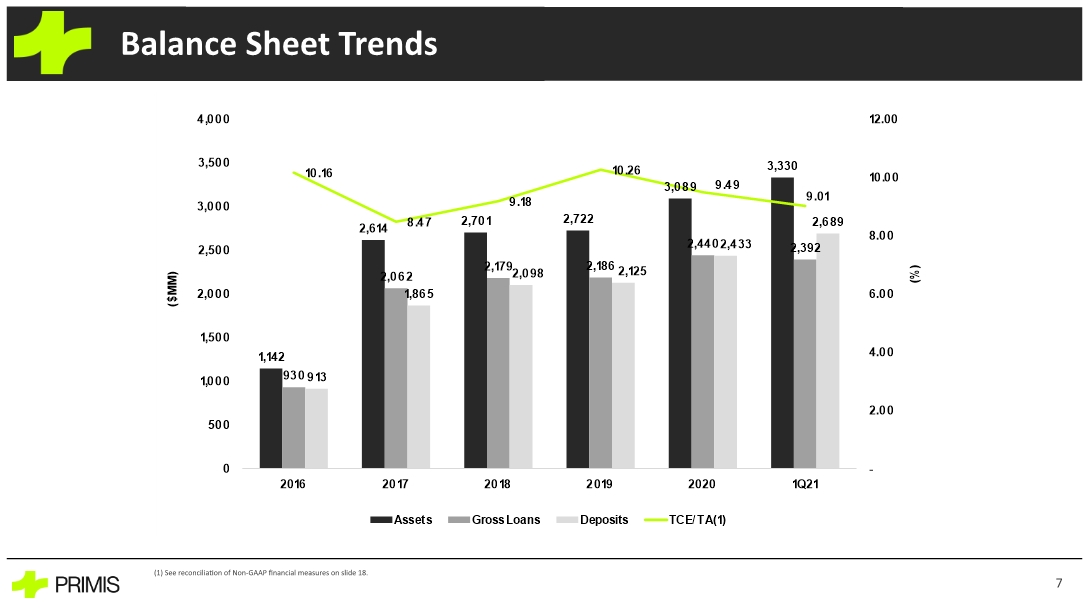
(1) See reconciliation of Non-GAAP financial measures on slide 18. Balance Sheet Trends 7
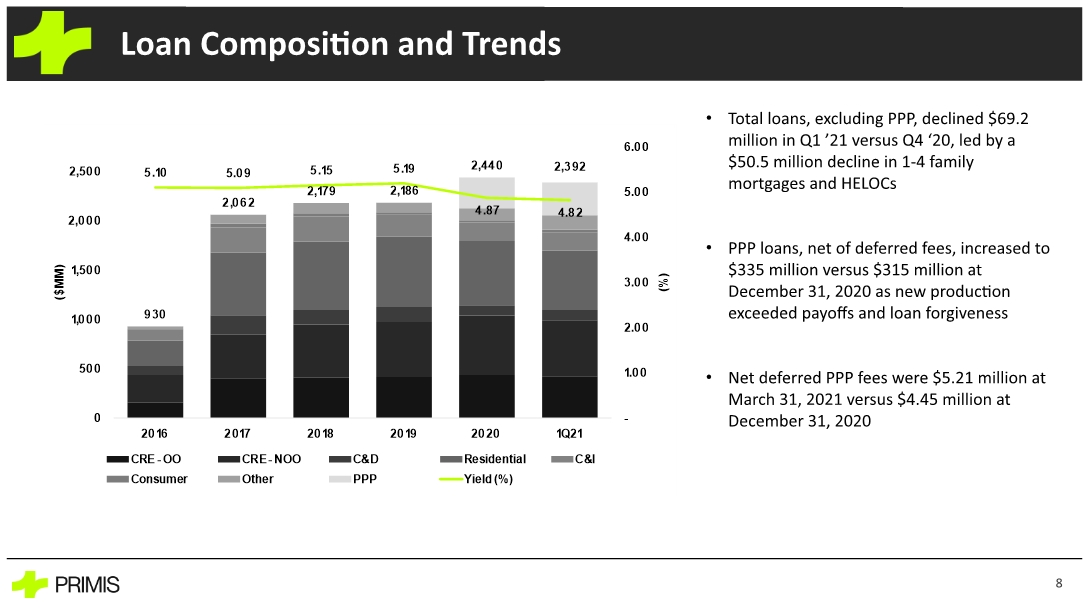
Total loans, excluding PPP, declined $69.2 million in Q1 ’21 versus Q4 ‘20, led by a $50.5 million decline in 1-4 family mortgages and HELOCs PPP loans, net of deferred fees, increased to $335 million versus $315 million at December 31, 2020 as new production exceeded payoffs and loan forgiveness Net deferred PPP fees were $5.21 million at March 31, 2021 versus $4.45 million at December 31, 2020 Loan Composition and Trends 8
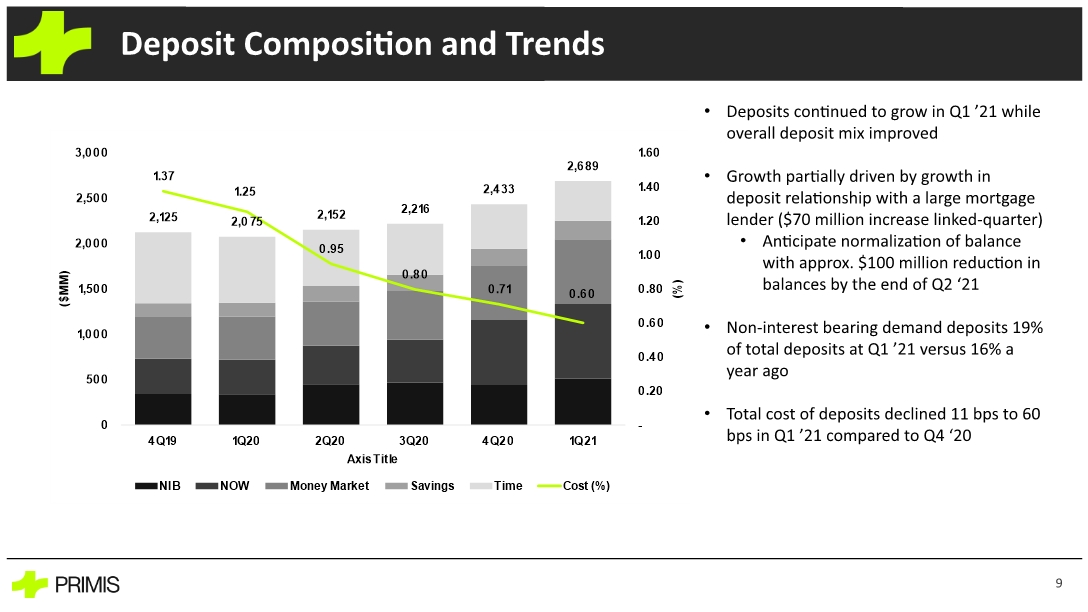
Deposits continued to grow in Q1 ’21 while overall deposit mix improved Growth partially driven by growth in deposit relationship with a large mortgage lender ($70 million increase linked-quarter) Anticipate normalization of balance with approx. $100 million reduction in balances by the end of Q2 ‘21 Non-interest bearing demand deposits 19% of total deposits at Q1 ’21 versus 16% a year ago Total cost of deposits declined 11 bps to 60 bps in Q1 ’21 compared to Q4 ‘20 Deposit Composition and Trends 9
Asset Quality 10
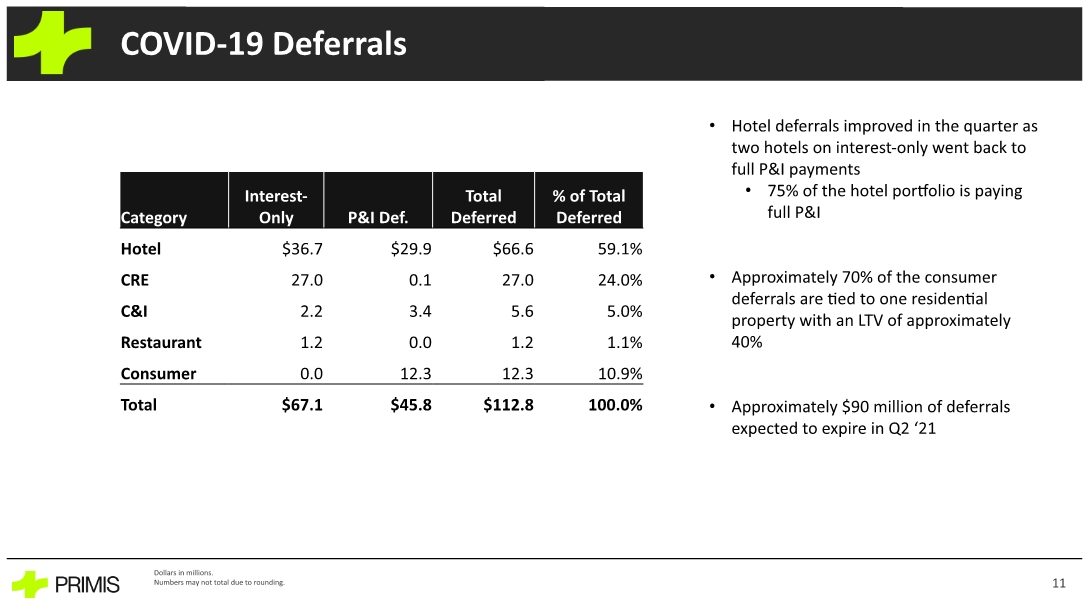
Dollars in millions. Numbers may not total due to rounding. Hotel deferrals improved in the quarter as two hotels on interest-only went back to full P&I payments 75% of the hotel portfolio is paying full P&I Approximately 70% of the consumer deferrals are tied to one residential property with an LTV of approximately 40% Approximately $90 million of deferrals expected to expire in Q2 ‘21 COVID-19 Deferrals 11
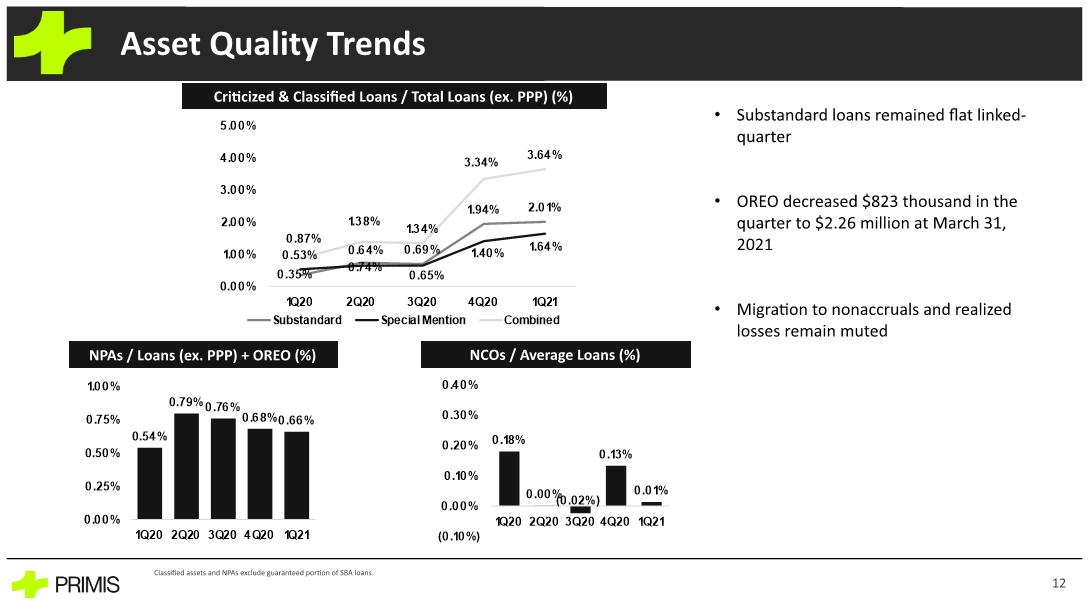
Classified assets and NPAs exclude guaranteed portion of SBA loans. NPAs / Loans (ex. PPP) + OREO (%) NCOs / Average Loans (%) Substandard loans remained flat linked-quarter OREO decreased $823 thousand in the quarter to $2.26 million at March 31, 2021 Migration to nonaccruals and realized losses remain muted Criticized & Classified Loans / Total Loans (ex. PPP) (%) Asset Quality Trends 12
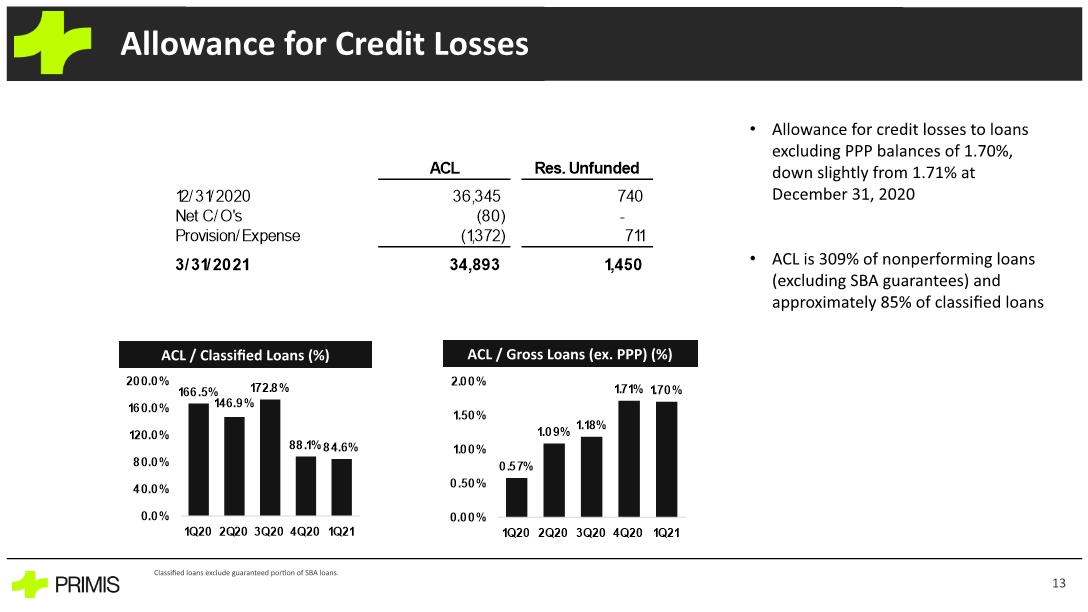
ACL / Classified Loans (%) ACL / Gross Loans (ex. PPP) (%) Allowance for credit losses to loans excluding PPP balances of 1.70%, down slightly from 1.71% at December 31, 2020 ACL is 309% of nonperforming loans (excluding SBA guarantees) and approximately 85% of classified loans Allowance for Credit Losses Classified loans exclude guaranteed portion of SBA loans. 13
Profitability 14
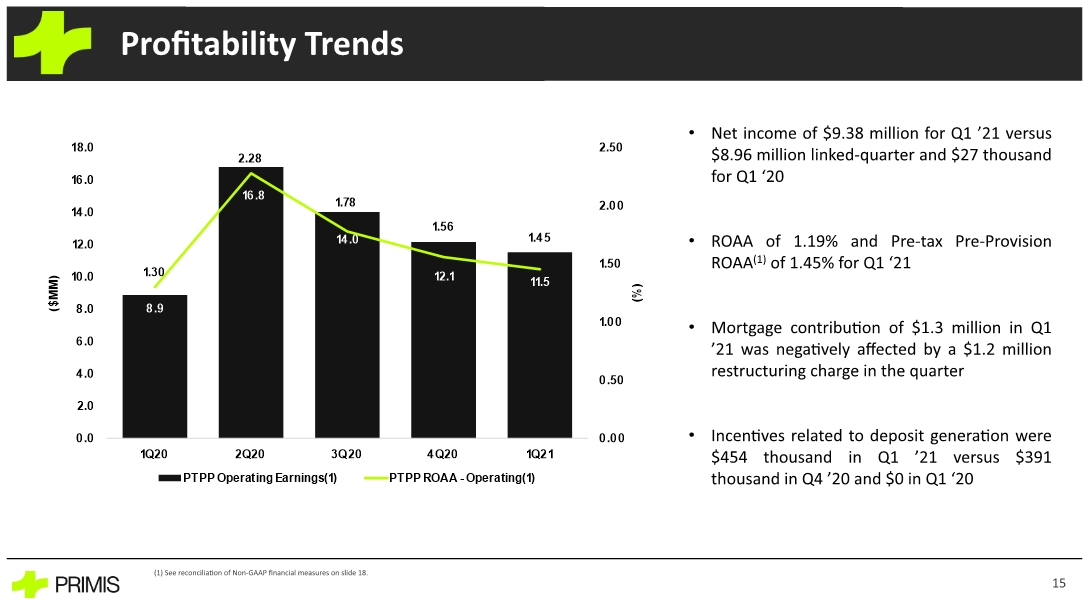
(1) See reconciliation of Non-GAAP financial measures on slide 18. Net income of $9.38 million for Q1 ’21 versus $8.96 million linked-quarter and $27 thousand for Q1 ‘20 ROAA of 1.19% and Pre-tax Pre-Provision ROAA(1) of 1.45% for Q1 ‘21 Mortgage contribution of $1.3 million in Q1 ’21 was negatively affected by a $1.2 million restructuring charge in the quarter Incentives related to deposit generation were $454 thousand in Q1 ’21 versus $391 thousand in Q4 ’20 and $0 in Q1 ‘20 Profitability Trends 15
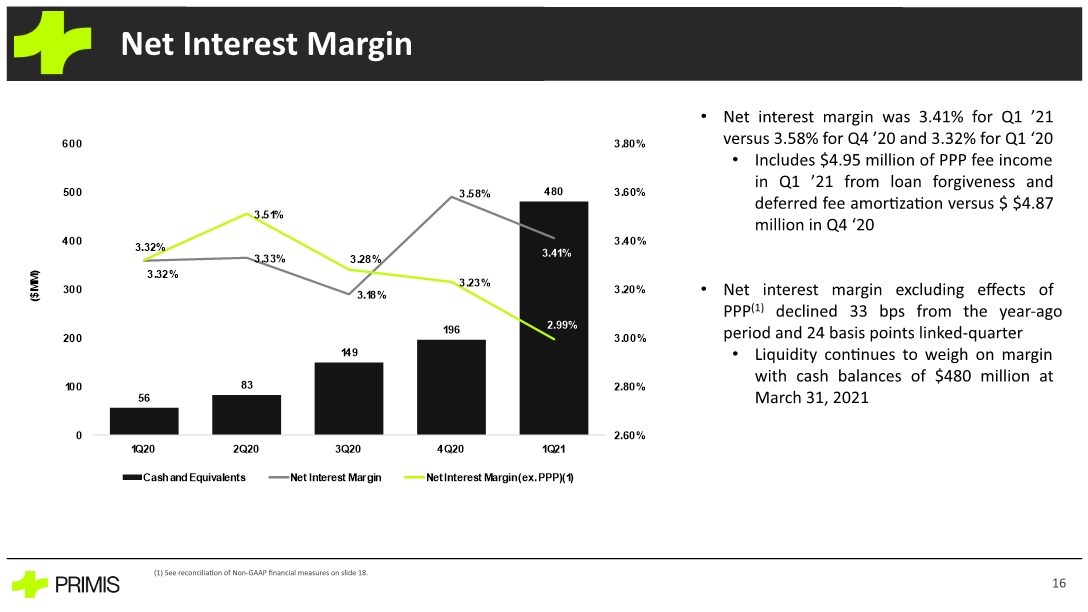
(1) See reconciliation of Non-GAAP financial measures on slide 18. Net interest margin was 3.41% for Q1 ’21 versus 3.58% for Q4 ’20 and 3.32% for Q1 ‘20 Includes $4.95 million of PPP fee income in Q1 ’21 from loan forgiveness and deferred fee amortization versus $ $4.87 million in Q4 ‘20 Net interest margin excluding effects of PPP(1) declined 33 bps from the year-ago period and 24 basis points linked-quarter Liquidity continues to weigh on margin with cash balances of $480 million at March 31, 2021 Net Interest Margin 16
Appendix 17
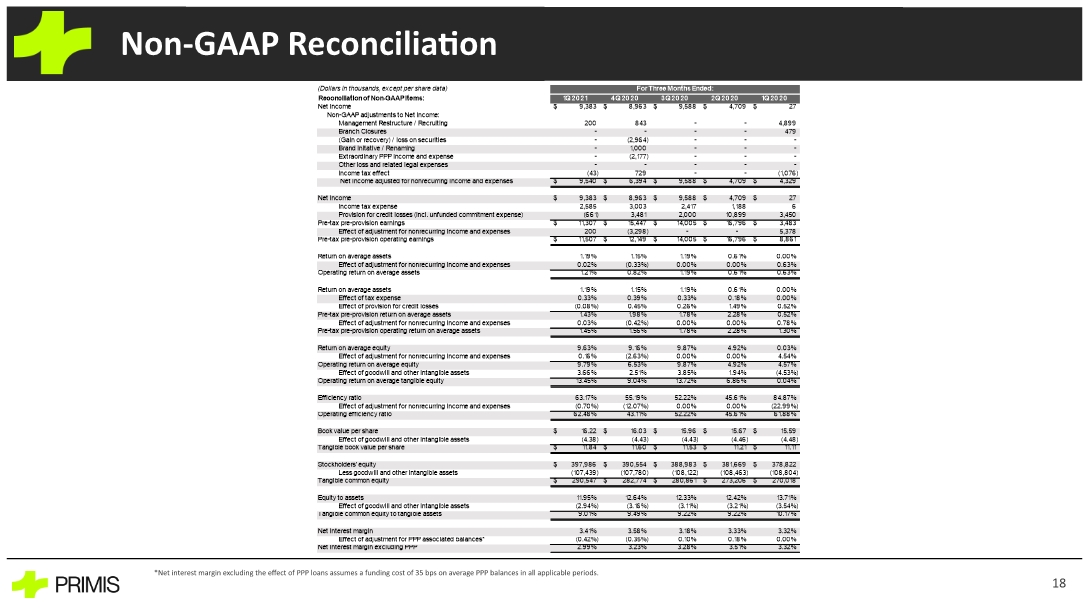
*Net interest margin excluding the effect of SBA PPP loans assumes a funding cost of 35bps on average PPP balances in all applicable periods Non-GAAP Reconciliation 18 *Net interest margin excluding the effect of PPP loans assumes a funding cost of 35 bps on average PPP balances in all applicable periods.
