Attached files
| file | filename |
|---|---|
| EX-99.1 - EXHIBIT 99.1 - NABORS INDUSTRIES LTD | tm2114219d1_ex99-1.htm |
| 8-K - FORM 8-K - NABORS INDUSTRIES LTD | tm2114219d1_8k.htm |
Exhibit 99.2

1 4/28/2021 NABORS INDUSTRIES LTD. 1Q Earnings Presentation

2 Forward Looking Statements We often discuss expectations regarding our future markets, demand for our products and services, and our performance in our annual, quarterly, and current reports, press releases, and other written and oral statements . Such statements, including statements in this document that relate to matters that are not historical facts, are “forward - looking statements” within the meaning of the safe harbor provisions of Section 27 A of the U . S . Securities Act of 1933 and Section 21 E of the U . S . Securities Exchange Act of 1934 . These “forward - looking statements” are based on our analysis of currently available competitive, financial and economic data and our operating plans . They are inherently uncertain, and investors should recognize that events and actual results could turn out to be significantly different from our expectations . Factors to consider when evaluating these forward - looking statements include, but are not limited to: • the Covid - 19 pandemic and its impact on oil and gas markets and prices; • fluctuations and volatility in worldwide prices of and demand for oil and natural gas; • fluctuations in levels of oil and natural gas exploration and development activities; • fluctuations in the demand for our services; • competitive and technological changes and other developments in the oil and gas and oilfield services industries; • our ability to renew customer contracts in order to maintain competitiveness; • the existence of operating risks inherent in the oil and gas and oilfield services industries; • the possibility of the loss of one or a number of our large customers; • the impact of long - term indebtedness and other financial commitments on our financial and operating flexibility; • our access to and the cost of capital, including the impact of a further downgrade in our credit rating, covenant restrictions, availability under our unsecured revolving credit facility, and future issuances of debt or equity securities; • our dependence on our operating subsidiaries and investments to meet our financial obligations; our ability to retain skilled employees; • our ability to complete, and realize the expected benefits, of strategic transactions; • changes in tax laws and the possibility of changes in other laws and regulation; • the possibility of political or economic instability, civil disturbance, war or acts of terrorism in any of the countries in which we do business; • the possibility of changes to U.S. trade policies and regulations including the imposition of trade embargoes or sanctions; and • general economic conditions, including the capital and credit markets. Our businesses depend, to a large degree, on the level of spending by oil and gas companies for exploration, development and production activities . Therefore, sustained lower oil or natural gas prices that have a material impact on exploration, development or production activities could also materially affect our financial position, results of operations and cash flows . The above description of risks and uncertainties is by no means all - inclusive, but is designed to highlight what we believe are important factors to consider . For a discussion of these factors and other risks and uncertainties, please refer to our filings with the Securities and Exchange Commission ("SEC"), including those contained in our Annual Reports on Form 10 - K and Quarterly Reports on Form 10 - Q, which are available at the SEC's website at www . sec . gov .

Recent Company Highlights Generated FCF of $60M in 1Q 2021 After funding $40M in capital spending and semi - annual interest payments of $71M Reduced Total Debt by $70M during 1Q 2021 Includes repaying senior notes and executing debt exchanges for a total reduction of $30M, as well as reducing credit facility outstanding by $40M 1Q 2021 adjusted EBITDA of $108M in line with Q4 2020 Drilling activity continues to strengthen throughout our markets. Strong improvement in Drilling Solutions and Canada Drilling Solutions continues growth of new product offerings and market penetration in Lower 48 RigCLOUD® installations on 90% of our average working rigs SmartDRILL TM increased by 25% in Lower 48 Received 4 awards to date from Saudi Aramco to provide in Kingdom newbuild rigs Fully funded by SANAD’s cash on hand ESG score (ISS) improvement in 1Q 1 point on Governance vs 4Q 2020 3 Note: For adjusted EBITDA and FCF see non - GAAP reconciliations in the Appendix

4 1Q Rig Utilization and Availability RIG FLEET (1) 383 1Q21 AVERAGE RIGS ON REV 139 AVERAGE UTILIZATION 36% (1) As of March 31, 2021 Note: Subtotals may not foot due to rounding TOTAL U.S. OFFSHORE 12 2 17% CANADA 16 2 14% ALASKA 35 14 39% INTERNATIONAL 133 65 49% 187 56 30% U.S. LOWER 48 HIGH SPEC 110 HIGH SPEC 55 HIGH SPEC 50%
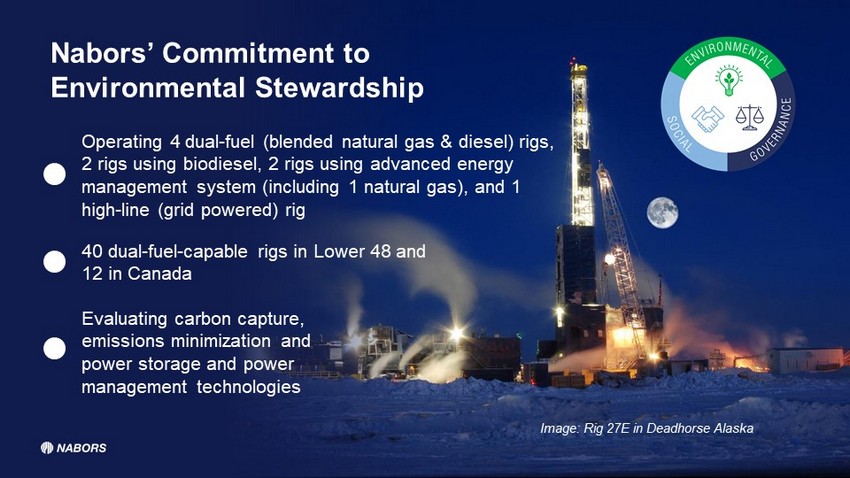
5 Nabors’ Commitment to Environmental Stewardship 40 dual - fuel - capable rigs in Lower 48 and 12 in Canada Image: Rig 27E in Deadhorse Alaska 3 High - Line rigs, 4 Bi - Fuel rigs, including 2 rigs using advanced energy management system in L48 Evaluating carbon capture, emissions minimization and power storage and power management technologies
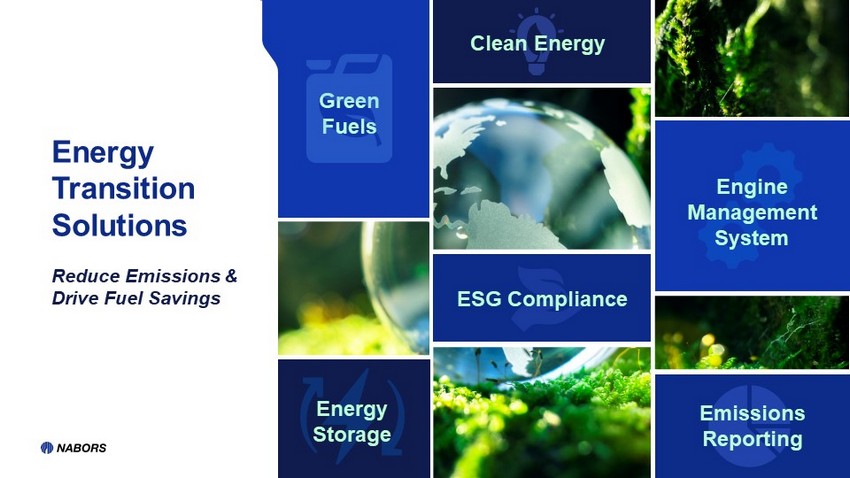
Energy Storage 6 Engine Management System ESG Compliance Emissions Reporting Green Fuels Clean Energy Energy Transition Solutions Reduce Emissions & Drive Fuel Savings

0 2 4 6 8 10 12 14 16 18 20 0 100 200 300 400 500 600 700 800 Q2'17 Q4'17 Q2'18 Q4'18 Q2'19 Q4'19 Q2'20 Q4'20 Q1'21 FOOTAGE DRILLED Millions # OF WELLS DRILLED # of Wells Drilled Footage Drilled • Over 18 MILLION Feet Drilled • 720+ Wells Drilled • 5 Basin Records in Q1 2021 • 30% of Smart Suite Customers on Performance Based Contracts • 0 Recordable Incidents SmartDRILL TM Commercialization SmartNAV TM & SmartSLIDE TM Commercialization Smart Suite Growth Smart Suite Growth

Four additional Operators added Smart Suite across multiple basins in Q1 2021. Smart Suite is now active across all major US L48 basins. Expanding Next - Gen Digital Solutions and Smart Suite Smart Suite Active RigCLOUD ® EDGE Active 5+ Rigs 1 - 5 Rigs

9 Smart Suite Apps High - end edge computing at the rig site Delivery of Analytics at the rig transforms insights into performance, delivering more value for customers Transparency of value delivery facilitates adoption of new technology Stakeholders communicate value in the same terms Driller’s Dashboards EDGE SmartSLIDE TM & SmartDRILL TM Apps Expanding Next - Gen Digital Solutions through RigCLOUD ®

86 146 287 855 560 390 633 $0 $250 $500 $750 $1,000 $1,250 $1,500 2021 2022 2023 2024 2025 2026 2027 2028 Revolving Credit Facility Notes Outstanding (1) 10 (1) Annual figures shown in millions at maturity face value as of March 31, 2021 (2) Annual figures shown reflect carrying values as of March 31, 2021 Total Debt improved by $70M, driven by positive FCF and gains from debt exchanges completed during 1Q 2021 (1) Debt at 3/31/2021 Total Debt: $2.90Bn (2) Cash, Cash Equivalents & STI $0.42Bn Total Debt Less Cash, Cash Equiv. & STI $2.48Bn (2) Debt Maturity Profile as of March 31, 2021
11 APPENDIX

12 Reconciliation of Adjusted EBITDA to Income (Loss) From Continuing Operations Before Income Tax Adjusted EBITDA represents income (loss) from continuing operations before income taxes, interest expense, depreciation and a mor tization, earnings (losses) from unconsolidated affiliates, investment income (loss), impairments and other charges and other, net. Adjusted EBITDA is a non - GAAP financial measure and should not be used in isolation or as a substitute for the amounts reported in accordance with GAAP. In addition, adjusted EBITDA excludes certa in cash expenses that the Company is obligated to make. However, management evaluates the performance of its operating segments and the consolidated Company based on several c rit eria, including adjusted EBITDA and adjusted operating income (loss), because it believes that these financial measures accurately reflect the Company’s ongoing pro fitability and performance. Securities analysts and investors use this measure as one of the metrics on which they analyze the Company’s performance. Other companies in thi s i ndustry may compute these measures differently. A reconciliation of this non - GAAP measure to income (loss) from continuing operations before income taxes, which is the most closely comparable GAAP measure, is provided below. Three Months Ended March 31, 2021 Adjusted EBITDA $107,730 Depreciation and Amortization 177,276 Adjusted Operating Income (loss) (69,546) Investment Income (loss) 1,263 Interest Expense (42,975) Other, net (4,863) Impairments and other charges (2,483) Income (loss) from continuing operations before income taxes ($118,604) (In Thousands)

13 Reconciliation of Free Cash Flow to Net Cash Provided by Operating Activities Free cash flow represents net cash provided by operating activities less cash used for investing activities. Free cash flow i s a n indicator of our ability to generate cash flow after required spending to maintain or expand our asset base. Management believes that this non - GAAP measure is useful information to investors when comparing our cash flows with the cash flows of other companies. This non - GAAP measure has limitations and therefore should not be used in isolation or a s a substitute for the amounts reported in accordance with GAAP. However, management evaluates the performance of the consolidated Company based on several criteria, in clu ding free cash flow, because it believes that these financial measures accurately reflect the Company's ongoing profitability and performance. A reconciliation of thi s m easure to net cash provided by operating activities is provided below. March 31, 2021 Net cash provided by operating activities $79,490 Less: Net Cash used for investing activities (19,119) Free cash flow $60,371 (In Thousands)
nabors.com Contact Us: William C. Conroy VP - Corporate Development and Investor Relations William.Conroy@nabors.com Kara K. Peak Director - Corporate Development and Investor Relations Kara.Peak@nabors.com NABORS CORPORATE SERVICES 515 W. Greens Road Suite 1200 Houston, TX 77067 - 4525