Attached files
| file | filename |
|---|---|
| 8-K - 8-K - FLUSHING FINANCIAL CORP | ffic-20210428x8k.htm |
Exhibit 99.1
| “Small Enough To Know You. Large Enough To Help You.” 1Q21 Earnings Conference Call April 28, 2021 “Small Enough To Know You. Large Enough To Help You.” |

| Safe Harbor Statement “Safe Harbor” Statement under the Private Securities Litigation Reform Act of 1995: Statements in this Presentation relating to plans, strategies, economic performance and trends, projections of results of specific activities or investments and other statements that are not descriptions of historical facts may be forward- looking statements within the meaning of the Private Securities Litigation Reform Act of 1995, Section 27A of the Securities Act of 1933 and Section 21E of the Securities Exchange Act of 1934. Forward-looking information is inherently subject to risks and uncertainties, and actual results could differ materially from those currently anticipated due to a number of factors, which include, but are not limited to, risk factors discussed in the Company’s Annual Report on Form 10-K for the fiscal year ended December 31, 2020 and in other documents filed by the Company with the Securities and Exchange Commission from time to time. Forward- looking statements may be identified by terms such as “may”, “will”, “should”, “could”, “expects”, “plans”, “intends”, “anticipates”, “believes”, “estimates”, “predicts”, “forecasts”, “goals”, “potential” or “continue” or similar terms or the negative of these terms. Although we believe that the expectations reflected in the forward- looking statements are reasonable, we cannot guarantee future results, levels of activity, performance or achievements. The Company has no obligation to update these forward-looking statements. 2 |
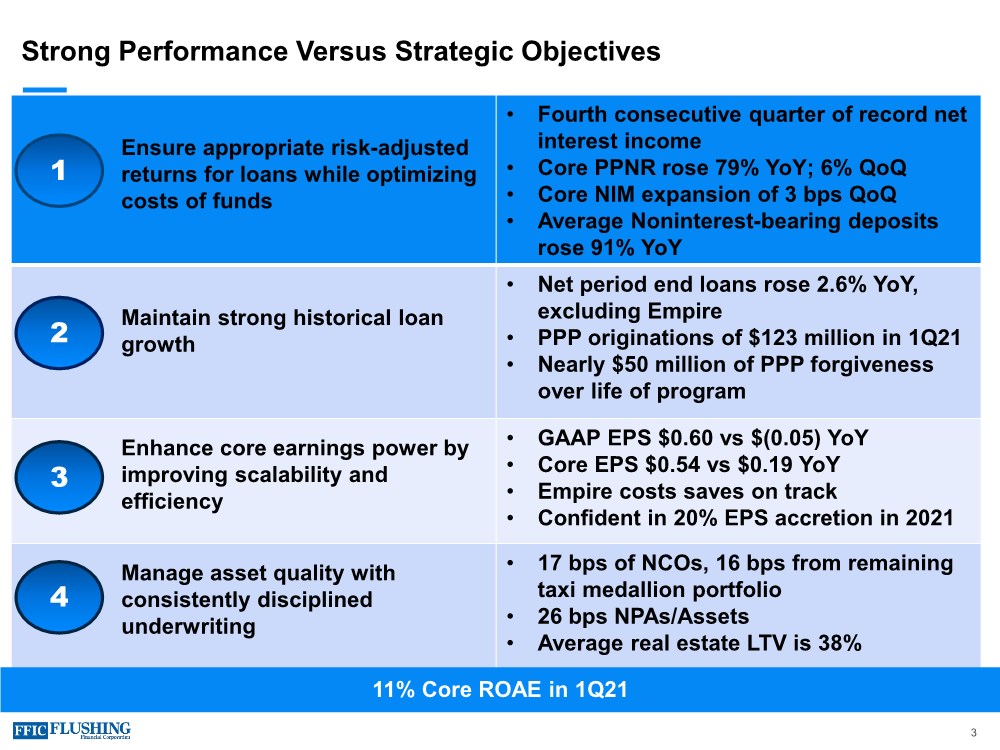
| Ensure appropriate risk-adjusted returns for loans while optimizing costs of funds • Fourth consecutive quarter of record net interest income • Core PPNR rose 79% YoY; 6% QoQ • Core NIM expansion of 3 bps QoQ • Average Noninterest-bearing deposits rose 91% YoY Maintain strong historical loan growth • Net period end loans rose 2.6% YoY, excluding Empire • PPP originations of $123 million in 1Q21 • Nearly $50 million of PPP forgiveness over life of program Enhance core earnings power by improving scalability and efficiency • GAAP EPS $0.60 vs $(0.05) YoY • Core EPS $0.54 vs $0.19 YoY • Empire costs saves on track • Confident in 20% EPS accretion in 2021 Manage asset quality with consistently disciplined underwriting • 17 bps of NCOs, 16 bps from remaining taxi medallion portfolio • 26 bps NPAs/Assets • Average real estate LTV is 38% Strong Performance Versus Strategic Objectives 3 11% Core ROAE in 1Q21 1 2 3 4 |
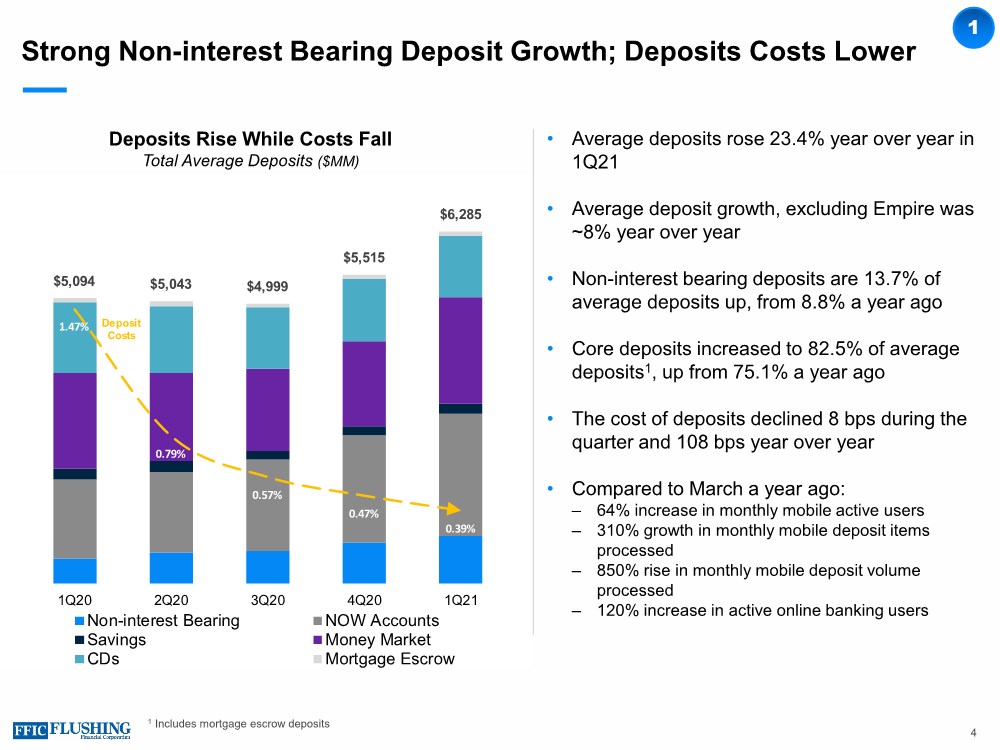
| Strong Non-interest Bearing Deposit Growth; Deposits Costs Lower • Average deposits rose 23.4% year over year in 1Q21 • Average deposit growth, excluding Empire was ~8% year over year • Non-interest bearing deposits are 13.7% of average deposits up, from 8.8% a year ago • Core deposits increased to 82.5% of average deposits1, up from 75.1% a year ago • The cost of deposits declined 8 bps during the quarter and 108 bps year over year • Compared to March a year ago: ‒ 64% increase in monthly mobile active users ‒ 310% growth in monthly mobile deposit items processed ‒ 850% rise in monthly mobile deposit volume processed ‒ 120% increase in active online banking users 4 Deposits Rise While Costs Fall Total Average Deposits ($MM) 1 $5,094 $5,043 $4,999 $5,515 $6,285 1.47% 0.79% 0.57% 0.47% 0.39% 0 1000 2000 3000 4000 5000 6000 7000 1Q20 2Q20 3Q20 4Q20 1Q21 Non-interest Bearing NOW Accounts Savings Money Market CDs Mortgage Escrow Deposit Costs 1 Includes mortgage escrow deposits |
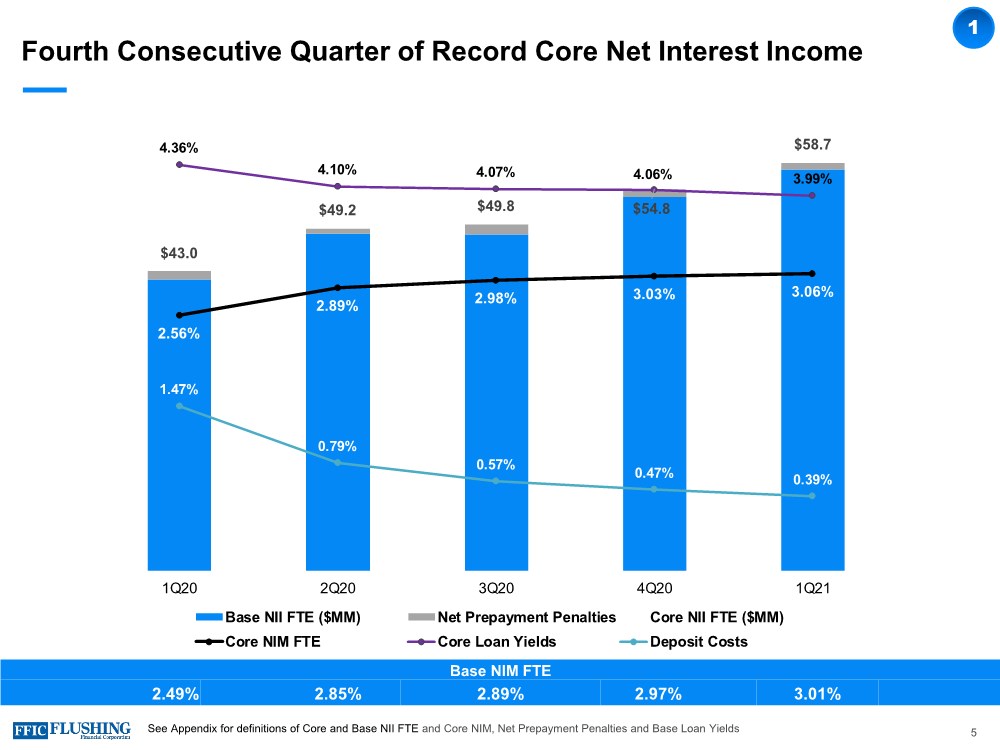
| $43.0 $49.2 $49.8 $54.8 $58.7 2.56% 2.89% 2.98% 3.03% 3.06% 4.36% 4.10% 4.07% 4.06% 3.99% 1.47% 0.79% 0.57% 0.47% 0.39% -0.50% 0.50% 1.50% 2.50% 3.50% 4.50% 5.50% $0.0 $10.0 $20.0 $30.0 $40.0 $50.0 $60.0 $70.0 1Q20 2Q20 3Q20 4Q20 1Q21 Base NII FTE ($MM) Net Prepayment Penalties Core NII FTE ($MM) Core NIM FTE Core Loan Yields Deposit Costs Fourth Consecutive Quarter of Record Core Net Interest Income 5 1 See Appendix for definitions of Core and Base NII FTE and Core NIM, Net Prepayment Penalties and Base Loan Yields Base NIM FTE 2.49% 2.85% 2.89% 2.97% 3.01% |
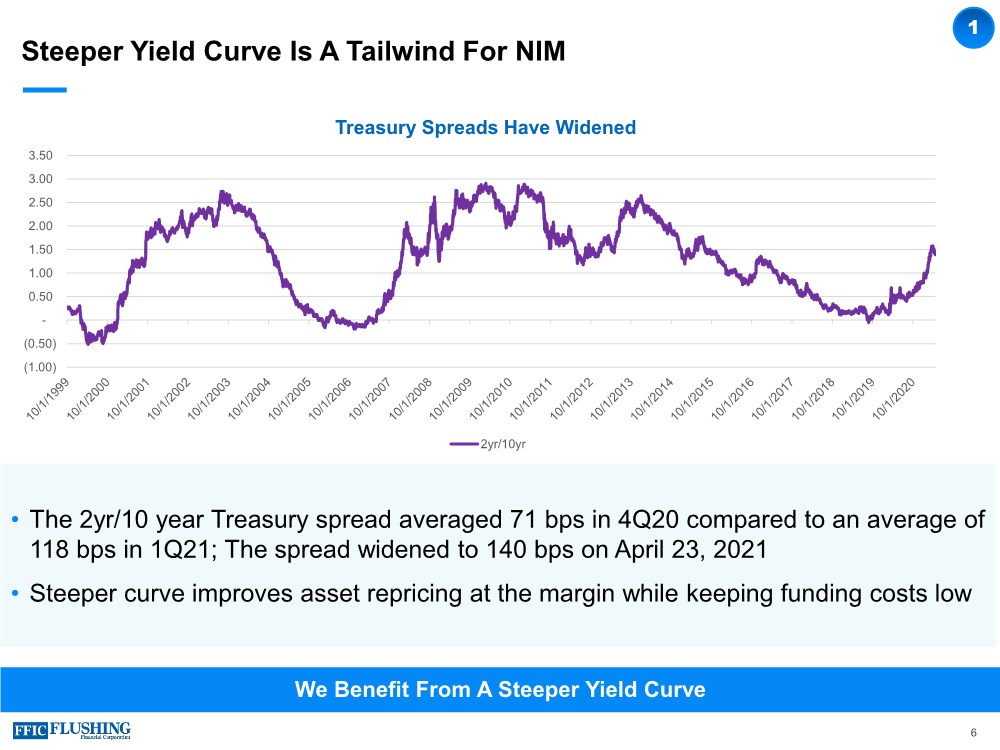
| Steeper Yield Curve Is A Tailwind For NIM 1 6 We Benefit From A Steeper Yield Curve (1.00) (0.50) - 0.50 1.00 1.50 2.00 2.50 3.00 3.50 Treasury Spreads Have Widened 2yr/10yr • The 2yr/10 year Treasury spread averaged 71 bps in 4Q20 compared to an average of 118 bps in 1Q21; The spread widened to 140 bps on April 23, 2021 • Steeper curve improves asset repricing at the margin while keeping funding costs low |
| We Have Tools to Manage Short Term Increases in Rates 1 7 Forward Starting Swaps To Help Protect NIM From Rising Short Rates • The duration of our assets is greater than the duration of our liabilities • Our balance sheet naturally improves over the next two years without any actions and we can take or have already taken the following actions: • $480 million of forward starting pay fixed (0.73%), receive floating swaps on our wholesale funding compared to Federal Home Loan Bank advances yield (inclusive of existing swaps) of 2.33% in 1Q21 • On average the forward starting swaps begin in early 4Q22 which is ahead of the Fed’s timing on rate increases in 2023 • Extending the duration of liabilities to better match our assets; We will take further actions opportunistically • Continue to grow C&I portfolio and use back to back loan swap program to add shorter duration loans |
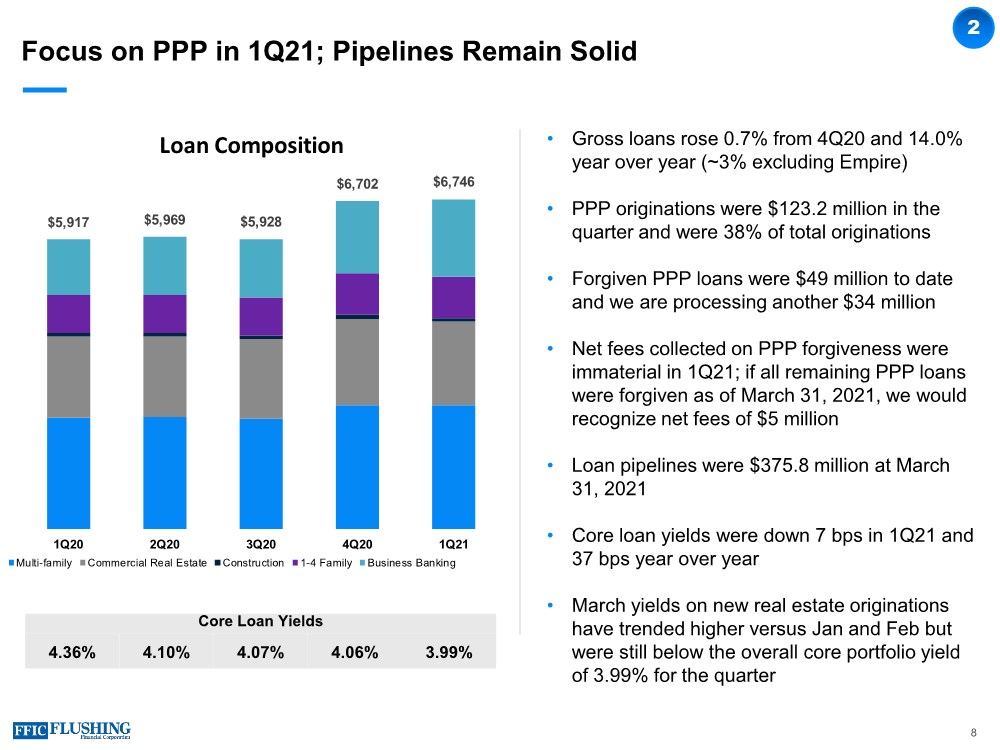
| Focus on PPP in 1Q21; Pipelines Remain Solid 8 2 Core Loan Yields 4.36% 4.10% 4.07% 4.06% 3.99% Period End Loans Rise ___% ($MM) • Gross loans rose 0.7% from 4Q20 and 14.0% year over year (~3% excluding Empire) • PPP originations were $123.2 million in the quarter and were 38% of total originations • Forgiven PPP loans were $49 million to date and we are processing another $34 million • Net fees collected on PPP forgiveness were immaterial in 1Q21; if all remaining PPP loans were forgiven as of March 31, 2021, we would recognize net fees of $5 million • Loan pipelines were $375.8 million at March 31, 2021 • Core loan yields were down 7 bps in 1Q21 and 37 bps year over year • March yields on new real estate originations have trended higher versus Jan and Feb but were still below the overall core portfolio yield of 3.99% for the quarter $5,917 $5,969 $5,928 $6,702 $6,746 - 1, 000 2, 000 3, 000 4, 000 5, 000 6, 000 7, 000 8, 000 1Q20 2Q20 3Q20 4Q20 1Q21 Loan Composition Multi-family Commercial Real Estate Construction 1-4 Family Business Banking |
| Achieving Synergies From Empire Transaction • At close, $982MM assets, $685MM loans and $854MM deposits • $7MM after-tax cost saves expected in 2021 ‒ Cost savings recognized in 1Q21 consistent with projections ‒ Systems conversion completed in November 2020 ‒ Essentially all cost saves in the 1Q21 run rate • Branch Deposit growth of 14% since close • 15-20% of our marketing budget will be spent in Suffolk County • Ramping community service/sponsorships ‒ Delivered food to 6 local Suffolk County hospitals ‒ Identified 7 sponsorship opportunities to date Deal in Line with Expectations; Confident in Achieving 20% Earnings Accretion in 2021 3 Closed Transaction on October 31, 2020 9 |

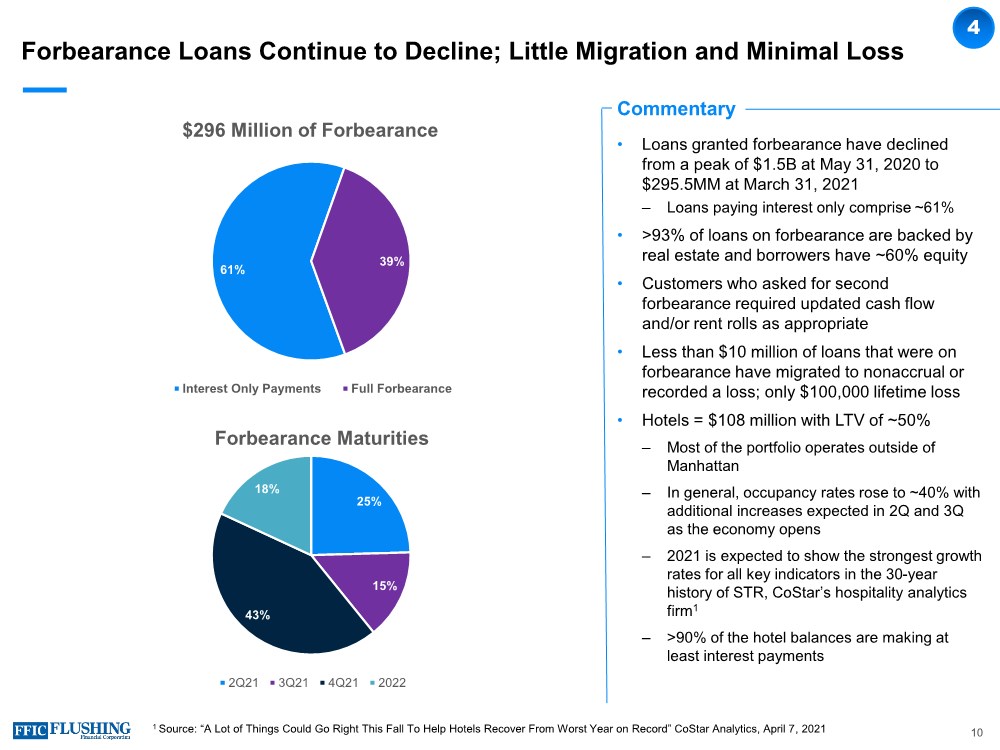
| Forbearance Loans Continue to Decline; Little Migration and Minimal Loss Commentary • Loans granted forbearance have declined from a peak of $1.5B at May 31, 2020 to $295.5MM at March 31, 2021 ‒ Loans paying interest only comprise ~61% • >93% of loans on forbearance are backed by real estate and borrowers have ~60% equity • Customers who asked for second forbearance required updated cash flow and/or rent rolls as appropriate • Less than $10 million of loans that were on forbearance have migrated to nonaccrual or recorded a loss; only $100,000 lifetime loss • Hotels = $108 million with LTV of ~50% ‒ Most of the portfolio operates outside of Manhattan ‒ In general, occupancy rates rose to ~40% with additional increases expected in 2Q and 3Q as the economy opens ‒ 2021 is expected to show the strongest growth rates for all key indicators in the 30-year history of STR, CoStar’s hospitality analytics firm1 ‒ >90% of the hotel balances are making at least interest payments $148.1MM $216.3MM 4 10 1 Source: “A Lot of Things Could Go Right This Fall To Help Hotels Recover From Worst Year on Record” CoStar Analytics, April 7, 2021 25% 15% 43% 18% Forbearance Maturities 2Q21 3Q21 4Q21 2022 61% 39% $296 Million of Forbearance Interest Only Payments Full Forbearance |
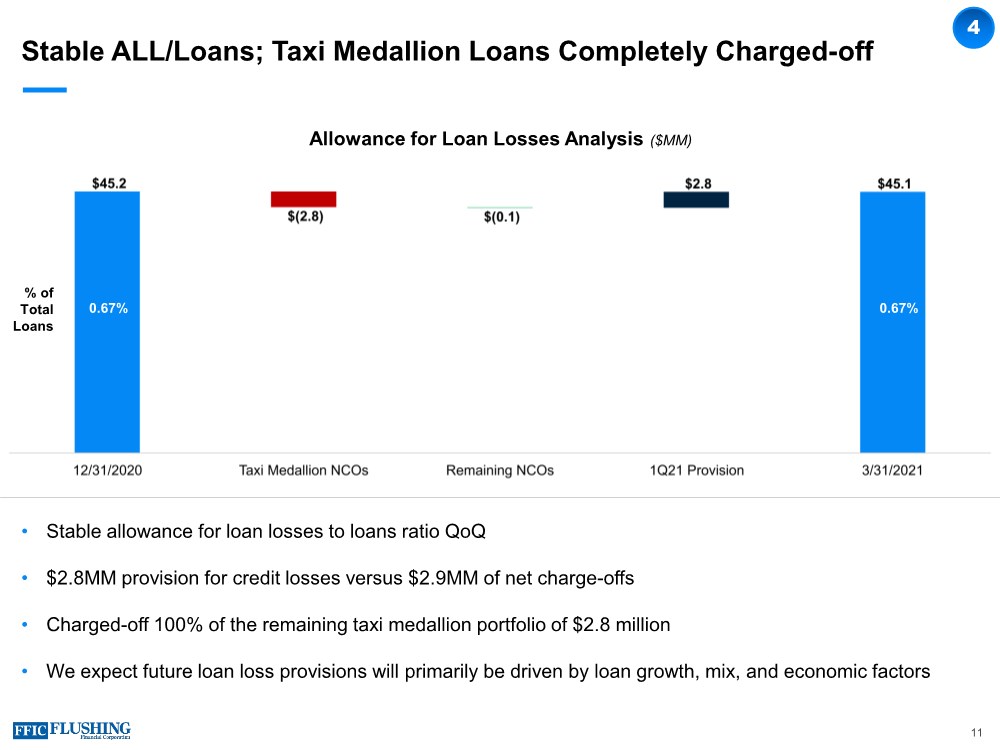
| Stable ALL/Loans; Taxi Medallion Loans Completely Charged-off • Stable allowance for loan losses to loans ratio QoQ • $2.8MM provision for credit losses versus $2.9MM of net charge-offs • Charged-off 100% of the remaining taxi medallion portfolio of $2.8 million • We expect future loan loss provisions will primarily be driven by loan growth, mix, and economic factors 11 Allowance for Loan Losses Analysis ($MM) 4 % of Total Loans 0.67% 0.67% |
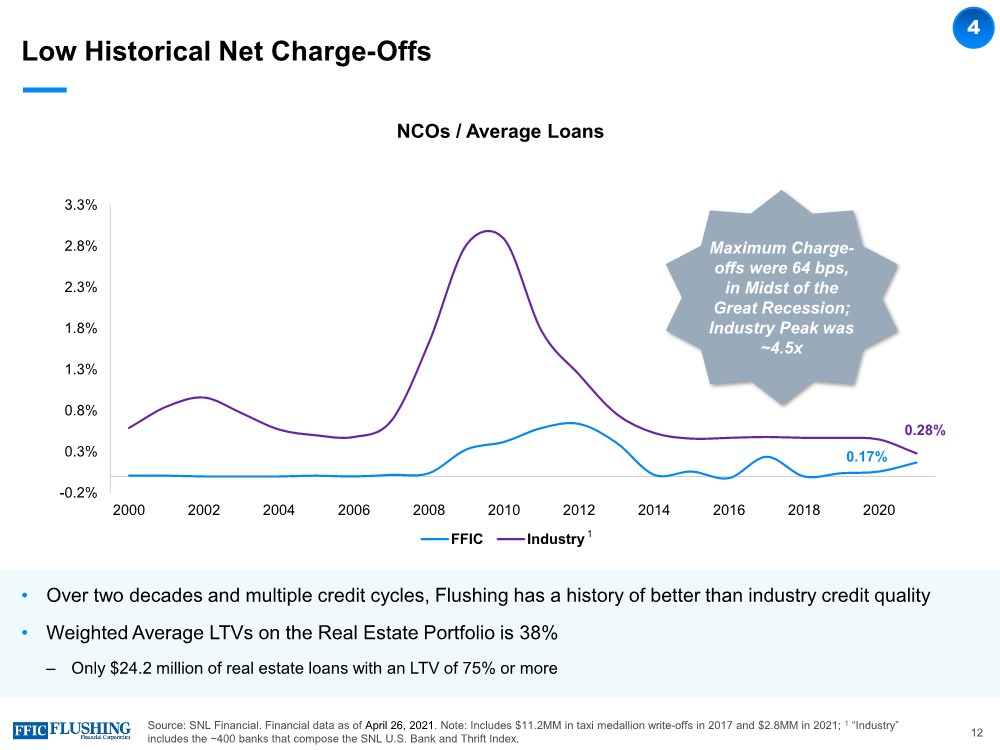
| Low Historical Net Charge-Offs • Over two decades and multiple credit cycles, Flushing has a history of better than industry credit quality • Weighted Average LTVs on the Real Estate Portfolio is 38% ‒ Only $24.2 million of real estate loans with an LTV of 75% or more Source: SNL Financial. Financial data as of April 26, 2021. Note: Includes $11.2MM in taxi medallion write-offs in 2017 and $2.8MM in 2021; 1 “Industry” includes the ~400 banks that compose the SNL U.S. Bank and Thrift Index. NCOs / Average Loans 0.17% 0.28% -0.2% 0.3% 0.8% 1.3% 1.8% 2.3% 2.8% 3.3% 2000 2002 2004 2006 2008 2010 2012 2014 2016 2018 2020 FFIC Industry Maximum Charge- offs were 64 bps, in Midst of the Great Recession; Industry Peak was ~4.5x 1 4 12 |
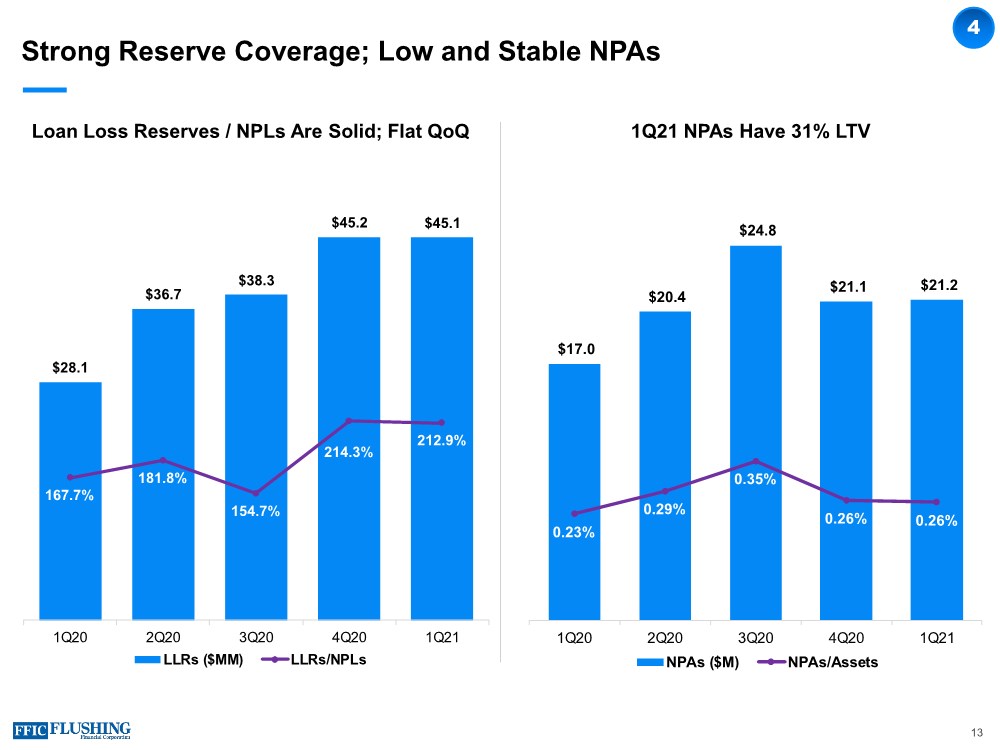
| Strong Reserve Coverage; Low and Stable NPAs Loan Loss Reserves / NPLs Are Solid; Flat QoQ 1Q21 NPAs Have 31% LTV 4 13 $28.1 $36.7 $38.3 $45.2 $45.1 167.7% 181.8% 154.7% 214.3% 212.9% 0.5 1 1.5 2 2.5 3 3.5 4 $0.0 $5.0 $10.0 $15.0 $20.0 $25.0 $30.0 $35.0 $40.0 $45.0 $50.0 1Q20 2Q20 3Q20 4Q20 1Q21 LLRs ($MM) LLRs/NPLs $17.0 $20.4 $24.8 $21.1 $21.2 0.23% 0.29% 0.35% 0.26% 0.26% 0.00% 0.10% 0.20% 0.30% 0.40% 0.50% 0.60% 0.70% 0.80% 0.90% 1.00% $- $5.0 $10.0 $15.0 $20.0 $25.0 $30.0 1Q20 2Q20 3Q20 4Q20 1Q21 NPAs ($M) NPAs/Assets |
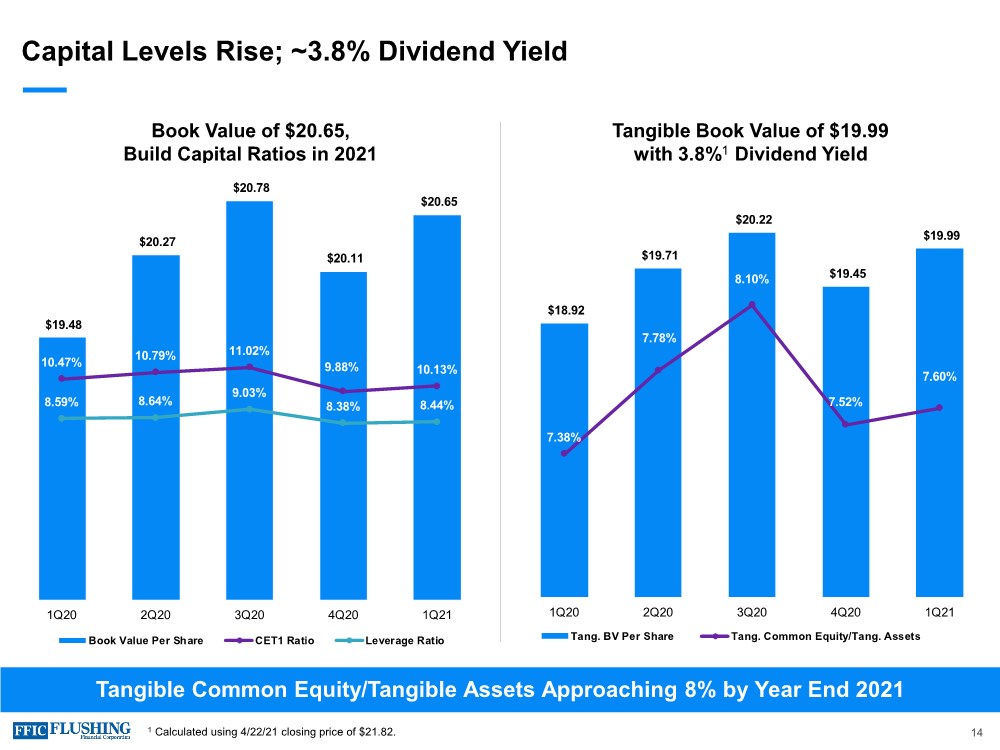
| Capital Levels Rise; ~3.8% Dividend Yield Tangible Common Equity/Tangible Assets Approaching 8% by Year End 2021 Book Value of $20.65, Build Capital Ratios in 2021 Tangible Book Value of $19.99 with 3.8%1 Dividend Yield 1 Calculated using 4/22/21 closing price of $21.82. 14 $19.48 $20.27 $20.78 $20.11 $20.65 10.47% 10.79% 11.02% 9.88% 10.13% 8.59% 8.64% 9.03% 8.38% 8.44% 0.00% 2.00% 4.00% 6.00% 8.00% 10.00% 12.00% 14.00% 16.00% 18.00% 20.00% $17. 00 $17. 50 $18. 00 $18. 50 $19. 00 $19. 50 $20. 00 $20. 50 $21. 00 1Q20 2Q20 3Q20 4Q20 1Q21 Book Value Per Share CET1 Ratio Leverage Ratio $18.92 $19.71 $20.22 $19.45 $19.99 7.38% 7.78% 8.10% 7.52% 7.60% 6.70% 6.90% 7.10% 7.30% 7.50% 7.70% 7.90% 8.10% 8.30% 8.50% 8.70% $15. 00 $16. 00 $17. 00 $18. 00 $19. 00 $20. 00 $21. 00 1Q20 2Q20 3Q20 4Q20 1Q21 Tang. BV Per Share Tang. Common Equity/Tang. Assets |
| Outlook Benefitting from steeper yield curve; positioning for higher rates ‒ Steeper yield curve helps asset repricing and keeps funding pressures low ‒ Starting to extend liability duration to help protect from rising short term rates ‒ Continue to build out Commercial lending portfolio and shorten asset duration ‒ $480 million forward starting swaps on wholesale funding More optimistic about operating environment ‒ Accelerated vaccine roll out to have a positive impact on the economy ‒ Asian franchise to become more active as pandemic recedes; more outreach and community events planned ‒ Using some of the benefit from the steeper yield curve to make investments in the business ‒ Digital enhancements are planned with new offerings and business opportunities • Loan pipelines are solid and should translate to better non-PPP loan growth • Empire synergies are underway; costs savings targets on track; working on revenue enhancements; confident in 20% EPS accretion in 2021 Remain very comfortable with our credit profile On right path to reach through-the-cycle goals: ROA ≥1% and ROE ≥10% 15 |
| Appendix |

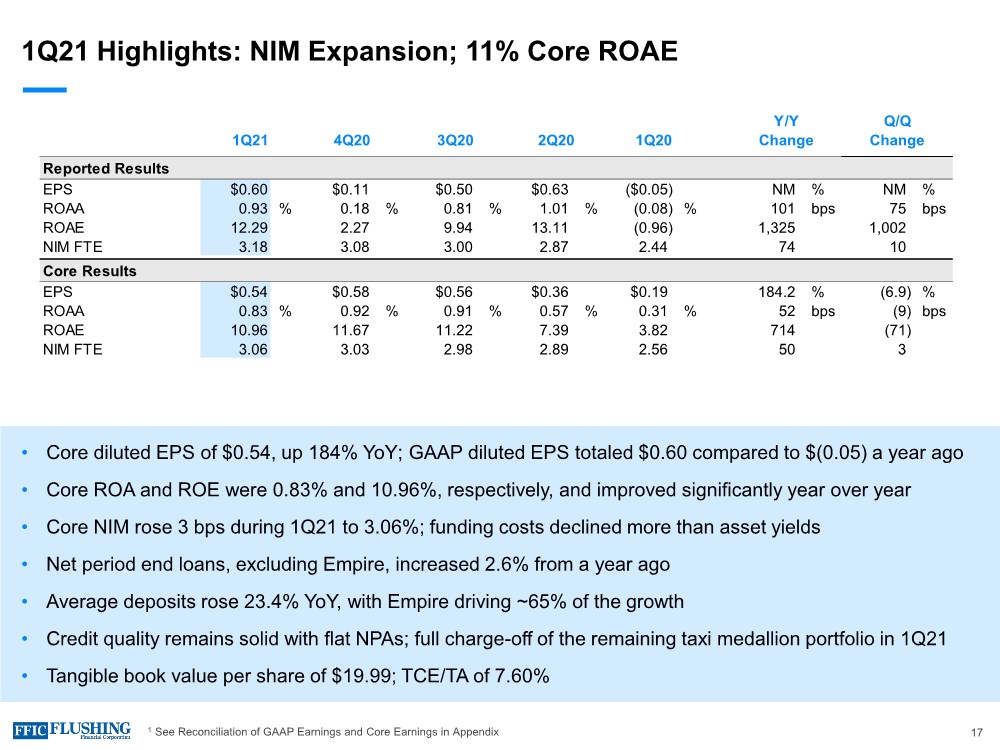
| 1Q21 Highlights: NIM Expansion; 11% Core ROAE • Core diluted EPS of $0.54, up 184% YoY; GAAP diluted EPS totaled $0.60 compared to $(0.05) a year ago • Core ROA and ROE were 0.83% and 10.96%, respectively, and improved significantly year over year • Core NIM rose 3 bps during 1Q21 to 3.06%; funding costs declined more than asset yields • Net period end loans, excluding Empire, increased 2.6% from a year ago • Average deposits rose 23.4% YoY, with Empire driving ~65% of the growth • Credit quality remains solid with flat NPAs; full charge-off of the remaining taxi medallion portfolio in 1Q21 • Tangible book value per share of $19.99; TCE/TA of 7.60% 17 1 See Reconciliation of GAAP Earnings and Core Earnings in Appendix Reported Results EPS $0.60 $0.11 $0.50 $0.63 ($0.05) NM % NM % ROAA 0.93 % 0.18 % 0.81 % 1.01 %(0.08) % 101 bps 75 bps ROAE 12.29 2.27 9.94 13.11 (0.96) 1,325 1,002 NIM FTE 3.18 3.08 3.00 2.87 2.44 74 10 Core Results EPS $0.54 $0.58 $0.56 $0.36 $0.19 184.2 %(6.9) % ROAA 0.83 % 0.92 % 0.91 % 0.57 % 0.31 % 52 bps (9) bps ROAE 10.96 11.67 11.22 7.39 3.82 714 (71) NIM FTE 3.06 3.03 2.98 2.89 2.56 50 3 1Q21 4Q20 3Q20 2Q20 1Q20 Y/Y Q/Q Change Change |
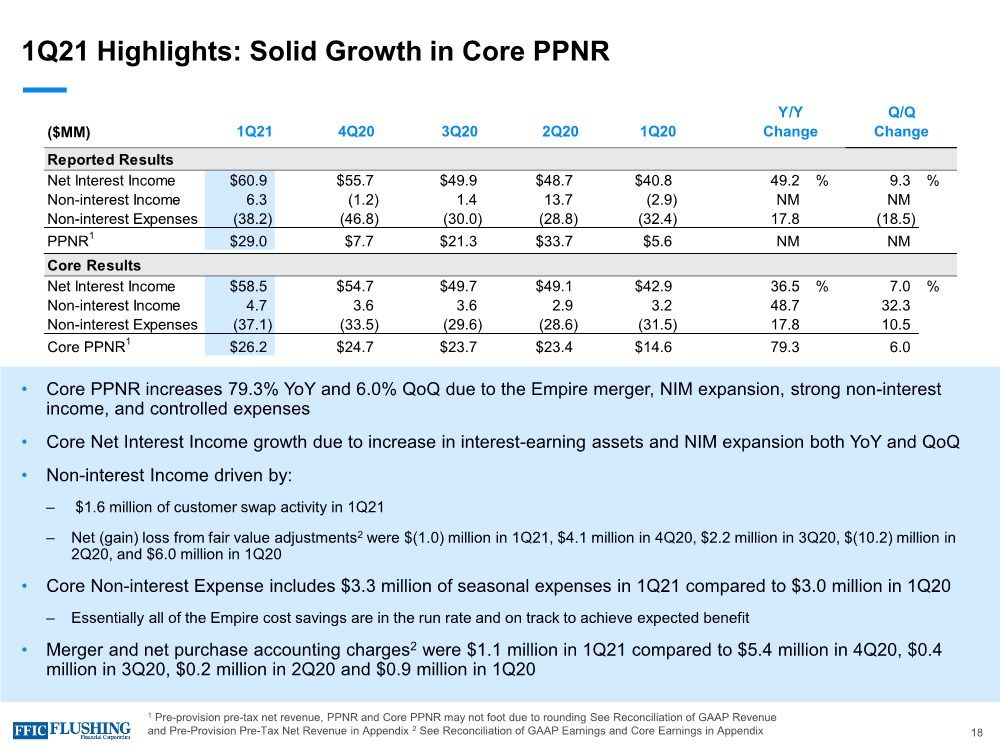
| 1Q21 Highlights: Solid Growth in Core PPNR • Core PPNR increases 79.3% YoY and 6.0% QoQ due to the Empire merger, NIM expansion, strong non-interest income, and controlled expenses • Core Net Interest Income growth due to increase in interest-earning assets and NIM expansion both YoY and QoQ • Non-interest Income driven by: ‒ $1.6 million of customer swap activity in 1Q21 ‒ Net (gain) loss from fair value adjustments2 were $(1.0) million in 1Q21, $4.1 million in 4Q20, $2.2 million in 3Q20, $(10.2) million in 2Q20, and $6.0 million in 1Q20 • Core Non-interest Expense includes $3.3 million of seasonal expenses in 1Q21 compared to $3.0 million in 1Q20 ‒ Essentially all of the Empire cost savings are in the run rate and on track to achieve expected benefit • Merger and net purchase accounting charges2 were $1.1 million in 1Q21 compared to $5.4 million in 4Q20, $0.4 million in 3Q20, $0.2 million in 2Q20 and $0.9 million in 1Q20 18 1 Pre-provision pre-tax net revenue, PPNR and Core PPNR may not foot due to rounding See Reconciliation of GAAP Revenue and Pre-Provision Pre-Tax Net Revenue in Appendix 2 See Reconciliation of GAAP Earnings and Core Earnings in Appendix ($MM) Reported Results Net Interest Income $60.9 $55.7 $49.9 $48.7 $40.8 49.2 % 9.3 % Non-interest Income 6.3 (1.2) 1.4 13.7 (2.9) NM NM Non-interest Expenses (38.2) (46.8) (30.0) (28.8) (32.4) 17.8 (18.5) PPNR1 $29.0 $7.7 $21.3 $33.7 $5.6 NM NM Core Results Net Interest Income $58.5 $54.7 $49.7 $49.1 $42.9 36.5 % 7.0 % Non-interest Income 4.7 3.6 3.6 2.9 3.2 48.7 32.3 Non-interest Expenses (37.1) (33.5) (29.6) (28.6) (31.5) 17.8 10.5 Core PPNR1 $26.2 $24.7 $23.7 $23.4 $14.6 79.3 6.0 Y/Y Q/Q 1Q21 4Q20 3Q20 2Q20 1Q20 Change Change |
| Reconciliation of GAAP Earnings and Core Earnings Non-cash Fair Value Adjustments to GAAP Earnings The variance in GAAP and core earnings is partly driven by the impact of non-cash net gains and losses from fair value adjustments. These fair value adjustments relate primarily to swaps designated to protect against rising rates and borrowing carried at fair value under the fair value option. As the swaps get closer to maturity, the volatility in fair value adjustments will dissipate. In a declining interest rate environment, the movement in the curve exaggerates our mark-to-market loss position. In a rising interest rate environment or a steepening of the yield curve, the loss position would experience an improvement. Core Net Income, Core Diluted EPS, Core ROAE, Core ROAA, Pre-provision Pre-tax Net Revenue, Core Net Interest Income FTE, Core Net Interest Margin FTE, Base Net Interest Income FTE, Base Net Interest Margin FTE, Core Interest Income and Yield on Total Loans, Base Interest Income and Yield on Total Loans, Core Non-interest Income, Core Non-interest Expense and tangible book value per common share are each non- GAAP measures used in this presentation.A reconciliation to the most directly comparable GAAP financial measures appears below in tabular form. The Company believes that these measures are useful for both investors and management to understand the effects of certain interest and non-interest items and provide an alternative view of the Company's performance over time and in comparison to the Company's competitors. These measures should not be viewed as a substitute for net income. The Company believes that tangible book value per common share is useful for both investors and management as these are measures commonly used by financial institutions, regulators and investors to measure the capital adequacy of financial institutions. The Company believes these measures facilitate comparison of the quality and composition of the Company's capital over time and in comparison to its competitors. These measures should not be viewed as a substitute for total shareholders' equity. These non-GAAP measures have inherent limitations, are not required to be uniformly applied and are not audited. They should not be considered in isolation or as a substitute for analysis of results reported under GAAP. These non-GAAP measures may not be comparable to similarly titled measures reported by other companies. 19 |
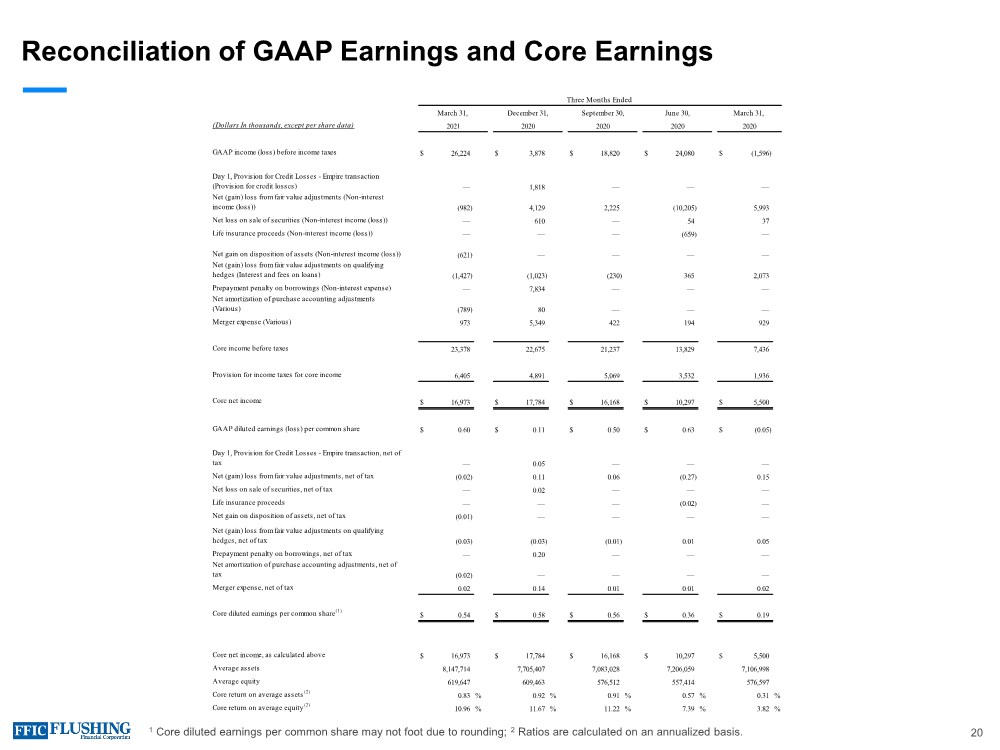
| Reconciliation of GAAP Earnings and Core Earnings 1 Core diluted earnings per common share may not foot due to rounding; 2 Ratios are calculated on an annualized basis. 20 (Dollars In thousands, except per share data) GAAP income (loss) before income taxes $ 26,224 $ 3,878 $ 18,820 $ 24,080 $ (1,596) Day 1, Provision for Credit Losses - Empire transaction (Provision for credit losses) — 1,818 — — — Net (gain) loss from fair value adjustments (Non-interest income (loss)) (982) 4,129 2,225 (10,205) 5,993 Net loss on sale of securities (Non-interest income (loss)) — 610 — 54 37 Life insurance proceeds (Non-interest income (loss)) — — — (659) — Net gain on disposition of assets (Non-interest income (loss)) (621) — — — — Net (gain) loss from fair value adjustments on qualifying hedges (Interest and fees on loans) (1,427) (1,023) (230) 365 2,073 Prepayment penalty on borrowings (Non-interest expense) — 7,834 — — — Net amortization of purchase accounting adjustments (Various) (789) 80 — — — Merger expense (Various) 973 5,349 422 194 929 Core income before taxes 23,378 22,675 21,237 13,829 7,436 Provision for income taxes for core income 6,405 4,891 5,069 3,532 1,936 Core net income $ 16,973 $ 17,784 $ 16,168 $ 10,297 $ 5,500 GAAP diluted earnings (loss) per common share $ 0.60 $ 0.11 $ 0.50 $ 0.63 $ (0.05) Day 1, Provision for Credit Losses - Empire transaction, net of tax — 0.05 — — — Net (gain) loss from fair value adjustments, net of tax (0.02) 0.11 0.06 (0.27) 0.15 Net loss on sale of securities, net of tax — 0.02 — — — Life insurance proceeds — — — (0.02) — Net gain on disposition of assets, net of tax (0.01) — — — — Net (gain) loss from fair value adjustments on qualifying hedges, net of tax (0.03) (0.03) (0.01) 0.01 0.05 Prepayment penalty on borrowings, net of tax — 0.20 — — — Net amortization of purchase accounting adjustments, net of tax (0.02) — — — — Merger expense, net of tax 0.02 0.14 0.01 0.01 0.02 Core diluted earnings per common share(1) $ 0.54 $ 0.58 $ 0.56 $ 0.36 $ 0.19 Core net income, as calculated above $ 16,973 $ 17,784 $ 16,168 $ 10,297 $ 5,500 Average assets 8,147,714 7,705,407 7,083,028 7,206,059 7,106,998 Average equity 619,647 609,463 576,512 557,414 576,597 Core return on average assets(2) 0.83 % 0.92 % 0.91 % 0.57 % 0.31 % Core return on average equity(2) 10.96 % 11.67 % 11.22 % 7.39 % 3.82 % Three Months Ended September 30, June 30, 2020 2020 March 31, 2021 March 31, December 31, 2020 2020 |
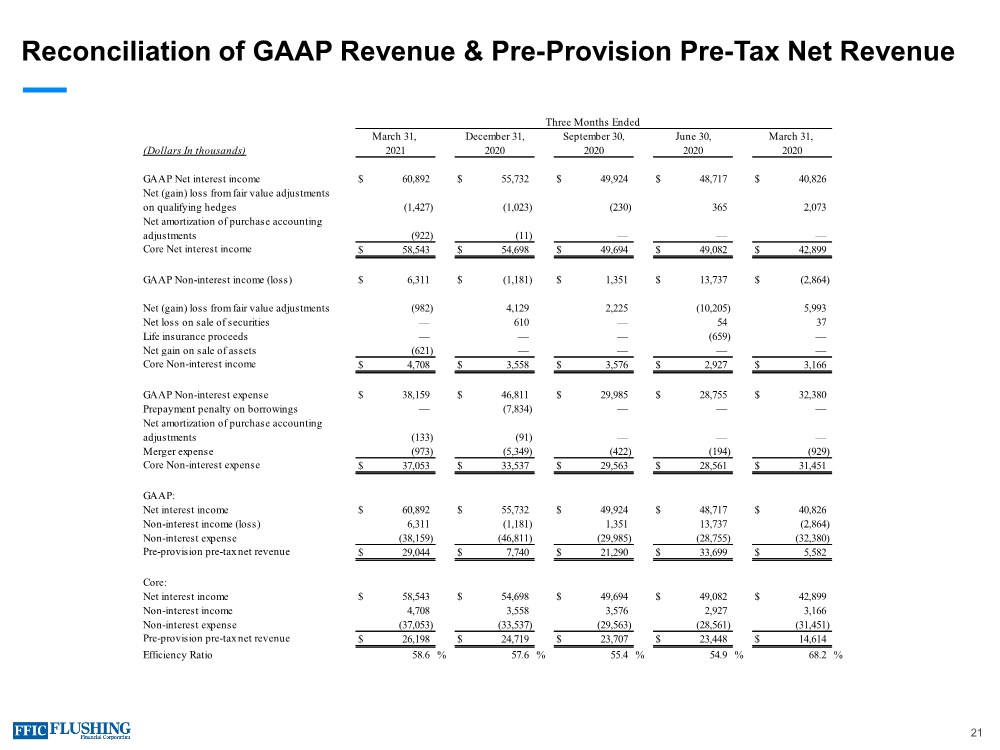
| Reconciliation of GAAP Revenue & Pre-Provision Pre-Tax Net Revenue 21 (Dollars In thousands) GAAP Net interest income $ 60,892 $ 55,732 $ 49,924 $ 48,717 $ 40,826 Net (gain) loss from fair value adjustments on qualifying hedges (1,427) (1,023) (230) 365 2,073 Net amortization of purchase accounting adjustments (922) (11) — — — Core Net interest income $ 58,543 $ 54,698 $ 49,694 $ 49,082 $ 42,899 GAAP Non-interest income (loss) $ 6,311 $ (1,181) $ 1,351 $ 13,737 $ (2,864) Net (gain) loss from fair value adjustments (982) 4,129 2,225 (10,205) 5,993 Net loss on sale of securities — 610 — 54 37 Life insurance proceeds — — — (659) — Net gain on sale of assets (621) — — — — Core Non-interest income $ 4,708 $ 3,558 $ 3,576 $ 2,927 $ 3,166 GAAP Non-interest expense $ 38,159 $ 46,811 $ 29,985 $ 28,755 $ 32,380 Prepayment penalty on borrowings — (7,834) — — — Net amortization of purchase accounting adjustments (133) (91) — — — Merger expense (973) (5,349) (422) (194) (929) Core Non-interest expense $ 37,053 $ 33,537 $ 29,563 $ 28,561 $ 31,451 GAAP: Net interest income $ 60,892 $ 55,732 $ 49,924 $ 48,717 $ 40,826 Non-interest income (loss) 6,311 (1,181) 1,351 13,737 (2,864) Non-interest expense (38,159) (46,811) (29,985) (28,755) (32,380) Pre-provision pre-tax net revenue $ 29,044 $ 7,740 $ 21,290 $ 33,699 $ 5,582 Core: Net interest income $ 58,543 $ 54,698 $ 49,694 $ 49,082 $ 42,899 Non-interest income 4,708 3,558 3,576 2,927 3,166 Non-interest expense (37,053) (33,537) (29,563) (28,561) (31,451) Pre-provision pre-tax net revenue $ 26,198 $ 24,719 $ 23,707 $ 23,448 $ 14,614 Efficiency Ratio 58.6 % 57.6 % 55.4 % 54.9 % 68.2 % 2021 2020 2020 2020 2020 Three Months Ended March 31, December 31, September 30, June 30, March 31, |
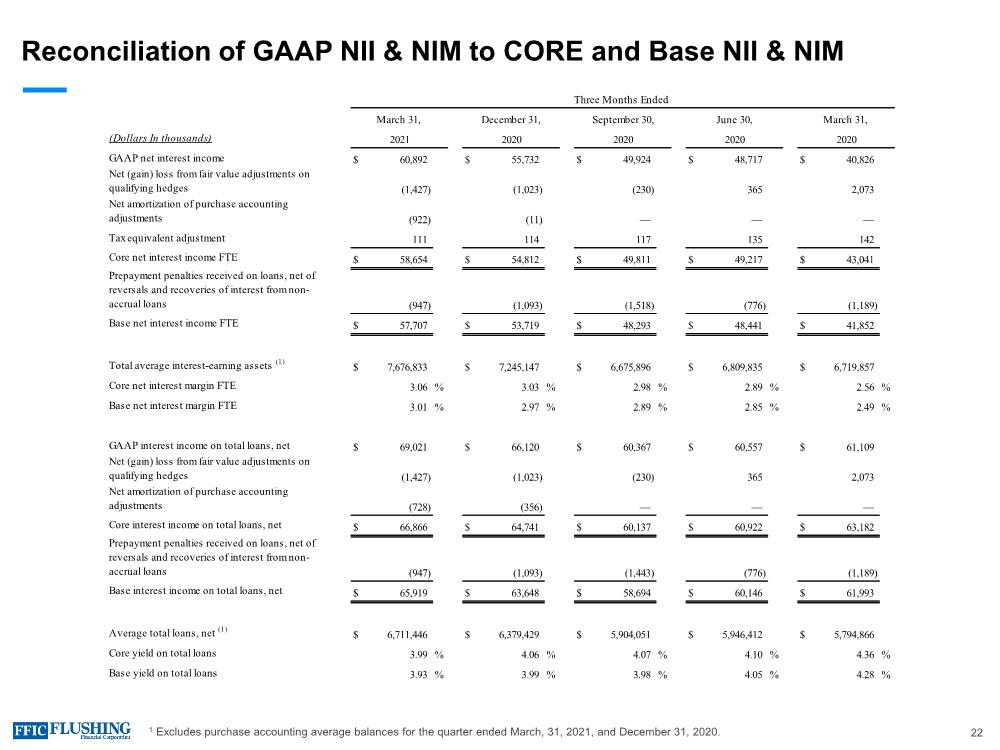
| Reconciliation of GAAP NII & NIM to CORE and Base NII & NIM 1 Excludes purchase accounting average balances for the quarter ended March, 31, 2021, and December 31, 2020. 22 (Dollars In thousands) GAAP net interest income $ 60,892 $ 55,732 $ 49,924 $ 48,717 $ 40,826 Net (gain) loss from fair value adjustments on qualifying hedges (1,427) (1,023) (230) 365 2,073 Net amortization of purchase accounting adjustments (922) (11) — — — Tax equivalent adjustment 111 114 117 135 142 Core net interest income FTE $ 58,654 $ 54,812 $ 49,811 $ 49,217 $ 43,041 Prepayment penalties received on loans, net of reversals and recoveries of interest from non- accrual loans (947) (1,093) (1,518) (776) (1,189) Base net interest income FTE $ 57,707 $ 53,719 $ 48,293 $ 48,441 $ 41,852 Total average interest-earning assets (1) $ 7,676,833 $ 7,245,147 $ 6,675,896 $ 6,809,835 $ 6,719,857 Core net interest margin FTE 3.06 % 3.03 % 2.98 % 2.89 % 2.56 % Base net interest margin FTE 3.01 % 2.97 % 2.89 % 2.85 % 2.49 % GAAP interest income on total loans, net $ 69,021 $ 66,120 $ 60,367 $ 60,557 $ 61,109 Net (gain) loss from fair value adjustments on qualifying hedges (1,427) (1,023) (230) 365 2,073 Net amortization of purchase accounting adjustments (728) (356) — — — Core interest income on total loans, net $ 66,866 $ 64,741 $ 60,137 $ 60,922 $ 63,182 Prepayment penalties received on loans, net of reversals and recoveries of interest from non- accrual loans (947) (1,093) (1,443) (776) (1,189) Base interest income on total loans, net $ 65,919 $ 63,648 $ 58,694 $ 60,146 $ 61,993 Average total loans, net (1) $ 6,711,446 $ 6,379,429 $ 5,904,051 $ 5,946,412 $ 5,794,866 Core yield on total loans 3.99 % 4.06 % 4.07 % 4.10 % 4.36 % Base yield on total loans 3.93 % 3.99 % 3.98 % 4.05 % 4.28 % 2021 2020 2020 2020 2020 Three Months Ended March 31, December 31, September 30, June 30, March 31, |
| Contact Details Susan K. Cullen SEVP, CFO & Treasurer Phone: (718) 961-5400 Email: susan.cullen@flushingbank.com Al Savastano Director of Investor Relations Phone: (516) 820-1146 Email: asavastano@flushingbank.com 23 |

|