Attached files
| file | filename |
|---|---|
| 8-K - 8-K - FIRST US BANCSHARES INC | fusb-8k_20210428.htm |
Investor Presentation As of March 31, 2021
Forward-Looking Statements This presentation of First US Bancshares, Inc. (“FUSB” or the “Company”) contains forward-looking statements, as defined by federal securities laws. Statements contained in this presentation that are not historical facts are forward-looking statements. These statements may address issues that involve significant risks, uncertainties, estimates and assumptions made by FUSB’s senior management. FUSB undertakes no obligation to update these statements following the date of this presentation, except as required by law. In addition, FUSB, through its senior management, may make from time to time forward-looking public statements concerning the matters described herein. Such forward-looking statements are necessarily estimates reflecting the best judgment of FUSB’s senior management based upon current information and involve a number of risks and uncertainties. Certain factors that could affect the accuracy of such forward-looking statements are identified in the public filings made by FUSB with the Securities and Exchange Commission (the “SEC”), including FUSB’s most recent Annual Report on Form 10-K, and forward-looking statements contained in this presentation or in other public statements of FUSB or its senior management should be considered in light of those factors. Specifically, with respect to statements relating to the sufficiency of the allowance for loan and lease losses, loan demand, cash flows, interest costs, growth and earnings potential, expansion and FUSB’s positioning to handle the challenges presented by COVID-19, these factors include, but are not limited to, the rate of growth (or lack thereof) in the economy generally and in FUSB’s service areas; market conditions and investment returns; changes in interest rates; the impact of the COVID-19 pandemic on FUSB’s business, FUSB’s customers, the communities that FUSB serves and the United States economy, including the actions taken by governmental authorities to try to contain the virus and protect against it, through vaccinations and otherwise, or address the impact of the virus on the United States economy (including, without limitation, the Coronavirus Aid, Relief and Economic Security (CARES) Act and subsequent federal legislation) and the resulting effect on FUSB’s operations, liquidity and capital position and on the financial condition of FUSB’s borrowers and other customers; the pending discontinuation of LIBOR as an interest rate benchmark; the availability of quality loans in FUSB’s service areas; the relative strength and weakness in the consumer and commercial credit sectors and in the real estate markets; collateral values; cybersecurity threats; and risks related to the Paycheck Protection Program. There can be no assurance that such factors or other factors will not affect the accuracy of such forward-looking statements. 2
Presentation Disclosure This presentation has been prepared by FUSB solely for informational purposes based on its own information, as well as information from public sources. This presentation has been prepared to assist interested parties in making their own evaluation of FUSB and does not purport to contain all of the information that may be relevant. In all cases, interested parties should conduct their own investigation and analysis of FUSB and the information included in this presentation or other information provided by or on behalf of FUSB. This presentation does not constitute an offer to sell or a solicitation of an offer to buy any securities of FUSB by any person in any jurisdiction in which it is unlawful for such person to make such an offer or solicitation. Neither the SEC nor any state securities commission has approved or disapproved of the securities of FUSB or passed upon the accuracy or adequacy of this presentation. Any representation to the contrary is a criminal offense. Except as otherwise indicated, this presentation speaks as of the date indicated on the cover page. The delivery of this presentation shall not, under any circumstances, create any implication that there has been no change in the affairs of FUSB after such date. This presentation includes unaudited financial measures that have been prepared other than in accordance with generally accepted accounting principles in the United States (“non-GAAP financial measures”), including tangible book value per common share, return on average tangible common equity and tangible common equity to tangible assets. FUSB presents non-GAAP financial measures when it believes that the additional information is useful and meaningful to management and investors. Non-GAAP financial measures do not have any standardized meaning and, therefore, may not be comparable to similar measures presented by other companies. The presentation of non-GAAP financial measures is not intended to be a substitute for, and should not be considered in isolation from, the financial measures reported in accordance with GAAP. See Appendix B to this presentation for a reconciliation of certain non-GAAP financial measures to the comparable GAAP measures. Quarterly data and 3/31/2021 data presented herein have not been audited by FUSB’s independent registered public accounting firm. 3
Contents Corporate Profile ………………………………………..……………………………………...….….....5 1Q2021 Highlights……………………………...……………………………………………………….....9 Financial Results through March 31, 2021….....…………………………………………………….15 Ongoing Strategic Focus……………………………………………………………………………….20 Appendix A: Historical Information……………………………………...……………………...……24 Appendix B: Non-GAAP Reconciliation….……….....………………………………………..…….33 4
5
Corporate Profile Senior Leadership Team 6
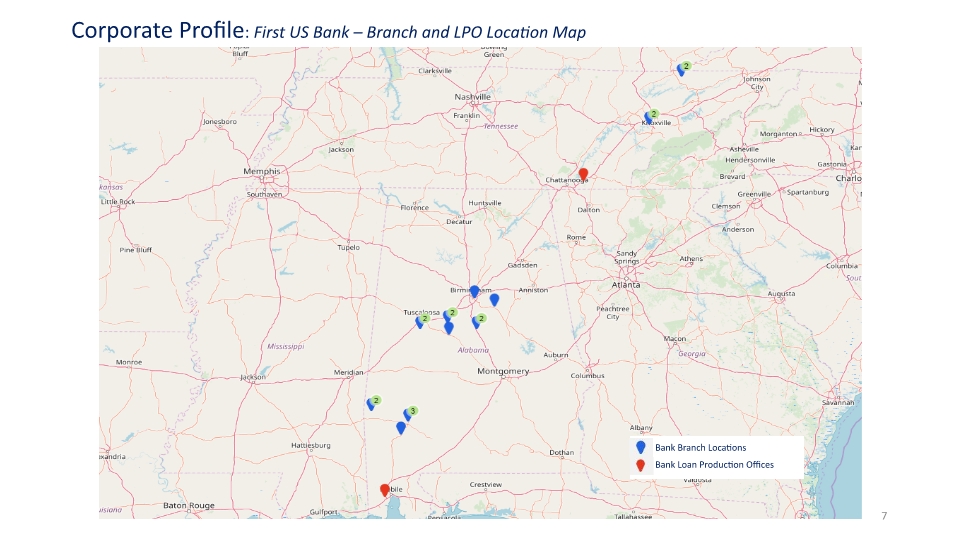
7 Corporate Profile: First US Bank – Branch and LPO Location Map
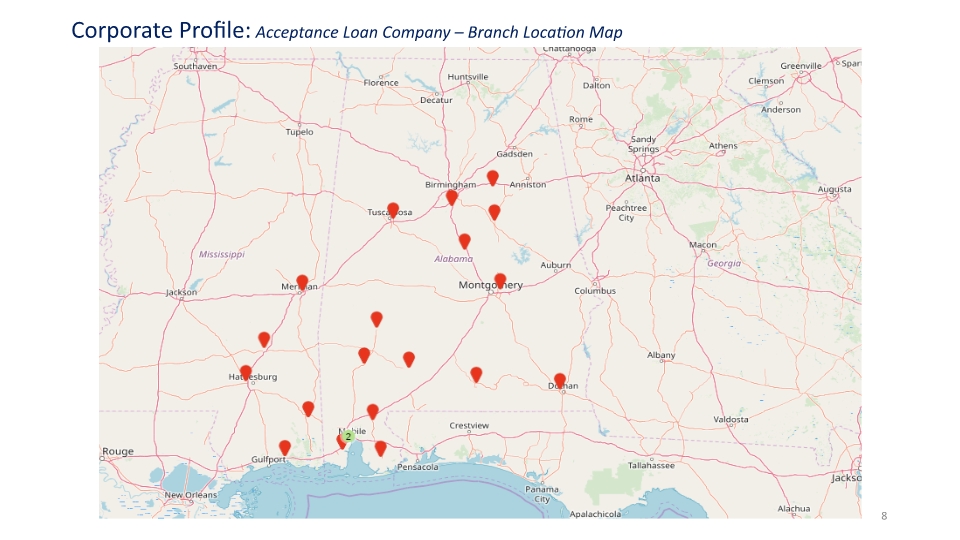
8 Corporate Profile: Acceptance Loan Company – Branch Location Map
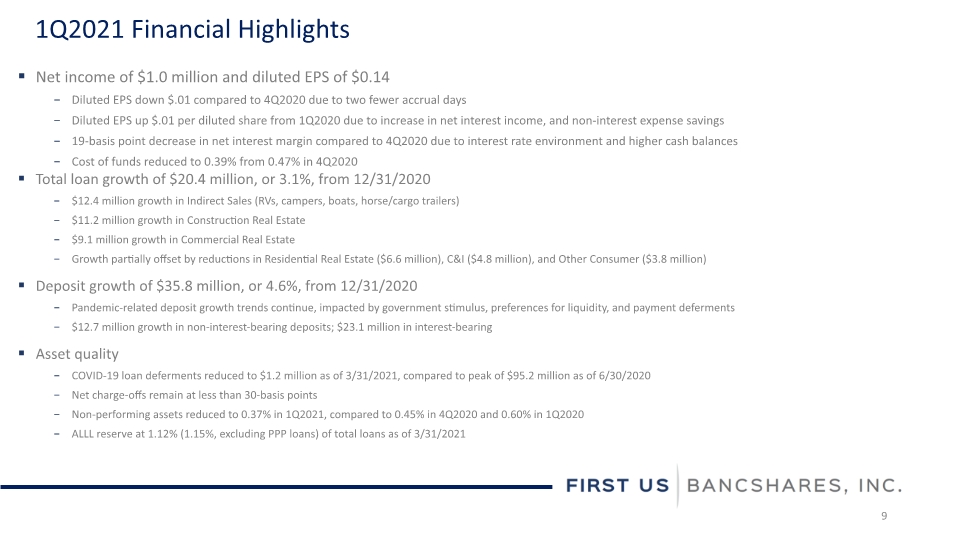
9 Net income of $1.0 million and diluted EPS of $0.14 Diluted EPS down $.01 compared to 4Q2020 due to two fewer accrual days Diluted EPS up $.01 per diluted share from 1Q2020 due to increase in net interest income, and non-interest expense savings 19-basis point decrease in net interest margin compared to 4Q2020 due to interest rate environment and higher cash balances Cost of funds reduced to 0.39% from 0.47% in 4Q2020 Total loan growth of $20.4 million, or 3.1%, from 12/31/2020 $12.4 million growth in Indirect Sales (RVs, campers, boats, horse/cargo trailers) $11.2 million growth in Construction Real Estate $9.1 million growth in Commercial Real Estate Growth partially offset by reductions in Residential Real Estate ($6.6 million), C&I ($4.8 million), and Other Consumer ($3.8 million) Deposit growth of $35.8 million, or 4.6%, from 12/31/2020 Pandemic-related deposit growth trends continue, impacted by government stimulus, preferences for liquidity, and payment deferments $12.7 million growth in non-interest-bearing deposits; $23.1 million in interest-bearing Asset quality COVID-19 loan deferments reduced to $1.2 million as of 3/31/2021, compared to peak of $95.2 million as of 6/30/2020 Net charge-offs remain at less than 30-basis points Non-performing assets reduced to 0.37% in 1Q2021, compared to 0.45% in 4Q2020 and 0.60% in 1Q2020 ALLL reserve at 1.12% (1.15%, excluding PPP loans) of total loans as of 3/31/2021 1Q2021 Financial Highlights
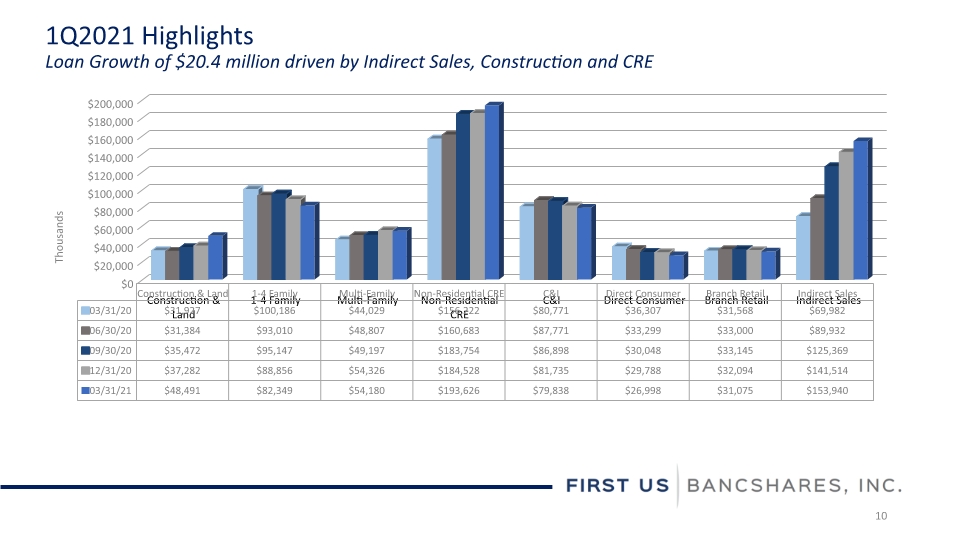
1Q2021 Highlights Loan Growth of $20.4 million driven by Indirect Sales, Construction and CRE 10
1Q2021Highlights A Focus on the Indirect Sales Portfolio 11 Indirect Sales by Collateral as of 3/31/2021 Indirect Sales by State as of 3/31/2021(1) (1) Represents state in which the participating dealer operates
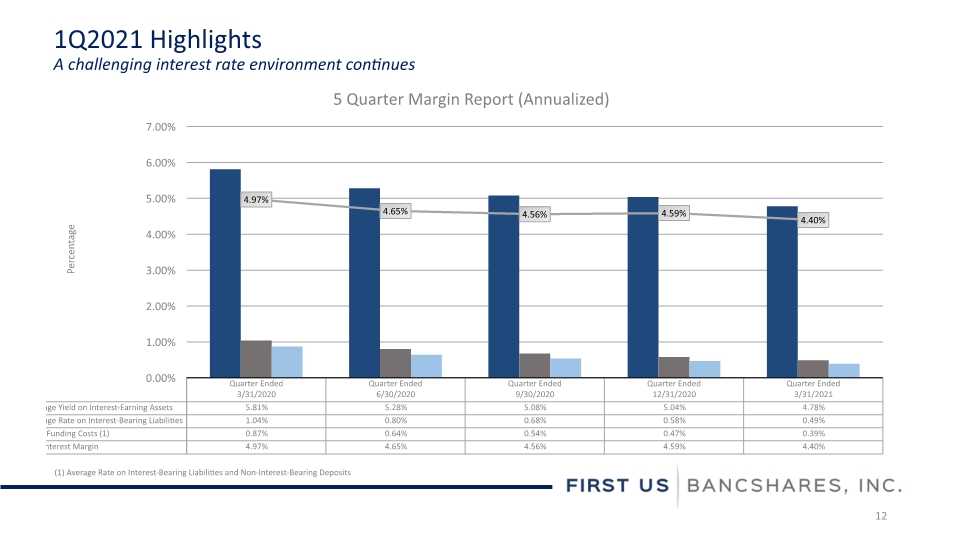
1Q2021 Highlights A challenging interest rate environment continues 12 (1) Average Rate on Interest-Bearing Liabilities and Non-Interest-Bearing Deposits
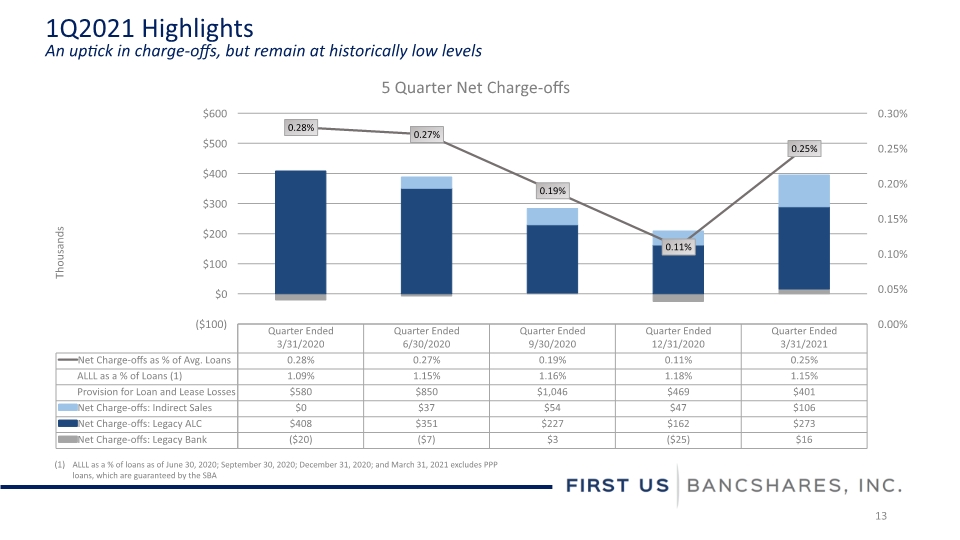
1Q2021 Highlights An uptick in charge-offs, but remain at historically low levels 13 ALLL as a % of loans as of June 30, 2020; September 30, 2020; December 31, 2020; and March 31, 2021 excludes PPP loans, which are guaranteed by the SBA
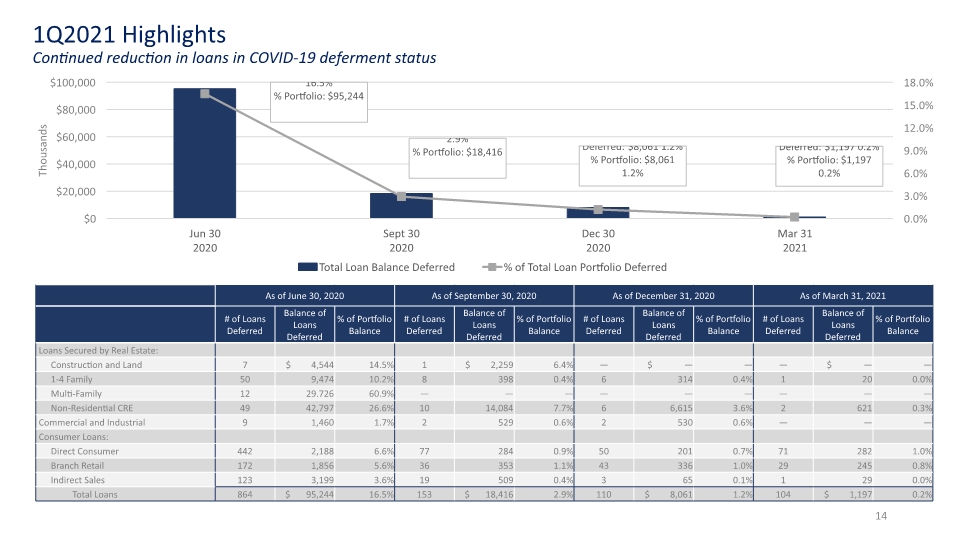
14 1Q2021 Highlights Continued reduction in loans in COVID-19 deferment status
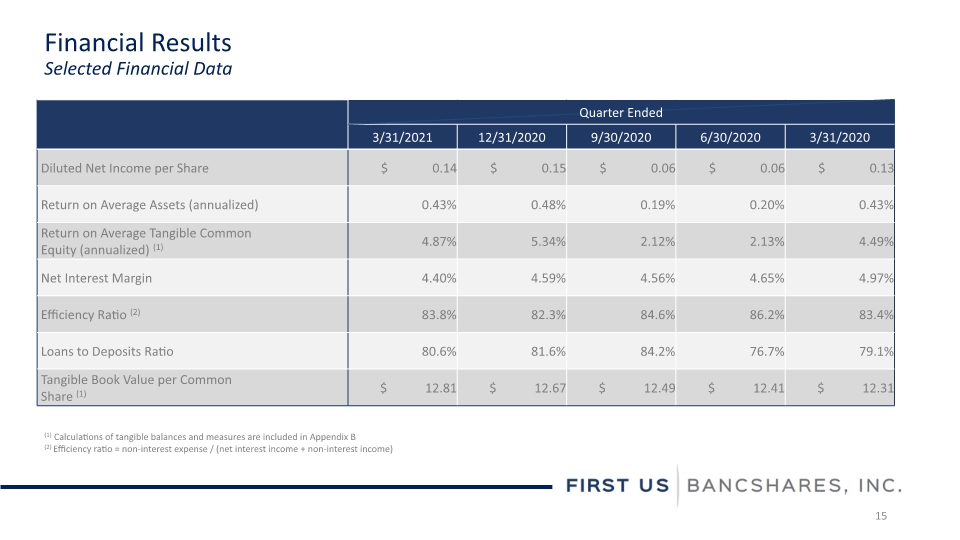
15 Financial Results Selected Financial Data (1) Calculations of tangible balances and measures are included in Appendix B (2) Efficiency ratio = non-interest expense / (net interest income + non-interest income)
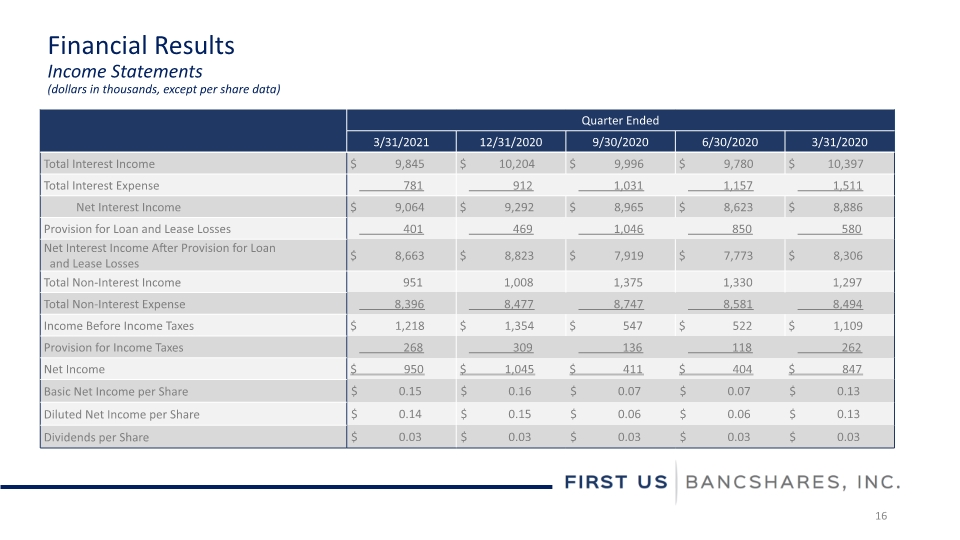
Financial Results Income Statements (dollars in thousands, except per share data) 16
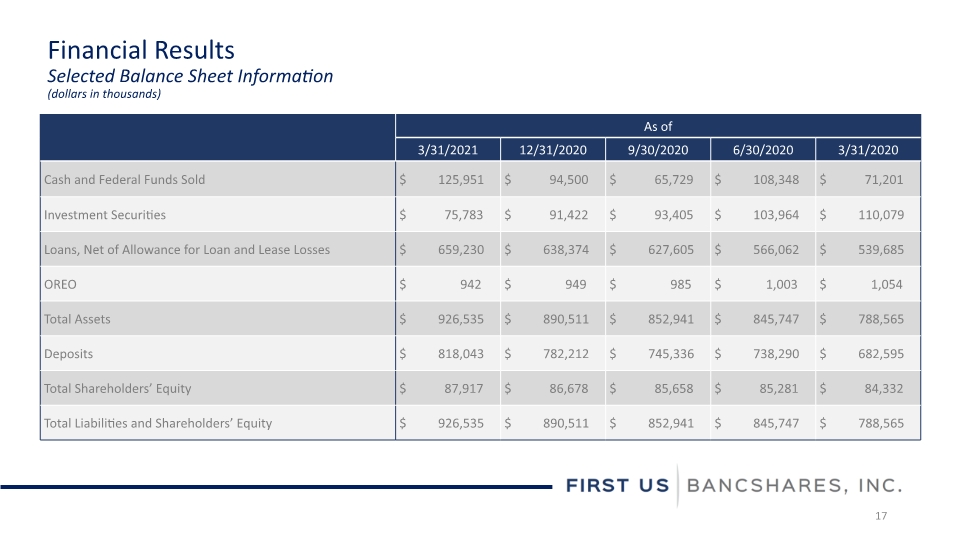
Financial Results Selected Balance Sheet Information (dollars in thousands) 17
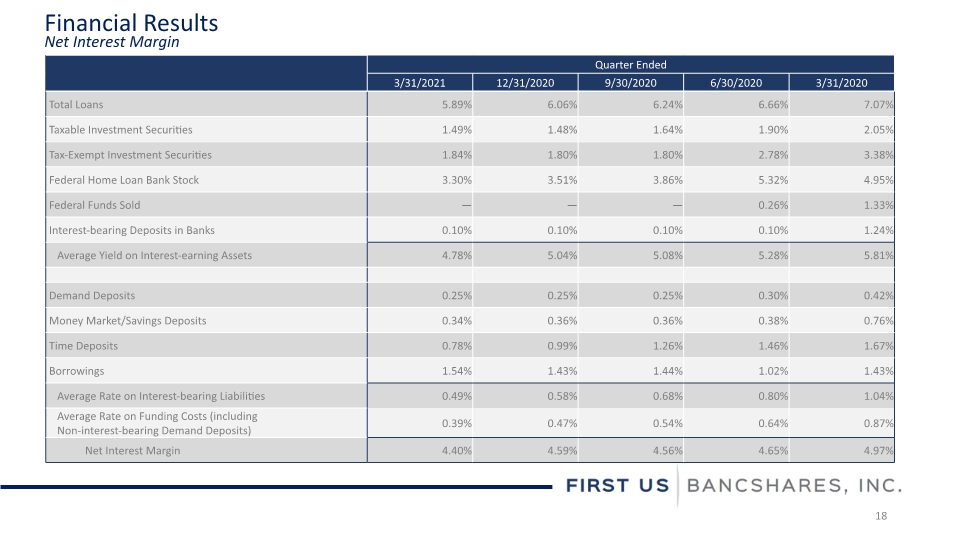
18 Financial Results Net Interest Margin
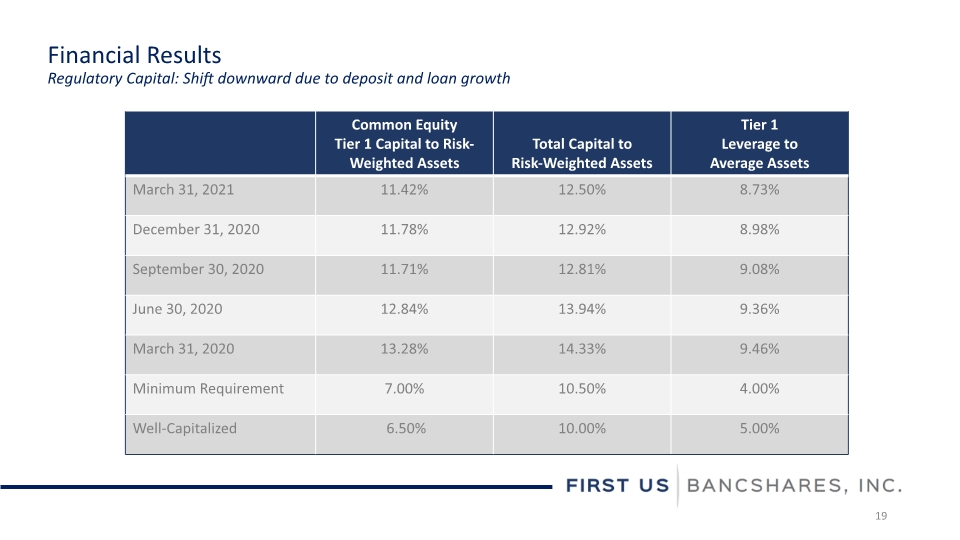
Financial Results Regulatory Capital: Shift downward due to deposit and loan growth 19
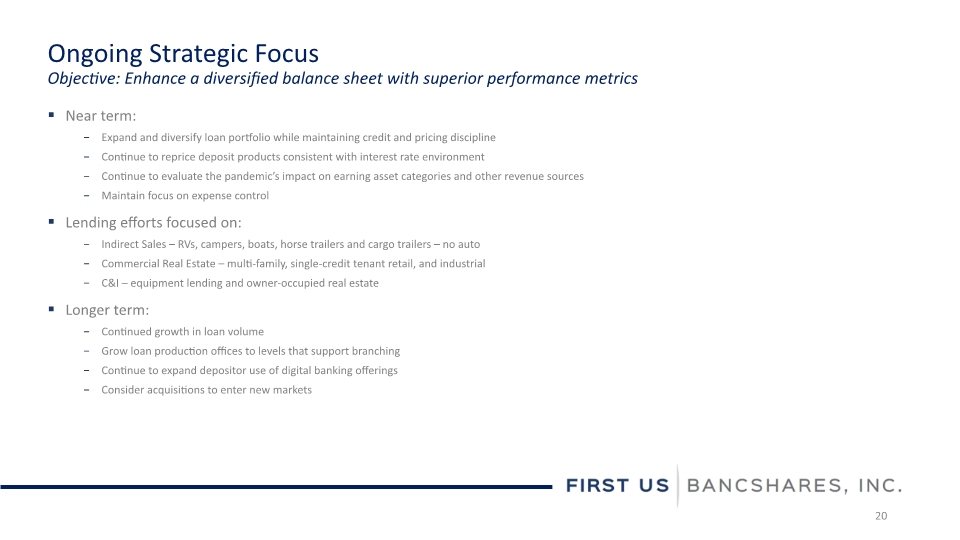
20 Near term: Expand and diversify loan portfolio while maintaining credit and pricing discipline Continue to reprice deposit products consistent with interest rate environment Continue to evaluate the pandemic’s impact on earning asset categories and other revenue sources Maintain focus on expense control Lending efforts focused on: Indirect Sales – RVs, campers, boats, horse trailers and cargo trailers – no auto Commercial Real Estate – multi-family, single-credit tenant retail, and industrial C&I – equipment lending and owner-occupied real estate Longer term: Continued growth in loan volume Grow loan production offices to levels that support branching Continue to expand depositor use of digital banking offerings Consider acquisitions to enter new markets Ongoing Strategic Focus Objective: Enhance a diversified balance sheet with superior performance metrics
Ongoing Strategic Focus Building and Maintaining a Diversified Balance Sheet 21
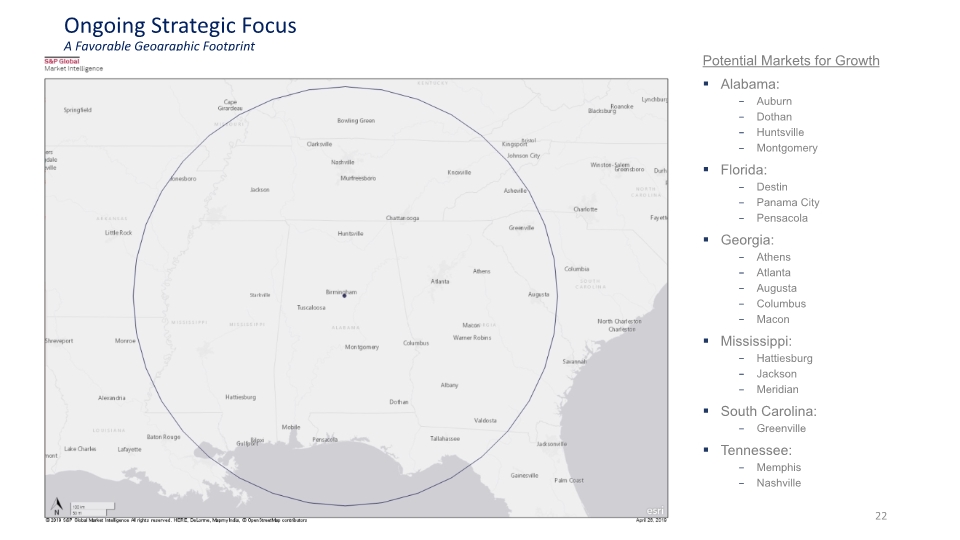
22 Ongoing Strategic Focus A Favorable Geographic Footprint Potential Markets for Growth Alabama: Auburn Dothan Huntsville Montgomery Florida: Destin Panama City Pensacola Georgia: Athens Atlanta Augusta Columbus Macon Mississippi: Hattiesburg Jackson Meridian South Carolina: Greenville Tennessee: Memphis Nashville
Appendices
24 Earnings challenged in Q2 and Q3 in wake of COVID-19 pandemic and margin compression Diluted EPS of $0.40 in 2020, compared to $0.67 in 2019 Net income of $2.7 million in 2020, compared to $4.6 million in 2019 Net interest income decreased by $1.2 million in 2020 49-basis point reduction to net interest margin as interest-bearing assets repriced at faster pace than interest-bearing liabilities Average yield on interest-bearing assets reduced to 5.29% from 6.11% Average cost of funds reduced to 0.62%, compared to 0.96% Focus on deposit cost reduction continues in the current environment Loan loss provision increased by $0.2 million in 2020 Qualitative factors warranted reserve increases to account for pandemic uncertainty Additional provisioning for loan growth Net loan growth totaled $93.1 million, or 17.1% Significant growth in Indirect Sales – transfer from ALC to Bank on January 1, 2020 has proven beneficial Commercial Real Estate lending gained momentum in Q3 and Q4 Relatively low level of “at-risk” loans (hotels, motels, dine-in restaurants) allows continued focus on loan growth Continued emphasis on credit quality (now with the benefit of some clarity on the impact of the pandemic to date) Deposit growth of $98.6 million, or 14.4%, year-to-date $39.2 million growth in non-interest-bearing deposits, $59.4 million growth in interest-bearing deposits Growth largely reflects the impact of the pandemic on deposit holders, including preferences for liquidity, loan and tax payment deferments, stimulus checks and lower consumer spending Appendix A – Historical Information 2020 Financial Highlights
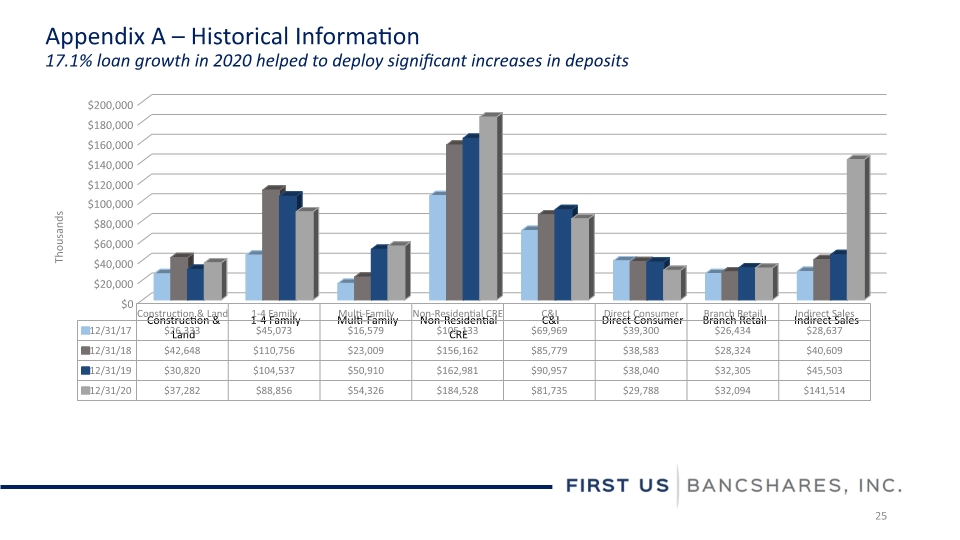
Appendix A – Historical Information 17.1% loan growth in 2020 helped to deploy significant increases in deposits 25
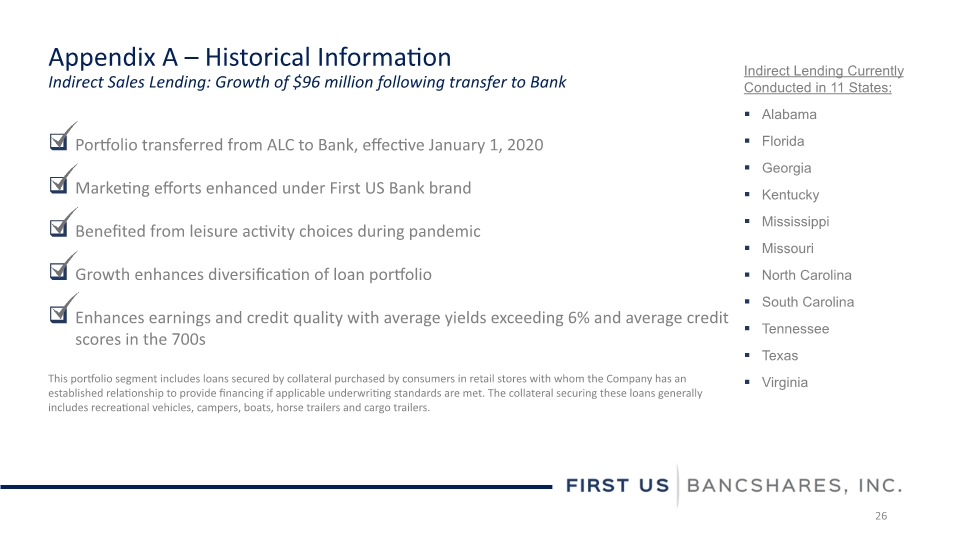
Appendix A – Historical Information Indirect Sales Lending: Growth of $96 million following transfer to Bank Portfolio transferred from ALC to Bank, effective January 1, 2020 Marketing efforts enhanced under First US Bank brand Benefited from leisure activity choices during pandemic Growth enhances diversification of loan portfolio Enhances earnings and credit quality with average yields exceeding 6% and average credit scores in the 700s This portfolio segment includes loans secured by collateral purchased by consumers in retail stores with whom the Company has an established relationship to provide financing if applicable underwriting standards are met. The collateral securing these loans generally includes recreational vehicles, campers, boats, horse trailers and cargo trailers. 26 Indirect Lending Currently Conducted in 11 States: Alabama Florida Georgia Kentucky Mississippi Missouri North Carolina South Carolina Tennessee Texas Virginia
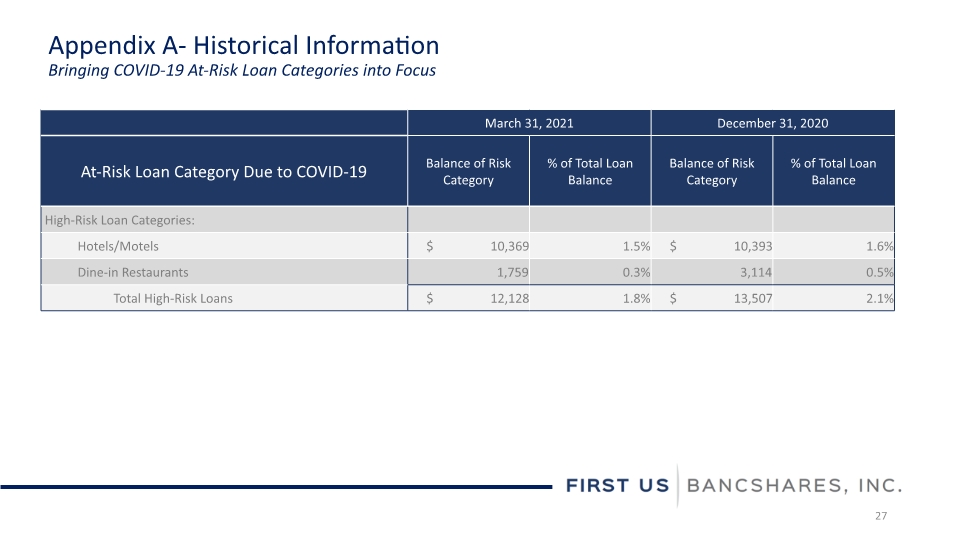
Appendix A- Historical Information Bringing COVID-19 At-Risk Loan Categories into Focus 27
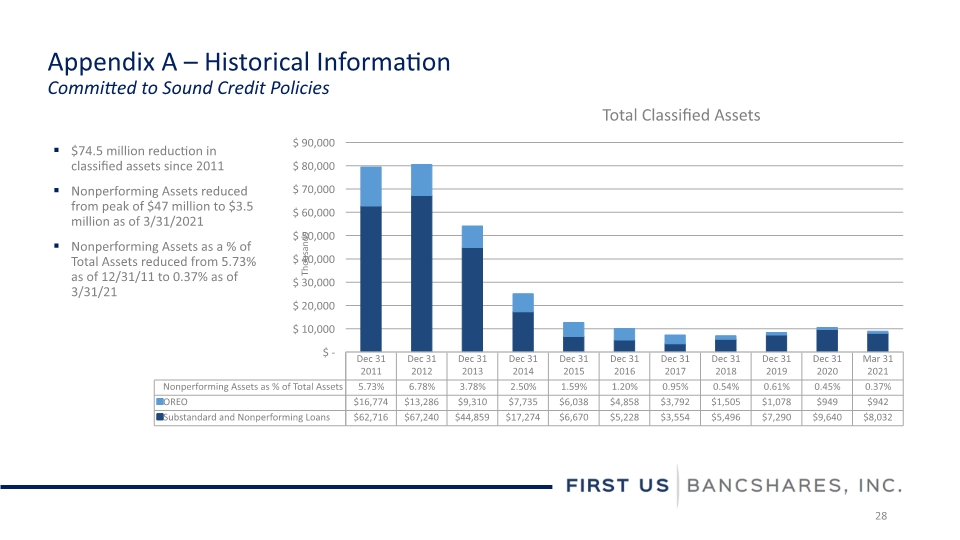
Appendix A – Historical Information Committed to Sound Credit Policies Total Classified Assets 28 $74.5 million reduction in classified assets since 2011 Nonperforming Assets reduced from peak of $47 million to $3.5 million as of 3/31/2021 Nonperforming Assets as a % of Total Assets reduced from 5.73% as of 12/31/11 to 0.37% as of 3/31/21
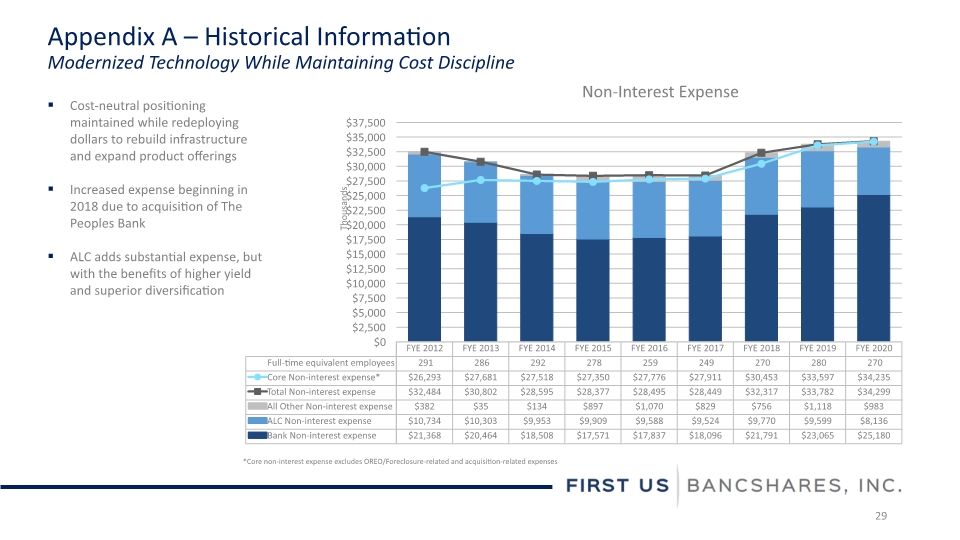
Appendix A – Historical Information Modernized Technology While Maintaining Cost Discipline Cost-neutral positioning maintained while redeploying dollars to rebuild infrastructure and expand product offerings Increased expense beginning in 2018 due to acquisition of The Peoples Bank ALC adds substantial expense, but with the benefits of higher yield and superior diversification Non-Interest Expense *Core non-interest expense excludes OREO/Foreclosure-related and acquisition-related expenses 29
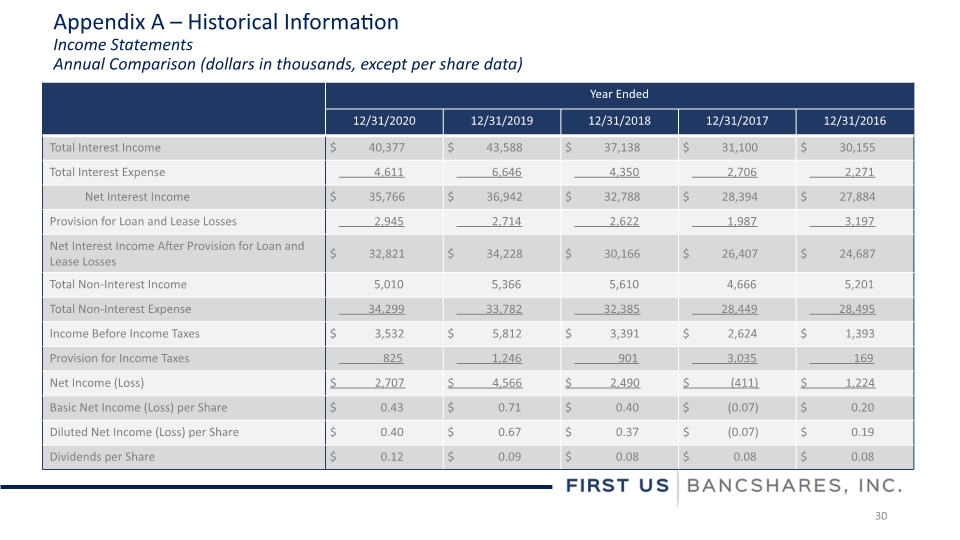
Appendix A – Historical Information Income Statements Annual Comparison (dollars in thousands, except per share data) 30
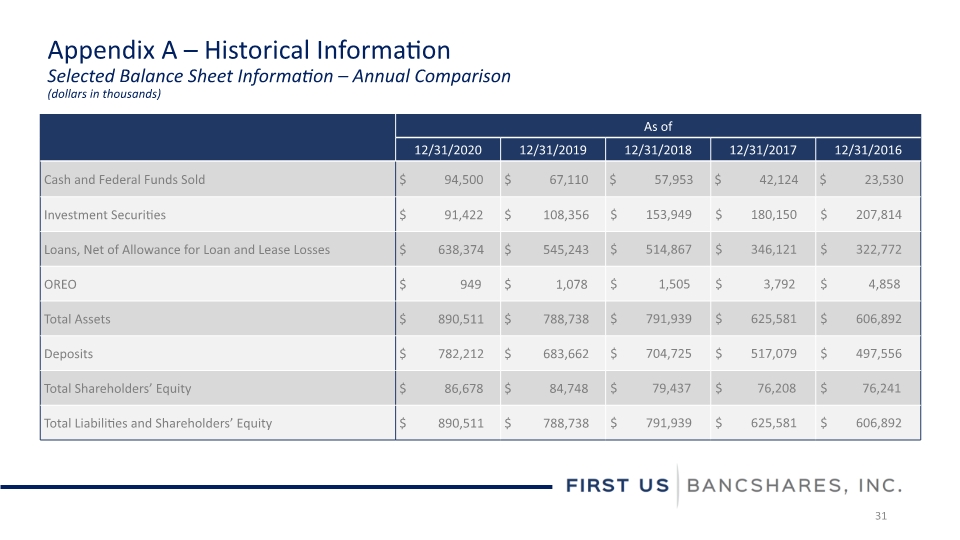
Appendix A – Historical Information Selected Balance Sheet Information – Annual Comparison (dollars in thousands) 31
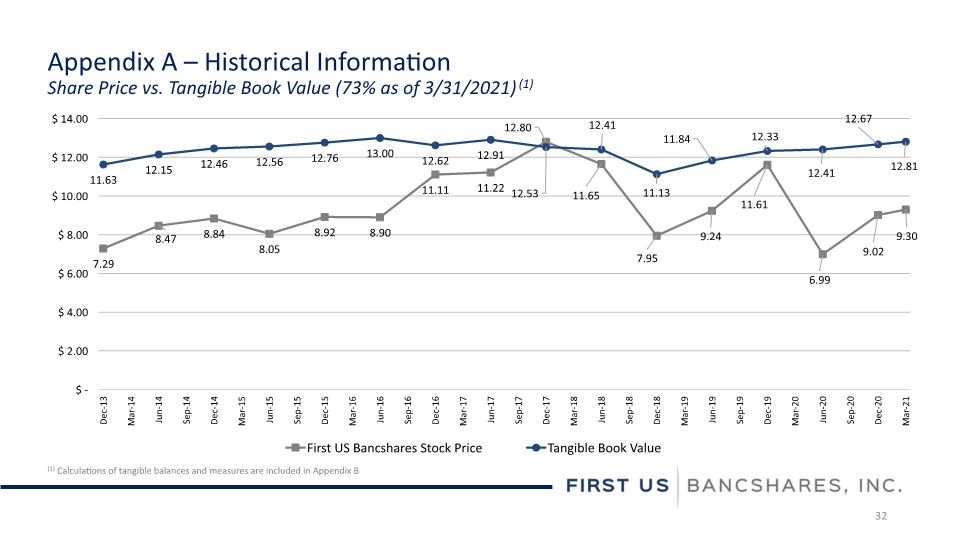
Appendix A – Historical Information Share Price vs. Tangible Book Value (73% as of 3/31/2021)(1) 32 (1) Calculations of tangible balances and measures are included in Appendix B
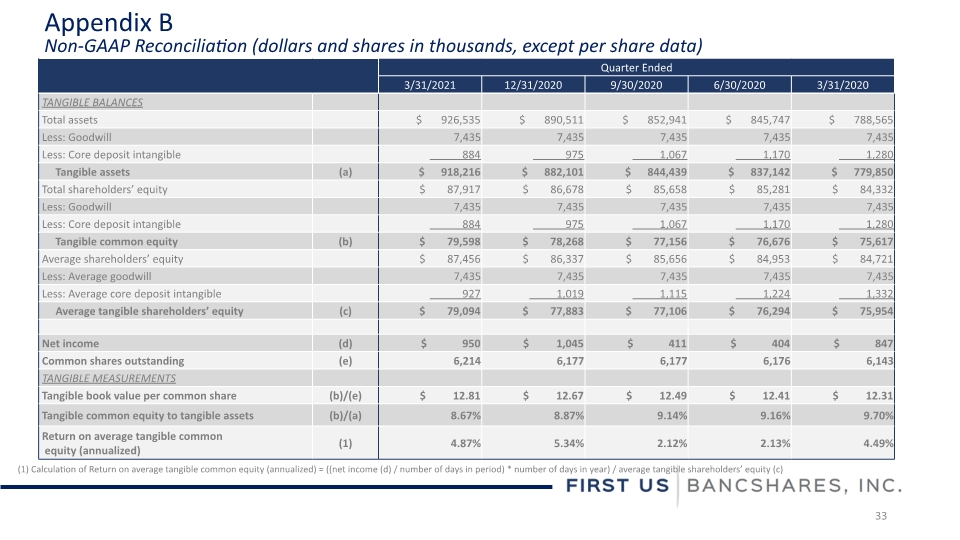
33 Appendix B Non-GAAP Reconciliation (dollars and shares in thousands, except per share data) (1) Calculation of Return on average tangible common equity (annualized) = ((net income (d) / number of days in period) * number of days in year) / average tangible shareholders’ equity (c)
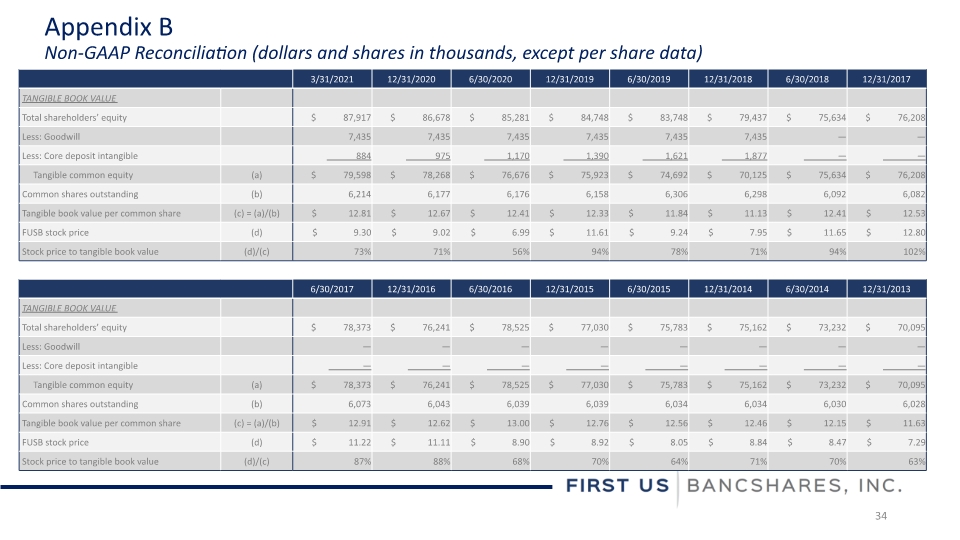
34 Appendix B Non-GAAP Reconciliation (dollars and shares in thousands, except per share data)
www.firstusbank.com Contact: Thomas S. Elley Chief Financial Officer telley@firstusbank.com 205.582.1200
