Attached files
| file | filename |
|---|---|
| EX-99.2 - EX-99.2 - PDF - UDR, Inc. | udr-20210427ex992b9e83d.pdf |
| EX-99.1 - EX-99.1 - PDF - UDR, Inc. | udr-20210427ex99131a7e5.pdf |
| EX-99.1 - EX-99.1 - UDR, Inc. | udr-20210427ex991a3ff25.htm |
| 8-K - 8-K - UDR, Inc. | udr-20210427x8k.htm |
Exhibit 99.2
Financial Highlights
UDR, Inc.
As of End of First Quarter 2021
(Unaudited) (1)
| | | | Actual Results | | | | Guidance as of March 31, 2021 | ||
Dollars in thousands, except per share and unit | | | | 1Q 2021 | | | | 2Q 2021 | | Full-Year 2021 |
| | | | | | | | | | |
GAAP Metrics | | | | | | | | | | |
Net income/(loss) attributable to UDR, Inc. | | | | $3,104 | | | | -- | | -- |
Net income/(loss) attributable to common stockholders | | | | $2,048 | | | | -- | | -- |
Income/(loss) per weighted average common share, diluted | | | | $0.01 | | | | $0.01 to $0.03 | | $0.04 to $0.13 |
| | | | | | | | | | |
Per Share Metrics | | | | | | | | | | |
FFO per common share and unit, diluted | | | | $0.32 | | | | $0.47 to $0.49 | | $1.76 to $1.85 |
FFO as Adjusted per common share and unit, diluted | | | | $0.47 | | | | $0.47 to $0.49 | | $1.91 to $2.00 |
Adjusted Funds from Operations ("AFFO") per common share and unit, diluted | | | | $0.44 | | | | $0.42 to $0.44 | | $1.73 to $1.82 |
Dividend declared per share and unit | | | | $0.3625 | | | | $0.3625 | | $1.45 (2) |
| | | | | | | | | | |
Same-Store Operating Metrics | | | | | | | | | | |
Revenue growth/(decline) (Cash basis) | | | | -6.4% | | | | -- | | (2.00%) - 0.50% |
Revenue growth/(decline) (Straight-line basis) | | | | -6.7% | | | | -- | | (4.00%) - (1.50%) |
Expense growth | | | | 3.3% | | | | -- | | 1.00% - 3.00% |
NOI growth/(decline) (Cash basis) | | | | -10.4% | | | | -- | | (3.25%) - 0.00% |
NOI growth/(decline) (Straight-line basis) | | | | -10.8% | | | | -- | | (5.75%) - (2.50%) |
Physical Occupancy | | | | 96.4% | | | | -- | | -- |
| | | | | | | | | | |
| | | | | | | | | | |
Property Metrics | | | | Homes | | Communities | | % of Total NOI | | |
Same-Store | | | | 45,403 | | 142 | | 90.9% | | |
Stabilized, Non-Mature | | | | 2,294 | | 6 | | 3.6% | | |
Acquired Communities | | | | 300 | | 1 | | 0.3% | | |
Development, completed | | | | 366 | | 1 | | 0.2% | | |
Non-Residential / Other | | | | N/A | | N/A | | 1.0% | | |
Joint Venture (3) | | | | 2,837 | | 13 | | 4.0% | | |
Total completed homes | | | | 51,200 | | 163 | | 100% | | |
Under Development | | | | 1,417 | | 5 | | - | | |
Total Quarter-end homes (3)(4) | | | | 52,617 | | 168 | | 100% | | |
| | | | | | | | | | |
| | | | | | | | | | |
Balance Sheet Metrics (adjusted for non-recurring items) | | | | | | | | | | |
| | | | 1Q 2021 | | 1Q 2020 | | | | |
Consolidated Interest Coverage Ratio | | | | 4.7x | | 5.0x | | | | |
Consolidated Fixed Charge Coverage Ratio | | | | 4.5x | | 4.8x | | | | |
Consolidated Debt as a percentage of Total Assets | | | | 35.3% | | 35.0% | | | | |
Consolidated Net Debt-to-EBITDAre | | | | 7.0x | | 6.0x | | | | |
| | | | | | | | | | |
| (1) | See Attachment 16 for definitions, other terms and reconciliations. |
| (2) | Annualized for 2021. |
| (3) | Joint venture NOI is based on UDR's share. Homes and communities at 100%. |
| (4) | Excludes 3,469 homes that are part of the Developer Capital Program as described in Attachment 12(B). |
1
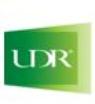
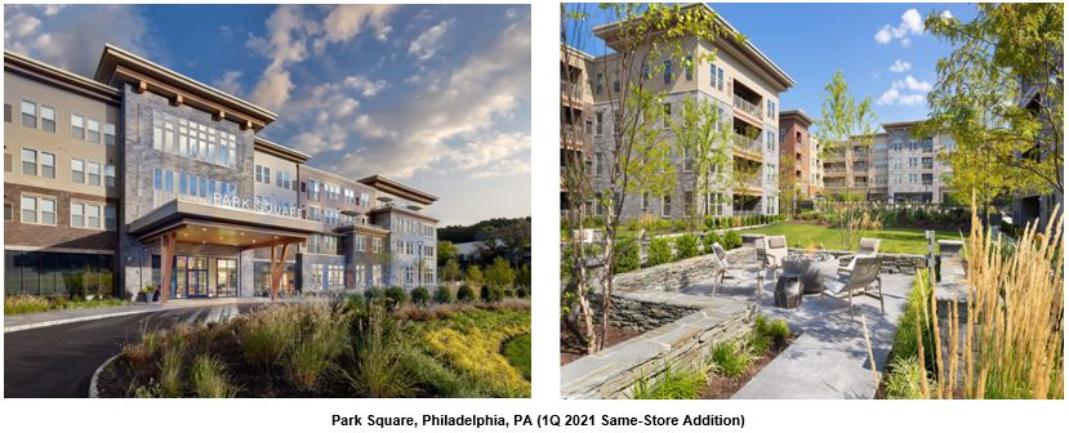
Recent Operating Trends
UDR, Inc.
March 31, 2021 (1)
(Unaudited)
 Green dashed lines indicate estimated results for the month of April 2021 and are as of April 25, 2021.
| (1) | April 2021 results are as of and through April 25, 2021. Actual April 2021 results may vary. |
| (2) | The Company defines Leasing Traffic as average daily leads to lease a home for the period indicated. |
| (3) | The Company defines Billed Revenue as Same-Store revenue with concessions reflected on a cash basis less bad debt reserves and write-offs. |
| (4) | Cash Collections are for the Company's total residential portfolio. |
2
Attachment 1
UDR, Inc.
Consolidated Statements of Operations
(Unaudited) (1)
| | Three Months Ended | ||||
| | March 31, | ||||
In thousands, except per share amounts | | 2021 | | 2020 | ||
| | | | | | |
REVENUES: | | | | | | |
Rental income (2) | | $ | 299,826 | | $ | 320,093 |
Joint venture management and other fees | | | 1,615 | | | 1,388 |
Total revenues | | | 301,441 | | | 321,481 |
| | | | | | |
OPERATING EXPENSES: | | | | | | |
Property operating and maintenance | | | 51,381 | | | 49,483 |
Real estate taxes and insurance | | | 47,387 | | | 45,145 |
Property management | | | 8,995 | | | 9,203 |
Other operating expenses | | | 4,435 | | | 4,966 |
Real estate depreciation and amortization | | | 144,088 | | | 155,476 |
General and administrative | | | 12,736 | | | 14,978 |
Casualty-related charges/(recoveries), net (3) | | | 5,577 | | | 1,251 |
Other depreciation and amortization | | | 2,601 | | | 2,025 |
Total operating expenses | | | 277,200 | | | 282,527 |
| | | | | | |
Gain/(loss) on sale of real estate owned | | | 50,829 | | | - |
Operating income | | | 75,070 | | | 38,954 |
| | | | | | |
Income/(loss) from unconsolidated entities (2) | | | 4,922 | | | 3,367 |
Interest expense | | | (36,206) | | | (39,317) |
Debt extinguishment and other associated costs | | | (41,950) | | | - |
Total interest expense | | | (78,156) | | | (39,317) |
Interest income and other income/(expense), net | | | 2,057 | | | 2,700 |
| | | | | | |
Income/(loss) before income taxes | | | 3,893 | | | 5,704 |
Tax (provision)/benefit, net | | | (619) | | | (164) |
| | | | | | |
Net Income/(loss) | | | 3,274 | | | 5,540 |
Net (income)/loss attributable to redeemable noncontrolling interests in the OP and DownREIT Partnership | | | (154) | | | (313) |
Net (income)/loss attributable to noncontrolling interests | | | (16) | | | (6) |
| | | | | | |
Net income/(loss) attributable to UDR, Inc. | | | 3,104 | | | 5,221 |
Distributions to preferred stockholders - Series E (Convertible) | | | (1,056) | | | (1,066) |
| | | | | | |
Net income/(loss) attributable to common stockholders | | $ | 2,048 | | $ | 4,155 |
| | | | | | |
| | | | | | |
Income/(loss) per weighted average common share - basic: | | | $0.01 | | | $0.01 |
Income/(loss) per weighted average common share - diluted: | | | $0.01 | | | $0.01 |
| | | | | | |
Common distributions declared per share | | | $0.3625 | | | $0.3600 |
| | | | | | |
Weighted average number of common shares outstanding - basic | | | 296,537 | | | 294,457 |
Weighted average number of common shares outstanding - diluted | | | 297,026 | | | 295,160 |
| (5) | See Attachment 16 for definitions and other terms. |
| (6) | During the three months ended March 31, 2021, UDR collected 95.2% of billed residential revenue and 84.4% of billed retail revenue. Of the 4.8% and 15.6% not collected, UDR reserved (reflected as a reduction to revenues) approximately 1.5% or $4.7 million for residential, including $0.3 million for UDR’s share from unconsolidated joint ventures, and 10.1% or $0.8 million, including straight-line rent receivables and $0.1 million for UDR’s share from unconsolidated joint ventures, for retail. The reserves are based on probability of collection. |
| (7) | During the three months ended March 31, 2021, various UDR communities in Texas and Washington incurred property damage in connection with Winter Storm Uri. |
3
Attachment 2
UDR, Inc.
Funds From Operations
(Unaudited) (1)
| | | Three Months Ended | |||
| | | March 31, | |||
In thousands, except per share and unit amounts | | | 2021 | | 2020 | |
| | | | | | |
Net income/(loss) attributable to common stockholders | | $ | 2,048 | | $ | 4,155 |
| | | | | | |
Real estate depreciation and amortization | | | 144,088 | | | 155,476 |
Noncontrolling interests | | | 170 | | | 319 |
Real estate depreciation and amortization on unconsolidated joint ventures | | | 8,205 | | | 8,816 |
Net gain on the sale of unconsolidated depreciable property | | | (2,460) | | | - |
Net gain on the sale of depreciable real estate owned, net of tax | | | (50,778) | | | - |
Funds from operations ("FFO") attributable to common stockholders and unitholders, basic | | $ | 101,273 | | $ | 168,766 |
| | | | | | |
Distributions to preferred stockholders - Series E (Convertible) (2) | | | 1,056 | | | 1,066 |
| | | | | | |
FFO attributable to common stockholders and unitholders, diluted | | $ | 102,329 | | $ | 169,832 |
| | | | | | |
FFO per weighted average common share and unit, basic | | $ | 0.32 | | $ | 0.53 |
FFO per weighted average common share and unit, diluted | | $ | 0.32 | | $ | 0.53 |
| | | | | | |
Weighted average number of common shares and OP/DownREIT Units outstanding, basic | | | 318,935 | | | 316,685 |
Weighted average number of common shares, OP/DownREIT Units, and common stock | | | | | | |
equivalents outstanding, diluted | | | 322,342 | | | 320,399 |
| | | | | | |
Impact of adjustments to FFO: | | | | | | |
Debt extinguishment and other associated costs | | $ | 41,950 | | $ | - |
Debt extinguishment and other associated costs on unconsolidated joint ventures | | | 1,682 | | | - |
Legal and other costs | | | 629 | | | 758 |
Realized/unrealized (gain)/loss on unconsolidated real estate technology investments, net of tax | | | (1,428) | | | 32 |
Severance costs and other restructuring expense | | | 468 | | | 1,642 |
Casualty-related charges/(recoveries), net | | | 5,577 | | | 1,399 |
Casualty-related charges/(recoveries) on unconsolidated joint ventures, net | | | - | | | 31 |
| | $ | 48,878 | | $ | 3,862 |
| | | | | | |
FFO as Adjusted attributable to common stockholders and unitholders, diluted | | $ | 151,207 | | $ | 173,694 |
| | | | | | |
FFO as Adjusted per weighted average common share and unit, diluted | | $ | 0.47 | | $ | 0.54 |
| | | | | | |
Recurring capital expenditures | | | (9,754) | | | (9,209) |
AFFO attributable to common stockholders and unitholders, diluted | | $ | 141,453 | | $ | 164,485 |
| | | | | | |
AFFO per weighted average common share and unit, diluted | | $ | 0.44 | | $ | 0.51 |
| (1) | See Attachment 16 for definitions and other terms. |
| (2) | Series E cumulative convertible preferred shares are dilutive for purposes of calculating FFO per share for the three months ended March 31, 2021 and March 31, 2020. Consequently, distributions to Series E cumulative convertible preferred stockholders are added to FFO and the weighted average number of Series E cumulative convertible preferred shares are included in the denominator when calculating FFO per common share and unit, diluted. |
4
Attachment 3
UDR, Inc.
Consolidated Balance Sheets
(Unaudited) (1)
| | March 31, | | December 31, | ||
In thousands, except share and per share amounts | | 2021 | | 2020 | ||
| | | | | | |
ASSETS | | | | | | |
| | | | | | |
Real estate owned: | | | | | | |
Real estate held for investment | | $ | 12,852,700 | | $ | 12,706,940 |
Less: accumulated depreciation | | | (4,729,702) | | | (4,590,577) |
Real estate held for investment, net | | | 8,122,998 | | | 8,116,363 |
Real estate under development | | | | | | |
(net of accumulated depreciation of $319 and $1,010) | | | 242,881 | | | 246,867 |
Real estate held for disposition | | | | | | |
(net of accumulated depreciation of $0 and $13,779) | | | - | | | 102,876 |
Total real estate owned, net of accumulated depreciation | | | 8,365,879 | | | 8,466,106 |
| | | | | | |
Cash and cash equivalents | | | 1,172 | | | 1,409 |
Restricted cash | | | 33,428 | | | 22,762 |
Notes receivable, net | | | 155,206 | | | 157,992 |
Investment in and advances to unconsolidated joint ventures, net | | | 620,111 | | | 600,233 |
Operating lease right-of-use assets | | | 200,064 | | | 200,913 |
Other assets | | | 190,696 | | | 188,118 |
Total assets | | $ | 9,566,556 | | $ | 9,637,533 |
| | | | | | |
LIABILITIES AND EQUITY | | | | | | |
| | | | | | |
Liabilities: | | | | | | |
Secured debt | | $ | 919,177 | | $ | 862,147 |
Unsecured debt | | | 4,121,998 | | | 4,114,401 |
Operating lease liabilities | | | 194,829 | | | 195,592 |
Real estate taxes payable | | | 32,437 | | | 29,946 |
Accrued interest payable | | | 23,149 | | | 44,760 |
Security deposits and prepaid rent | | | 47,968 | | | 49,008 |
Distributions payable | | | 116,693 | | | 115,795 |
Accounts payable, accrued expenses, and other liabilities | | | 104,218 | | | 110,999 |
Total liabilities | | | 5,560,469 | | | 5,522,648 |
| | | | | | |
Redeemable noncontrolling interests in the OP and DownREIT Partnership | | | 989,686 | | | 856,294 |
| | | | | | |
Equity: | | | | | | |
Preferred stock, no par value; 50,000,000 shares authorized | | | | | | |
2,695,363 shares of 8.00% Series E Cumulative Convertible issued | | | | | | |
and outstanding (2,695,363 shares at December 31, 2020) | | | 44,764 | | | 44,764 |
14,374,488 shares of Series F outstanding (14,440,519 shares | | | | | | |
at December 31, 2020) | | | 1 | | | 1 |
Common stock, $0.01 par value; 350,000,000 shares authorized | | | | | | |
296,822,363 shares issued and outstanding (296,611,579 shares at December 31, 2020) | | | 2,968 | | | 2,966 |
Additional paid-in capital | | | 5,885,682 | | | 5,881,383 |
Distributions in excess of net income | | | (2,923,073) | | | (2,685,770) |
Accumulated other comprehensive income/(loss), net | | | (8,614) | | | (9,144) |
Total stockholders' equity | | | 3,001,728 | | | 3,234,200 |
Noncontrolling interests | | | 14,673 | | | 24,391 |
Total equity | | | 3,016,401 | | | 3,258,591 |
Total liabilities and equity | | $ | 9,566,556 | | $ | 9,637,533 |
| (1) | See Attachment 16 for definitions and other terms. |
5
Attachment 4(A)
UDR, Inc.
Selected Financial Information
(Unaudited) (1)
| | | | | | | | | | March 31, | | December 31, |
Common Stock and Equivalents | | | | | | | | | | 2021 | | 2020 |
| | | | | | | | | | | | |
Common shares | | | | | | | | | | 296,573,755 | | 296,374,227 |
Restricted shares | | | | | | | | | | 248,608 | | 237,352 |
Total common shares | | | | | | | | | | 296,822,363 | | 296,611,579 |
Restricted unit and common stock equivalents | | | | | | | | | | 142,822 | | 344,128 |
Operating and DownREIT Partnership units | | | | | | | | | | 20,812,982 | | 20,530,251 |
Class A Limited Partnership units | | | | | | | | | | 1,751,671 | | 1,751,671 |
Series E cumulative convertible preferred shares (2) | | | | | | | | | | 2,918,127 | | 2,918,127 |
Total common shares, OP/DownREIT units, and common stock equivalents | | | | | | | | | | 322,447,965 | | 322,155,756 |
| | | | | | | | | | | | |
| | | | | | | | | | | | |
| | | | | | | | | | | | |
| | | | | | | | | | | | |
Weighted Average Number of Shares Outstanding | | | | | | | | | | 1Q 2021 | | 1Q 2020 |
| | | | | | | | | | | | |
Weighted average number of common shares and OP/DownREIT units outstanding - basic | | | | | | | | | | 318,934,716 | | 316,685,092 |
Weighted average number of OP/DownREIT units outstanding | | | | | | | | | | (22,398,049) | | (22,227,883) |
Weighted average number of common shares outstanding - basic per the Consolidated Statements of Operations | | | | | | | | | | 296,536,667 | | 294,457,209 |
| | | | | | | | | | | | |
Weighted average number of common shares, OP/DownREIT units, and common stock equivalents outstanding - diluted | | | | | | | | | | 322,342,024 | | 320,398,509 |
Weighted average number of OP/DownREIT units outstanding | | | | | | | | | | (22,398,049) | | (22,227,883) |
Weighted average number of Series E cumulative convertible preferred shares outstanding (3) | | | | | | | | | | (2,918,127) | | (3,010,843) |
Weighted average number of common shares outstanding - diluted per the Consolidated Statements of Operations | | | | | | | | | | 297,025,848 | | 295,159,783 |
| | | | | | | | | | | | |
| | | | | | | | | | | | |
| (1) | See Attachment 16 for definitions and other terms. |
| (2) | At March 31, 2021 and December 31, 2020 there were 2,695,363 of Series E cumulative convertible preferred shares outstanding, which is equivalent to 2,918,127 shares of common stock if converted (after adjusting for the special dividend paid in 2008). |
| (3) | Series E cumulative convertible preferred shares are anti-dilutive for purposes of calculating Income/(loss) per weighted average common share for the three months ended March 31, 2021 and March 31, 2020. |
6
Attachment 4(B)
UDR, Inc.
Selected Financial Information
(Unaudited) (1)
| | | | | | | | | | | | | | Weighted | | Weighted |
| | | | | | | | | | | | | | Average | | Average Years |
Debt Structure, In thousands | | | | | | | | Balance | | | % of Total | | Interest Rate | | to Maturity (2) | |
| | | | | | | | | | | | | | | | |
Secured | | | Fixed | | | | | $ | 876,080 | | | 17.4% | | 3.37% | | 7.0 |
| | | Floating | | | | | | 27,000 | | | 0.5% | | 0.77% | | 11.0 |
| | | Combined | | | | | | 903,080 | | | 17.9% | | 3.29% | | 7.1 |
| | | | | | | | | | | | | | | | |
Unsecured | | | Fixed | | | | | | 3,880,644 | (3) | | 76.9% | | 2.87% | | 8.9 |
| | | Floating | | | | | | 262,813 | | | 5.2% | | 0.41% | | 0.4 |
| | | Combined | | | | | | 4,143,457 | | | 82.1% | | 2.72% | | 8.4 |
| | | | | | | | | | | | | | | | |
Total Debt | | | Fixed | | | | | | 4,756,724 | | | 94.3% | | 2.96% | | 8.6 |
| | | Floating | | | | | | 289,813 | | | 5.7% | | 0.44% | | 1.4 |
| | | Combined | | | | | | 5,046,537 | | | 100.0% | | 2.82% | | 8.2 |
| | | Total Non-Cash Adjustments (4) | | | | | | (5,362) | | | | | | | |
| | | Total per Balance Sheet | | | | | $ | 5,041,175 | | | | | 2.84% | | |
| | | | | | | | | | | | | | | | |
| | | | | | | | | | | | | | | | |
| | | | | | | | | | | | | | | | |
Debt Maturities, In thousands | | | | | | | | | | | | | | | | |
| | | | | | | | Revolving Credit | | | | | | | | |
| | | | | Unsecured | | Facilities & Comm. | | | | | | | Weighted Average | ||
| | Secured Debt (5) | | Debt | | Paper (2) (6) (7) | | Balance | | % of Total | | Interest Rate | ||||
| | | | | | | | | | | | | | | | |
2021 | | $ | 827 | | $ | - | | $ | 210,000 | | $ | 210,827 | | 4.2% | | 0.27% |
2022 | | | 1,140 | | | - | | | 17,813 | | | 18,953 | | 0.4% | | 1.11% |
2023 | | | 1,183 | | | 350,000 | | | - | | | 351,183 | | 7.0% | | 1.07% |
2024 | | | 96,028 | | | 15,644 | | | - | | | 111,672 | | 2.2% | | 4.00% |
2025 | | | 174,043 | | | - | | | - | | | 174,043 | | 3.4% | | 3.68% |
2026 | | | 51,963 | | | 300,000 | | | - | | | 351,963 | | 7.0% | | 2.95% |
2027 | | | 2,045 | | | 300,000 | | | - | | | 302,045 | | 6.0% | | 4.03% |
2028 | | | 123,435 | | | 300,000 | | | - | | | 423,435 | | 8.4% | | 3.67% |
2029 | | | 191,986 | | | 300,000 | | | - | | | 491,986 | | 9.7% | | 3.94% |
2030 | | | 72,500 | | | 600,000 | | | - | | | 672,500 | | 13.3% | | 3.29% |
Thereafter | | | 187,930 | | | 1,750,000 | | | - | | | 1,937,930 | | 38.4% | | 2.44% |
| | | 903,080 | | | 3,915,644 | | | 227,813 | | | 5,046,537 | | 100.0% | | 2.82% |
Total Non-Cash Adjustments (4) | | | 16,097 | | | (21,459) | | | - | | | (5,362) | | | | |
Total per Balance Sheet | | $ | 919,177 | | $ | 3,894,185 | | $ | 227,813 | | $ | 5,041,175 | | | | 2.84% |
| (1) | See Attachment 16 for definitions and other terms. |
| (2) | The 2021 maturity reflects the $210.0 million of principal outstanding at an interest rate of 0.26%, the equivalent of LIBOR plus a spread of 15 basis points, on the Company’s unsecured commercial paper program as of March 31, 2021. Under the terms of the program the Company may issue up to a maximum aggregate amount outstanding of $500.0 million. If the commercial paper was refinanced using the line of credit, the weighted average years to maturity would be 8.2 years without extensions and 8.3 years with extensions. |
| (3) | Includes $315.0 million of floating rate debt that has been fixed using interest rate swaps at a weighted average all-in rate of 1.07% until July 2022. |
| (4) | Includes the unamortized balance of fair market value adjustments, premiums/discounts and deferred financing costs. |
| (5) | Includes principal amortization, as applicable. |
| (6) | There were no borrowings outstanding on our $1.1 billion line of credit at March 31, 2021. The facility has a maturity date of January 2023, plus two six-month extension options and carries an interest rate equal to LIBOR plus a spread of 82.5 basis points. |
| (7) | There was $17.8 million outstanding on our $75.0 million working capital credit facility at March 31, 2021. The facility has a maturity date of January 2022. The working capital credit facility carries an interest rate equal to LIBOR plus a spread of 82.5 basis points. |
7
Attachment 4(C)
UDR, Inc.
Selected Financial Information
(Dollars in Thousands)
(Unaudited) (1)
| | | | | | | | | | | | Quarter Ended | |
Coverage Ratios | | | | | | | | | | | | March 31, 2021 | |
Net income/(loss) | | | | | | | | | | | | $ | 3,274 |
Adjustments: | | | | | | | | | | | | | |
Interest expense, including debt extinguishment and other associated costs | | | 78,156 | ||||||||||
Real estate depreciation and amortization | | | | | | | | | | | | | 144,088 |
Other depreciation and amortization | | | | | | | | | | | | | 2,601 |
Tax provision/(benefit), net | | | | | | | | | | | | | 619 |
Net (gain)/loss on the sale of depreciable real estate owned | | | | | | | | | | | | | (50,829) |
Adjustments to reflect the Company's share of EBITDAre of unconsolidated joint ventures | | | 11,858 | ||||||||||
EBITDAre | | | | | | | | | | | | $ | 189,767 |
| | | | | | | | | | | | | |
Casualty-related charges/(recoveries), net | | | | | | | | | | | | | 5,577 |
Legal and other costs | | | | | | | | | | | | | 629 |
Severance costs and other restructuring expense | | | | | | | | | | | | | 468 |
(Income)/loss from unconsolidated entities | | | | | | | | | | | | | (4,922) |
Adjustments to reflect the Company's share of EBITDAre of unconsolidated joint ventures | | | (11,858) | ||||||||||
Management fee expense on unconsolidated joint ventures | | | | | | | | | | | | | (757) |
Consolidated EBITDAre - adjusted for non-recurring items | | | | | | | | | | | | $ | 178,904 |
| | | | | | | | | | | | | |
Annualized consolidated EBITDAre - adjusted for non-recurring items | | $ | 715,616 | ||||||||||
| | | | | | | | | | | | | |
Interest expense, including debt extinguishment and other associated costs | | | 78,156 | ||||||||||
Capitalized interest expense | | | | | | | | | | | | | 2,122 |
Total interest | | | | | | | | | | | | $ | 80,278 |
Debt extinguishment and other associated costs | | | | | | | | | | | | | (41,950) |
Total interest - adjusted for non-recurring items | | | | | | | | | | | | $ | 38,328 |
| | | | | | | | | | | | | |
Preferred dividends | | | | | | | | | | | | $ | 1,056 |
| | | | | | | | | | | | | |
Total debt | | | | | | | | | | | | $ | 5,041,175 |
Cash | | | | | | | | | | | | | (1,172) |
Net debt | | | | | | | | | | | | $ | 5,040,003 |
| | | | | | | | | | | | | |
Consolidated Interest Coverage Ratio - adjusted for non-recurring items | | | 4.7x | ||||||||||
| | | | | | | | | | | | | |
Consolidated Fixed Charge Coverage Ratio - adjusted for non-recurring items | | | 4.5x | ||||||||||
| | | | | | | | | | | | | |
Consolidated Net Debt-to-EBITDAre - adjusted for non-recurring items | | | 7.0x | ||||||||||
| | | | | | | | | | | | | |
| | | | | | | | | | | | | |
Debt Covenant Overview | |||||||||||||
| | | | | | | | | | | | | |
Unsecured Line of Credit Covenants (2) | | | | | | | Required | | | Actual | | | Compliance |
| | | | | | | | | | | | | |
Maximum Leverage Ratio | | | | | | | ≤60.0% | | | 38.4% (2) | | | Yes |
Minimum Fixed Charge Coverage Ratio | | | | | | | ≥1.5x | | | 4.3x | | | Yes |
Maximum Secured Debt Ratio | | | | | | | ≤40.0% | | | 10.7% | | | Yes |
Minimum Unencumbered Pool Leverage Ratio | | | | | | | ≥150.0% | | | 295.7% | | | Yes |
| | | | | | | | | | | | | |
Senior Unsecured Note Covenants (3) | | | | | | | Required | | | Actual | | | Compliance |
| | | | | | | | | | | | | |
Debt as a percentage of Total Assets | | | | | | | ≤65.0% | | | 35.3% (3) | | | Yes |
Consolidated Income Available for Debt Service to Annual Service Charge | | ≥1.5x | | | 5.5x | | | Yes | |||||
Secured Debt as a percentage of Total Assets | | | | | | | ≤40.0% | | | 6.4% | | | Yes |
Total Unencumbered Assets to Unsecured Debt | | | | | | | ≥150.0% | | | 296.2% | | | Yes |
| | | | | | | | | | | | | |
Securities Ratings | | | | | | | Debt | | | Outlook | | | Commercial Paper |
| | | | | | | | | | | | | |
Moody's Investors Service | | | | | | | Baa1 | | | Stable | | | P-2 |
S&P Global Ratings | | | | | | | BBB+ | | | Stable | | | A-2 |
| | | | | | | | | | | | | |
| | | | | | | | | | | | | |
| | | | | | | | | | | | | |
| | | | | | | | | | Gross | | | % of |
| | Number of | | 1Q 2021 NOI (1) | | | | | Carrying Value | | | Total Gross | |
Asset Summary | | Homes | | ($000s) | | % of NOI | | | ($000s) | | | Carrying Value | |
| | | | | | | | | | | | | |
Unencumbered assets | | 42,165 | | $ | 177,898 | | 88.5% | | $ | 11,630,533 | | | 88.8% |
Encumbered assets | | 6,198 | | | 23,160 | | 11.5% | | | 1,465,367 | | | 11.2% |
| | 48,363 | | $ | 201,058 | | 100.0% | | $ | 13,095,900 | | | 100.0% |
| | | | | | | | | | | | | |
| (1) | See Attachment 16 for definitions and other terms. |
| (2) | As defined in our credit agreement dated September 27, 2018. |
| (3) | As defined in our indenture dated November 1, 1995 as amended, supplemented or modified from time to time. |
8
Attachment 5
UDR, Inc.
Operating Information
(Unaudited) (1)
| | Total | | Quarter Ended | | Quarter Ended | | Quarter Ended | | Quarter Ended | | Quarter Ended | |||||
Dollars in thousands | | Homes | | March 31, 2021 | | December 31, 2020 | | September 30, 2020 | | June 30, 2020 | | March 31, 2020 | |||||
Revenues | | | | | | | | | | | | | | | | | |
Same-Store Communities | | 45,403 | | $ | 277,820 | | $ | 276,996 | | $ | 278,398 | | $ | 285,922 | | $ | 296,882 |
Stabilized, Non-Mature Communities | | 2,294 | | | 14,123 | | | 10,805 | | | 8,723 | | | 10,346 | | | 10,107 |
Acquired Communities | | 300 | | | 1,000 | | | - | | | - | | | - | | | - |
Development Communities | | 366 | | | 847 | | | 539 | | | 244 | | | 58 | | | 7 |
Non-Residential / Other (2) | | - | | | 5,007 | | | 10,498 | | | 17,057 | | | 4,065 | | | 5,958 |
Total | | 48,363 | | $ | 298,797 | | $ | 298,838 | | $ | 304,422 | | $ | 300,391 | | $ | 312,954 |
| | | | | | | | | | | | | | | | | |
Expenses | | | | | | | | | | | | | | | | | |
Same-Store Communities | | | | $ | 88,079 | | $ | 86,808 | | $ | 89,809 | | $ | 84,689 | | $ | 85,231 |
Stabilized, Non-Mature Communities | | | | | 6,594 | | | 5,609 | | | 4,763 | | | 4,107 | | | 3,786 |
Acquired Communities | | | | | 349 | | | - | | | - | | | - | | | - |
Development Communities | | | | | 462 | | | 215 | | | 248 | | | 123 | | | 47 |
Non-Residential / Other (2) | | | | | 2,878 | | | 2,447 | | | 1,207 | | | 2,948 | | | 3,287 |
Total (3) | | | | $ | 98,362 | | $ | 95,079 | | $ | 96,027 | | $ | 91,867 | | $ | 92,351 |
| | | | | | | | | | | | | | | | | |
Net Operating Income | | | | | | | | | | | | | | | | | |
Same-Store Communities | | | | $ | 189,741 | | $ | 190,188 | | $ | 188,589 | | $ | 201,233 | | $ | 211,651 |
Stabilized, Non-Mature Communities | | | | | 7,529 | | | 5,196 | | | 3,960 | | | 6,239 | | | 6,321 |
Acquired Communities | | | | | 651 | | | - | | | - | | | - | | | - |
Development Communities | | | | | 385 | | | 324 | | | (4) | | | (65) | | | (40) |
Non-Residential / Other (2) | | | | | 2,129 | | | 8,051 | | | 15,850 | | | 1,117 | | | 2,671 |
Total | | | | $ | 200,435 | | $ | 203,759 | | $ | 208,395 | | $ | 208,524 | | $ | 220,603 |
| | | | | | | | | | | | | | | | | |
Operating Margin | | | | | | | | | | | | | | | | | |
Same-Store Communities | | | | | 68.3% | | | 68.7% | | | 67.7% | | | 70.4% | | | 71.3% |
| | | | | | | | | | | | | | | | | |
Weighted Average Physical Occupancy | | | | | | | | | | | | | | | | | |
Same-Store Communities | | | | | 96.4% | | | 96.1% | | | 95.5% | | | 96.1% | | | 96.8% |
Stabilized, Non-Mature Communities | | | | | 94.5% | | | 93.6% | | | 88.3% | | | 92.5% | | | 95.2% |
Acquired Communities | | | | | 93.3% | | | - | | | - | | | - | | | - |
Development Communities | | | | | 75.1% | | | 81.6% | | | 79.6% | | | 44.5% | | | - |
Other (4) | | | | | 96.5% | | | 93.3% | | | 92.9% | | | 94.0% | | | 96.7% |
Total | | | | | 96.9% | | | 95.9% | | | 95.3% | | | 96.0% | | | 96.9% |
| | | | | | | | | | | | | | | | | |
Sold and Held for Disposition Communities | | | | | | | | | | | | | | | | | |
Revenues | | - | | $ | 1,029 | | $ | 2,338 | | $ | 4,423 | | $ | 5,591 | | $ | 7,139 |
Expenses (3) | | | | | 406 | | | 1,245 | | | 1,686 | | | 1,862 | | | 2,277 |
Net Operating Income/(Loss) | | | | $ | 623 | | $ | 1,093 | | $ | 2,737 | | $ | 3,729 | | $ | 4,862 |
| | | | | | | | | | | | | | | | | |
Total | | 48,363 | | $ | 201,058 | | $ | 204,852 | | $ | 211,132 | | $ | 212,253 | | $ | 225,465 |
| (1) | See Attachment 16 for definitions and other terms. |
| (2) | Primarily non-residential revenue and expense and straight-line adjustment for concessions. |
| (3) | The summation of Total expenses and Sold and Held for Disposition Communities expenses above agrees to the summation of property operating and maintenance and real estate taxes and insurance expenses on Attachment 1. |
| (4) | Includes occupancy of Sold and Held for Disposition Communities. |
9
Attachment 6
UDR, Inc.
Same-Store Operating Expense Information
(Dollars in Thousands)
(Unaudited) (1)
| | % of 1Q 2021 | | | | | | | | |
| | SS Operating | | | | | | | | |
Year-Over-Year Comparison | | Expenses | | 1Q 2021 | | 1Q 2020 | | % Change | ||
| | | | | | | | | | |
Personnel | | 15.7% | | $ | 13,817 | | $ | 15,333 | | -9.9% |
Utilities | | 13.6% | | | 11,973 | | | 11,762 | | 1.8% |
Repair and maintenance | | 16.5% | | | 14,535 | | | 12,371 | | 17.5% |
Administrative and marketing | | 7.0% | | | 6,154 | | | 6,105 | | 0.8% |
Controllable expenses | | 52.8% | | | 46,479 | | | 45,571 | | 2.0% |
| | | | | | | | | | |
Real estate taxes (2) | | 42.2% | | $ | 37,142 | | $ | 36,182 | | 2.7% |
Insurance | | 5.0% | | | 4,458 | | | 3,478 | | 28.2% |
Same-Store operating expenses (2) | | 100.0% | | $ | 88,079 | | $ | 85,231 | | 3.3% |
| | | | | | | | | | |
Same-Store Homes | | 45,403 | | | | | | | | |
| | | | | | | | | | |
| | | | | | | | | | |
| | | | | | | | | | |
| | % of 1Q 2021 | | | | | | | | |
| | SS Operating | | | | | | | | |
Sequential Comparison | | Expenses | | 1Q 2021 | | 4Q 2020 | | % Change | ||
| | | | | | | | | | |
Personnel | | 15.7% | | $ | 13,817 | | $ | 14,435 | | -4.3% |
Utilities | | 13.6% | | | 11,973 | | | 11,542 | | 3.7% |
Repair and maintenance | | 16.5% | | | 14,535 | | | 13,915 | | 4.5% |
Administrative and marketing | | 7.0% | | | 6,154 | | | 6,281 | | -2.0% |
Controllable expenses | | 52.8% | | | 46,479 | | | 46,173 | | 0.7% |
| | | | | | | | | | |
Real estate taxes (2) | | 42.2% | | $ | 37,142 | | $ | 36,587 | | 1.5% |
Insurance | | 5.0% | | | 4,458 | | | 4,048 | | 10.1% |
Same-Store operating expenses (2) | | 100.0% | | $ | 88,079 | | $ | 86,808 | | 1.5% |
| | | | | | | | | | |
Same-Store Homes | | 45,403 | | | | | | | | |
| | | | | | | | | | |
| | | | | | | | | | |
| | | | | | | | | | |
| | | | | | | | | | |
| (1) | See Attachment 16 for definitions and other terms. |
| (2) | The year-over-year and sequential comparisons presented above include $347 thousand and $0, respectively, of higher New York real estate taxes due to 421g exemption and abatement reductions. |
10
Attachment 7(A)
UDR, Inc.
Apartment Home Breakout
Portfolio Overview as of Quarter Ended
March 31, 2021
(Unaudited) (1)
| | | | Non-Mature Homes | | | | Unconsolidated | | | ||
| | Total | | | | | | Total | | Joint Venture | | Total |
| | Same-Store | | | | Non- | | Consolidated | | Operating | | Homes |
| | Homes | | Stabilized (2) | | Stabil. / Other (3) | | Homes | | Homes (4) | | (incl. JV) (4) |
West Region | | | | | | | | | | | | |
Orange County, CA | | 4,950 | | - | | - | | 4,950 | | 381 | | 5,331 |
San Francisco, CA | | 2,751 | | - | | - | | 2,751 | | 602 | | 3,353 |
Seattle, WA | | 2,725 | | - | | - | | 2,725 | | - | | 2,725 |
Monterey Peninsula, CA | | 1,565 | | - | | - | | 1,565 | | - | | 1,565 |
Los Angeles, CA | | 1,225 | | - | | - | | 1,225 | | 340 | | 1,565 |
| | 13,216 | | - | | - | | 13,216 | | 1,323 | | 14,539 |
| | | | | | | | | | | | |
Mid-Atlantic Region | | | | | | | | | | | | |
Metropolitan DC | | 8,003 | | 400 | | - | | 8,403 | | - | | 8,403 |
Baltimore, MD | | 1,597 | | - | | - | | 1,597 | | - | | 1,597 |
Richmond, VA | | 1,359 | | - | | - | | 1,359 | | - | | 1,359 |
| | 10,959 | | 400 | | - | | 11,359 | | - | | 11,359 |
| | | | | | | | | | | | |
Northeast Region | | | | | | | | | | | | |
Boston, MA | | 4,139 | | 159 | | 300 | | 4,598 | | 250 | | 4,848 |
New York, NY | | 1,825 | | 493 | | - | | 2,318 | | 710 | | 3,028 |
| | 5,964 | | 652 | | 300 | | 6,916 | | 960 | | 7,876 |
| | | | | | | | | | | | |
Southeast Region | | | | | | | | | | | | |
Tampa, FL | | 2,908 | | 966 | | - | | 3,874 | | - | | 3,874 |
Orlando, FL | | 2,500 | | - | | - | | 2,500 | | - | | 2,500 |
Nashville, TN | | 2,260 | | - | | - | | 2,260 | | - | | 2,260 |
| | 7,668 | | 966 | | - | | 8,634 | | - | | 8,634 |
| | | | | | | | | | | | |
Southwest Region | | | | | | | | | | | | |
Dallas, TX | | 3,864 | | - | | 366 | | 4,230 | | - | | 4,230 |
Austin, TX | | 1,272 | | - | | - | | 1,272 | | - | | 1,272 |
| | 5,136 | | - | | 366 | | 5,502 | | - | | 5,502 |
| | | | | | | | | | | | |
Other Markets (5) | | 2,460 | | 276 | | - | | 2,736 | | 554 | | 3,290 |
| | | | | | | | | | | | |
Totals | | 45,403 | | 2,294 | | 666 | | 48,363 | | 2,837 | | 51,200 |
| | | | | | | | | | | | |
Communities (6) | | 142 | | 6 | | 2 | | 150 | | 13 | | 163 |
| | | | | | | | | | | | |
| | | | | | Homes | | Communities | | | | |
Total completed homes | | | | | | 51,200 | | 163 | | | | |
Under Development (7) | | | | | | 1,417 | | 5 | | | | |
| | | | | | | | | | | | |
Total Quarter-end homes and communities | | | | | | 52,617 | | 168 | | | | |
| (1) | See Attachment 16 for definitions and other terms. |
| (2) | Represents homes included in Stabilized, Non-Mature Communities category on Attachment 5. |
| (3) | Represents homes included in Acquired, Development, Redevelopment and Non-Residential/Other Communities categories on Attachment 5. Excludes development homes not yet completed and Sold and Held for Disposition Communities. |
| (4) | Represents joint venture operating homes at 100 percent. Excludes joint venture held for disposition communities. See Attachment 12(A) for UDR's joint venture and partnership ownership interests. |
| (5) | Other Markets include Denver (218 homes), Palm Beach (636 homes), Inland Empire (654 homes), San Diego (163 wholly owned, 264 JV homes), Portland (752 homes) and Philadelphia (313 wholly owned, 290 JV homes). |
| (6) | Represents communities where 100 percent of all development homes have been completed. |
| (7) | See Attachment 9 for UDR’s developments and ownership interests. |
11

Attachment 7(B)
UDR, Inc.
Non-Mature Home Summary
Portfolio Overview as of Quarter Ended
March 31, 2021
(Unaudited) (1)
Non-Mature Home Breakout - By Date (quarter indicates anticipated date of QTD Same-Store inclusion) | |||||||||||||
| | | | | | | | | | | | | |
| | | | | | | | | | | | | |
Community | | | Category | | # of Homes | | Market | | Same-Store Quarter (2) | | | ||
| | | | | | | | | | | | | |
The Slade at Channelside | | | Stabilized, Non-Mature | | 294 | | Tampa, FL | | 2Q21 | | | ||
| | | | | | | | | | | | ||
The Arbory | | | Stabilized, Non-Mature | | 276 | | Portland, OR | | 2Q21 | | | ||
| | | | | | | | | | | | ||
10 Hanover Square | | | Stabilized, Non-Mature | | 493 | | New York, NY | | 1Q22 | | | ||
| | | | | | | | | | | | ||
Garrison Square | | | Stabilized, Non-Mature | | 159 | | Boston, MA | | 1Q22 | | | ||
| | | | | | | | | | | | ||
Andover Place at Cross Creek | | | Stabilized, Non-Mature | | 672 | | Tampa, FL | | 2Q22 | | | ||
| | | | | | | | | | | | ||
Station on Silver | | | Stabilized, Non-Mature | | 400 | | Metropolitan DC | | 2Q22 | | | ||
| | | | | | | | | | | | ||
Union Place | | | Acquired | | 300 | | Boston, MA | | 2Q22 | | | ||
| | | | | | | | | | | | | |
Vitruvian West Phase 2 | | | Development | | 366 | | Dallas, TX | | 3Q22 | | | ||
| | | | | | | | | | | | | |
Total | | | | | | | 2,960 | | | | | | |
| | | | | | | | | | | | | |
| | | | | | | | | | | | | |
Summary of Non-Mature Home Activity | |||||||||||||
| | | | | Stabilized, | | | | | | | | |
| | | Market | | Non-Mature | | Acquired | | Redevelopment | | Development | | Total |
Non-Mature Homes at December 31, 2020 | | 1,535 | | 1,072 | | - | | 202 | | 2,809 | |||
Park Square | | | Philadelphia, PA | | (313) | | - | | - | | - | | (313) |
Andover Place at Cross Creek | | | Tampa, FL | | 672 | | (672) | | - | | - | | - |
Station on Silver | | | Metropolitan DC | | 400 | | (400) | | - | | - | | - |
Vitruvian West Phase 2 | | | Dallas, TX | | - | | - | | - | | 164 | | 164 |
Union Place | | | Boston, MA | | - | | 300 | | - | | - | | 300 |
Non-Mature Homes at March 31, 2021 | | 2,294 | | 300 | | - | | 366 | | 2,960 | |||
| | | | | | | | | | | | | |
| (1) | See Attachment 16 for definitions and other terms. |
| (2) | Estimated Same-Store quarter represents the quarter UDR anticipates contributing the community to the QTD same-store pool. |
12
Attachment 7(C)
UDR, Inc.
Total Revenue Per Occupied Home Summary
Portfolio Overview as of Quarter Ended
March 31, 2021
(Unaudited) (1)
| | | | Non-Mature Homes | | | | Unconsolidated | | | ||||||||
| | Total | | | | | | | | Total | | Joint Venture | | Total | ||||
| | Same-Store | | | | | | Non- | | Consolidated | | Operating | | Homes | ||||
| | Homes | | Stabilized (2) | | | Stabilized (3) | | Homes | | Homes (4) | | (incl. JV at share) (4) | |||||
| | | | | | | | | | | | | | | | | | |
West Region | | | | | | | | | | | | | | | | | | |
Orange County, CA | | $ | 2,463 | | $ | - | | $ | - | | $ | 2,463 | | $ | 2,389 | | $ | 2,460 |
San Francisco, CA | | | 3,088 | | | - | | | - | | | 3,088 | | | 3,871 | | | 3,167 |
Seattle, WA | | | 2,324 | | | - | | | - | | | 2,324 | | | - | | | 2,324 |
Monterey Peninsula, CA | | | 1,928 | | | - | | | - | | | 1,928 | | | - | | | 1,928 |
Los Angeles, CA | | | 2,547 | | | - | | | - | | | 2,547 | | | 4,105 | | | 2,733 |
| | | | | | | | | | | | | | | | | | |
Mid-Atlantic Region | | | | | | | | | | | | | | | | | | |
Metropolitan DC | | | 2,090 | | | 1,948 | | | - | | | 2,083 | | | - | | | 2,083 |
Baltimore, MD | | | 1,624 | | | - | | | - | | | 1,624 | | | - | | | 1,624 |
Richmond, VA | | | 1,452 | | | - | | | - | | | 1,452 | | | - | | | 1,452 |
| | | | | | | | | | | | | | | | | | |
Northeast Region | | | | | | | | | | | | | | | | | | |
Boston, MA | | | 2,623 | | | 4,233 | | | 1,706 | | | 2,618 | | | 2,127 | | | 2,573 |
New York, NY | | | 3,833 | | | 3,215 | | | - | | | 3,703 | | | 4,208 | | | 3,769 |
| | | | | | | | | | | | | | | | | | |
Southeast Region | | | | | | | | | | | | | | | | | | |
Tampa, FL | | | 1,585 | | | 1,535 | | | - | | | 1,573 | | | - | | | 1,573 |
Orlando, FL | | | 1,426 | | | - | | | - | | | 1,426 | | | - | | | 1,426 |
Nashville, TN | | | 1,386 | | | - | | | - | | | 1,386 | | | - | | | 1,386 |
| | | | | | | | | | | | | | | | | | |
Southwest Region | | | | | | | | | | | | | | | | | | |
Dallas, TX | | | 1,480 | | | - | | | 1,554 | | | 1,471 | | | - | | | 1,471 |
Austin, TX | | | 1,533 | | | - | | | - | | | 1,533 | | | - | | | 1,533 |
| | | | | | | | | | | | | | | | | | |
Other Markets | | | 2,056 | | | 1,772 | | | - | | | 2,027 | | | 2,937 | | | 2,111 |
| | | | | | | | | | | | | | | | | | |
Weighted Average | | $ | 2,116 | | $ | 2,172 | | $ | 1,640 | | $ | 2,109 | | $ | 3,433 | | $ | 2,147 |
| (1) | See Attachment 16 for definitions and other terms. |
| (2) | Represents homes included in Stabilized, Non-Mature Communities category on Attachment 5. |
| (3) | Represents homes included in Acquired, Development, Redevelopment and Non-Residential/Other Communities categories on Attachment 5. Excludes development homes not yet completed and Sold and Held for Disposition Communities. |
| (4) | Represents joint ventures at UDR's ownership interests. Excludes joint venture held for disposition communities. See Attachment 12(A) for UDR's joint venture and partnership ownership interests. |
13
Attachment 7(D)
UDR, Inc.
Net Operating Income Breakout By Market
March 31, 2021
(Dollars in Thousands)
(Unaudited) (1)
| Three Months Ended March 31, 2021 | | | | | | |||||||||||
| | | | | | | | | | | | | | | | | |
| | | | | | | UDR's | | | | | | | | | ||
| | Same-Store | | Non Same-Store (3) | | Share of JVs (3)(4) | | Total | | | | | | ||||
| | | | | | | | | | | | | | | | | |
Net Operating Income | | $ | 189,741 | | $ | 10,694 | | $ | 8,387 | | $ | 208,822 | | | | | |
| | | | | | | | | | | | | | | | | |
% of Net Operating Income | | | 90.9% | | | 5.1% | | | 4.0% | | | 100.0% | | | | | |
| | | | | | | | | | | | | | | | | |
| | | | | | | | | | | | | | | | | |
Three Months Ended March 31, 2021 | |||||||||||||||||
| | | | | | | | | | | | | | | | | |
| | As a % of NOI | | | | | As a % of NOI | ||||||||||
Region | | Same-Store | | Total | | Region | | Same-Store | | | Total | ||||||
| | | | | | | | | | | | | | | | | |
West Region | | | | | | | | Southeast Region | | | | | | | | | |
Orange County, CA | | | 14.4% | | | 13.5% | | Tampa, FL | | | 4.6% | | | | | 5.3% | |
San Francisco, CA | | | 8.6% | | | 8.6% | | Orlando, FL | | | 3.8% | | | | | 3.4% | |
Seattle, WA | | | 6.7% | | | 6.5% | | Nashville, TN | | | 3.3% | | | | | 3.0% | |
Monterey Penninsula, CA | | | 3.5% | | | 3.2% | | | | | | 11.7% | | | | | 11.7% |
Los Angeles, CA | | | 3.2% | | | 3.5% | | | | | | | | | | | |
| | | 36.4% | | | 35.3% | | Southwest Region | | | | | | | | | |
| | | | | | | | Dallas, TX | | | 5.4% | | | | | 5.2% | |
Mid-Atlantic Region | | | | | | | | Austin, TX | | | 1.8% | | | | | 1.6% | |
Metropolitan DC | | | 17.4% | | | 16.5% | | | | | | 7.2% | | | | | 6.8% |
Baltimore, MD | | | 2.7% | | | 2.5% | | | | | | | | | | | |
Richmond, VA | | | 2.3% | | | 2.0% | | Other Markets | | | 5.5% | | | | | 6.3% | |
| | | 22.4% | | | 21.0% | | | | | | | | | | | |
| | | | | | | | | | | | | | | | | |
Northeast Region | | | | | | | | | | | | | | | | | |
Boston, MA | | | 11.6% | | | 11.8% | | | | | | | | | | | |
New York, NY | | | 5.2% | | | 7.1% | | | | | | | | | | | |
| | | 16.8% | | | 18.9% | | Total | | | 100.0% | | | | | 100.0% | |
| | | | | | | | | | | | | | | | | |
| (1) | See Attachment 16 for definitions and other terms. |
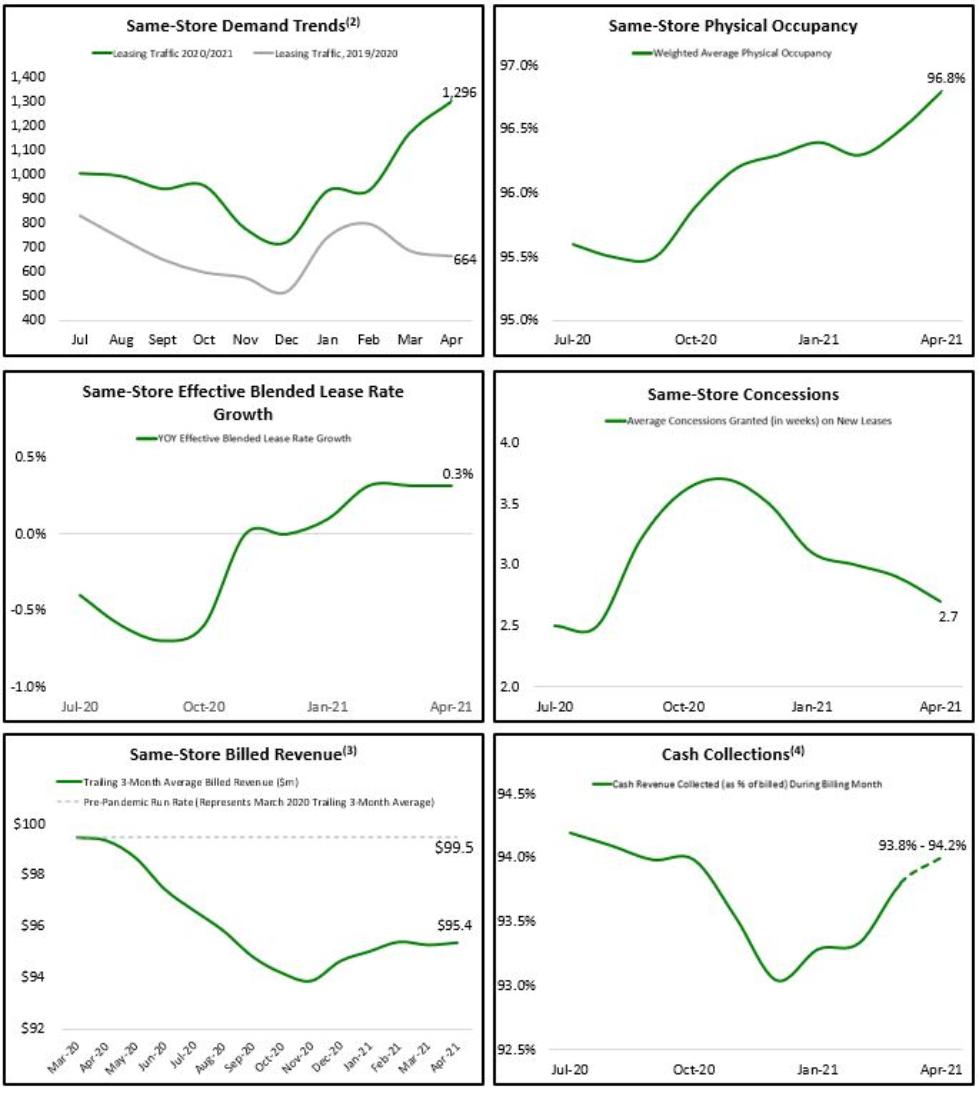
| (2) | Other Markets are included in the map within their actual geography. See Attachment 7(A), footnote 5 for details regarding location of the Other Markets. |
| (3) | Excludes results from Sold and Held for Disposition Communities. |
| (4) | Includes UDR's share of joint venture and partnership NOI on Attachment 12(A). |
14
Attachment 8(A)
UDR, Inc.
Same-Store Operating Information By Major Market
Current Quarter vs. Prior Year Quarter
March 31, 2021
(Unaudited) (1)
| | | | | | | | | | | | | |
| | | % of Same- | | Same-Store | ||||||||
| | Total | Store Portfolio | | | | | | | | | | |
| | Same-Store | Based on | | Physical Occupancy | | Total Revenue per Occupied Home | ||||||
| | Homes | 1Q 2021 NOI | | 1Q 21 | 1Q 20 | Change | | 1Q 21 | 1Q 20 | Change | ||
| | | | | | | | | | | | | |
West Region | | | | | | | | | | | | | |
Orange County, CA | | 4,950 | 14.4% | | 97.1% | 97.1% | 0.0% | | $ | 2,463 | $ | 2,555 | -3.6% |
San Francisco, CA | | 2,751 | 8.6% | | 92.8% | 96.5% | -3.7% | | | 3,088 | | 3,753 | -17.7% |
Seattle, WA | | 2,725 | 6.7% | | 96.3% | 97.6% | -1.3% | | | 2,324 | | 2,547 | -8.8% |
Monterey Peninsula, CA | | 1,565 | 3.5% | | 96.4% | 95.9% | 0.5% | | | 1,928 | | 1,953 | -1.3% |
Los Angeles, CA | | 1,225 | 3.2% | | 95.0% | 97.0% | -2.0% | | | 2,547 | | 2,939 | -13.3% |
| | 13,216 | 36.4% | | 95.8% | 96.9% | -1.1% | | | 2,504 | | 2,767 | -9.5% |
| | | | | | | | | | | | | |
Mid-Atlantic Region | | | | | | | | | | | | | |
Metropolitan DC | | 8,003 | 17.4% | | 95.9% | 97.1% | -1.2% | | | 2,090 | | 2,194 | -4.7% |
Baltimore, MD | | 1,597 | 2.7% | | 98.4% | 96.1% | 2.3% | | | 1,624 | | 1,634 | -0.6% |
Richmond, VA | | 1,359 | 2.3% | | 98.5% | 97.1% | 1.4% | | | 1,452 | | 1,407 | 3.2% |
| | 10,959 | 22.4% | | 96.6% | 97.0% | -0.4% | | | 1,940 | | 2,015 | -3.7% |
| | | | | | | | | | | | | |
Northeast Region | | | | | | | | | | | | | |
Boston, MA | | 4,139 | 11.6% | | 95.9% | 95.8% | 0.1% | | | 2,623 | | 2,809 | -6.6% |
New York, NY | | 1,825 | 5.2% | | 94.6% | 98.2% | -3.6% | | | 3,833 | | 4,310 | -11.1% |
| | 5,964 | 16.8% | | 95.5% | 96.5% | -1.0% | | | 2,990 | | 3,276 | -8.7% |
| | | | | | | | | | | | | |
Southeast Region | | | | | | | | | | | | | |
Tampa, FL | | 2,908 | 4.6% | | 97.4% | 96.8% | 0.6% | | | 1,585 | | 1,542 | 2.8% |
Orlando, FL | | 2,500 | 3.8% | | 96.8% | 96.0% | 0.8% | | | 1,426 | | 1,420 | 0.4% |
Nashville, TN | | 2,260 | 3.3% | | 97.7% | 97.7% | 0.0% | | | 1,386 | | 1,359 | 2.0% |
| | 7,668 | 11.7% | | 97.3% | 96.8% | 0.5% | | | 1,475 | | 1,448 | 1.8% |
| | | | | | | | | | | | | |
Southwest Region | | | | | | | | | | | | | |
Dallas, TX | | 3,864 | 5.4% | | 96.7% | 96.9% | -0.2% | | | 1,480 | | 1,510 | -2.0% |
Austin, TX | | 1,272 | 1.8% | | 97.3% | 97.6% | -0.3% | | | 1,533 | | 1,550 | -1.1% |
| | 5,136 | 7.2% | | 96.9% | 97.1% | -0.2% | | | 1,492 | | 1,520 | -1.8% |
| | | | | | | | | | | | | |
Other Markets | | 2,460 | 5.5% | | 97.2% | 96.2% | 1.0% | | | 2,056 | | 2,074 | -0.9% |
| | | | | | | | | | | | | |
Total/Weighted Avg. | | 45,403 | 100.0% | | 96.4% | 96.8% | -0.4% | | $ | 2,116 | $ | 2,251 | -6.0% |
| (1) | See Attachment 16 for definitions and other terms. |
15
Attachment 8(B)
UDR, Inc.
Same-Store Operating Information By Major Market
Current Quarter vs. Prior Year Quarter
March 31, 2021
(Unaudited) (1)
| | | | Same-Store ($000s) | |||||||||||||||
| | | | | | | | | | | | | | | | | | | |
| Total | | | | | | | | | | | | | | | | | | |
| Same-Store | | Revenues | | Expenses | | Net Operating Income | ||||||||||||
| Homes | | 1Q 21 | 1Q 20 | Change | | 1Q 21 | 1Q 20 | Change | | 1Q 21 | 1Q 20 | Change | ||||||
| | | | | | | | | | | | | | | | | | | |
West Region | | | | | | | | | | | | | | | | | | | |
Orange County, CA | 4,950 | | $ | 35,511 | $ | 36,848 | -3.6% | | $ | 8,252 | $ | 8,600 | -4.0% | | $ | 27,259 | $ | 28,248 | -3.5% |
San Francisco, CA | 2,751 | | | 23,652 | | 29,892 | -20.9% | | | 7,365 | | 7,291 | 1.0% | | | 16,287 | | 22,601 | -27.9% |
Seattle, WA | 2,725 | | | 18,296 | | 20,324 | -10.0% | | | 5,639 | | 5,269 | 7.0% | | | 12,657 | | 15,055 | -15.9% |
Monterey Peninsula, CA | 1,565 | | | 8,728 | | 8,795 | -0.8% | | | 2,006 | | 1,943 | 3.2% | | | 6,722 | | 6,852 | -1.9% |
Los Angeles, CA | 1,225 | | | 8,891 | | 10,477 | -15.1% | | | 2,729 | | 2,814 | -3.0% | | | 6,162 | | 7,663 | -19.6% |
| 13,216 | | | 95,078 | | 106,336 | -10.6% | | | 25,991 | | 25,917 | 0.3% | | | 69,087 | | 80,419 | -14.1% |
| | | | | | | | | | | | | | | | | | | |
Mid-Atlantic Region | | | | | | | | | | | | | | | | | | | |
Metropolitan DC | 8,003 | | | 48,132 | | 51,150 | -5.9% | | | 15,230 | | 15,278 | -0.3% | | | 32,902 | | 35,872 | -8.3% |
Baltimore, MD | 1,597 | | | 7,655 | | 7,522 | 1.8% | | | 2,461 | | 2,251 | 9.4% | | | 5,194 | | 5,271 | -1.5% |
Richmond, VA | 1,359 | | | 5,832 | | 5,566 | 4.8% | | | 1,526 | | 1,392 | 9.7% | | | 4,306 | | 4,174 | 3.2% |
| 10,959 | | | 61,619 | | 64,238 | -4.1% | | | 19,217 | | 18,921 | 1.6% | | | 42,402 | | 45,317 | -6.4% |
| | | | | | | | | | | | | | | | | | | |
Northeast Region | | | | | | | | | | | | | | | | | | | |
Boston, MA | 4,139 | | | 31,234 | | 33,414 | -6.5% | | | 9,166 | | 8,887 | 3.1% | | | 22,068 | | 24,527 | -10.0% |
New York, NY | 1,825 | | | 19,853 | | 23,172 | -14.3% | | | 9,893 | | 8,680 | 14.0% | | | 9,960 | | 14,492 | -31.3% |
| 5,964 | | | 51,087 | | 56,586 | -9.7% | | | 19,059 | | 17,567 | 8.5% | | | 32,028 | | 39,019 | -17.9% |
| | | | | | | | | | | | | | | | | | | |
Southeast Region | | | | | | | | | | | | | | | | | | | |
Tampa, FL | 2,908 | | | 13,465 | | 13,021 | 3.4% | | | 4,682 | | 4,438 | 5.5% | | | 8,783 | | 8,583 | 2.3% |
Orlando, FL | 2,500 | | | 10,354 | | 10,225 | 1.3% | | | 3,174 | | 2,934 | 8.2% | | | 7,180 | | 7,291 | -1.5% |
Nashville, TN | 2,260 | | | 9,182 | | 9,005 | 2.0% | | | 2,920 | | 2,381 | 22.6% | | | 6,262 | | 6,624 | -5.5% |
| 7,668 | | | 33,001 | | 32,251 | 2.3% | | | 10,776 | | 9,753 | 10.5% | | | 22,225 | | 22,498 | -1.2% |
| | | | | | | | | | | | | | | | | | | |
Southwest Region | | | | | | | | | | | | | | | | | | | |
Dallas, TX | 3,864 | | | 16,593 | | 16,965 | -2.2% | | | 6,382 | | 6,481 | -1.5% | | | 10,211 | | 10,484 | -2.6% |
Austin, TX | 1,272 | | | 5,693 | | 5,772 | -1.4% | | | 2,325 | | 2,264 | 2.7% | | | 3,368 | | 3,508 | -4.0% |
| 5,136 | | | 22,286 | | 22,737 | -2.0% | | | 8,707 | | 8,745 | -0.4% | | | 13,579 | | 13,992 | -3.0% |
| | | | | | | | | | | | | | | | | | | |
Other Markets | 2,460 | | | 14,749 | | 14,734 | 0.1% | | | 4,329 | | 4,328 | 0.0% | | | 10,420 | | 10,406 | 0.1% |
| | | | | | | | | | | | | | | | | | | |
Total (2)(3) | 45,403 | | $ | 277,820 | $ | 296,882 | -6.4% | | $ | 88,079 | $ | 85,231 | 3.3% | | $ | 189,741 | $ | 211,651 | -10.4% |
| (1) | See Attachment 16 for definitions and other terms. |
| (2) | 1Q 21 includes a reserve (reflected as a reduction to revenues) of approximately $4.5 million or 1.6% of billed residential revenue on our Same-Store Communities. The reserve is based on probability of collection. |
| (3) | With concessions reflected on a straight-line basis, Same-Store revenue and Same-Store NOI decreased year-over-year by -6.7% and -10.8%, respectively. See Attachment 16(C) for definitions and reconciliations. |
16
Attachment 8(C)
UDR, Inc.
Same-Store Operating Information By Major Market
Current Quarter vs. Last Quarter
March 31, 2021
(Unaudited) (1)
| | | | Same-Store | ||||||||
| | Total | | | | | | | | | | |
| | Same-Store | | Physical Occupancy | | Total Revenue per Occupied Home | ||||||
| | Homes | | 1Q 21 | 4Q 20 | Change | | 1Q 21 | 4Q 20 | Change | ||
| | | | | | | | | | | | |
West Region | | | | | | | | | | | | |
Orange County, CA | | 4,950 | | 97.1% | 96.3% | 0.8% | | $ | 2,463 | $ | 2,460 | 0.1% |
San Francisco, CA | | 2,751 | | 92.8% | 90.4% | 2.4% | | | 3,088 | | 3,127 | -1.2% |
Seattle, WA | | 2,725 | | 96.3% | 97.0% | -0.7% | | | 2,324 | | 2,371 | -2.0% |
Monterey Peninsula, CA | | 1,565 | | 96.4% | 96.6% | -0.2% | | | 1,928 | | 1,954 | -1.3% |
Los Angeles, CA | | 1,225 | | 95.0% | 94.1% | 0.9% | | | 2,547 | | 2,590 | -1.7% |
| | 13,216 | | 95.8% | 95.0% | 0.8% | | | 2,504 | | 2,524 | -0.8% |
| | | | | | | | | | | | |
Mid-Atlantic Region | | | | | | | | | | | | |
Metropolitan DC | | 8,003 | | 95.9% | 96.5% | -0.6% | | | 2,090 | | 2,131 | -1.9% |
Baltimore, MD | | 1,597 | | 98.4% | 98.0% | 0.4% | | | 1,624 | | 1,632 | -0.5% |
Richmond, VA | | 1,359 | | 98.5% | 98.7% | -0.2% | | | 1,452 | | 1,432 | 1.4% |
| | 10,959 | | 96.6% | 97.0% | -0.4% | | | 1,940 | | 1,969 | -1.5% |
| | | | | | | | | | | | |
Northeast Region | | | | | | | | | | | | |
Boston, MA | | 4,139 | | 95.9% | 94.4% | 1.5% | | | 2,623 | | 2,651 | -1.1% |
New York, NY | | 1,825 | | 94.6% | 93.9% | 0.7% | | | 3,833 | | 3,482 | 10.1% |
| | 5,964 | | 95.5% | 94.3% | 1.2% | | | 2,990 | | 2,901 | 3.0% |
| | | | | | | | | | | | |
Southeast Region | | | | | | | | | | | | |
Tampa, FL | | 2,908 | | 97.4% | 97.2% | 0.2% | | | 1,585 | | 1,578 | 0.4% |
Orlando, FL | | 2,500 | | 96.8% | 96.7% | 0.1% | | | 1,426 | | 1,427 | -0.1% |
Nashville, TN | | 2,260 | | 97.7% | 97.6% | 0.1% | | | 1,386 | | 1,395 | -0.6% |
| | 7,668 | | 97.3% | 97.2% | 0.1% | | | 1,475 | | 1,475 | 0.0% |
| | | | | | | | | | | | |
Southwest Region | | | | | | | | | | | | |
Dallas, TX | | 3,864 | | 96.7% | 96.9% | -0.2% | | | 1,480 | | 1,479 | 0.1% |
Austin, TX | | 1,272 | | 97.3% | 97.5% | -0.2% | | | 1,533 | | 1,551 | -1.2% |
| | 5,136 | | 96.9% | 97.1% | -0.2% | | | 1,492 | | 1,495 | -0.2% |
| | | | | | | | | | | | |
Other Markets | | 2,460 | | 97.2% | 97.4% | -0.2% | | | 2,056 | | 2,053 | 0.1% |
| | | | | | | | | | | | |
Total/Weighted Avg. | | 45,403 | | 96.4% | 96.1% | 0.3% | | $ | 2,116 | $ | 2,117 | -0.1% |
| (1) | See Attachment 16 for definitions and other terms. |
17
Attachment 8(D)
UDR, Inc.
Same-Store Operating Information By Major Market
Current Quarter vs. Last Quarter
March 31, 2021
(Unaudited) (1)
| | | | Same-Store ($000s) | |||||||||||||||
| Total | | | | | | | | | | | | | | | | | | |
| Same-Store | | Revenues | | Expenses | | Net Operating Income | ||||||||||||
| Homes | | 1Q 21 | 4Q 20 | Change | | 1Q 21 | 4Q 20 | Change | | 1Q 21 | 4Q 20 | Change | ||||||
| | | | | | | | | | | | | | | | | | | |
West Region | | | | | | | | | | | | | | | | | | | |
Orange County, CA | 4,950 | | $ | 35,511 | $ | 35,180 | 0.9% | | $ | 8,252 | $ | 8,521 | -3.1% | | $ | 27,259 | $ | 26,659 | 2.2% |
San Francisco, CA | 2,751 | | | 23,652 | | 23,330 | 1.4% | | | 7,365 | | 7,426 | -0.8% | | | 16,287 | | 15,904 | 2.4% |
Seattle, WA | 2,725 | | | 18,296 | | 18,800 | -2.7% | | | 5,639 | | 5,408 | 4.3% | | | 12,657 | | 13,392 | -5.5% |
Monterey Peninsula, CA | 1,565 | | | 8,728 | | 8,861 | -1.5% | | | 2,006 | | 1,933 | 3.7% | | | 6,722 | | 6,928 | -3.0% |
Los Angeles, CA | 1,225 | | | 8,891 | | 8,958 | -0.7% | | | 2,729 | | 2,865 | -4.8% | | | 6,162 | | 6,093 | 1.1% |
| 13,216 | | | 95,078 | | 95,129 | -0.1% | | | 25,991 | | 26,153 | -0.6% | | | 69,087 | | 68,976 | 0.2% |
| | | | | | | | | | | | | | | | | | | |
Mid-Atlantic Region | | | | | | | | | | | | | | | | | | | |
Metropolitan DC | 8,003 | | | 48,132 | | 49,372 | -2.5% | | | 15,230 | | 14,654 | 3.9% | | | 32,902 | | 34,718 | -5.2% |
Baltimore, MD | 1,597 | | | 7,655 | | 7,663 | -0.1% | | | 2,461 | | 2,382 | 3.3% | | | 5,194 | | 5,281 | -1.6% |
Richmond, VA | 1,359 | | | 5,832 | | 5,758 | 1.3% | | | 1,526 | | 1,451 | 5.2% | | | 4,306 | | 4,307 | 0.0% |
| 10,959 | | | 61,619 | | 62,793 | -1.9% | | | 19,217 | | 18,487 | 4.0% | | | 42,402 | | 44,306 | -4.3% |
| | | | | | | | | | | | | | | | | | | |
Northeast Region | | | | | | | | | | | | | | | | | | | |
Boston, MA | 4,139 | | | 31,234 | | 31,072 | 0.5% | | | 9,166 | | 8,621 | 6.3% | | | 22,068 | | 22,451 | -1.7% |
New York, NY | 1,825 | | | 19,853 | | 17,900 | 10.9% | | | 9,893 | | 9,851 | 0.4% | | | 9,960 | | 8,049 | 23.7% |
| 5,964 | | | 51,087 | | 48,972 | 4.3% | | | 19,059 | | 18,472 | 3.2% | | | 32,028 | | 30,500 | 5.0% |
| | | | | | | | | | | | | | | | | | | |
Southeast Region | | | | | | | | | | | | | | | | | | | |
Tampa, FL | 2,908 | | | 13,465 | | 13,382 | 0.6% | | | 4,682 | | 4,745 | -1.3% | | | 8,783 | | 8,637 | 1.7% |
Orlando, FL | 2,500 | | | 10,354 | | 10,349 | 0.0% | | | 3,174 | | 3,203 | -0.9% | | | 7,180 | | 7,146 | 0.5% |
Nashville, TN | 2,260 | | | 9,182 | | 9,229 | -0.5% | | | 2,920 | | 2,705 | 7.9% | | | 6,262 | | 6,524 | -4.0% |
| 7,668 | | | 33,001 | | 32,960 | 0.1% | | | 10,776 | | 10,653 | 1.1% | | | 22,225 | | 22,307 | -0.4% |
| | | | | | | | | | | | | | | | | | | |
Southwest Region | | | | | | | | | | | | | | | | | | | |
Dallas, TX | 3,864 | | | 16,593 | | 16,608 | -0.1% | | | 6,382 | | 6,147 | 3.8% | | | 10,211 | | 10,461 | -2.4% |
Austin, TX | 1,272 | | | 5,693 | | 5,771 | -1.4% | | | 2,325 | | 2,411 | -3.6% | | | 3,368 | | 3,360 | 0.2% |
| 5,136 | | | 22,286 | | 22,379 | -0.4% | | | 8,707 | | 8,558 | 1.7% | | | 13,579 | | 13,821 | -1.8% |
| | | | | | | | | | | | | | | | | | | |
Other Markets | 2,460 | | | 14,749 | | 14,763 | -0.1% | | | 4,329 | | 4,485 | -3.5% | | | 10,420 | | 10,278 | 1.4% |
| | | | | | | | | | | | | | | | | | | |
Total (2)(3) | 45,403 | | $ | 277,820 | $ | 276,996 | 0.3% | | $ | 88,079 | $ | 86,808 | 1.5% | | $ | 189,741 | $ | 190,188 | -0.2% |
| (1) | See Attachment 16 for definitions and other terms. |
| (2) | 1Q21 and 4Q20 include reserves (reflected as a reduction to revenues) of approximately $4.5 million and $3.8 million or 1.6% and 1.4%, respectively, of billed residential revenue on our Same-Store Communities. The reserve is based on probability of collection. |
| (3) | With concessions reflected on a straight-line basis, Same-Store revenue and Same-Store NOI decreased quarter-over-quarter by -1.7% and -3.1%, respectively. See Attachment 16(C) for definitions and reconciliations. |
18
Attachment 8(E)
UDR, Inc.
Same-Store Operating Information By Major Market
March 31, 2021
(Unaudited) (1)
| | Effective Blended Lease Rate Growth | | Effective New Lease Rate Growth | | Effective Renewal Lease Rate Growth | | Annualized Turnover (2)(3) | |
| | 1Q 2021 | | 1Q 2021 | | 1Q 2021 | | 1Q 2021 | 1Q 2020 |
| | | | | | | | | |
West Region | | | | | | | | | |
Orange County, CA | | 0.9% | | -1.0% | | 3.9% | | 42.0% | 42.2% |
San Francisco, CA | | -6.4% | | -11.5% | | -1.7% | | 41.4% | 42.3% |
Seattle, WA | | -2.8% | | -5.2% | | -0.7% | | 51.0% | 48.2% |
Monterey Peninsula, CA | | 4.9% | | 7.3% | | 3.4% | | 30.1% | 39.2% |
Los Angeles, CA | | -5.4% | | -8.2% | | 0.6% | | 41.7% | 31.8% |
| | -1.3% | | -3.6% | | 1.3% | | 43.1% | 42.6% |
| | | | | | | | | |
Mid-Atlantic Region | | | | | | | | | |
Metropolitan DC | | -1.2% | | -5.7% | | 2.6% | | 35.1% | 28.5% |
Baltimore, MD | | 3.4% | | 3.2% | | 3.5% | | 32.5% | 36.6% |
Richmond, VA | | 6.4% | | 8.4% | | 5.5% | | 30.1% | 44.0% |
| | 0.4% | | -3.1% | | 3.2% | | 34.2% | 32.5% |
| | | | | | | | | |
Northeast Region | | | | | | | | | |
Boston, MA | | -0.7% | | -3.4% | | 1.4% | | 30.5% | 31.3% |
New York, NY | | -5.4% | | -8.3% | | -2.7% | | 28.7% | 21.3% |
| | -2.0% | | -4.7% | | 0.3% | | 29.9% | 29.0% |
| | | | | | | | | |
Southeast Region | | | | | | | | | |
Tampa, FL | | 5.3% | | 4.1% | | 6.5% | | 48.1% | 50.2% |
Orlando, FL | | 1.4% | | -1.3% | | 3.7% | | 43.0% | 43.8% |
Nashville, TN | | 2.0% | | -1.4% | | 5.2% | | 41.3% | 42.6% |
| | 3.3% | | 1.0% | | 5.3% | | 44.6% | 46.1% |
| | | | | | | | | |
Southwest Region | | | | | | | | | |
Dallas, TX | | 0.8% | | -2.4% | | 3.9% | | 48.1% | 40.8% |
Austin, TX | | 2.6% | | 0.4% | | 4.7% | | 44.0% | 43.2% |
| | 1.3% | | -1.6% | | 4.1% | | 47.1% | 41.4% |
| | | | | | | | | |
Other Markets | | 4.3% | | 2.4% | | 5.9% | | 37.9% | 38.4% |
| | | | | | | | | |
Total/Weighted Avg. | | 0.3% | | -2.4% | | 2.7% | | 39.4% | 38.3% |
| | | | | | | | | |
| | | | | | | | | |
1Q 2020 Weighted Avg. Lease Rate Growth (3) | | 2.8% | | 0.2% | | 5.3% | | | |
| | | | | | | | | |
| | | | | | | | | |
1Q 2021 Percentage of Total Repriced Homes | | | | 48.2% | | 51.8% | | | |
| (1) | See Attachment 16 for definitions and other terms. |
| (2) | 1Q21 same-store home count: 45,403. |
| (3) | 1Q20 same-store home count: 41,529. |
19
Attachment 9
UDR, Inc.
Development Summary
March 31, 2021
(Dollars in Thousands)
(Unaudited) (1)
Wholly-Owned | | | | | | | | | | | | | | | | | | |
| | | | | | | | | | | | Schedule | | | Percentage | |||
| | # of | Compl. | Cost to | Budgeted | Est. Cost | | | Initial | | | | | | ||||
Community | Location | Homes | Homes | Date | Cost | per Home | Start | Occ. | Compl. | | Leased | | Occupied | |||||
| | | | | | | | | | | | | | | | | | |
Projects Under Construction | | | | | | | | | | | | | | | | | | |
Cirrus | Denver, CO | | 292 | - | $ | 76,370 | $ | 97,500 | $ | 334 | | 3Q19 | 4Q21 | 1Q22 | | - | | - |
5421 at Dublin Station | Dublin, CA | | 220 | - | | 66,756 | | 117,000 | | 532 | | 4Q19 | 4Q21 | 2Q22 | | - | | - |
Village at Valley Forge | King of Prussia, PA | | 200 | - | | 25,208 | | 68,000 | | 340 | | 4Q20 | 2Q22 | 3Q22 | | - | | - |
Vitruvian West Phase 3 | Addison, TX | | 405 | - | | 21,908 | | 74,000 | | 183 | | 1Q21 | 2Q22 | 1Q23 | | - | | - |
440 Penn Street | Washington, DC | | 300 | - | | 52,958 | | 145,000 | | 483 | | 3Q20 | 1Q23 | 2Q23 | | - | | - |
| | | | | | | | | | | | | | | | | | |
Total Under Construction | | | 1,417 | - | $ | 243,200 | $ | 501,500 | $ | 354 | | | | | | | | |
| | | | | | | | | | | | | | | | | | |
Completed Projects, Non-Stabilized | | | | | | | | | | | | | | | | |||
Vitruvian West Phase 2 | Addison, TX | | 366 | 366 | $ | 59,280 | $ | 64,000 | $ | 175 | | 1Q19 | 2Q20 | 1Q21 | | 75.1% | | 72.1% |
| | | | | | | | | | | | | | | | | | |
Total Completed, Non-Stabilized | | | 366 | 366 | $ | 59,280 | $ | 64,000 | $ | 175 | | | | | | | | |
| | | | | | | | | | | | | | | | | | |
Total - Wholly Owned | | | 1,783 | 366 | $ | 302,480 | $ | 565,500 | $ | 317 | | | | | | | | |
| | | | | | | | | | | | | | | | | | |
| | | | | | | | | | | | | | | | | | |
NOI From Wholly-Owned Projects | | | | | | | UDR’s Capitalized Interest | | | | | | ||||||
| | 1Q 21 | | | | | | | | 1Q 21 | | | | | | | ||
| | | | | | | | | | | | | | | | | | |
Projects Under Construction | | $ | - | | | | | | | | $ | 1,666 | | | | | | |
Completed, Non-Stabilized | | | 385 | | | | | | | | | | | | | | | |
Total | | $ | 385 | | | | | | | | | | | | | | | |
| | | | | | | | | | | | | | | | | | |
| | | | | | | | | | | | | | | | | | |
| (1) | See Attachment 16 for definitions and other terms. |
20
Attachment 10
UDR, Inc.
Redevelopment Summary
March 31, 2021
(Dollars in Thousands)
(Unaudited) (1)
| | | | Sched. | | | | | | | | | Schedule | | Percentage | |||
| | | # of | Redev. | Compl. | Cost to | Budgeted | Est. Cost | | | | Same-Store | | | ||||
Community | Location | Homes | Homes | Homes | Date | Cost | per Home | | Start | Compl. | Quarter | | Leased | Occupied | ||||
| | | | | | | | | | | | | | | | | | |
Projects in Redevelopment | | | | | | | | | | | | | | | ||||
| | | | | | | | | | | | | | | | | | |
N/A | N/A | - | - | - | $ | - | $ | - | $ | - | | N/A | N/A | N/A | | - | - | |
Total | | - | - | - | $ | - | $ | - | $ | - | | | | | | | | |
| | | | | | | | | | | | | | | | | | |
| | | | | | | | | | | | | | | | | | |
| | | | | | | | | | | | | | | | | | |
| | | | | | | | | | | | | | | | | | |
| | | | | | | | | | | | | | | | | | |
| | | | | | | | | | | | | | | | | | |
| | | | Sched. | | | | | | | | | Schedule | | | | | |
| | | # of | Home | Compl. | Cost to | Budgeted | Est. Cost | | | | | | | | |||
Community | Location | Homes | Additions | Homes | Date | Cost (2) | per Home | | Start | Compl. | | | | | ||||
| | | | | | | | | | | | | | | | | | |
Other Projects | | | | | | | | | | | | | | | | | | |
| | | | | | | | | | | | | | | | | | |
Eight80 Newport Beach (3) | Newport Beach, CA | 30 | 30 | - | $ | 257 | $ | 12,100 | $ | 403 | | 1Q21 | 1Q22 | | | | | |
Total | | 30 | 30 | - | $ | 257 | $ | 12,100 | $ | 403 | | | | | | | | |
| | | | | | | | | | | | | | | | | | |
| | | | | | | | | | | | | | | | | | |
| | | | | | | | | | | | | | | | | | |
| | | | | | | | | | | | | | | | | | |
UDR's Capitalized Interest | | | | | | | | | | | | | | | | | | |
1Q 21 | | | | | | | | | | | | | | | | | | |
$ | 8 | | | | | | | | | | | | | | | | | |
| | | | | | | | | | | | | | | | | | |
| | | | | | | | | | | | | | | | | | |
| | | | | | | | | | | | | | | | | | |
| | | | | | | | | | | | | | | | | | |
| (1) | See Attachment 16 for definitions and other terms. |
| (2) | Represents UDR’s incremental capital invested in the projects. |
| (3) | Project consists of unit additions and renovation of related common area amenities. Existing units for this project remain in Same-Store. |
21
Attachment 11
UDR, Inc.
Land Summary
March 31, 2021
(Dollars in Thousands)
(Unaudited) (1)
| | | UDR Ownership | Real Estate | Pursuing | Design | Hold for Future | |
Parcel | Location | Interest | Cost Basis | Entitlements | Development | Development | ||
| | | | | | | | |
Vitruvian Park® | Addison, TX | 100% | $ | 44,331 | Complete | In Process | In Process | |
Total | | | $ | 44,331 | | | | |
| | | | | | | | |
| | | | | | | | |
| | | | | | | | |
UDR's Capitalized Interest | | | | | | | | |
| | | | | | | | |
1Q 21 | | | | | | | | |
$ | 448 | | | | | | | |
| (1) | See Attachment 16 for definitions and other terms. |
| (2) | Pursuing Entitlements: During this phase the Company is actively pursuing the necessary approvals for the rights to develop multifamily and/or mixed use communities. |
Design Development: During this phase the Company is actively working to complete architectural and engineering documents in preparation for the commencement of construction of multifamily and/or mixed uses communities.
Hold for Future Development: Entitled and/or unentitled land sites that the Company holds for future development.
22
Attachment 12(A)
UDR, Inc.
Unconsolidated Summary
March 31, 2021
(Dollars in Thousands)
(Unaudited) (1)
| | | | | | | | | | | | | | | | |
| | | | | | | Physical | | Total Rev. per | Net Operating Income | | |||||
| Own. | # of | | # of | | Occupancy | | Occ. Home | UDR's Share | Total | | |||||
Portfolio Characteristics | Interest | Comm. | | Homes | | 1Q 21 | | 1Q 21 | 1Q 21 | 1Q 21 (2) | | |||||
| | | | | | | | | | | | | | | | |
UDR / MetLife Operating communities | | 50% | | 13 | | 2,837 | | 94.1% | | $ | 3,433 | $ | 8,387 | $ | 16,693 | |
| | | | | | | | | | | | | | | | |
Total | | | | 13 | | 2,837 | | 94.1% | | $ | 3,433 | $ | 8,387 | $ | 16,693 | |
| | | | | | | | | | | | | | | | |
| | | | | | | | | | | | | | | | |
| | | | | | | | | | | | | ||||
| Gross Book Value | | | | | | Weighted | | | | | | | | | |
| of JV Real | Total Project | UDR's Equity | | Avg. Debt | | Debt | | | | | | ||||
Balance Sheet Characteristics | Estate Assets (3) | Debt (3) | Investment | | Interest Rate | | Maturities | | | | ||||||
| | | | | | | | | | | | | | | | |
UDR / MetLife Operating communities | $ | 1,699,568 | $ | 862,785 | $ | 295,341 | | 3.37% | | 2024-2031 | | | | | | |
| | | | | | | | | | | | | | | | |
UDR / West Coast Development JV | | - | | - | | 311 | | N/A | | N/A | | | | | | |
Total | $ | 1,699,568 | $ | 862,785 | $ | 295,652 | | 3.37% | | | | | | | | |
| | | | | | | | | | | | | | | | |
| | | | | | | | | | | | | | | | |
| | | | | | | | | | | | | ||||
| Joint Venture | | | | | | | | | | | | | | | |
| Same-Store | 1Q 21 vs. 1Q 20 Growth | | 1Q 21 vs. 4Q 20 Growth | | |||||||||||
Joint Venture Same-Store Growth | Communities (4) | Revenue | Expense | | NOI | | Revenue | Expense | NOI | | ||||||
UDR / MetLife | 13 | -18.0% | 0.4% | | -27.0% | | -3.1% | -0.5% | -4.8% | | ||||||
Total | 13 | -18.0% | 0.4% | | -27.0% | | -3.1% | -0.5% | -4.8% | | ||||||
| | | | | | | | | | | | | | | | |
| | | | | | | | | | | | | | | | |
| | | | | | | | | | | | | | | | |
| | | | | | | | | | | | | | | | |
| | | | | | | | | | | | | | | | |
| | | | | | | Income/(Loss) | | | | | | | | | |
| UDR Investment (6) | from Investments | | | | | | | | | ||||||
Other Unconsolidated Investments (5) | Commitment | Funded | Balance | 1Q 21 (7) | | | | | | | | | ||||
| | | | | | | | | | | | | | | | |
RETV I | $ | 18,000 | $ | 12,780 | $ | 22,641 | $ | 2,051 | | | | | | | | |
RETV II | | 16,500 | | 2,475 | | 2,184 | | (101) | | | | | | | | |
Total | $ | 34,500 | $ | 15,255 | $ | 24,825 | $ | 1,950 | | | | | | | | |
| | | | | | | | | | | | | | | | |
| (1) | See Attachment 16 for definitions and other terms. |
| (2) | Represents NOI at 100% for the period ended March 31, 2021. |
| (3) | Joint ventures and partnerships represented at 100%. Debt balances are presented net of deferred financing costs. |
| (4) | Joint Venture Same-Store growth is presented at UDR's ownership interest. |
| (5) | Other unconsolidated investments represent UDR's investment in real estate technology funds. |
| (6) | Investment commitment represents maximum equity and therefore excludes realized/unrealized gain/(loss). Investment funded represents cash funded towards the investment commitment. Investment balance includes amount funded plus realized/unrealized gain/(loss), less distributions received prior to the period end. |
| (7) | Income/(loss) from investments is added back/deducted from FFOA. |
23
Attachment 12(B)
UDR, Inc.
Developer Capital Program
March 31, 2021
(Dollars in Thousands)
(Unaudited) (1)
Developer Capital Program (2) | | | | | | | | | | | | | | |
| | | | | | | | | | | | | | |
| | | | | | | | | | Income from | | | ||
| | # of | UDR Investment | Return | Years to | | Investment | Upside | ||||||
Community | Location | Homes | Commitment (3) | Balance (3) | Rate | Maturity | | 1Q 2021 | Participation | |||||
| | | | | | | | | | | | | | |
Preferred Equity | | | | | | | | | | | | | | |
| | | | | | | | | | | | | | |
1532 Harrison | San Francisco, CA | 136 | $ | 24,645 | $ | 35,069 | 11.0% | 1.2 | | $ | 929 | - | ||
Junction | Santa Monica, CA | 66 | | 8,800 | | 12,049 | 12.0% | 1.3 | | | 350 | - | ||
1200 Broadway (4) | Nashville, TN | 313 | | 55,558 | | 70,709 | 8.0% | 1.5 | | | 1,372 | Variable | ||
1300 Fairmount | Philadelphia, PA | 471 | | 51,393 | | 60,799 | 8.5% | 2.4 | | | 1,255 | Variable | ||
Essex | Orlando, FL | 330 | | 12,886 | | 17,292 | 12.5% | 2.4 | | | 522 | - | ||
Modera Lake Merritt | Oakland, CA | 173 | | 27,250 | | 31,619 | 9.0% | 3.0 | | | 691 | Variable | ||
Thousand Oaks | Thousand Oaks, CA | 142 | | 20,059 | | 21,278 | 9.0% | 3.8 | | | 438 | Variable | ||
Vernon Boulevard | Queens, NY | 534 | | 40,000 | | 43,737 | 13.0% | 4.3 | | | 1,372 | Variable | ||
Makers Rise | Herndon, VA | 356 | | 30,208 | | 7,070 | 9.0% | 4.7 | | | 96 | Variable | ||
121 at Watters (5) | Allen, TX | 469 | | 19,846 | | 12 | 9.0% | 5.0 | | | 2 | Variable | ||
Total - Preferred Equity | | 2,990 | $ | 290,645 | $ | 299,634 | 9.8% | 2.9 | | $ | 7,027 | | | |
| | | | | | | | | | | | | | |
Secured Loans | | | | | | | | | | | | | | |
| | | | | | | | | | | | | | |
Alameda Point Block 11 (6) | Alameda, CA | 220 | $ | 20,000 | $ | 24,869 | 8.0% | 1.2 | | $ | - | - | ||
Brio (7) | Bellevue, WA | 259 | | 115,000 | | 122,764 | 4.8% | 1.6 | | | 1,427 | Purchase Option | ||
Total - Secured Loans | | 479 | $ | 135,000 | $ | 147,633 | 5.3% | 1.5 | | $ | 1,427 | | | |
| | | | | | | | | | | | | | |
Total - Developer Capital Program | | 3,469 | $ | 425,645 | $ | 447,267 | 8.3% | 2.5 | | $ | 8,454 | | | |
| | | | | | | | | | | | | | |
| | | | | | | | | | | | | | |
| | | | | | | | | | | | | | |
| | | | | | | | | | | | | | |
| (1) | See Attachment 16 for definitions and other terms. |
| (2) | UDR's investments are reflected as investment in and advances to unconsolidated joint ventures or notes receivable, net on the Consolidated Balance Sheets and income/(loss) from unconsolidated entities or interest and other income/(expense), net on the Consolidated Statements of Operations in accordance with GAAP. |
| (3) | Investment commitment represents maximum loan principal or equity and therefore excludes accrued return. Investment balance includes amount funded plus accrued return prior to the period end. |
| (4) | In April 2021, the balance was paid down by $12.5 million and the annual return rate increased to 12.25%. The annual return rate will revert to 8.0% in February 2022 if no prior capital event occurs. |
| (5) | At March 31, 2021, UDR's initial investment balance of $10.0 million is reflected as restricted cash on the Consolidated Balance Sheets. |
| (6) | In March 2018, UDR made a $20.0 million secured loan to a third-party developer to acquire a parcel of land upon which the developer planned to construct a 220 apartment home community. The loan is secured by the land parcel and related assets, and, as of the end of the quarter, was reflected in notes receivable, net on the Consolidated Balance Sheets and interest and other income/(expense), net on the Consolidated Statements of Operations in accordance with GAAP. The developer defaulted on the loan in September 2020. As a result of the default, in April 2021, UDR took title to the property pursuant to a deed in lieu of foreclosure. |
| (7) | In November 2019, UDR made a $115.0 million secured loan to a third-party developer to finance a 259 apartment home community that was completed in 2020. UDR also entered into a purchase option agreement at the time the loan was funded which gave UDR the option to acquire the community at a fixed price, which is currently projected to occur in 2021. The option was exercised in August 2020. The loan is secured by the community and is reflected in notes receivable, net on the Consolidated Balance Sheets and interest and other income/(expense), net on the Consolidated Statements of Operations in accordance with GAAP. |
24
Attachment 13
UDR, Inc.
Acquisitions, Dispositions and Developer Capital Program Investments Summary
March 31, 2021
(Dollars in Thousands)
(Unaudited) (1)
| | | | | | Post | | | | | | | | | |
| | | | | Prior | Transaction | | | | | | | | | |
Date of | | | | | Ownership | Ownership | | UDR Investment | Return | | # of | | |||
Investment | | Community | | Location | Interest | Interest | | Commitment | Rate | | Homes | | |||
| | | | | | | | | | | | | | | |
Developer Capital Program - Investment | | | | | | | | | | | | ||||
| | | | | | | | | | | | | | | |
Jan-21 | | Makers Rise | | Herndon, VA | N/A | N/A | | $ | 30,208 | | 9.0% | | 356 | | |
Mar-21 | | 121 at Watters | | Allen, TX | N/A | N/A | | | 19,846 | | 9.0% | | 469 | | |
| | | | | | | | $ | 50,054 | | 9.0% | | 825 | | |
| | | | | | | | | | | | | | | |
| | | | | | | | | | | | | | | |
| | | | | | | | | | | | | | | |
| | | | | | | | | | | | | | | |
| | | | | | Post | | | | | | | | | |
| | | | | Prior | Transaction | | | | | | | | | |
| | | | | Ownership | Ownership | | | | | # of | Price per | |||
Date of Purchase | | Community | | Location | Interest | Interest | | Price (2) | Debt (2) | | Homes | Home | |||
| | | | | | | | | | | | | | | |
Acquisitions - Wholly-Owned | | | | | | | | | | | | | | | |
| | | | | | | | | | | | | | | |
Jan-21 | | Union Place | | Franklin, MA | 0% | 100% | | $ | 77,400 | $ | 51,800 | | 300 | $ | 258 |
| | | | | | | | $ | 77,400 | $ | 51,800 | | 300 | $ | 258 |
| | | | | | | | | | | | | | | |
| | | | | | | | | | | | | | | |
| | | | | | | | | | | | | | | |
| | | | | | | | | | | | | | | |
| | | | | | Post | | | | | | | | | |
| | | | | Prior | Transaction | | | | | | | | | |
| | | | | Ownership | Ownership | | | | | # of | Price per | |||
Date of Sale | | Community | | Location | Interest | Interest | | Price (2) | Debt (2) | | Homes | Home | |||
| | | | | | | | | | | | | | | |
Dispositions - Wholly-Owned | | | | | | | | | | | | | | | |
| | | | | | | | | | | | | | | |
Feb-21 | | Parallel (3) | | Anaheim, CA | 100% | 0% | | $ | 156,000 | $ | - | | 386 | $ | 404 |
| | | | | | | | $ | 156,000 | $ | - | | 386 | $ | 404 |
| | | | | | | | | | | | | | | |
| | | | | | | | | | | | | | | |
Dispositions - Joint Ventures | | | | | | | | | | | | | | | |
| | | | | | | | | | | | | | | |
Jan-21 | | OLiVE DTLA (4) | | Los Angeles, CA | 47% | 0% | | $ | 121,000 | $ | 53,666 | | 293 | $ | 413 |
| | | | | | | | $ | 121,000 | $ | 53,666 | | 293 | $ | 413 |
| (1) | See Attachment 16 for definitions and other terms. |
| (2) | Price represents 100% of assets. Debt represents 100% of the asset's indebtedness. |
| (3) | UDR recorded a gain on sale of approximately $50.8 million during the three months ended March 31, 2021, which is included in gain/(loss) on sale of real estate owned. |
| (4) | UDR recorded a gain on sale of approximately $2.5 million during the three months ended March 31, 2021, which is included in income/(loss) from unconsolidated entites. |
25
Attachment 14
UDR, Inc.
Capital Expenditure and Repair and Maintenance Summary
March 31, 2021
(In thousands, except Cost per Home)
(Unaudited) (1)
| | | | Three Months | | Capex | ||
| | Estimated | | Ended | Cost | as a % | ||
Capital Expenditures for Consolidated Homes (2) | | Useful Life (yrs.) | | March 31, 2021 | per Home | of NOI | ||
| | | | | | | | |
Average number of homes (3) | | | | | 48,124 | | | |
| | | | | | | | |
Recurring Cap Ex | | | | | | | | |
Asset preservation | | | | | | | | |
Building interiors | | 5 - 20 | | $ | 4,529 | $ | 94 | |
Building exteriors | | 5 - 20 | | | 1,639 | | 34 | |
Landscaping and grounds | | 10 | | | 653 | | 14 | |
Total asset preservation | | | | | 6,821 | | 142 | |
| | | | | | | | |
Turnover related | | 5 | | | 2,933 | | 61 | |
| | | | | | | | |
Total Recurring Cap Ex | | | | | 9,754 | | 203 | 5% |
| | | | | | | | |
NOI Enhancing Cap Ex | | 5 - 20 | | | 9,093 | | 189 | |
| | | | | | | | |
Total Recurring and NOI Enhancing Cap Ex | | | | $ | 18,847 | $ | 392 | |
| | | | | | | | |
| | | | | | | | |
| | | | Three Months | | | | |
| | | | Ended | | Cost | | |
Repair and Maintenance for Consolidated Homes (Expensed) | | March 31, 2021 | | per Home | | |||
| | | | | | | | |
Average number of homes (3) | | | | | 48,124 | | | |
| | | | | | | | |
Contract services | | | | $ | 7,425 | $ | 154 | |
| | | | | | | | |
Turnover related expenses | | | | | 4,363 | | 91 | |
| | | | | | | | |
Other Repair and Maintenance | | | | | | | | |
Building interiors | | | | | 2,028 | | 42 | |
Building exteriors | | | | | 618 | | 13 | |
Landscaping and grounds | | | | | 1,087 | | 23 | |
Total Repair and Maintenance | | | | $ | 15,521 | $ | 323 | |
| (1) | See Attachment 16 for definitions and other terms. |
| (2) | Excludes redevelopment capital and initial capital expenditures on acquisitions. |
| (3) | Average number of homes is calculated based on the number of homes owned at the end of each month. |
26
Attachment 15
UDR, Inc.
2Q 2021 and Full-Year 2021 Guidance
March 31, 2021
(Unaudited) (1)
| | | | Full-Year 2021 Guidance | ||||
| | | | | | | | Change from |
Net Income, FFO, FFO as Adjusted and AFFO per Share and Unit Guidance | | 2Q 2021 | | Full-Year 2021 | | Prior Guidance | | Prior Midpoint |
| | | | | | | | |
Income/(loss) per weighted average common share, diluted | | $0.01 to $0.03 | | $0.04 to $0.13 | | $0.13 to $0.25 | | ($0.105) |
FFO per common share and unit, diluted | | $0.47 to $0.49 | | $1.76 to $1.85 | | $1.87 to $1.99 | | ($0.125) |
FFO as Adjusted per common share and unit, diluted | | $0.47 to $0.49 | | $1.91 to $2.00 | | $1.88 to $2.00 | | $0.015 |
Adjusted Funds from Operations ("AFFO") per common share and unit, diluted | | $0.42 to $0.44 | | $1.73 to $1.82 | | $1.70 to $1.82 | | $0.015 |
Annualized dividend per share and unit | | | | $1.45 | | $1.45 | | - |
| | | | | | | | |
| | | | | | | | |
| | | | | | | | Change from |
Same-Store Guidance | | | | Full-Year 2021 | | Prior Guidance | | Prior Midpoint |
| | | | | | | | |
Revenue growth / (decline) (Cash basis) | | | | (2.00%) - 0.50% | | (2.50%) - 0.50% | | 0.25% |
Revenue growth / (decline) (Straight-line basis) | | | | (4.00%) - (1.50%) | | (4.50%) - (1.50%) | | 0.25% |
Expense growth | | | | 1.00% - 3.00% | | 1.00% - 4.00% | | (0.50%) |
NOI growth / (decline) (Cash basis) | | | | (3.25%) - 0.00% | | (4.00%) - 0.00% | | 0.375% |
NOI growth / (decline) (Straight-line basis) | | | | (5.75%) - (2.50%) | | (6.50%) - (2.50%) | | 0.375% |
| | | | | | | | |
| | | | | | | | Change from |
Sources of Funds ($ in millions) | | | | Full-Year 2021 | | Prior Guidance | | Prior Midpoint |
| | | | | | | | |
AFFO less Dividends | | | | $90 to $120 | | $80 to $120 | | $5 |
Debt Issuances/Assumptions and LOC Draw/Paydown (2) | | | | $350 to $550 | | $63 to $163 | | $337 |
Dispositions (2) | | | | $187 | | $187 | | - |
Equity Issuance (Forward ATM settlement) | | | | $405 | | N/A | | $405 |
| | | | | | | | |
| | | | | | | | Change from |
Uses of Funds ($ in millions) | | | | Full-Year 2021 | | Prior Guidance | | Prior Midpoint |
| | | | | | | | |
Debt maturities inclusive of principal amortization (3) | | | | $380 | | $40 | | $340 |
Development spending and land acquisitions | | | | $150 to $225 | | $150 to $250 | | ($12.5) |
Redevelopment and other non-recurring | | | | $30 to $50 | | $20 to $40 | | $10 |
Developer Capital Program, net | | | | $45 to $55 | | $25 to $35 | | $20 |
Acquisitions | | | | $360 to $500 | | $30 to $65 | | $382.5 |
NOI enhancing capital expenditures inclusive of Kitchen and Bath | | | | $40 to $45 | | $40 to $45 | | - |
| | | | | | | | |
| | | | | | | | |
| | | | | | | | Change from |
Other Additions/(Deductions) ($ in millions except per home amounts) | | | | Full-Year 2021 | | Prior Guidance | | Prior Midpoint |
| | | | | | | | |
Consolidated interest expense, net of capitalized interest and adjustments for FFO as Adjusted | | | | ($140) to ($146) | | ($140) to ($150) | | ($2) |
Capitalized interest expense (4) | | | | $8 to $10 | | $8 to $12 | | ($1) |
General and administrative expense | | | | ($48) to ($55) | | ($45) to ($55) | | $1.5 |
Recurring capital expenditures per home | | | | $1,200 | | $1,200 | | - |
| | | | | | | | |
| (1) | See Attachment 16 for definitions and other terms. |
| (2) | Prior Guidance has been adjusted to reflect the breakout of funds from "Dispositions" of $187 million which had previously been included in the "Debt Issuances, Sales Proceeds, and LOC Draw/Paydown" guidance line in the prior quarter. |
| (3) | Excludes short-term maturities related to the Company's unsecured commercial paper program. Includes the prepayment costs and net proceeds associated with the Columbus Square refinance which occurred in January 2021 and the make-whole premium associated with the early retirement of the $300M MTNs set to mature in 2025 which occurred in March of 2021. |
| (4) | Excludes capitalized interest on joint venture and partnership level debt. |
27

Attachment 16(A)
UDR, Inc.
Definitions and Reconciliations
March 31, 2021
(Unaudited)
Acquired Communities: The Company defines Acquired Communities as those communities acquired by the Company, other than development and redevelopment activity, that did not achieve stabilization as of the most recent quarter.
Adjusted Funds from Operations ("AFFO") attributable to common stockholders and unitholders: The Company defines AFFO as FFO as Adjusted attributable to common stockholders and unitholders less recurring capital expenditures on consolidated communities that are necessary to help preserve the value of and maintain functionality at our communities.
Management considers AFFO a useful supplemental performance metric for investors as it is more indicative of the Company's operational performance than FFO or FFO as Adjusted. AFFO is not intended to represent cash flow or liquidity for the period, and is only intended to provide an additional measure of our operating performance. The Company believes that net income/(loss) attributable to common stockholders is the most directly comparable GAAP financial measure to AFFO. Management believes that AFFO is a widely recognized measure of the operations of REITs, and presenting AFFO will enable investors to assess our performance in comparison to other REITs. However, other REITs may use different methodologies for calculating AFFO and, accordingly, our AFFO may not always be comparable to AFFO calculated by other REITs. AFFO should not be considered as an alternative to net income/(loss) (determined in accordance with GAAP) as an indication of financial performance, or as an alternative to cash flows from operating activities (determined in accordance with GAAP) as a measure of our liquidity, nor is it indicative of funds available to fund our cash needs, including our ability to make distributions. A reconciliation from net income/(loss) attributable to common stockholders to AFFO is provided on Attachment 2.
Consolidated Fixed Charge Coverage Ratio - adjusted for non-recurring items: The Company defines Consolidated Fixed Charge Coverage Ratio - adjusted for non-recurring items as Consolidated Interest Coverage Ratio - adjusted for non-recurring items divided by total consolidated interest, excluding the impact of costs associated with debt extinguishment, plus preferred dividends.
Management considers Consolidated Fixed Charge Coverage Ratio - adjusted for non-recurring items a useful metric for investors as it provides ratings agencies, investors and lending partners with a widely-used measure of the Company’s ability to service its consolidated debt obligations as well as compare leverage against that of its peer REITs. A reconciliation of the components that comprise Consolidated Fixed Charge Coverage Ratio - adjusted for non-recurring items is provided on Attachment 4(C) of the Company's quarterly supplemental disclosure.
Consolidated Interest Coverage Ratio - adjusted for non-recurring items: The Company defines Consolidated Interest Coverage Ratio - adjusted for non-recurring items as Consolidated EBITDAre – adjusted for non-recurring items divided by total consolidated interest, excluding the impact of costs associated with debt extinguishment.
Management considers Consolidated Interest Coverage Ratio - adjusted for non-recurring items a useful metric for investors as it provides ratings agencies, investors and lending partners with a widely-used measure of the Company’s ability to service its consolidated debt obligations as well as compare leverage against that of its peer REITs. A reconciliation of the components that comprise Consolidated Interest Coverage Ratio - adjusted for non-recurring items is provided on Attachment 4(C) of the Company's quarterly supplemental disclosure.
Consolidated Net Debt-to-EBITDAre - adjusted for non-recurring items: The Company defines Consolidated Net Debt-to-EBITDAre - adjusted for non-recurring items as total consolidated debt net of cash and cash equivalents divided by annualized Consolidated EBITDAre - adjusted for non-recurring items. Consolidated EBITDAre - adjusted for non-recurring items is defined as EBITDAre excluding the impact of income/(loss) from unconsolidated entities, adjustments to reflect the Company’s share of EBITDAre of unconsolidated joint ventures and other non-recurring items including, but not limited to casualty-related charges/(recoveries), net of wholly owned communities.
Management considers Consolidated Net Debt-to-EBITDAre - adjusted for non-recurring items a useful metric for investors as it provides ratings agencies, investors and lending partners with a widely-used measure of the Company’s ability to service its consolidated debt obligations as well as compare leverage against that of its peer REITs. A reconciliation between net income/(loss) and Consolidated EBITDAre - adjusted for non-recurring items is provided on Attachment 4(C) of the Company's quarterly supplemental disclosure.
Controllable Expenses: The Company refers to property operating and maintenance expenses as Controllable Expenses.
Controllable Operating Margin: The Company defines Controllable Operating Margin as (i) rental income less Controllable Expenses (ii) divided by rental income. Management considers Controllable Operating Margin a useful metric as it provides investors with an indicator of the Company’s ability to limit the growth of expenses that are within the control of the Company.
Development Communities: The Company defines Development Communities as those communities recently developed or under development by the Company, that are currently majority owned by the Company and have not achieved stabilization as of the most recent quarter.
Earnings Before Interest, Taxes, Depreciation and Amortization for Real Estate (EBITDAre): The Company defines EBITDAre as net income/(loss) (computed in accordance GAAP), plus interest expense, including costs associated with debt extinguishment, plus real estate depreciation and amortization, plus other depreciation and amortization, plus (minus) income tax provision/(benefit), net, (minus) plus net gain/(loss) on the sale of depreciable real estate owned, plus impairment write-downs of depreciable real estate, plus the adjustments to reflect the Company’s share of EBITDAre of unconsolidated joint ventures. The Company computes EBITDAre in accordance with standards established by the National Association of Real Estate Investment Trusts, or Nareit, which may not be comparable to EBITDAre reported by other REITs that do not compute EBITDAre in accordance with the Nareit definition, or that interpret the Nareit definition differently than the Company does. The White Paper on EBITDAre was approved by the Board of Governors of Nareit in September 2017.
Management considers EBITDAre a useful metric for investors as it provides an additional indicator of the Company’s ability to incur and service debt, and will enable investors to assess our performance against that of its peer REITs. EBITDAre should be considered along with, but not as an alternative to, net income and cash flow as a measure of the Company’s activities in accordance with GAAP. EBITDAre does not represent cash generated from operating activities in accordance with GAAP and is not necessarily indicative of funds available to fund our cash needs. A reconciliation between net income/(loss) and EBITDAre is provided on Attachment 4(C) of the Company's quarterly supplemental disclosure.
Effective Blended Lease Rate Growth: The Company defines Effective Blended Lease Rate Growth as the combined proportional growth as a result of Effective New Lease Rate Growth and Effective Renewal Lease Rate Growth. Management considers Effective Blended Lease Rate Growth a useful metric for investors as it assesses combined proportional market-level, new and in-place demand trends.
Effective New Lease Rate Growth: The Company defines Effective New Lease Rate Growth as the increase in gross potential rent realized less concessions for the new lease term (current effective rent) versus prior resident effective rent for the prior lease term on new leases commenced during the current quarter.
Management considers Effective New Lease Rate Growth a useful metric for investors as it assesses market-level new demand trends.
Effective Renewal Lease Rate Growth: The Company defines Effective Renewal Lease Rate Growth as the increase in gross potential rent realized less concessions for the new lease term (current effective rent) versus prior effective rent for the prior lease term on renewed leases commenced during the current quarter.
Management considers Effective Renewal Lease Rate Growth a useful metric for investors as it assesses market-level, in-place demand trends.
Estimated Quarter of Completion: The Company defines Estimated Quarter of Completion of a development or redevelopment project as the date on which construction is expected to be completed, but it does not represent the date of stabilization.
28
Attachment 16(B)
UDR, Inc.
Definitions and Reconciliations
March 31, 2021
(Unaudited)
Funds from Operations as Adjusted ("FFO as Adjusted") attributable to common stockholders and unitholders: The Company defines FFO as Adjusted attributable to common stockholders and unitholders as FFO excluding the impact of other non-comparable items including, but not limited to, acquisition-related costs, prepayment costs/benefits associated with early debt retirement, impairment write-downs or gains and losses on sales of real estate or other assets incidental to the main business of the Company and income taxes directly associated with those gains and losses, casualty-related expenses and recoveries, severance costs and legal and other costs.
Management believes that FFO as Adjusted is useful supplemental information regarding our operating performance as it provides a consistent comparison of our operating performance across time periods and allows investors to more easily compare our operating results with other REITs. FFO as Adjusted is not intended to represent cash flow or liquidity for the period, and is only intended to provide an additional measure of our operating performance. The Company believes that net income/(loss) attributable to common stockholders is the most directly comparable GAAP financial measure to FFO as Adjusted. However, other REITs may use different methodologies for calculating FFO as Adjusted or similar FFO measures and, accordingly, our FFO as Adjusted may not always be comparable to FFO as Adjusted or similar FFO measures calculated by other REITs. FFO as Adjusted should not be considered as an alternative to net income (determined in accordance with GAAP) as an indication of financial performance, or as an alternative to cash flows from operating activities (determined in accordance with GAAP) as a measure of our liquidity. A reconciliation from net income attributable to common stockholders to FFO as Adjusted is provided on Attachment 2.
Funds from Operations ("FFO") attributable to common stockholders and unitholders: The Company defines FFO attributable to common stockholders and unitholders as net income/(loss) attributable to common stockholders (computed in accordance with GAAP), excluding impairment write-downs of depreciable real estate related to the main business of the Company or of investments in non-consolidated investees that are directly attributable to decreases in the fair value of depreciable real estate held by the investee, gains and losses from sales of depreciable real estate related to the main business of the Company and income taxes directly associated with those gains and losses, plus real estate depreciation and amortization, and after adjustments for noncontrolling interests, and the Company’s share of unconsolidated partnerships and joint ventures. This definition conforms with the National Association of Real Estate Investment Trust's definition issued in April 2002 and restated in November 2018. In the computation of diluted FFO, if OP Units, DownREIT Units, unvested restricted stock, unvested LTIP Units, stock options, and the shares of Series E Cumulative Convertible Preferred Stock are dilutive, they are included in the diluted share count.
Management considers FFO a useful metric for investors as the Company uses FFO in evaluating property acquisitions and its operating performance and believes that FFO should be considered along with, but not as an alternative to, net income and cash flow as a measure of the Company's activities in accordance with GAAP. FFO does not represent cash generated from operating activities in accordance with GAAP and is not necessarily indicative of funds available to fund our cash needs. A reconciliation from net income/(loss) attributable to common stockholders to FFO is provided on Attachment 2.
Held For Disposition Communities: The Company defines Held for Disposition Communities as those communities that were held for sale as of the end of the most recent quarter.
Joint Venture Reconciliation at UDR's weighted average ownership interest:
In thousands | | | | | | | 1Q 2021 | | | | ||
Income/(loss) from unconsolidated entities | | | | | | | | $ | 4,922 | | | |
Management fee | | | | | | | | | 470 | | | |
Financing fee | | | | | | | | | 287 | | | |
Interest expense | | | | | | | | | 4,431 | | | |
Debt extinguishment and other associated costs | | | | | | | | | 1,395 | | | |
Depreciation | | | | | | | | | 8,205 | | | |
General and administrative | | | | | | | | | 64 | | | |
Developer Capital Program (excludes Alameda Point Block 11 and Brio) | | | | | | | | | (7,027) | | | |
Other (income)/expense | | | | | | | | | 137 | | | |
Realized/unrealized (gain)/loss on unconsolidated real estate technology investments | | | | | | | | | (1,950) | | | |
NOI related to sold properties | | | | | | | | | (87) | | | |
(Gain)/loss on sales | | | | | | | | | (2,460) | | | |
Total Joint Venture NOI at UDR's Ownership Interest | | | | | | $ | 8,387 | | | | ||
Leasing Traffic: The Company defines Leasing Traffic as average daily leads to lease a home for the period indicated.
Net Operating Income (“NOI”): The Company defines NOI as rental income less direct property rental expenses. Rental income represents gross market rent and other revenues less adjustments for concessions, vacancy loss and bad debt. Rental expenses include real estate taxes, insurance, personnel, utilities, repairs and maintenance, administrative and marketing. Excluded from NOI is property management expense, which is calculated as 3.0% of property revenue, and land rent. Property management expense covers costs directly related to consolidated property operations, inclusive of corporate management, regional supervision, accounting and other costs.
Management considers NOI a useful metric for investors as it is a more meaningful representation of a community’s continuing operating performance than net income as it is prior to corporate-level expense allocations, general and administrative costs, capital structure and depreciation and amortization and is a widely used input, along with capitalization rates, in the determination of real estate valuations. A reconciliation from net income/(loss) attributable to UDR, Inc. to NOI is provided below.
In thousands | 1Q 2021 | 4Q 2020 | 3Q 2020 | | 2Q 2020 | 1Q 2020 | | |||||
Net income/(loss) attributable to UDR, Inc. | $ | 3,104 | $ | 26,532 | $ | (25,258) | | $ | 57,771 | $ | 5,221 | |
Property management | | 8,995 | | 8,659 | | 8,879 | | | 8,797 | | 9,203 | |
Other operating expenses | | 4,435 | | 6,153 | | 5,543 | | | 6,100 | | 4,966 | |
Real estate depreciation and amortization | | 144,088 | | 146,135 | | 151,949 | | | 155,056 | | 155,476 | |
Interest expense | | 78,156 | | 62,524 | | 62,268 | | | 38,597 | | 39,317 | |
Casualty-related charges/(recoveries), net | | 5,577 | | 778 | | - | | | 102 | | 1,251 | |
General and administrative | | 12,736 | | 11,978 | | 11,958 | | | 10,971 | | 14,978 | |
Tax provision/(benefit), net | | 619 | | 668 | | 187 | | | 1,526 | | 164 | |
(Income)/loss from unconsolidated entities | | (4,922) | | (4,516) | | (2,940) | | | (8,021) | | (3,367) | |
Interest income and other (income)/expense, net | | (2,057) | | 1,030 | | (2,183) | | | (2,421) | | (2,700) | |
Joint venture management and other fees | | (1,615) | | (1,208) | | (1,199) | | | (1,274) | | (1,388) | |
Other depreciation and amortization | | 2,601 | | 2,074 | | 3,887 | | | 2,027 | | 2,025 | |
(Gain)/loss on sale of real estate owned | | (50,829) | | (57,974) | | - | | | (61,303) | | - | |
Net income/(loss) attributable to noncontrolling interests | | 170 | | 2,019 | | (1,959) | | | 4,325 | | 319 | |
Total consolidated NOI | $ | 201,058 | $ | 204,852 | $ | 211,132 | | $ | 212,253 | $ | 225,465 | |
29
Attachment 16(C)
UDR, Inc.
Definitions and Reconciliations
March 31, 2021
(Unaudited)
NOI Enhancing Capital Expenditures ("Cap Ex"): The Company defines NOI Enhancing Capital Expenditures as expenditures that result in increased income generation or decreased expense growth over time.
Management considers NOI Enhancing Capital Expenditures a useful metric for investors as it quantifies the amount of capital expenditures that are expected to grow, not just maintain, revenues or to decrease expenses.
Non-Mature Communities: The Company defines Non-Mature Communities as those communities that have not met the criteria to be included in same-store communities.
Non-Residential / Other: The Company defines Non-Residential / Other as non-apartment components of mixed-use properties, land held, properties being prepared for redevelopment and properties where a material change in home count has occurred.
Other Markets: The Company defines Other Markets as the accumulation of individual markets where it operates less than 1,000 Same-Store homes. Management considers Other Markets a useful metric as the operating results for the individual markets are not representative of the fundamentals for those markets as a whole.
Physical Occupancy: The Company defines Physical Occupancy as the number of occupied homes divided by the total homes available at a community.
QTD Same-Store Communities: The Company defines QTD Same-Store Communities as those communities Stabilized for five full consecutive quarters. These communities were owned and had stabilized operating expenses as of the beginning of the quarter in the prior year, were not in process of any substantial redevelopment activities, and were not held for disposition.
Recurring Capital Expenditures: The Company defines Recurring Capital Expenditures as expenditures that are necessary to help preserve the value of and maintain functionality at its communities.
Redevelopment Communities: The Company generally defines Redevelopment Communities as those communities where substantial redevelopment is in progress that is expected to have a material impact on the community's operations, including occupancy levels and future rental rates.
Redevelopment Projected Weighted Average Return on Incremental Capital Invested: The projected weighted average return on incremental capital invested for redevelopment projects is NOI as set forth in the definition of Stabilization Period for Redevelopment Yield, less Recurring Capital Expenditures, minus the project’s annualized NOI prior to commencing the redevelopment, less Recurring Capital Expenditures, divided by the total cost of the project.
Same-Store Revenue with Concessions on a Cash Basis: Same-Store Revenue with Concessions on a Cash Basis is considered by the Company to be a supplemental measure to rental income on a straight-line basis which allows investors to evaluate the impact of both current and historical concessions and to more readily enable comparisons to revenue as reported by its peer REITs. In addition, Same-Store Revenue with Concessions on a Cash Basis allows an investor to understand the historical trends in cash concessions.
A reconciliation between Same-Store Revenue with Concessions on a Cash Basis to Same-Store Revenue on a straight-line basis (inclusive of the impact to Same-Store NOI) is provided below:
| 1Q 21 | | 1Q 20 | | 1Q 21 | | 4Q 20 | ||||
Revenue (Cash basis) | $ | 277,820 | | $ | 296,882 | | $ | 277,820 | | $ | 276,996 |
Concessions granted/amortized, net | | (1,407) | | | (568) | | | (1,407) | | | 4,196 |
Revenue (Straight-line basis) | $ | 276,413 | | $ | 296,314 | | $ | 276,413 | | $ | 281,192 |
| | | | | | | | | | | |
% change - Same-Store Revenue with Concessions on a Cash basis: | | -6.4% | | | | | | 0.3% | | | |
% change - Same-Store Revenue on a Straight-line basis: | | -6.7% | | | | | | -1.7% | | | |
| | | | | | | | | | | |
% change - Same-Store NOI with Same-Store Revenue with Concessions on a Cash basis: | | -10.4% | | | | | | -0.2% | | | |
% change - Same-Store NOI with Same-Store Revenue on a Straight-line basis: | | -10.8% | | | | | | -3.1% | | | |
Sold Communities: The Company defines Sold Communities as those communities that were disposed of prior to the end of the most recent quarter.
Stabilization/Stabilized: The Company defines Stabilization/Stabilized as when a community’s occupancy reaches 90% or above for at least three consecutive months.
Stabilized, Non-Mature Communities: The Company defines Stabilized, Non-Mature Communities as those communities that have reached Stabilization but are not yet in the same-store portfolio.
Stabilization Period for Development Yield: The Company defines the Stabilization Period for Development Yield as the forward twelve month NOI, excluding any remaining lease-up concessions outstanding, commencing one year following the delivery of the final home of the project.
Stabilization Period for Redevelopment Yield: The Company defines the stabilization period for a redevelopment property yield for purposes of computing the Redevelopment Projected Weighted Average Return on Incremental Capital Invested, as the forward twelve month NOI, excluding any remaining lease-up concessions outstanding, commencing one year following the delivery of the final home of a project.
Stabilized Yield on Developments: The Company calculates expected stabilized yields on development as follows: projected stabilized NOI less management fees divided by budgeted construction costs on a project-specific basis. Projected stabilized NOI for development projects, calculated in accordance with the NOI reconciliation provided on Attachment 16(B), is set forth in the definition of Stabilization Period for Development Yield. Given the differing completion dates and years for which NOI is being projected for these communities as well as the complexities associated with estimating other expenses upon completion such as corporate overhead allocation, general and administrative costs and capital structure, a reconciliation to GAAP measures is not meaningful. Projected NOI for these projects is neither provided, nor is representative of Management’s expectations for the Company’s overall financial performance or cash flow growth and there can be no assurances that forecast NOI growth implied in the estimated construction yield of any project will be achieved.
Management considers estimated Stabilized Yield on Developments as a useful metric for investors as it helps provide context to the expected effects that development projects will have on the Company’s future performance once stabilized.
30
Attachment 16(D)
UDR, Inc.
Definitions and Reconciliations
March 31, 2021
(Unaudited)
Total Revenue per Occupied Home: The Company defines Total Revenue per Occupied Home as rental and other revenues, calculated in accordance with GAAP, divided by the product of occupancy and the number of apartment homes.
Management considers Total Revenue per Occupied Home a useful metric for investors as it serves as a proxy for portfolio quality, both geographic and physical.
TRS: The Company’s taxable REIT subsidiary (“TRS”) focuses on making investments and providing services that are otherwise not allowed to be made or provided by a REIT.
Visits: The Company defines Visits as the summation of tours taken by current and prospective residents, whether in-person (where allowed) or by virtual means, for the period indicated.
YTD Same-Store Communities: The Company defines YTD Same-Store Communities as those communities Stabilized for two full consecutive calendar years. These communities were owned and had stabilized operating expenses as of the beginning of the prior year, were not in process of any substantial redevelopment activities, and were not held for disposition.
31
Attachment 16(E)
UDR, Inc.
Definitions and Reconciliations
March 31, 2021
(Unaudited)
All guidance is based on current expectations of future economic conditions and the judgment of the Company's management team. The following reconciles from GAAP Net income/(loss) per share for full-year 2021 and second quarter of 2021 to forecasted FFO, FFO as Adjusted and AFFO per share and unit:
| | | | | Full-Year 2021 | | | ||||
| | | | | Low | | High | | | ||
| | | | | | | | | | | |
Forecasted net income per diluted share | | | | | $ | 0.04 | | $ | 0.13 | | |
Conversion from GAAP share count | | | | | | (0.02) | | | (0.02) | | |
Net gain on the sale of depreciable real estate owned | | | | | | (0.16) | | | (0.16) | | |
Depreciation | | | | | | 1.88 | | | 1.88 | | |
Noncontrolling interests | | | | | | 0.01 | | | 0.01 | | |
Preferred dividends | | | | | | 0.01 | | | 0.01 | | |
Forecasted FFO per diluted share and unit | | | | | $ | 1.76 | | $ | 1.85 | | |
Legal and other costs | | | | | | - | | | - | | |
Debt extinguishment and other associated costs | | | | | | 0.14 | | | 0.14 | | |
Casualty-related charges/(recoveries) | | | | | | 0.02 | | | 0.02 | | |
Realized/unrealized gain on unconsolidated real estate technology investments, net of tax | | | | | | (0.01) | | | (0.01) | | |
Forecasted FFO as Adjusted per diluted share and unit | | | | | $ | 1.91 | | $ | 2.00 | | |
Recurring capital expenditures | | | | | | (0.18) | | | (0.18) | | |
Forecasted AFFO per diluted share and unit | | | | | $ | 1.73 | | $ | 1.82 | | |
| | | | | | | | | | | |
| | | | | | | | | | | |
| | | | | 2Q 2021 | | | ||||
| | | | | Low | | High | | | ||
| | | | | | | | | | | |
Forecasted net income per diluted share | | | | | $ | 0.01 | | $ | 0.03 | | |
Conversion from GAAP share count | | | | | | (0.01) | | | (0.01) | | |
Depreciation | | | | | | 0.47 | | | 0.47 | | |
Noncontrolling interests | | | | | | - | | | - | | |
Preferred dividends | | | | | | - | | | - | | |
Forecasted FFO per diluted share and unit | | | | | $ | 0.47 | | $ | 0.49 | | |
Legal and other costs | | | | | | - | | | - | | |
Debt extinguishment and other associated costs | | | | | | - | | | - | | |
Casualty-related charges/(recoveries) | | | | | | - | | | - | | |
Realized/unrealized gain on unconsolidated real estate technology investments, net of tax | | | | | | - | | | - | | |
Forecasted FFO as Adjusted per diluted share and unit | | | | | $ | 0.47 | | $ | 0.49 | | |
Recurring capital expenditures | | | | | | (0.05) | | | (0.05) | | |
Forecasted AFFO per diluted share and unit | | | | | $ | 0.42 | | $ | 0.44 | | |
32