Attached files
| file | filename |
|---|---|
| EX-99.1 - EX-99.1 - NCR CORP | exhibit991-q12021earningsr.htm |
| 8-K - 8-K - NCR CORP | ncr-20210427.htm |

1 Q1 2021 EARNINGS CONFERENCE CALL MICHAEL HAYFORD, PRESIDENT & CEO OWEN SULLIVAN, COO TIM OLIVER, CFO April 27, 2021

2 FORWARD-LOOKING STATEMENTS. Comments made during this conference call and in these materials contain “forward-looking statements” within the meaning of Section 27A of the Securities Act of 1933, as amended, and Section 21E of the Securities Exchange Act of 1934, as amended, pursuant to the safe harbor provisions of the Private Securities Litigation Reform Act of 1995 (the “Act”). Forward-looking statements use words such as “expect,” “anticipate,” “outlook,” “intend,” “plan,” “believe,” “will,” “should,” “would,” “potential,” “proposed,” “objective,” “could,” “may,” and words of similar meaning, as well as other words or expressions referencing future events, conditions or circumstances. We intend these forward-looking statements to be covered by the safe harbor provisions for forward-looking statements contained in the Act. Statements that describe or relate to NCR’s plans, goals, intentions, strategies, or financial outlook, and statements that do not relate to historical or current fact, are examples of forward-looking statements. Examples of forward-looking statements in these materials include, without limitation, statements regarding NCR’s momentum and acceleration of our NCR-as-a-Service and 80/60/20 strategy, statements regarding our financial position, expectations regarding the closing of the proposed Cardtronics acquisition, expectations regarding growth and long-term value creation for our stockholders, expectations regarding execution of our 80/60/20 strategy and continued growth, statements regarding our plan to continue investing in strategic platforms, statements regarding our plans to manage our business through the COVID-19 pandemic and the health and safety of our employees and helping our customers, the expected impact of the COVID-19 pandemic on our business, segments and revenues, statements regarding our second quarter 2021 financial outlook including revenue, adjusted EBITDA margin and free cash flow, expectations regarding increasing revenue and cash flow linearity, and expectations regarding cost discipline, operating leverage, margin expansion and return on investment opportunities. Forward-looking statements are based on our current beliefs, expectations and assumptions, which may not prove to be accurate, and involve a number of known and unknown risks and uncertainties, many of which are out of NCR’s control. Forward-looking statements are not guarantees of future performance, and there are a number of important factors that could cause actual outcomes and results to differ materially from the results contemplated by such forward- looking statements, including those factors listed in Item 1A “Risk Factors” of NCR’s Annual Report on Form 10-K filed with the U.S. Securities and Exchange Commission (SEC) on February 26, 2021 and those factors detailed from time to time in NCR’s other SEC reports including quarterly reports on Form 10-Q and current reports on Form 8-K. These materials are dated April 27, 2021, and NCR does not undertake any obligation to publicly update or revise any forward-looking statements, whether as a result of new information, future events or otherwise, except as otherwise required by law. NOTES TO INVESTORS
3 NON-GAAP MEASURES. While NCR reports its results in accordance with generally accepted accounting principles in the United States, or GAAP, comments made during this conference call and in these materials will include or make reference to certain "non-GAAP" measures, including: selected measures, such as period-over-period revenue growth; gross margin rate (non-GAAP); diluted earnings per share (non-GAAP); free cash flow; gross margin (non-GAAP); net debt; adjusted EBITDA; the ratio of net debt to adjusted EBITDA; operating income (non-GAAP); interest and other expense (non-GAAP); income tax expense (non-GAAP); effective income tax rate (non-GAAP); and net income (non-GAAP). These measures are included to provide additional useful information regarding NCR's financial results, and are not a substitute for their comparable GAAP measures. Explanations of these non-GAAP measures, and reconciliations of these non-GAAP measures to their directly comparable GAAP measures, are included in the accompanying "Supplementary Materials" and are available on the Investor Relations page of NCR's website at www.ncr.com. Descriptions of many of these non-GAAP measures are also included in NCR's SEC reports. USE OF CERTAIN TERMS. As used in these materials: (i) the term "recurring revenue" includes all revenue streams from contracts where there is a predictable revenue pattern that will occur at regular intervals with a relatively high degree of certainty. This includes hardware and software maintenance revenue, cloud revenue, payment processing revenue, and certain professional services arrangements, as well as term-based software license arrangements that include customer termination rights. These presentation materials and the associated remarks made during this conference call are integrally related and are intended to be presented and understood together. NOTES TO INVESTORS

4 Anticipate mid-year close with CARDTRONICS, subject to regulatory and shareholder approval OVERVIEW FREE CASH FLOW of $98M in Q1 RECURRING REVENUE up 9% Y/Y in Q1 Adjusted EBITDA MARGIN EXPANSION 420 bps Y/Y to 16.7% Completed FINANCING for pending Cardtronics transaction

5 STRATEGIC UPDATE • Successful progress on 80/60/20 goals • Banking – Digital banking momentum and accelerating shift to recurring software revenue • Retail - Gaining traction on NCR EmeraldTM and self-checkout solutions • Hospitality - Momentum in AlohaTM Essentials continues • Accelerating NCR-as-a-Service transformation • Continue to invest in strategic platforms

6 Adjusted EBITDA up 37% and margin rate up 420 bps y/y due to higher revenue and expense reduction Non-GAAP EPS up y/y due to higher operating earnings Driving more linear free cash flow production Total Revenue/Recurring Adjusted EBITDA Non-GAAP Diluted EPS Free Cash Flow Revenue up 3% y/y due to an increase in Retail and Hospitality; Recurring revenue up 9% y/y Q1 2021 FINANCIAL RESULTS Q1 20 Q2 20 Q3 20 Q4 20 Q1 21 $0 $900 $1,800 Q1 20 Q2 20 Q3 20 Q4 20 Q1 21 $0 $150 $300 Q1 20 Q2 20 Q3 20 Q4 20 Q1 21 $0.00 $0.30 $0.60 Q1 20 Q2 20 Q3 20 Q4 20 Q1 21 $0 $100 $200 $98 $0.51 $1,544 $258 $ in millions, except for EPS $1,503 $188 $0.31 $(20) 16.7% 12.5% $1,631 $258 $0.59 $158 15.8% $802 $874 $874
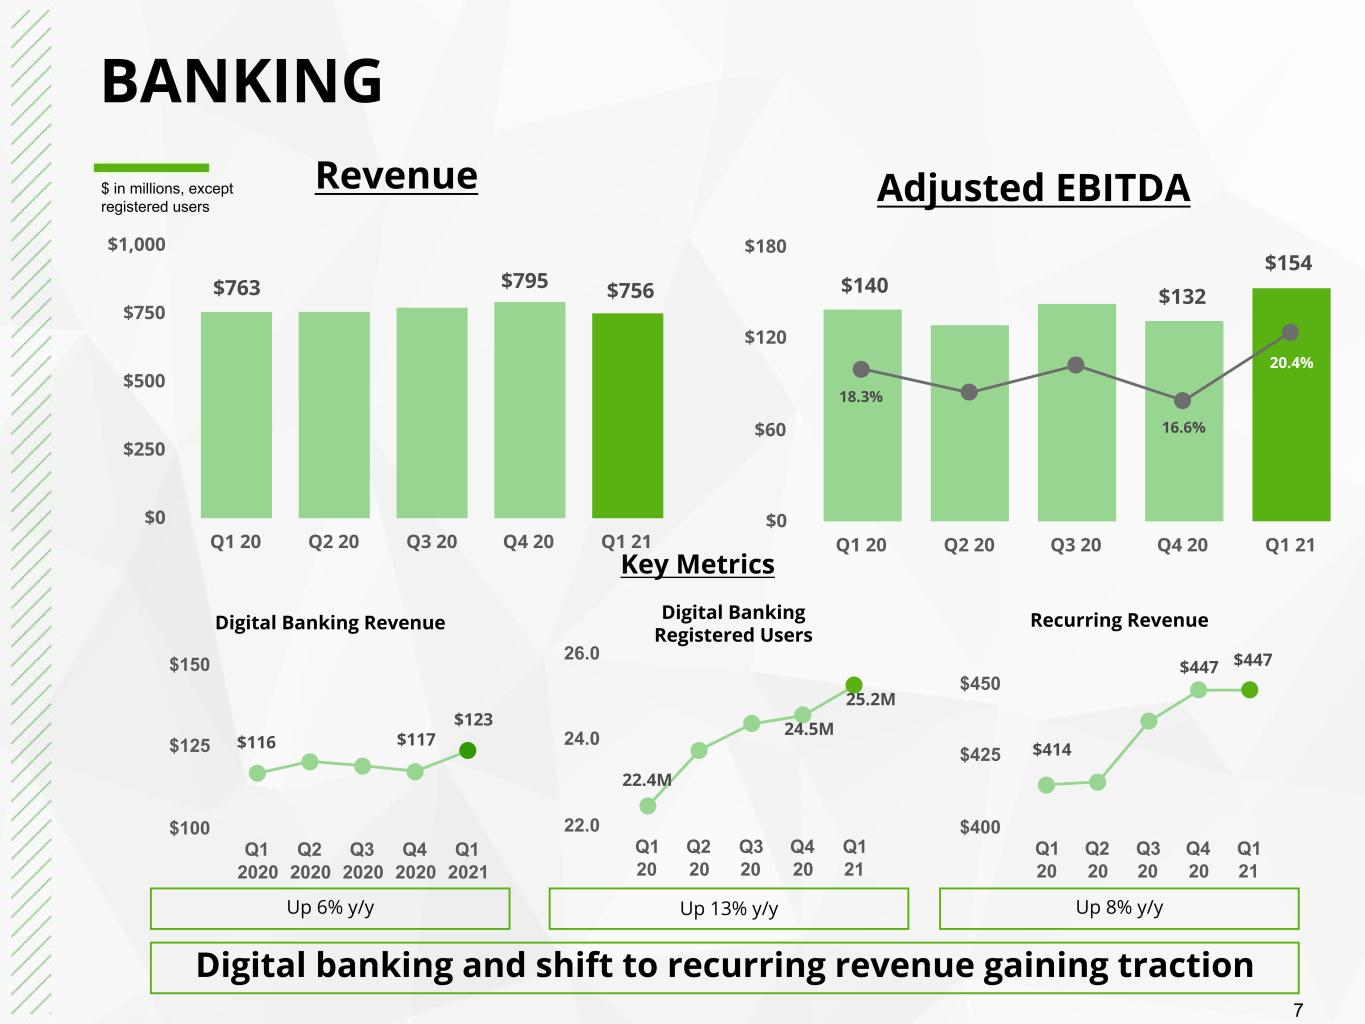
7 Q1 2020 Q2 2020 Q3 2020 Q4 2020 Q1 2021 $100 $125 $150 $ in millions, except registered users BANKING Revenue Adjusted EBITDA Q1 20 Q2 20 Q3 20 Q4 20 Q1 21 $0 $250 $500 $750 $1,000 Q1 20 Q2 20 Q3 20 Q4 20 Q1 21 $0 $60 $120 $180 $756$763 $154 $140 20.4% 18.3% Q1 20 Q2 20 Q3 20 Q4 20 Q1 21 22.0 24.0 26.0 Digital Banking Revenue Digital Banking Registered Users Recurring Revenue Up 6% y/y Up 13% y/y Q1 20 Q2 20 Q3 20 Q4 20 Q1 21 $400 $425 $450 Up 8% y/y Digital banking and shift to recurring revenue gaining traction $117 25.2M $447 Key Metrics $795 $132 16.6% $116 $123 22.4M 24.5M $414 $447

8 Momentum in Self-Checkout and Platform Lanes $ in millions, except platform lanes RETAIL Revenue Adjusted EBITDA Q1 20 Q2 20 Q3 20 Q4 20 Q1 21 $0 $200 $400 $600 Q1 20 Q2 20 Q3 20 Q4 20 Q1 21 $0 $40 $80 $120$569 $472 $73 $37 13.7% 7.8% SCO Revenue Platform Lanes Q1 20 Q2 20 Q3 20 Q4 20 Q1 21 3,000 4,000 5,000 Recurring Revenue Up 31% y/y Q1 20 Q2 20 Q3 20 Q4 20 Q1 21 $200 $250 $300 Q1 20 Q2 20 Q3 20 Q4 20 Q1 21 $100 $200 $300 $225 4,618 $260 Key Metrics $532 $88 Up 14% y/yUp 51% y/y 15.5% 4,249 $172 $260 3,059 $229 $260

9 $ in millions, except Aloha Essential sites HOSPITALITY Revenue Adjusted EBITDA Q1 20 Q2 20 Q3 20 Q4 20 Q1 21 $0 $50 $100 $150 $200 Q1 20 Q2 20 Q3 20 Q4 20 Q1 21 $0 $10 $20 $30$179$169 $25 $7 4.1% 14.0% Aloha Essential Sites Recurring Revenue Q1 20 Q2 20 Q3 20 Q4 20 Q1 21 2,500 3,750 5,000 Up 61% y/y Down 1% y/y Q1 20 Q2 20 Q3 20 Q4 20 Q1 21 $75 $100 $125 Conversion to Aloha Essentials gaining traction Key Metrics 4,594 $106 $182 $27 14.8% 2,856 3,785 $107 $106

10 Q1 2021 Q4 2020 Q1 2020 80% of NCR's revenue will come from software and services 72% 71% 74% 60% of NCR's revenue will come from recurring revenue 57% 54% 53% 20% goal for Adjusted EBITDA as a percent of revenue 16.7% 15.8% 12.5% Progress on 80/60/20 Goals

11 Free Cash Flow Q1 2021 Q1 2020 Cash provided by operating activities $155 $54 Less: Total capital expenditures ($61) ($79) Plus: Pension contributions $4 $5 Free Cash Flow $98 ($20) $ in millions FREE CASH FLOW, NET DEBT & EBITDA Net Debt & EBITDA Q1 2021 Q4 2020 Q1 2020 Debt $3,401 $3,278 $4,385 Cash ($319) ($338) ($1,214) Net Debt $3,082 $2,940 $3,171 Adjusted EBITDA LTM $966 $896 $1,028 Net Debt / Adjusted EBITDA 3.2x 3.3x 3.1x
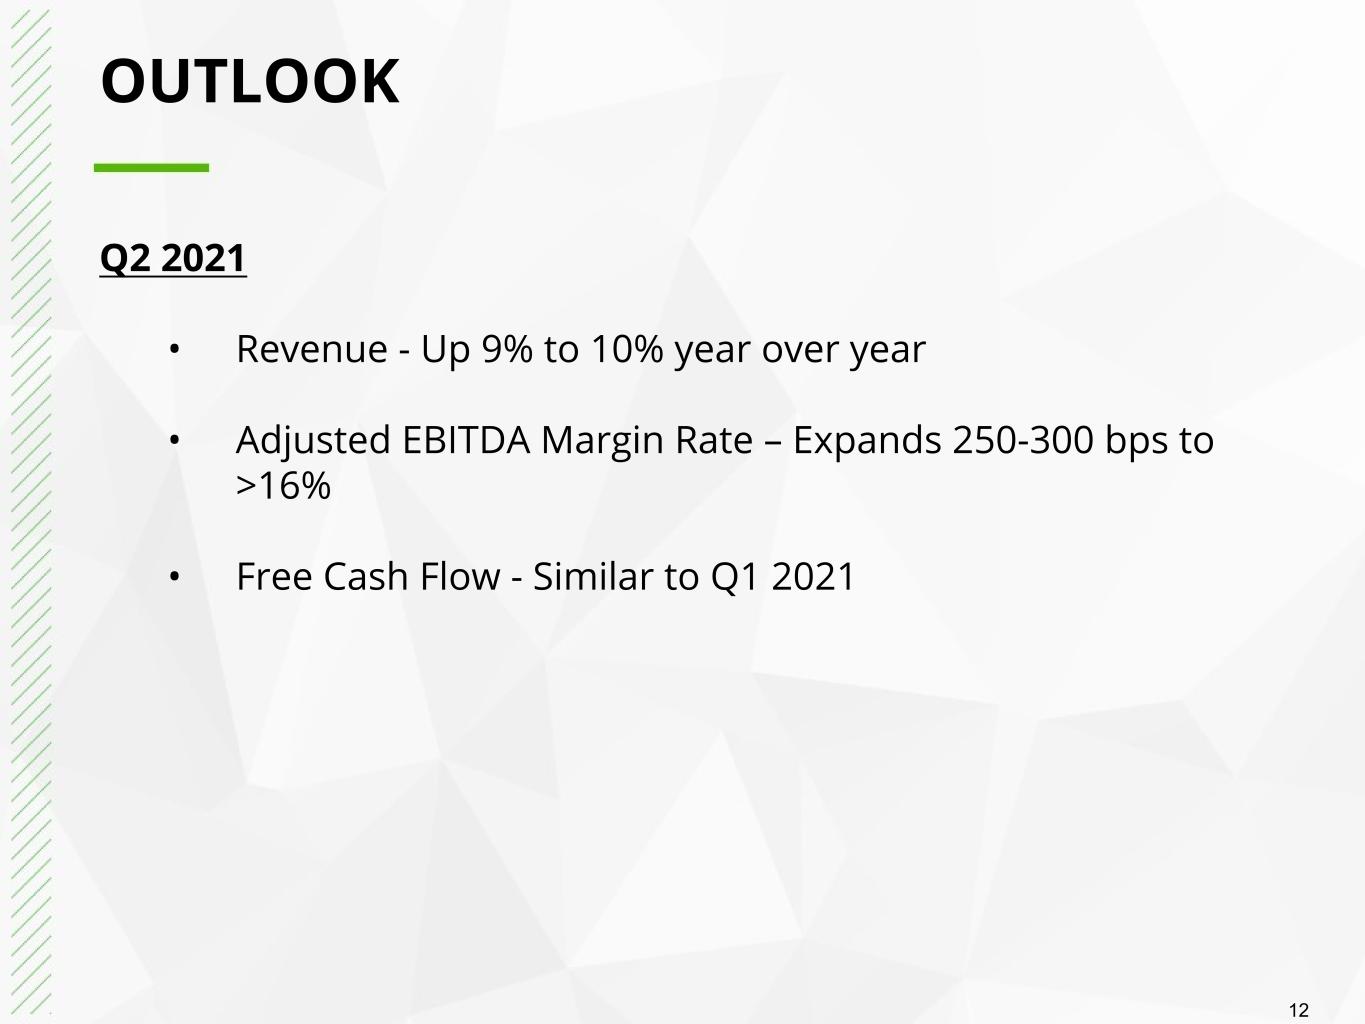
12 OUTLOOK Q2 2021 • Revenue - Up 9% to 10% year over year • Adjusted EBITDA Margin Rate – Expands 250-300 bps to >16% • Free Cash Flow - Similar to Q1 2021
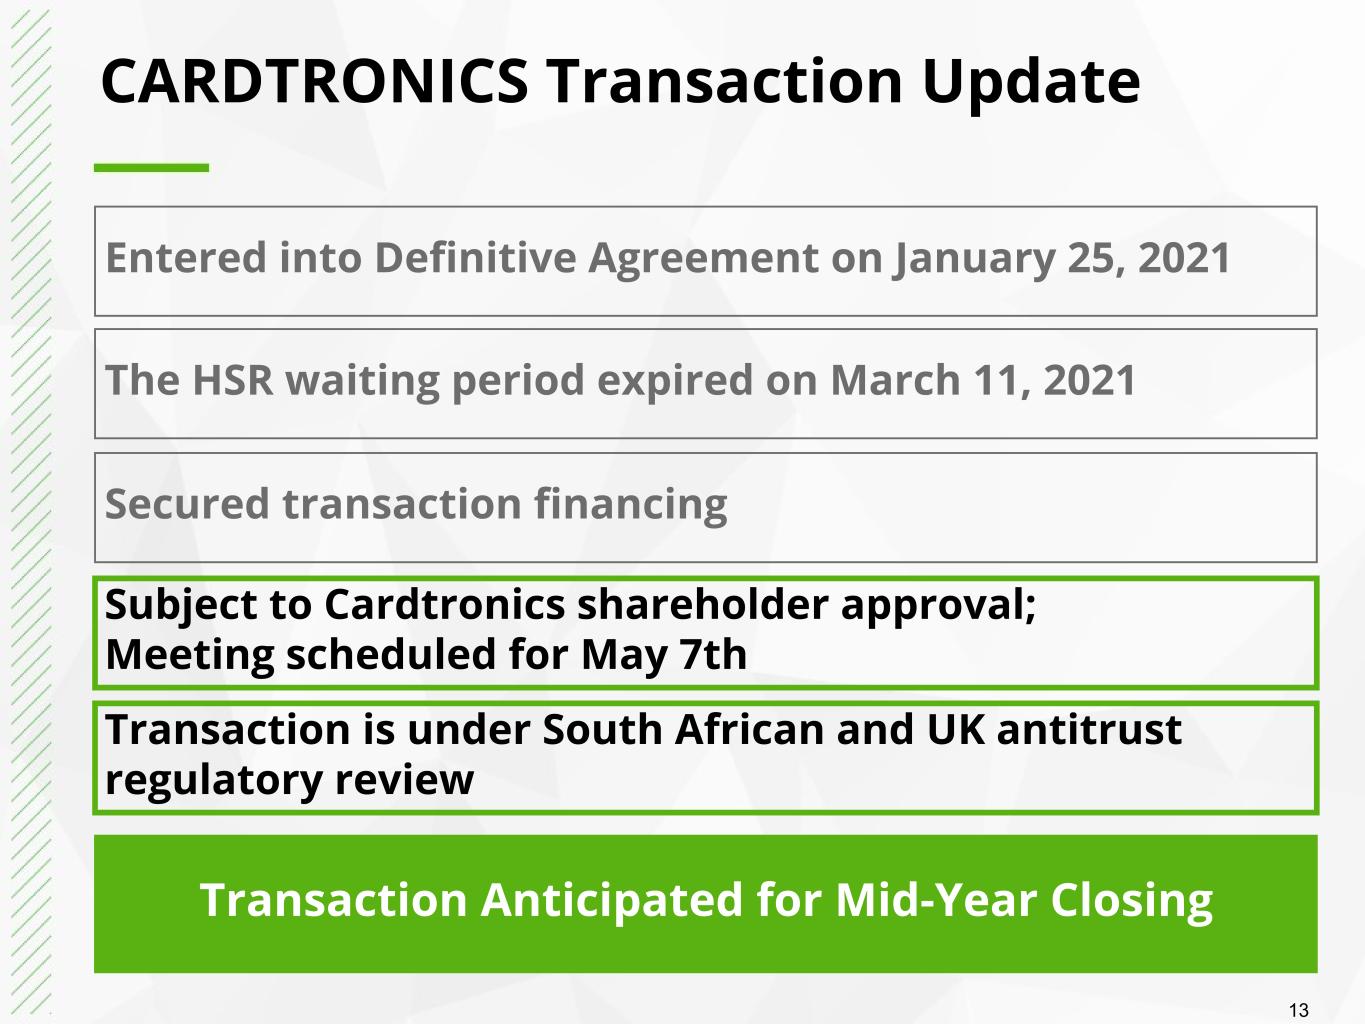
13 Transaction is under South African and UK antitrust regulatory review CARDTRONICS Transaction Update The HSR waiting period expired on March 11, 2021 Secured transaction financing Entered into Definitive Agreement on January 25, 2021 Subject to Cardtronics shareholder approval; Meeting scheduled for May 7th Transaction Anticipated for Mid-Year Closing

14 • Maintain momentum of NCR-as-a-Service 80/60/20 strategy • Accelerate growth • Increase revenue and cash flow linearity • Cost discipline and positive operating leverage drive margin expansion • Allocate capital to highest growth and return on investment opportunities LOOKING FORWARD

15 SUPPLEMENTARY MATERIALS
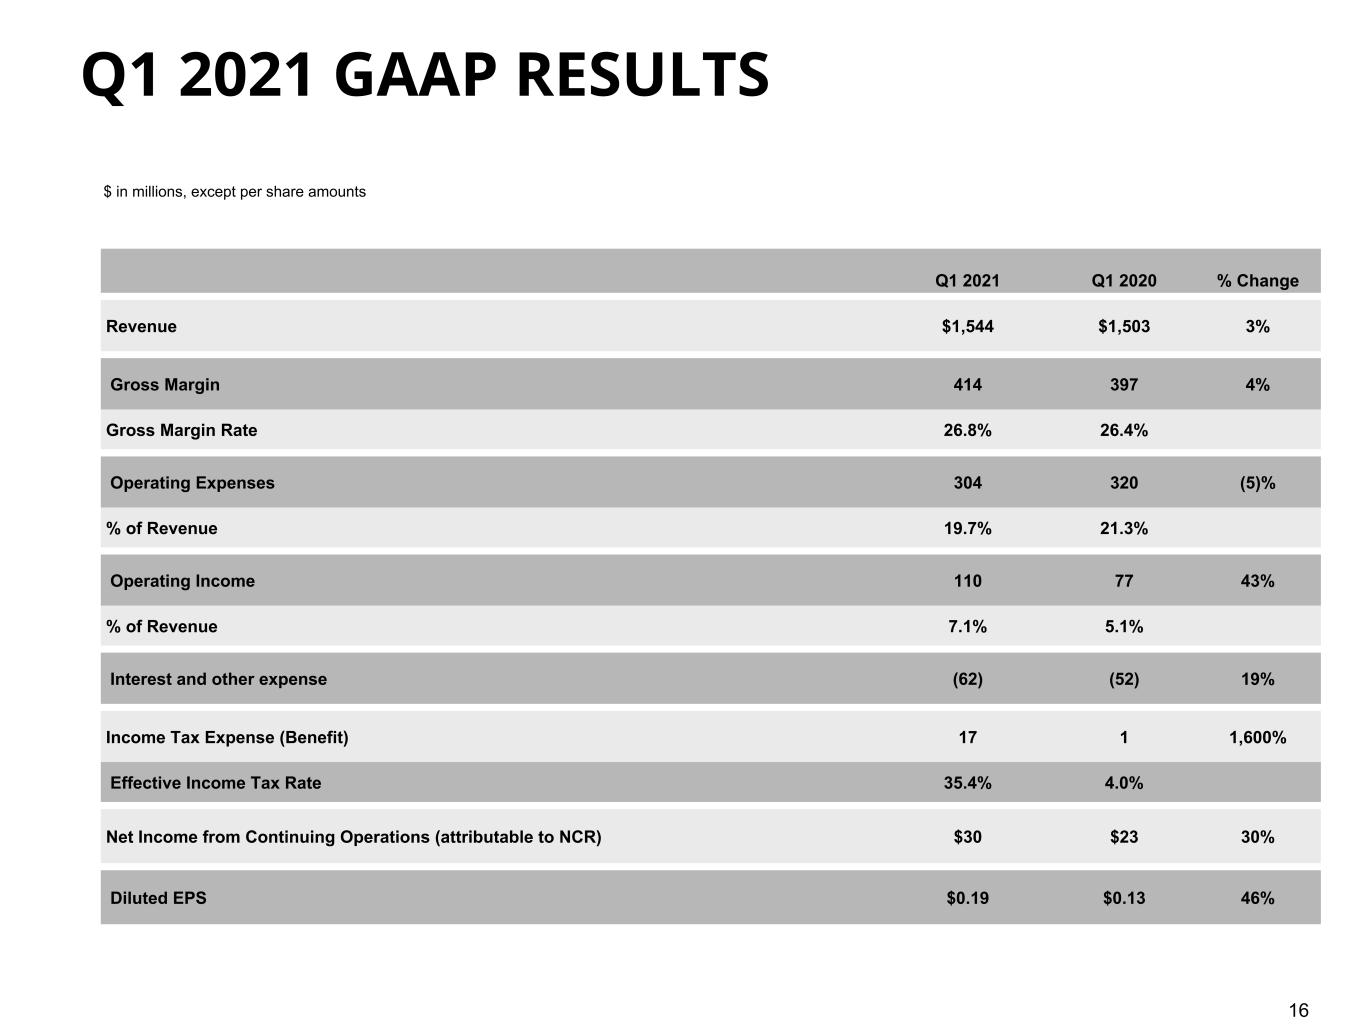
16 Q1 2021 Q1 2020 % Change Revenue $1,544 $1,503 3% Gross Margin 414 397 4% Gross Margin Rate 26.8% 26.4% Operating Expenses 304 320 (5)% % of Revenue 19.7% 21.3% Operating Income 110 77 43% % of Revenue 7.1% 5.1% Interest and other expense (62) (52) 19% Income Tax Expense (Benefit) 17 1 1,600% Effective Income Tax Rate 35.4% 4.0% Net Income from Continuing Operations (attributable to NCR) $30 $23 30% Diluted EPS $0.19 $0.13 46% $ in millions, except per share amounts Q1 2021 GAAP RESULTS

17 Q1 2021 Q1 2020 % Change Revenue $1,544 $1,503 3% Gross Margin (non-GAAP) 425 404 5% Gross Margin Rate (non-GAAP) 27.5% 26.9% 60 bps Operating Expenses (non-GAAP) $277 $300 (8%) % of Revenue 17.9% 20.0% (200 bps) Operating Income (non-GAAP) $148 $104 42% % of Revenue 9.6% 6.9% 270 bps Interest and other expense (non-GAAP) ($45) ($52) (13%) Income Tax Expense (non-GAAP) 29 7 314% Effective Income Tax Rate (non-GAAP) 28.2% 13.5% Net Income (Loss) From Continuing Operations (attributable to NCR) (non-GAAP) $73 $44 66% Diluted EPS (non-GAAP) $0.51 $0.31 65% $ in millions, except per share amounts Q1 2021 OPERATIONAL RESULTS
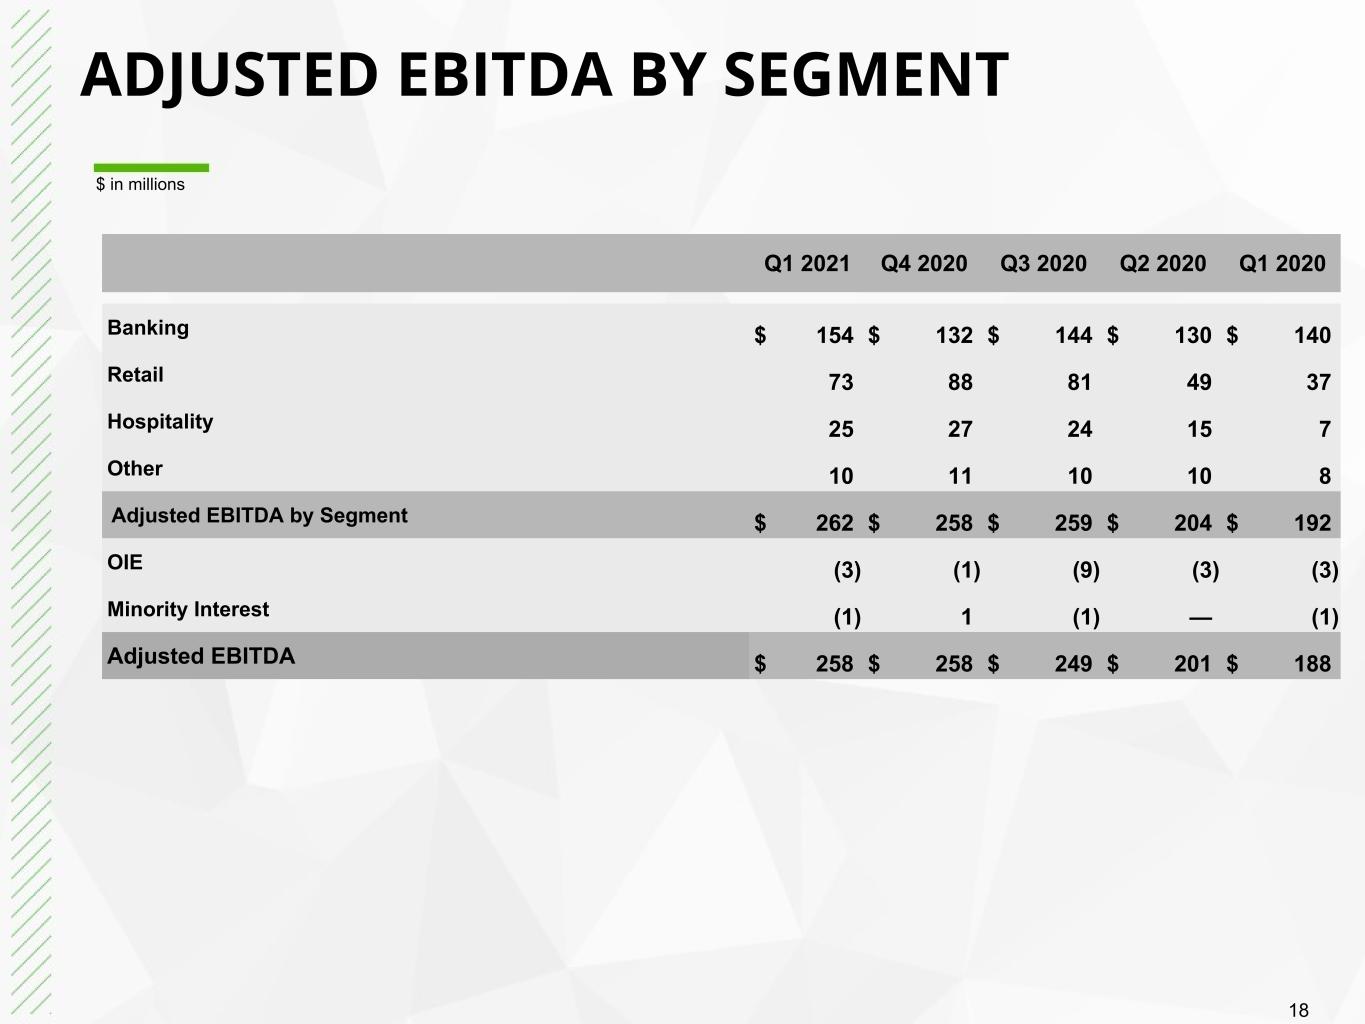
18 Q1 2021 Q4 2020 Q3 2020 Q2 2020 Q1 2020 Banking $ 154 $ 132 $ 144 $ 130 $ 140 Retail 73 88 81 49 37 Hospitality 25 27 24 15 7 Other 10 11 10 10 8 Adjusted EBITDA by Segment $ 262 $ 258 $ 259 $ 204 $ 192 OIE (3) (1) (9) (3) (3) Minority Interest (1) 1 (1) — (1) Adjusted EBITDA $ 258 $ 258 $ 249 $ 201 $ 188 ADJUSTED EBITDA BY SEGMENT $ in millions

19 While NCR reports its results in accordance with generally accepted accounting principles (GAAP) in the United States, comments made during this conference call and in these materials will include non-GAAP measures. These measures are included to provide additional useful information regarding NCR's financial results, and are not a substitute for their comparable GAAP measures. Non-GAAP Diluted Earnings Per Share (EPS), Gross Margin (non-GAAP), Gross Margin Rate (non-GAAP), Operating Expenses (non- GAAP), Operating Income (non-GAAP), Operating Margin Rate (non-GAAP), Other (Expense) (non-GAAP), Income Tax Expense (non-GAAP), Effective Income Tax Rate (non-GAAP), and Net Income from Continuing Operations Attributable to NCR (non- GAAP). NCR’s non-GAAP diluted EPS, gross margin (non-GAAP), gross margin rate (non-GAAP), operating expenses (non-GAAP), operating income (non-GAAP), operating margin rate (non-GAAP), other (expense) (non-GAAP), income tax expense (non-GAAP), effective income tax rate (non-GAAP), and net income from continuing operations attributable to NCR (non-GAAP) are determined by excluding, as applicable, pension mark-to-market adjustments, pension settlements, pension curtailments and pension special termination benefits, as well as other special items, including amortization of acquisition related intangibles and transformation and restructuring activities, from NCR’s GAAP earnings per share, gross margin, gross margin rate, expenses, income from operations, operating margin rate, other (expense), income tax expense, effective income tax rate and net income from continuing operations attributable to NCR, respectively. Due to the non-operational nature of these pension and other special items, NCR's management uses these non-GAAP measures to evaluate year-over-year operating performance. NCR believes these measures are useful for investors because they provide a more complete understanding of NCR's underlying operational performance, as well as consistency and comparability with NCR's past reports of financial results. Free Cash Flow. NCR defines free cash flow as net cash provided by (used in) operating activities less capital expenditures for property, plant and equipment, less additions to capitalized software plus pension contributions and pension settlements. NCR's management uses free cash flow to assess the financial performance of the Company and believes it is useful for investors because it relates the operating cash flow of the Company to the capital that is spent to continue and improve business operations. In particular, free cash flow indicates the amount of cash generated after capital expenditures, which can be used for, among other things, investment in the Company's existing businesses, strategic acquisitions, strengthening the Company's balance sheet, repurchase of Company stock and repayment of the Company's debt obligations. Free cash flow does not represent the residual cash flow available for discretionary expenditures since there may be other nondiscretionary expenditures that are not deducted from the measure. Free cash flow does not have uniform definitions under GAAP and, therefore, NCR's definitions may differ from other companies' definitions of these measures. NON-GAAP MEASURES

20 Net Debt and Adjusted Earnings Before Interest, Taxes, Depreciation and Amortization (Adjusted EBITDA). NCR determines Net Debt based on its total debt less cash and cash equivalents, with total debt being defined as total short-term borrowings plus total long-term debt. NCR believes that Net Debt provides useful information to investors because NCR’s management reviews Net Debt as part of its management of overall liquidity, financial flexibility, capital structure and leverage. In addition, certain debt rating agencies, creditors and credit analysts monitor NCR’s Net Debt as part of their assessments of NCR’s business. NCR determines Adjusted EBITDA for a given period based on its GAAP net income from continuing operations attributable to NCR plus interest expense, net; plus income tax expense (benefit); plus depreciation and amortization; plus other income (expense); plus pension mark-to-market adjustments, pension settlements, pension curtailments and pension special termination benefits and other special items, including amortization of acquisition related intangibles and restructuring charges, among others. NCR uses Adjusted EBITDA to manage and measure the performance of its business segments. NCR also uses Adjusted EBITDA to manage and determine the effectiveness of its business managers and as a basis for incentive compensation. NCR believes that Adjusted EBITDA provides useful information to investors because it is an indicator of the strength and performance of the Company's ongoing business operations, including its ability to fund discretionary spending such as capital expenditures, strategic acquisitions and other investments. NCR believes that its ratio of Net Debt to Adjusted EBITDA provides useful information to investors because it is an indicator of the company's ability to meet its future financial obligations. In addition, the Net Debt to Adjusted EBITDA ratio is measures frequently used by investors and credit rating agencies. The Net Debt to Adjusted EBITDA ratio is calculated by dividing Net Debt by trailing twelve-month Adjusted EBITDA. NCR management's definitions and calculations of these non-GAAP measures may differ from similarly-titled measures reported by other companies and cannot, therefore, be compared with similarly-titled measures of other companies. These non-GAAP measures should not be considered as substitutes for, or superior to, results determined in accordance with GAAP. These non- GAAP measures are reconciled to their corresponding GAAP measures in the following slides and elsewhere in these materials. These reconciliations and other information regarding these non-GAAP measures are also available on the Investor Relations page of NCR's website at www.ncr.com. NON-GAAP MEASURES

21 Q1 2021 Q4 2020 Q3 2020 Q2 2020 Q1 2020 Net (Loss) Income from Continuing Operations Attributable to NCR (GAAP) $ 30 $ (125) $ 31 $ 64 $ 23 Pension Mark-to-Market Adjustments — 34 — — — Transformation & Restructuring Costs 8 202 19 8 5 Acquisition-Related Amortization of Intangibles 20 19 21 19 22 Acquisition-Related Costs 27 (6) — — — Loss on Debt Extinguishment — — 20 — — Interest Expense 45 51 60 57 50 Interest Income (3) (3) (3) (1) (1) Depreciation and Amortization 70 74 70 68 63 Income Taxes 17 (20) — (34) 1 Stock Compensation Expense 44 32 31 20 25 Adjusted EBITDA (non-GAAP) $ 258 $ 258 $ 249 $ 201 $ 188 GAAP TO NON-GAAP RECONCILIATION $ in millions

22 Q1 2021 LTM Q4 2020 LTM Q1 2020 LTM Net (Loss) Income from Continuing Operations Attributable to NCR (GAAP) $ — $ (7) $ 600 Pension Mark-to-Market Adjustments 34 34 75 Transformation & Restructuring Costs 237 234 37 Acquisition-Related Amortization of Intangibles 79 81 87 Acquisition-Related Costs 21 (6) 3 Internal reorganization & IP Transfer — — (37) Loss on Debt Extinguishment 20 20 — Interest Expense 213 218 202 Interest Income (10) (8) (4) Depreciation and Amortization 282 275 237 Income Taxes (37) (53) (281) Stock Compensation Expense 127 108 109 Adjusted EBITDA (non-GAAP) $ 966 $ 896 $ 1,028 GAAP TO NON-GAAP RECONCILIATION $ in millions

23 Q1 QTD 2021 GAAP Transformation Costs Acquisition- related amortization of intangibles Acquisition- related costs Q1 QTD 2021 non-GAAP Product revenue $482 $— $— $— $482 Service revenue 1,062 — — — 1,062 Total revenue 1,544 — — — 1,544 Cost of products 408 — (3) — 405 Cost of services 722 (4) (4) — 714 Gross margin 414 4 7 — 425 Gross margin rate 26.8% 0.3% 0.4% —% 27.5% Selling, general and administrative expenses 238 (2) (13) (10) 213 Research and development expenses 66 (2) — — 64 Total operating expenses 304 (4) (13) (10) 277 Total operating expense as a % of revenue 19.7% (0.3)% (0.9)% (0.6)% 17.9% Income from operations 110 8 20 10 148 Income from operations as a % of revenue 7.1% 0.5% 1.4% 0.6% 9.6% Interest and Other (expense) income, net (62) — — 17 (45) Income from continuing operations before income taxes 48 8 20 27 103 Income tax (benefit) expense 17 2 4 6 29 Effective income tax rate 35.4% —% —% —% 28.2% Income from continuing operations 31 6 16 21 74 Net income (loss) attributable to noncontrolling interests 1 — — — 1 Income from continuing operations (attributable to NCR) $30 $6 $16 $21 $73 Diluted earnings per share $0.19 $0.04 $0.11 $0.15 $0.51 Diluted shares outstanding 134.7 143.9 GAAP TO NON-GAAP RECONCILIATION Q1 2021 $ in millions, except per share amounts

24 Q1 QTD 2021 GAAP Q1 QTD 2021 non- GAAP Income from continuing operations attributable to NCR common stockholders: Income from continuing operations (attributable to NCR) $30 $73 Dividends on convertible preferred shares (4) — Income from continuing operations attributable to NCR common stockholders $26 $73 Weighted average outstanding shares: Weighted average diluted shares outstanding 134.7 134.7 Weighted as-if converted preferred shares — 9.2 Total shares used in diluted earnings per share 134.7 143.9 Diluted earnings per share (1) $0.19 $0.51 (1) GAAP EPS is determined using the most dilutive measure, either including the impact of the dividends or deemed dividends on NCR's Series A Convertible Preferred Shares in the calculation of net income or loss available to common stockholders or including the impact of the conversion of such preferred stock into common stock in the calculation of the weighted average diluted shares outstanding. Non-GAAP EPS is always determined using the as-if converted preferred shares and shares that would be issued for stock compensation awards. Therefore, GAAP diluted EPS and non-GAAP diluted EPS may be calculated using different methods, and may not mathematically reconcile. GAAP TO NON-GAAP RECONCILIATION Q1 2021 $ in millions, except per share amounts

25 Q1 QTD 2020 GAAP Transformation Costs Acquisition- related amortization of intangibles Q1 QTD 2020 non-GAAP Product revenue $474 $— $— $474 Service revenue 1,029 — — 1,029 Total revenue 1,503 — — 1,503 Cost of products 391 — (3) 388 Cost of services 715 — (4) 711 Gross margin 397 — 7 404 Gross margin rate 26.4% —% 0.5% 26.9% Selling, general and administrative expenses 255 (5) (15) 235 Research and development expenses 65 — — 65 Total expenses 320 (5) (15) 300 Total expense as a % of revenue 21.3% (0.3)% (1.0)% 20.0% Income from operations 77 5 22 104 Income from operations as a % of revenue 5.1% 0.3% 1.5% 6.9% Interest and Other (expense) income, net (52) — — (52) Income from continuing operations before income taxes 25 5 22 52 Income tax expense 1 1 5 7 Effective income tax rate 4.0% —% —% 13.5% Income from continuing operations 24 4 17 45 Net income attributable to noncontrolling interests 1 — — 1 Income from continuing operations (attributable to NCR) $23 $4 $17 $44 Diluted (loss) earnings per share $0.13 $0.03 $0.12 $0.31 Diluted shares outstanding 130.5 143.7 GAAP TO NON-GAAP RECONCILIATION Q1 2020 $ in millions, except per share amounts
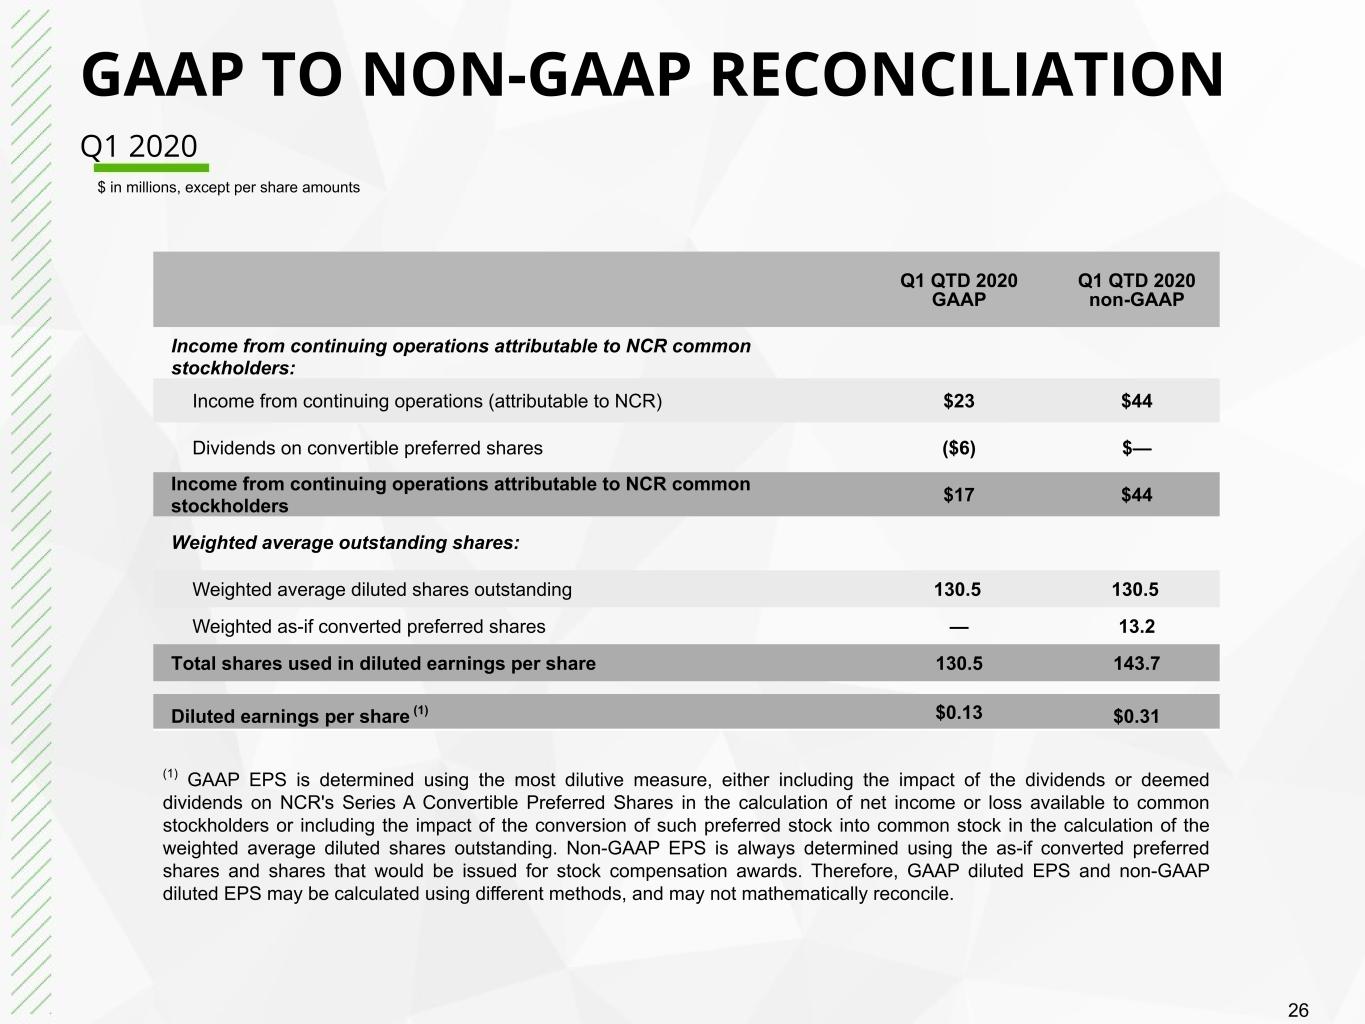
26 Q1 QTD 2020 GAAP Q1 QTD 2020 non-GAAP Income from continuing operations attributable to NCR common stockholders: Income from continuing operations (attributable to NCR) $23 $44 Dividends on convertible preferred shares ($6) $— Income from continuing operations attributable to NCR common stockholders $17 $44 Weighted average outstanding shares: Weighted average diluted shares outstanding 130.5 130.5 Weighted as-if converted preferred shares — 13.2 Total shares used in diluted earnings per share 130.5 143.7 Diluted earnings per share (1) $0.13 $0.31 (1) GAAP EPS is determined using the most dilutive measure, either including the impact of the dividends or deemed dividends on NCR's Series A Convertible Preferred Shares in the calculation of net income or loss available to common stockholders or including the impact of the conversion of such preferred stock into common stock in the calculation of the weighted average diluted shares outstanding. Non-GAAP EPS is always determined using the as-if converted preferred shares and shares that would be issued for stock compensation awards. Therefore, GAAP diluted EPS and non-GAAP diluted EPS may be calculated using different methods, and may not mathematically reconcile. GAAP TO NON-GAAP RECONCILIATION Q1 2020 $ in millions, except per share amounts

27 Q1 2021 Q4 2020 Q1 2020 Cash provided by operating activities $155 $146 $54 Less: Total capital expenditures ($61) ($63) ($79) Plus: Pension contributions $4 $75 $5 Free Cash Flow $98 $158 ($20) $ in millions GAAP TO NON-GAAP RECONCILIATION

28 THANK YOU
