Attached files
| file | filename |
|---|---|
| EX-99.1 - EX-99.1 - HELIX ENERGY SOLUTIONS GROUP INC | hlx-20210426xex99d1.htm |
| 8-K - 8-K - HELIX ENERGY SOLUTIONS GROUP INC | hlx-20210426x8k.htm |
Exhibit 99.2
| April 27, 2021 First Quarter 2021 Conference Call EXHIBIT 99.2 |
| This presentation contains forward-looking statements that involve risks, uncertainties and assumptions that could cause our results to differ materially from those expressed or implied by such forward-looking statements. All statements, other than statements of historical fact, are “forward-looking statements” within the meaning of the Private Securities Litigation Reform Act of 1995, including, without limitation, any statements regarding the ongoing COVID-19 pandemic and oil price volatility and their respective effects and results, our protocols and plans, our current work continuing, the spot market, our spending and cost reduction plans and our ability to manage changes; our strategy; any statements regarding visibility and future utilization; any projections of financial items; any statements regarding future operations expenditures; any statements regarding the plans, strategies and objectives of management for future operations; any statements regarding our ability to enter into, renew and/or perform commercial contracts; any statements concerning developments; any statements regarding future economic conditions or performance; any statements of expectation or belief; and any statements of assumptions underlying any of the foregoing. Forward-looking statements are subject to a number of known and unknown risks, uncertainties and other factors that could cause results to differ materially from those in the forward-looking statements, including but not limited to the results and effects of the COVID-19 pandemic and actions by governments, customers, suppliers and partners with respect thereto; market conditions; results from acquired properties; demand for our services; the performance of contracts by suppliers, customers and partners; actions by governmental and regulatory authorities including recent regulatory initiatives by the new U.S. administration; operating hazards and delays, which include delays in delivery, chartering or customer acceptance of assets or terms of their acceptance; our ultimate ability to realize current backlog; employee management issues; complexities of global political and economic developments; geologic risks; volatility of oil and gas prices and other risks described from time to time in our reports filed with the Securities and Exchange Commission (“SEC”), including our most recently filed Annual Report on Form 10-K and in our other filings with the SEC, which are available free of charge on the SEC’s website at www.sec.gov. We assume no obligation and do not intend to update these forward-looking statements, which speak only as of their respective dates, except as required by the securities laws. Social Media From time to time we provide information about Helix on social media, including: Twitter: @Helix_ESG LinkedIn: www.linkedin.com/company/helix-energy-solutions-group Facebook: www.facebook.com/HelixEnergySolutionsGroup Instagram: www.instagram.com/helixenergysolutions FORWARD-LOOKING STATEMENTS 2 |

| • Executive Summary (pg. 4) • Operational Highlights by Segment (pg. 9) • Key Financial Metrics (pg. 17) • 2021 Outlook (pg. 20) • Non-GAAP Reconciliations (pg. 26) • Questions and Answers 3 PRESENTATION OUTLINE |
| Executive Summary |
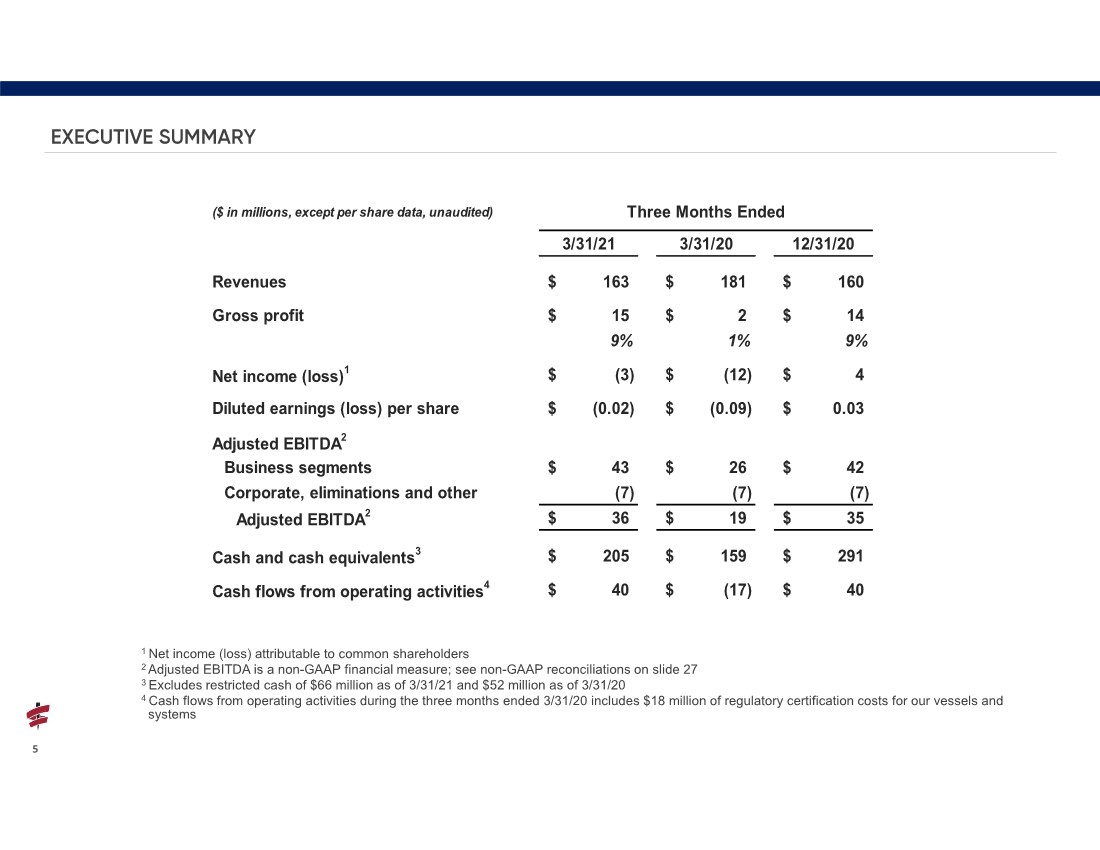
| 5 EXECUTIVE SUMMARY ($ in millions, except per share data, unaudited) Three Months Ended 3/31/21 3/31/20 12/31/20 Revenues 163 $ 181 $ 160 $ Gross profit 15 $ 2 $ 14 $ 9% 1% 9% Net income (loss)1 (3) $ (12) $ 4 $ Diluted earnings (loss) per share (0.02) $ (0.09) $ 0.03 $ Adjusted EBITDA2 Business segments 43 $ 26 $ 42 $ Corporate, eliminations and other (7) (7) (7) Adjusted EBITDA2 36 $ 19 $ 35 $ Cash and cash equivalents3 205 $ 159 $ 291 $ Cash flows from operating activities4 40 $ (17) $ 40 $ 1 Net income (loss) attributable to common shareholders 2 Adjusted EBITDA is a non-GAAP financial measure; see non-GAAP reconciliations on slide 27 3 Excludes restricted cash of $66 million as of 3/31/21 and $52 million as of 3/31/20 4 Cash flows from operating activities during the three months ended 3/31/20 includes $18 million of regulatory certification costs for our vessels and systems |
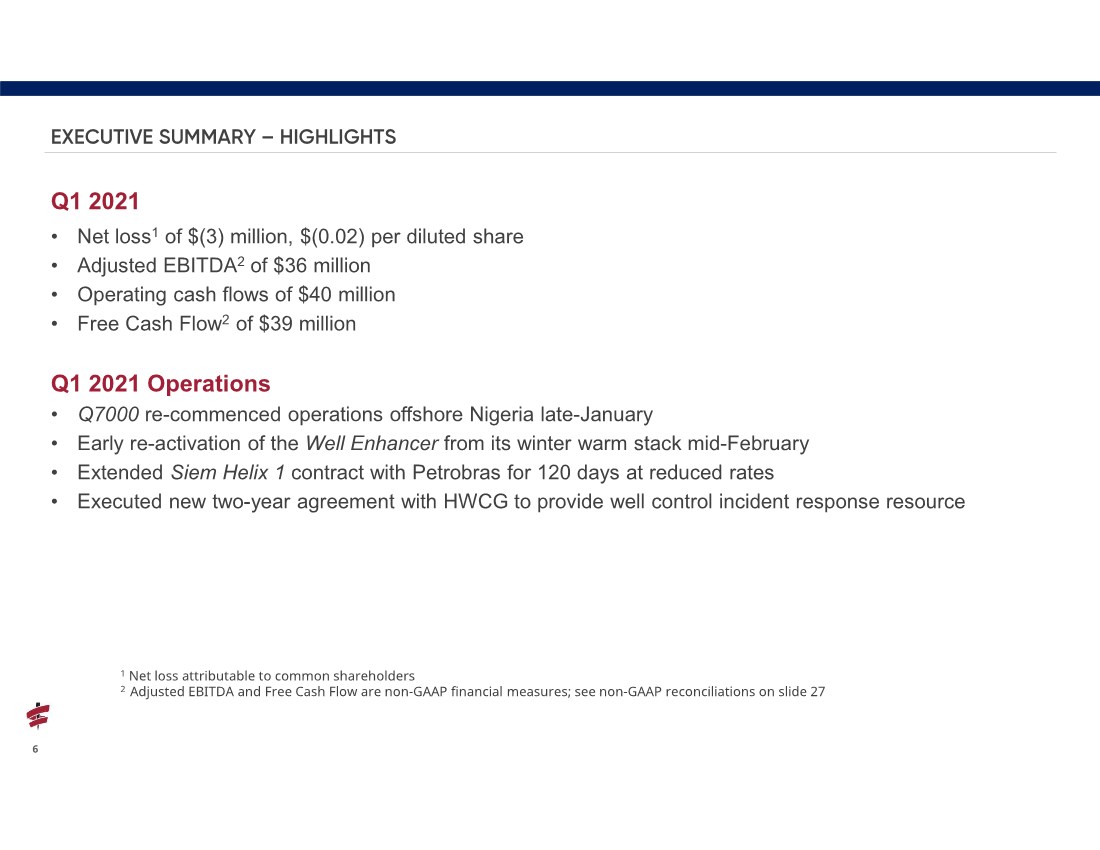
| 6 Q1 2021 • Net loss1 of $(3) million, $(0.02) per diluted share • Adjusted EBITDA2 of $36 million • Operating cash flows of $40 million • Free Cash Flow2 of $39 million Q1 2021 Operations • Q7000 re-commenced operations offshore Nigeria late-January • Early re-activation of the Well Enhancer from its winter warm stack mid-February • Extended Siem Helix 1 contract with Petrobras for 120 days at reduced rates • Executed new two-year agreement with HWCG to provide well control incident response resource EXECUTIVE SUMMARY – HIGHLIGHTS 1 Net loss attributable to common shareholders 2 Adjusted EBITDA and Free Cash Flow are non-GAAP financial measures; see non-GAAP reconciliations on slide 27 |
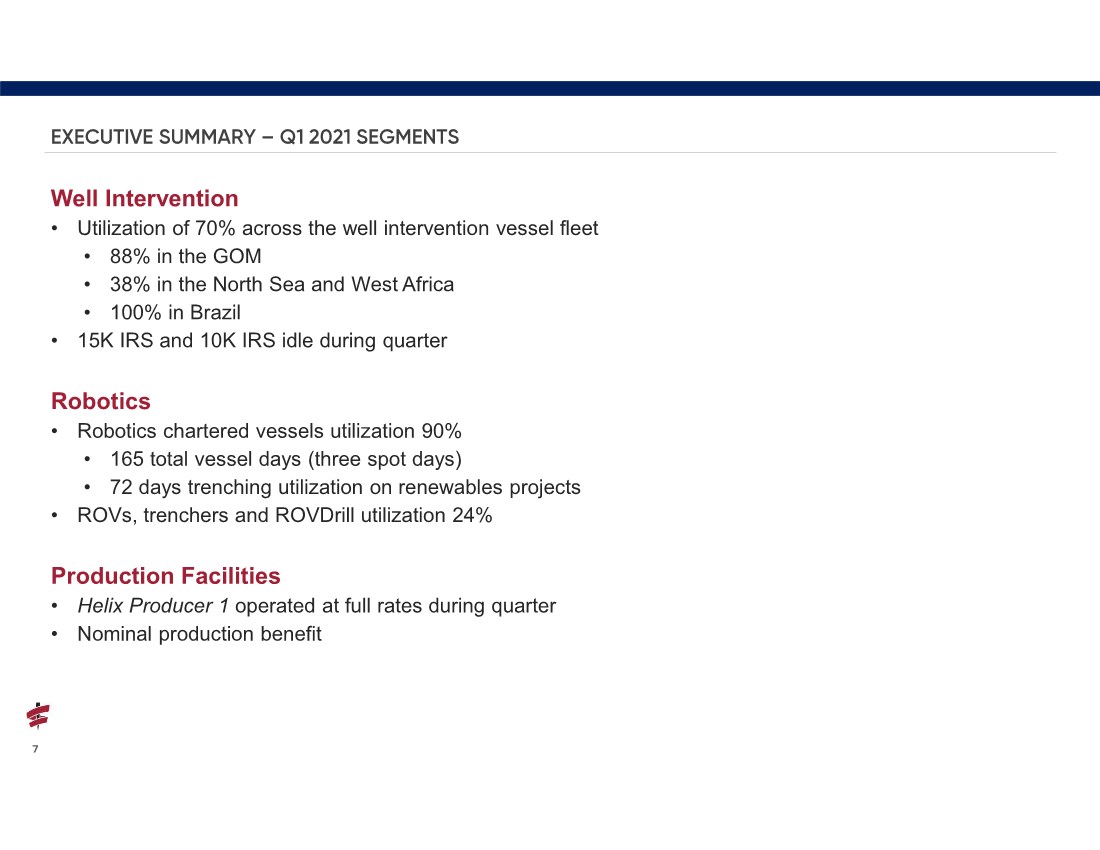
| 7 Well Intervention • Utilization of 70% across the well intervention vessel fleet • 88% in the GOM • 38% in the North Sea and West Africa • 100% in Brazil • 15K IRS and 10K IRS idle during quarter Robotics • Robotics chartered vessels utilization 90% • 165 total vessel days (three spot days) • 72 days trenching utilization on renewables projects • ROVs, trenchers and ROVDrill utilization 24% Production Facilities • Helix Producer 1 operated at full rates during quarter • Nominal production benefit EXECUTIVE SUMMARY – Q1 2021 SEGMENTS |
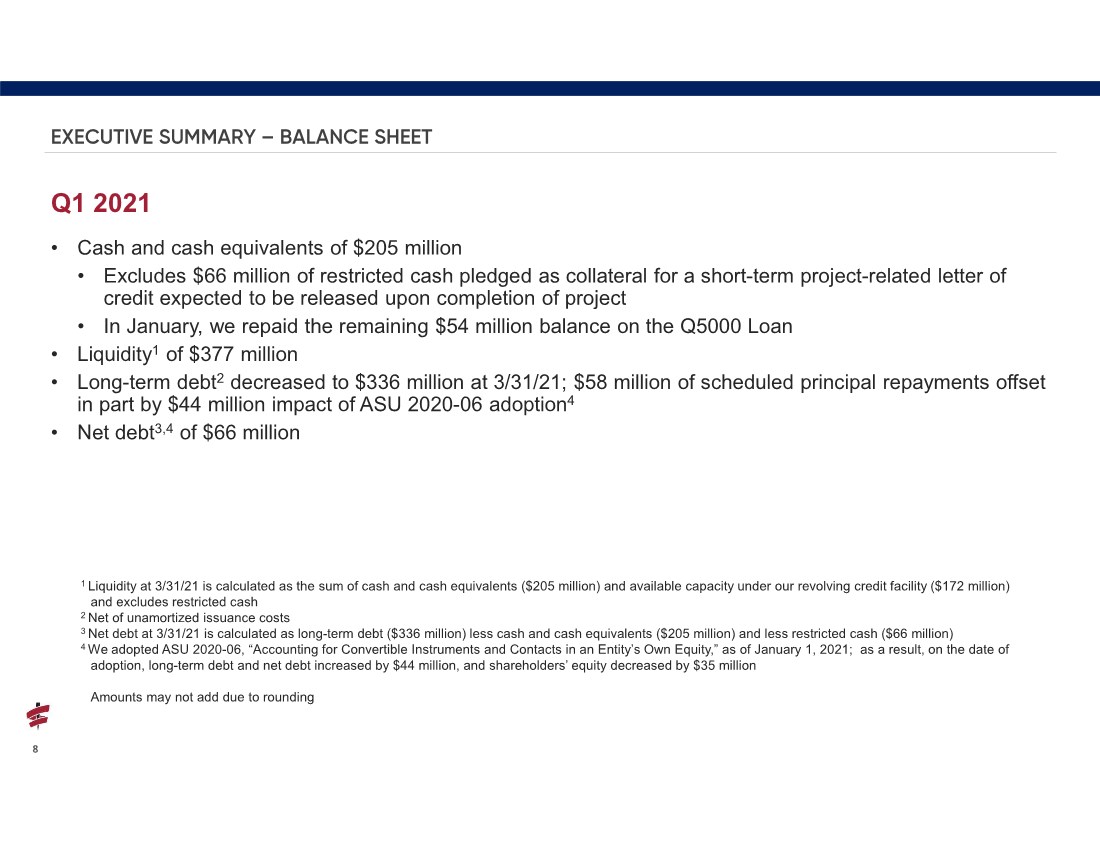
| 8 Q1 2021 • Cash and cash equivalents of $205 million • Excludes $66 million of restricted cash pledged as collateral for a short-term project-related letter of credit expected to be released upon completion of project • In January, we repaid the remaining $54 million balance on the Q5000 Loan • Liquidity1 of $377 million • Long-term debt2 decreased to $336 million at 3/31/21; $58 million of scheduled principal repayments offset in part by $44 million impact of ASU 2020-06 adoption4 • Net debt3,4 of $66 million EXECUTIVE SUMMARY – BALANCE SHEET 1 Liquidity at 3/31/21 is calculated as the sum of cash and cash equivalents ($205 million) and available capacity under our revolving credit facility ($172 million) and excludes restricted cash 2 Net of unamortized issuance costs 3 Net debt at 3/31/21 is calculated as long-term debt ($336 million) less cash and cash equivalents ($205 million) and less restricted cash ($66 million) 4 We adopted ASU 2020-06, “Accounting for Convertible Instruments and Contacts in an Entity’s Own Equity,” as of January 1, 2021; as a result, on the date of adoption, long-term debt and net debt increased by $44 million, and shareholders’ equity decreased by $35 million Amounts may not add due to rounding |
| Operational Highlights By Segment |

| • The ongoing COVID-19 pandemic and its impact on the global economy have resulted in volatile oil prices and caused significant disruption and uncertainty in the oil and gas market • The pandemic has negatively affected the global economy and the oil and gas market and resulted in demand and pricing for our services to decrease, which are expected to remain weak in 2021 and possibly beyond • We have responded to revenue reductions by responsibly reducing our cost base, including warm stacking our vessels during idle periods and cutting capital expenditures and targeted SG&A spending • We are continuing to take what we believe to be appropriate steps to protect our employees, customers and balance sheet COVID & MARKET EVENTS 10 |
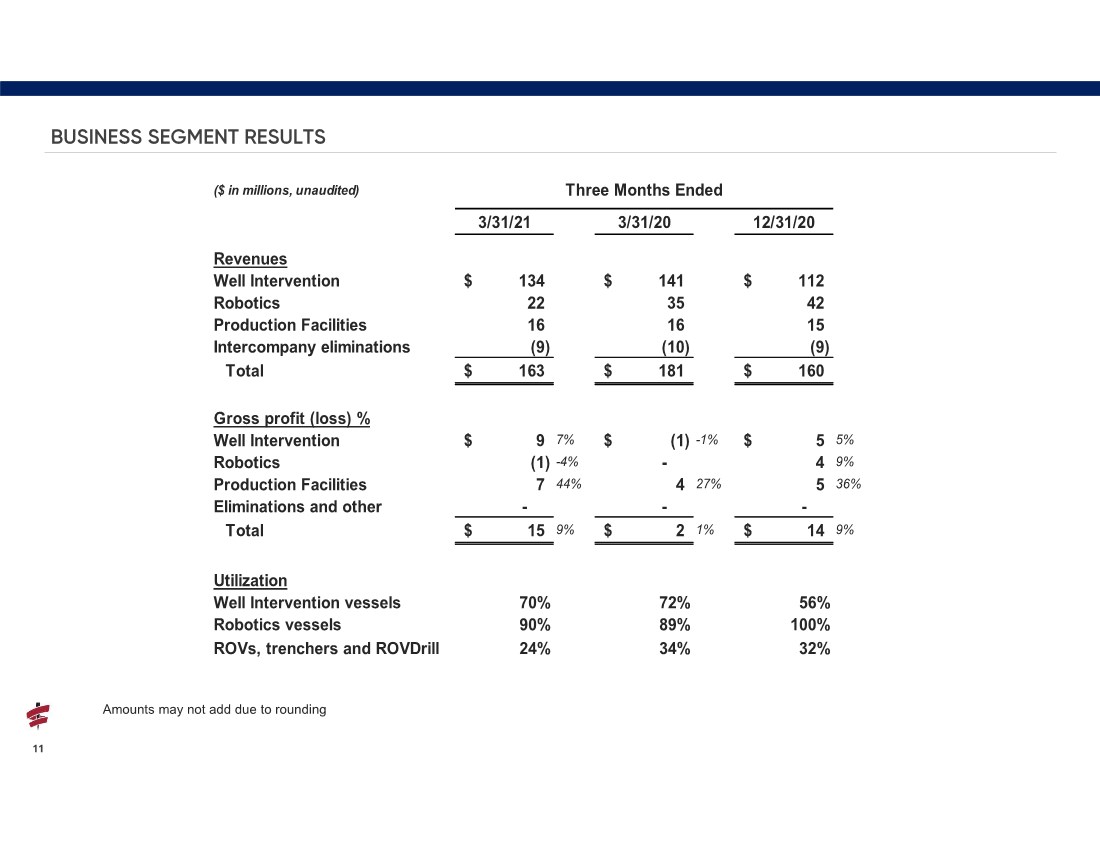
| BUSINESS SEGMENT RESULTS 11 ($ in millions, unaudited) Three Months Ended 3/31/21 3/31/20 12/31/20 Revenues Well Intervention 134 $ 141 $ 112 $ Robotics 22 35 42 Production Facilities 16 16 15 Intercompany eliminations (9) (10) (9) Total 163 $ 181 $ 160 $ Gross profit (loss) % Well Intervention 9 $ 7% (1) $ -1% 5 $ 5% Robotics (1) -4% - 4 9% Production Facilities 7 44% 4 27% 5 36% Eliminations and other - - - Total 15 $ 9% 2 $ 1% 14 $ 9% Utilization Well Intervention vessels 70% 72% 56% Robotics vessels 90% 89% 100% ROVs, trenchers and ROVDrill 24% 34% 32% Amounts may not add due to rounding |
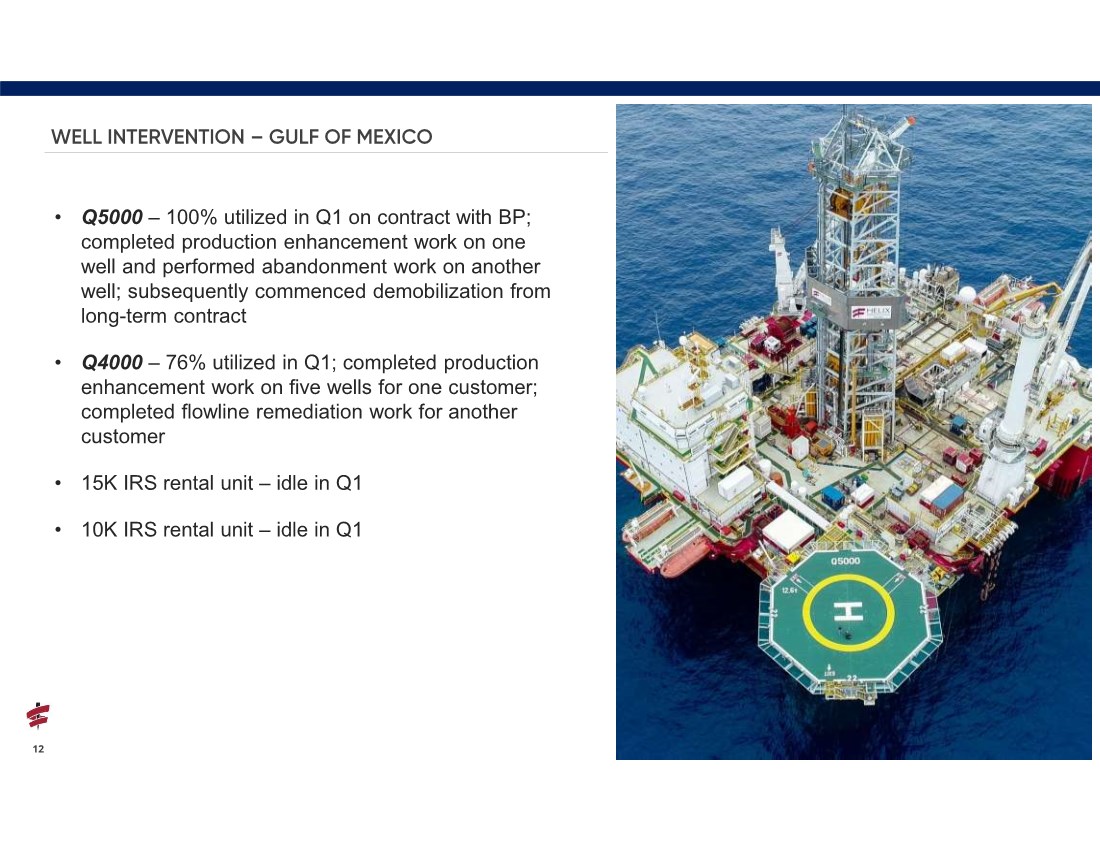
| • Q5000 – 100% utilized in Q1 on contract with BP; completed production enhancement work on one well and performed abandonment work on another well; subsequently commenced demobilization from long-term contract • Q4000 – 76% utilized in Q1; completed production enhancement work on five wells for one customer; completed flowline remediation work for another customer • 15K IRS rental unit – idle in Q1 • 10K IRS rental unit – idle in Q1 12 WELL INTERVENTION – GULF OF MEXICO |
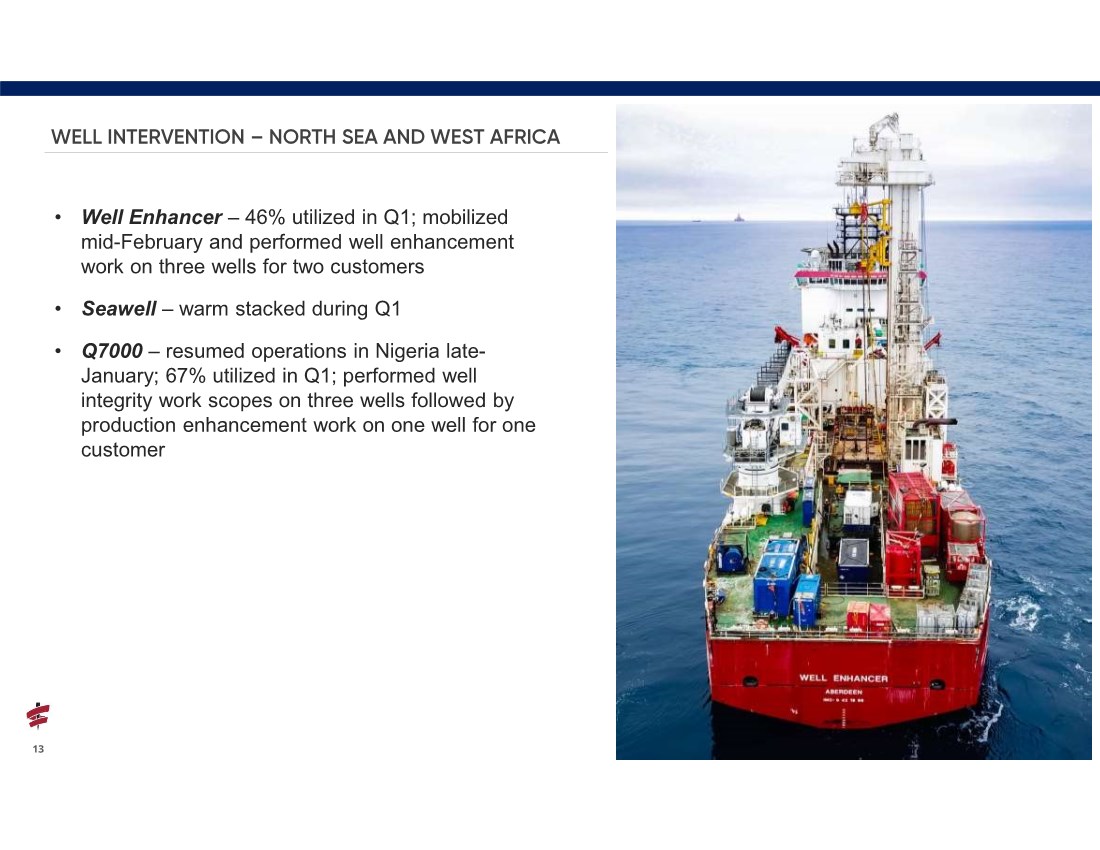
| • Well Enhancer – 46% utilized in Q1; mobilized mid-February and performed well enhancement work on three wells for two customers • Seawell – warm stacked during Q1 • Q7000 – resumed operations in Nigeria late- January; 67% utilized in Q1; performed well integrity work scopes on three wells followed by production enhancement work on one well for one customer 13 WELL INTERVENTION – NORTH SEA AND WEST AFRICA |
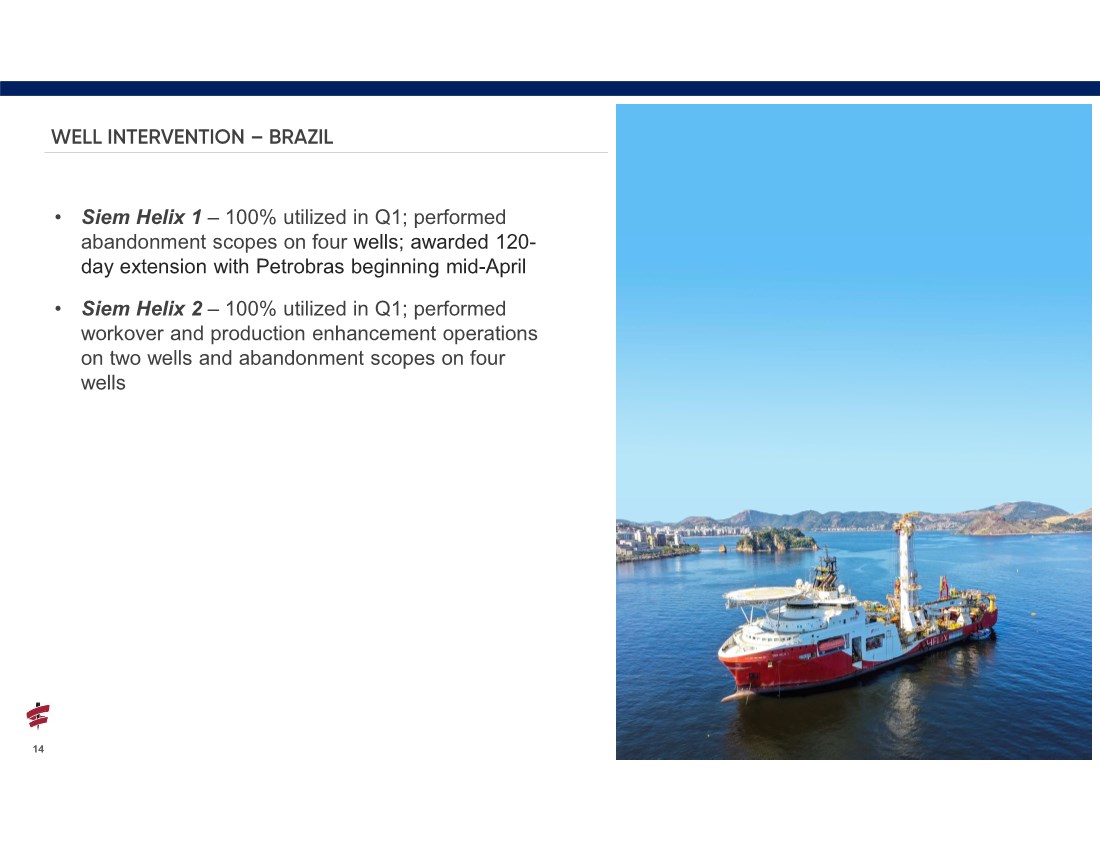
| • Siem Helix 1 – 100% utilized in Q1; performed abandonment scopes on four wells; awarded 120- day extension with Petrobras beginning mid-April • Siem Helix 2 – 100% utilized in Q1; performed workover and production enhancement operations on two wells and abandonment scopes on four wells 14 WELL INTERVENTION – BRAZIL |
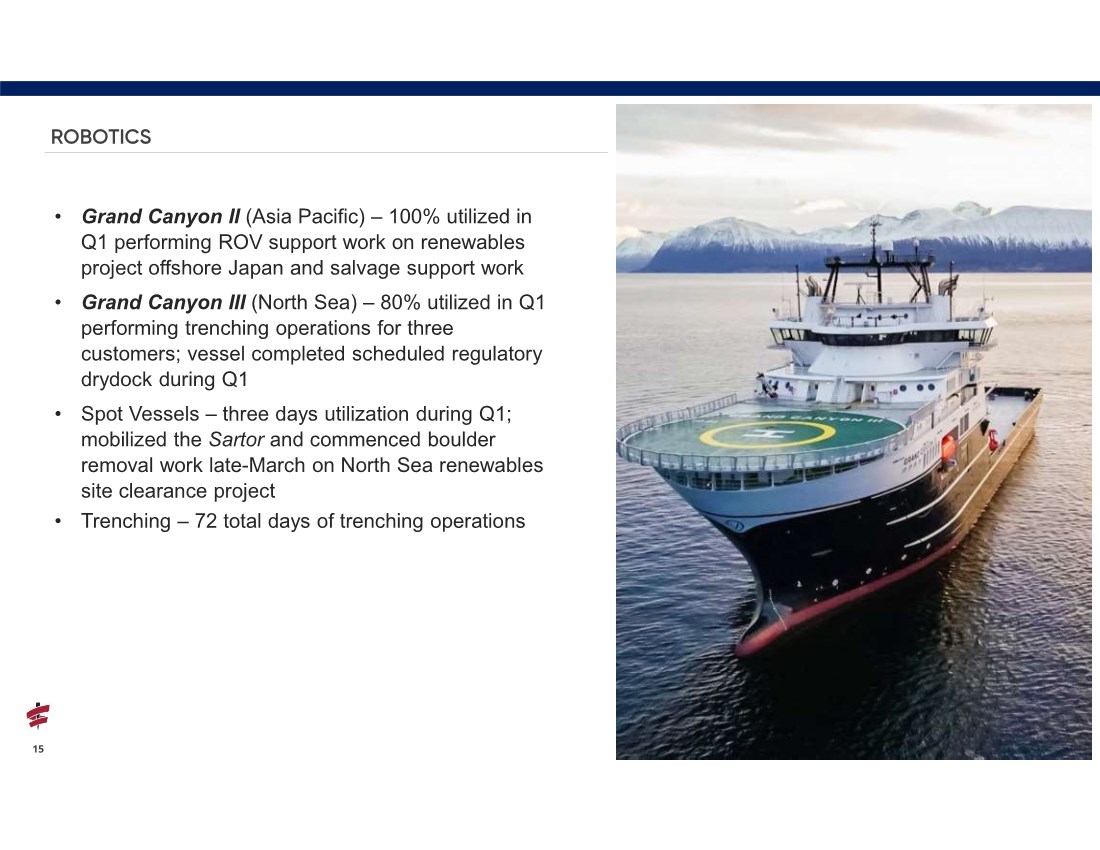
| • Grand Canyon II (Asia Pacific) – 100% utilized in Q1 performing ROV support work on renewables project offshore Japan and salvage support work • Grand Canyon III (North Sea) – 80% utilized in Q1 performing trenching operations for three customers; vessel completed scheduled regulatory drydock during Q1 • Spot Vessels – three days utilization during Q1; mobilized the Sartor and commenced boulder removal work late-March on North Sea renewables site clearance project • Trenching – 72 total days of trenching operations 15 ROBOTICS |
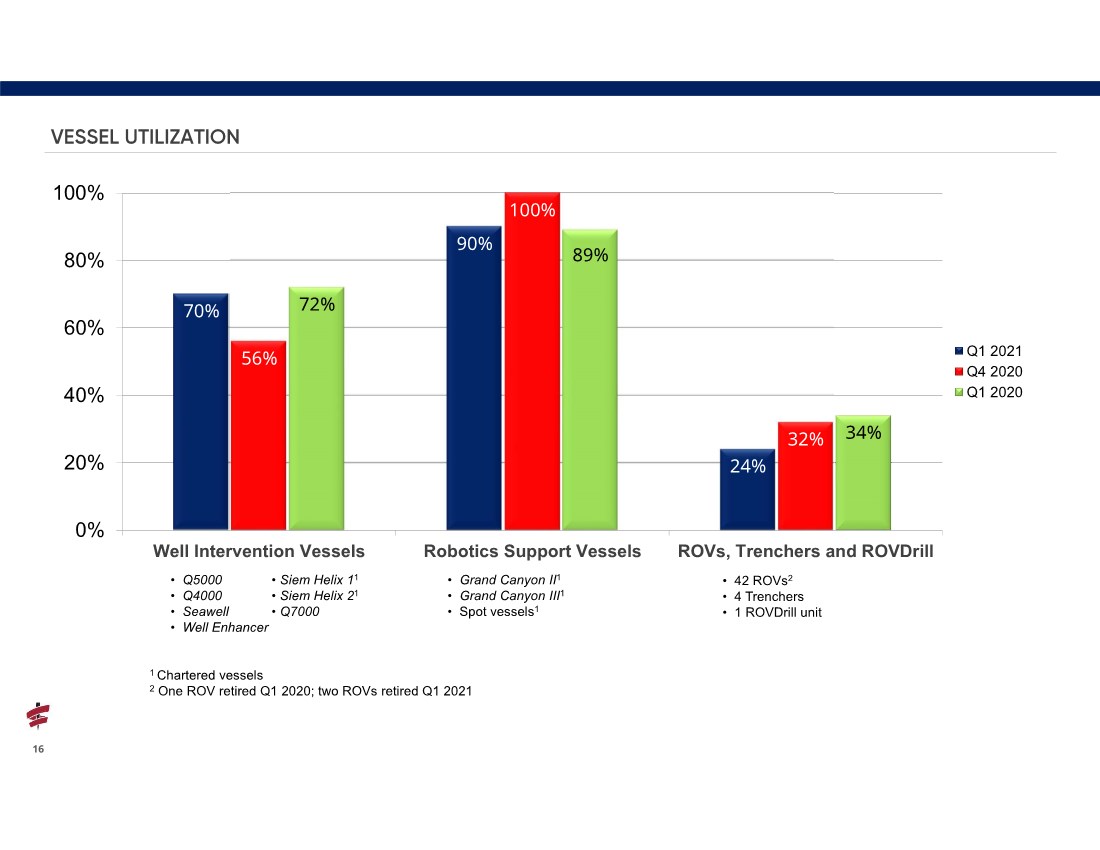
| 16 VESSEL UTILIZATION • Grand Canyon II1 • Grand Canyon III1 • Spot vessels1 • Q5000 • Q4000 • Seawell • Well Enhancer • Siem Helix 11 • Siem Helix 21 • Q7000 • 42 ROVs2 • 4 Trenchers • 1 ROVDrill unit 70% 90% 24% 56% 100% 32% 72% 89% 34% 0% 20% 40% 60% 80% 100% Well Intervention Vessels Robotics Support Vessels ROVs, Trenchers and ROVDrill Q1 2021 Q4 2020 Q1 2020 1 Chartered vessels 2 One ROV retired Q1 2020; two ROVs retired Q1 2021 |
| Key Financial Metrics |

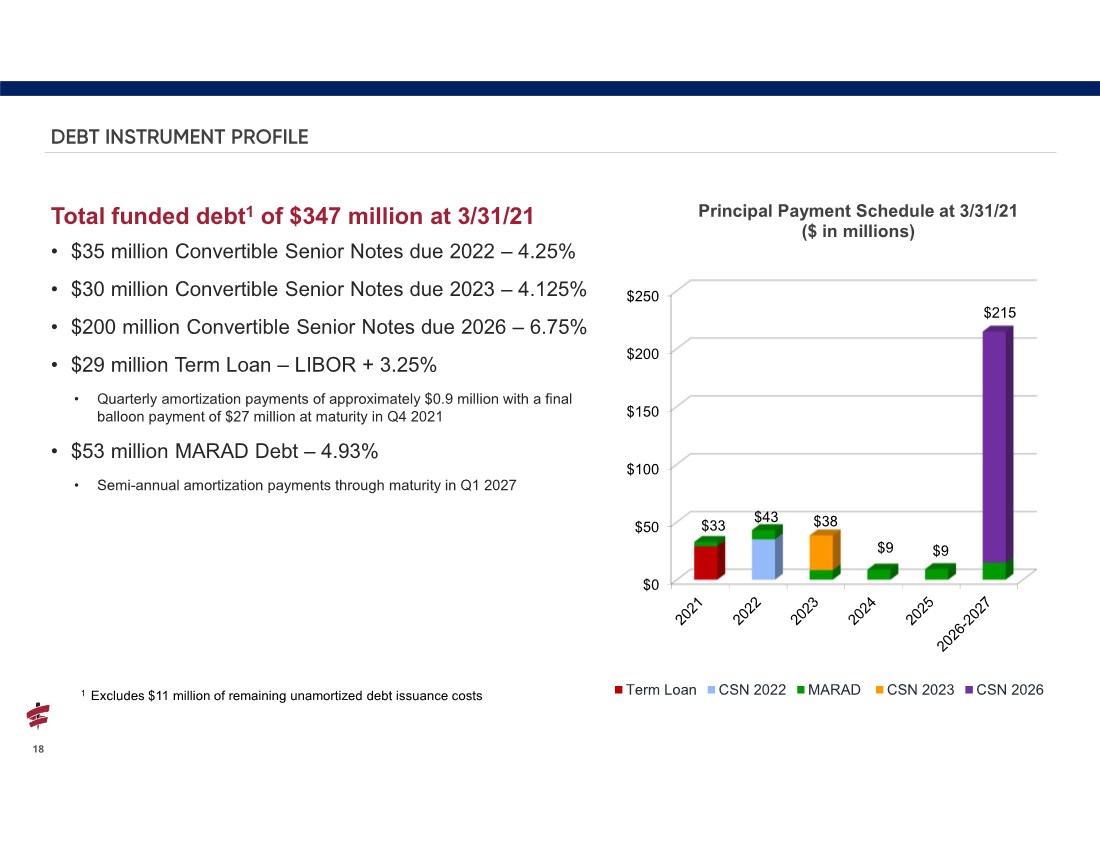
| DEBT INSTRUMENT PROFILE Total funded debt1 of $347 million at 3/31/21 • $35 million Convertible Senior Notes due 2022 – 4.25% • $30 million Convertible Senior Notes due 2023 – 4.125% • $200 million Convertible Senior Notes due 2026 – 6.75% • $29 million Term Loan – LIBOR + 3.25% • Quarterly amortization payments of approximately $0.9 million with a final balloon payment of $27 million at maturity in Q4 2021 • $53 million MARAD Debt – 4.93% • Semi-annual amortization payments through maturity in Q1 2027 $0 $50 $100 $150 $200 $250 $9 $215 Principal Payment Schedule at 3/31/21 ($ in millions) Term Loan CSN 2022 MARAD CSN 2023 CSN 2026 $43 $33 $9 $38 1 Excludes $11 million of remaining unamortized debt issuance costs 18 |
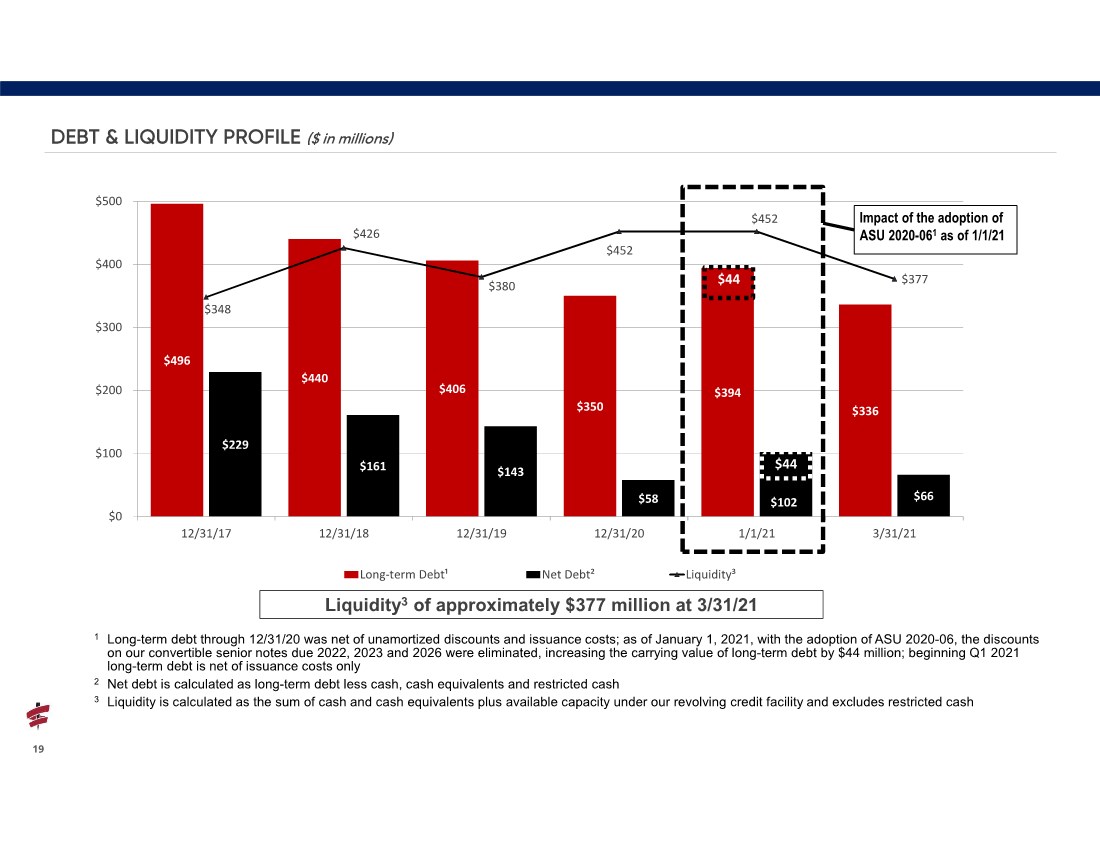
| 19 DEBT & LIQUIDITY PROFILE ($ in millions) $496 $440 $406 $350 $394 $336 $229 $161 $143 $58 $102 $66 $348 $426 $380 $452 $452 $377 $0 $100 $200 $300 $400 $500 12/31/17 12/31/18 12/31/19 12/31/20 1/1/21 3/31/21 Long-term Debt¹ Net Debt² Liquidity³ $44 $44 Impact of the adoption of ASU 2020-061 as of 1/1/21 Liquidity3 of approximately $377 million at 3/31/21 1 Long-term debt through 12/31/20 was net of unamortized discounts and issuance costs; as of January 1, 2021, with the adoption of ASU 2020-06, the discounts on our convertible senior notes due 2022, 2023 and 2026 were eliminated, increasing the carrying value of long-term debt by $44 million; beginning Q1 2021 long-term debt is net of issuance costs only 2 Net debt is calculated as long-term debt less cash, cash equivalents and restricted cash 3 Liquidity is calculated as the sum of cash and cash equivalents plus available capacity under our revolving credit facility and excludes restricted cash |
| 2021 Outlook |
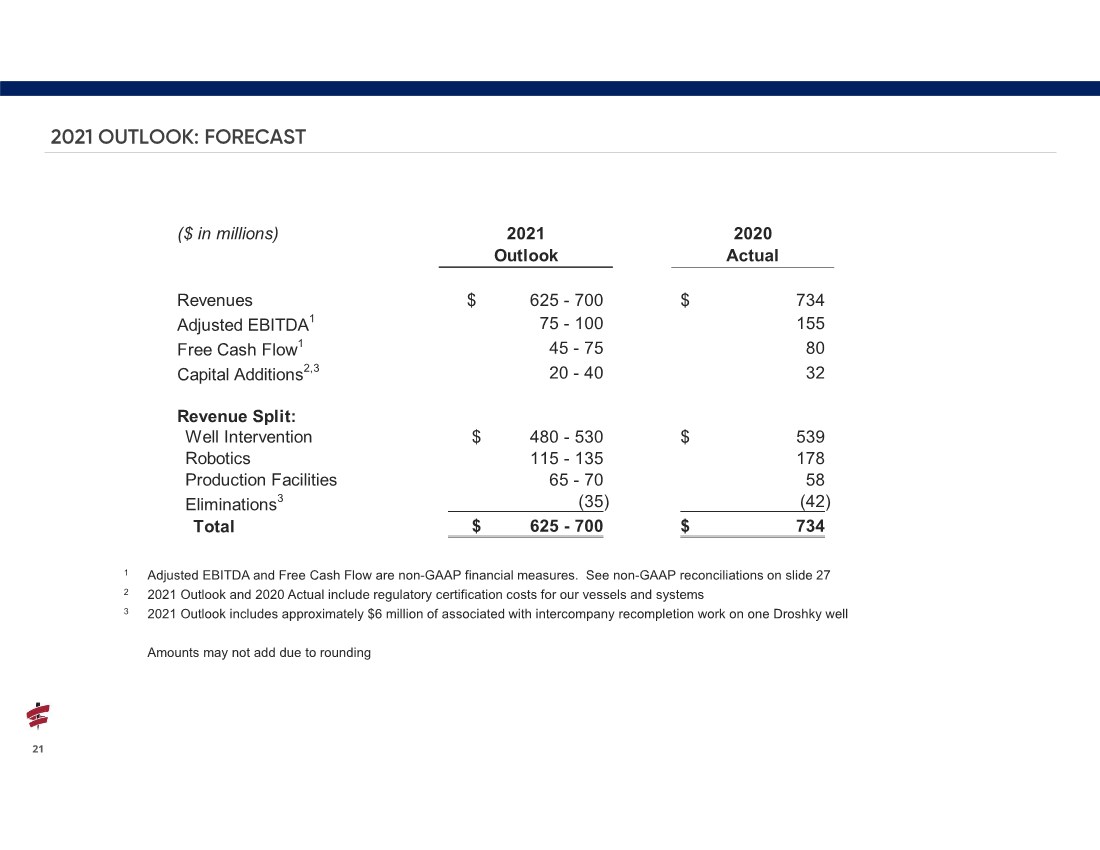
| 21 2021 OUTLOOK: FORECAST ($ in millions) 2021 2020 Outlook Actual Revenues $ 625 - 700 734 $ Adjusted EBITDA1 75 - 100 155 Free Cash Flow1 45 - 75 80 Capital Additions2,3 20 - 40 32 Revenue Split: Well Intervention $ 480 - 530 539 $ Robotics 115 - 135 178 Production Facilities 65 - 70 58 Eliminations3 (35) (42) Total $ 625 - 700 734 $ 1 Adjusted EBITDA and Free Cash Flow are non-GAAP financial measures. See non-GAAP reconciliations on slide 27 2 2021 Outlook and 2020 Actual include regulatory certification costs for our vessels and systems 3 2021 Outlook includes approximately $6 million of associated with intercompany recompletion work on one Droshky well Amounts may not add due to rounding |
| 22 The ongoing COVID pandemic and its effect on the offshore oil and gas market, combined with sector uncertainty relating to regulatory changes by the new U.S. administration, suggests a year that will be more challenging than 2020. Our customers’ spending levels currently remain low, providing even more challenges in a year in which three of our long-term Well Intervention contracts expire. Key expectations / assumptions for 2021 include the following: • Total backlog at March 31, 2021 of approximately $358 million ($162 million for Well Intervention); $239 million expected to be realized during remainder of 2021 • North Sea – prioritizing utilization on the Well Enhancer with targeted opportunities on the Seawell in Q3 • Brazil – 120-day contract extension on the Siem Helix 1 with Petrobras into mid-August at reduced rates; Siem Helix 2 on contract into mid-December • Gulf of Mexico – prioritizing utilization on the Q5000 with expected gaps in schedule on both vessels • Robotics – intermittent renewables work with expected fewer site clearance days and overall weaker ROV market than 2020 2021 OUTLOOK |
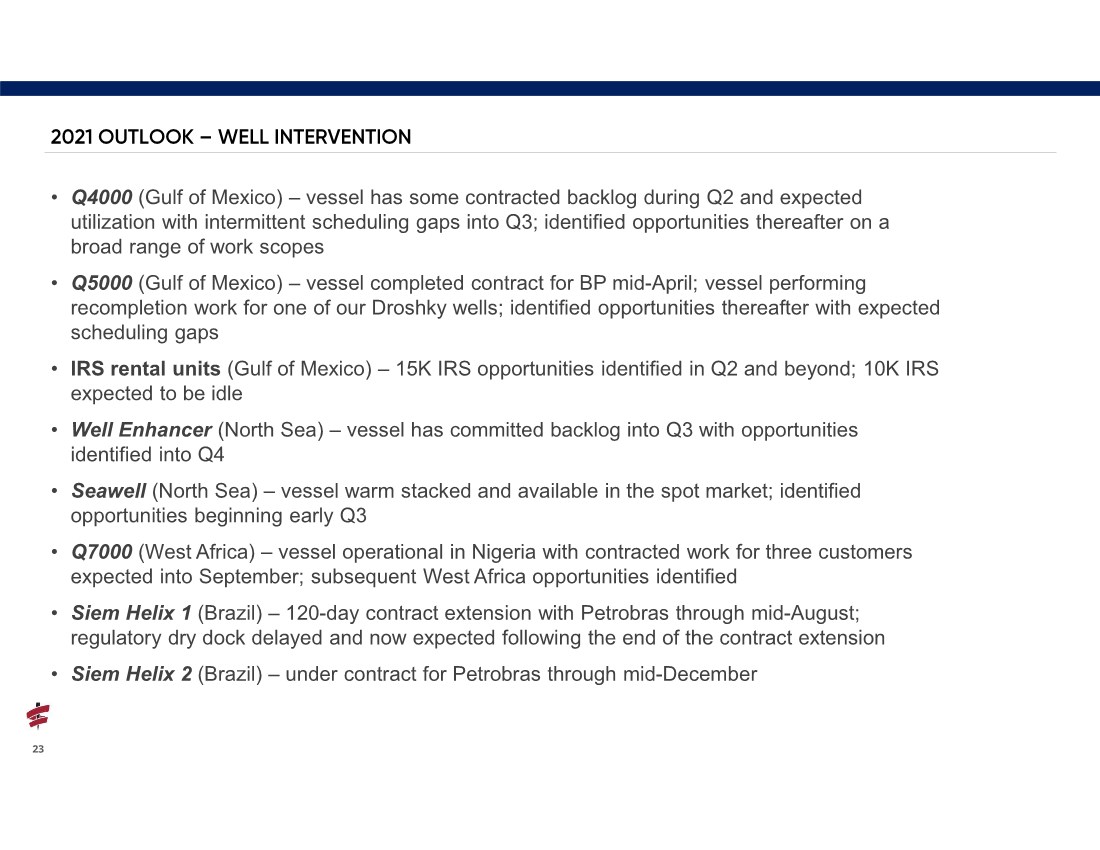
| 23 2021 OUTLOOK – WELL INTERVENTION • Q4000 (Gulf of Mexico) – vessel has some contracted backlog during Q2 and expected utilization with intermittent scheduling gaps into Q3; identified opportunities thereafter on a broad range of work scopes • Q5000 (Gulf of Mexico) – vessel completed contract for BP mid-April; vessel performing recompletion work for one of our Droshky wells; identified opportunities thereafter with expected scheduling gaps • IRS rental units (Gulf of Mexico) – 15K IRS opportunities identified in Q2 and beyond; 10K IRS expected to be idle • Well Enhancer (North Sea) – vessel has committed backlog into Q3 with opportunities identified into Q4 • Seawell (North Sea) – vessel warm stacked and available in the spot market; identified opportunities beginning early Q3 • Q7000 (West Africa) – vessel operational in Nigeria with contracted work for three customers expected into September; subsequent West Africa opportunities identified • Siem Helix 1 (Brazil) – 120-day contract extension with Petrobras through mid-August; regulatory dry dock delayed and now expected following the end of the contract extension • Siem Helix 2 (Brazil) – under contract for Petrobras through mid-December |
| 24 • Grand Canyon II (Asia Pacific) – vessel performing various work scopes including ROV support work for renewable project offshore Taiwan expected late April through early May; identified subsequent projects currently being evaluated; strong utilization expected in Asia Pacific region for the remainder of 2021 • Grand Canyon III (North Sea) – vessel expected to perform trenching work in the North Sea through Q3 with good utilization expected during the remainder of 2021 • Renewables site clearance – follow-on site clearance work on North Sea wind farm (boulder removal) utilizing one vessel of opportunity commenced early Q2 and expected to continue into Q3 2021 OUTLOOK - ROBOTICS |
| 25 2021 Capital additions are currently forecasted at $20-$40 million, consisting of the following: • Maintenance Capex – $15-30 million related to regulatory inspection costs of our systems and equipment and other maintenance capital • Recompletion Capex – $5-10 million of recompletion costs on one of our Droshky wells • Capital additions during Q1 approximated $2 million Balance Sheet • Our total funded debt1 level is expected to decrease by $33 million (from $347 million at March 31, 2021 to $314 million at December 31, 2021) as a result of scheduled principal payments • Credit Facility expiration and $29 million Term Loan maturity date December 31, 2021 • Tax refunds related to the CARES Act of $12 million expected during 2021 ($7 million collected during Q1 2021) 2021 OUTLOOK: CAPITAL ADDITIONS & BALANCE SHEET 1 Excludes unamortized issuance costs |
| Non-GAAP Reconciliations |
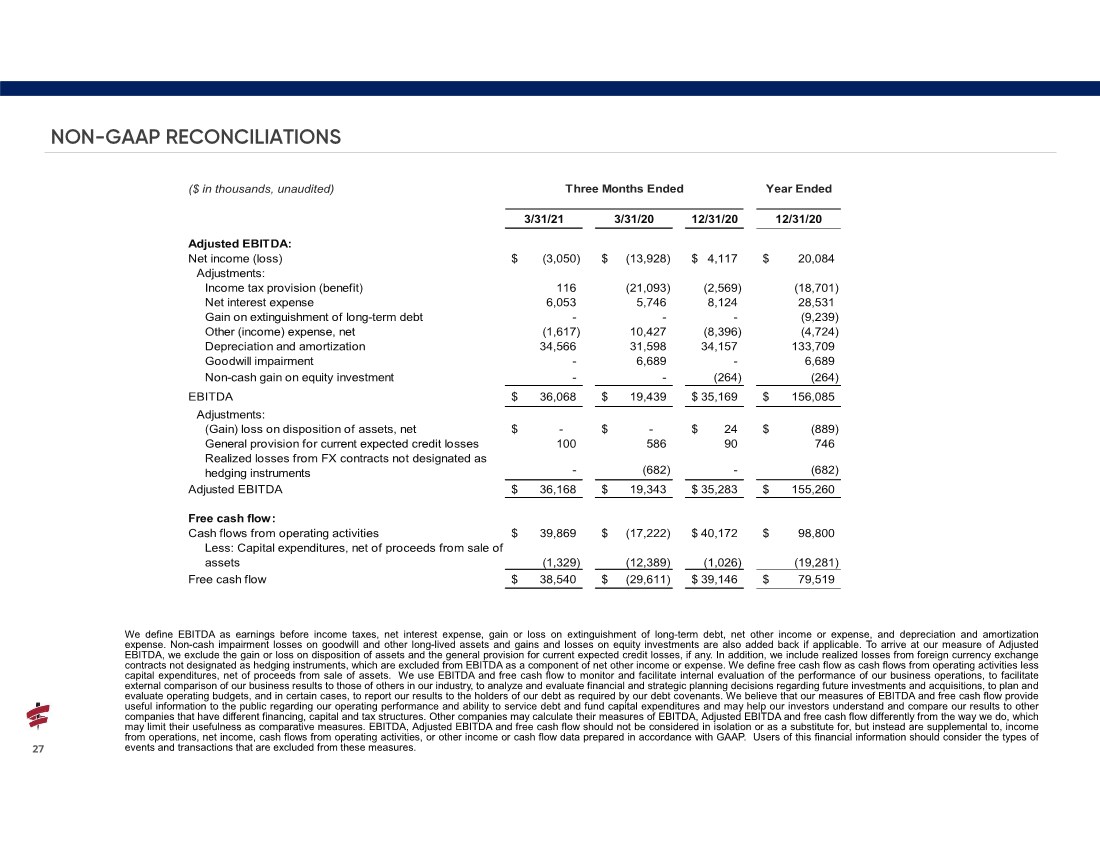
| 27 NON-GAAP RECONCILIATIONS ($ in thousands, unaudited) Three Months Ended 3/31/21 3/31/20 12/31/20 12/31/20 Adjusted EBITDA: Net income (loss) (3,050) $ (13,928) $ 4,117 $ 20,084 $ Adjustments: Income tax provision (benefit) 116 (21,093) (2,569) (18,701) Net interest expense 6,053 5,746 8,124 28,531 Gain on extinguishment of long-term debt - - - (9,239) Other (income) expense, net (1,617) 10,427 (8,396) (4,724) Depreciation and amortization 34,566 31,598 34,157 133,709 Goodwill impairment - 6,689 - 6,689 Non-cash gain on equity investment - - (264) (264) EBITDA 36,068 $ 19,439 $ 35,169 $ 156,085 $ Adjustments: (Gain) loss on disposition of assets, net - $ - $ 24 $ (889) $ General provision for current expected credit losses 100 586 90 746 Realized losses from FX contracts not designated as hedging instruments - (682) - (682) Adjusted EBITDA 36,168 $ 19,343 $ 35,283 $ 155,260 $ Free cash flow: Cash flows from operating activities 39,869 $ (17,222) $ 40,172 $ 98,800 $ Less: Capital expenditures, net of proceeds from sale of assets (1,329) (12,389) (1,026) (19,281) Free cash flow 38,540 $ (29,611) $ 39,146 $ 79,519 $ Year Ended We define EBITDA as earnings before income taxes, net interest expense, gain or loss on extinguishment of long-term debt, net other income or expense, and depreciation and amortization expense. Non-cash impairment losses on goodwill and other long-lived assets and gains and losses on equity investments are also added back if applicable. To arrive at our measure of Adjusted EBITDA, we exclude the gain or loss on disposition of assets and the general provision for current expected credit losses, if any. In addition, we include realized losses from foreign currency exchange contracts not designated as hedging instruments, which are excluded from EBITDA as a component of net other income or expense. We define free cash flow as cash flows from operating activities less capital expenditures, net of proceeds from sale of assets. We use EBITDA and free cash flow to monitor and facilitate internal evaluation of the performance of our business operations, to facilitate external comparison of our business results to those of others in our industry, to analyze and evaluate financial and strategic planning decisions regarding future investments and acquisitions, to plan and evaluate operating budgets, and in certain cases, to report our results to the holders of our debt as required by our debt covenants. We believe that our measures of EBITDA and free cash flow provide useful information to the public regarding our operating performance and ability to service debt and fund capital expenditures and may help our investors understand and compare our results to other companies that have different financing, capital and tax structures. Other companies may calculate their measures of EBITDA, Adjusted EBITDA and free cash flow differently from the way we do, which may limit their usefulness as comparative measures. EBITDA, Adjusted EBITDA and free cash flow should not be considered in isolation or as a substitute for, but instead are supplemental to, income from operations, net income, cash flows from operating activities, or other income or cash flow data prepared in accordance with GAAP. Users of this financial information should consider the types of events and transactions that are excluded from these measures. |
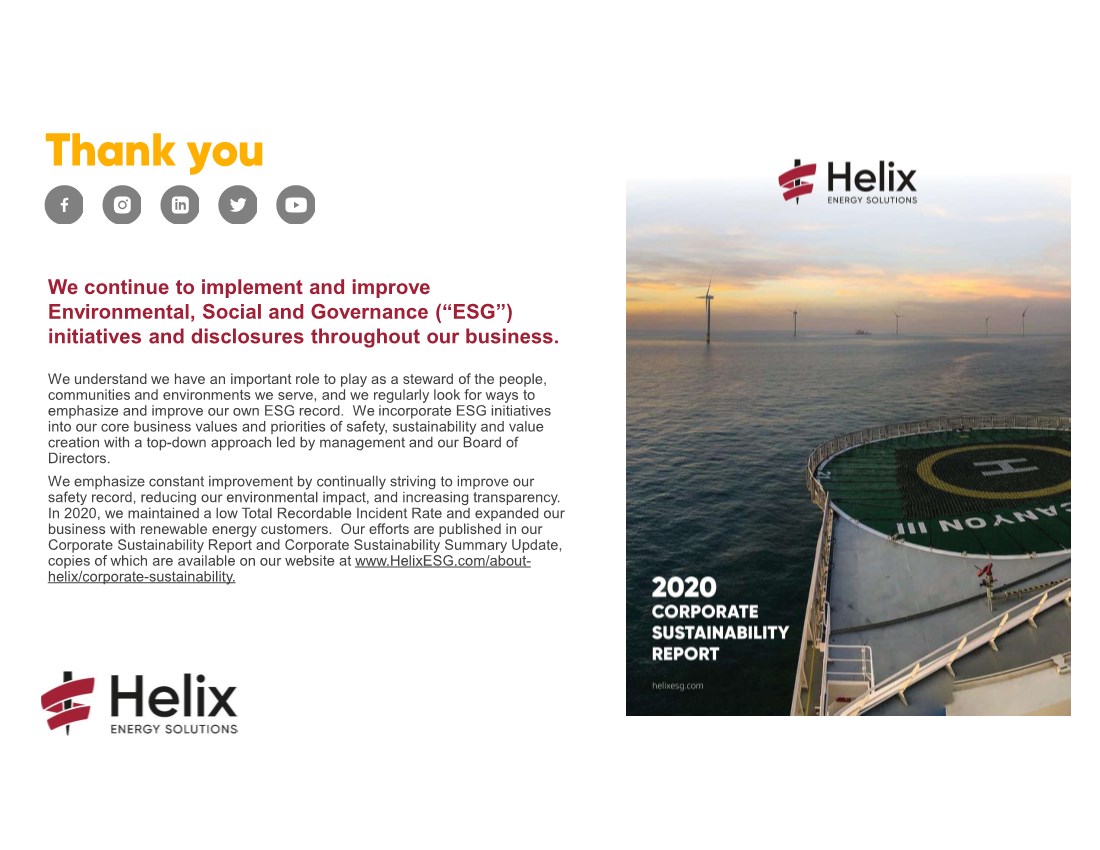
| We continue to implement and improve Environmental, Social and Governance (“ESG”) initiatives and disclosures throughout our business. We understand we have an important role to play as a steward of the people, communities and environments we serve, and we regularly look for ways to emphasize and improve our own ESG record. We incorporate ESG initiatives into our core business values and priorities of safety, sustainability and value creation with a top-down approach led by management and our Board of Directors. We emphasize constant improvement by continually striving to improve our safety record, reducing our environmental impact, and increasing transparency. In 2020, we maintained a low Total Recordable Incident Rate and expanded our business with renewable energy customers. Our efforts are published in our Corporate Sustainability Report and Corporate Sustainability Summary Update, copies of which are available on our website at www.HelixESG.com/about- helix/corporate-sustainability. Thank you |