Attached files
| file | filename |
|---|---|
| 8-K - 2021 SHAREHOLDERS' PRESENTATION 8-K - COMMUNITY TRUST BANCORP INC /KY/ | ctbi2021sharepres8k.htm |
Exhibit 99.1

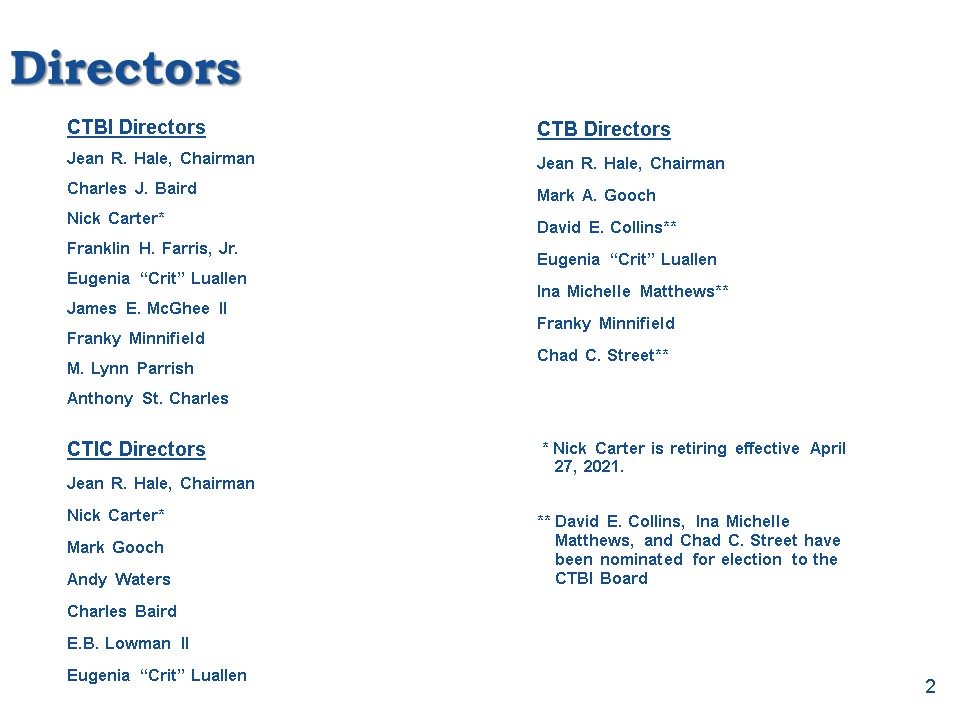
Directors CTBI DirectorsJean R. Hale, ChairmanCharles J. BairdNick Carter*Franklin H. Farris, Jr.Eugenia
“Crit” LuallenJames E. McGhee IIFranky MinnifieldM. Lynn ParrishAnthony St. Charles 2 CTB DirectorsJean R. Hale, ChairmanMark A. GoochDavid E. Collins**Eugenia “Crit” Luallen Ina Michelle Matthews**Franky Minnifield Chad C. Street** CTIC
DirectorsJean R. Hale, ChairmanNick Carter*Mark GoochAndy WatersCharles BairdE.B. Lowman IIEugenia “Crit” Luallen * Nick Carter is retiring effective April 27, 2021.** David E. Collins, Ina Michelle Matthews, and Chad C. Street have been
nominated for election to the CTBI Board
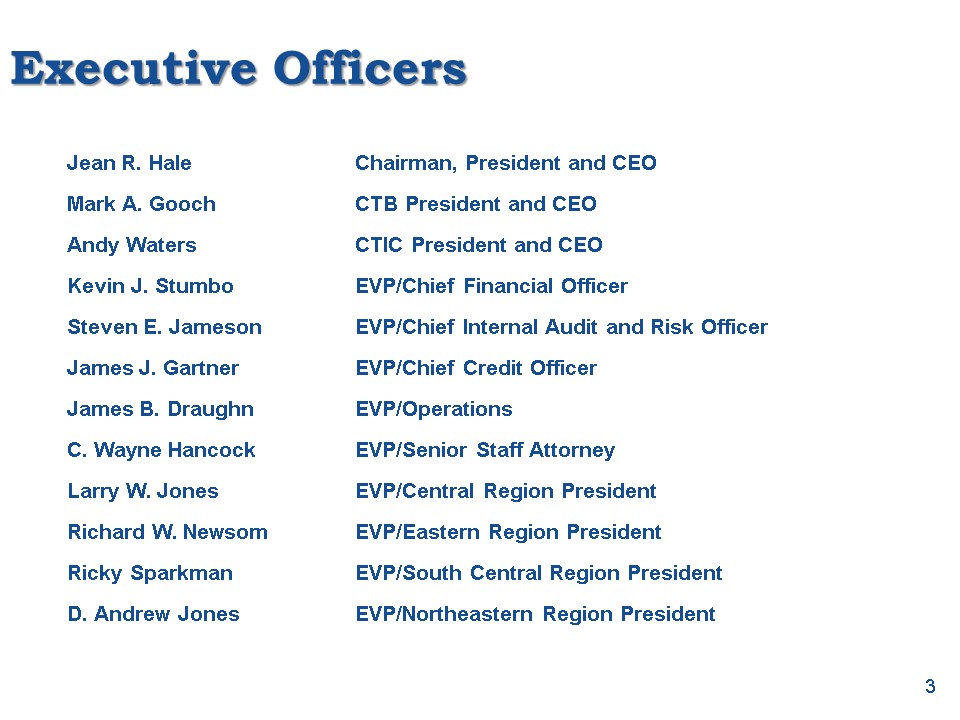
Executive Officers 3 Jean R. Hale Chairman, President and CEOMark A. Gooch CTB President and CEOAndy
Waters CTIC President and CEOKevin J. Stumbo EVP/Chief Financial OfficerSteven E. Jameson EVP/Chief Internal Audit and Risk OfficerJames J. Gartner EVP/Chief Credit OfficerJames B. Draughn EVP/OperationsC. Wayne Hancock EVP/Senior Staff
AttorneyLarry W. Jones EVP/Central Region PresidentRichard W. Newsom EVP/Eastern Region PresidentRicky Sparkman EVP/South Central Region PresidentD. Andrew Jones EVP/Northeastern Region President
Cautionary Statement Information provided herein by CTBI contains “forward-looking” information. CTBI
cautions that any forward-looking statements made are not guarantees of future performance and that actual results may differ materially from those in the forward-looking statements. Please refer to CTBI’s 2020 Annual Report on Form 10-K,
Cautionary Statement Regarding Forward Looking Statements for additional information. 4
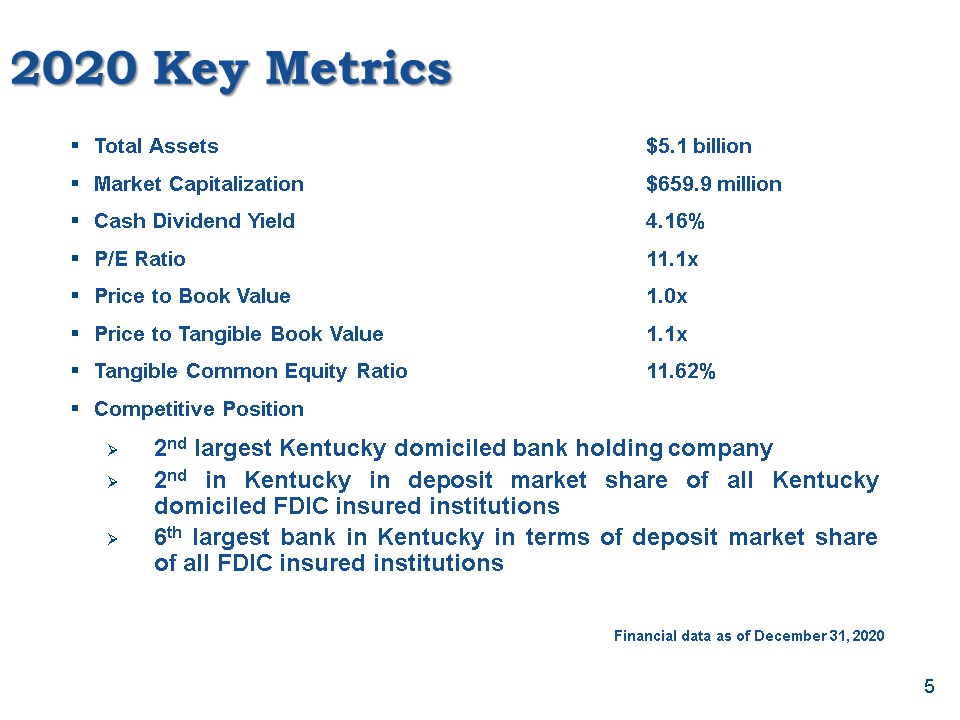
2020 Key Metrics Total Assets $5.1 billionMarket Capitalization $659.9 millionCash Dividend Yield
4.16%P/E Ratio 11.1xPrice to Book Value 1.0xPrice to Tangible Book Value 1.1xTangible Common Equity Ratio 11.62%Competitive Position2nd largest Kentucky domiciled bank holding company 2nd in Kentucky in deposit market share of all Kentucky
domiciled FDIC insured institutions 6th largest bank in Kentucky in terms of deposit market share of all FDIC insured institutions Financial data as of December 31, 2020 5
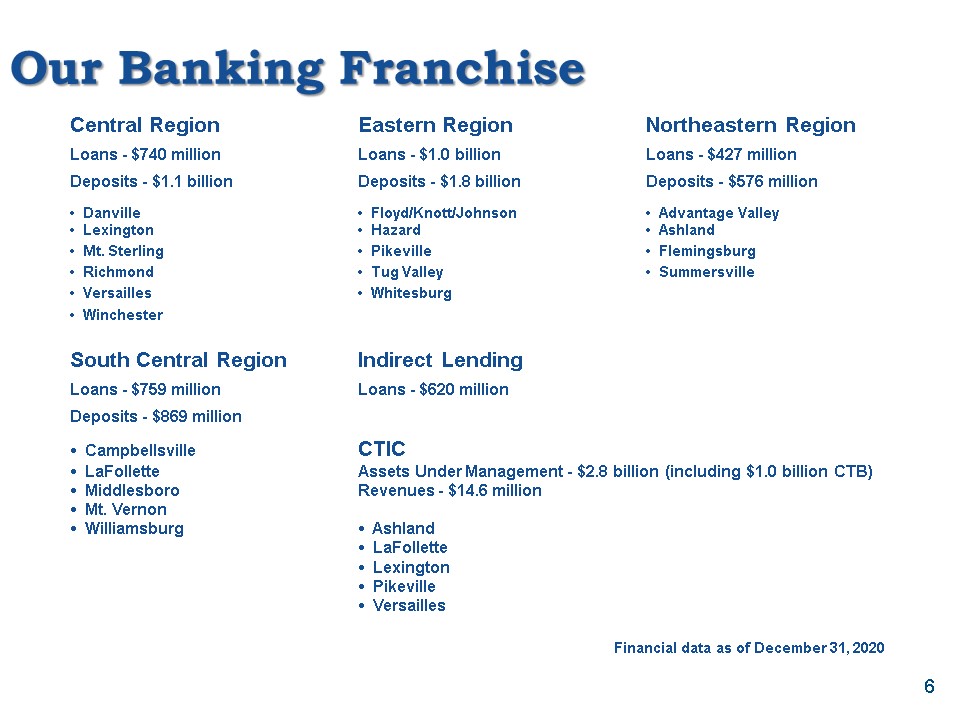
Our Banking Franchise Central Region Eastern Region Northeastern RegionLoans - $740 million Loans - $1.0
billion Loans - $427 millionDeposits - $1.1 billion Deposits - $1.8 billion Deposits - $576 million• Danville • Floyd/Knott/Johnson • Advantage Valley• Lexington • Hazard • Ashland• Mt. Sterling • Pikeville • Flemingsburg• Richmond • Tug Valley
• Summersville• Versailles • Whitesburg• WinchesterSouth Central Region Indirect LendingLoans - $759 million Loans - $620 million Deposits - $869 million• Campbellsville CTIC• LaFollette Assets Under Management - $2.8 billion (including $1.0
billion CTB)• Middlesboro Revenues - $14.6 million• Mt. Vernon • Williamsburg • Ashland • LaFollette • Lexington • Pikeville • Versailles Financial data as of December 31, 2020 6
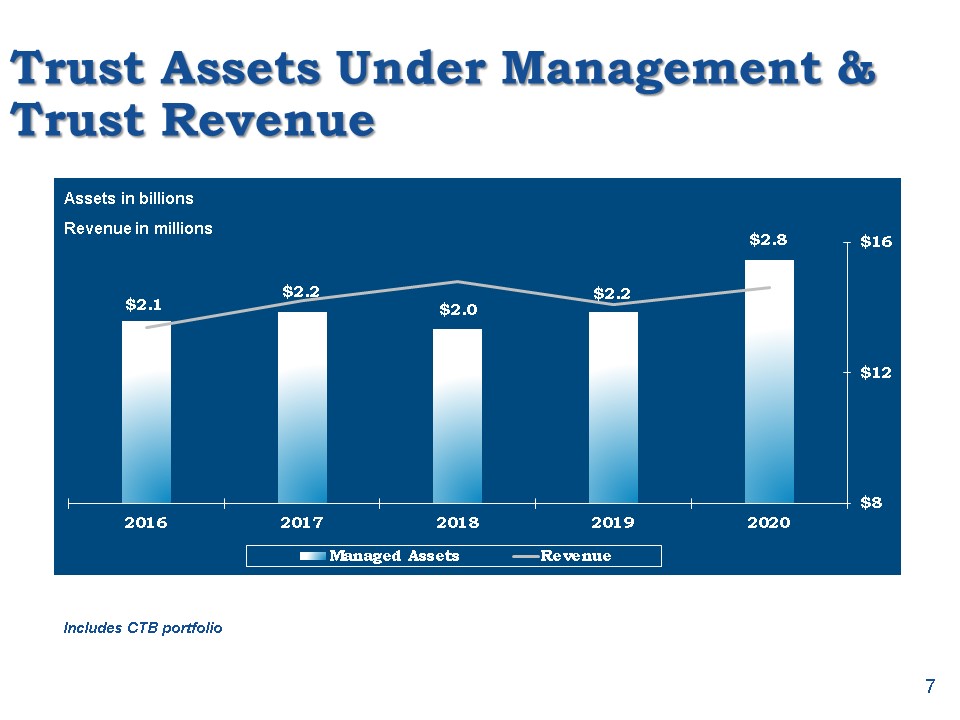
Trust Assets Under Management & Trust Revenue Includes CTB portfolio Assets in billionsRevenue in
millions 7
2020 Performance
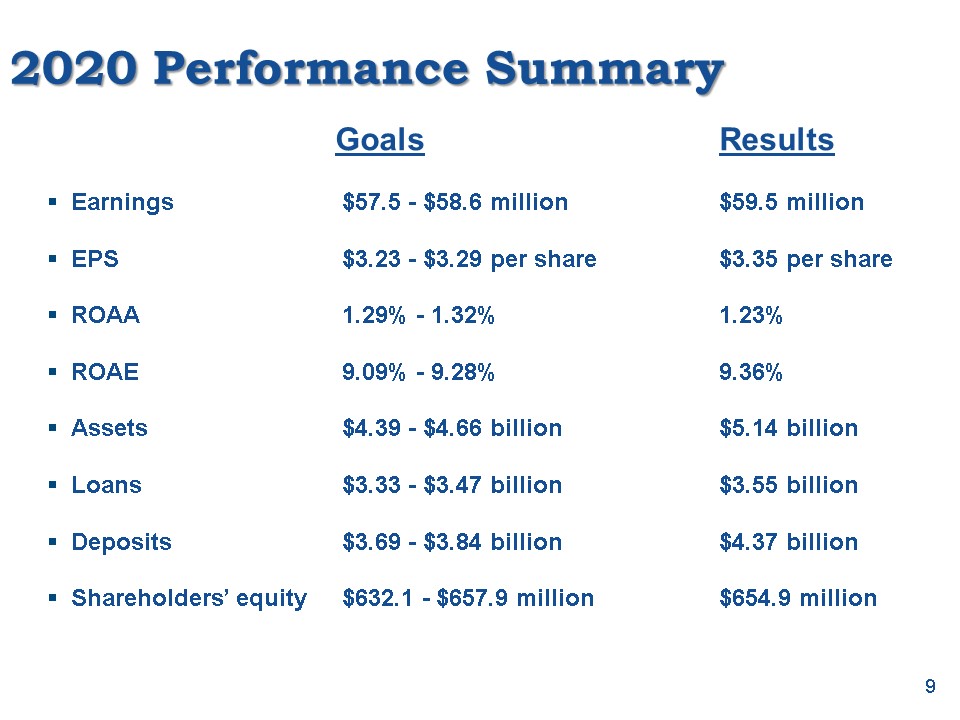
2020 Performance Summary Goals ResultsEarnings $57.5 - $58.6 million $59.5 millionEPS $3.23 - $3.29 per
share $3.35 per shareROAA 1.29% - 1.32% 1.23%ROAE 9.09% - 9.28% 9.36%Assets $4.39 - $4.66 billion $5.14 billionLoans $3.33 - $3.47 billion $3.55 billionDeposits $3.69 - $3.84 billion $4.37 billionShareholders’ equity $632.1 - $657.9 million
$654.9 million 9
Shareholder Value
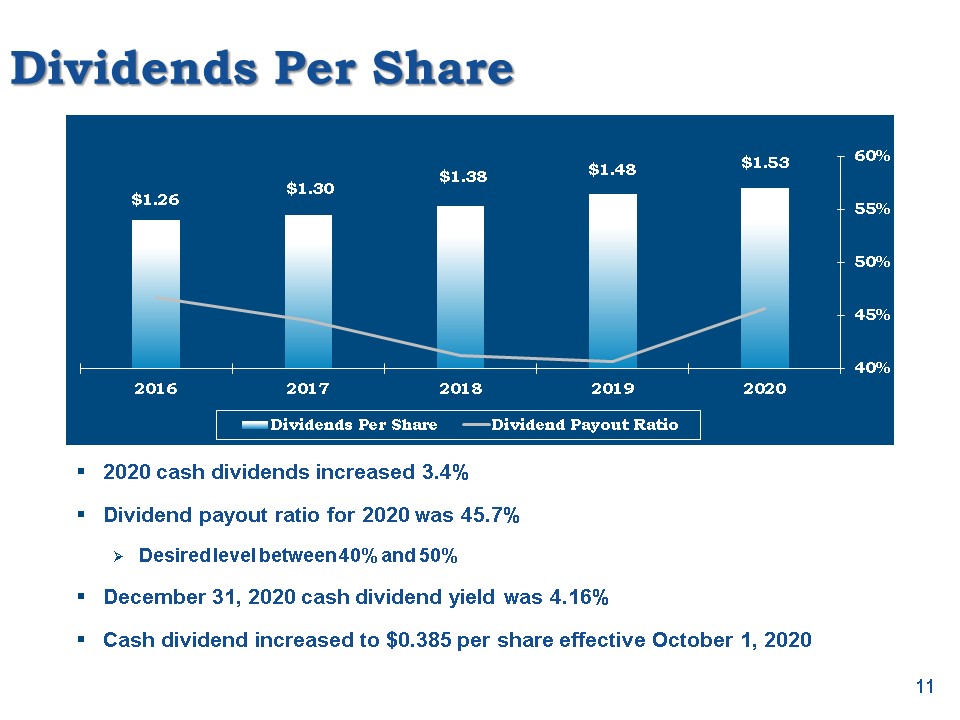
Dividends Per Share 2020 cash dividends increased 3.4%Dividend payout ratio for 2020 was 45.7%Desired
level between 40% and 50%December 31, 2020 cash dividend yield was 4.16%Cash dividend increased to $0.385 per share effective October 1, 2020 11
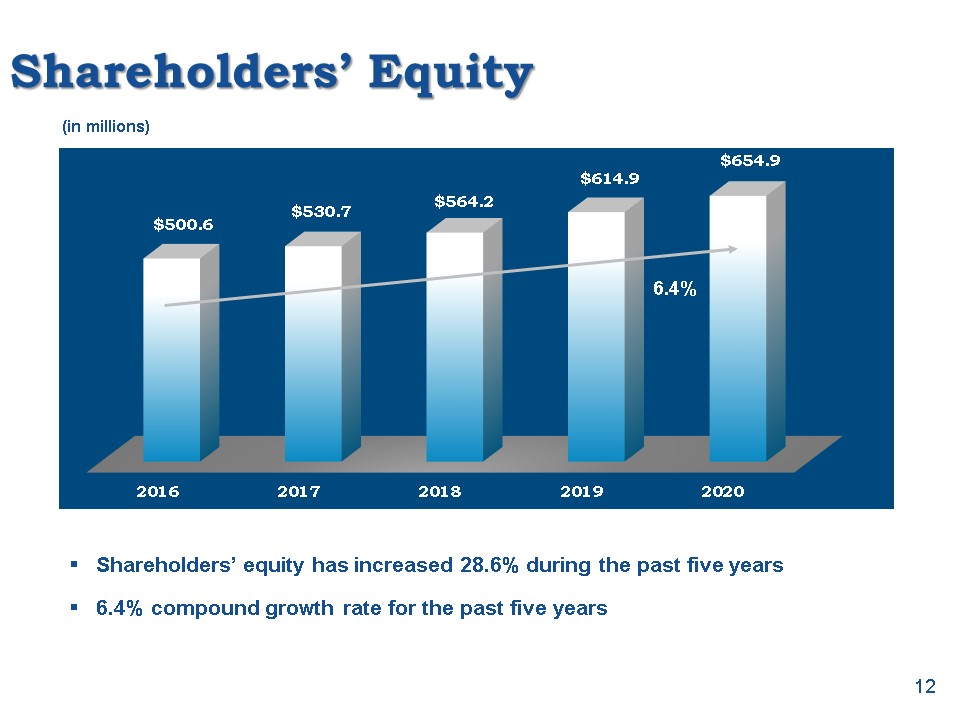
Shareholders’ Equity Shareholders’ equity has increased 28.6% during the past five years6.4% compound
growth rate for the past five years (in millions) 12 6.4%
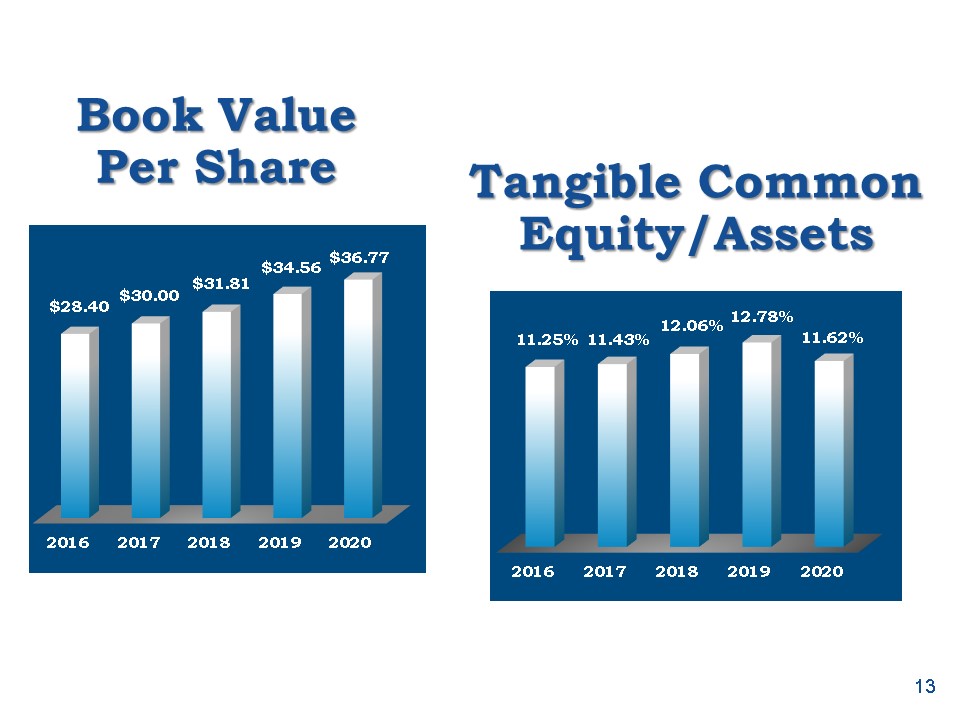
Book Value Per Share Tangible Common Equity/Assets 13
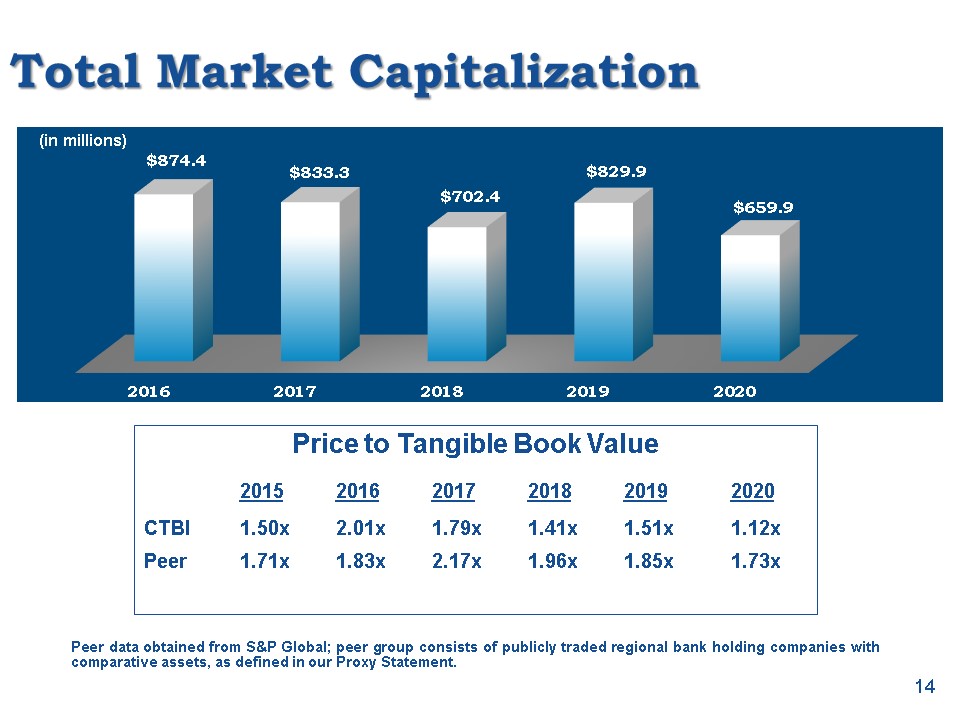
Total Market Capitalization Peer data obtained from S&P Global; peer group consists of publicly
traded regional bank holding companies with comparative assets, as defined in our Proxy Statement. (in millions) 14 Price to Tangible Book Value 2015 2016 2017 2018 2019 2020CTBI 1.50x 2.01x 1.79x 1.41x 1.51x 1.12xPeer 1.71x 1.83x 2.17x
1.96x 1.85x 1.73x
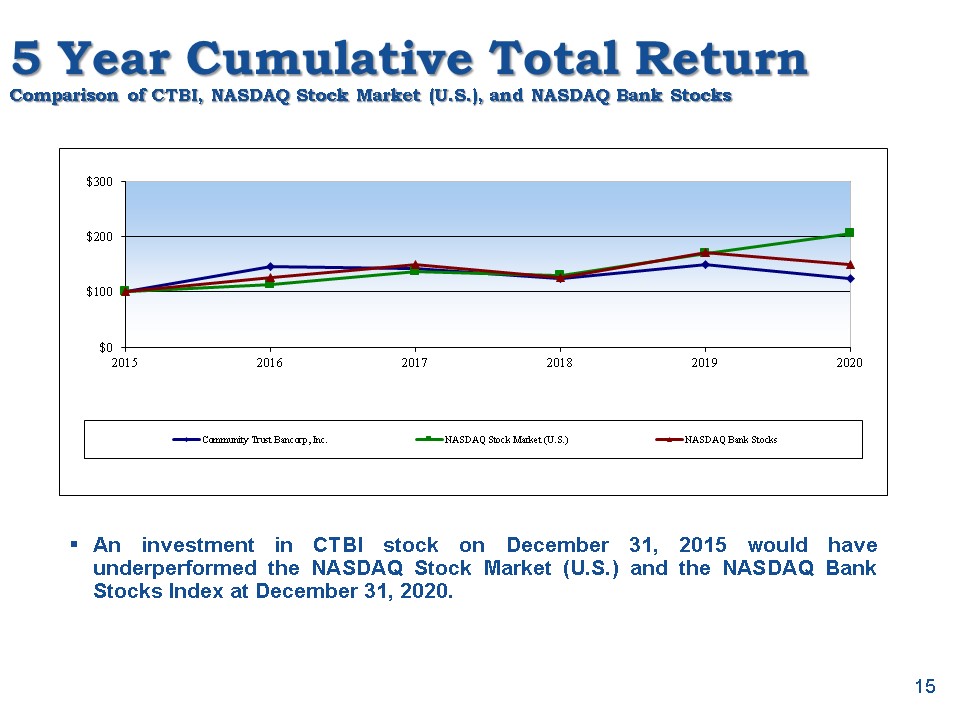
5 Year Cumulative Total ReturnComparison of CTBI, NASDAQ Stock Market (U.S.), and NASDAQ Bank Stocks An
investment in CTBI stock on December 31, 2015 would have underperformed the NASDAQ Stock Market (U.S.) and the NASDAQ Bank Stocks Index at December 31, 2020. 15
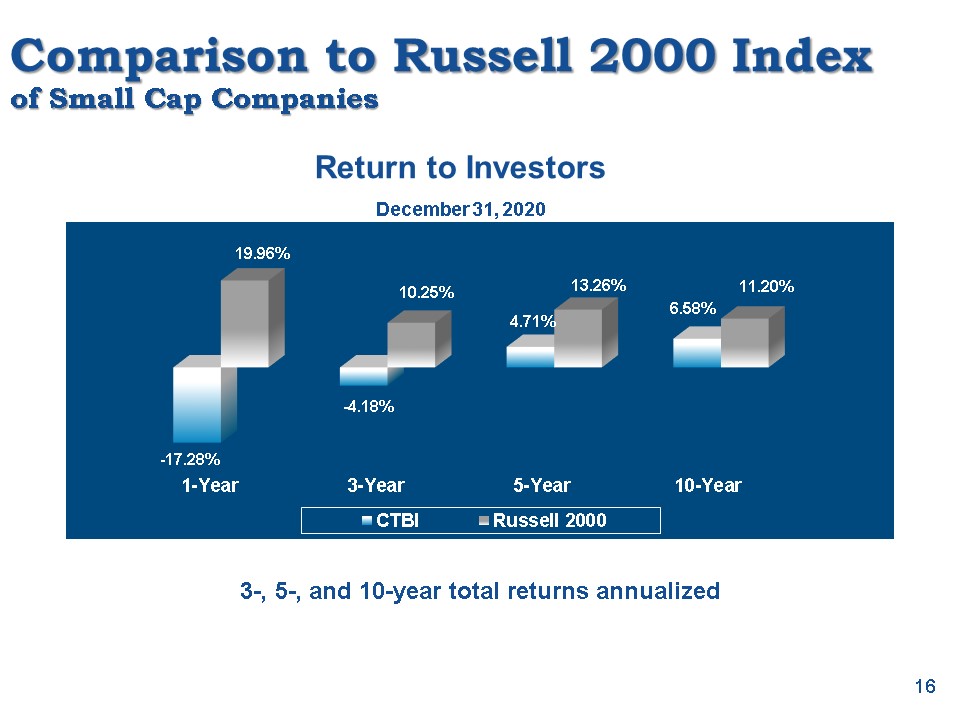
Comparison to Russell 2000 Indexof Small Cap Companies 3-, 5-, and 10-year total returns
annualized Return to Investors 16 December 31, 2020
Core Value Long-Term Investment 12 stock splits and 10 stock dividends40 years of consecutive increases
in cash dividends5-year compound growth rate of cash dividends 4.7%Stock included in the NASDAQ Global Select Market, NASDAQ Dividend Achievers Index, and NASDAQ Bank Stock IndexCTBI shareholders include186 institutional investors (including
CTIC – 10.16%) hold 10.5 million shares (55.3%)309 mutual funds hold 5.1 million shares (28.6%) Data as of December 31, 2020 17
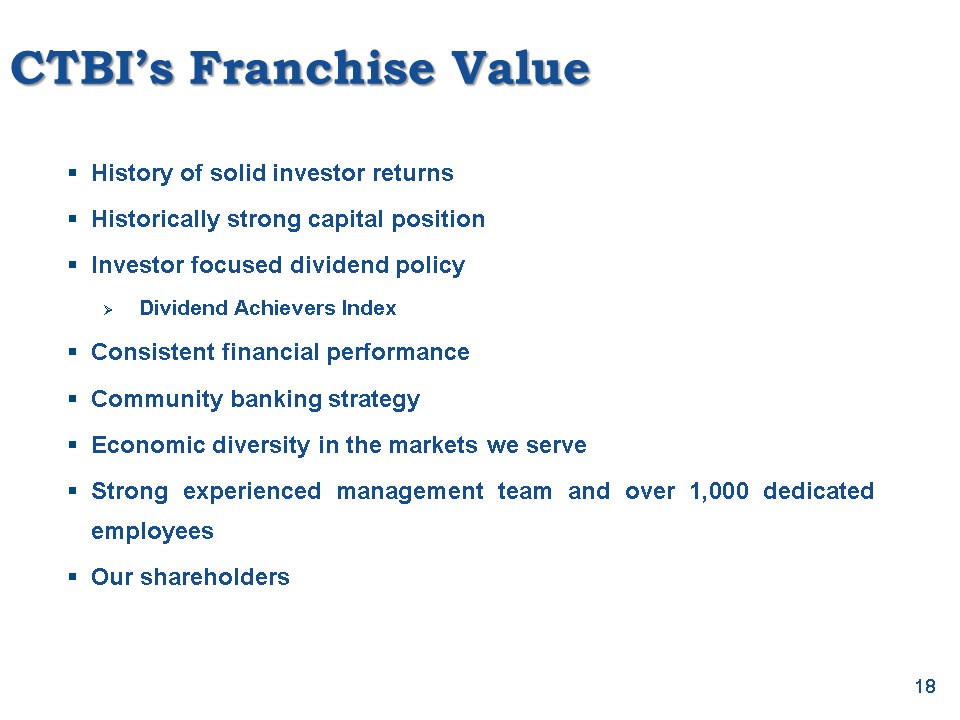
CTBI’s Franchise Value History of solid investor returnsHistorically strong capital positionInvestor
focused dividend policyDividend Achievers IndexConsistent financial performanceCommunity banking strategyEconomic diversity in the markets we serveStrong experienced management team and over 1,000 dedicated employeesOur shareholders 18
Earnings Review
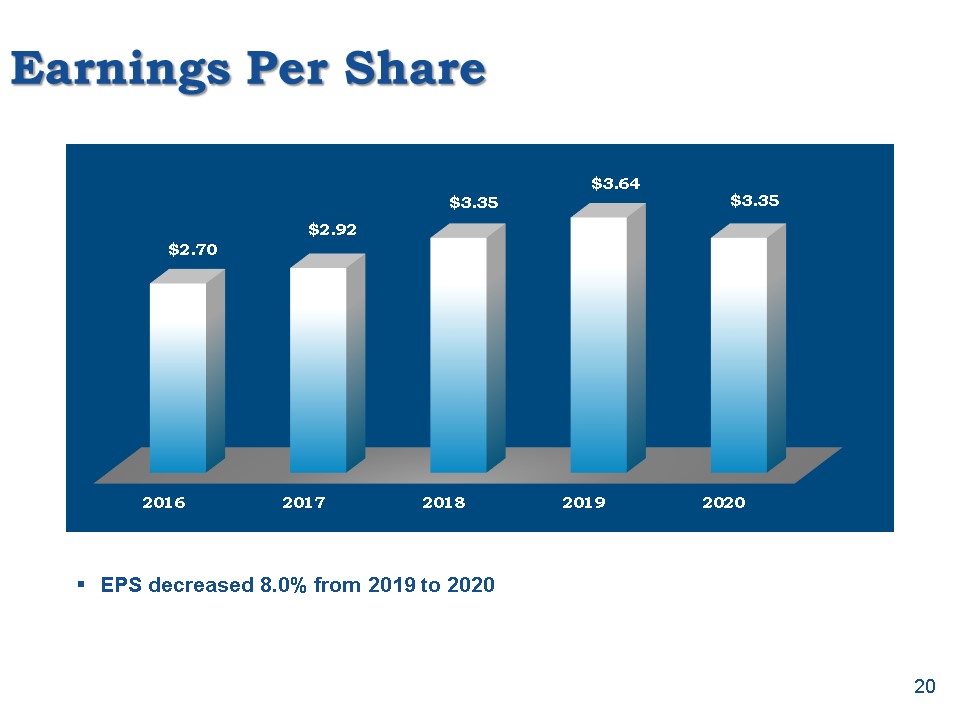
Earnings Per Share EPS decreased 8.0% from 2019 to 2020 20
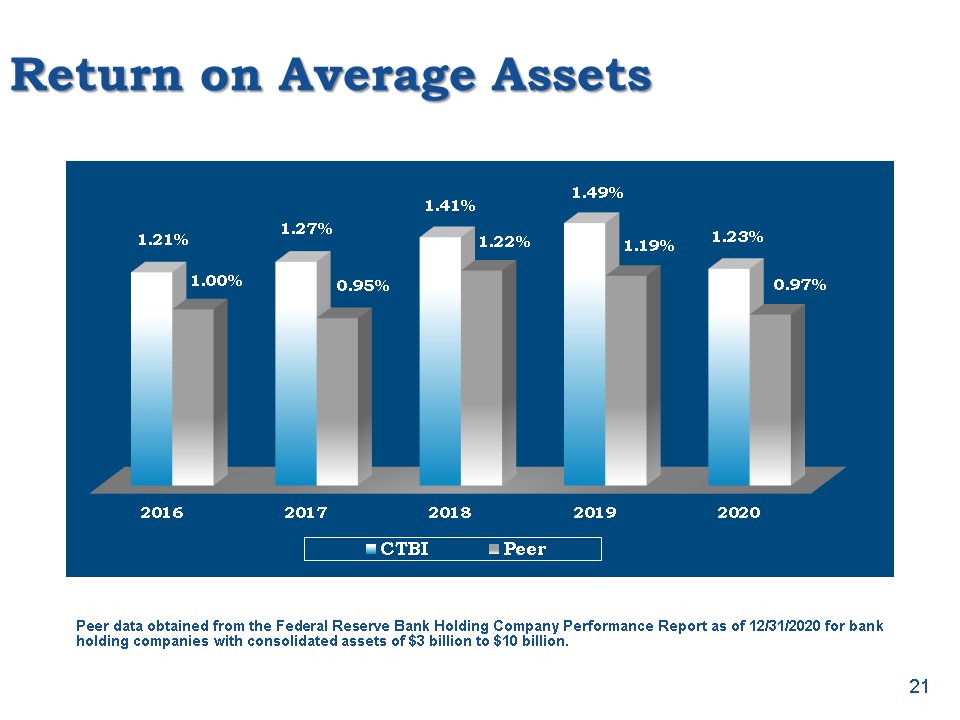
Return on Average Assets Peer data obtained from the Federal Reserve Bank Holding Company Performance
Report as of 12/31/2020 for bank holding companies with consolidated assets of $3 billion to $10 billion. 21
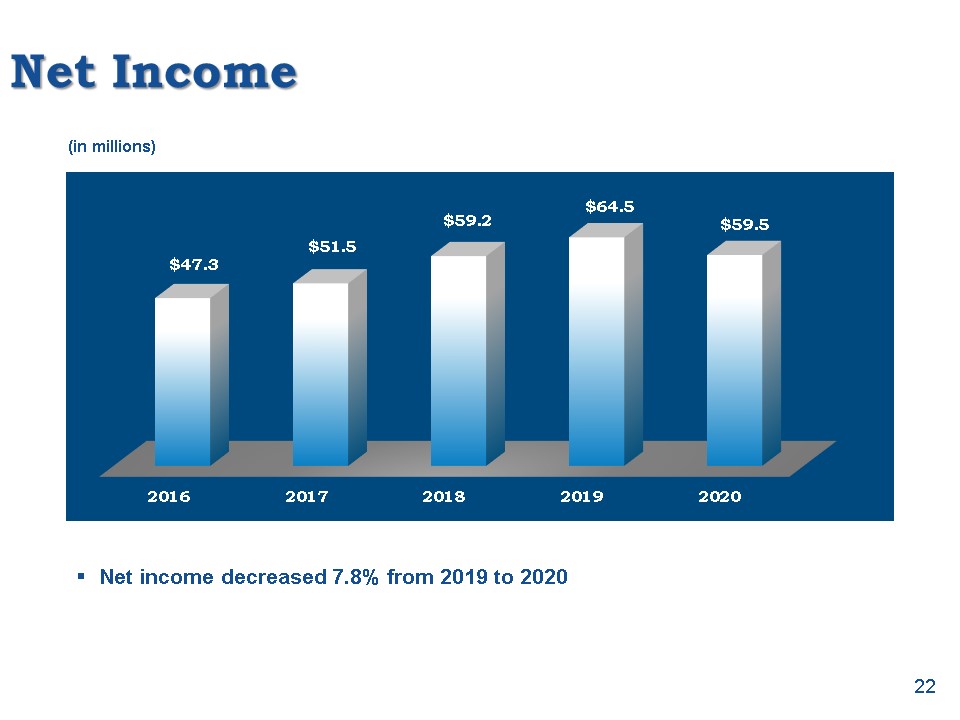
Net Income Net income decreased 7.8% from 2019 to 2020 (in millions) 22
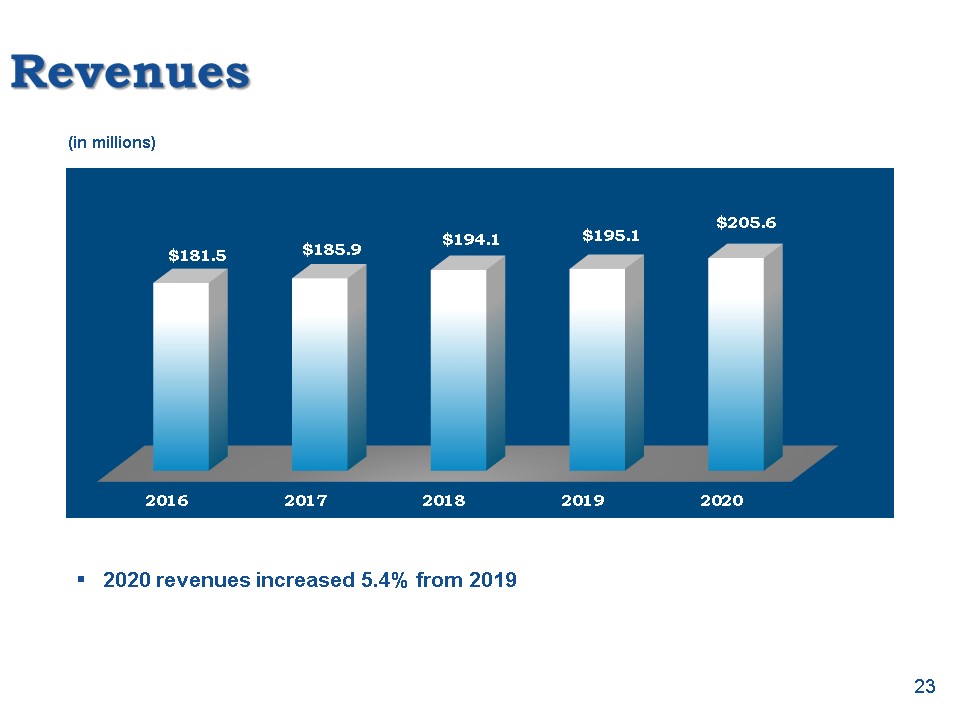
Revenues 2020 revenues increased 5.4% from 2019 (in millions) 23
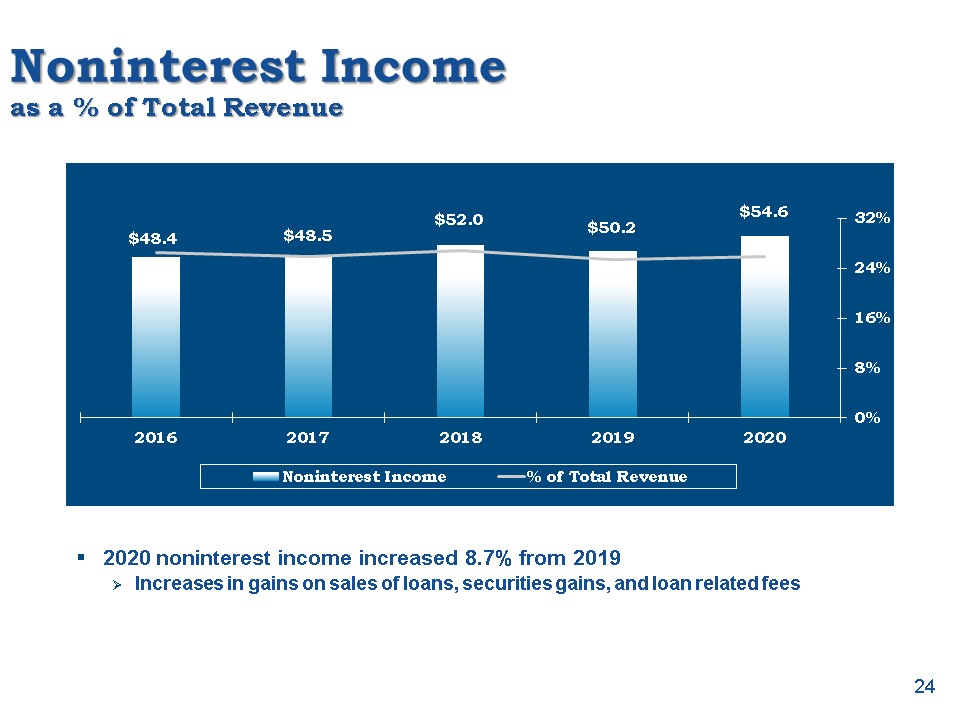
Noninterest Incomeas a % of Total Revenue 2020 noninterest income increased 8.7% from 2019Increases in
gains on sales of loans, securities gains, and loan related fees (in millions) 24
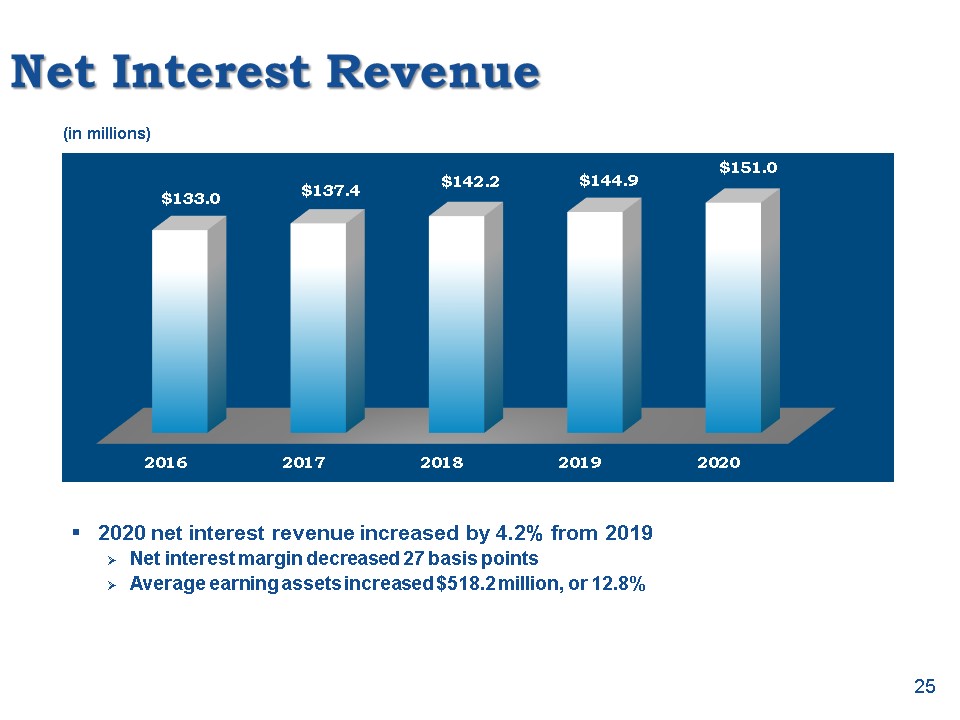
Net Interest Revenue 2020 net interest revenue increased by 4.2% from 2019Net interest margin decreased
27 basis pointsAverage earning assets increased $518.2 million, or 12.8% (in millions) 25
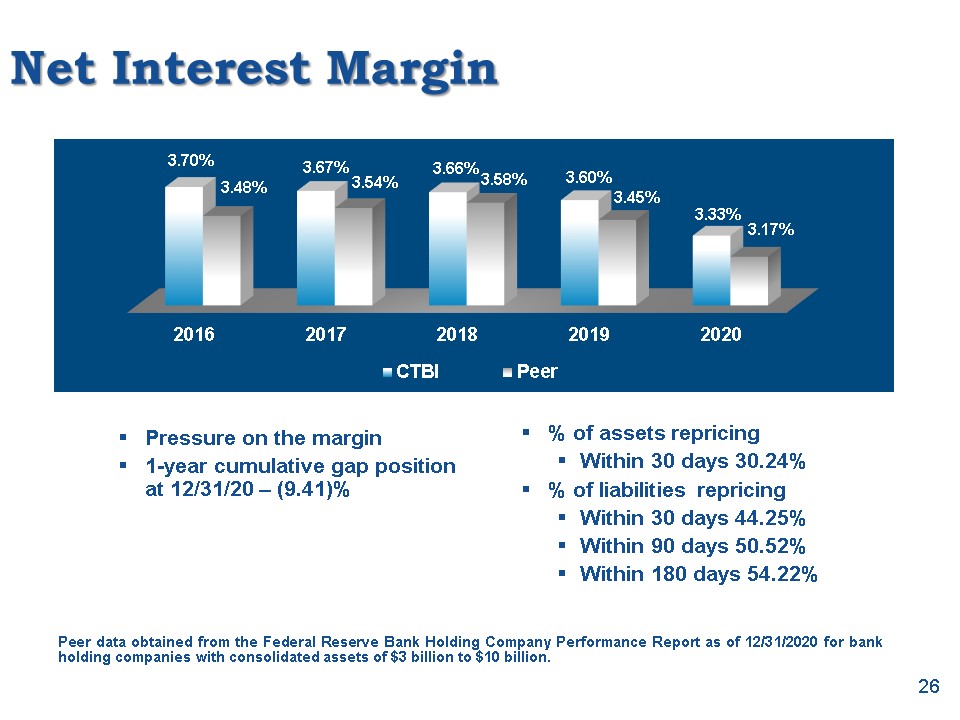
Net Interest Margin Pressure on the margin1-year cumulative gap position at 12/31/20 – (9.41)% Peer
data obtained from the Federal Reserve Bank Holding Company Performance Report as of 12/31/2020 for bank holding companies with consolidated assets of $3 billion to $10 billion. % of assets repricingWithin 30 days 30.24%% of liabilities
repricing Within 30 days 44.25%Within 90 days 50.52%Within 180 days 54.22% 26
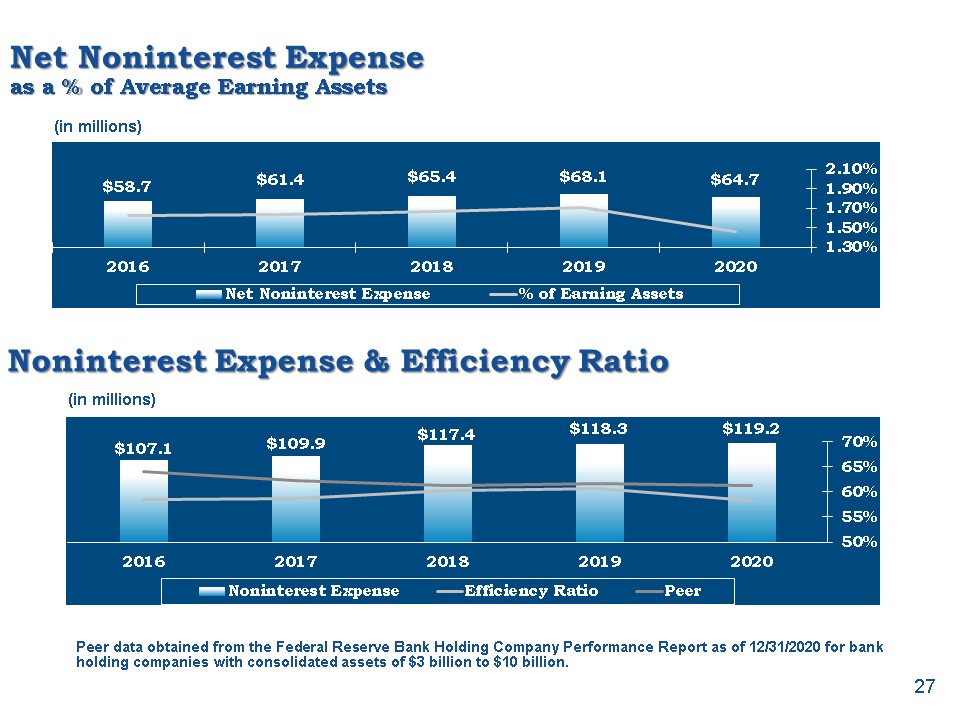
Net Noninterest Expenseas a % of Average Earning Assets Peer data obtained from the Federal Reserve Bank
Holding Company Performance Report as of 12/31/2020 for bank holding companies with consolidated assets of $3 billion to $10 billion. (in millions) 27 Noninterest Expense & Efficiency Ratio (in millions)
Balance Sheet Review
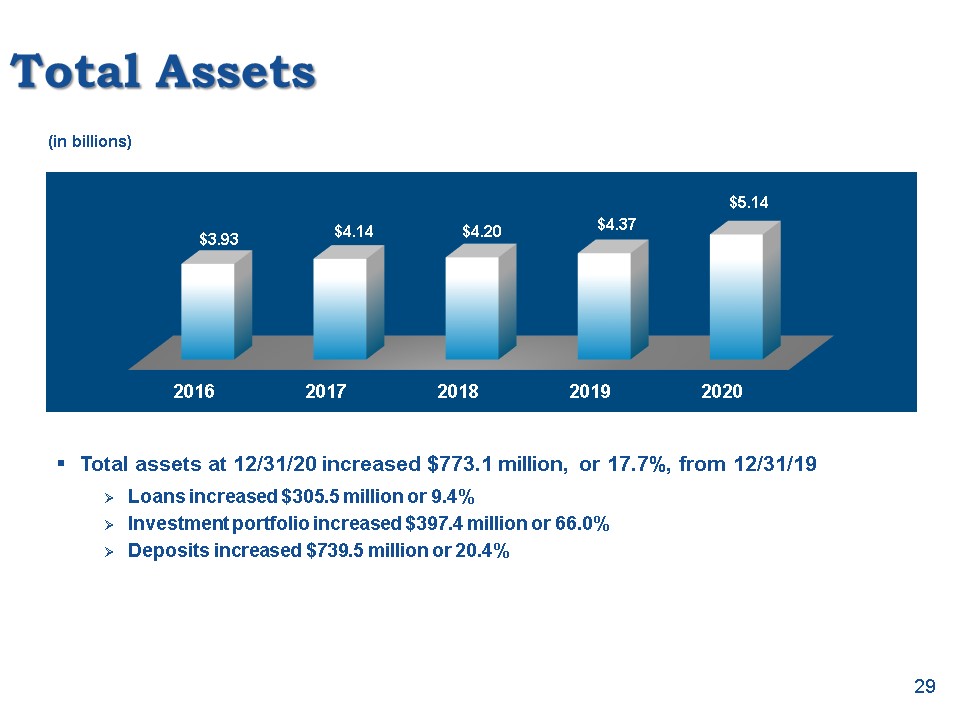
Total Assets Total assets at 12/31/20 increased $773.1 million, or 17.7%, from 12/31/19Loans increased
$305.5 million or 9.4%Investment portfolio increased $397.4 million or 66.0%Deposits increased $739.5 million or 20.4% (in billions) 29
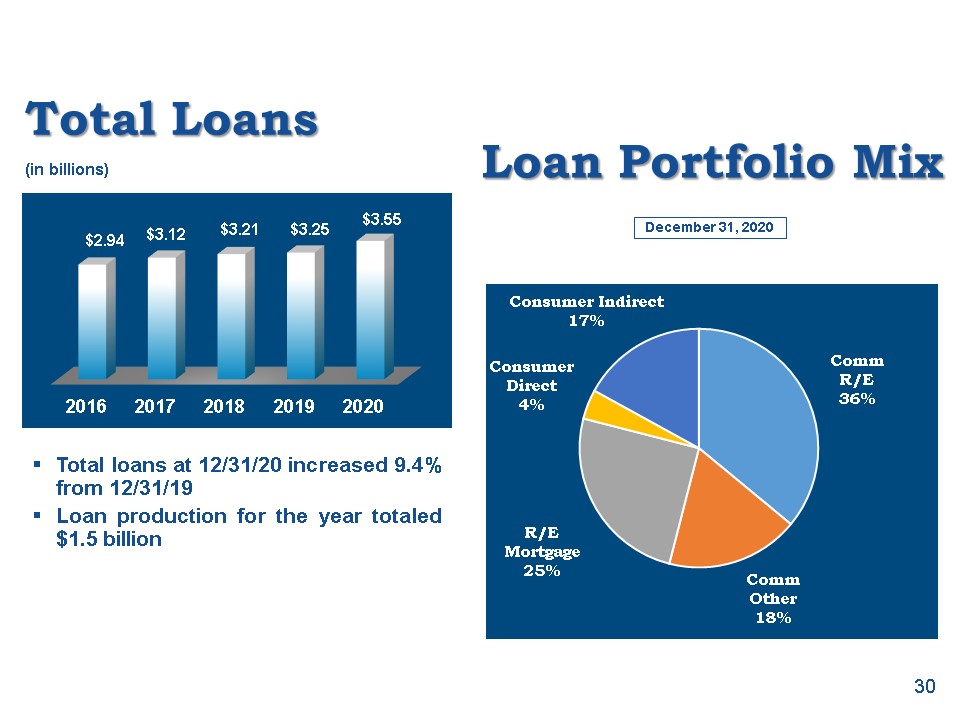
Total Loans Total loans at 12/31/20 increased 9.4% from 12/31/19Loan production for the year totaled
$1.5 billion (in billions) 30 Loan Portfolio Mix December 31, 2020
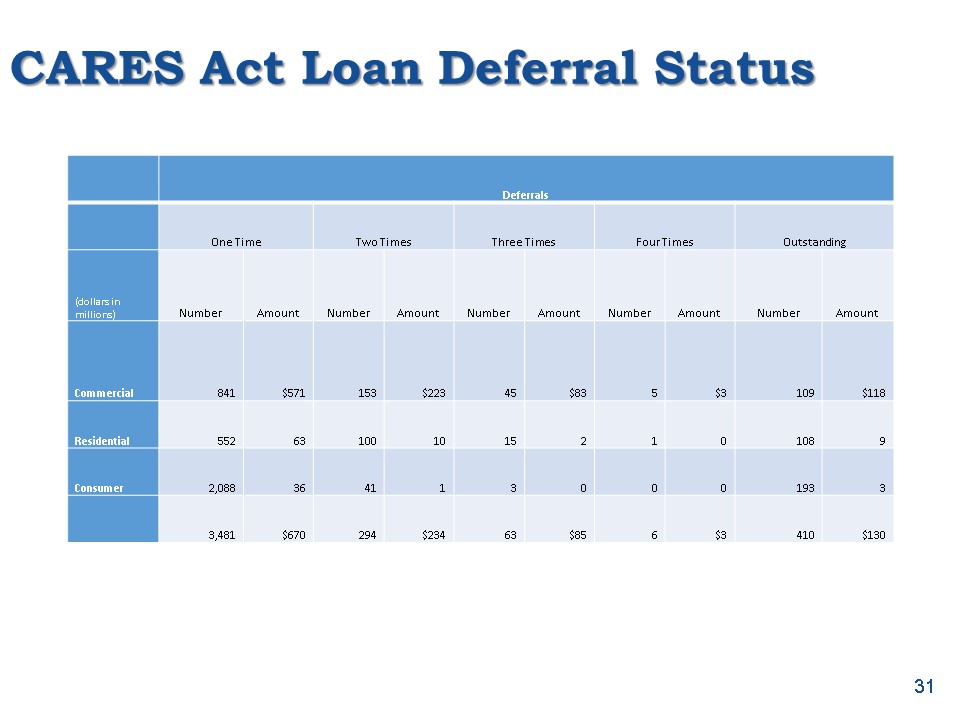
CARES Act Loan Deferral Status 31 Deferrals One Time Two Times Three
Times Four Times Outstanding (dollars in millions) Number Amount Number Amount Number Amount Number Amount Number Amount Commercial 841 $571 153 $223 45 $83 5 $3 109 $118 Residential
552 63 100 10 15 2 1 0 108 9 Consumer 2,088 36 41 1 3 0 0 0 193 3 3,481 $670 294 $234 63 $85 6 $3 410 $130
PPP Loans 32 As of December 31, 2020, we have closed 2,962 PPP loans totaling $277.0 million 2,817 were
under $350 thousand132 were between $350 thousand and $2.0 million13 were over $2.0 million
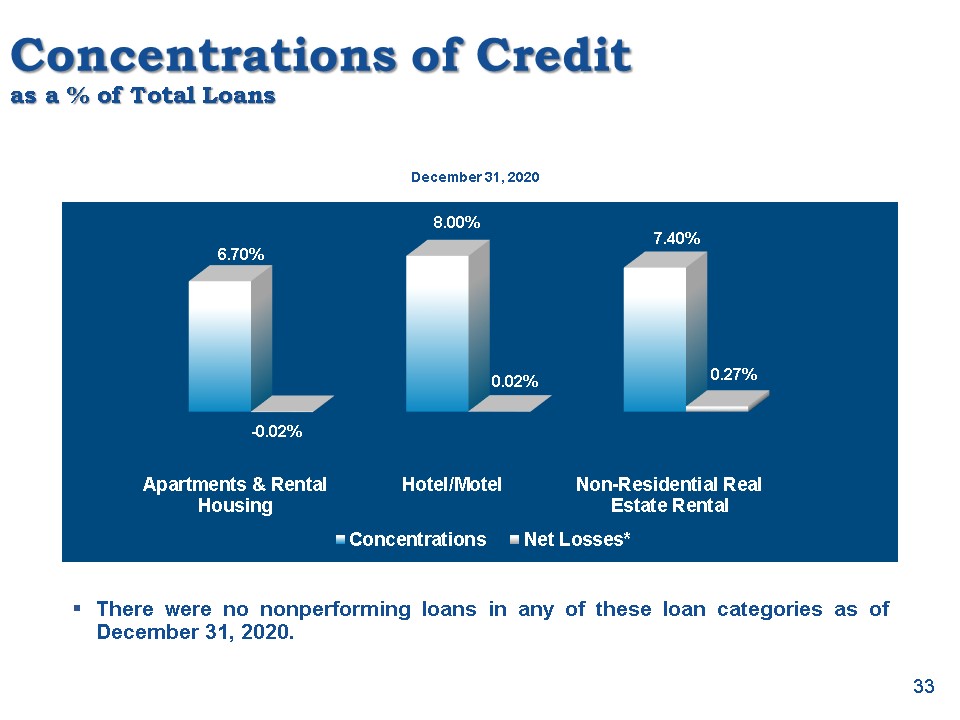
Concentrations of Creditas a % of Total Loans December 31, 2020 There were no nonperforming loans in
any of these loan categories as of December 31, 2020. 33
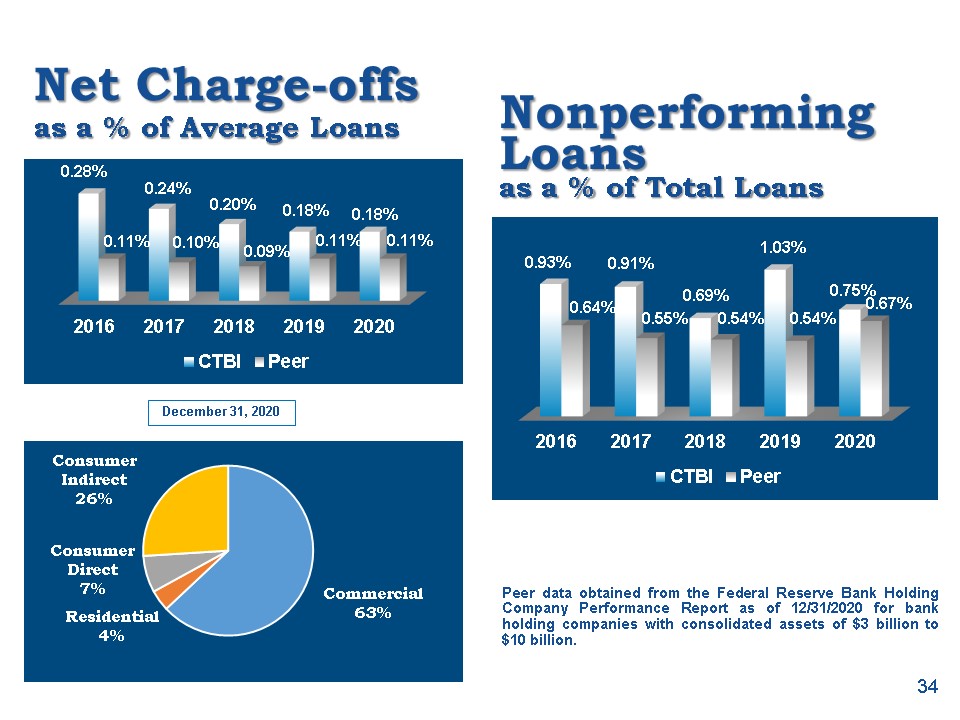
Net Charge-offsas a % of Average Loans Peer data obtained from the Federal Reserve Bank Holding Company
Performance Report as of 12/31/2020 for bank holding companies with consolidated assets of $3 billion to $10 billion. December 31, 2020 34 Nonperforming Loansas a % of Total Loans
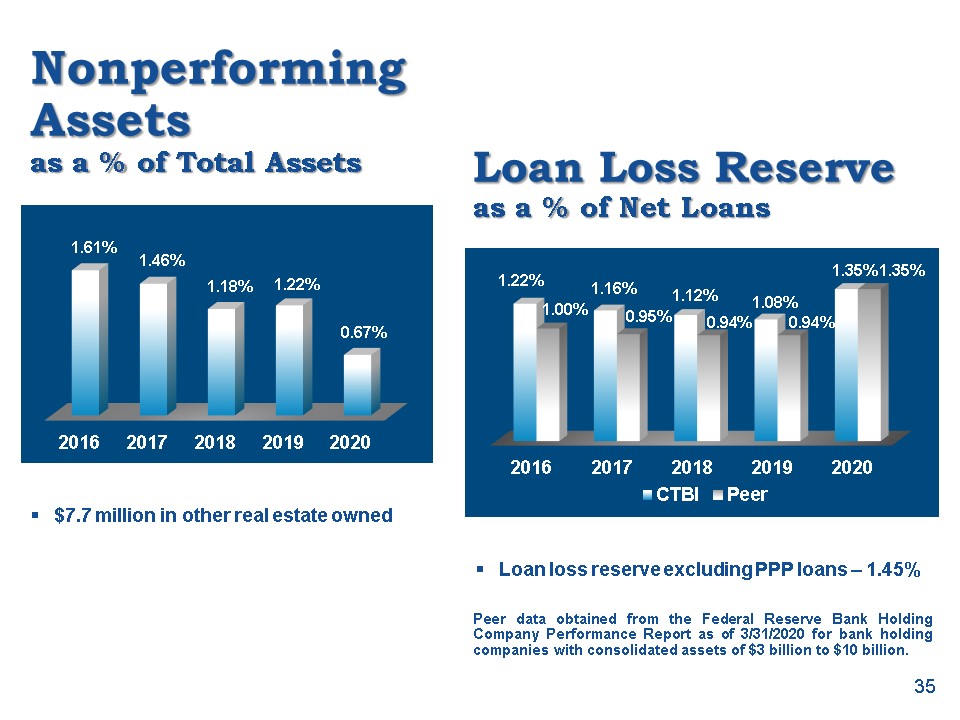
Nonperforming Assetsas a % of Total Assets $7.7 million in other real estate owned 35 Loan Loss
Reserveas a % of Net Loans Peer data obtained from the Federal Reserve Bank Holding Company Performance Report as of 3/31/2020 for bank holding companies with consolidated assets of $3 billion to $10 billion. Loan loss reserve excluding PPP
loans – 1.45%
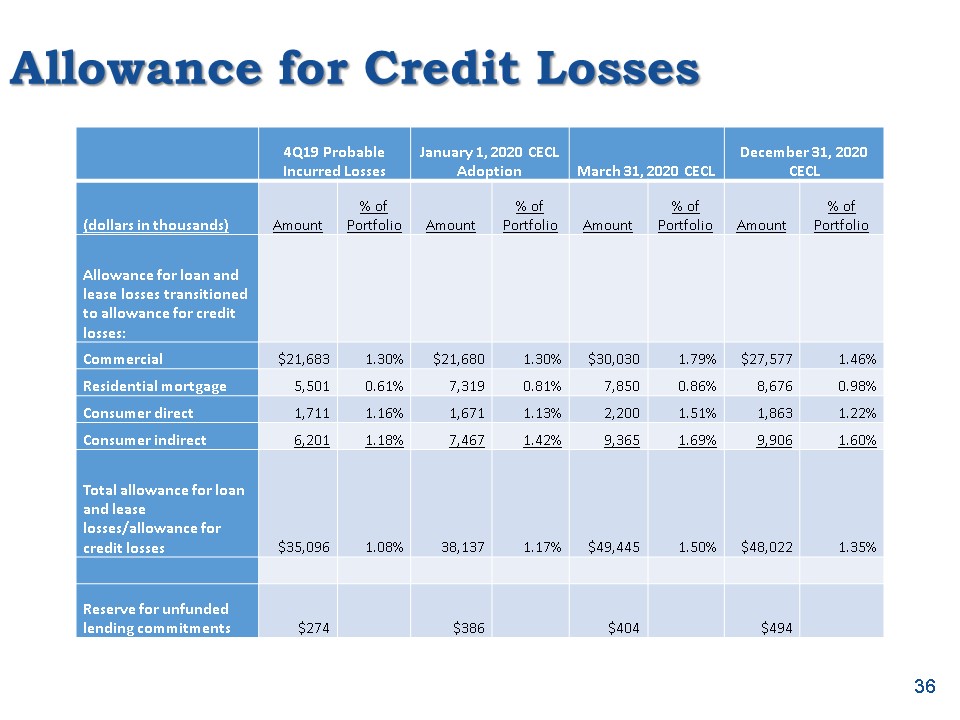
Allowance for Credit Losses 36 4Q19 Probable Incurred Losses January 1, 2020 CECL
Adoption March 31, 2020 CECL December 31, 2020 CECL (dollars in thousands) Amount % of Portfolio Amount % of Portfolio Amount % of Portfolio Amount % of Portfolio Allowance for loan and lease losses transitioned to allowance
for credit losses: Commercial $21,683 1.30% $21,680 1.30% $30,030 1.79% $27,577 1.46% Residential mortgage 5,501 0.61% 7,319 0.81% 7,850 0.86% 8,676 0.98% Consumer
direct 1,711 1.16% 1,671 1.13% 2,200 1.51% 1,863 1.22% Consumer indirect 6,201 1.18% 7,467 1.42% 9,365 1.69% 9,906 1.60% Total allowance for loan and lease losses/allowance for credit
losses $35,096 1.08% 38,137 1.17% $49,445 1.50% $48,022 1.35% Reserve for unfunded lending commitments $274 $386 $404 $494
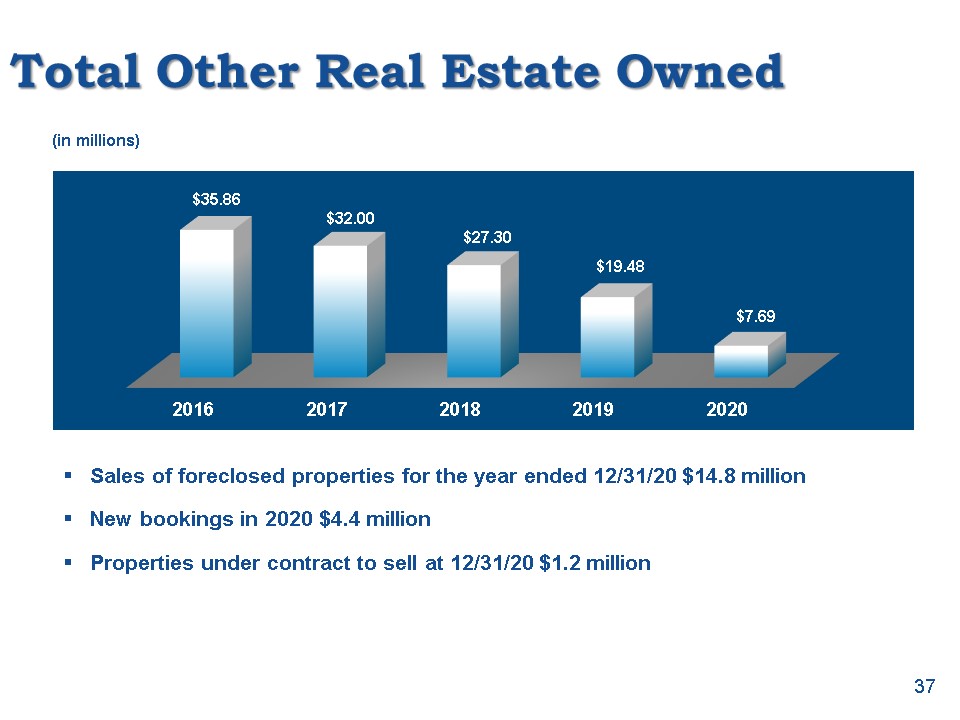
Total Other Real Estate Owned Sales of foreclosed properties for the year ended 12/31/20 $14.8
millionNew bookings in 2020 $4.4 millionProperties under contract to sell at 12/31/20 $1.2 million (in millions) 37
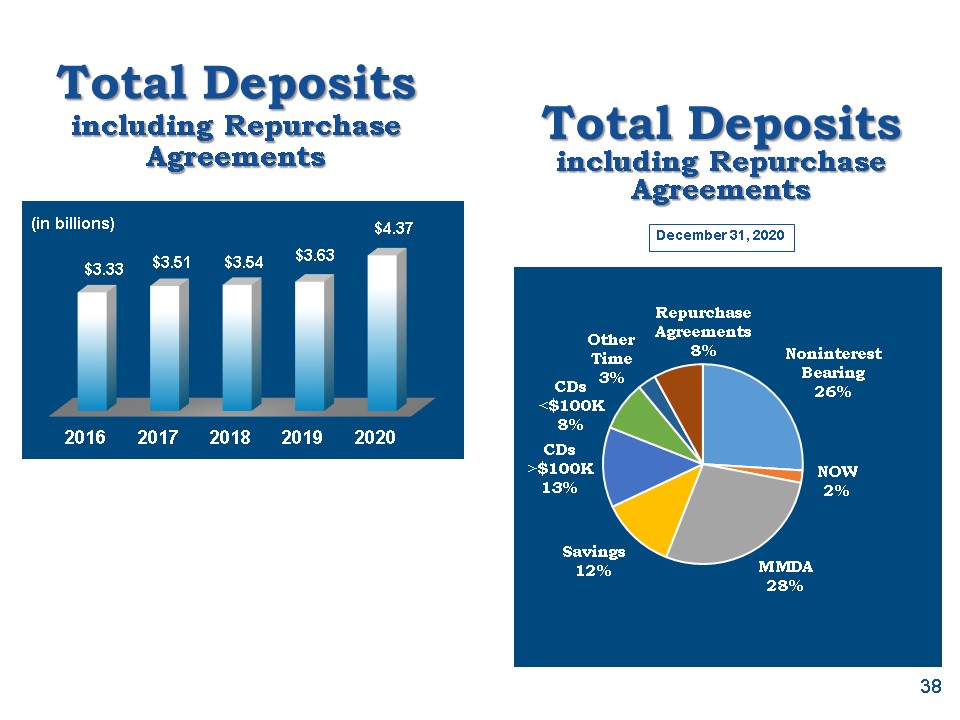
Total Depositsincluding Repurchase Agreements 38 Total Depositsincluding Repurchase
Agreements December 31, 2020 (in billions)
1st Quarter 2021 Review
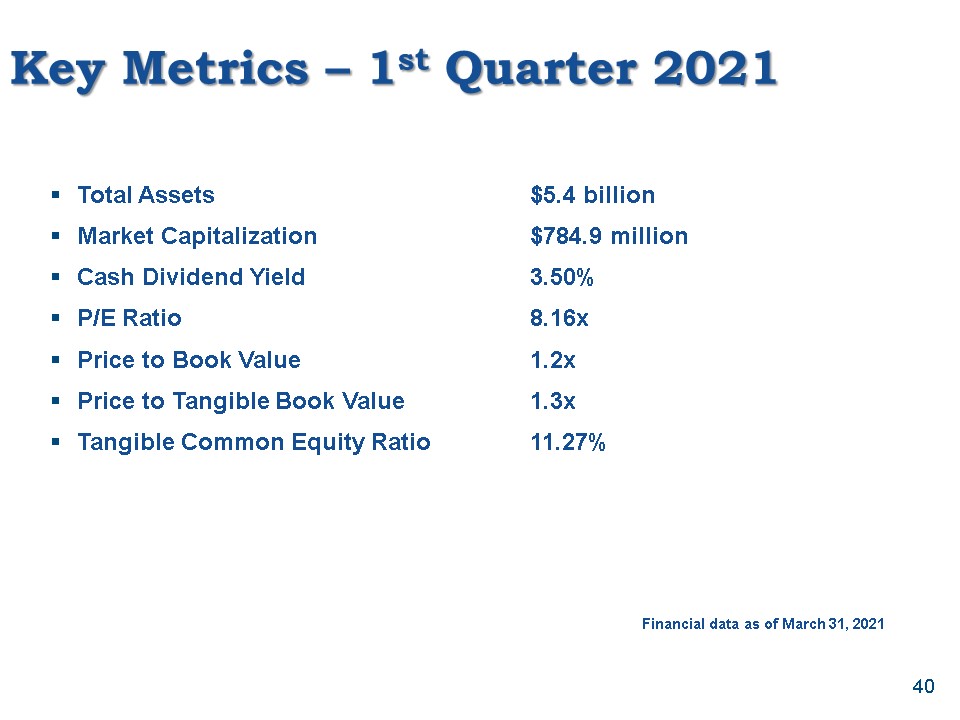
Key Metrics – 1st Quarter 2021 Total Assets $5.4 billionMarket Capitalization $784.9 millionCash
Dividend Yield 3.50%P/E Ratio 8.16xPrice to Book Value 1.2xPrice to Tangible Book Value 1.3xTangible Common Equity Ratio 11.27% Financial data as of March 31, 2021 40
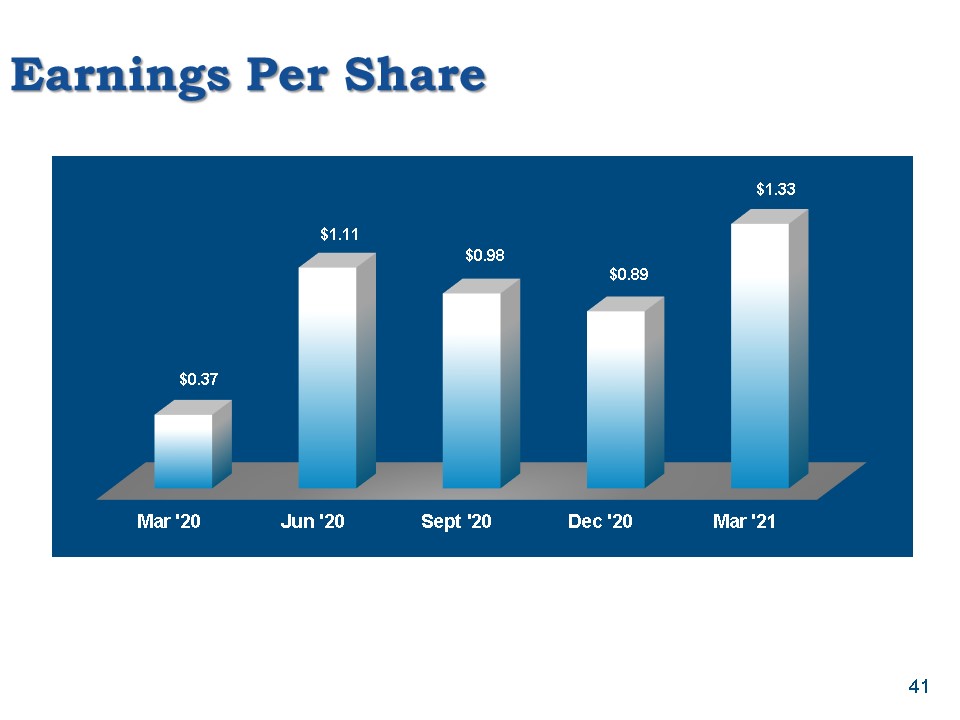
Earnings Per Share 41
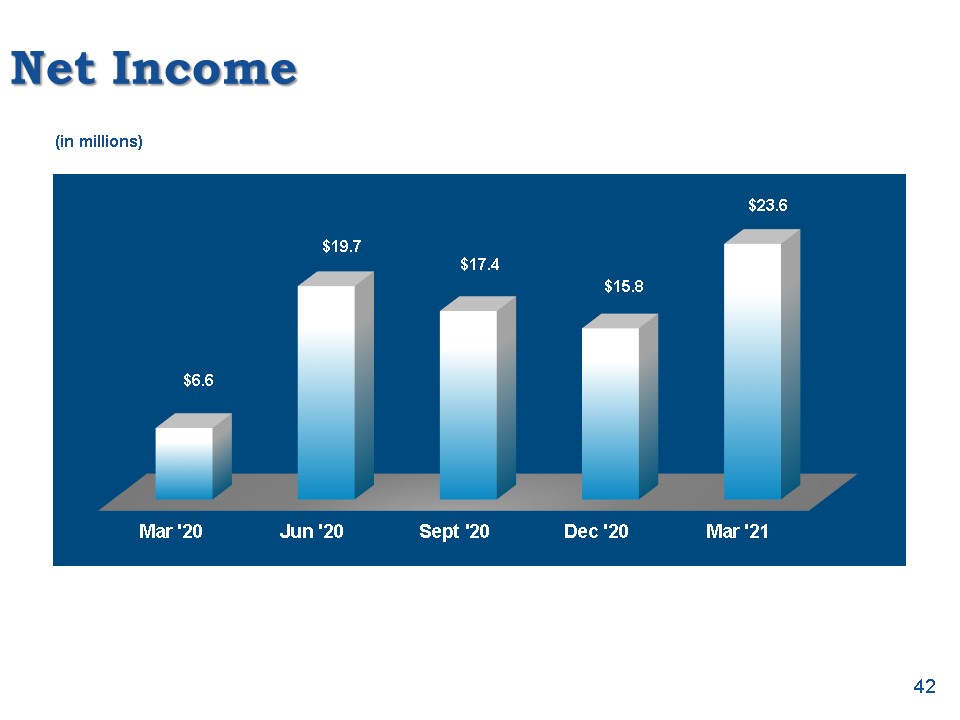
Net Income 42 (in millions)
Earnings Net interest income for the quarter of $40.2 million was $1.6 million, or 4.2%, above prior
quarter and $4.0 million, or 11.0%, above first quarter 2020. We recovered $2.5 million of our provision for credit losses during the quarter ended March 31, 2021, as a result of improvement in our net charge-off experience. Provision for
credit losses for the prior quarter and prior year same quarter was $1.0 million and $12.7 million, respectively.Noninterest income for the quarter ended March 31, 2021 of $15.6 million was a $0.3 million, or 2.1%, increase from prior quarter
and a $4.1 million, or 35.2%, increase from prior year same quarter.Noninterest expense for the quarter ended March 31, 2021 of $28.3 million decreased $5.3 million, or 15.8%, from prior quarter, but increased slightly by $0.1 million, or 0.3%,
from prior year same quarter. 43
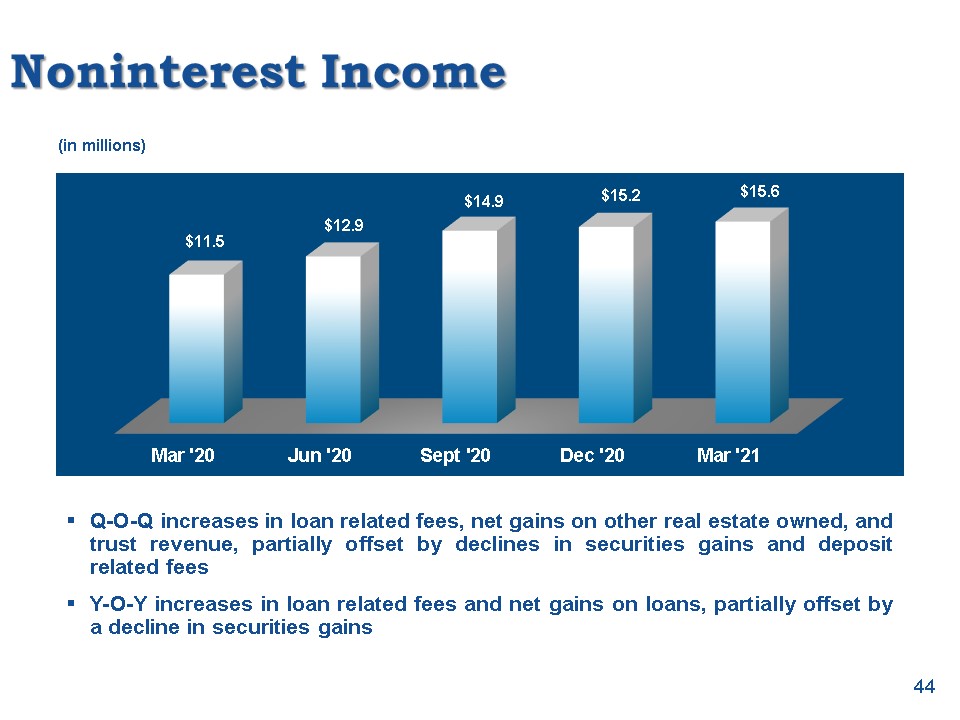
Noninterest Income Q-O-Q increases in loan related fees, net gains on other real estate owned, and trust
revenue, partially offset by declines in securities gains and deposit related feesY-O-Y increases in loan related fees and net gains on loans, partially offset by a decline in securities gains (in millions) 44
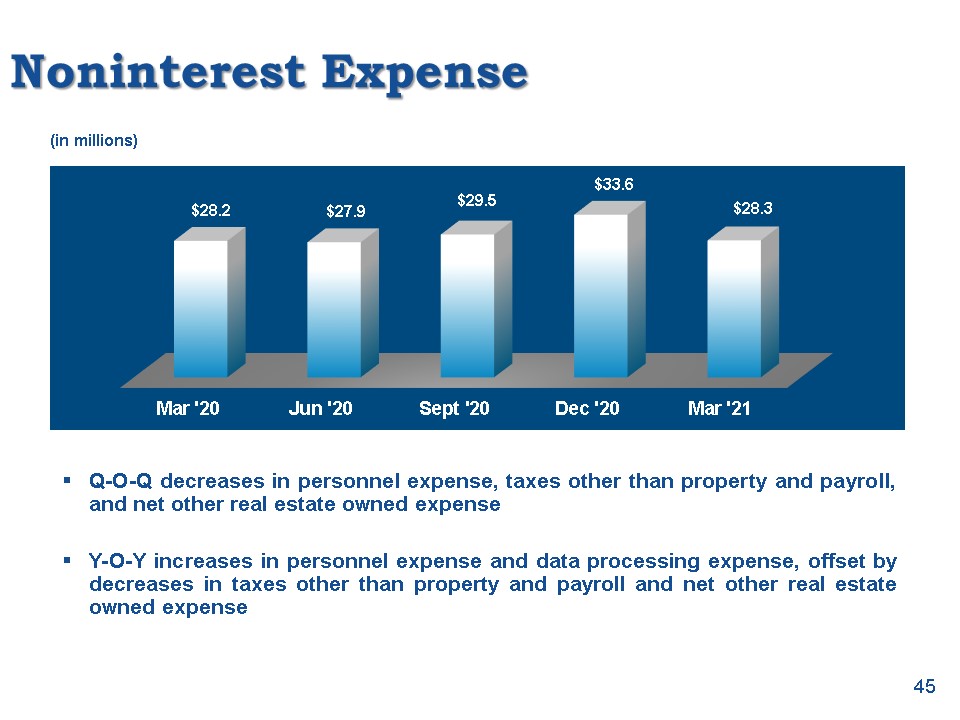
Noninterest Expense Q-O-Q decreases in personnel expense, taxes other than property and payroll, and net
other real estate owned expenseY-O-Y increases in personnel expense and data processing expense, offset by decreases in taxes other than property and payroll and net other real estate owned expense (in millions) 45
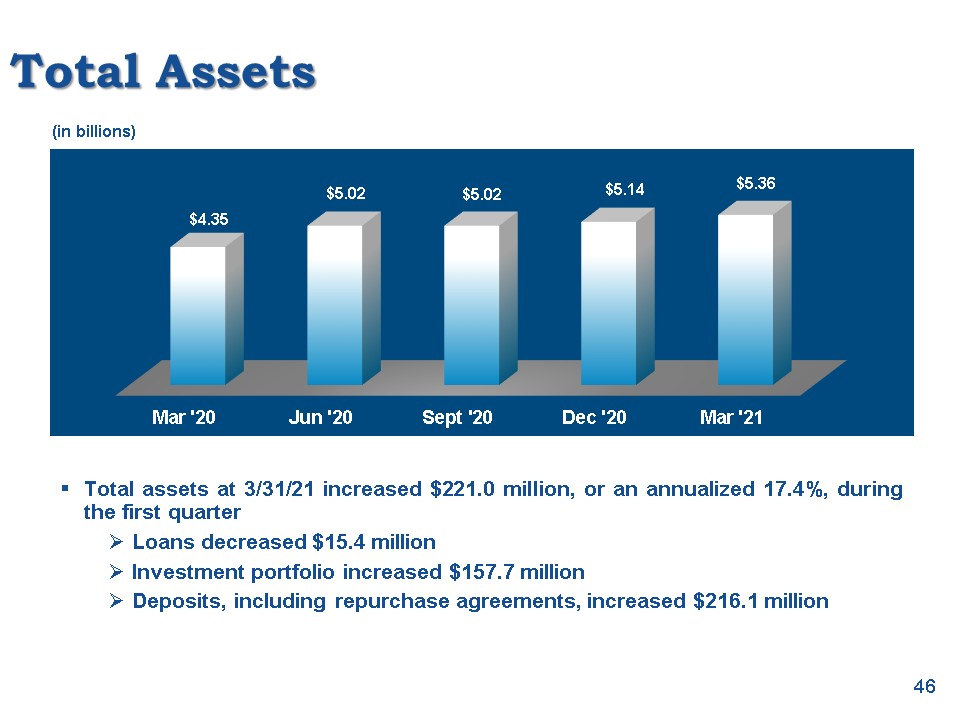
Total Assets Total assets at 3/31/21 increased $221.0 million, or an annualized 17.4%, during the first
quarterLoans decreased $15.4 millionInvestment portfolio increased $157.7 millionDeposits, including repurchase agreements, increased $216.1 million (in billions) 46
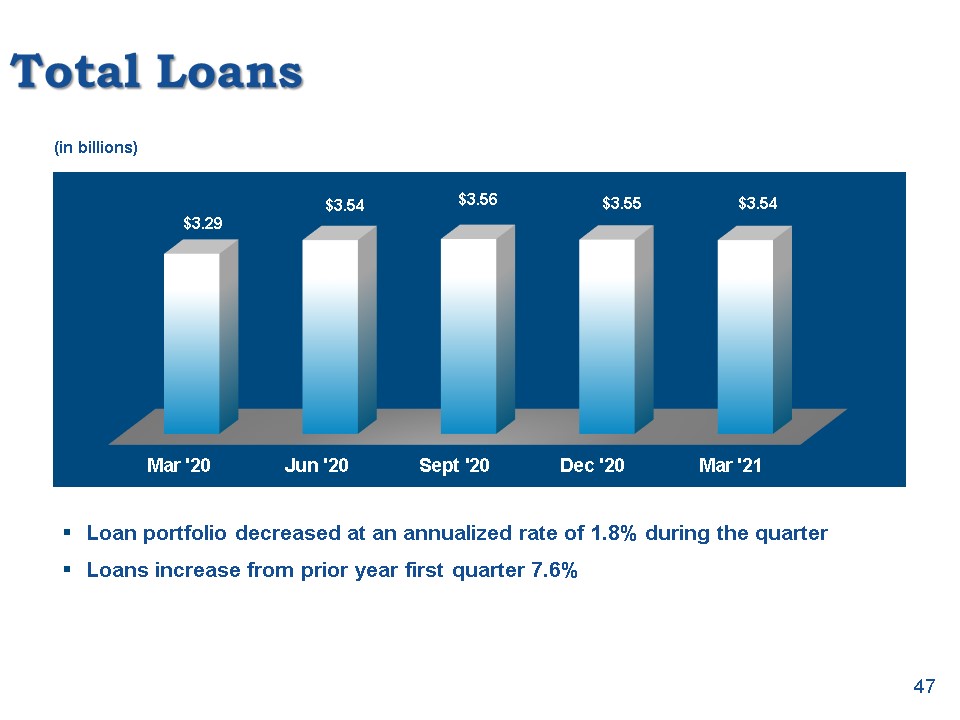
Total Loans Loan portfolio decreased at an annualized rate of 1.8% during the quarterLoans increase from
prior year first quarter 7.6% (in billions) 47
CARES Act Loan Deferral Status 48 At March 31, 2021, the number of customers with CARES Act
deferrals reduced to 226 for a total outstanding amount of $81.8 million73 commercial with a total outstanding amount of $73.8 million83 residential with a total outstanding amount of $6.5 million70 consumer with a total outstanding amount of
$1.5 million
49 PPP Loans As of March 31, 2021, we had closed 4,819 Paycheck Protection Program (PPP) loans totaling
$376.1 million2,962 loans totaling $277.0 million stemming from the CARES Act1,857 loans totaling $99.1 million in new PPP loans stemming from the Consolidated Appropriations Act 2021Through March 31, 2021, we have had 1,563 of our PPP loans
forgiven by the SBA in a total amount of $117.2 million$98.1 million during the first quarter 2021
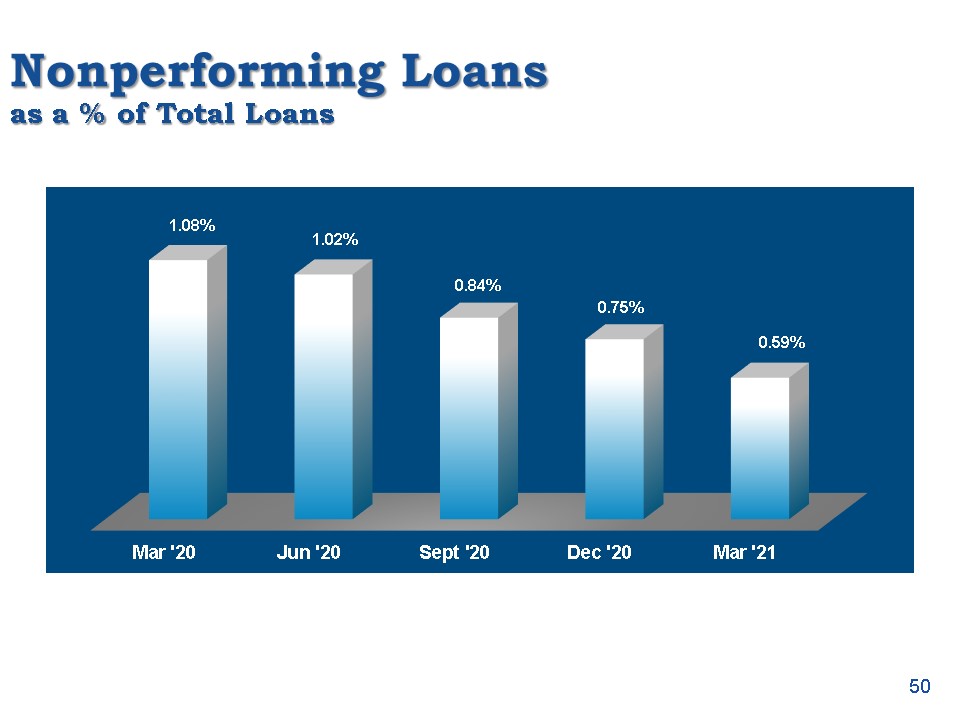
Nonperforming Loansas a % of Total Loans 50
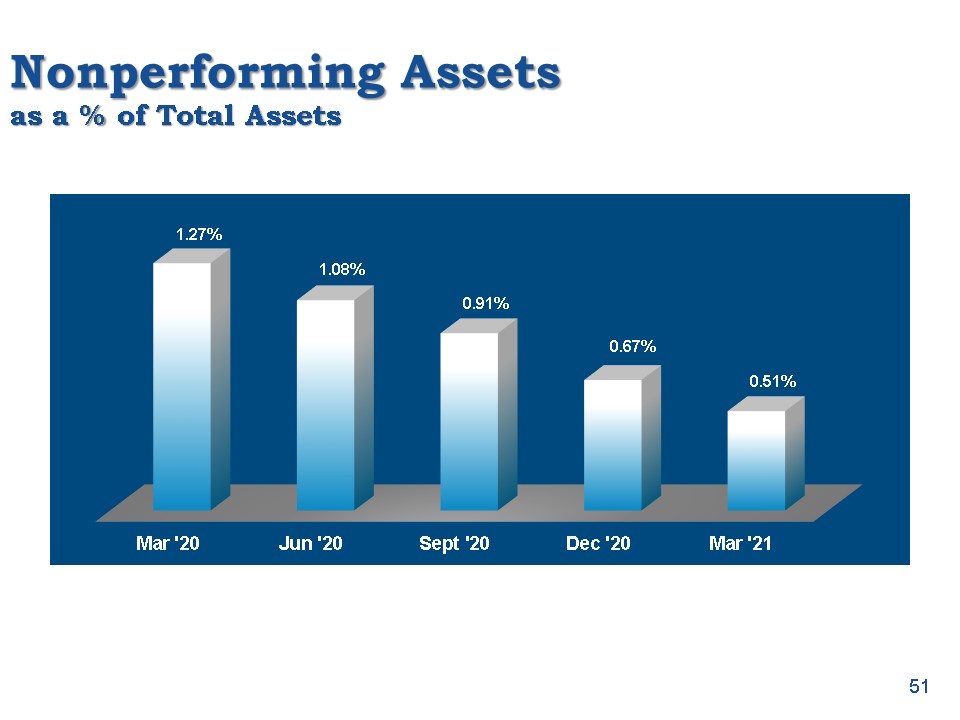
Nonperforming Assetsas a % of Total Assets 51
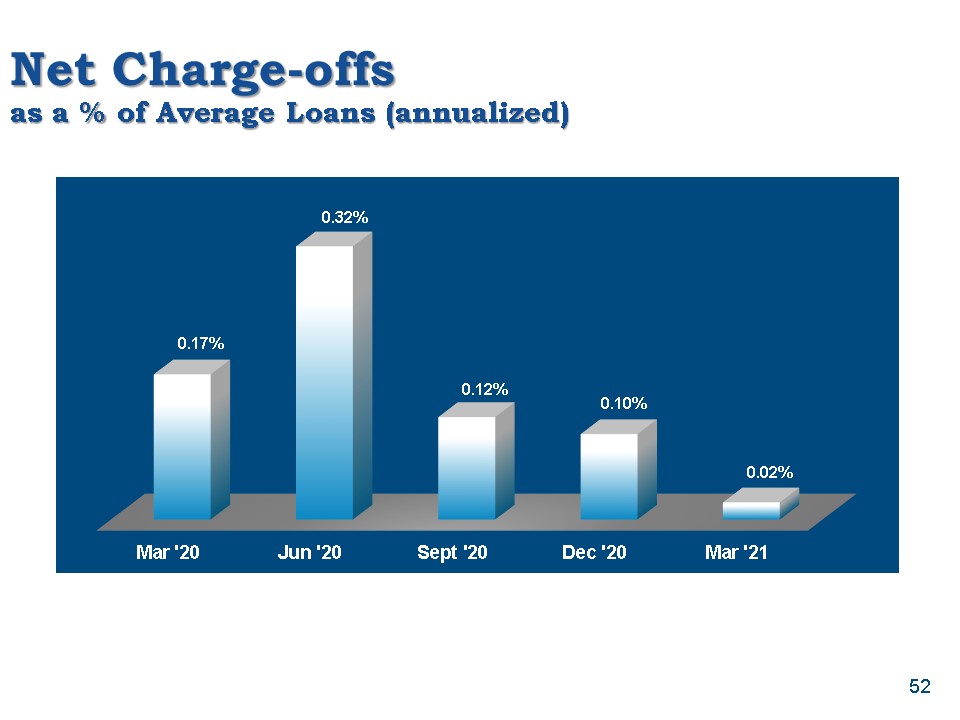
Net Charge-offsas a % of Average Loans (annualized) 52
Allowance for Credit Losses We recognized a recapture of allowance for credit losses with a credit to
provision for credit losses of $2.5 million for the first quarter of 2021, compared to a provision for credit losses of $1.0 million for the prior quarter and $12.7 million for the first quarter of 2020.The change in the provision for credit
losses compared to the fourth quarter of 2020 was due primarily to the improvement in net charge off experience affecting our vintage loss analysis in several segments, the most significant of those being the indirect lending and residential
lending segments.Our credit loss reserve as a percentage of total loans outstanding at March 31, 2021 was 1.28% (1.38% excluding PPP loans) compared to 1.35% at December 31, 2020 (1.46% excluding PPP loans) and 1.50% at March 31, 2020. 53
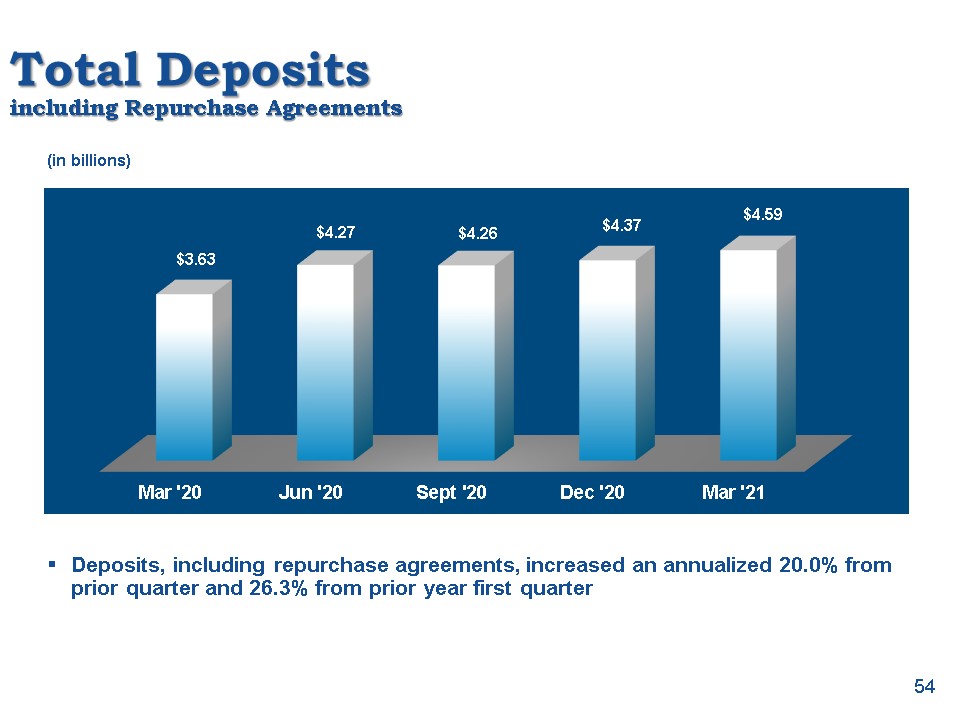
Total Depositsincluding Repurchase Agreements Deposits, including repurchase agreements, increased an
annualized 20.0% from prior quarter and 26.3% from prior year first quarter (in billions) 54
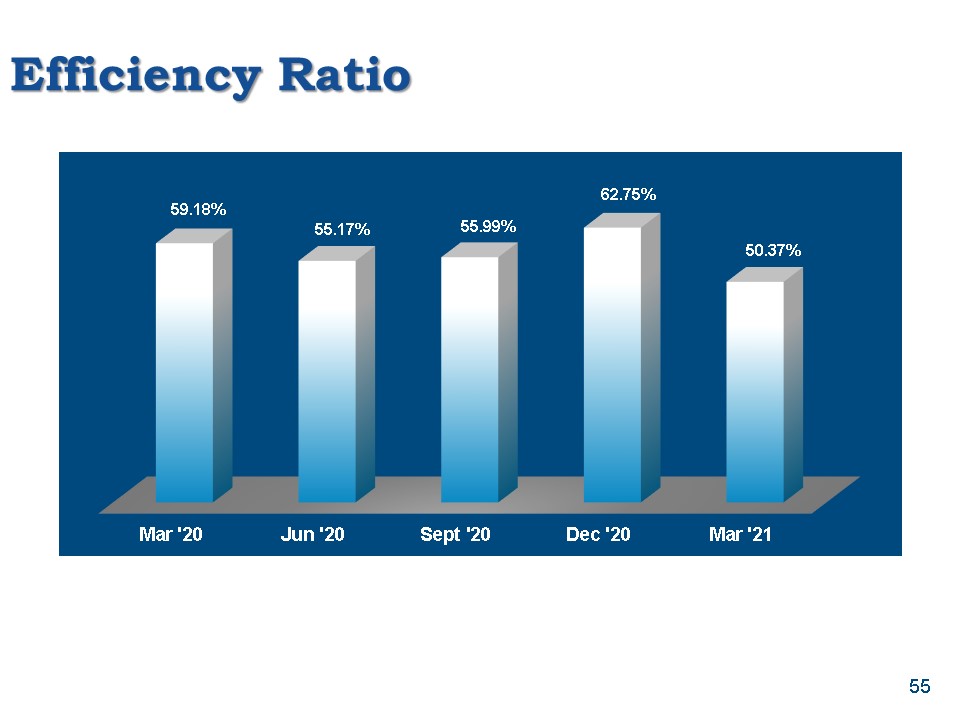
Efficiency Ratio 55
Key Strategic Initiatives
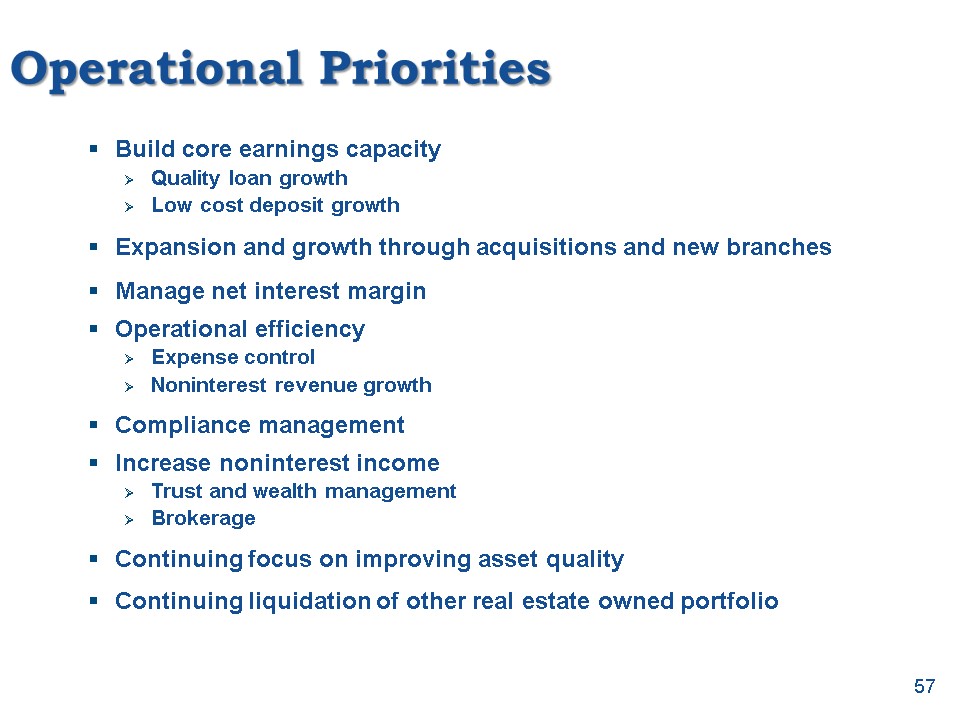
Operational Priorities Build core earnings capacityQuality loan growthLow cost deposit growthExpansion
and growth through acquisitions and new branchesManage net interest margin Operational efficiencyExpense controlNoninterest revenue growthCompliance managementIncrease noninterest incomeTrust and wealth managementBrokerageContinuing focus on
improving asset quality Continuing liquidation of other real estate owned portfolio 57

To Our Shareholders Your management has a Strategic Plan for the performance and operations of your
company. Success will be attained by the execution of this plan, not just by management, but by approximately 1,000 employees. The continuing support by you, our shareholders, by referring your friends, neighbors, and business associates to do
business with your bank, is invaluable to the execution of our plans for the performance of your Company. 58

59