Attached files
| file | filename |
|---|---|
| 8-K - 8-K - NEXTIER OILFIELD SOLUTIONS INC. | frac-20210426.htm |

Investor Presentation April 2021

Forward Looking Statements & Disclosures 2 All statements other than statements of historical facts contained in this presentation and any oral statements made in connection with this presentation, including statements regarding our future operating results and financial position, business strategy and plans and objectives of management for future operations, are forward-looking statements within the meaning of the Private Securities Litigation Reform Act of 1995. Our forward-looking statements are generally accompanied by words such as “may,” “should,” “expect,” “believe,” “plan,” “anticipate,” “could,” “intend,” “target,” “goal,” “project,” “contemplate,” “believe,” “estimate,” “predict,” “potential,” or “continue” or the negative of these terms or other similar expressions. Any forward- looking statements contained in this presentation or in oral statements made in connection with this presentation speak only as of the date on which we make them and are based upon our historical performance and on current plans, estimates and expectations. These forward-looking statements are only predictions and involve known and unknown risks and uncertainties. Statements in this presentation regarding the Company that are forward-looking, including projections and outlook information, are based on management's estimates, assumptions and projections, and are subject to significant uncertainties and other factors, many of which are beyond the Company's control. These factors and risks include, but are not limited to, (i) the competitive nature of the industry in which the Company conducts its business, including pricing pressures; (ii) the ability to meet rapid demand shifts; (iii) the impact of pipeline capacity constraints and adverse weather conditions in oil or gas producing regions; (iv) the ability to obtain or renew customer contracts and changes in customer requirements in the markets the Company serves; (v) the ability to identify, effect and integrate acquisitions, joint ventures or other transactions; (vi) the ability to protect and enforce intellectual property rights; (vii) the effect of environmental and other governmental regulations on the Company's operations; (viii) the effect of a loss of, or interruption in operations of, one or more key suppliers, including resulting from product defects, recalls or suspensions; (ix) the variability of crude oil and natural gas commodity prices; (x) the market price and availability of materials or equipment; (xi) the ability to obtain permits, approvals and authorizations from governmental and third parties; (xii) the Company's ability to employ a sufficient number of skilled and qualified workers to combat the operating hazards inherent in the Company's industry; (xiii) fluctuations in the market price of the Company's stock; (xiv) the level of, and obligations associated with, the Company's indebtedness; (xv) the duration, impact and severity of the COVID-19 pandemic and the evolving response thereto, including the impact of social distancing, shelter-in-place, shutdowns of non-essential businesses and similar measures imposed or undertaken by governments, private businesses or others; and (xvi) other risk factors and additional information. For a more detailed discussion of such risks and other factors, see the Company's filings with the Securities and Exchange Commission (the "SEC"), including under the heading "Risk Factors" in Item 1A of the Company's Annual Report on Form 10-K for the fiscal year ended December 31, 2020, and any subsequently filed Quarterly Reports on Form 10-Q or Current Reports on Form 8-K, all available on the SEC website or www.NexTierOFS.com. The Company assumes no obligation to update any forward-looking statements or information, which speak as of their respective dates, to reflect events or circumstances after the date hereof, or to reflect the occurrence of unanticipated events, except as may be required under applicable securities laws. Investors should not assume that any lack of update to a previously issued "forward-looking statement" constitutes a reaffirmation of that statement.

Overview of NexTier 3 #1 Dual-Fuel Gas powered HHP1 #1 Wireline plug & perf fleet1 #3 U.S. land completion services provider1 Our Position L48 Geographic Overview International (MENA Region) 1 Source: Company estimates based on deployed and working fleets as of March 31, 2021. Permian Northeast West/ Rockies Central Int’l Service Solutions: Hydraulic Fracturing Wireline Cement Coiled Tubing Power Solutions NexTier Advantage: Exceptional HSE Performance Carbon Reducing ESG Technology Digitally Driven Operations Value Enabling Tiered Solutions OUR MISSION To consistently outperform in service delivery and returns, while enabling customers to win by reducing their overall cost per well and carbon footprint

Track Record of M&A Selection, Execution, Integration March 2016 July 2017 November 2017 July 2018 October 2019 Proven Ability to Successfully Integrate & Capture Synergies Disciplined Capital Allocation Approach Committed to Shareholder Value Creation Focused on Expansion, Technology & Consolidation June 2012 4 March 2015
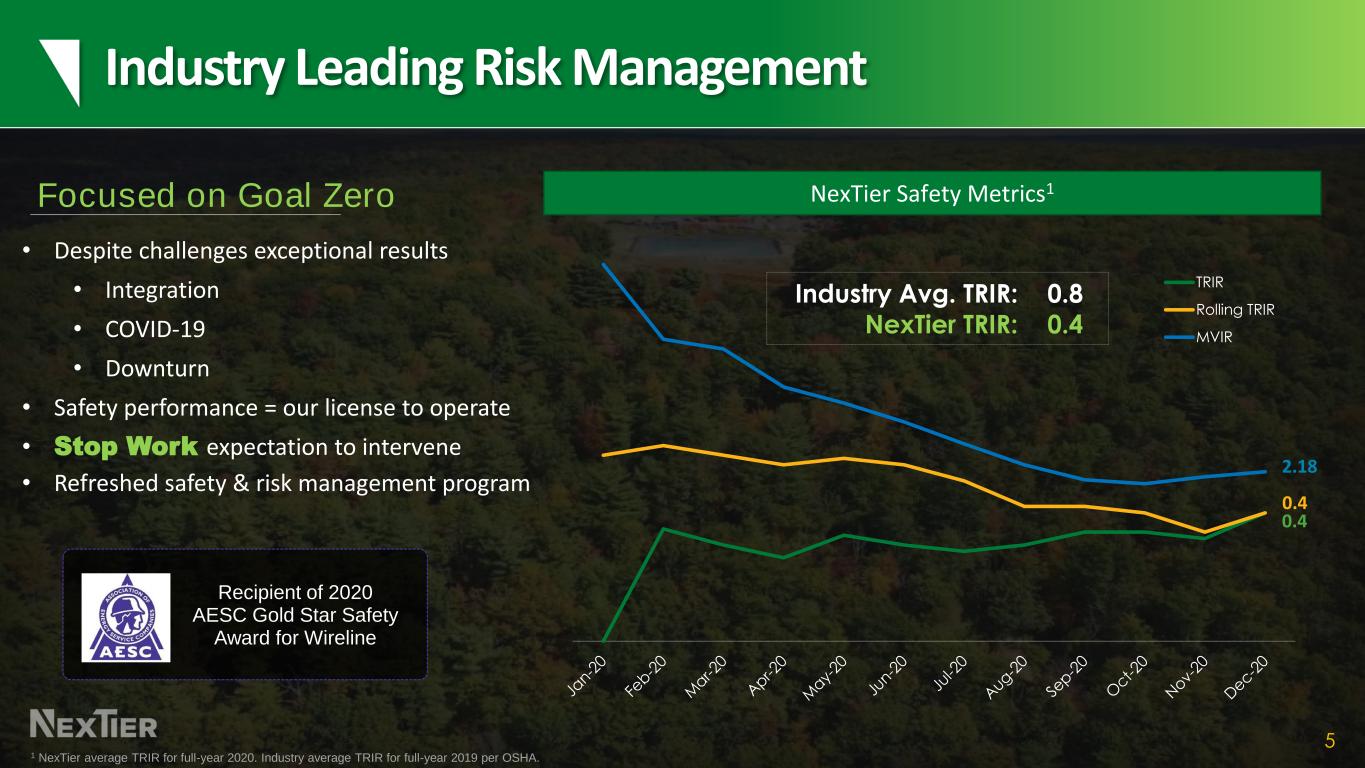
Industry Leading Risk Management 5 NexTier Safety Metrics1 • Despite challenges exceptional results • Integration • COVID-19 • Downturn • Safety performance = our license to operate • Stop Work expectation to intervene • Refreshed safety & risk management program Focused on Goal Zero 1 NexTier average TRIR for full-year 2020. Industry average TRIR for full-year 2019 per OSHA. Recipient of 2020 AESC Gold Star Safety Award for Wireline 2.18 0.4 0.4 Industry Avg. TRIR: NexTier TRIR: 0.8 0.4 TRIR Rolling TRIR MVIR

Fortified Balance Sheet ✓ MINIMAL net debt of $60mm1 ✓ SUFFICIENT cash to navigate cycles ✓ FLEXIBILITY to fund growth & innovation ✓ LONG runway on debt maturity Financial Strength & Flexibility ̶ $276mm cash ̶ $74mm ABL availability $350mm Liquidity1 Invested in equipment readiness = ready on demand Ability to provide exceptional safety and performance at the wellsite Allocate all future growth capital on equipment with enhanced return & emissions profile NexTier Offering Capital priorities focused on cash preservation and investment in emissions reducing technologies 6 1 As of December 31, 2020. Net debt is calculated as total outstanding debt minus cash.

Responsible Asset Readiness ✓ Deployed across all excess equipment, product & service lines ✓ Real-time equipment health management & AI-based preventive maintenance program ✓ Leverage technology to protect & track equipment ✓ Unutilized assets moved and centralized in world-class maintenance facility ✓ Dedicated team to relocate, repair, preserve, and restore unutilized assets ✓ Invested $1 million per month during downturn to ensure asset readiness World Class Maintenance Facility • 116-acre facility dedicated to manage, protect, and preserve • Highly functional maintenance, electronics, and fabrication capabilities Protect: Preserve: Where? What? How? Is my asset? NexTier Real-time Asset Management Portal (RAMP) 7 The Result: Redeployed significant portion of the fleet with minimal startup cost
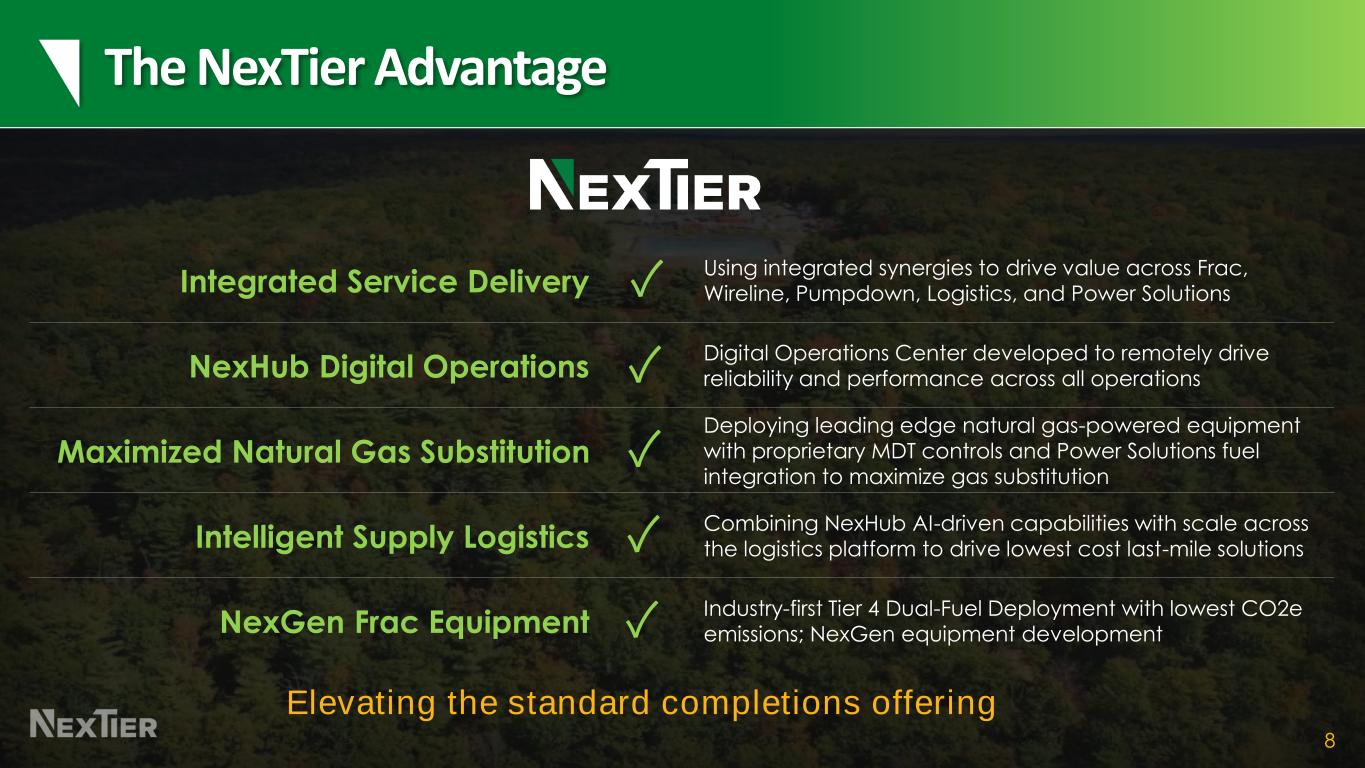
The NexTier Advantage 8 Integrated Service Delivery Using integrated synergies to drive value across Frac, Wireline, Pumpdown, Logistics, and Power Solutions NexHub Digital Operations Digital Operations Center developed to remotely drive reliability and performance across all operations Maximized Natural Gas Substitution Deploying leading edge natural gas-powered equipment with proprietary MDT controls and Power Solutions fuel integration to maximize gas substitution Intelligent Supply Logistics Combining NexHub AI-driven capabilities with scale across the logistics platform to drive lowest cost last-mile solutions NexGen Frac Equipment Industry-first Tier 4 Dual-Fuel Deployment with lowest CO2e emissions; NexGen equipment development ✓ ✓ ✓ ✓ ✓ Elevating the standard completions offering
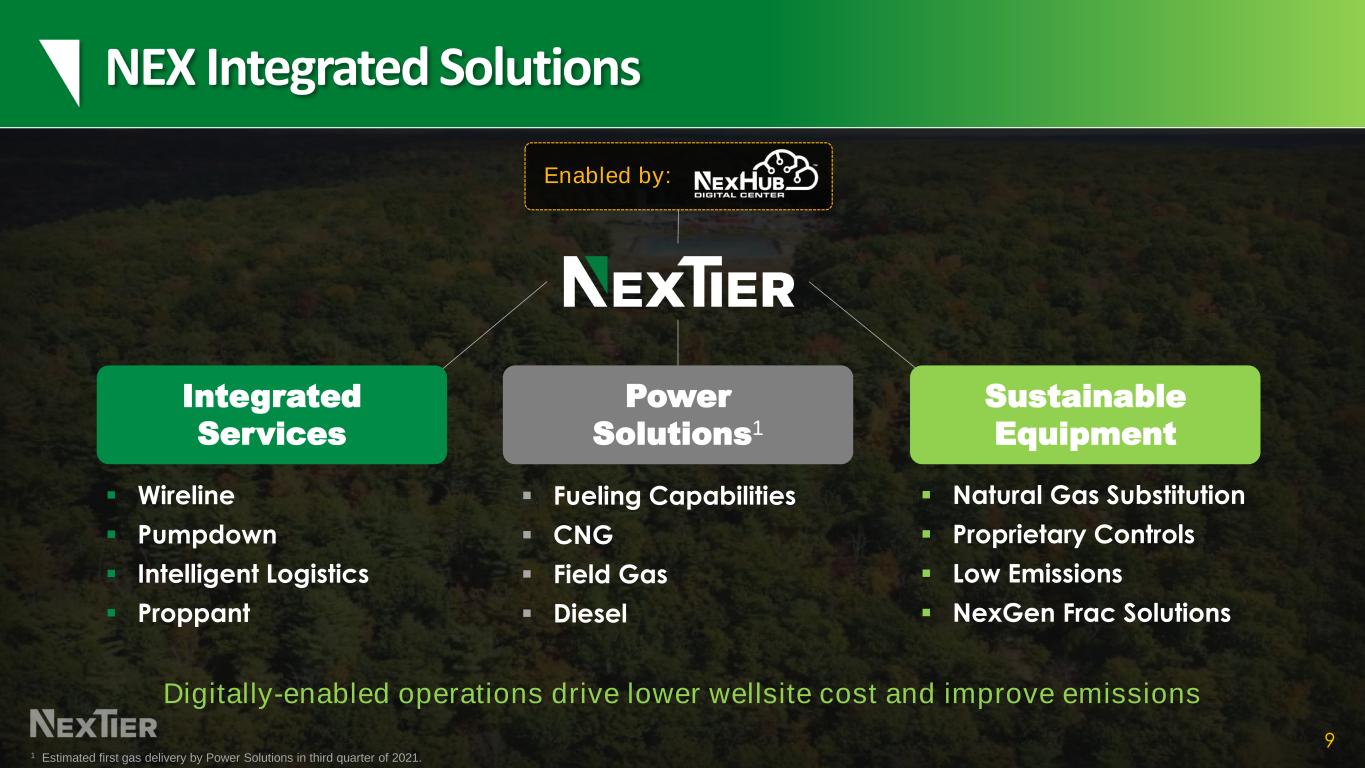
NEX Integrated Solutions 9 Integrated Services Power Solutions1 Sustainable Equipment ▪ Wireline ▪ Pumpdown ▪ Intelligent Logistics ▪ Proppant ▪ Fueling Capabilities ▪ CNG ▪ Field Gas ▪ Diesel ▪ Natural Gas Substitution ▪ Proprietary Controls ▪ Low Emissions ▪ NexGen Frac Solutions Enabled by: Digitally-enabled operations drive lower wellsite cost and improve emissions 1 Estimated first gas delivery by Power Solutions in third quarter of 2021.
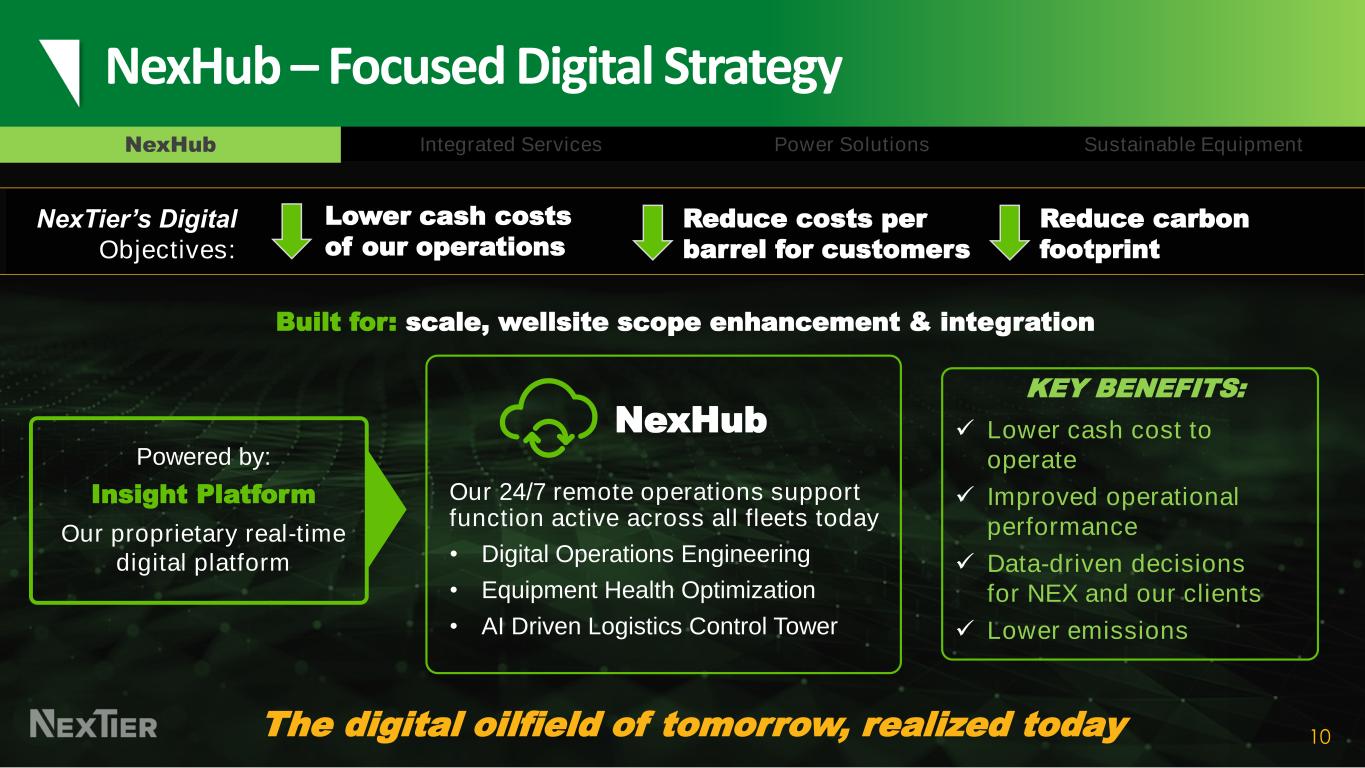
10 NexHub Sustainable EquipmentPower SolutionsIntegrated Services NexHub Our 24/7 remote operations support function active across all fleets today • Digital Operations Engineering • Equipment Health Optimization • AI Driven Logistics Control Tower Powered by: Insight Platform Our proprietary real-time digital platform Built for: scale, wellsite scope enhancement & integration KEY BENEFITS: ✓ Lower cash cost to operate ✓ Improved operational performance ✓ Data-driven decisions for NEX and our clients ✓ Lower emissions The digital oilfield of tomorrow, realized today NexTier’s Digital Objectives: Lower cash costs of our operations Reduce costs per barrel for customers Reduce carbon footprint NexHub – Focused Digital Strategy

11 Digital Solutions Powering the Ever-Changing Wellsite Reduced NPT for Frac Operations Less Wait Time At The Wellsite Increased Pumping Hours Between Failures DIGITAL OPERATIONS ENGINEERING LOGISTICS CONTROL TOWER EQUIPMENT HEALTH MONITORING MDT DATA CONTROLS Reduced Maintenance Capex per Fleet Equipment Modularity with Proprietary Controls Remote monitoring capabilities increase performance and our people efficiency Note: As of December 31, 2020 NexHub Sustainable EquipmentPower SolutionsIntegrated Services

NexTier Integrated Solutions 12 The Average Wellsite with numerous vendorsIntegrated Solutions • Safety System • Quality Management System • Risk Management System • Team focused on efficiencies 1 Based on average wellsite performing completions operations Integrated approach leads to fewer suppliers and personnel, improving financial and wellsite performance NexHub Sustainable EquipmentPower SolutionsIntegrated Services

Oct-20 Nov-20 Dec-20 Jan-21 Feb-21 Mar-21 Integrated Wireline –Adding Value to Both Frac and Wireline 13 27% Average 27% Increase in Daily Operating Completions Efficiency • NexTier Wireline & Pumpdown integrated services efficiency increases Frac profitability • Improvement of 3+ pumping hours/day on a monthly average: • One safety culture • One training program • Single point management team that owns the operations • All incentives are aligned-to-win • NexTier currently deploys the majority of Frac fleets integrated with Wireline and Pumpdown NEX Frac w/ NEX Wireline NEX Frac w/ 3rd Party Wireline Pumping Hours per Day NexHub Sustainable EquipmentPower SolutionsIntegrated Services
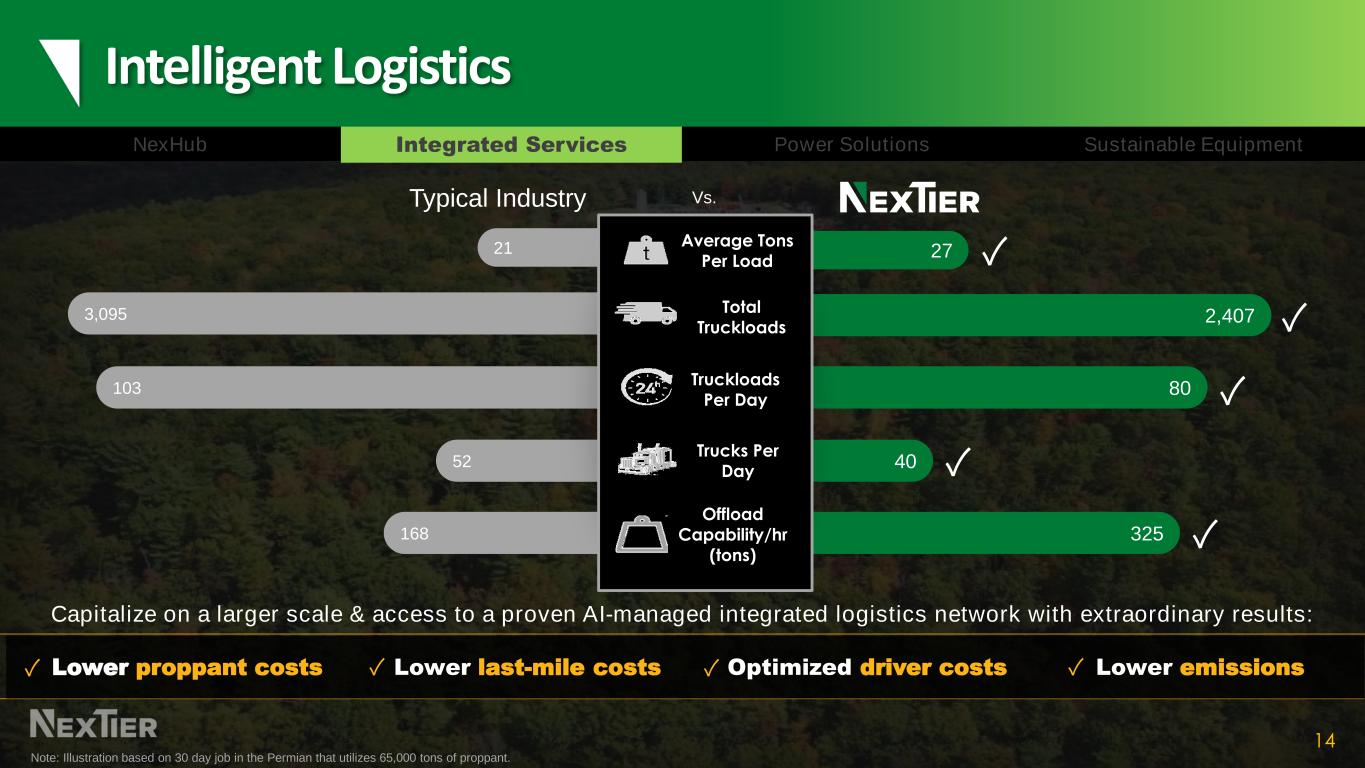
Intelligent Logistics 14 168 325 52 40 80103 3,095 2,407 21 27 Average Tons Per Load Total Truckloads Trucks Per Day Truckloads Per Day Offload Capability/hr (tons) Typical Industry ✓ ✓ ✓ ✓ ✓ Lower proppant costs Lower last-mile costs Lower emissionsOptimized driver costs✓ ✓ ✓ ✓ Note: Illustration based on 30 day job in the Permian that utilizes 65,000 tons of proppant. Capitalize on a larger scale & access to a proven AI-managed integrated logistics network with extraordinary results: Vs. NexHub Sustainable EquipmentPower SolutionsIntegrated Services

Optimized Driver Network 15 Optimized Driver Network ✓ AI-Powered Intelligence + logistics scale reduces total drivers required ✓ Reduces overall driver count by 35% ✓ Provides individual drivers w/ opportunity to earn more 1 Fleet Unbundled 1 Fleet AI & Integrated 5 Fleets Unbundled 5 Fleets AI & Integrated 10 Fleets Unbundled 10 Fleets AI & Integrated The bottom line… 1 Fleet 5 Fleets 10 Fleets 25% fewer drivers Integrated Logistics Services Driver Optimized Savings Example1 1 Drivers optimized for rig-up/down, proppant, chemicals, fuel, wireline deliveries. Based on average wellsite performing completions operations over a 30 day period. 31% fewer drivers 35% fewer drivers NexHub Sustainable EquipmentPower SolutionsIntegrated Services
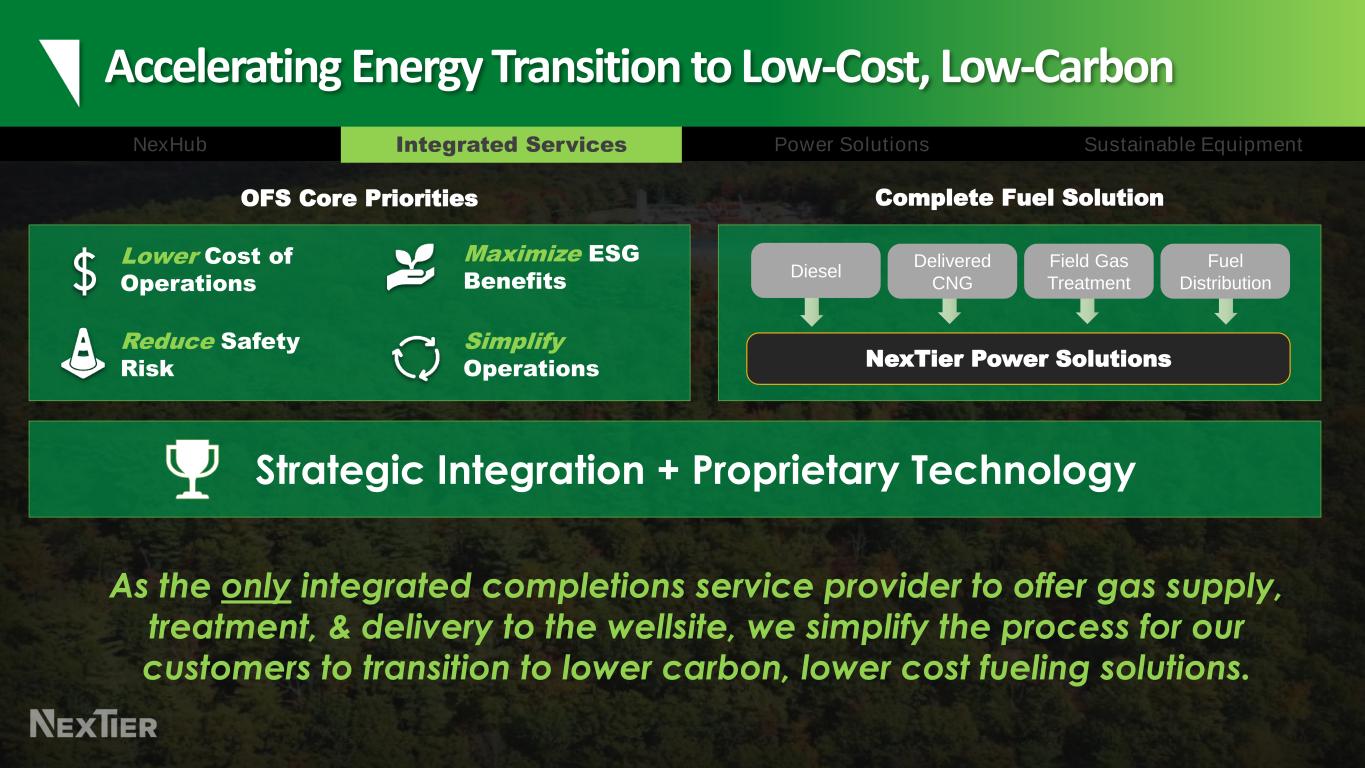
Accelerating Energy Transition to Low-Cost, Low-Carbon Lower Cost of Operations Reduce Safety Risk Maximize ESG Benefits Simplify Operations OFS Core Priorities NexTier Power Solutions Diesel Delivered CNG Field Gas Treatment Fuel Distribution Complete Fuel Solution NexHub Sustainable EquipmentPower SolutionsIntegrated Services Strategic Integration + Proprietary Technology As the only integrated completions service provider to offer gas supply, treatment, & delivery to the wellsite, we simplify the process for our customers to transition to lower carbon, lower cost fueling solutions.
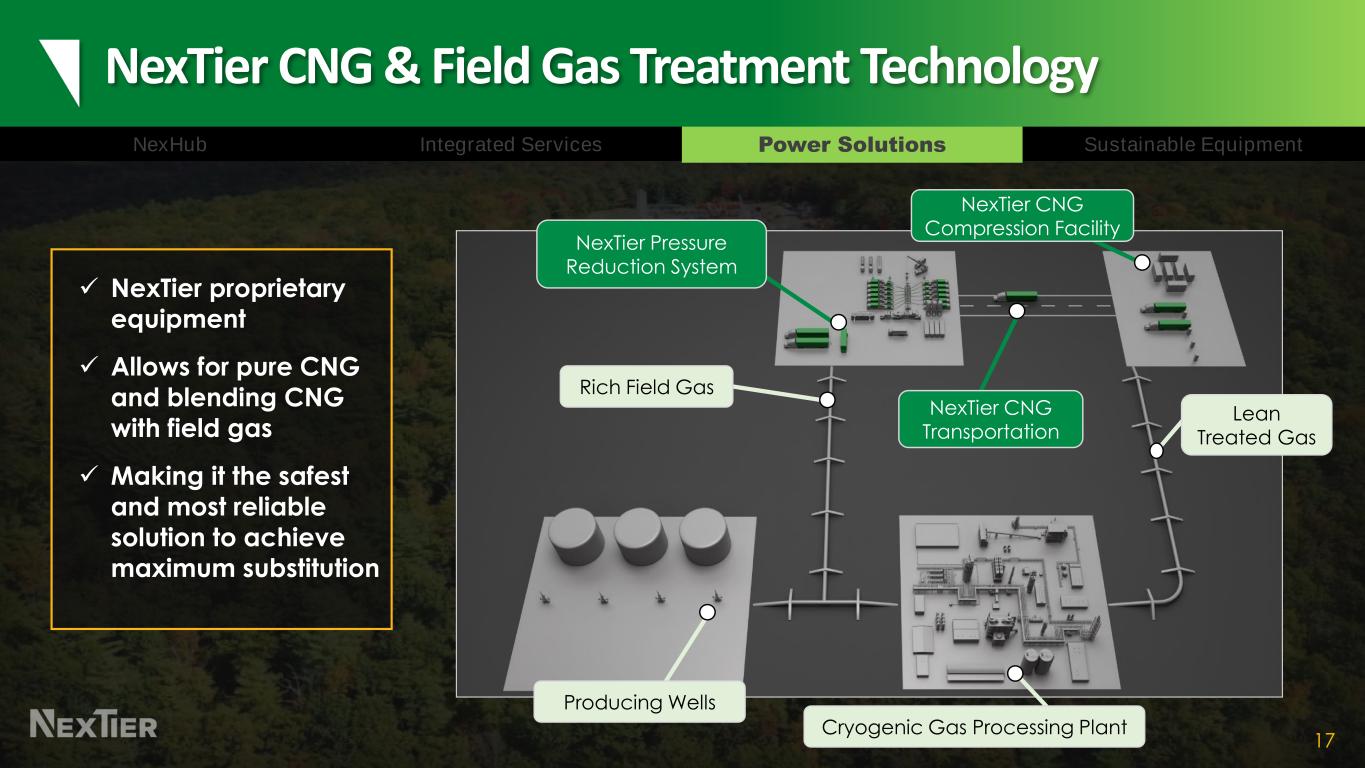
NexTier CNG & Field Gas Treatment Technology 17 ✓ NexTier proprietary equipment ✓ Allows for pure CNG and blending CNG with field gas ✓ Making it the safest and most reliable solution to achieve maximum substitution Lean Treated Gas Cryogenic Gas Processing Plant Producing Wells Rich Field Gas NexTier CNG Transportation NexTier Pressure Reduction System NexTier CNG Compression Facility NexHub Sustainable EquipmentPower SolutionsIntegrated Services

Power Solutions Goals Are Aligned With Our Customers 18 NexHub Sustainable EquipmentPower SolutionsIntegrated Services Independent Providers Reliable Gas Supply Maximum Gas Substitution Field/Residue Gas Utilization Efficient Operations Fuel Manifold - - - NO Gas Treatment - - - NO Frac - - - Diesel NO NONO NO CNG ✓✓ -NO NexTier Integrated Solutions Frac + CNG + Field Gas + Diesel + Distribution ✓ ✓ ✓ ✓ ✓
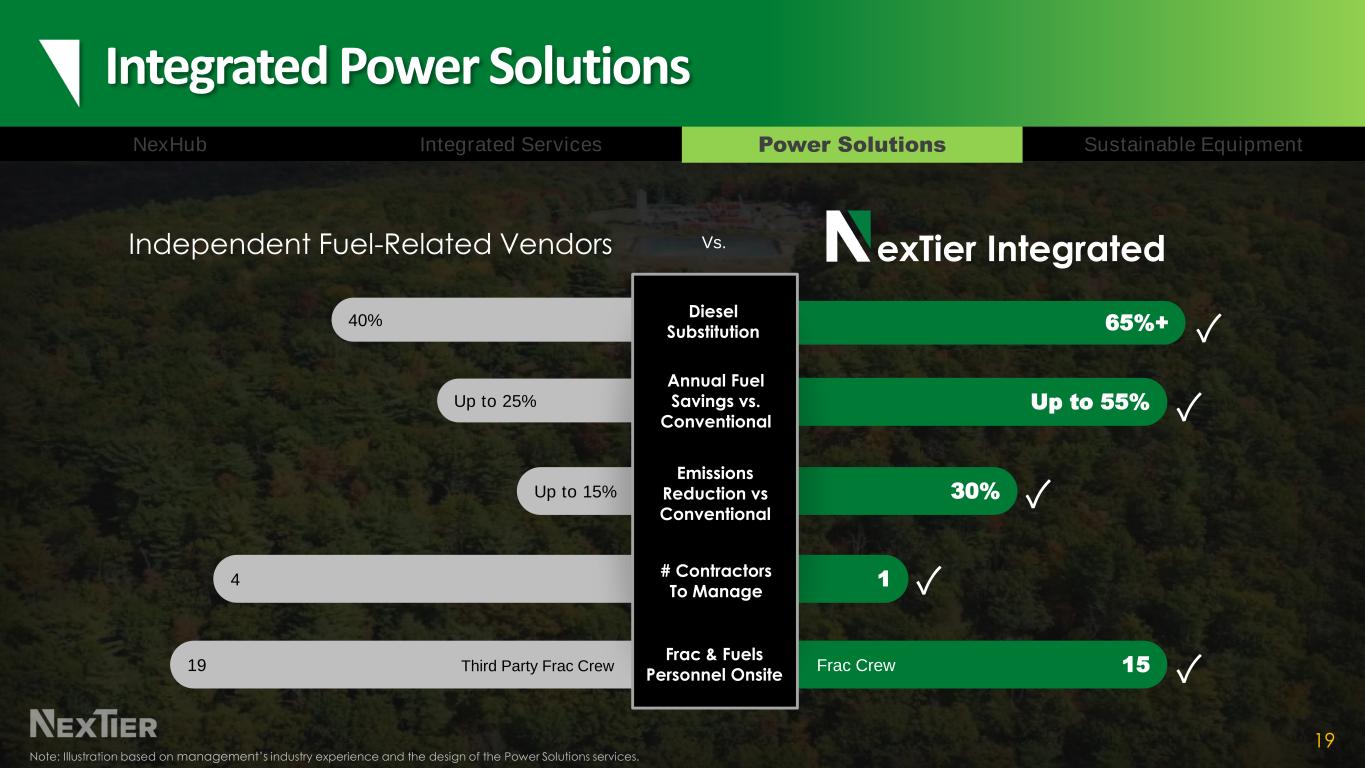
Integrated Power Solutions 19 Independent Fuel-Related Vendors Up to 55% Up to 15% 30% 19 15 14 Up to 25% 40% 65%+ Diesel Substitution Annual Fuel Savings vs. Conventional Frac & Fuels Personnel Onsite # Contractors To Manage Emissions Reduction vs Conventional exTier Integrated Third Party Frac Crew Frac Crew ✓ ✓ ✓ ✓ ✓ Vs. NexHub Sustainable EquipmentPower SolutionsIntegrated Services Note: Illustration based on management’s industry experience and the design of the Power Solutions services.

Diesel US Active Frac Fleets NexGen Frac Equipment 20 • Client demand for carbon reducing natural- gas powered capabilities in 2Q21 > 2x vs. 1Q20 • Supply of gas burning fleets approximately 25% of total deployed HHP ✓ Gas burning fleets approaching 100% utilization ✓ Fuel cost reduction up to 70% vs. conventional diesel ✓ Alternative fuels drive maximum ESG benefit, up to 30% reduction in C02e • OFS sector ability to address this market tier is limited ✓ Requires new capital allocation NexTier has the deployed in the market today that is fueled by lower emissions 75% NexHub Sustainable EquipmentPower SolutionsIntegrated Services 1 B E C D FGH Company A 1 Gas Fueled fleets include DGB, Electric & Direct Drive Fleets

Multiple NexTier NexGen Frac Market Entries 21 Conventional Diesel • Most abundant option in the market • Fleets already capitalized • Proven durability over years in service • “Typical” emissions levels ESG Pro Target Substitution: 50% • Gas conversion kits installed on existing equipment • OEM kits maximize results vs. aftermarket bolt-on • Gas substitution of 40%-55% ESG Platinum Target Substitution: 65% • Capital efficient emissions reduction • Gas conversion kits or Gas retrofit on existing equipment • Gas substitution of 55%-70% NexGen 100% Natural Gas • Ideal EFrac System • Direct Drive System • Requires significant investment capital • Underwritten by multi-year dedicated client contract • Emissions depends on Power Source Ideal EFrac Tier 2 DGB Tier 4 & Tier 2 DGB Caterpillar 3512E Tier 4 DGB engine recipient of EPA’s Clean Air Excellence Award NexHub Sustainable EquipmentPower SolutionsIntegrated Services
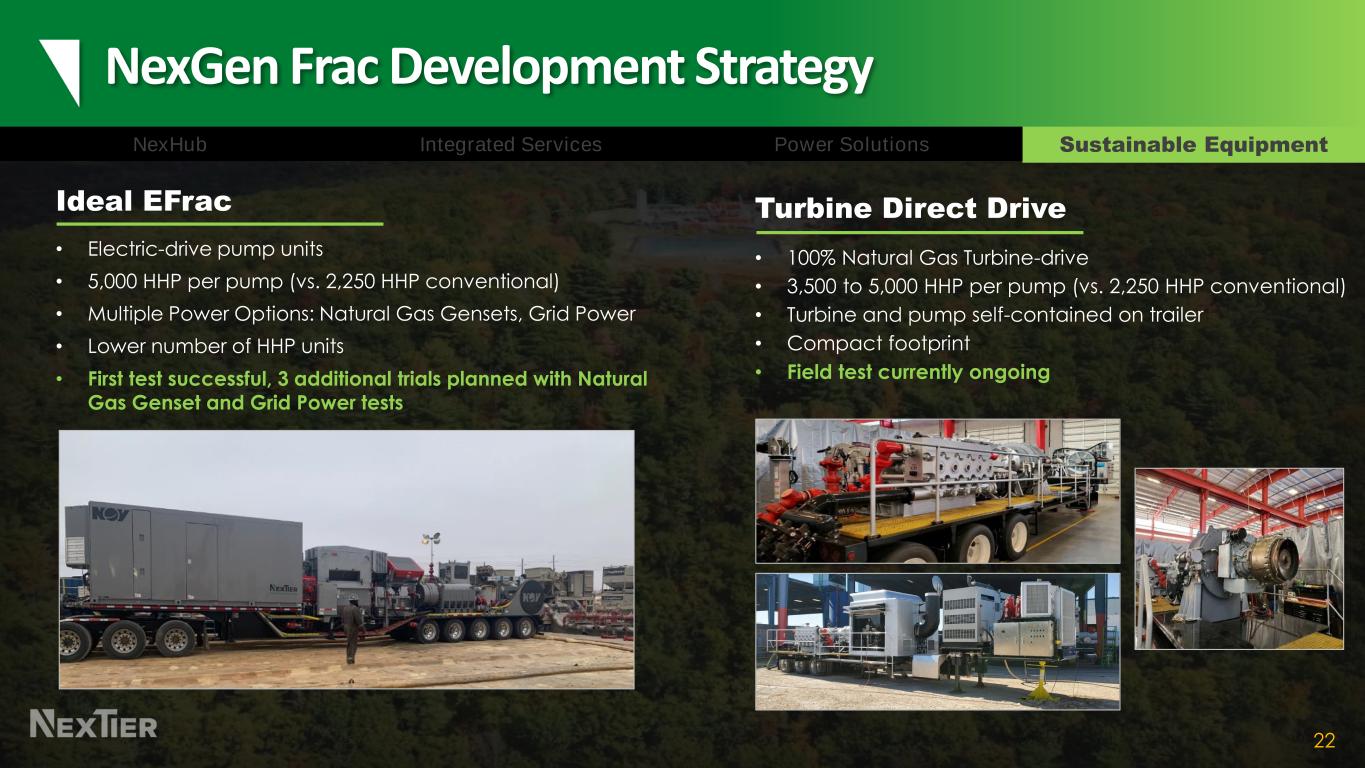
NexGen Frac Development Strategy 22 Turbine Direct Drive • 100% Natural Gas Turbine-drive • 3,500 to 5,000 HHP per pump (vs. 2,250 HHP conventional) • Turbine and pump self-contained on trailer • Compact footprint • Field test currently ongoing Ideal EFrac • Electric-drive pump units • 5,000 HHP per pump (vs. 2,250 HHP conventional) • Multiple Power Options: Natural Gas Gensets, Grid Power • Lower number of HHP units • First test successful, 3 additional trials planned with Natural Gas Genset and Grid Power tests NexHub Sustainable EquipmentPower SolutionsIntegrated Services
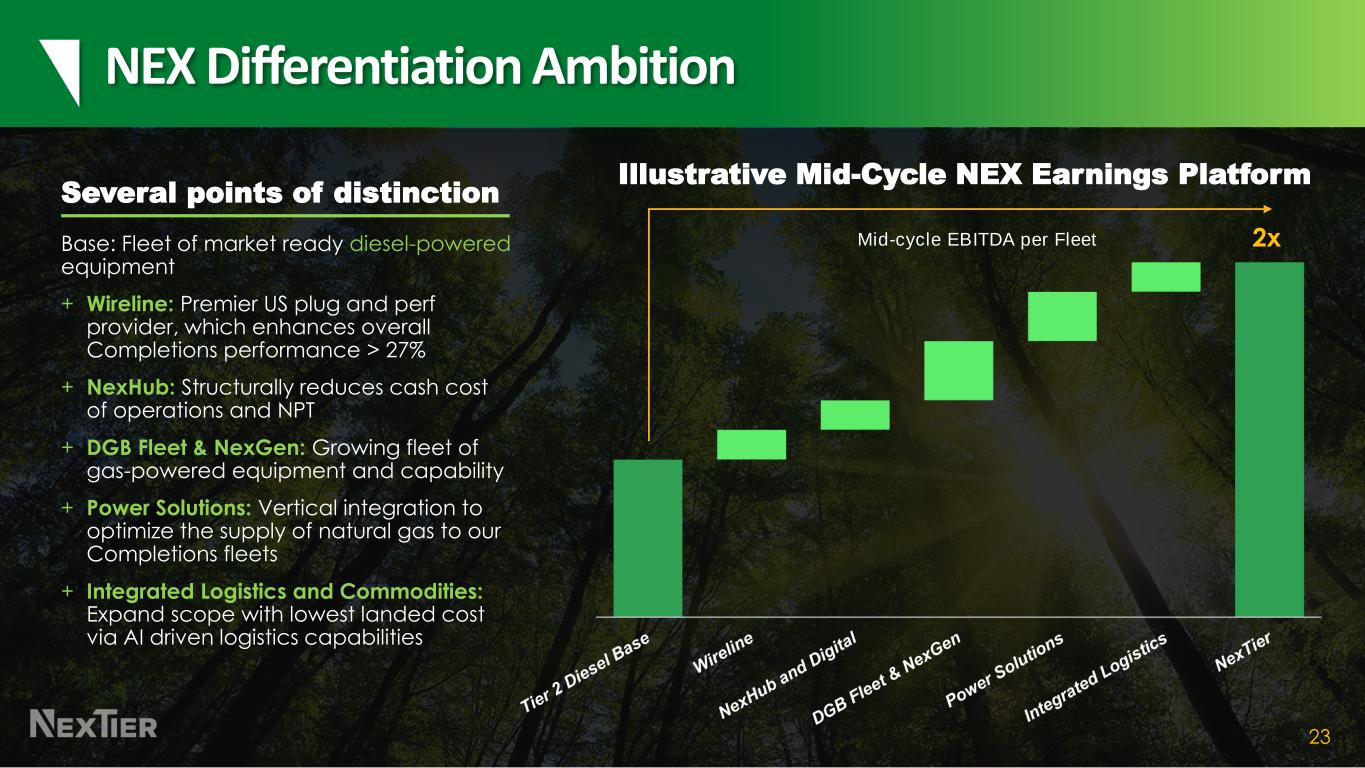
23 NEX Differentiation Ambition 2x Several points of distinction Base: Fleet of market ready diesel-powered equipment + Wireline: Premier US plug and perf provider, which enhances overall Completions performance > 27% + NexHub: Structurally reduces cash cost of operations and NPT + DGB Fleet & NexGen: Growing fleet of gas-powered equipment and capability + Power Solutions: Vertical integration to optimize the supply of natural gas to our Completions fleets + Integrated Logistics and Commodities: Expand scope with lowest landed cost via AI driven logistics capabilities Mid-cycle EBITDA per Fleet Illustrative Mid-Cycle NEX Earnings Platform

24 Compelling Valuation on Earnings Potential 2nd Most attractive valuation amongst 58 public OFS companies1 Despite… ✓ Strong balance sheet position ✓ Leading digital capabilities ✓ Integrated service offering ✓ Leading market position ✓ Strong customer relationships ✓ Responsible, market-ready assets Source: EV to EBITDA multiples per FactSet. Enterprise value as of 4/19/2021. NEX EBITDA is 2019 pro-forma adjusted EBITDA of $446 million. See Appendix for additional information. EBITDA for other OFS entities reflects 2019 reported results per FactSet. EBITDA may not be calculated the same among companies shown. OFS group includes: AKSO-NO; APY; AROC; BAS; BHGE; BOOM; CEU-CA; CFX; CKH; CLB; DNOW; DO; DRQ; ERII; ESI-CA; ESN-CA; EXTN; FET; FI; FTI; GTLS; HAL; HLX; HP; ICD; KLXE; LBRT; MRC; NBR; NCSM; NEX; NINE; NOV; NR; OII; OIS; PD-CA; PSI-CA; PTEN; PUMP; RES; RIG; RNGR; SBO-AT; SLB; SLCA; SND; SOI; SUBC-NO; TCW-CA; TDW; TS; TTI; USWS; VAL; WEIR-GB; WHD; WTTR EV / 2019 EBITDA Average Median
25 DIGITAL ENABLERS ESG FOCUS INTEGRATED SOLUTIONS The Choice for Low-Cost, Low-Carbon Completions

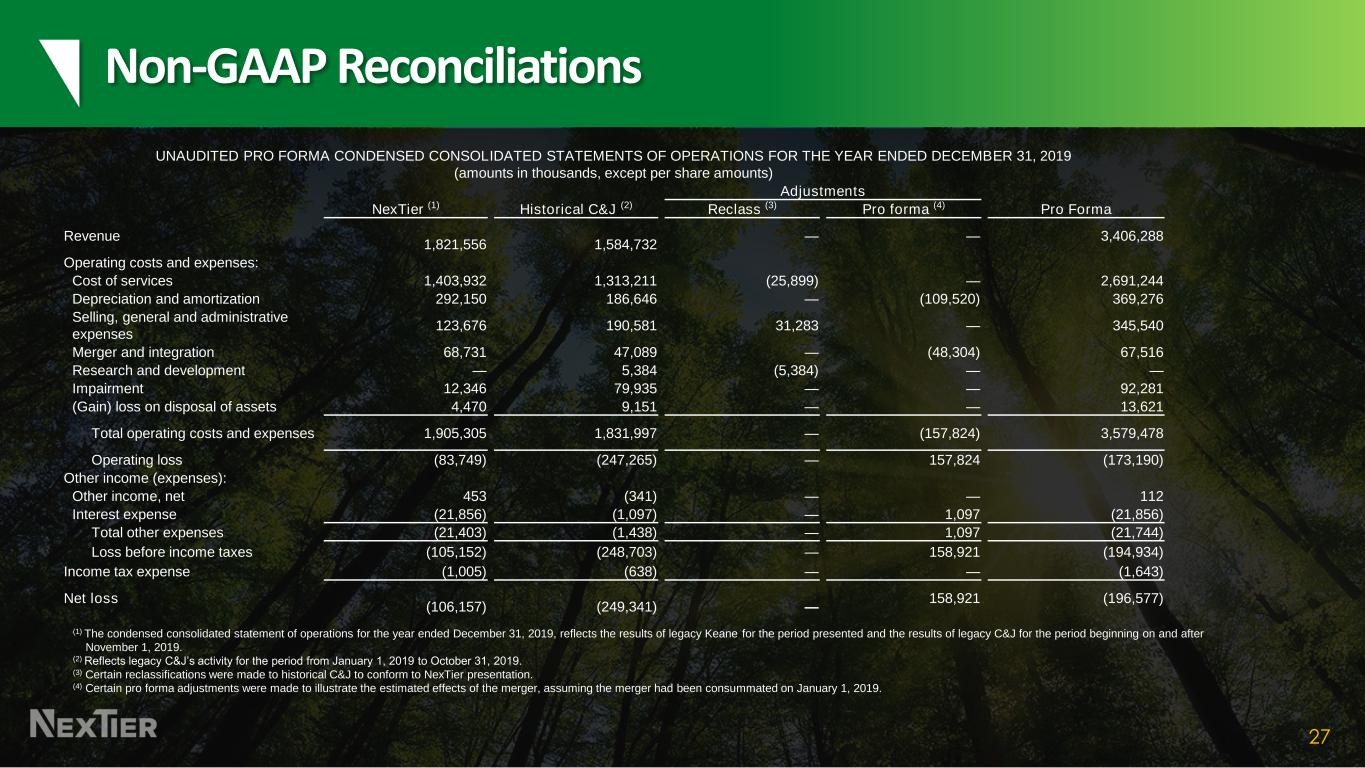
27 Non-GAAP Reconciliations UNAUDITED PRO FORMA CONDENSED CONSOLIDATED STATEMENTS OF OPERATIONS FOR THE YEAR ENDED DECEMBER 31, 2019 (amounts in thousands, except per share amounts) Adjustments NexTier (1) Historical C&J (2) Reclass (3) Pro forma (4) Pro Forma Revenue 1,821,556 1,584,732 — — 3,406,288 Operating costs and expenses: Cost of services 1,403,932 1,313,211 (25,899) — 2,691,244 Depreciation and amortization 292,150 186,646 — (109,520) 369,276 Selling, general and administrative expenses 123,676 190,581 31,283 — 345,540 Merger and integration 68,731 47,089 — (48,304) 67,516 Research and development — 5,384 (5,384) — — Impairment 12,346 79,935 — — 92,281 (Gain) loss on disposal of assets 4,470 9,151 — — 13,621 Total operating costs and expenses 1,905,305 1,831,997 — (157,824) 3,579,478 Operating loss (83,749) (247,265) — 157,824 (173,190) Other income (expenses): Other income, net 453 (341) — — 112 Interest expense (21,856) (1,097) — 1,097 (21,856) Total other expenses (21,403) (1,438) — 1,097 (21,744) Loss before income taxes (105,152) (248,703) — 158,921 (194,934) Income tax expense (1,005) (638) — — (1,643) Net loss (106,157) (249,341) — 158,921 (196,577) (1) The condensed consolidated statement of operations for the year ended December 31, 2019, reflects the results of legacy Keane for the period presented and the results of legacy C&J for the period beginning on and after November 1, 2019. (2) Reflects legacy C&J’s activity for the period from January 1, 2019 to October 31, 2019. (3) Certain reclassifications were made to historical C&J to conform to NexTier presentation. (4) Certain pro forma adjustments were made to illustrate the estimated effects of the merger, assuming the merger had been consummated on January 1, 2019.
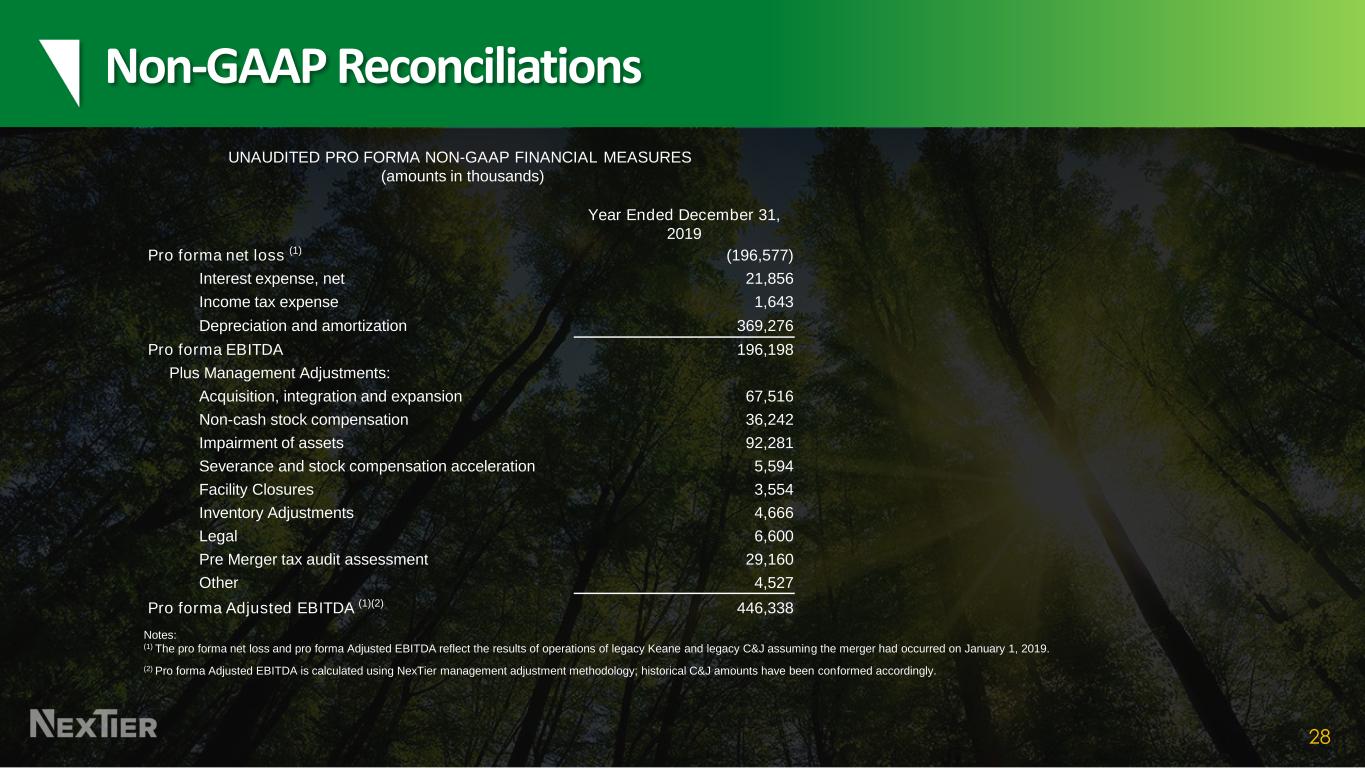
28 Non-GAAP Reconciliations Year Ended December 31, 2019 Pro forma net loss (1) (196,577) Interest expense, net 21,856 Income tax expense 1,643 Depreciation and amortization 369,276 Pro forma EBITDA 196,198 Plus Management Adjustments: Acquisition, integration and expansion 67,516 Non-cash stock compensation 36,242 Impairment of assets 92,281 Severance and stock compensation acceleration 5,594 Facility Closures 3,554 Inventory Adjustments 4,666 Legal 6,600 Pre Merger tax audit assessment 29,160 Other 4,527 Pro forma Adjusted EBITDA (1)(2) 446,338 Notes: (1) The pro forma net loss and pro forma Adjusted EBITDA reflect the results of operations of legacy Keane and legacy C&J assuming the merger had occurred on January 1, 2019. (2) Pro forma Adjusted EBITDA is calculated using NexTier management adjustment methodology; historical C&J amounts have been conformed accordingly. UNAUDITED PRO FORMA NON-GAAP FINANCIAL MEASURES (amounts in thousands)

