Attached files
| file | filename |
|---|---|
| EX-99.2 - EX-99.2 - Calumet Specialty Products Partners, L.P. | exhibit992-financialinform.htm |
| EX-99.1 - EX-99.1 - Calumet Specialty Products Partners, L.P. | exhibit991-segmentchange03.htm |
| 8-K - 8-K - Calumet Specialty Products Partners, L.P. | clmt-20210426.htm |

External Reporting Adjustments April 2021

© 2021 Calumet Specialty Products Partners, L.P. 2 • Historically, the Partnership reported its results in the following three segments: • Specialty products • Fuel products • Corporate • During the first quarter of 2021, as a result of a change in how the Partnership’s chief operating decision maker assesses the performance of the Partnership’s business, allocates resources and makes operating decisions, the Partnership will report its results in the following four segments: • Specialty Products and Solutions • Performance Brands • Montana/Renewables • Corporate Segment Reporting Change

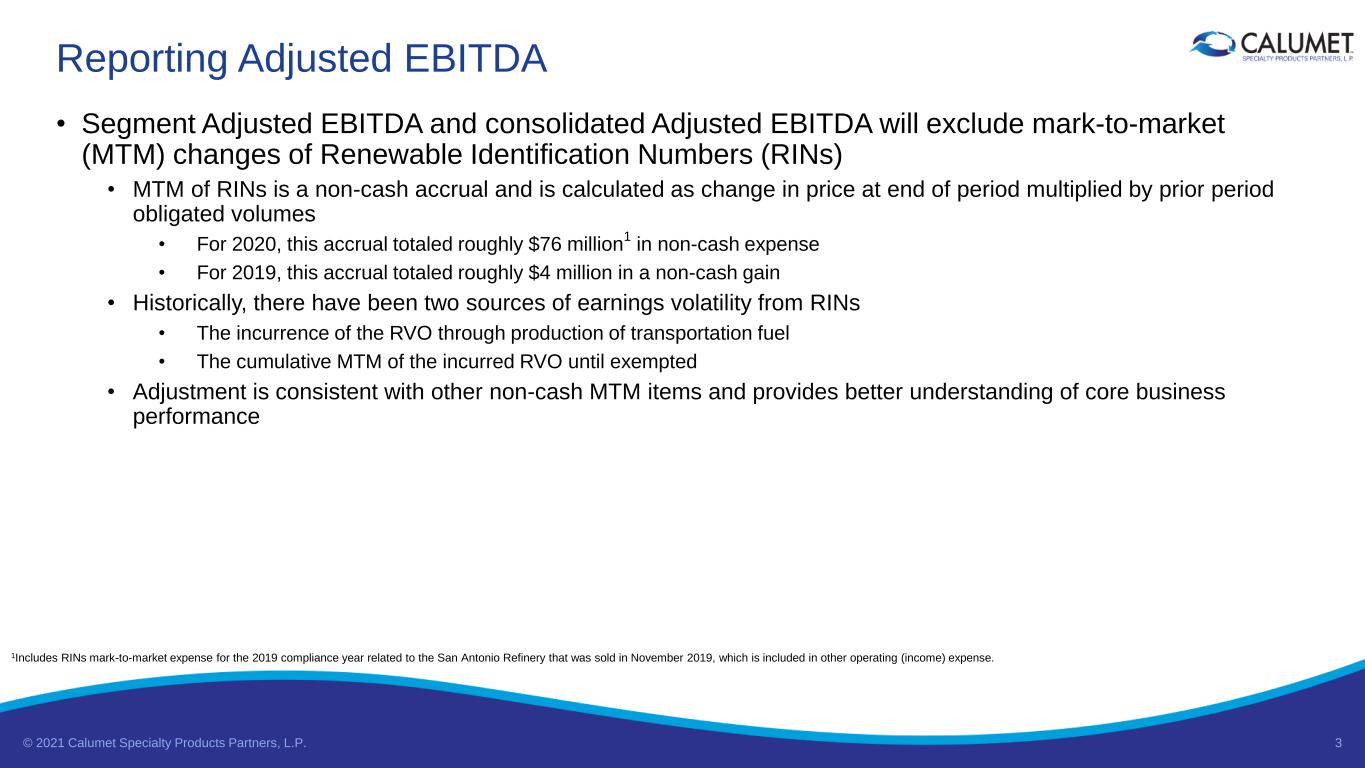
© 2021 Calumet Specialty Products Partners, L.P. 3 • Segment Adjusted EBITDA and consolidated Adjusted EBITDA will exclude mark-to-market (MTM) changes of Renewable Identification Numbers (RINs) • MTM of RINs is a non-cash accrual and is calculated as change in price at end of period multiplied by prior period obligated volumes • For 2020, this accrual totaled roughly $76 million 1 in non-cash expense • For 2019, this accrual totaled roughly $4 million in a non-cash gain • Historically, there have been two sources of earnings volatility from RINs • The incurrence of the RVO through production of transportation fuel • The cumulative MTM of the incurred RVO until exempted • Adjustment is consistent with other non-cash MTM items and provides better understanding of core business performance Reporting Adjusted EBITDA 1Includes RINs mark-to-market expense for the 2019 compliance year related to the San Antonio Refinery that was sold in November 2019, which is included in other operating (income) expense.

© 2021 Calumet Specialty Products Partners, L.P. 4 • Transportation Costs moved from Operating expense to Cost of Sales • Enhances understanding of profitability by including both revenue from billed freight and the associated transportation expense in Adjusted Gross Profit • Historically, billed transportation had been included in Revenue on the Income Statement, while transportation costs had been reported within Operating Costs and Expenses • In 2020, Calumet reported $111 million in transportation costs, or $3.50/bbl • In 2019, Calumet reported $123 million in transportation costs, or $3.21/bbl • Adjusted Gross Profit 1 will exclude RINs MTM and Depreciation and Amortization expenses • Aligns with revised Adjusted EBITDA definition and increases transparency of business profitability • Introduction of new Operating Metric: Specialty Products and Solutions (SPS) Material Margin 2 • Increases transparency into margins of specialty products and fuels productions within the SPS segment Reporting Adjusted Gross Profit These reporting adjustments improve visibility into the performance of our businesses 1See slide 5 for historical reconciliations of Gross Profit (Loss) to revised Adjusted Gross Profit 2See slide 6 for calculation of Specialty Products and Solutions Material Margin

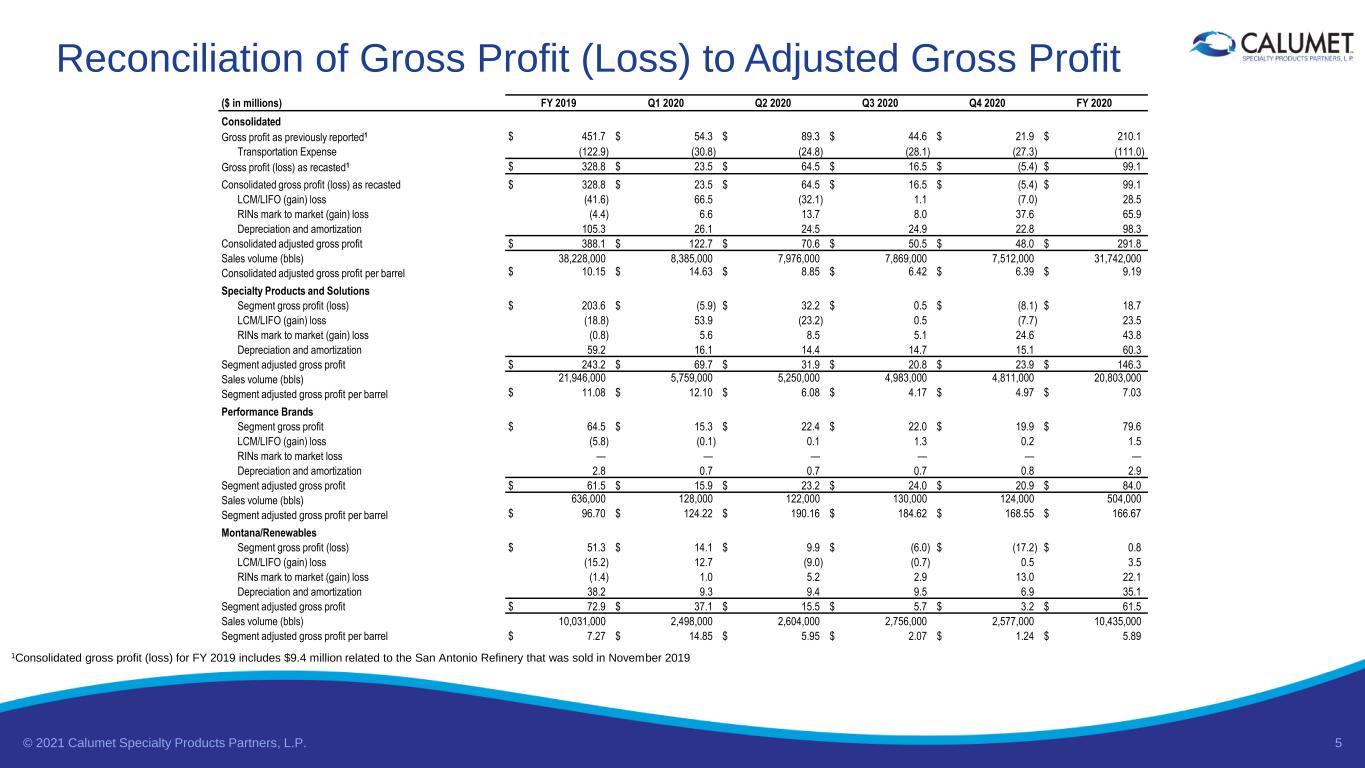
© 2021 Calumet Specialty Products Partners, L.P. 5 Reconciliation of Gross Profit (Loss) to Adjusted Gross Profit ($ in millions) FY 2019 Q1 2020 Q2 2020 Q3 2020 Q4 2020 FY 2020 Consolidated Gross profit as previously reported1 $ 451.7 $ 54.3 $ 89.3 $ 44.6 $ 21.9 $ 210.1 Transportation Expense (122.9) (30.8) (24.8) (28.1) (27.3) (111.0) Gross profit (loss) as recasted1 $ 328.8 $ 23.5 $ 64.5 $ 16.5 $ (5.4) $ 99.1 Consolidated gross profit (loss) as recasted $ 328.8 $ 23.5 $ 64.5 $ 16.5 $ (5.4) $ 99.1 LCM/LIFO (gain) loss (41.6) 66.5 (32.1) 1.1 (7.0) 28.5 RINs mark to market (gain) loss (4.4) 6.6 13.7 8.0 37.6 65.9 Depreciation and amortization 105.3 26.1 24.5 24.9 22.8 98.3 Consolidated adjusted gross profit $ 388.1 $ 122.7 $ 70.6 $ 50.5 $ 48.0 $ 291.8 Sales volume (bbls) 38,228,000 8,385,000 7,976,000 7,869,000 7,512,000 31,742,000 Consolidated adjusted gross profit per barrel $ 10.15 $ 14.63 $ 8.85 $ 6.42 $ 6.39 $ 9.19 Specialty Products and Solutions Segment gross profit (loss) $ 203.6 $ (5.9) $ 32.2 $ 0.5 $ (8.1) $ 18.7 LCM/LIFO (gain) loss (18.8) 53.9 (23.2) 0.5 (7.7) 23.5 RINs mark to market (gain) loss (0.8) 5.6 8.5 5.1 24.6 43.8 Depreciation and amortization 59.2 16.1 14.4 14.7 15.1 60.3 Segment adjusted gross profit $ 243.2 $ 69.7 $ 31.9 $ 20.8 $ 23.9 $ 146.3 Sales volume (bbls) 21,946,000 5,759,000 5,250,000 4,983,000 4,811,000 20,803,000 Segment adjusted gross profit per barrel $ 11.08 $ 12.10 $ 6.08 $ 4.17 $ 4.97 $ 7.03 Performance Brands Segment gross profit $ 64.5 $ 15.3 $ 22.4 $ 22.0 $ 19.9 $ 79.6 LCM/LIFO (gain) loss (5.8) (0.1) 0.1 1.3 0.2 1.5 RINs mark to market loss — — — — — — Depreciation and amortization 2.8 0.7 0.7 0.7 0.8 2.9 Segment adjusted gross profit $ 61.5 $ 15.9 $ 23.2 $ 24.0 $ 20.9 $ 84.0 Sales volume (bbls) 636,000 128,000 122,000 130,000 124,000 504,000 Segment adjusted gross profit per barrel $ 96.70 $ 124.22 $ 190.16 $ 184.62 $ 168.55 $ 166.67 Montana/Renewables Segment gross profit (loss) $ 51.3 $ 14.1 $ 9.9 $ (6.0) $ (17.2) $ 0.8 LCM/LIFO (gain) loss (15.2) 12.7 (9.0) (0.7) 0.5 3.5 RINs mark to market (gain) loss (1.4) 1.0 5.2 2.9 13.0 22.1 Depreciation and amortization 38.2 9.3 9.4 9.5 6.9 35.1 Segment adjusted gross profit $ 72.9 $ 37.1 $ 15.5 $ 5.7 $ 3.2 $ 61.5 Sales volume (bbls) 10,031,000 2,498,000 2,604,000 2,756,000 2,577,000 10,435,000 Segment adjusted gross profit per barrel $ 7.27 $ 14.85 $ 5.95 $ 2.07 $ 1.24 $ 5.89 1Consolidated gross profit (loss) for FY 2019 includes $9.4 million related to the San Antonio Refinery that was sold in November 2019

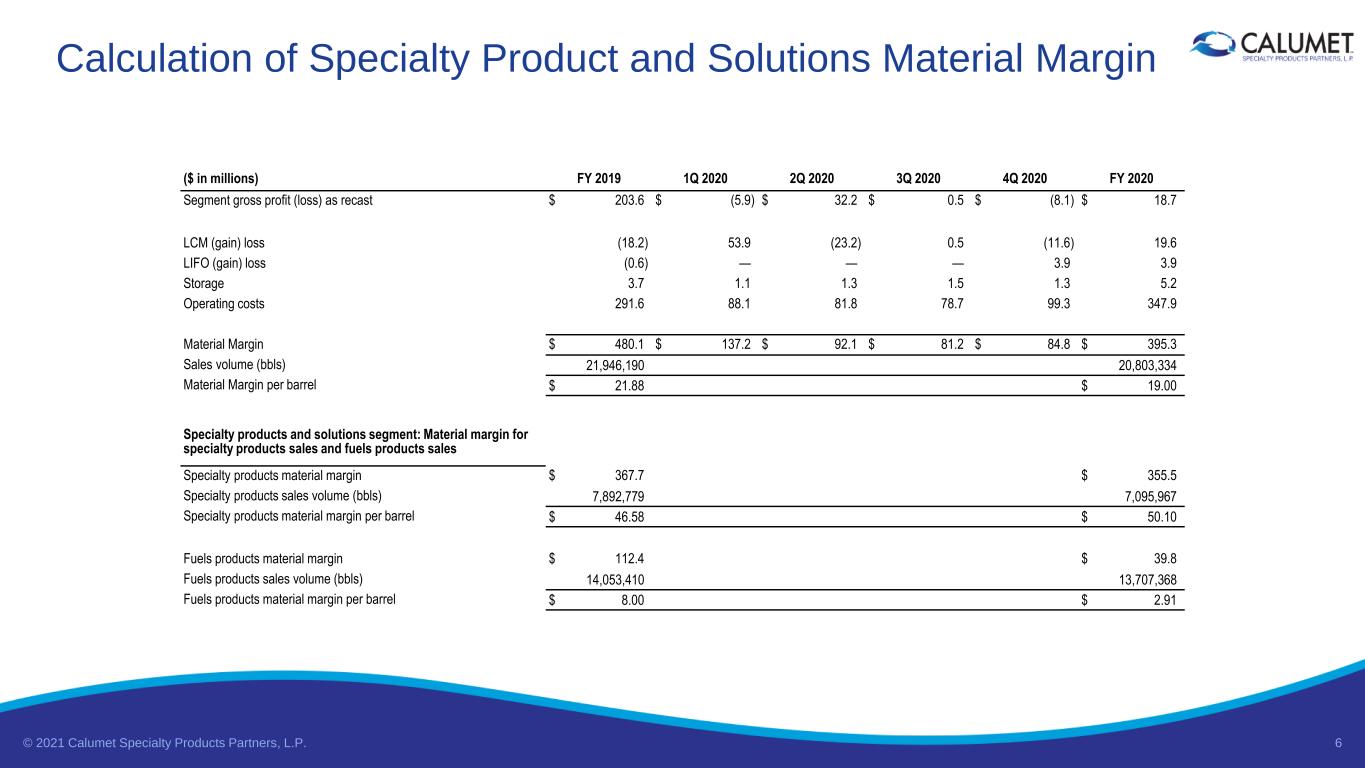
© 2021 Calumet Specialty Products Partners, L.P. 6 Calculation of Specialty Product and Solutions Material Margin ($ in millions) FY 2019 1Q 2020 2Q 2020 3Q 2020 4Q 2020 FY 2020 Segment gross profit (loss) as recast $ 203.6 $ (5.9) $ 32.2 $ 0.5 $ (8.1) $ 18.7 LCM (gain) loss (18.2) 53.9 (23.2) 0.5 (11.6) 19.6 LIFO (gain) loss (0.6) — — — 3.9 3.9 Storage 3.7 1.1 1.3 1.5 1.3 5.2 Operating costs 291.6 88.1 81.8 78.7 99.3 347.9 Material Margin $ 480.1 $ 137.2 $ 92.1 $ 81.2 $ 84.8 $ 395.3 Sales volume (bbls) 21,946,190 20,803,334 Material Margin per barrel $ 21.88 $ 19.00 Specialty products and solutions segment: Material margin for specialty products sales and fuels products sales Specialty products material margin $ 367.7 $ 355.5 Specialty products sales volume (bbls) 7,892,779 7,095,967 Specialty products material margin per barrel $ 46.58 $ 50.10 Fuels products material margin $ 112.4 $ 39.8 Fuels products sales volume (bbls) 14,053,410 13,707,368 Fuels products material margin per barrel $ 8.00 $ 2.91
