Attached files
| file | filename |
|---|---|
| 8-K - FORM 8-K - Horizon Acquisition Corp | tm2113760d1_8k.htm |
| EX-99.1 - EXHIBIT 99.1 - Horizon Acquisition Corp | tm2113760d1_ex99-1.htm |
Exhibit 99.2
 |
Investor April 2021 Presentation |
 |
Disclaimer This confidential presentation (the “presentation”) is being delivered to you by Horizon Acquisition Corporation (“Horizon”) and Hoya Intermediate, LLC, an indirect parent of Vivid Seats L.L.C. (“Vivid Seats”) for use by Vivid Seats and Horizon in connection with their proposed business combination and the offering of the securities of the post-business combination company in a private placement (the “Transaction”). This presentation is for information purposes only and is being provided to you solely in your capacity as a potential investor in considering an investment in Vivid Seats. Any reproduction or distribution of this presentation, in whole or in part, or the disclosure of its contents, without the prior consent of Horizon or Vivid Seats is prohibited. By accepting this presentation, each recipient and its directors, partners, officers, employees, attorney(s), agents and representatives (“recipient”) agrees: (i) to maintain the confidentiality of all information that is contained in this presentation and not already in the public domain; and (ii) to return or destroy all copies of this presentation or portions thereof in its possession following the request for the return or destruction of such copies. This presentation and any oral statements made in connection with this presentation shall neither constitute an offer to sell nor the solicitation of an offer to buy any securities, or the solicitation of any proxy, vote, consent or approval in any jurisdiction in connection with the proposed business combination, nor shall there be any sale of securities in any jurisdiction in which the offer, solicitation or sale would be unlawful prior to the registration or qualification under the securities laws of any such jurisdiction. This communication is restricted by law; it is not intended for distribution to, or use by any person in, any jurisdiction where such distribution or use would be contrary to local law or regulation. No Representations and Warranties This presentation is for informational purposes only and does not purport to contain all of the information that may be required to evaluate a possible investment decision with respect to Vivid Seats. The recipient agrees and acknowledges that this presentation is not intended to form the basis of any investment decision by the recipient and does not constitute investment, tax or legal advice. No representation or warranty, express or implied, is or will be given by Horizon or Vivid Seats or any of their respective affiliates, directors, officers, employees or advisers or any other person as to the accuracy or completeness of the information in this presentation or any other written, oral or other communications transmitted or otherwise made available to any party in the course of its evaluation of a possible transaction between Horizon and Vivid Seats and no responsibility or liability whatsoever is accepted for the accuracy or sufficiency thereof or for any errors, omissions or misstatements, negligent or otherwise, relating thereto. The recipient also acknowledges and agrees that the information contained in this presentation is preliminary in nature and is subject to change, and any such changes may be material. Horizon and Vivid Seats disclaim any duty to update the information contained in this presentation. Forward-Looking Statements This presentation includes “forward-looking statements” within the meaning of the “safe harbor” provisions of the Private Securities Litigation Reform Act of 1995. Horizon’s and Vivid Seats’ actual results may differ from their expectations, estimates and projections and consequently, you should not rely on these forward-looking statements as predictions of future events. Words such as “expect”, “estimate”, “project”, “budget”, “forecast”, “anticipate”, “intend”, “plan”, “may”, “will”, “could”, “should”, “believes”, “predicts”, “potential”, “continue”, and similar expressions are intended to identify such forward-looking statements. These forward-looking statements include, without limitation, Horizon’s and Vivid Seats’ expectations with respect to future performance and anticipated financial impacts of the Transaction, the satisfaction of closing conditions to the Transaction and the timing of the completion of the Transaction. These forward-looking statements involve significant risks and uncertainties that could cause the actual results to differ materially from the expected results. You should carefully consider the risks and uncertainties described in the “Risk Factors” section of Horizon’s registration statement on Form S-1. In addition, there will be risks and uncertainties described in the proxy statement/prospectus on Form S-4 relating to the Transaction, which is expected to be filed by Vivid Seats with the Securities and Exchange Commission (the “SEC”) and other documents filed by Horizon from time to time with the SEC. These filings identify and address other important risks and uncertainties that could cause actual events and results to differ materially from those contained in the forward looking statements. Most of these factors are outside Horizon’s and Vivid Seats’ control and are difficult to predict. Factors that may cause such differences include, but are not limited to: (1) the outcome of any legal proceedings that may be instituted against Horizon or Vivid Seats following the announcement of the Transaction; (2) the inability to complete the Transaction, including due to the inability to concurrently close the business combination and the private placement of common stock or due to failure to obtain approval of the stockholders of Horizon; (3) delays in obtaining, adverse conditions contained in, or the inability to obtain necessary regulatory approvals or complete regulatory reviews required to complete the Transaction; (4) the risk that the Transaction disrupts current plans and operations as a result of the announcement and consummation of the Transaction; (5) the inability to recognize the anticipated benefits of the Transaction, which may be affected by, among other things, competition, the ability of the combined company to grow and manage growth profitably, maintain relationships with customers and suppliers and retain key employees; (6) costs related to the Transaction; (7) changes in the applicable laws or regulations; (8) the possibility that the combined company may be adversely affected by other economic, business, and/or competitive factors; (9) the impact of the global COVID-19 pandemic; and (10) other risks and uncertainties indicated from time to time described in Horizon’s registration on Form S-1, including those under “Risk Factors” therein, and in Horizon’s other filings with the SEC. Horizon and Vivid Seats caution that the foregoing list of factors is not exclusive and not to place undue reliance upon any forward-looking statements, including projections, which speak only as of the date made. Neither Horizon nor Vivid Seats undertakes or accepts any obligation to release publicly any updates or revisions to any forward-looking statements to reflect any change in its expectations or any change in events, conditions or circumstances on which any such statement is based. Industry and Market Data In this presentation, Horizon and Vivid Seats rely on and refer to publicly available information and statistics regarding market participants in the sectors in which Vivid Seats competes and other industry data. Any comparison of Vivid Seats to the industry or to any of its competitors is based on this publicly available information and statistics and such comparisons assume the reliability of the information available to Vivid Seats. Vivid Seats obtained this information and statistics from third-party sources, including reports by market research firms and company filings. While Vivid Seats believes such third-party information is reliable, there can be no assurance as to the accuracy or completeness of the indicated information. Neither Vivid Seats nor Horizon has independently verified the information provided by the third-party sources. Trademarks This presentation may contain trademarks, service marks, trade names and copyrights of other companies, which are the property of their respective owners. Solely for convenience, some of the trademarks, service marks, trade names and copyrights referred to in this presentation may be listed without the TM, SM © or ® symbols, but Horizon and Vivid Seats will assert, to the fullest extent under applicable law, the rights of the applicable owners, if any, to these trademarks, service marks, trade names and copyrights. 2 |
 |
Disclaimer (cont’d) Private Placement The securities to which this presentation relates have not been registered under the Securities Act of 1933, as amended (the “Securities Act”), or the securities laws of any other jurisdiction. This presentation relates to securities that Vivid Seats intends to offer in reliance on exemptions from the registration requirements of the Securities Act and other applicable laws. These exemptions apply to offers and sales of securities that do not involve a public offering. The securities have not been approved or recommended by any federal, state or foreign securities authorities, nor have any of these authorities passed upon the merits of this offering or determined that this presentation is accurate or complete. Any representation to the contrary is a criminal offense. Financial and Other Information This presentation contains certain estimated preliminary financial results and key operating metrics for the year ended December 31, 2020, and the historical financial information respecting Vivid Seats contained in this presentation has been taken from or prepared based on historical financial statements of Vivid Seats, including unaudited financial statements for its fiscal year ended December 31, 2020. This information is preliminary and subject to change. As such, actual results may differ from the estimated preliminary results presented here and will not be finalized until year-end accounting procedures are completed. This presentation includes certain non-GAAP financial measures (including on a forward-looking basis) such as EBITDA, EBITDA Margin, Adjusted EBITDA and Free Cash Flow. These non-GAAP measures are an addition, and not a substitute for or superior to, measures of financial performance prepared in accordance with GAAP and should not be considered as an alternative to net income, operating income or any other performance measures derived in accordance with GAAP. Vivid Seats believes that these non-GAAP measures of financial results (including on a forward-looking basis) provide useful supplemental information to investors about Vivid Seats. Vivid Seats’ management uses forward-looking non-GAAP measures to evaluate Vivid Seats’ projected financials and operating performance. However, there are a number of limitations related to the use of these non-GAAP measures and their nearest GAAP equivalents, including that they exclude significant expenses that are required by GAAP to be recorded in Vivid Seats’ financial measures. In addition, other companies may calculate non-GAAP measures differently, or may use other measures to calculate their financial performance, and therefore, Vivid Seats’ non-GAAP measures may not be directly comparable to similarly titled measures of other companies. Additionally, to the extent that forward-looking non-GAAP financial measures are provided, they are presented on a non-GAAP basis without reconciliations of such forward-looking non-GAAP measures due to the inherent difficulty in forecasting and quantifying certain amounts that are necessary for such reconciliations. Use of Projections This presentation also contains certain financial forecasts, including projected revenue. Neither Horizon’s nor Vivid Seats’ independent auditors have studied, reviewed, compiled or performed any procedures with respect to the projections for the purpose of their inclusion in this presentation, and accordingly, neither of them expressed an opinion or provided any other form of assurance with respect thereto for the purpose of this presentation. These projections are for illustrative purposes only and should not be relied upon as being necessarily indicative of future results. In this presentation, certain of the above-mentioned projected information has been provided for purposes of providing comparisons with historical data. The assumptions and estimates underlying the prospective financial information are inherently uncertain and are subject to a wide variety of significant business, economic and competitive risks and uncertainties that could cause actual results to differ materially from those contained in the prospective financial information. Projections are inherently uncertain due to a number of factors outside of Horizon’s or Vivid Seats’ control. While all financial projections, estimates and targets are necessarily speculative, Horizon and Vivid Seats believe that the preparation of prospective financial information involves increasingly higher levels of uncertainty the further out the projection, estimate or target extends from the date of preparation. Accordingly, there can be no assurance that the prospective results are indicative of future performance of the combined company after the Transaction or that actual results will not differ materially from those presented in the prospective financial information. Inclusion of the prospective financial information in this presentation should not be regarded as a representation by any person that the results contained in the prospective financial information will be achieved. Participation in Solicitation Horizon and Vivid Seats and their respective directors and executive officers, under SEC rules, may be deemed to be participants in the solicitation of proxies of Horizon’s shareholders in connection with the proposed Transaction. Investors and security holders may obtain more detailed information regarding the names and interests in the proposed Transaction of Horizon’s directors and officers in Horizon’s filings with the SEC, including Horizon’s registration statement on Form S-1, which was originally filed with the SEC on August 3, 2020. To the extent that holdings of Horizon’s securities have changed from the amounts reported in Horizon’s registration statement on Form S-1, such changes have been or will be reflected on Statements of Change in Ownership on Form S-4 filed with the SEC. Information regarding the persons who may, under SEC rules, be deemed participants in the solicitation of proxies to Horizon’s shareholders in connection with the proposed Transaction will be set forth in the proxy statement/prospectus on Form S-4 for the proposed Transaction, which is expected to be filed by Vivid Seats with the SEC. Investors and security holders of Horizon and Vivid Seats are urged to read the proxy statement/prospectus and other relevant documents that will be filed with the SEC carefully and in their entirety when they become available because they will contain important information about the proposed Transaction. Investors and security holders will be able to obtain free copies of the proxy statement and other documents containing important information about Horizon and Vivid Seats through the website maintained by the SEC at www.sec.gov. Copies of the documents filed with the SEC by Horizon can be obtained free of charge by directing a written request to Horizon Acquisition Corporation, 600 Steamboat Road, Suite 200, Greenwich, CT 06830. 3 |
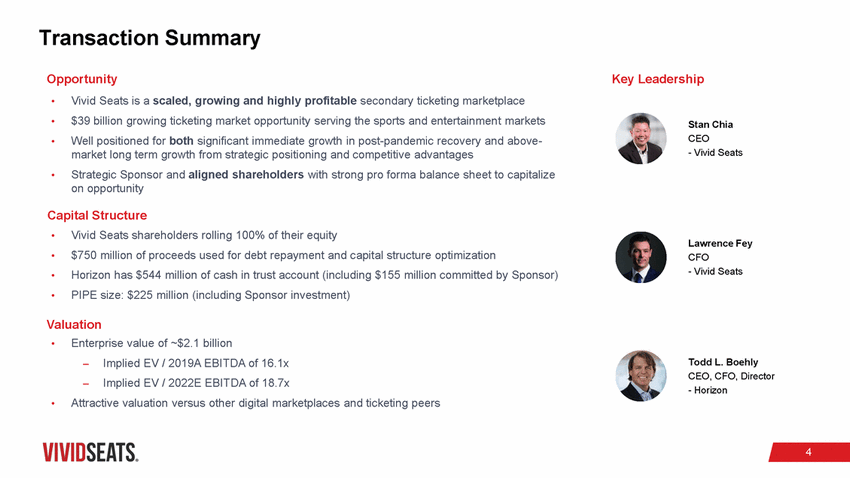 |
Transaction Summary Opportunity Key Leadership Vivid Seats is a scaled, growing and highly profitable secondary ticketing marketplace $39 billion growing ticketing market opportunity serving the sports and entertainment markets Well positioned for both significant immediate growth in post-pandemic recovery and above-market long term growth from strategic positioning and competitive advantages Strategic Sponsor and aligned shareholders with strong pro forma balance sheet to capitalize on opportunity • • • Stan Chia CEO - Vivid Seats • Capital Structure Vivid Seats shareholders rolling 100% of their equity $750 million of proceeds used for debt repayment and capital structure optimization Horizon has $544 million of cash in trust account (including $155 million committed by Sponsor) PIPE size: $225 million (including Sponsor investment) • • • • Lawrence Fey CFO - Vivid Seats Valuation Enterprise value of ~$2.1 billion • Implied EV / 2019A EBITDA of 16.1x Implied EV / 2022E EBITDA of 18.7x Todd L. Boehly CEO, CFO, Director - Horizon – – Attractive valuation versus other digital marketplaces and ticketing peers • 4 |
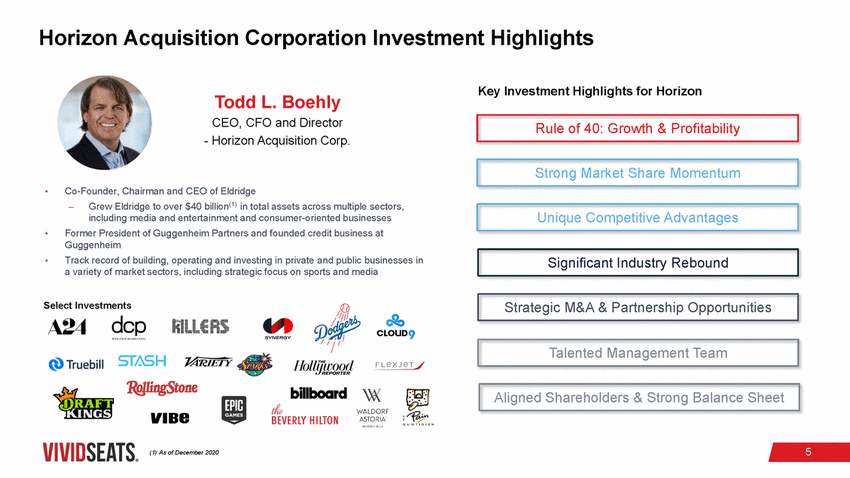 |
Horizon Acquisition Corporation Investment Highlights Key Investment Highlights for Horizon Todd L. Boehly CEO, CFO and Director - Horizon Acquisition Corp. Co-Founder, Chairman and CEO of Eldridge • Grew Eldridge to over $40 billion(1) in total assets across multiple sectors, including media and entertainment and consumer-oriented businesses Former President of Guggenheim Partners and founded credit business at Guggenheim Track record of building, operating and investing in private and public businesses in a variety of market sectors, including strategic focus on sports and media ‒ • • Select Investments 5 (1) As of December 2020 Aligned Shareholders & Strong Balance Sheet Talented Management Team Strategic M&A & Partnership Opportunities Significant Industry Rebound Unique Competitive Advantages Strong Market Share Momentum Rule of 40: Growth & Profitability |
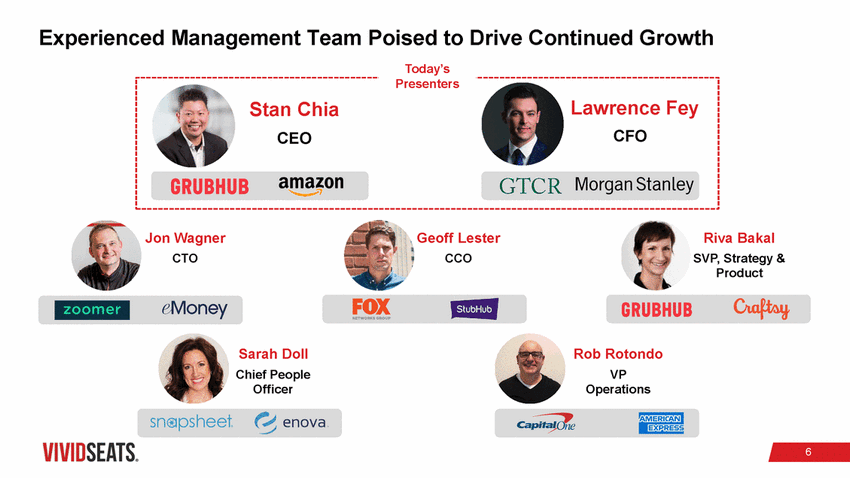 |
Experienced Management Team Poised to Drive Continued Growth Today’s Jon Wagner CTO Geoff Lester CCO Riva Bakal SVP, Strategy & Product Sarah Doll Chief People Officer Rob Rotondo VP Operations 6 Presenters Stan ChiaLawrence Fey CEOCFO |
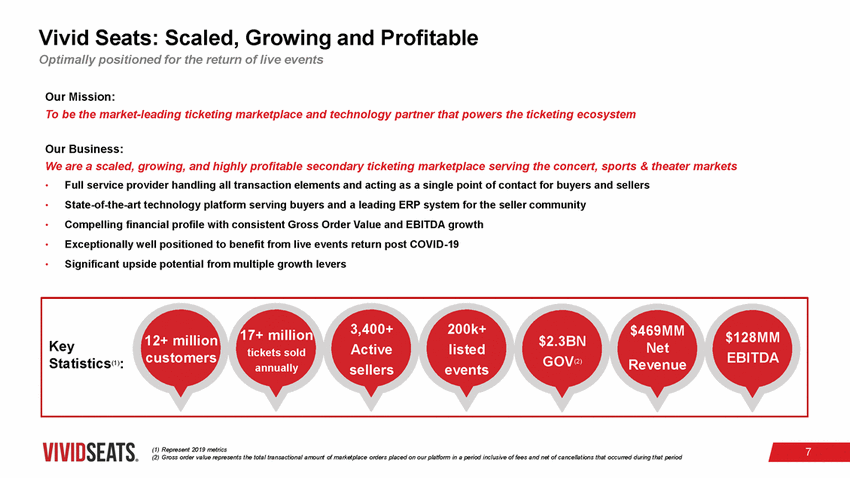 |
Vivid Seats: Scaled, Growing and Profitable Optimally positioned for the return of live events Our Mission: To be the market-leading ticketing marketplace and technology partner that powers the ticketing ecosystem Our Business: We are a scaled, growing, and highly profitable secondary ticketing marketplace serving the concert, sports & theater markets Full service provider handling all transaction elements and acting as a single point of contact for buyers and sellers State-of-the-art technology platform serving buyers and a leading ERP system for the seller community Compelling financial profile with consistent Gross Order Value and EBITDA growth Exceptionally well positioned to benefit from live events return post COVID-19 Significant upside potential from multiple growth levers • • • • • Key Net Active listed tickets sold (1) Represent 2019 metrics (2) Gross order value represents the total transactional amount of marketplace orders placed on our platform in a period inclusive of fees and net of cancellations that occurred during that period 7 12+ million17+ million 3,400+ 200k+$2.3BN $469MM$128MM Statistics(1):customersannuallysellersevents GOV(2)Revenue EBITDA |
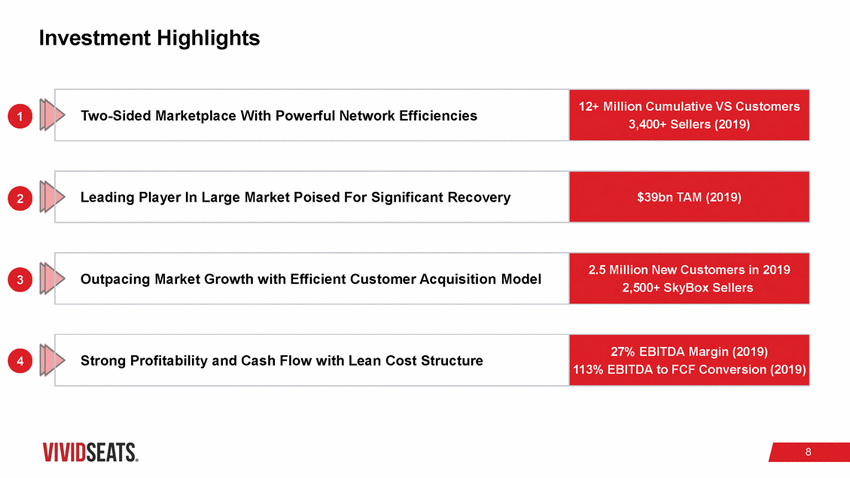 |
Investment Highlights 1 2 3 4 8 Strong Profitability and Cash Flow with Lean Cost Structure 27% EBITDA Margin (2019) 113% EBITDA to FCF Conversion (2019) Outpacing Market Growth with Efficient Customer Acquisition Model 2.5 Million New Customers in 2019 2,500+ SkyBox Sellers Leading Player In Large Market Poised For Significant Recovery $39bn TAM (2019) Two-Sided Marketplace With Powerful Network Efficiencies 12+ Million Cumulative VS Customers 3,400+ Sellers (2019) |
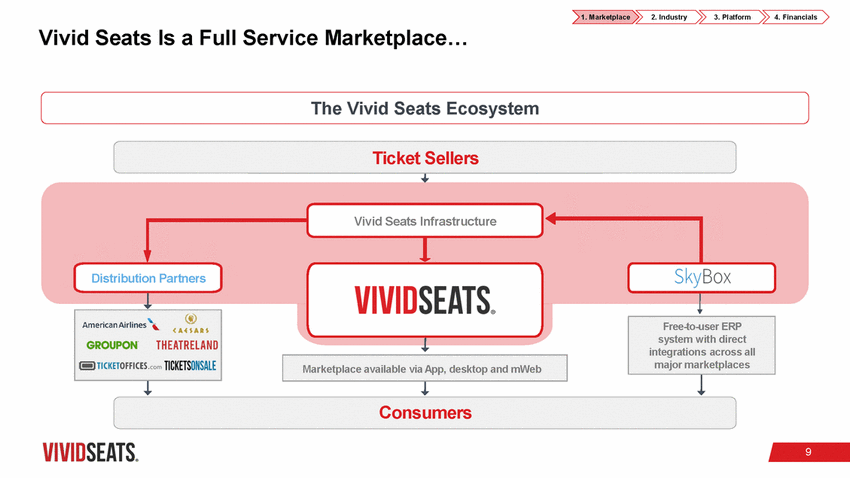 |
1. Marketplace 2. Industry 3. Platform 4. Financials Vivid Seats Is a Full Service Marketplace… The Vivid Seats Ecosystem Ticket Sellers Vivid Seats Infrastructure Distribution Partners Consumers 9 Marketplace available via App, desktop and mWeb Free-to-user ERP system with direct integrations across all major marketplaces |
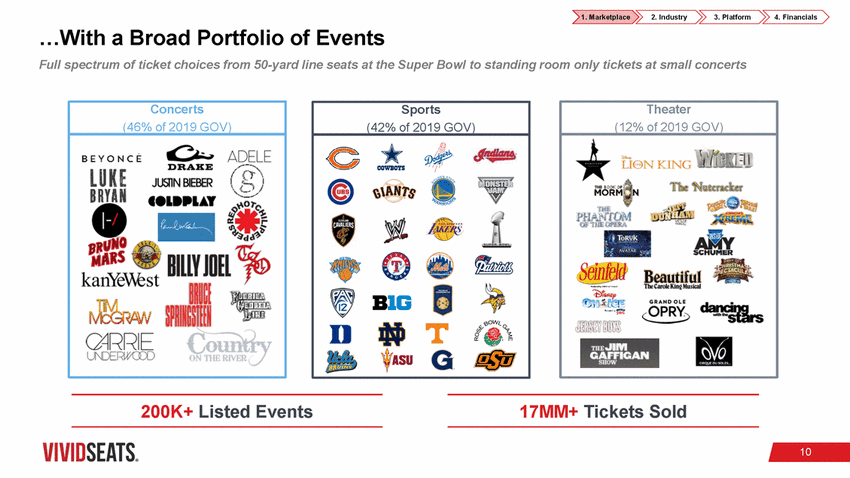 |
1. Marketplace 2. Industry 3. Platform 4. Financials …With a Broad Portfolio of Events Full spectrum of ticket choices from 50-yard line seats at the Super Bowl to standing room only tickets at small concerts Concerts (46% of 2019 GOV) Sports (42% of 2019 GOV) Theater (12% of 2019 GOV) 200K+ Listed Events 17MM+ Tickets Sold 10 |
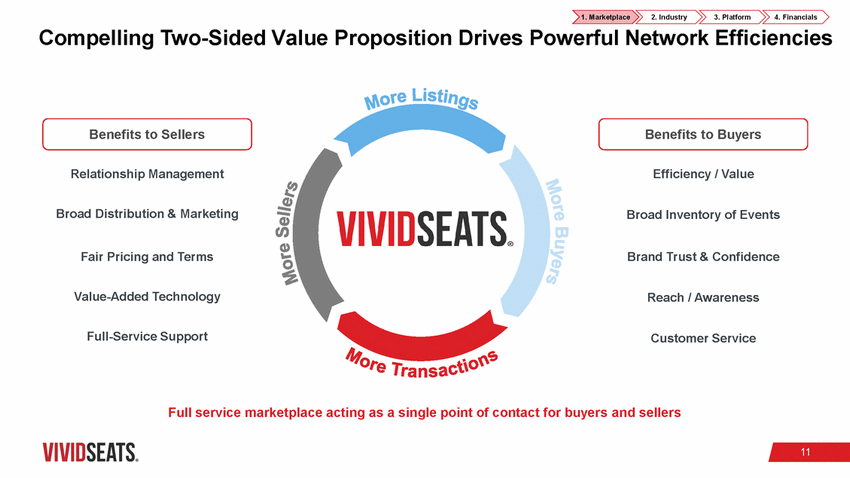 |
1. Marketplace 2. Industry 3. Platform 4. Financials Compelling Two-Sided Value Proposition Drives Powerful Network Efficiencies Benefits to Sellers Benefits to Buyers Relationship Management Efficiency / Value Broad Distribution & Marketing Broad Inventory of Events Fair Pricing and Terms Brand Trust & Confidence Value-Added Technology Reach / Awareness Full-Service Support Customer Service Full service marketplace acting as a single point of contact for buyers and sellers 11 |
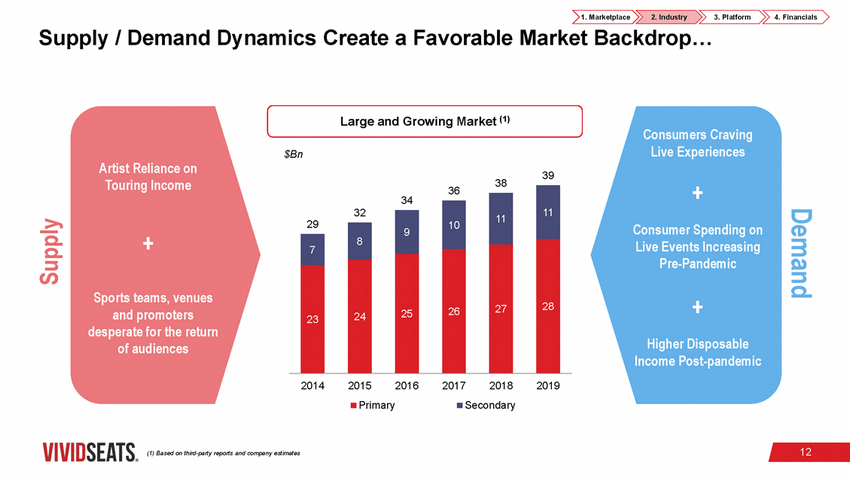 |
1. Marketplace 2. Industry 3. Platform 4. Financials Supply / Demand Dynamics Create a Favorable Market Backdrop… Large and Growing Market (1) Consumers Craving Live Experiences $Bn Artist Reliance on Touring Income 39 38 + 36 34 Consumer Spending on Live Events Increasing + Pre-Pandemic Sports teams, venues and promoters + Higher Disposable desperate for the return of audiences Income Post-pandemic 2014 2015 2016 2017 2018 2019 Primary Secondary 12 (1) Based on third-party reports and company estimates Demand Supply 11 11 10 32 9 29 8 7 28 27 26 25 24 23 |
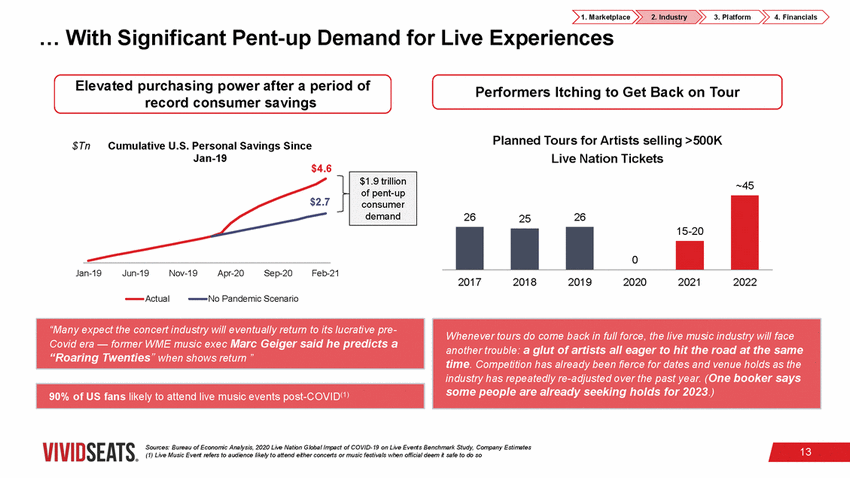 |
1. Marketplace Live Experiences 2. Industry 3. Platform 4. Financials … With Significant Pent-up Demand for Elevated purchasing power after a period of record consumer savings Performers Itching to Get Back on Tour Planned Tours for Artists selling >500K Live Nation Tickets $Tn Cumulative U.S. Personal Savings Since Jan-19 $4.6 ~45 $2.7 Jan-19 Jun-19 Nov-19 Apr-20 Sep-20 Feb-21 2017 2018 2019 2020 2021 2022 Actual No Pandemic Scenario another trouble: a glut of artists all eager to hit the road at the same Sources: Bureau of Economic Analysis, 2020 Live Nation Global Impact of COVID-19 on Live Events Benchmark Study, Company Estimates (1) Live Music Event refers to audience likely to attend either concerts or music festivals when official deem it safe to do so 13 90% of US fans likely to attend live music events post-COVID(1) Whenever tours do come back in full force, the live music industry will face time. Competition has already been fierce for dates and venue holds as the industry has repeatedly re-adjusted over the past year. (One booker says some people are already seeking holds for 2023.) “Many expect the concert industry will eventually return to its lucrative pre-Covid era — former WME music exec Marc Geiger said he predicts a “Roaring Twenties” when shows return ” 262526 15-20 0 $1.9 trillion of pent-up consumer demand |
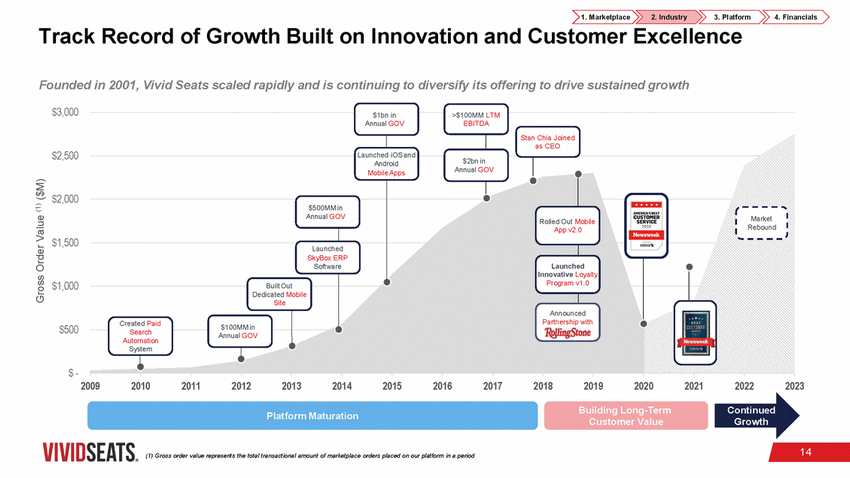 |
1. Marketplace 2. Industry 3. Platform 4. Financials Track Record of Growth Built on Innovation and Customer Excellence Founded in 2001, Vivid Seats scaled rapidly and is continuing to diversify its offering to drive sustained growth $3,000 $1bn in >$100MM LTM A $2,500 Launched iOS and Annual GOV e Apps $2,000 Mobile $1,500 hed $1,000 Built Out $100MM in $500 Search Automation $ - 2009 2010 2011 2012 2013 2014 2015 2016 2017 2018 2019 2020 2021 2022 2023 Building Long-Term Customer Value Continued Growth Platform Maturation 14 (1) Gross order value represents the total transactional amount of marketplace orders placed on our platform in a period Gross Order Value (1) ($M) Annual GOVEBITD Stan Chia Joined as CEO And Mobil roid$2bn in $500MM in Annual GOV Rolled Out App v2. Market 0 Rebound Launched SkyBox ERP Launc Innovative L Program v oyalty 1.0 Softwar e Dedicated Mobile Site Announc Partnership ed with Created Paid Annual GOV System |
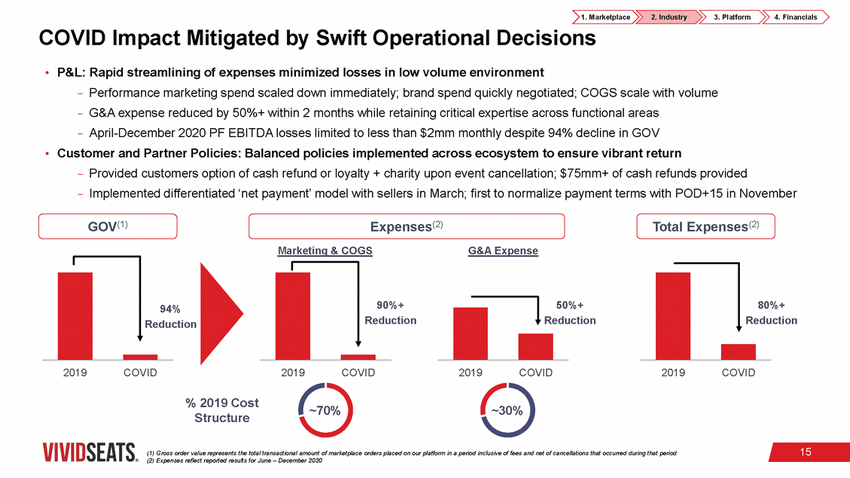 |
1. Marketplace COVID Impact Mitigated by Swift Operational Decisions 2. Industry 3. Platform 4. Financials P&L: Rapid streamlining of expenses minimized losses in low volume environment - Performance marketing spend scaled down immediately; brand spend quickly negotiated; COGS scale with volume - G&A expense reduced by 50%+ within 2 months while retaining critical expertise across functional areas - April-December 2020 PF EBITDA losses limited to less than $2mm monthly despite 94% decline in GOV Customer and Partner Policies: Balanced policies implemented across ecosystem to ensure vibrant return - Provided customers option of cash refund or loyalty + charity upon event cancellation; $75mm+ of cash refunds provided - Implemented differentiated ‘net payment’ model with sellers in March; first to normalize payment terms with POD+15 in November • • GOV(1) Expenses(2) Marketing & COGS Total Expenses(2) G&A Expense %+ ction 50%+ %+ ction 94% Reduction Reduction 2019 COVID 2019 COVID 2019 COVID 2019 COVID % 2019 Cost Structure ~70% ~30% 15 (1) Gross order value represents the total transactional amount of marketplace orders placed on our platform in a period inclusive of fees and net of cancellations that occurred during that period (2) Expenses reflect reported results for June – December 2020 80 Redu 90 Redu |
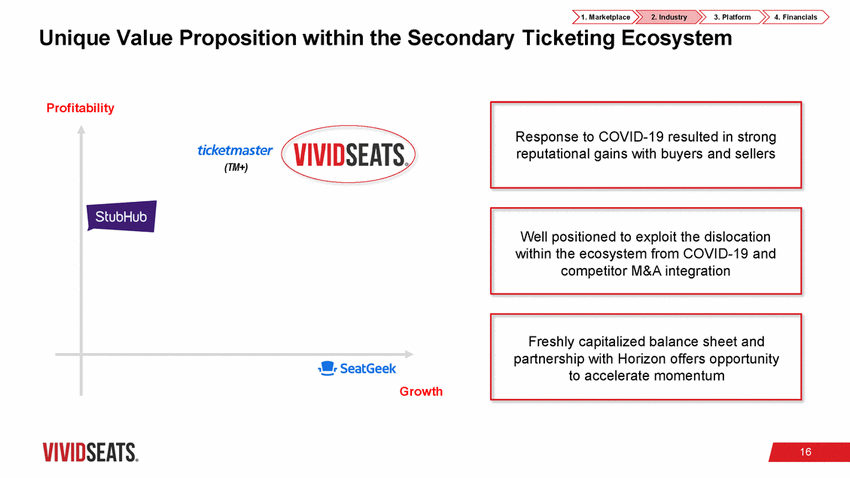 |
1. Marketplace 2. Industry 3. Platform 4. Financials Unique Value Proposition within the Secondary Ticketing Ecosystem Profitability (TM+) Growth 16 Freshly capitalized balance sheet and partnership with Horizon offers opportunity to accelerate momentum Well positioned to exploit the dislocation within the ecosystem from COVID-19 and competitor M&A integration Response to COVID-19 resulted in strong reputational gains with buyers and sellers |
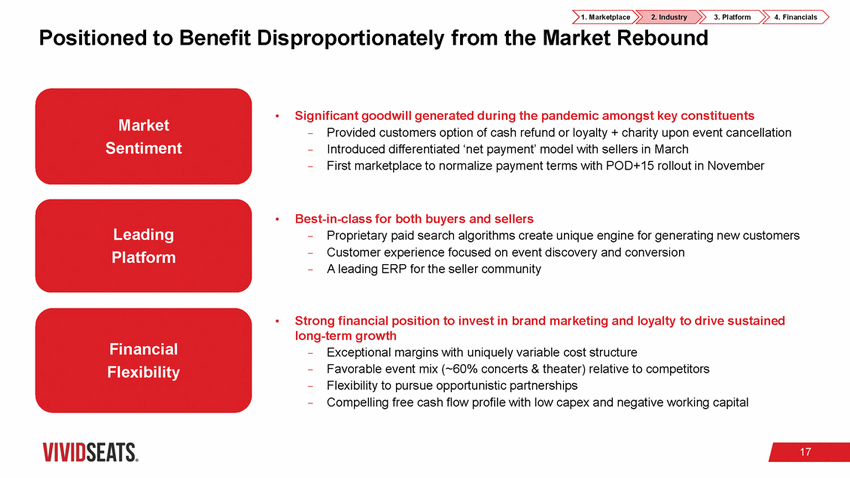 |
1. Marketplace 2. Industry 3. Platform 4. Financials Positioned to Benefit Disproportionately from the Market Rebound Significant goodwill generated during the pandemic amongst key constituents • Market Sentiment Provided customers option of cash refund or loyalty + charity upon event cancellation Introduced differentiated ‘net payment’ model with sellers in March First marketplace to normalize payment terms with POD+15 rollout in November - - - Best-in-class for both buyers and sellers • Leading Platform Proprietary paid search algorithms create unique engine for generating new customers Customer experience focused on event discovery and conversion A leading ERP for the seller community - - - Strong financial position to invest in brand marketing and loyalty to drive sustained long-term growth • Financial Flexibility Exceptional margins with uniquely variable cost structure Favorable event mix (~60% concerts & theater) relative to competitors Flexibility to pursue opportunistic partnerships Compelling free cash flow profile with low capex and negative working capital - - - - 17 |
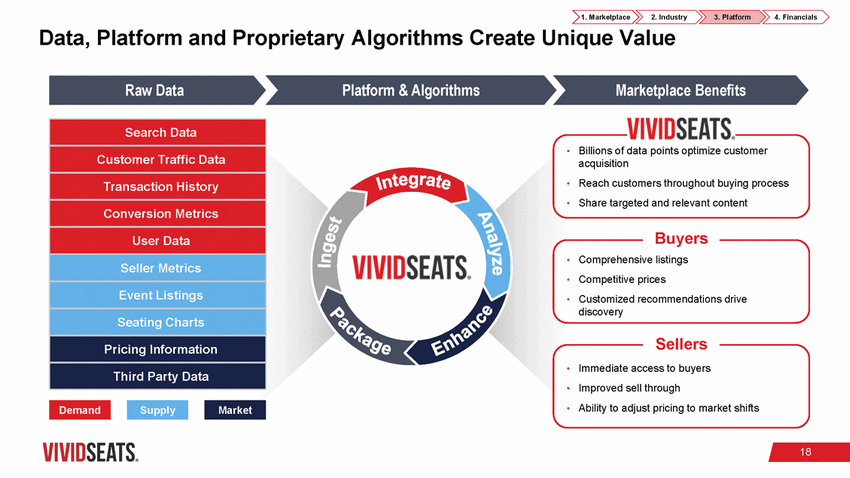 |
1. Marketplace 2. Industry 3. Platform 4. Financials Data, Platform and Proprietary Algorithms Create Unique Value Raw Data Platform & Algorithms Marketplace Benefits Billions of data points optimize customer acquisition Reach customers throughout buying process Share targeted and relevant content • • • Buyers • Comprehensive listings Competitive prices Customized recommendations drive discovery • • Sellers Immediate access to buyers Improved sell through Ability to adjust pricing to market shifts • • • 18 Market Supply Demand Search Data Customer Traffic Data Transaction History Conversion Metrics User Data Seller Metrics Event Listings Seating Charts Pricing Information Third Party Data |
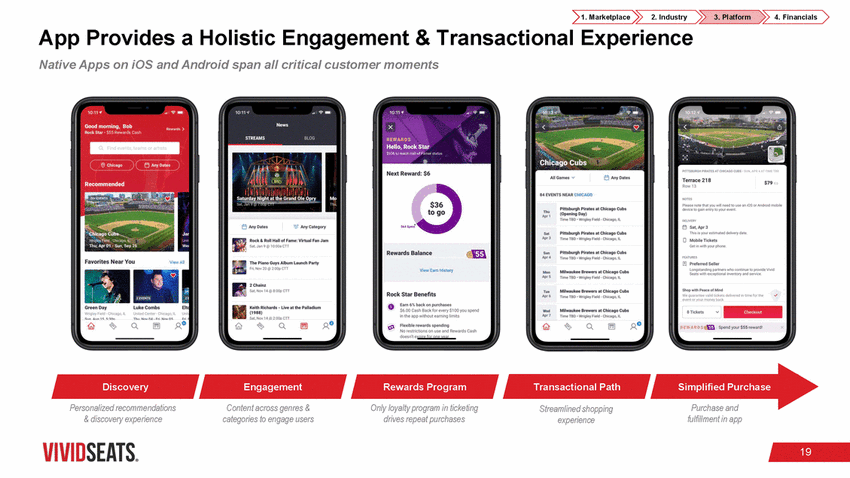 |
) 1.Marketplace )) 2. Industry )) 3.Platform )) 4. Financials ) App Provides a Holistic Engagement & Transactional Native Apps on iOS and Android span all critical customer moments Experience Next Reward:$6 Terrace 218 Row13 $79 14 EVENTS NEAR CHICAGO .T.h.o. Please note that you Will need touse an10S Of Androidmobile OeviCtto gain emry to your event Pittsbu,P, Pirata at 0\icevo Cubs (OpenlngDoy) Time TID • Wngky F..td· Chicago. ll ... -::=-Any category E::j Arty Dates El S.t. />;>< 3 This 1s your estimated delrvl'f)' date 0 MobileTickets Get 1n With )IOU" phone ..., Pltuburgft Pi,.te0. \lc:ago CUb• Time TIO • Wttglty Ftefd •CNc19o, ll m Roek & Roll Hall of Fame: Virtual Fan Jam .... .... - Sat,Jan 9@ 10.00a CTT Pittsburgh PiratH at Cflka9oCubs Tlr'M T80 • WngleJ•aMcago. ll Rewards Balance - "'"""' The Piano Guys Album t.unch Party Frt. Nov 20@ 2 OOp CTT .... [:] Preferred Seller loogstandmg partnfts who cootnue to prOVIde VIVId Seats wnhxceptiOI\&IIn ntory ind s rv1ce VIew Earn History Mltwauk"Brewers at Chicago Cubs T.me TBO • WngA.y Fteld •0.:.00. ll .-... 2 Chainz Sat NOY 14@ 8 00p CTT Shop with Puce of Mlnd Wegua ante-.vaKtt -keots drM edntJme fOfthC' @Vef110f Yt ffi:IOo'!YbaCk MiiWMikM Brtwtf't: at C'*-90Cubt -, Rock Star Benefits <./ TmeTB O • Wngltyftetd ll Keith Rk:hards - Uve at the Palladium (1988) SatNOY 14@ 200oCTI Q. Mawauk.N Brewen at Chic.a9oo.Ds T meT80 • Ww,ltrt F'.td• a..:.go.lt Q. ... &Tickets Checkout p._O m Spend your sss rewardl Q Personalized recommendations & discovery experience Content across genres & categories to engage users Only loyalty program in ticketing drives repeat purchases Purchase and fulfillment in app Streamlined shopping experience VIVIDSEATS. Transactional Path Rewards Program Engagement Discovery |
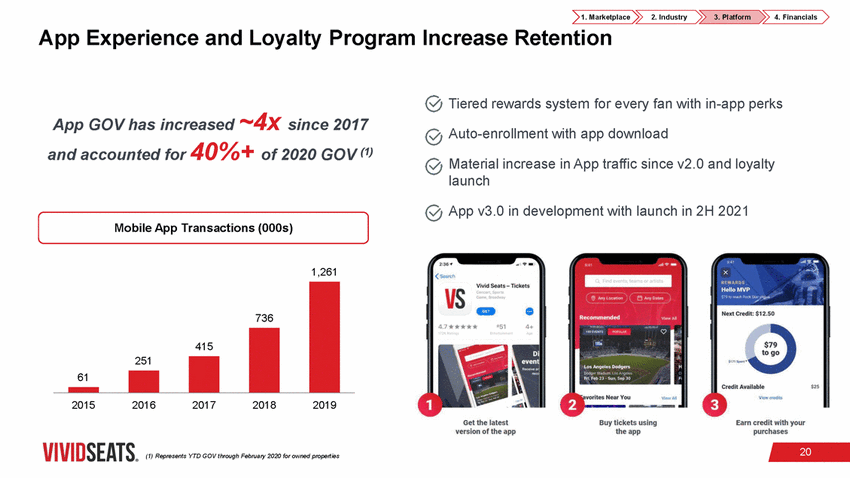 |
1. Marketplace Increase Retention 2. Industry 3. Platform 4. Financials App Experience and Loyalty Program Tiered rewards system for every fan with in-app perks App GOV has increased ~4x since 2017 Auto-enrollment with app download accounted for 40%+ of 2020 and GOV (1) Material increase in App traffic since v2.0 and loyalty launch App v3.0 in development with launch in 2H 2021 Mobile App Transactions (000s) 1,261 2015 2016 2017 2018 2019 20 (1) Represents YTD GOV through February 2020 for owned properties 736 415 251 61 |
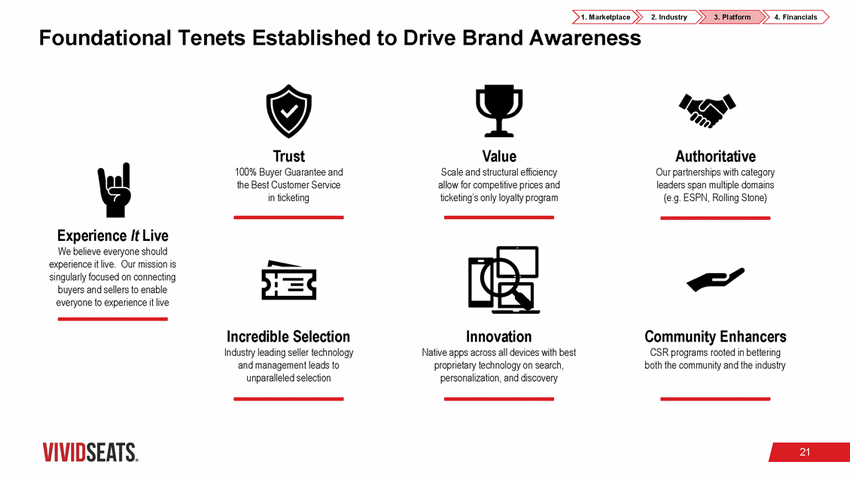 |
1. Marketplace Drive Brand Awareness 2. Industry 3. Platform 4. Financials Foundational Tenets Established to Trust 100% Buyer Guarantee and the Best Customer Service in ticketing Value Scale and structural efficiency allow for competitive prices and ticketing’s only loyalty program Authoritative Our partnerships with category leaders span multiple domains (e.g. ESPN, Rolling Stone) Experience It Live We believe everyone should experience it live. Our mission is singularly focused on connecting buyers and sellers to enable everyone to experience it live Incredible Selection Industry leading seller technology and management leads to unparalleled selection Innovation Native apps across all devices with best proprietary technology on search, personalization, and discovery Community Enhancers CSR programs rooted in bettering both the community and the industry 21 |
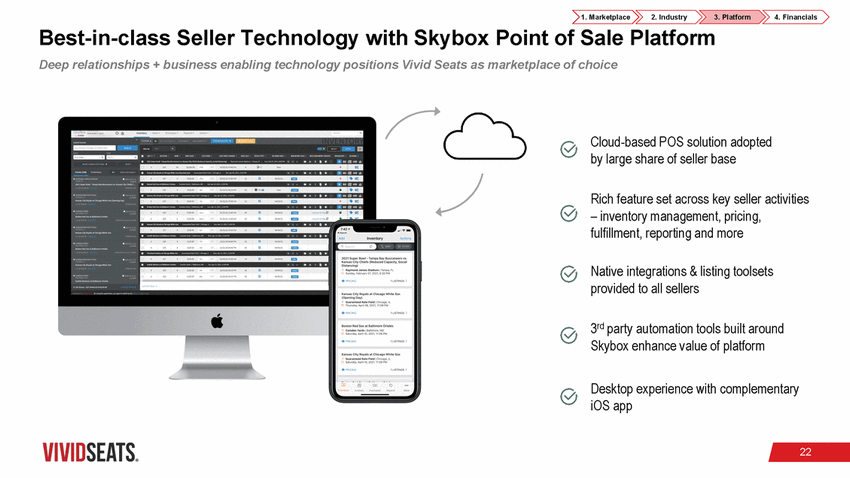 |
1. Marketplace 2. Industry 3. Platform 4. Financials Best-in-class Seller Technology with Skybox Point of Sale Platform Deep relationships + business enabling technology positions Vivid Seats as marketplace of choice Cloud-based POS solution adopted by large share of seller base Rich feature set across key seller activities – inventory management, pricing, fulfillment, reporting and more Native integrations & listing toolsets provided to all sellers 3rd party automation tools built around Skybox enhance value of platform Desktop experience with complementary iOS app 22 |
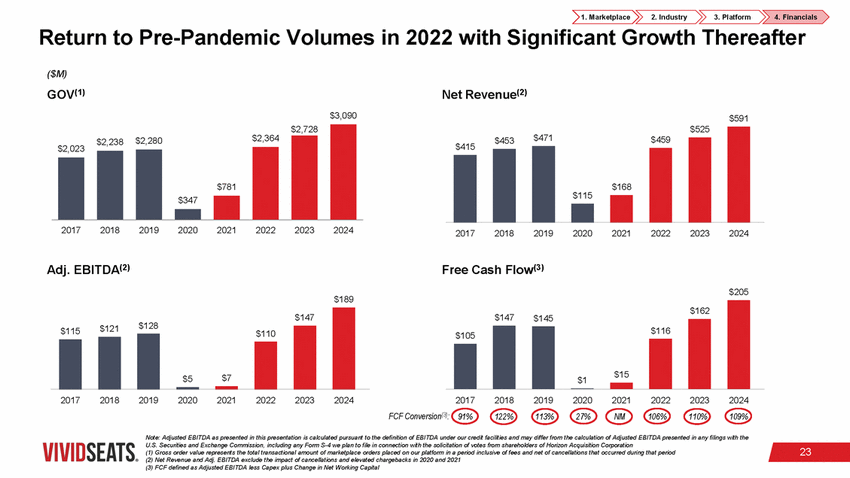 |
1. Marketplace 2. Industry 3. Platform 4. Financials Return to ($M) GOV(1) Pre-Pandemic Volumes in 2022 with Significant Growth Thereafter Net Revenue(2) $3,090 $591 $2,238 $415 $2,023 $115 2017 2018 2019 2020 2021 2022 2023 2024 2017 2018 2019 2020 2021 2022 2023 2024 Adj. EBITDA(2) Free Cash Flow(3) $205 $189 $128 $121 $115 $110 2017 2018 2019 2020 2021 2022 2023 2024 2017 FCF Conversion(3): 91% 2018 122% 2019 113% 2020 27% 2021 NM 2022 106% 2023 110% 2024 109% Note: Adjusted EBITDA as presented in this presentation is calculated pursuant to the definition of EBITDA under our credit facilities and may differ from the calculation of Adjusted EBITDA presented in any filings with the U.S. Securities and Exchange Commission, including any Form S-4 we plan to file in connection with the solicitation of votes from shareholders of Horizon Acquisition Corporation (1) Gross order value represents the total transactional amount of marketplace orders placed on our platform in a period inclusive of fees and net of cancellations that occurred during that period (2) Net Revenue and Adj. EBITDA exclude the impact of cancellations and elevated chargebacks in 2020 and 2021 (3) FCF defined as Adjusted EBITDA less Capex plus Change in Net Working Capital 23 $147 $5$7 $162 $147$145 $116 $1$15 $105 $525 $453$471$459 $168 $2,728 $2,280$2,364 $781 $347 |
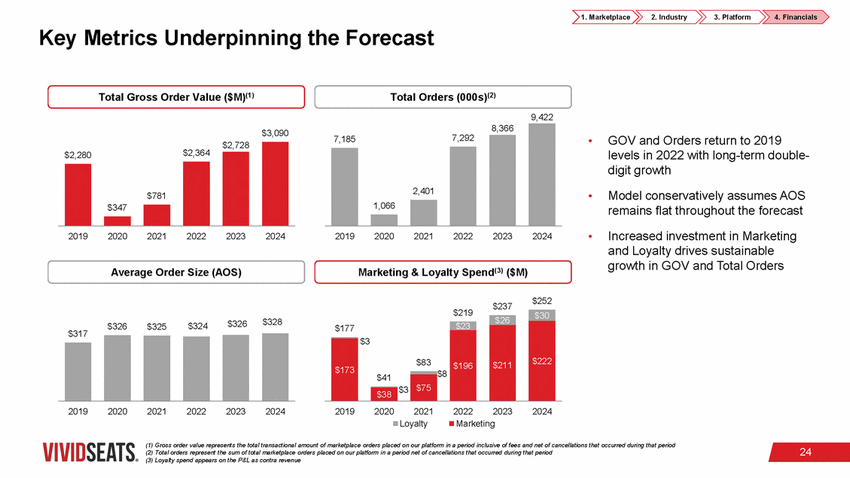 |
1. Marketplace 2. Industry 3. Platform 4. Financials Key Metrics Underpinning the Forecast Total Gross Order Value ($M)(1) Total Orders (000s)(2) 9,422 $3,090 GOV and Orders return to 2019 levels in 2022 with long-term double-digit growth Model conservatively assumes AOS remains flat throughout the forecast • • Increased investment in Marketing and Loyalty drives sustainable growth in GOV and Total Orders • 2019 2020 2021 2022 2023 2024 2019 2020 2021 2022 2023 2024 Average Order Size (AOS) Marketing & Loyalty Spend(3) ($M) $252 $237 $219 $328 $326 $326 $324 $325 $317 2019 2020 2021 2022 2023 2024 2019 20202021 2022 2023 2024 Loyalty Marketing (1) Gross order value represents the total transactional amount of marketplace orders placed on our platform in a period inclusive of fees and net of cancellations that occurred during that period (2) Total orders represent the sum of total marketplace orders placed on our platform in a period net of cancellations that occurred during that period (3) Loyalty spend appears on the P&L as contra revenue 24 $30 $26 $222 $177 $23 $211 $196 $173 $3 $83 $41 $75 $8 $38 $3 $2,728 $2,280$2,364 $781 $347 8,366 7,1857,292 2,401 1,066 |
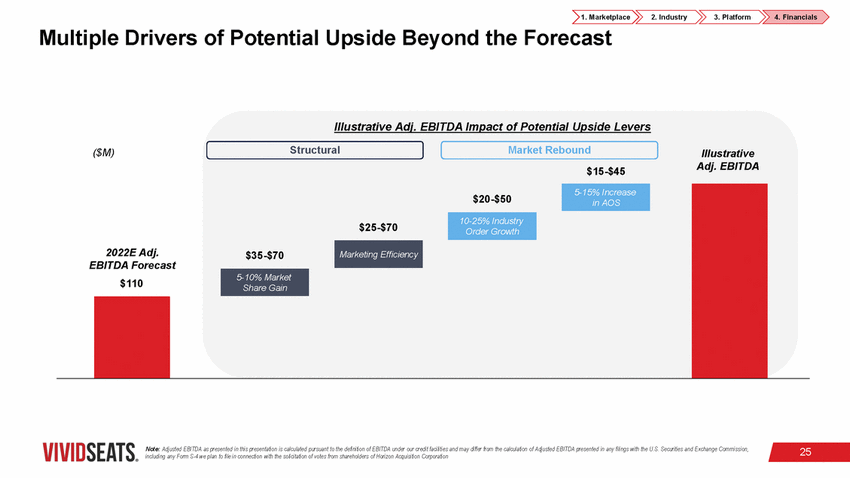 |
1. Marketplace Potential Upside Beyond the Forecast 2. Industry 3. Platform 4. Financials Multiple Drivers of Illustrative Adj. EBITDA Impact of Potential Upside Levers Structural Market Rebound $15-$45 ($M) Illustrative Adj. EBITDA EBITDA Forecast Note: Adjusted EBITDA as presented in this presentation is calculated pursuant to the definition of EBITDA under our credit facilit ies and may differ from the calculation of Adjusted EBITDA presented in any filings with the U.S. Securities and Exchange Commiss ion, including any Form S-4 we plan to file in connection with the solicitation of votes from shareholders of Horizon Acquisition Corporation 25 $20-$50 $25-$70 2022E Adj.$35-$70 $110 5-10% Market Share Gain Marketing Efficiency 10-25% Industry Order Growth 5-15% Increase in AOS |
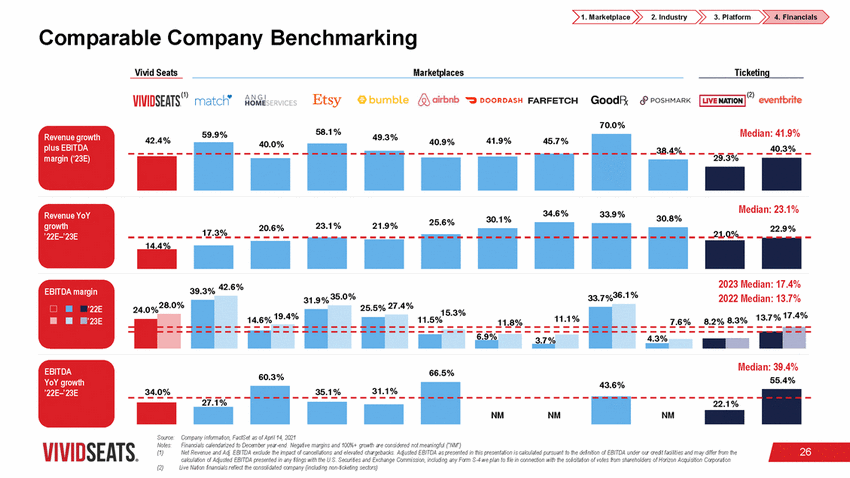 |
1. Marketplace 2. Industry 3. Platform 4. Financials Comparable Company Benchmarking Vivid Seats Marketplaces Ticketing (1) (2) 70.0% 58.1% Median: 41.9% 59.9% Revenue growth plus EBITDA margin (‘23E) 49.3% 42.4% 41.9% 45.7% 40.9% 40.0% Median: 23.1% 34.6% 33.9% Revenue YoY growth ’22E–’23E 30.8% 30.1% 25.6% 22.9% 21.0% 2023 Median: 17.4% 39.3% 42.6% EBITDA margin 36.1% 25.5% 27.4% ’22E ’23E 15.3% Median: 39.4% 55.4% EBITDA YoY growth ’22E–’23E 66.5% 60.3% Source: Notes: (1) Company information, FactSet as of April 14, 2021 Financials calendarized to December year-end. Negative margins and 100%+ growth are considered not meaningful (“NM”) Net Revenue and Adj. EBITDA exclude the impact of cancellations and elevated chargebacks. Adjusted EBITDA as presented in this presentation is calculated pursuant to the definition of EBITDA under our credit facilit ies and may differ from the calculation of Adjusted EBITDA presented in any filings with the U.S. Securities and Exchange Commission, including any Form S-4 we plan to file in connection with the solicitation of votes from shareholders of Horizon Acquisition Corporation Live Nation financials reflect the consolidated company (including non-ticketing sectors) 26 (2) 43.6% 34.0% 35.1% 31.1% 27.1% NMNM 22.1% NM 31.9% 35.0% 33.7% 2022 Median: 13.7% 28.0% 24.0% 7.6% 8.2% 8.3% 13.7% 17.4% 14.6% 19.4% 11.5% 11.8% 11.1% 6.9% 3.7% 4.3% 17.3% 20.6% 23.1% 21.9% 14.4% 38.4% 40.3% 29.3% |
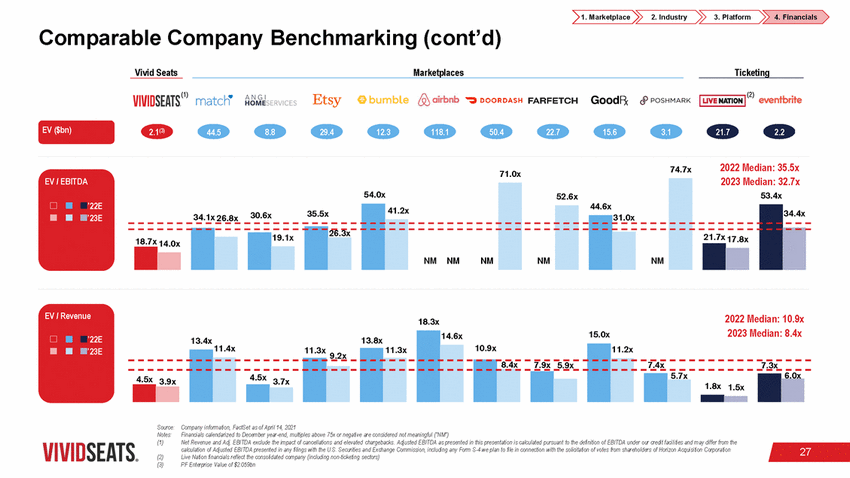 |
1. Marketplace 2. Industry 3. Platform 4. Financials Comparable Company Benchmarking (cont’d) Vivid Seats Marketplaces Ticketing (1) (2) EV ($bn) 44.5 12.3 118.1 21.7 2022 Median: 35.5x 74.7x 71.0x EV / EBITDA ’22E ’23E 44.6x EV / Revenue 2022 Median: 10.9x 18.3x ’22E ’23E 11.4x 11.3x 9.2x 1.8x 1.5x Source: Notes: (1) Company information, FactSet as of April 14, 2021 Financials calendarized to December year-end, multiples above 75x or negative are considered not meaningful (“NM”) Net Revenue and Adj. EBITDA exclude the impact of cancellations and elevated chargebacks. Adjusted EBITDA as presented in this presentation is calculated pursuant to the definition of EBITDA under our credit facil ities and may differ from the calculation of Adjusted EBITDA presented in any filings with the U.S. Securities and Exchange Commission, including any Form S-4 we plan to file in connection with the solicitation of votes from shareholders of Horizon Acquisition Corporation Live Nation financials reflect the consolidated company (including non-ticketing sectors) PF Enterprise Value of $2.059bn 27 (2) (3) 13.4x13.8x 14.6x15.0x2023 Median: 8.4x 10.9x 11.2x 11.3x 8.4x7.9x 5.9x 7.4x7.3x 4.5x 3.9x 4.5x 3.7x 5.7x6.0x 2023 Median: 32.7x 53.4x 54.0x 52.6x 34.1x 26.8x30.6x35.5x 41.2x 34.4x 31.0x 18.7x 14.0x 26.3x NMNMNM NM 21.7x 17.8x NM 19.1x 15.6 2.2 29.4 8.8 3.1 22.7 50.4 2.1(3) |
 |
Transaction Overview |
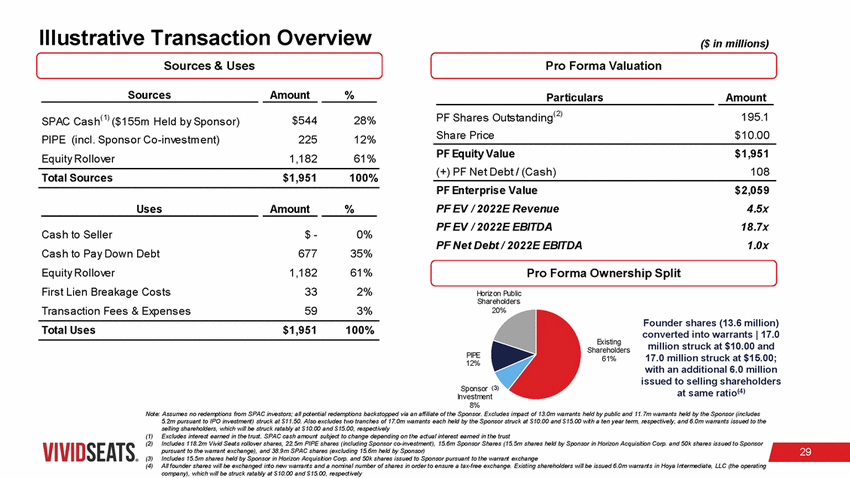 |
Illustrative Transaction Overview Sources & Uses ($ in millions) Pro Forma Valuation Sources Amount % Particulars Amount PF Shares Outs tanding(2) Share Price 195.1 $10.00 SPAC Cas h(1) ($155m Held by Spons or) PIPE (incl. Spons or Co-inves tm ent) Equity Rollover $544 225 1,182 28% 12% 61% PF Equity Value (+) PF Net Debt / (Cas h) $1,951 108 Total Sources $1,951 100% PF Enterprise Value PF EV / 2022E Revenue PF EV / 2022E EBITDA PF Net Debt / 2022E EBITDA $2,059 4.5x 18.7x 1.0x Uses Amount % Cas h to Seller Cas h to Pay Down Debt Equity Rollover Firs t Lien Breakage Cos ts Trans action Fees & Expens es $ - 677 1,182 33 59 0% 35% 61% 2% 3% Pro Forma Ownership Split Horizon Public Shareholders 20% Founder shares (13.6 million) converted into warrants | 17.0 million struck at $10.00 and 17.0 million struck at $15.00; with an additional 6.0 million issued to selling shareholders at same ratio(4) Total Uses $1,951 100% Existing Shareholders 61% PIPE 12% Sponsor (3) Investment 8% Note: Assumes no redemptions from SPAC investors; all potential redemptions backstopped via an affiliate of the Sponsor. Excludes impact of 13.0m warrants held by public and 11.7m warrants held by the Sponsor (includes 5.2m pursuant to IPO investment) struck at $11.50. Also excludes two tranches of 17.0m warrants each held by the Sponsor struck at $10.00 and $15.00 with a ten year term, respectively, and 6.0m warrants issued to the selling shareholders, which will be struck ratably at $10.00 and $15.00, respectively (1) (2) Excludes interest earned in the trust. SPAC cash amount subject to change depending on the actual interest earned in the trust Includes 118.2m Vivid Seats rollover shares, 22.5m PIPE shares (including Sponsor co-investment), 15.6m Sponsor Shares (15.5m shares held by Sponsor in Horizon Acquisition Corp. and 50k shares issued to Sponsor pursuant to the warrant exchange), and 38.9m SPAC shares (excluding 15.6m held by Sponsor) Includes 15.5m shares held by Sponsor in Horizon Acquisition Corp. and 50k shares issued to Sponsor pursuant to the warrant exchange All founder shares will be exchanged into new warrants and a nominal number of shares in order to ensure a tax-free exchange. Existing shareholders will be issued 6.0m warrants in Hoya Intermediate, LLC (the operating company), which will be struck ratably at $10.00 and $15.00, respectively 29 (3) (4) |
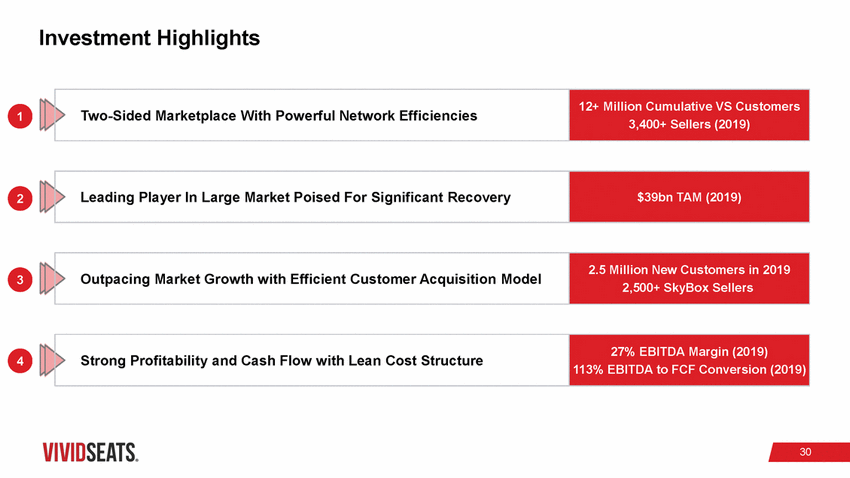 |
Investment Highlights 1 2 3 4 30 Strong Profitability and Cash Flow with Lean Cost Structure 27% EBITDA Margin (2019) 113% EBITDA to FCF Conversion (2019) Outpacing Market Growth with Efficient Customer Acquisition Model 2.5 Million New Customers in 2019 2,500+ SkyBox Sellers Leading Player In Large Market Poised For Significant Recovery $39bn TAM (2019) Two-Sided Marketplace With Powerful Network Efficiencies 12+ Million Cumulative VS Customers 3,400+ Sellers (2019) |
 |
Appendix |
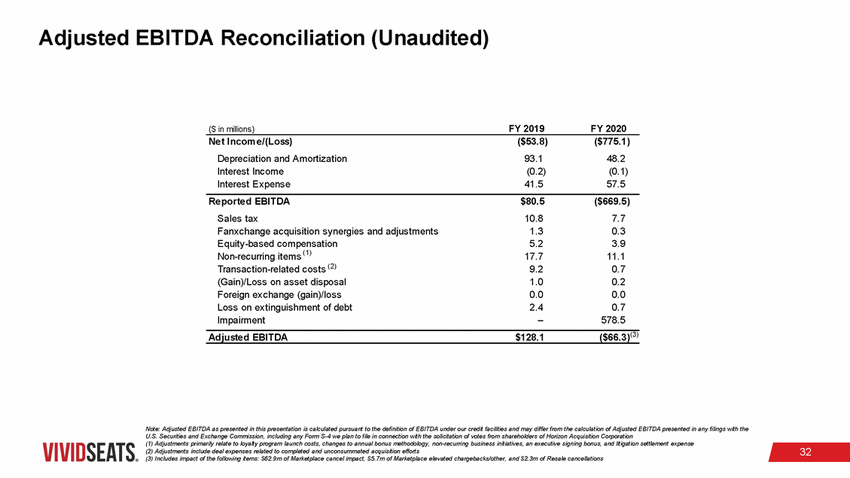 |
Adjusted EBITDA Reconciliation (Unaudited) FY 2019 FY 2020 ($ in millions) Net Income/(Loss) Depreciation and Amortization Interest Income Interest Expense ($53.8) 93.1 (0.2) 41.5 ($775.1) 48.2 (0.1) 57.5 Reported EBITDA Sales tax Fanxchange acquisition synergies and adjustments Equity-based compensation Non-recurring items (1) Transaction-related costs (2) (Gain)/Loss on asset disposal Foreign exchange (gain)/loss Loss on extinguishment of debt Impairment $80.5 10.8 1.3 5.2 17.7 9.2 1.0 0.0 2.4 – ($669.5) 7.7 0.3 3.9 11.1 0.7 0.2 0.0 0.7 578.5 ($66.3)(3) Adjusted EBITDA $128.1 Note: Adjusted EBITDA as presented in this presentation is calculated pursuant to the definition of EBITDA under our credit facilities and may differ from the calculation of Adjusted EBITDA presented in any filings with the U.S. Securities and Exchange Commission, including any Form S-4 we plan to file in connection with the solicitation of votes from shareholders of Horizon Acquisition Corporation (1) Adjustments primarily relate to loyalty program launch costs, changes to annual bonus methodology, non-recurring business initiatives, an executive signing bonus, and litigation settlement expense (2) Adjustments include deal expenses related to completed and unconsummated acquisition efforts (3) Includes impact of the following items: $62.9m of Marketplace cancel impact, $5.7m of Marketplace elevated chargebacks/other, and $2.3m of Resale cancellations 32 |
