Attached files
| file | filename |
|---|---|
| EX-99.1 - EX-99.1 - COMMERCE BANCSHARES INC /MO/ | cbsh3312021ex991.htm |
| 8-K - 8-K - COMMERCE BANCSHARES INC /MO/ | cbsh-20210415.htm |

COMMERCE BANCSHARES, INC. EARNINGS HIGHLIGHTS 1st Quarter 2021
CAUTIONARY STATEMENT A number of statements we will be making in our presentation and in the accompanying slides are “forward-looking statements” within the meaning of the Private Securities Litigation Reform Act of 1995, such as statements of the Corporation’s plans, goals, objectives, expectations, projections, estimates and intentions. These forward- looking statements involve significant risks and uncertainties and are subject to change based on various factors (some of which are beyond the Corporation’s control). Factors that could cause the Corporation’s actual results to differ materially from such forward- looking statements made herein or by management of the Corporation are set forth in the Corporation’s 2020 Annual Report on Form 10-K, and the Corporation’s Current Reports on Form 8-K.
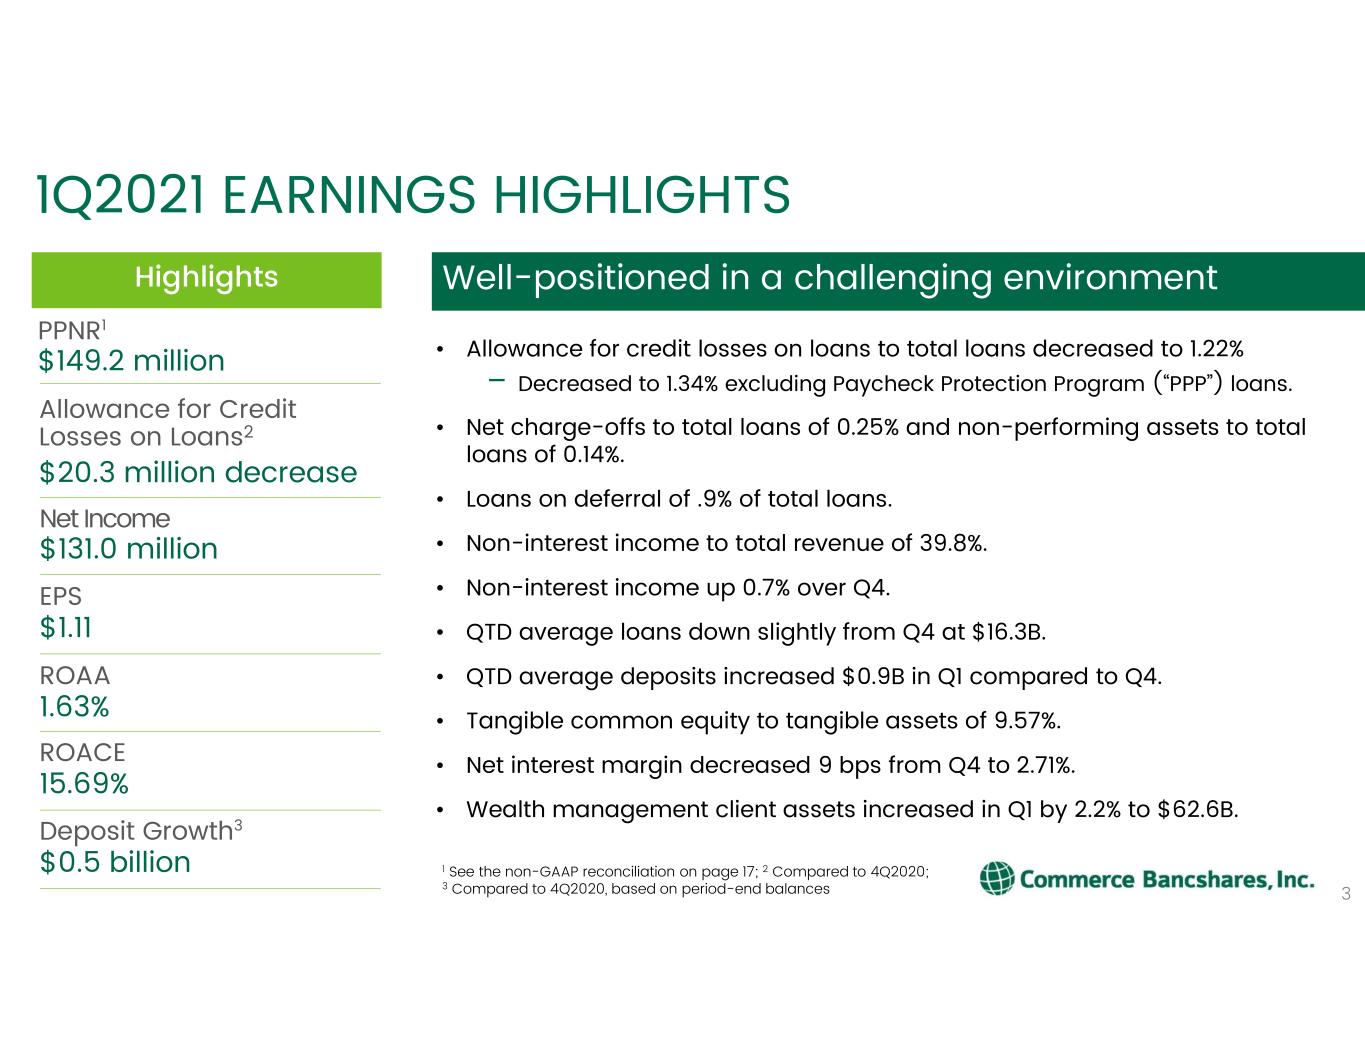
$1.11 EPS 3 • Allowance for credit losses on loans to total loans decreased to 1.22% – Decreased to 1.34% excluding Paycheck Protection Program (“PPP”) loans. • Net charge-offs to total loans of 0.25% and non-performing assets to total loans of 0.14%. • Loans on deferral of .9% of total loans. • Non-interest income to total revenue of 39.8%. • Non-interest income up 0.7% over Q4. • QTD average loans down slightly from Q4 at $16.3B. • QTD average deposits increased $0.9B in Q1 compared to Q4. • Tangible common equity to tangible assets of 9.57%. • Net interest margin decreased 9 bps from Q4 to 2.71%. • Wealth management client assets increased in Q1 by 2.2% to $62.6B. Highlights Well-positioned in a challenging environment 1Q2021 EARNINGS HIGHLIGHTS $149.2 million PPNR1 $20.3 million decrease Allowance for Credit Losses on Loans2 $131.0 million Net Income 15.69% ROACE $0.5 billion Deposit Growth3 1 See the non-GAAP reconciliation on page 17; 2 Compared to 4Q2020; 3 Compared to 4Q2020, based on period-end balances 1.63% ROAA
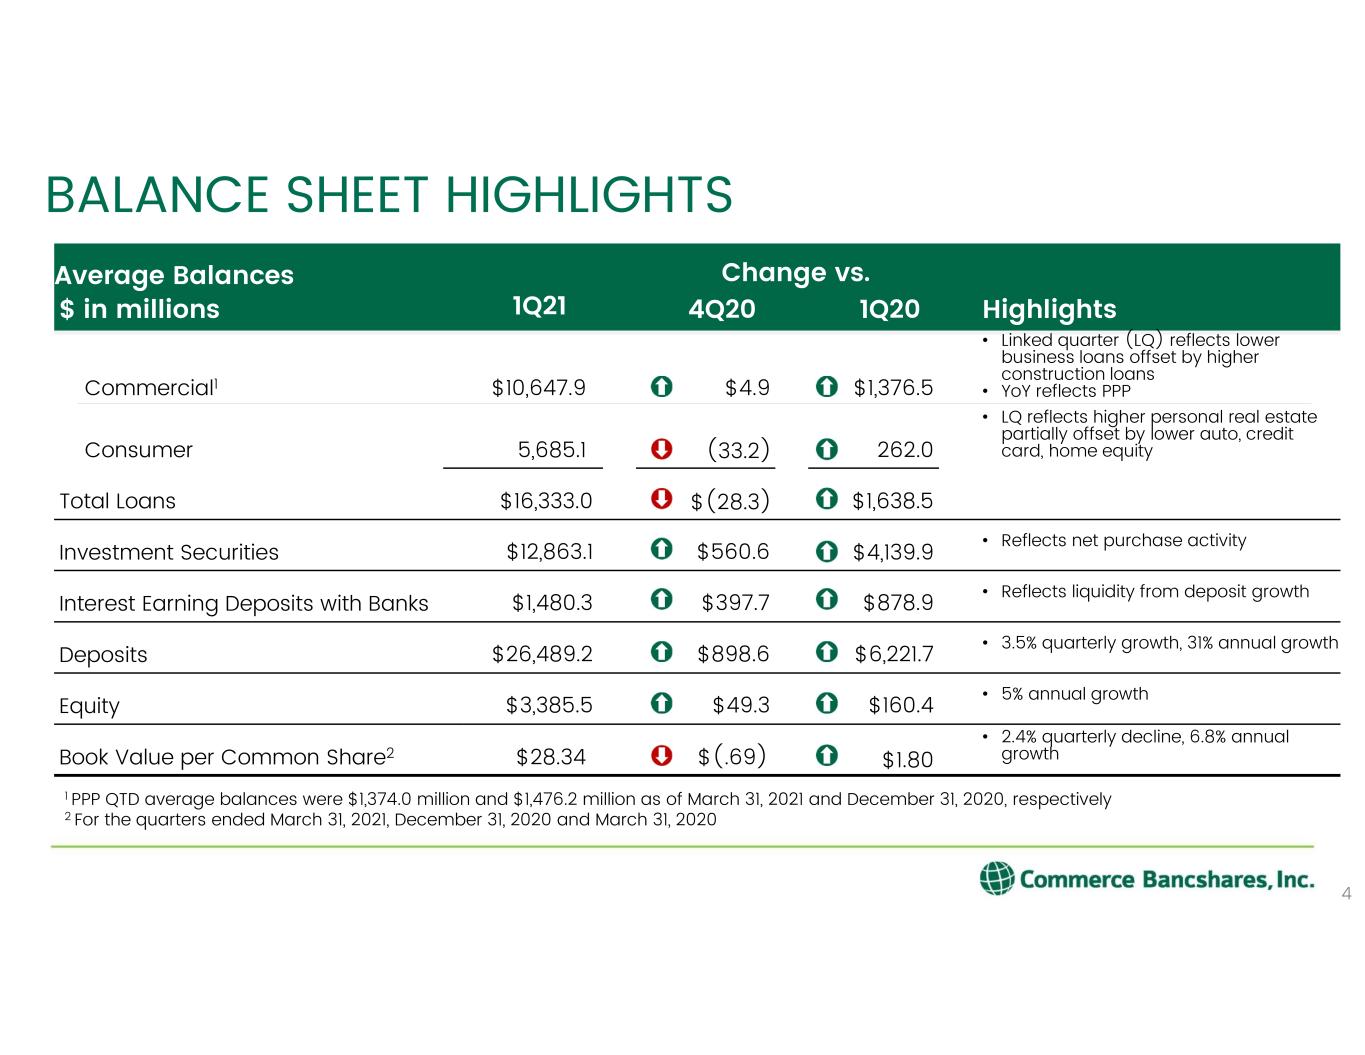
Average Balances Change vs. $ in millions 1Q21 4Q20 1Q20 Highlights Commercial1 $10,647.9 $4.9 $1,376.5 • Linked quarter (LQ) reflects lower business loans offset by higher construction loans • YoY reflects PPP Consumer 5,685.1 (33.2) 262.0 • LQ reflects higher personal real estate partially offset by lower auto, credit card, home equity Total Loans $16,333.0 $(28.3) $1,638.5 Investment Securities $12,863.1 $560.6 $4,139.9 • Reflects net purchase activity Interest Earning Deposits with Banks $1,480.3 $397.7 $878.9 • Reflects liquidity from deposit growth Deposits $26,489.2 $898.6 $6,221.7 • 3.5% quarterly growth, 31% annual growth Equity $3,385.5 $49.3 $160.4 • 5% annual growth Book Value per Common Share2 $28.34 $(.69) $1.80 • 2.4% quarterly decline, 6.8% annual growth BALANCE SHEET HIGHLIGHTS 4 1 PPP QTD average balances were $1,374.0 million and $1,476.2 million as of March 31, 2021 and December 31, 2020, respectively 2 For the quarters ended March 31, 2021, December 31, 2020 and March 31, 2020
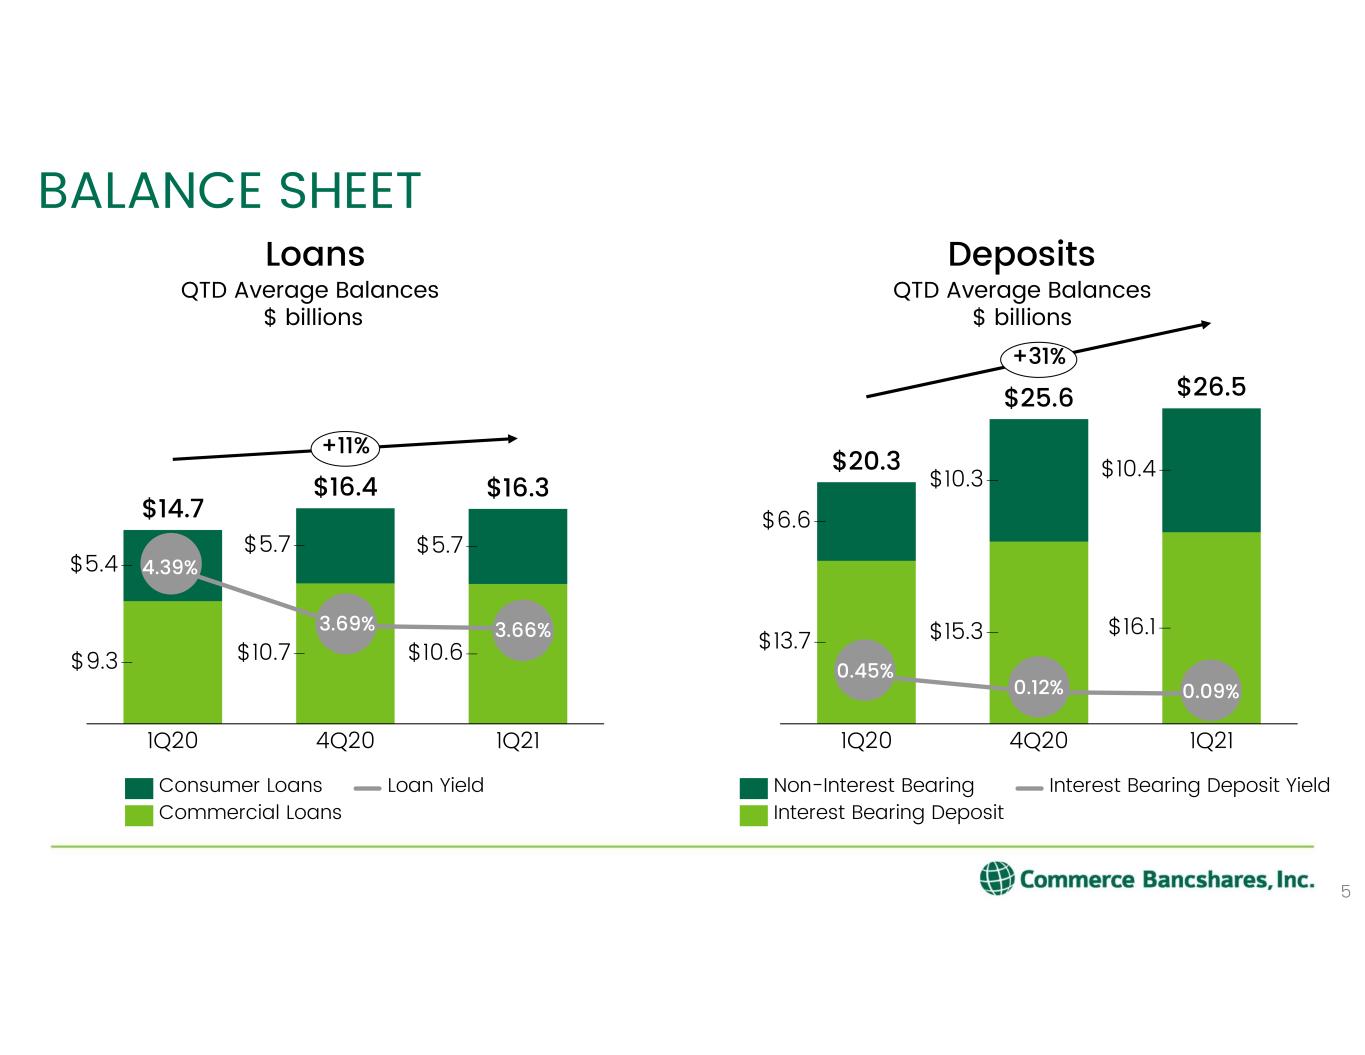
$13.7 $15.3 $16.1 $6.6 $10.3 $10.4 4Q20 $26.5 1Q20 1Q21 $20.3 $25.6 +31% $9.3 $10.7 $10.6 $5.4 $5.7 $5.7 4Q201Q20 1Q21 $14.7 $16.4 $16.3 +11% BALANCE SHEET 5 Loans Consumer Loans Loan Yield Commercial Loans Deposits QTD Average Balances $ billions Non-Interest Bearing Interest Bearing Deposit Interest Bearing Deposit Yield QTD Average Balances $ billions 4.39% 3.69% 3.66% 0.45% 0.12% 0.09%
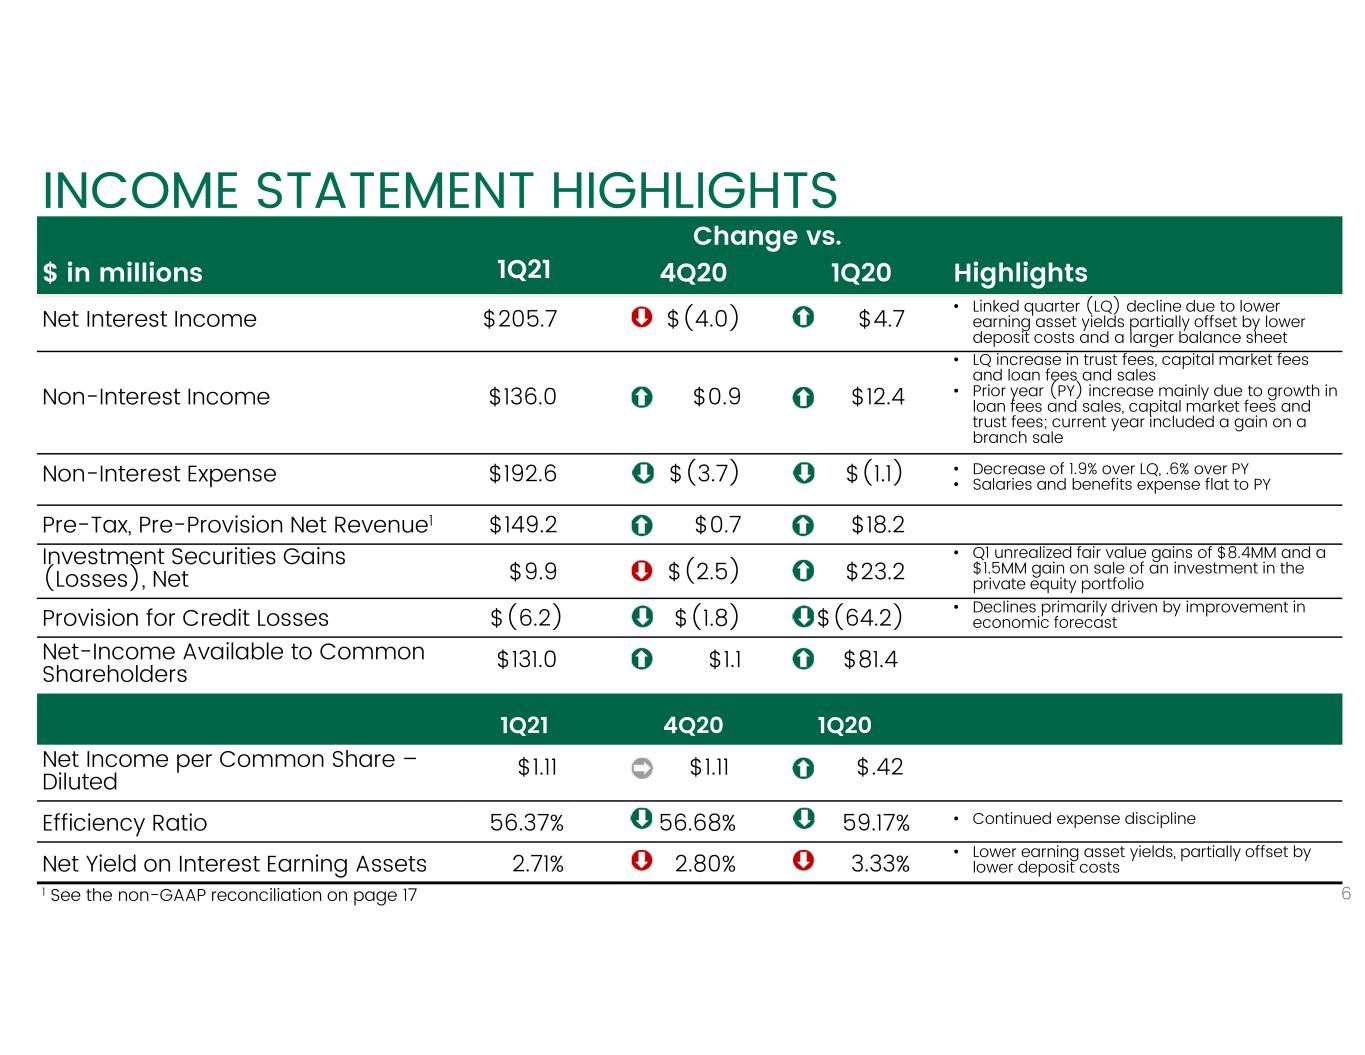
Change vs. $ in millions 1Q21 4Q20 1Q20 Highlights Net Interest Income $205.7 $(4.0) $4.7 • Linked quarter (LQ) decline due to lower earning asset yields partially offset by lower deposit costs and a larger balance sheet Non-Interest Income $136.0 $0.9 $12.4 • LQ increase in trust fees, capital market fees and loan fees and sales • Prior year (PY) increase mainly due to growth in loan fees and sales, capital market fees and trust fees; current year included a gain on a branch sale Non-Interest Expense $192.6 $(3.7) $(1.1) • Decrease of 1.9% over LQ, .6% over PY • Salaries and benefits expense flat to PY Pre-Tax, Pre-Provision Net Revenue1 $149.2 $0.7 $18.2 Investment Securities Gains (Losses), Net $9.9 $(2.5) $23.2 • Q1 unrealized fair value gains of $8.4MM and a $1.5MM gain on sale of an investment in the private equity portfolio Provision for Credit Losses $(6.2) $(1.8) $(64.2) • Declines primarily driven by improvement in economic forecast Net-Income Available to Common Shareholders $131.0 $1.1 $81.4 1Q21 4Q20 1Q20 Net Income per Common Share – Diluted $1.11 $1.11 $.42 Efficiency Ratio 56.37% 56.68% 59.17% • Continued expense discipline Net Yield on Interest Earning Assets 2.71% 2.80% 3.33% • Lower earning asset yields, partially offset by lower deposit costs INCOME STATEMENT HIGHLIGHTS 61 See the non-GAAP reconciliation on page 17
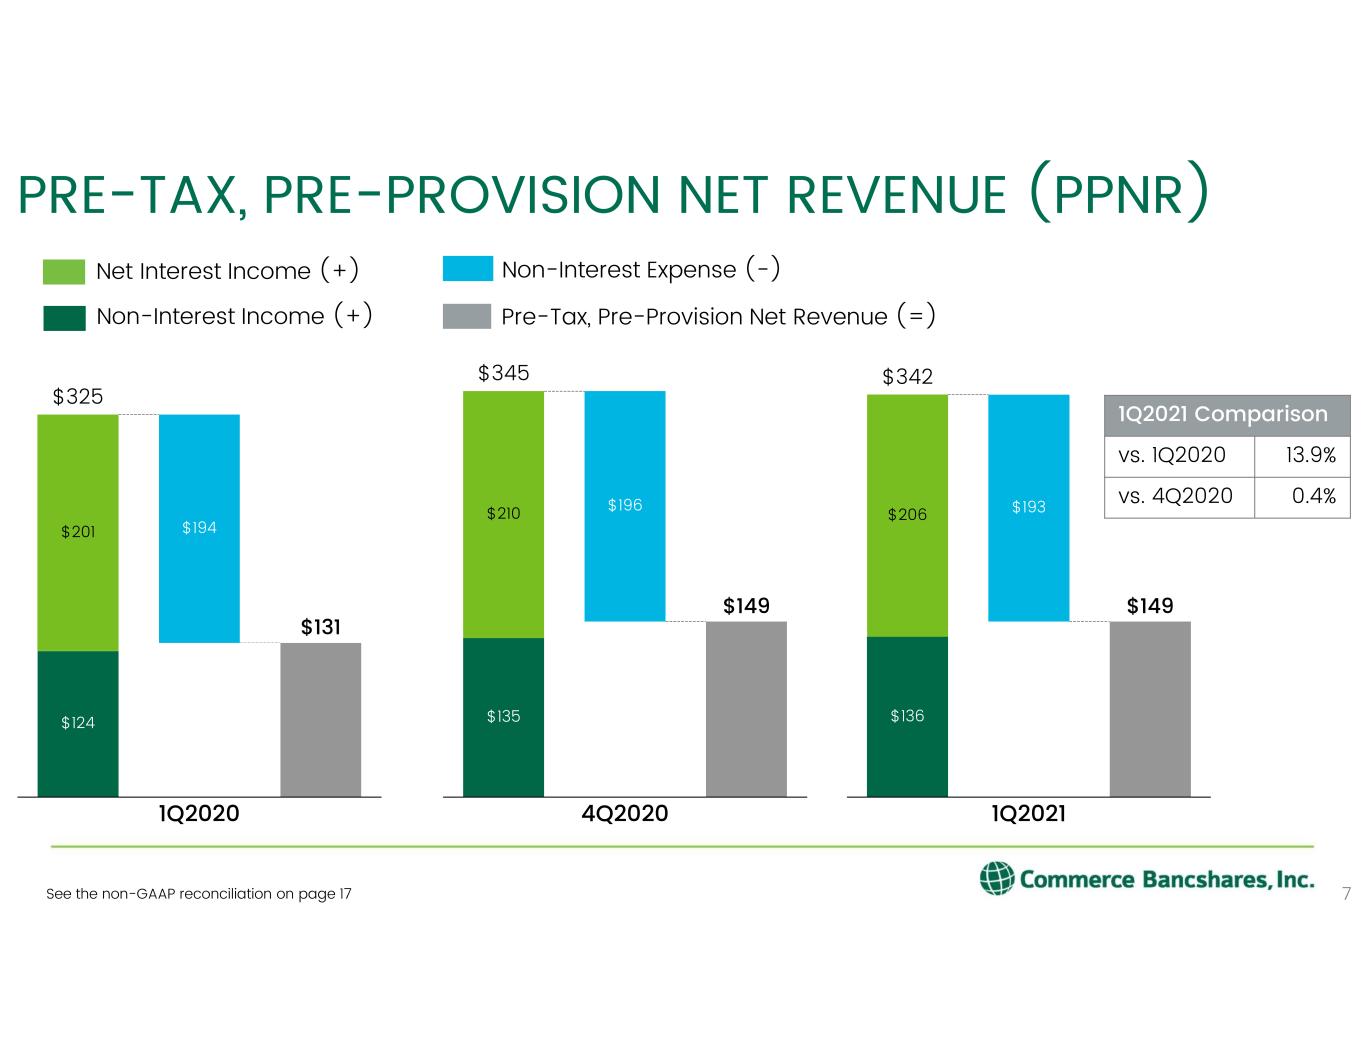
7 PRE-TAX, PRE-PROVISION NET REVENUE (PPNR) $124 $131 $201 $194 1Q2020 $325 $135 $149 $210 $196 4Q2020 $345 $136 $149 $206 $193 $342 1Q2021 Non-Interest Income (+) Net Interest Income (+) Non-Interest Expense (-) Pre-Tax, Pre-Provision Net Revenue (=) 1Q2021 Comparison vs. 1Q2020 13.9% vs. 4Q2020 0.4% See the non-GAAP reconciliation on page 17
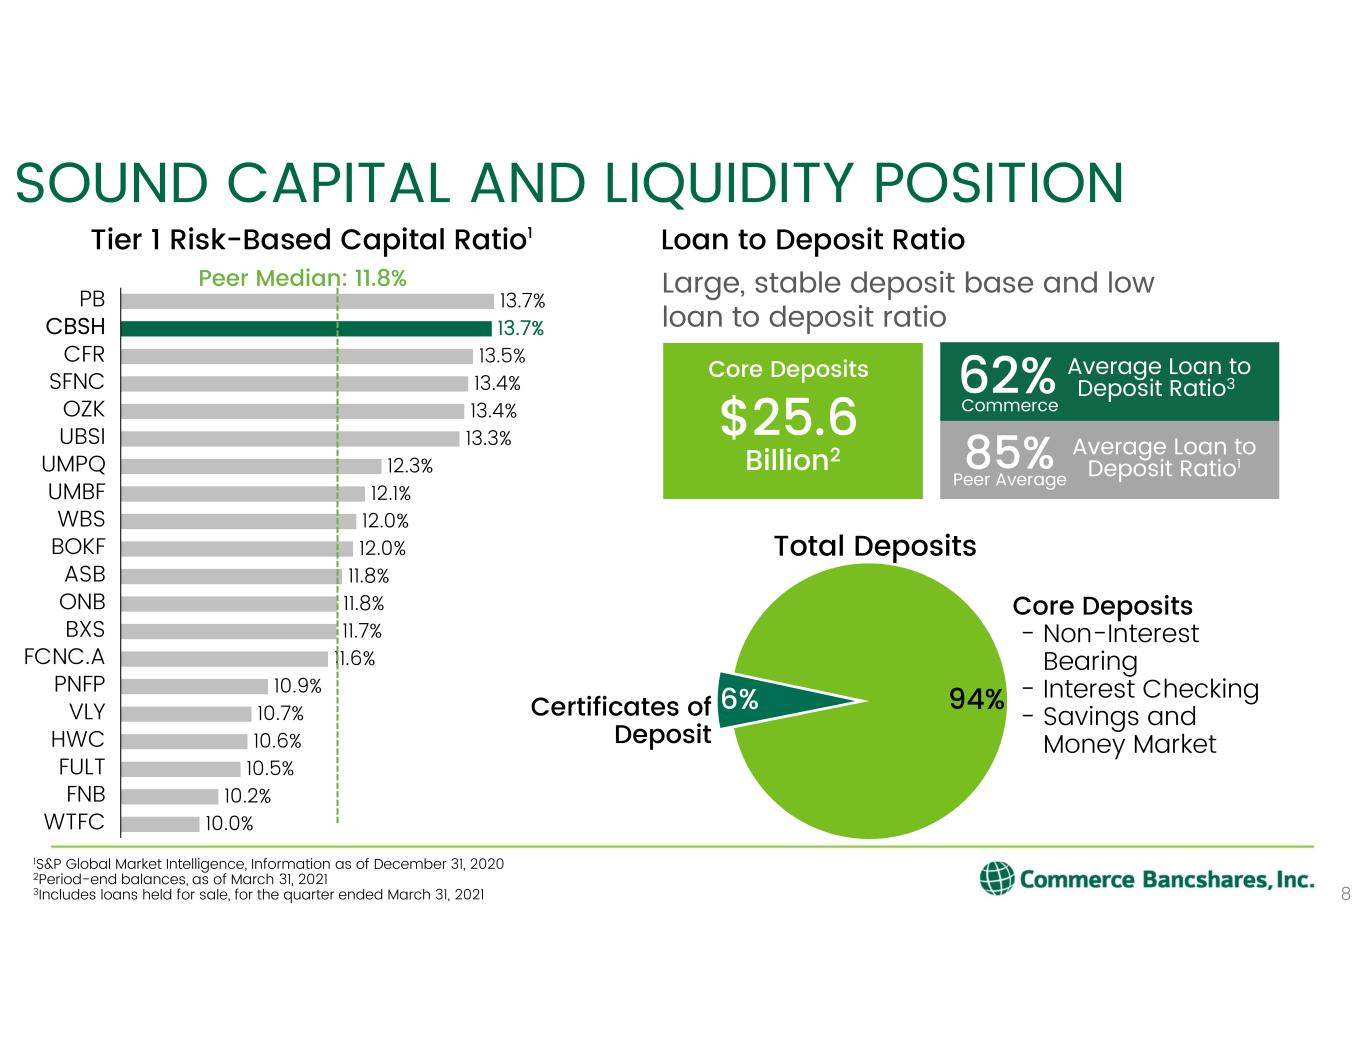
Average Loan to Deposit Ratio3 SOUND CAPITAL AND LIQUIDITY POSITION 8 Tier 1 Risk-Based Capital Ratio1 1S&P Global Market Intelligence, Information as of December 31, 2020 2Period-end balances, as of March 31, 2021 3Includes loans held for sale, for the quarter ended March 31, 2021 13.7% 13.7% 13.5% 13.4% 13.4% 13.3% 12.3% 12.1% 12.0% 12.0% 11.8% 11.8% 11.7% 11.6% 10.9% 10.7% 10.6% 10.5% 10.2% 10.0% WBS CBSH UMBF CFR UBSI OZK SFNC UMPQ BOKF ONB VLY BXS FCNC.A ASB HWC PNFP FULT FNB WTFC PB Peer Median: 11.8% Core Deposits $25.6 Billion2 Large, stable deposit base and low loan to deposit ratio Loan to Deposit Ratio Total Deposits 62% Average Loan to Deposit Ratio185%Peer Average Commerce 94%6% Core Deposits - Non-Interest Bearing - Interest Checking - Savings and Money Market Certificates of Deposit
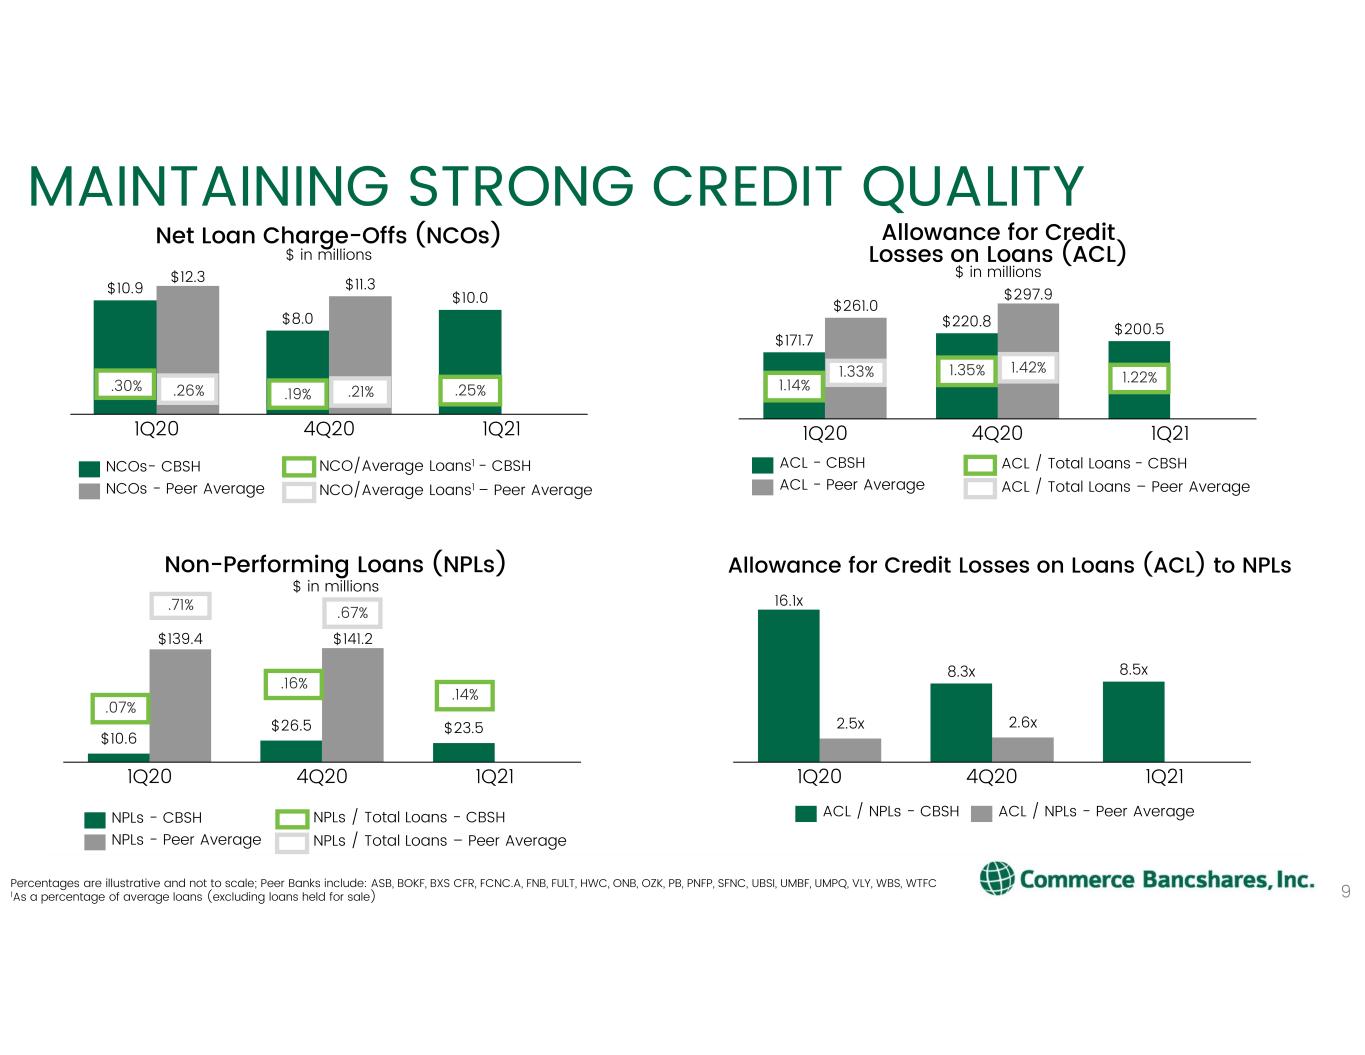
$10.9 $8.0 $10.0 $12.3 $11.3 4Q201Q20 1Q21 MAINTAINING STRONG CREDIT QUALITY 9 Net Loan Charge-Offs (NCOs) $ in millions NCOs - Peer Average NCOs- CBSH NCO/Average Loans1 - CBSH $171.7 $220.8 $200.5 $261.0 $297.9 4Q201Q20 1Q21 Allowance for Credit Losses on Loans (ACL) $ in millions ACL - CBSH ACL - Peer Average ACL / Total Loans - CBSH $10.6 $26.5 $23.5 $139.4 $141.2 4Q201Q20 1Q21 Non-Performing Loans (NPLs) $ in millions NPLs - Peer Average NPLs - CBSH 16.1x 8.3x 8.5x 2.5x 2.6x 1Q20 1Q214Q20 Allowance for Credit Losses on Loans (ACL) to NPLs ACL / NPLs - CBSH ACL / NPLs - Peer Average Percentages are illustrative and not to scale; Peer Banks include: ASB, BOKF, BXS CFR, FCNC.A, FNB, FULT, HWC, ONB, OZK, PB, PNFP, SFNC, UBSI, UMBF, UMPQ, VLY, WBS, WTFC 1As a percentage of average loans (excluding loans held for sale) NPLs / Total Loans - CBSH NCO/Average Loans1 – Peer Average .07% NPLs / Total Loans – Peer Average .16% .14% .71% .67% ACL / Total Loans – Peer Average 1.14% 1.35% 1.22%1.33% 1.42% .30% .19% .25%.26% .21%
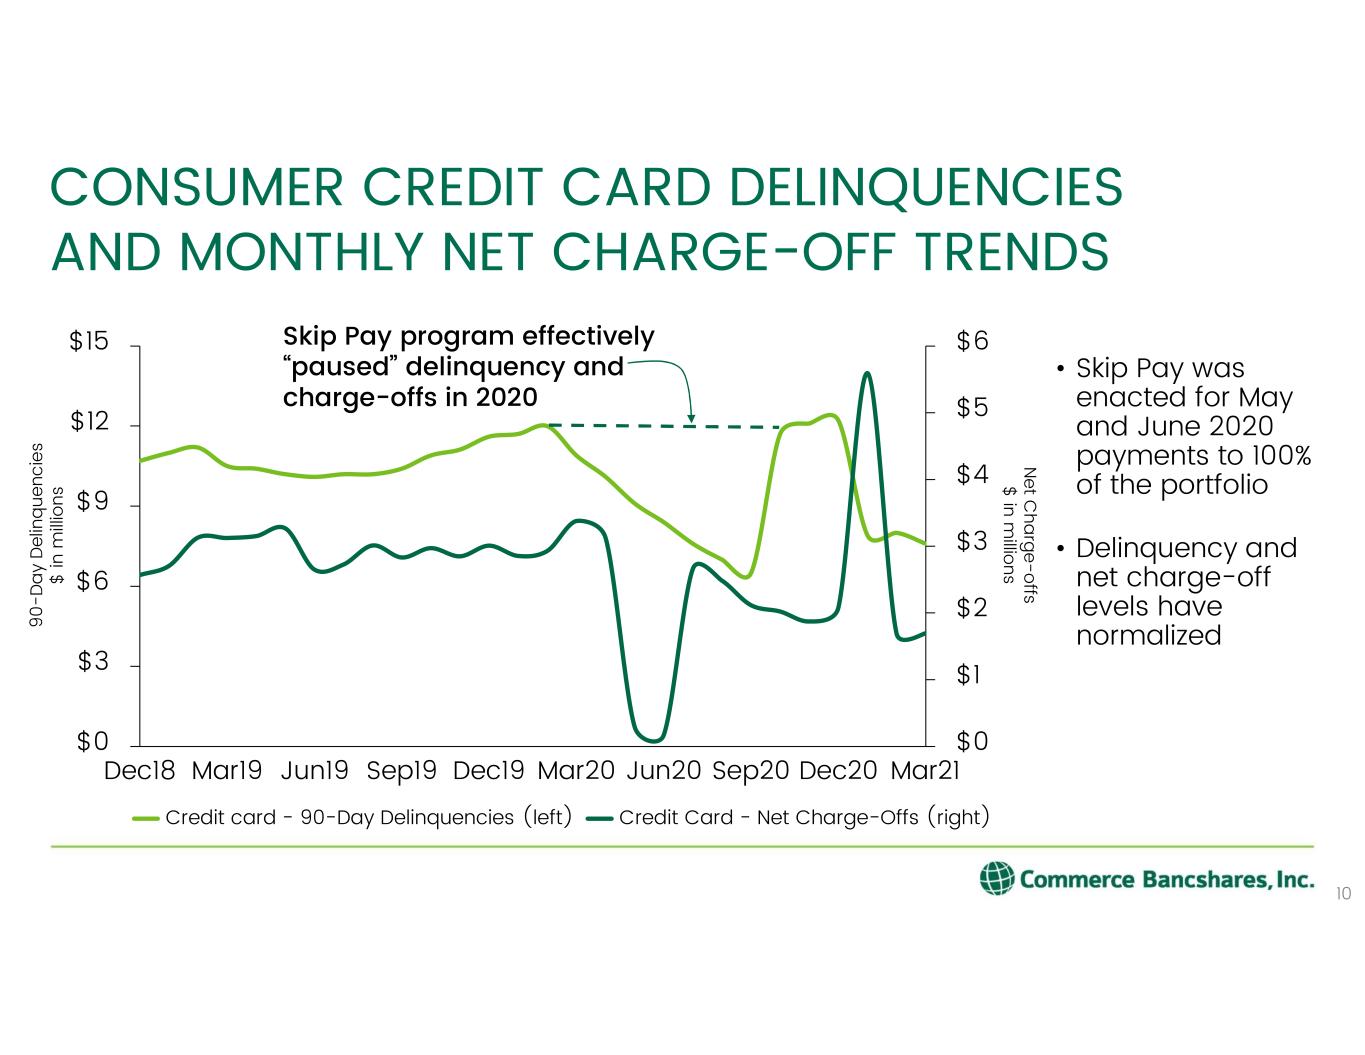
CONSUMER CREDIT CARD DELINQUENCIES AND MONTHLY NET CHARGE-OFF TRENDS • Skip Pay was enacted for May and June 2020 payments to 100% of the portfolio • Delinquency and net charge-off levels have normalized $0 $1 $2 $3 $4 $5 $6 $0 $3 $6 $9 $12 $15 Dec18 Mar19 Jun19 Sep19 Dec19 Dec20Sep20Jun20Mar20 Mar21 Credit card - 90-Day Delinquencies (left) Credit Card - Net Charge-Offs (right) 10 Skip Pay program effectively “paused” delinquency and charge-offs in 2020 9 0 -D a y D el in q ue nc ie s $ in m ill io ns N et C ha rg e-o ffs $ in m illio ns
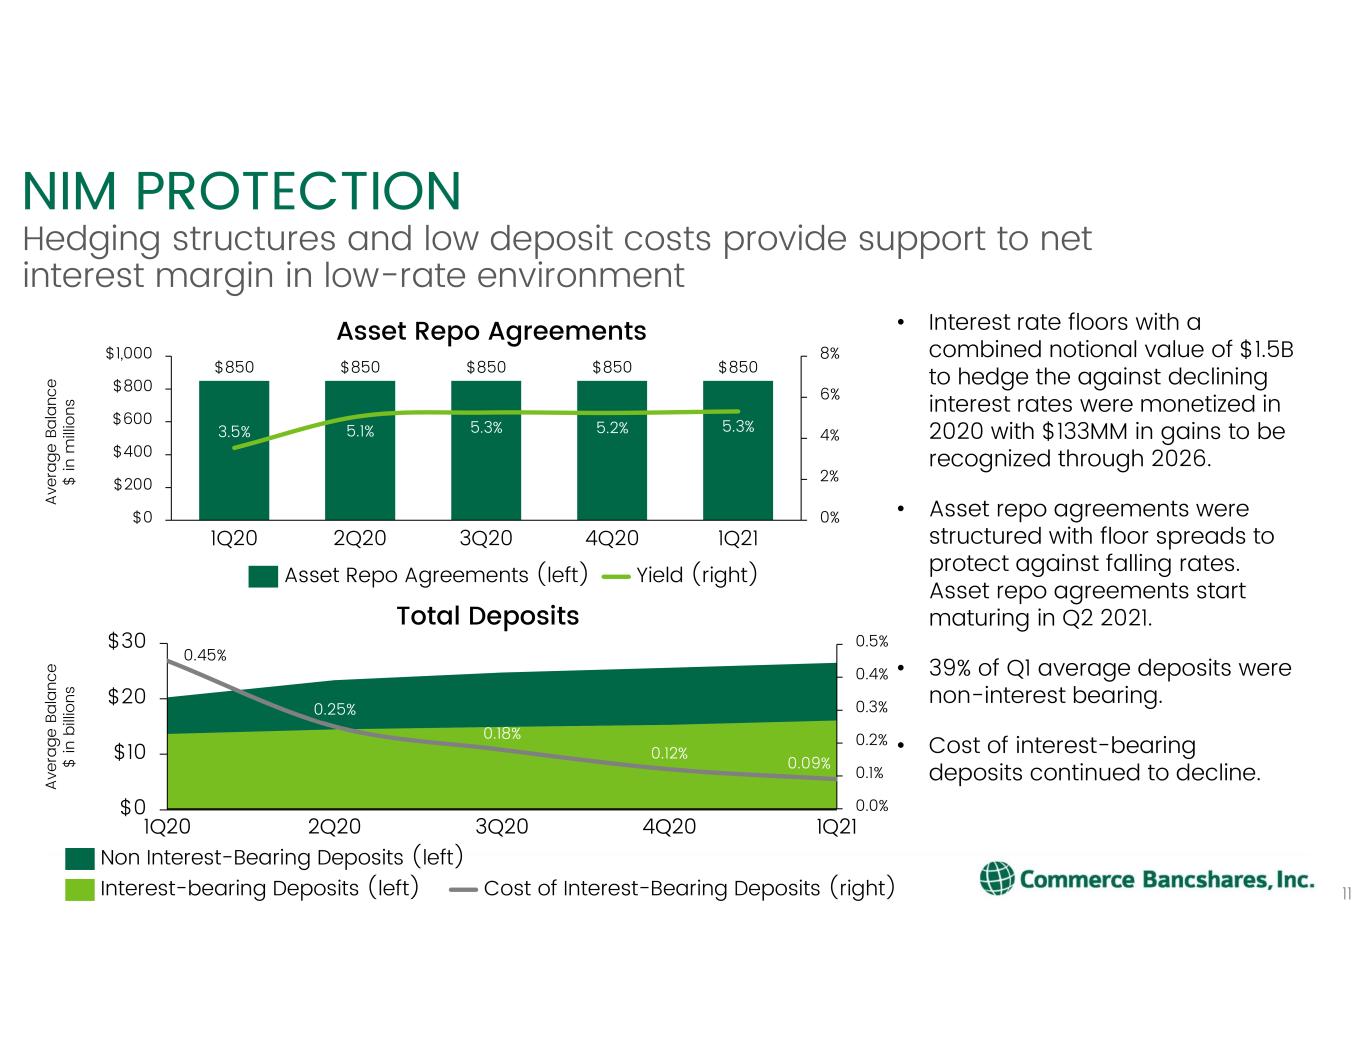
$0 $10 $30 $20 3Q201Q20 4Q202Q20 1Q21 0.45% 0.18% 0.12% 0.09% 0.0% 0.1% 0.2% 0.3% 0.4% 0.5% 0.25% $850 $850 $850 $850 $850 3.5% 5.1% 5.3% 5.2% 5.3% 0% 2% 4% 6% 8% $0 $200 $400 $600 $800 $1,000 2Q20 4Q201Q20 1Q213Q20 NIM PROTECTION Hedging structures and low deposit costs provide support to net interest margin in low-rate environment • Interest rate floors with a combined notional value of $1.5B to hedge the against declining interest rates were monetized in 2020 with $133MM in gains to be recognized through 2026. • Asset repo agreements were structured with floor spreads to protect against falling rates. Asset repo agreements start maturing in Q2 2021. • 39% of Q1 average deposits were non-interest bearing. • Cost of interest-bearing deposits continued to decline. Non Interest-Bearing Deposits (left) Interest-bearing Deposits (left) Asset Repo Agreements A ve ra g e Ba la nc e $ in m ill io ns Asset Repo Agreements (left) Yield (right) Total Deposits A ve ra g e Ba la nc e $ in b ill io ns Cost of Interest-Bearing Deposits (right) 11
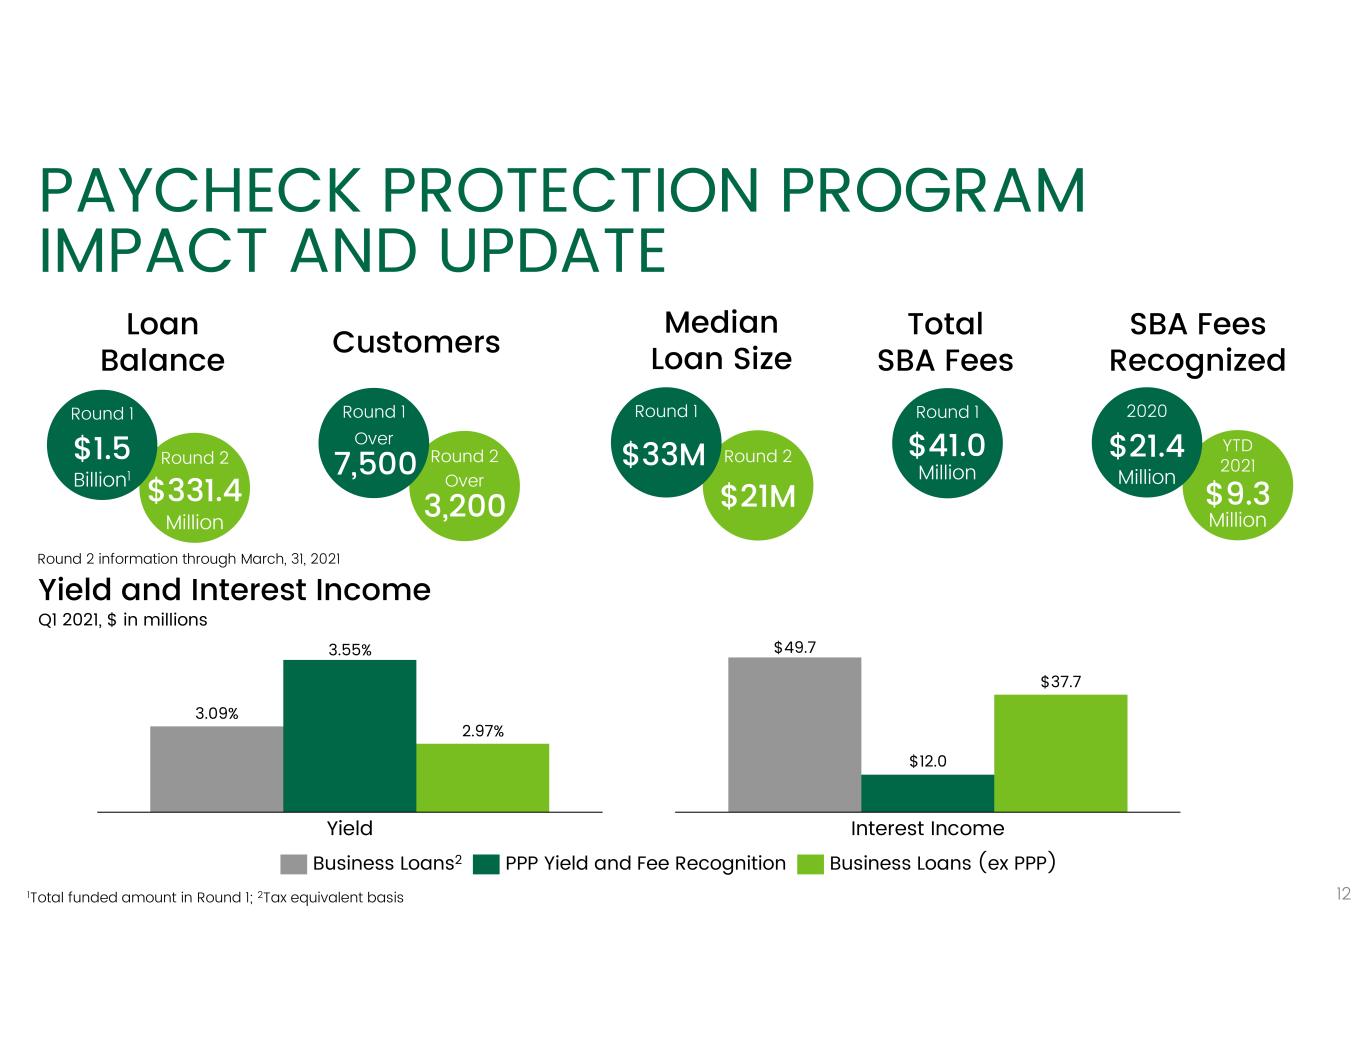
PAYCHECK PROTECTION PROGRAM IMPACT AND UPDATE 12 Yield and Interest Income Q1 2021, $ in millions 3.09% 3.55% 2.97% Yield Business Loans2 PPP Yield and Fee Recognition Business Loans (ex PPP) $49.7 $12.0 $37.7 Interest Income Loan Balance Round 1 Round 2$1.5 Billion1 $331.4 Million Customers Round 1 Round 27,500 Over 3,200 Over Median Loan Size Round 1 Round 2$33M $21M Total SBA Fees Round 1 $41.0 Million SBA Fees Recognized Round 1 $41.0 Million 2020 YTD 2021 $21.4 Million $9.3 Million Round 2 information through March, 31, 2021 1Total funded amount in Round 1; 2Tax equivalent basis
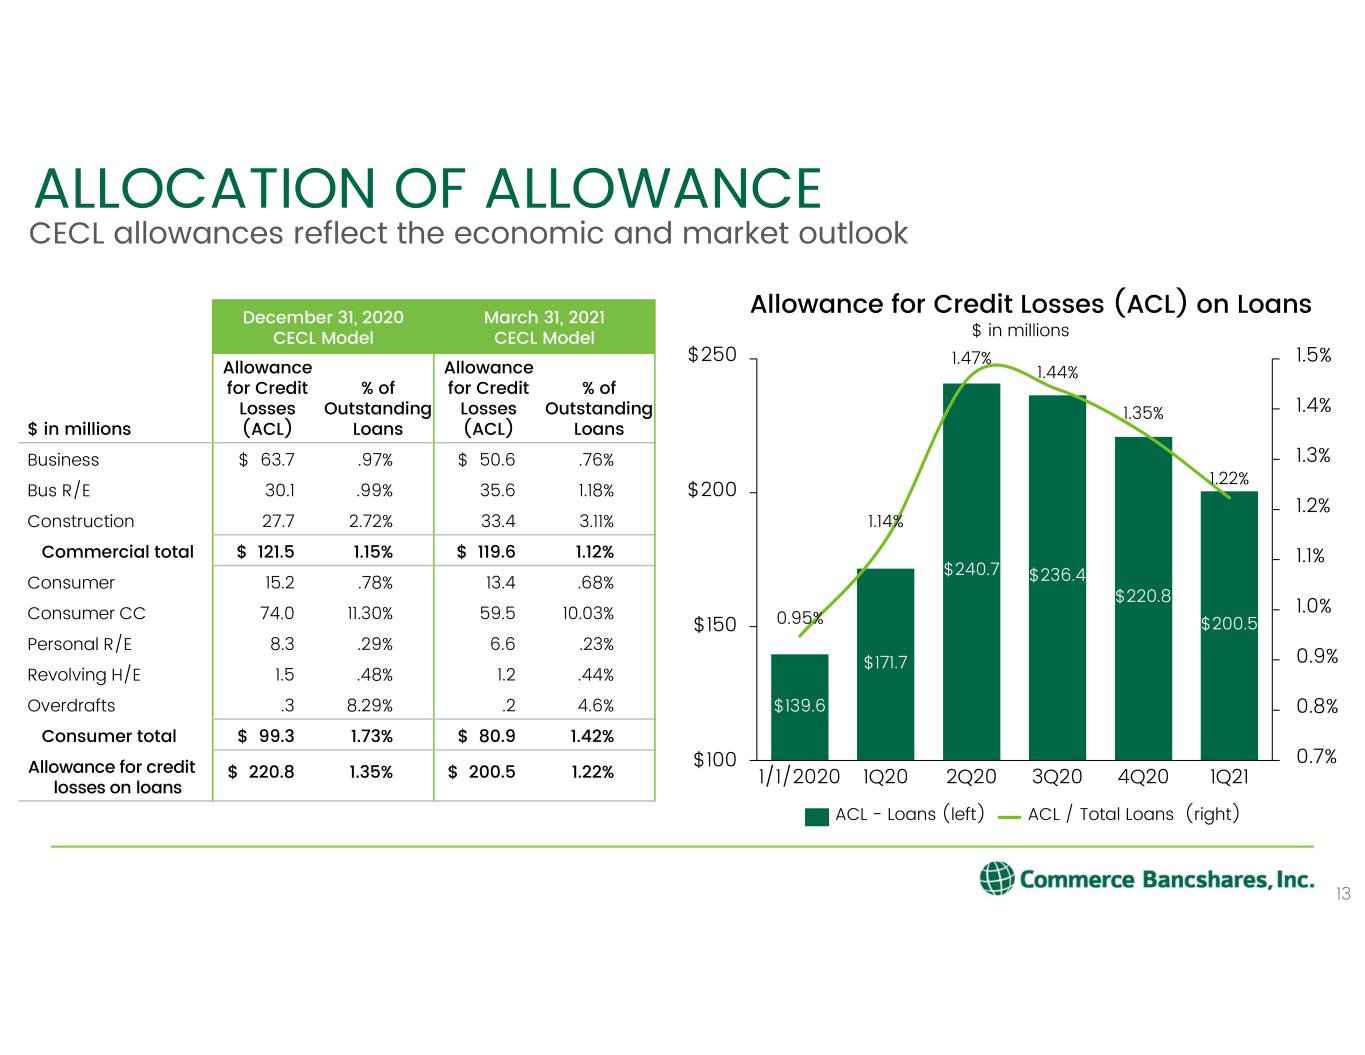
ALLOCATION OF ALLOWANCE 13 CECL allowances reflect the economic and market outlook December 31, 2020 CECL Model March 31, 2021 CECL Model $ in millions Allowance for Credit Losses (ACL) % of Outstanding Loans Allowance for Credit Losses (ACL) % of Outstanding Loans Business $ 63.7 .97% $ 50.6 .76% Bus R/E 30.1 .99% 35.6 1.18% Construction 27.7 2.72% 33.4 3.11% Commercial total $ 121.5 1.15% $ 119.6 1.12% Consumer 15.2 .78% 13.4 .68% Consumer CC 74.0 11.30% 59.5 10.03% Personal R/E 8.3 .29% 6.6 .23% Revolving H/E 1.5 .48% 1.2 .44% Overdrafts .3 8.29% .2 4.6% Consumer total $ 99.3 1.73% $ 80.9 1.42% Allowance for credit losses on loans $ 220.8 1.35% $ 200.5 1.22% 1.47% 1.44% 0.7% 0.8% 0.9% 1.0% 1.1% 1.2% 1.3% 1.4% 1.5% $100 $150 $200 $250 0.95% 1.22% $139.6 1Q201/1/2020 $171.7 $240.7 2Q20 $236.4 3Q20 $220.8 1.35% 4Q20 $200.5 1Q21 1.14% Allowance for Credit Losses (ACL) on Loans ACL - Loans (left) ACL / Total Loans (right) $ in millions
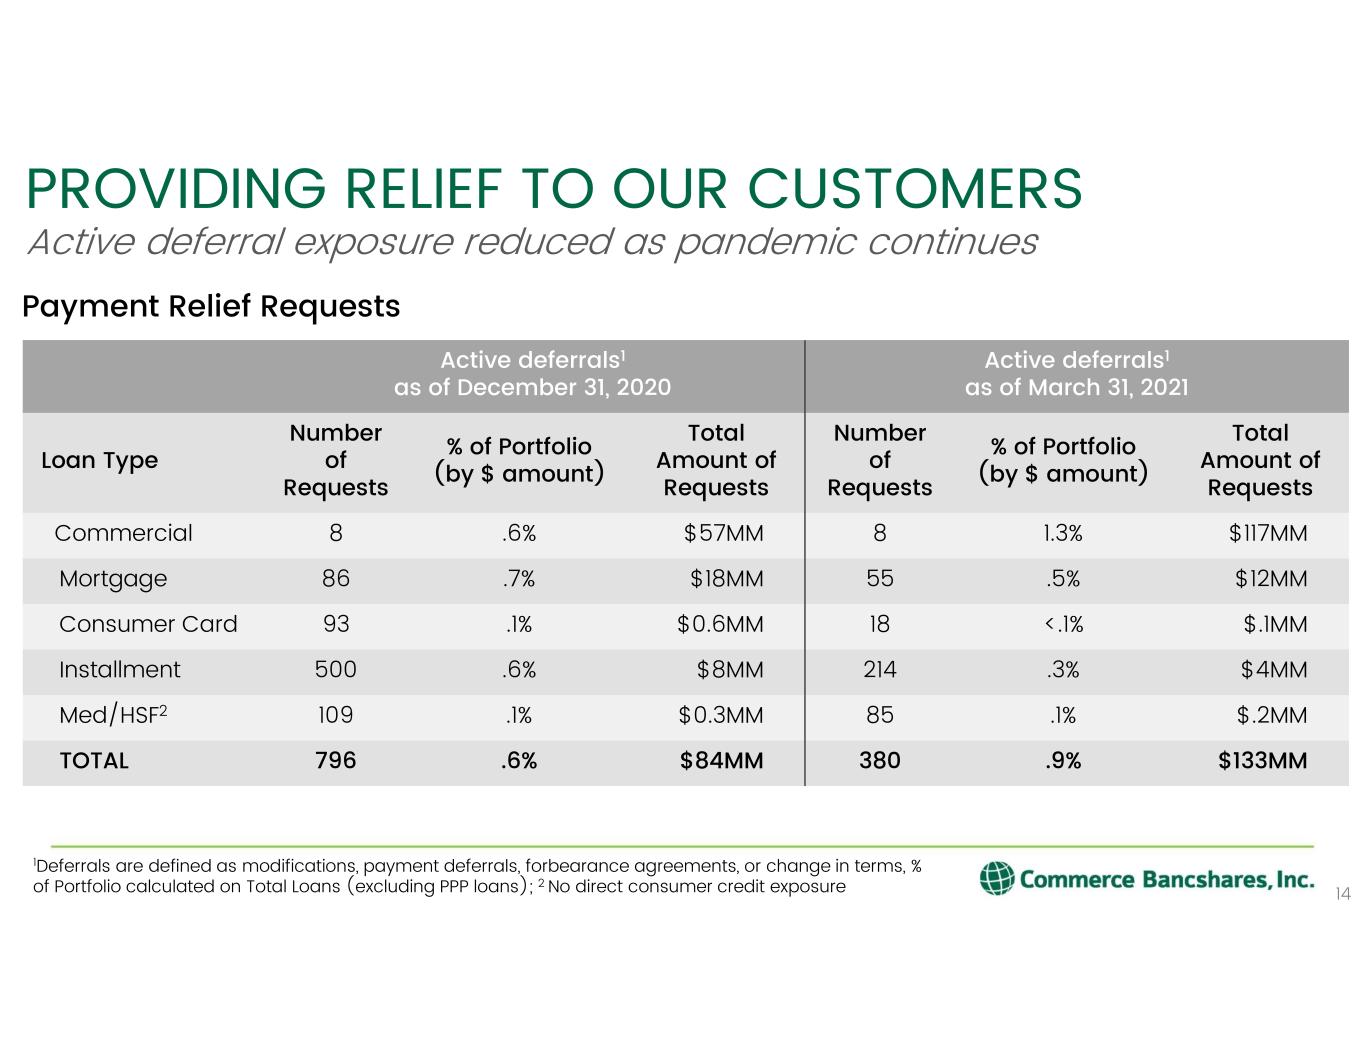
PROVIDING RELIEF TO OUR CUSTOMERS Active deferral exposure reduced as pandemic continues 14 Payment Relief Requests 1Deferrals are defined as modifications, payment deferrals, forbearance agreements, or change in terms, % of Portfolio calculated on Total Loans (excluding PPP loans); 2 No direct consumer credit exposure Active deferrals1 as of December 31, 2020 Active deferrals1 as of March 31, 2021 Loan Type Number of Requests % of Portfolio (by $ amount) Total Amount of Requests Number of Requests % of Portfolio (by $ amount) Total Amount of Requests Commercial 8 .6% $57MM 8 1.3% $117MM Mortgage 86 .7% $18MM 55 .5% $12MM Consumer Card 93 .1% $0.6MM 18 <.1% $.1MM Installment 500 .6% $8MM 214 .3% $4MM Med/HSF2 109 .1% $0.3MM 85 .1% $.2MM TOTAL 796 .6% $84MM 380 .9% $133MM
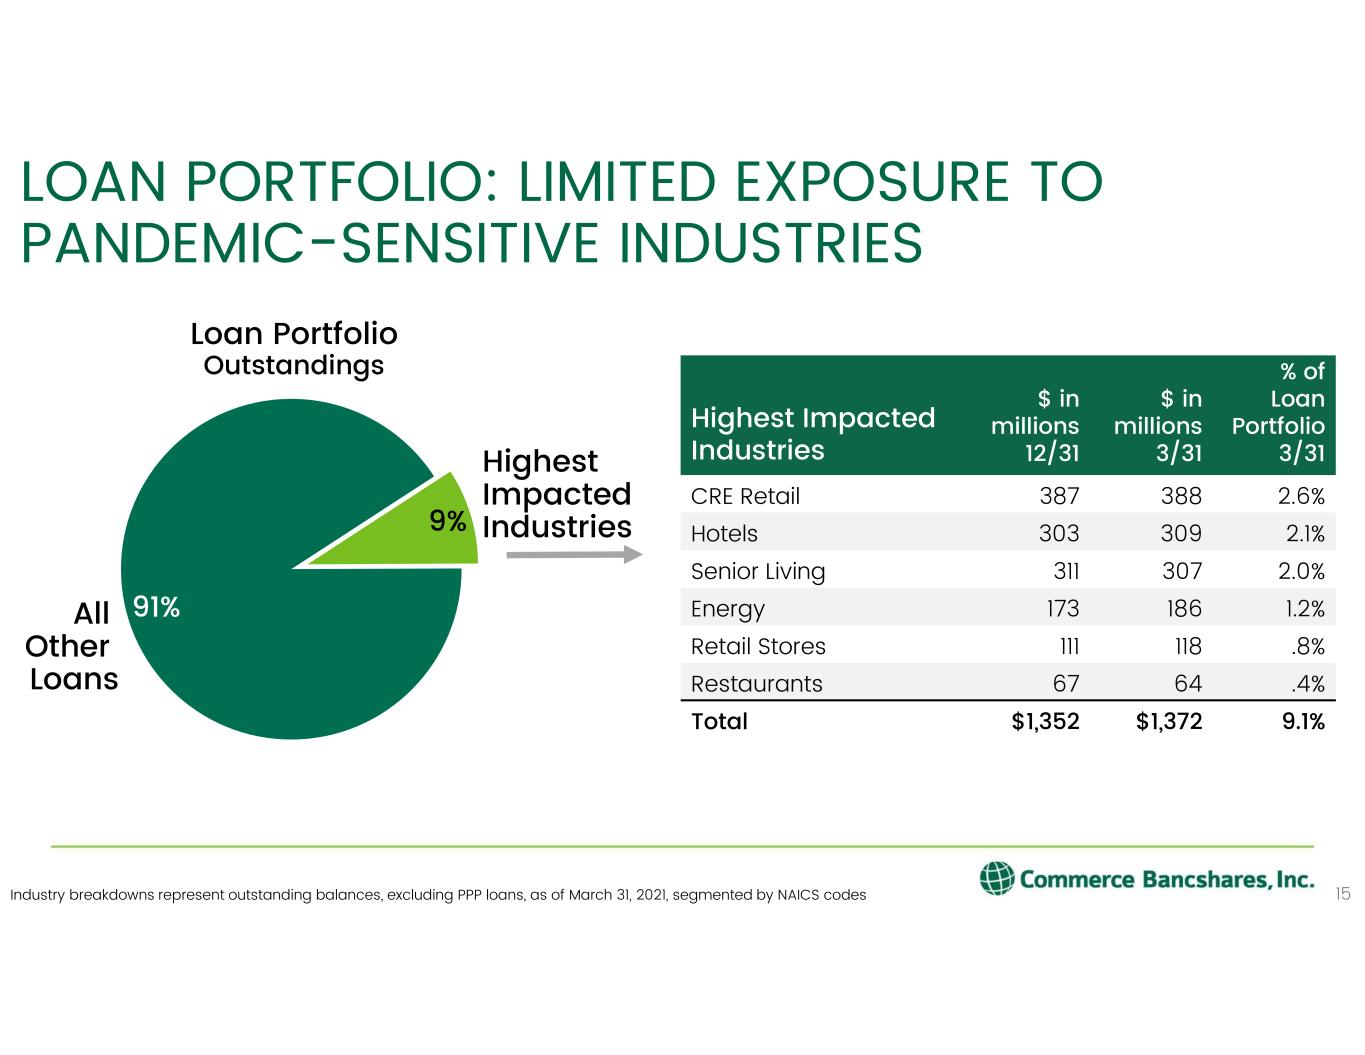
LOAN PORTFOLIO: LIMITED EXPOSURE TO PANDEMIC-SENSITIVE INDUSTRIES 15 Highest Impacted Industries $ in millions 12/31 $ in millions 3/31 % of Loan Portfolio 3/31 CRE Retail 387 388 2.6% Hotels 303 309 2.1% Senior Living 311 307 2.0% Energy 173 186 1.2% Retail Stores 111 118 .8% Restaurants 67 64 .4% Total $1,352 $1,372 9.1% 9% 91% Highest Impacted Industries All Other Loans Industry breakdowns represent outstanding balances, excluding PPP loans, as of March 31, 2021, segmented by NAICS codes Loan Portfolio Outstandings
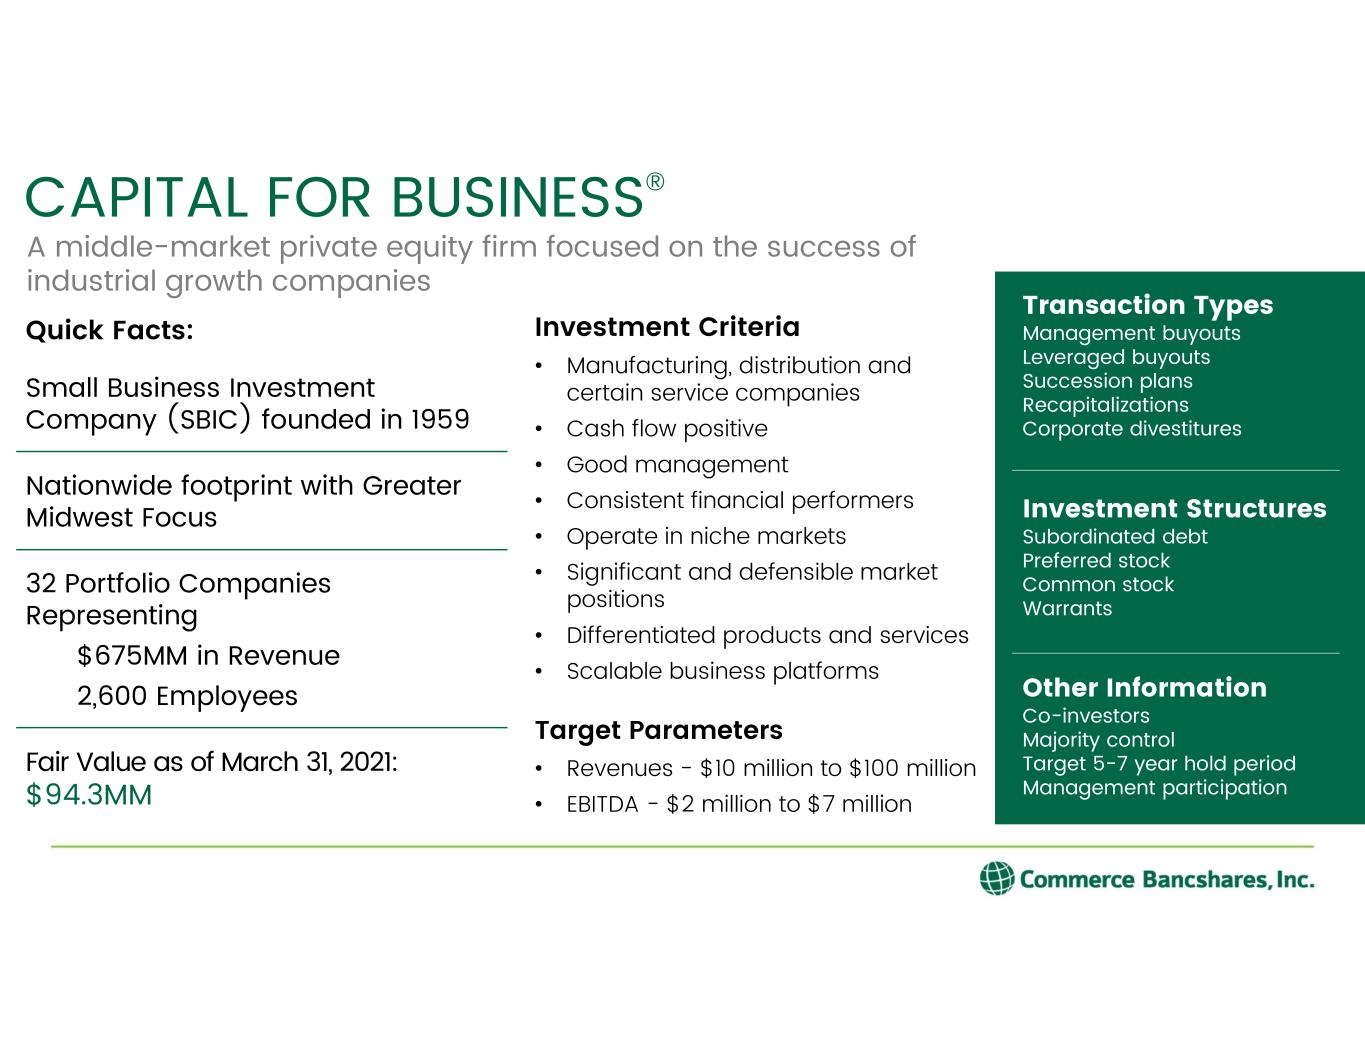
Quick Facts: Small Business Investment Company (SBIC) founded in 1959 Nationwide footprint with Greater Midwest Focus 32 Portfolio Companies Representing $675MM in Revenue 2,600 Employees Fair Value as of March 31, 2021: $94.3MM Investment Criteria • Manufacturing, distribution and certain service companies • Cash flow positive • Good management • Consistent financial performers • Operate in niche markets • Significant and defensible market positions • Differentiated products and services • Scalable business platforms Target Parameters • Revenues - $10 million to $100 million • EBITDA - $2 million to $7 million CAPITAL FOR BUSINESS® A middle-market private equity firm focused on the success of industrial growth companies Transaction Types Management buyouts Leveraged buyouts Succession plans Recapitalizations Corporate divestitures Investment Structures Subordinated debt Preferred stock Common stock Warrants Other Information Co-investors Majority control Target 5-7 year hold period Management participation 16
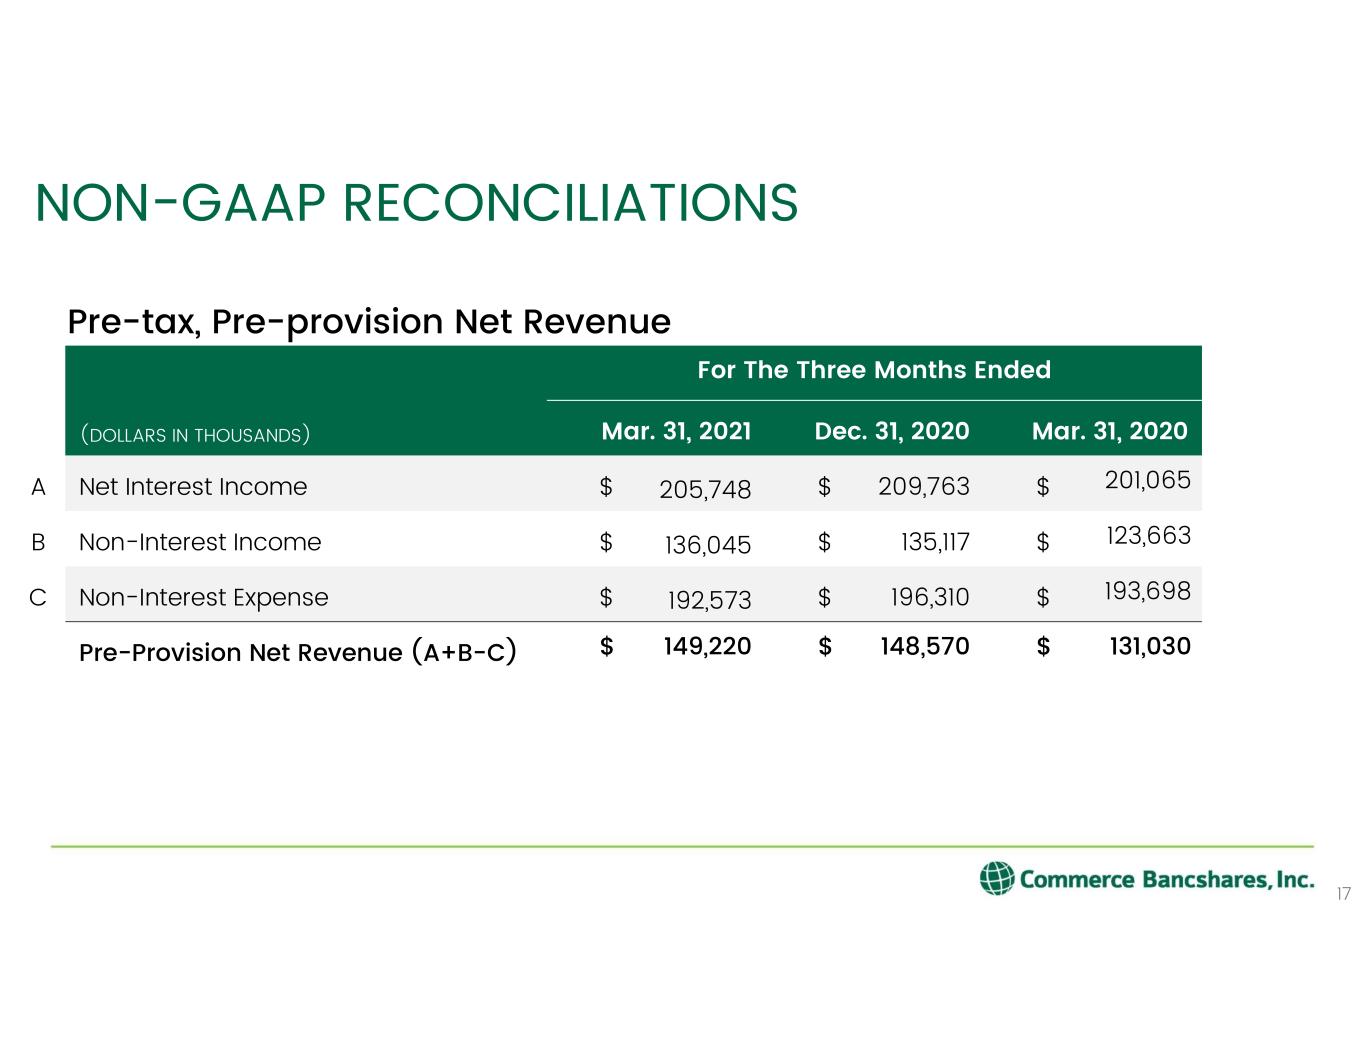
NON-GAAP RECONCILIATIONS 17 For The Three Months Ended (DOLLARS IN THOUSANDS) Mar. 31, 2021 Dec. 31, 2020 Mar. 31, 2020 A Net Interest Income $ 205,748 $ 209,763 $ 201,065 B Non-Interest Income $ 136,045 $ 135,117 $ 123,663 C Non-Interest Expense $ 192,573 $ 196,310 $ 193,698 Pre-Provision Net Revenue (A+B-C) $ 149,220 $ 148,570 $ 131,030 Pre-tax, Pre-provision Net Revenue
