Attached files
| file | filename |
|---|---|
| EX-32.2 - EXHIBIT 32.2 - JMP GROUP LLC | ex_216723.htm |
| EX-32.1 - EXHIBIT 32.1 - JMP GROUP LLC | ex_216722.htm |
| EX-31.2 - EXHIBIT 31.2 - JMP GROUP LLC | ex_216721.htm |
| EX-31.1 - EXHIBIT 31.1 - JMP GROUP LLC | ex_216720.htm |
| EX-23.2 - EXHIBIT 23.2 - JMP GROUP LLC | ex_234222.htm |
| EX-23.1 - EXHIBIT 23.1 - JMP GROUP LLC | ex_216719.htm |
| EX-21 - EXHIBIT 21 - JMP GROUP LLC | ex_216718.htm |
UNITED STATES
SECURITIES AND EXCHANGE COMMISSION
Washington, D.C. 20549
FORM 10-K
(Mark One)
|
☒ |
ANNUAL REPORT PURSUANT TO SECTION 13 OR 15(d) OF THE SECURITIES EXCHANGE ACT OF 1934 |
For the fiscal year ended December 31, 2020
OR
|
☐ |
TRANSITION REPORT PURSUANT TO SECTION 13 OR 15(d) OF THE SECURITIES EXCHANGE ACT OF 1934 |
For the transition period from to
Commission File Number: 001-36802
JMP Group LLC
(Exact name of registrant as specified in its charter)
|
Delaware |
47-1632931 |
|
|
(State or other jurisdiction of incorporation or organization) |
(I.R.S. Employer Identification No.) |
600 Montgomery Street, Suite 1100, San Francisco, California 94111
(Address of principal executive offices)
(415) 835-8900
(Registrant’s telephone number, including area code)
Securities registered pursuant to Section 12(b) of the Act:
|
Title of Each Class |
Trading Symbol |
Name of Each Exchange on Which Registered |
|
Shares representing limited liability company interests in JMP Group LLC JMP Group LLC 6.875% Senior Notes due 2029 JMP Group Inc. 7.25% Senior Notes due 2027 |
JMP JMPNZ JMPNL |
New York Stock Exchange The Nasdaq Global Market The Nasdaq Global Market |
Securities registered pursuant to Section 12(g) of the Act:
None
Indicate by check mark if the registrant is a well-known seasoned issuer, as defined in Rule 405 of the Securities Act. Yes ☐ No ☒
Indicate by check mark if the registrant is not required to file reports pursuant to Section 13 or Section 15(d) of the Act. Yes ☐ No ☒
Indicate by check mark whether the registrant (1) has filed all reports required to be filed by Section 13 or 15(d) of the Securities Exchange Act of 1934 during the preceding 12 months (or for such shorter period that the registrant was required to file such reports), and (2) has been subject to such filing requirements for the past 90 days. Yes ☒ No ☐
Indicate by check mark whether the registrant has submitted electronically every Interactive Data File required to be submitted pursuant to Rule 405 of Regulation S-T (§232.405 of this chapter) during the preceding 12 months (or for such shorter period that the registrant was required to submit such files). Yes ☒ No ☐
Indicate by check mark whether the registrant is a large accelerated filer, an accelerated filer, a non-accelerated filer, a smaller reporting company, or an emerging growth company. See the definitions of “large accelerated filer,” “accelerated filer,” “smaller reporting company,” and “emerging growth company” in Rule 12b-2 of the Exchange Act.
Large Accelerated Filer ☐ Accelerated Filer ☐ Non-Accelerated Filer ☒ Smaller Reporting Company ☒ Emerging growth company ☐
If an emerging growth company, indicate by check mark if the registrant has elected not to use the extended transition period for complying with any new or revised financial accounting standards provided pursuant to Section 13(a) of the Exchange Act. ☐
Indicate by check mark whether the registrant has filed a report on and attestation to its management's assessment of the effectiveness of its internal control over financial reporting under Section 404(b) of the Sarbanes-Oxley Act (15 U.S.C. 7262(b)) by the registered public accounting firm that prepared or issued its audit report. ☐
Indicate by check mark whether the registrant is a shell company (as defined in Rule 12b-2 of the Act). Yes ☐ No ☒
The aggregate market value of the voting and non-voting common stock held by non-affiliates of the registrant on the last business day of the registrant’s most recently completed second fiscal quarter, based upon the closing sale price of the registrant’s common share on June 30, 2020 as reported on The New York Stock Exchange was $22. 2 million.
JMP Group LLC shares representing limited liability company interests outstanding as of March 19, 2021: 19,823,354
DOCUMENTS INCORPORATED BY REFERENCE
Portions of the registrant’s definitive proxy statement to be delivered to shareholders in connection with the 2020 annual meeting of shareholders to be held in June 2021 are incorporated by reference in this Annual Report on Form 10-K (“Form 10-K”). Such proxy statement will be filed with the U.S. Securities and Exchange Commission (the “SEC”) within 120 days of the registrant’s fiscal year ended December 31, 2020.
|
PART I |
||
|
Item 1. |
6 | |
|
Item 1A. |
12 | |
|
Item 1B. |
28 | |
|
Item 2. |
28 | |
|
Item 3. |
28 | |
|
Item 4. |
28 | |
|
PART II |
||
|
Item 5. |
29 | |
|
Item 6. |
30 | |
|
Item 7. |
Management’s Discussion and Analysis of Financial Condition and Results of Operations |
30 |
|
Item 7A. |
54 | |
|
Item 8. |
55 | |
|
Item 9. |
Changes in and Disagreements With Accountants on Accounting and Financial Disclosure |
95 |
|
Item 9A. |
95 | |
|
Item 9B. |
95 | |
|
PART III |
||
|
Item 10. |
96 | |
|
Item 11. |
96 | |
|
Item 12. |
Security Ownership of Certain Beneficial Owners and Management and Related Shareholder Matters |
96 |
|
Item 13. |
Certain Relationships and Related Transactions, and Director Independence |
96 |
|
Item 14. |
96 | |
|
PART IV |
||
|
Item 15. |
97 | |
|
Item 16. |
97 | |
| 98 | ||
| 101 | ||
SPECIAL NOTE REGARDING FORWARD-LOOKING STATEMENTS
We make forward-looking statements, as defined by the “safe harbor” provisions of the Private Securities Litigation Reform Act of 1995, in this Form 10-K that are subject to risks and uncertainties. When we use the words “could,” “will likely result,” “if,” “in the event,” “may,” “might,” “should,” “shall,” “will,” “believe,” “expect,” “anticipate,” “plan,” “predict,” “potential,” “project,” “intend,” “estimate,” “goal,” “objective,” “continue,” or the negatives of these terms and other similar expressions, we intend to identify forward-looking statements. These forward-looking statements include information about possible or assumed future results of our business, financial condition, liquidity, results of operations, plans and objectives. They also include statements concerning anticipated revenues, income or loss, capital expenditures, distributions, capital structure or other financial terms. The statements we make regarding the following subject matters are forward-looking by their nature:
|
• |
the opportunity to grow our investment banking and sales and trading businesses because of the prevalent demand for our services in our three target industries; |
|
• |
the potential for impaired performance of our investment banking and sales and trading businesses due to a declining demand for our services or a declining market for securities of companies in our three target industries; |
|
• |
our ability to depend on follow-on offerings, PIPEs and registered direct offerings to generate corporate finance revenues; |
|
• |
the growth of our mergers and acquisitions and other strategic advisory business derived from our positions as a lead manager or senior co-manager of public and private securities offerings; |
|
• |
the opportunity to increase our representation of corporate clients as buyers and to grow our mergers and acquisitions and strategic advisory businesses; |
|
• |
our ability to succeed as a strategic advisor due to our ability to structure and execute complex transactions; |
|
• |
the possibility of generating stable or growing investment banking revenues due to our ability to engage in multiple types of transactions; |
|
• |
our plans to continue to focus our equity research and sales and trading products and services on small- and mid-capitalization companies in order to benefit institutional investors; |
|
• |
our expectations regarding the impact of the trend toward alternative trading systems and downward pricing pressure on trading commissions and spreads in the sales and trading business; |
|
• |
the characteristics of the asset management business, including its comparatively high margins, the recurring nature of its fee-based revenues and its dependence on intellectual capital, and our belief that this makes our asset management business less susceptible to competitive threats from larger financial institutions; |
|
• |
our expectations of a heightened demand for alternative asset management products and services; |
|
• |
our ability to increase assets under management and to develop new asset management products; |
|
• |
the fact that the past performance of our funds is not indicative of our future performance; |
|
• |
our plans to generate principal investing opportunities from our investment banking and asset management relationships; |
|
• |
the emergence of investment opportunities that offer attractive risk-adjusted returns on our investable assets; |
|
• |
our plans to grow our businesses both through internal expansion and through strategic investments, acquisitions or joint ventures; |
|
• |
our ability to take advantage of market opportunities as they arise, based on the strength of our capital position and the low level of leverage that we have traditionally employed; |
|
• |
our ability to realize revenues through gain on repurchase of Senior Notes; |
|
• |
the impact of changes in interest rates on the value of interest-bearing assets in which we invest; |
|
• |
the nature of the competition faced in the financial services industry, particularly among investment banks and asset managers, and our expectations regarding trends and changes with respect to competing entities; |
|
• |
our ability to attract, incentivize and retain top professionals and to retain valuable relationships with our clients; |
|
• |
our ability to avoid restrictions imposed by the Investment Company Act of 1940; |
|
• |
our expectations regarding the likelihood of increased scrutiny of financial services firms from regulators; |
|
• |
the fact that we do not anticipate that any tax adjustments will result in a material adverse effect on our financial condition; |
|
• |
the impact of existing claims and currently known threats against us on our business or financial condition; |
|
• |
the impact of bonus compensation payments to our employees on our cash position; |
|
• |
our ability to satisfy our funding needs with existing internal and external financial sources; |
|
• |
our beliefs regarding the impact of interest rate, credit and inflation risks; and |
|
• |
the fact that we believe that our available liquidity and current level of equity capital will be adequate to meet our liquidity and regulatory capital requirements for the next twelve months. |
The forward-looking statements are based on our beliefs, assumptions and expectations of future performance, taking into account the information currently available to us. These statements are only predictions, based upon our current expectations and projections about future events. Any projections of our future financial performance may be based upon expected outcomes of our growth strategies and anticipated trends in our business. There are important factors that could cause our actual results, levels of activity, performance or achievements to differ materially from the results, levels of activity, performance or achievements expressed or implied by the forward-looking statements. In particular, you should consider the numerous risks including, but not limited to, the following factors:
|
• |
the impact of multiple bookrunners, co-managers and multiple financial advisors on the competitive landscape and, in turn, on our revenues; |
|
• |
our ability to remain competitive with larger investment banks that provide commercial financing; |
|
• |
the impact of unsettled market conditions on our ability to serve as underwriter or placement agent; |
|
• |
the potential for uncertainty related to creditworthiness, volatility in the equity markets and diminished access to financing to impact our mergers and acquisitions and strategic advisory businesses; |
|
• |
the potential for volatility and weakness in the equity markets to adversely impact our sales and trading business, investment banking business and ability to manage exposure to market risks; |
|
• |
the impact of conditions in the global financial markets, such as the level and volatility of interest rates, investor sentiment, the availability and the cost of credit, the U.S. mortgage market, the U.S. real estate market, energy prices, consumer confidence, unemployment, and geopolitical issues on our business and revenues; |
|
• |
the impact of any deterioration in the business environment of our target sectors on our revenues; |
|
• |
our expectations regarding the effect of a market downturn on transaction volume and, therefore, our revenues; |
|
• |
our expectations regarding the impact of bankruptcies on our investment banking revenues; |
|
• |
the impact of securities-related write-downs on our securities trading revenues; |
|
• |
the impact of a market downturn on asset management fees; |
|
• |
the impact of the inability of companies to repay their borrowings on our CLO investment; |
|
• |
the potential for market declines to lead to an increase in litigation and arbitration claims; |
|
• |
our ability to pursue business opportunities in an environment of increased legislative or regulatory initiatives; |
|
• |
the potential for governmental fiscal and monetary policy to have a negative impact on our business; |
|
• |
our expectation that the ability to recruit and retain professionals impacts our reputation, business, results of operations and financial condition; |
|
• |
the impact of larger firms on our ability to grow our business; |
|
• |
the impact of increased competition in the middle-market investment banking space on our market share and revenues; |
|
• |
the impact on brokerage revenues of pricing arrangements with certain institutional sales and trading clients; |
|
• |
the potential for larger and more frequent capital commitments in our trading and underwriting business to increase losses; |
|
• |
the potential for increased competition in the asset management sector to affect our ability to raise capital and generate positive economic results; |
|
• |
the impact of investment performance and redemptions on our asset management business; |
|
• |
the potential for fluctuations in the global credit markets to affect our CLO investments; |
|
• |
any fluctuations in the credit markets, including reduced access to capital and liquidity, and the costs of credit; |
|
• |
any exposure to volatile and illiquid securities and their impact on our business; |
|
• |
the impact of principal investment activities on our capital base; |
|
• |
the challenges posed when valuing non-marketable investments; |
|
• |
the impact of our increased leverage as a result of our September 2019 offering of 6.875% Senior Notes due 2029 (the “2029 Senior Notes”) and the November 2017 offering of 7.25% Senior Notes due 2027 (the “2027 Senior Notes,” together with the 2029 Senior Notes, the “Senior Notes”); |
|
• |
the impact of requirements by the SEC, the Financial Industry Regulatory Authority and various other self-regulatory organizations on our business; |
|
• |
the potential for increased scrutiny of financial services firms to adversely impact our business; |
|
• |
the business risks posed by potential conflicts of interest, employee misconduct and business partner misconduct; |
|
• |
the risks posed by using estimates to prepare our consolidated financial statements and new accounting standards; |
|
• |
the potential for risks related to infrastructure and operations to impact our business; |
|
• |
the potential for interest rate, credit and inflation risks to impact our business; |
|
• |
the potential for market and non-market factors to impact our share price; and |
|
• |
any fluctuations in our share price related to the performance of our investment banking department. |
The foregoing list of risks is not exhaustive. Other sections of this Form 10-K may include additional factors that could adversely impact our business and financial performance. Moreover, we operate in a very competitive and rapidly changing environment. New risks emerge from time to time, and it is not possible for us to predict all risks, nor can we assess the impact of all factors or the effect that any factor, or combination of factors, may have on our business. Actual results may differ materially from those contained in any forward-looking statements.
Although we believe that the expectations reflected in the forward-looking statements are reasonable, we cannot guarantee future results, levels of activity, performance or achievements. You should not rely upon forward-looking statements as predictions of future events. We undertake no duty to update any of these forward-looking statements after the date of this Form 10-K to conform prior statements to actual results or revised expectations unless otherwise required by law.
|
Business |
Overview
Corporate Information
JMP Group LLC, together with its subsidiaries (collectively, “the Company”, “we” or “us”), is a diversified capital markets firm. We provide investment banking, sales and trading, and equity research services to corporate and institutional clients as well as alternative asset management products and services to institutional investors and high-net-worth individuals. In addition, we invest in corporate credit instruments through collateralized loan obligations and direct investments, and we serve as the investment advisor to a business development company under the Investment Company Act of 1940 (the “Investment Company Act”).
JMP Group Inc. was incorporated in Delaware in January 2000, and JMP Group LLC was formed in Delaware in August 2014. Our headquarters are located at 600 Montgomery Street, Suite 1100, San Francisco, California 94111. Our telephone number is (415) 835-8900, and our internet address is http://www.jmpg.com.
We completed an initial public offering in May 2007 and a reorganization transaction (the "Reorganization Transaction") in January 2015. References to JMP Group LLC in this Annual Report on Form 10-K that include any period before the effectiveness of the Reorganization Transaction shall be deemed to refer to JMP Group Inc.
In January 2019, the Company filed an election with the U.S. Internal Revenue Service to be treated as C corporation for tax purposes, rather than a partnership. The IRS subsequently approved the election, with an effective date of January 1, 2019. Irrespective of the change in tax treatment, the Company remains a limited liability company.
Our common shares representing limited liability company interests are currently listed on the New York Stock Exchange (the “NYSE”) under the symbol “JMP”. Our 7.25% Senior Notes due 2027 and 6.875% Senior Notes due 2029 are each listed on the Nasdaq Global Market under the symbols “JMPNL” and “JMPNZ”, respectively.
Principal Business Lines
We conduct our investment banking and institutional brokerage business through JMP Securities LLC (“JMP Securities”); conduct our asset management business through Harvest Capital Strategies LLC (“HCS”), JMP Asset Management LLC (“JMPAM”) and HCAP Advisors LLC ("HCAP Advisors"); and make certain principal investments through JMP Investment Holdings LLC ("JMP Investment Holdings"), JMP Capital LLC ("JMP Capital") and other subsidiaries.
JMP Securities is a U.S. registered broker-dealer under the Exchange Act and is a member of FINRA. JMP Securities provides equity research and sales and trading services to institutional brokerage clients, as well as capital raising and strategic advisory services to corporate clients. JMP Securities operates as an introducing broker and does not hold funds or securities for, or owe any money or securities to, customers and does not carry accounts for customers. All customer transactions are cleared through another broker-dealer on a fully disclosed basis.
HCS is a registered investment advisor under the Investment Advisers Act of 1940, as amended (the “Investment Advisers Act”), and provides investment management services for sophisticated investors through investment partnerships and other entities managed by HCS, including venture and private equity funds. JMPAM is the investment manager of private equity funds that invest in real estate and real estate related enterprises and provides credit to small and midsize private companies. HCAP Advisors is a majority-owned subsidiary that manages the investment activities of Harvest Capital Credit Corporation ("HCC"), a publicly-traded business development company ("BDC") offering customized financing solutions to small and middle-market companies.
We currently operate from our headquarters in San Francisco and from additional offices in New York, Boston, Chicago, Palm Beach, and the Minneapolis area. Our four revenue-producing business lines—investment banking, sales and trading, equity research, and asset management—across three target industries—technology, healthcare, and financial services and real estate—combine to form a diversified business model, especially when compared to that of our more specialized competitors.
Investment Banking
Our investment banking department provides capital raising services, mergers and acquisitions transaction services, and other strategic advisory services to corporate clients. We focus our efforts on small and middle-market companies in three broad industries: technology, healthcare, and financial services and real estate. Our specialization in these areas has enabled us to develop well recognized expertise and to cultivate extensive industry relationships.
Our investment bankers are arranged in dedicated industry coverage groups, enabling them to develop expertise in specific markets and to form close relationships with corporate executives, private equity investors, venture capitalists and other key industry participants. We offer our clients a high level of attention from senior personnel and have designed our organizational structure so that the investment bankers who are responsible for securing and maintaining client relationships also actively participate in providing transaction execution services to those clients.
By focusing consistently on our three target industries, we have developed a comprehensive understanding of the unique challenges and demands involved in executing corporate finance and strategic advisory assignments in these sectors. A significant portion of our corporate finance revenue is earned from small- and mid-capitalization public companies, and the balance is earned from private companies. Some of our corporate clients retain us for our advisory and capital raising capabilities during an accelerated growth phase as a private company and then continue to work with us through an initial public offering or sale of the company. We maintain exceptional client focus both during and following a transaction, leading to a true advisory relationship and a pattern of assisting companies with multiple transactions.
Corporate Finance
We assist our publicly traded and privately held corporate clients with capital raising activities, which include the underwriting and private placement of a wide range of equity and debt securities, including common, preferred, and convertible securities. Our public equity underwriting capabilities include initial public offerings, follow-on offerings, and at-the-market offerings. We also arrange private investments in public equity (“PIPE”) transactions and privately negotiated, registered direct stock offerings on behalf of our publicly traded clients. For our privately held clients, we act as an agent in private placements of equity and debt securities. We typically place securities with our client base of institutional investors, private equity and venture capital funds, and high net-worth individuals.
Because our corporate clients are generally high-growth companies, they are frequently in need of new capital. Many of our client relationships develop early, when a client company is still privately held, in which case we may facilitate private placements of the company's securities. Our ability to structure innovative private offerings and to identify the likely buyers of such offerings makes us a valuable advisor for many small and middle-market companies, as does our industry specialization. Thereafter, if our client prepares for an initial public offering, we may be selected to serve as an underwriter of that offering and of any subsequent follow-on offerings. We expect that, while the environment for initial public offerings may not be consistently favorable in the future, we should be able to depend on follow-on offerings, at-the-market offerings, PIPEs, registered direct offerings, and private placements to continue to generate corporate finance revenues.
Mergers and Acquisitions and Other Strategic Advisory
We work with corporate clients on a broad range of strategic matters, including mergers and acquisitions, divestitures and corporate restructurings, valuations of businesses and assets, and fairness opinions and special committee assignments. We provide our advice to senior executives and boards of directors of client companies in connection with transactions that are typically of significant strategic and financial importance to these companies. We believe that our success as a strategic advisor stems from our ability to structure and execute complex transactions that create long-term shareholder value. Because we serve a variety of corporate clients, from private companies in early stages of growth to mature businesses either publicly or privately held, the values of these transactions range in size.
Because of our focus on innovative and fast-growing companies, we are most often an advisor in company sale transactions, although we are taking steps to create equilibrium in our advisory business and expect to increasingly represent corporate clients as buyers over time. We believe that our position as a lead manager or senior co-manager of public and private equity offerings will facilitate the growth of our mergers and acquisitions and strategic advisory businesses, as companies that have been issuers of securities become more mature and pursue acquisitions or other exit events for their investors. We further believe that we have been able to elevate our profile as a strategic advisor in recent years as a result of a build-out of our firm’s advisory capabilities and our demonstrated success as an advisor in an increasing number of mergers and acquisitions with increasing transaction values and industry recognition. By gaining additional visibility among corporate clients with respect to our firm’s strategic advisory capabilities, we anticipate that advisory revenues will be a growing component of our company’s total revenue over time.
Sales and Trading
Our sales and trading department provides institutional investors with capital markets intelligence and distributes our equity research product, communicating investment recommendations about individual equities that are often not widely followed or well understood. In addition, our sales and trading staff executes securities trades on behalf of our institutional clients and markets the securities of companies for which we act as an underwriter.
We have established a broad institutional client base rooted in longstanding relationships, which have been developed through a consistent focus on the investment and trading objectives of our customers. Our sales and trading professionals work closely with our equity research staff to provide insight and differentiated investment advice to brokerage clients nationwide.
We believe that our sales and trading clients turn to us for timely, informed investment advice. Our equity research features proprietary themes and actionable ideas about industries and companies that are often not evaluated by many other research providers. Many peer firms focused on small- and mid-capitalization companies have shut down or have been purchased by larger firms over the past two decades, while several of the very largest investment banking firms failed or consolidated during that time. As a result, the amount of market-making activity, liquidity and research coverage for smaller companies has decreased significantly. However, we continue to commit sales and trading resources to these companies with the belief that institutional investors require and value such specialized knowledge and service.
Our sales and trading personnel are central to our ability to market securities offerings and provide after-market support. Our capital markets group manages the syndication, marketing, execution and distribution of the securities offerings we manage. Our syndicate activities include coordinating the marketing and order-taking process for underwritten transactions and conducting after-market stabilization and initial market-making. Our syndicate staff is also responsible for developing and maintaining relationships with the syndicate departments of other investment banks.
Equity Research
Our research department is charged with developing proprietary investment themes, anticipating secular and cyclical changes, and producing action-oriented reports that will assist our institutional brokerage clients with their investment decisions. Our analysts cultivate primary sources of information in order to refine their quantitative and qualitative assessments. Our objective is to provide institutional investors with a clear understanding of industry-specific and company-specific issues that can impact their portfolio returns.
Our equity research encompasses three industries—technology, healthcare, and financial services and real estate—and is concentrated on the following sectors within each industry:
|
Technology
• Cybersecurity
• Digital Media
• Energy Technology & Services
• Industrial Technology
• Internet
• IT Infrastructure
• Software |
Healthcare
• Biopharmaceuticals
• Biotechnology
• Medical Devices & Supplies |
Financial Services & Real Estate
• Alternative Asset Managers
• Commercial Finance
• Consumer Finance
• Financial Technology
• Housing
• Insurance
• Investment Banks & Brokers
• Land Development
• Mortgage Finance
• Real Estate Investment Trusts (REITs)
• Real Estate Services & Technology
|
|
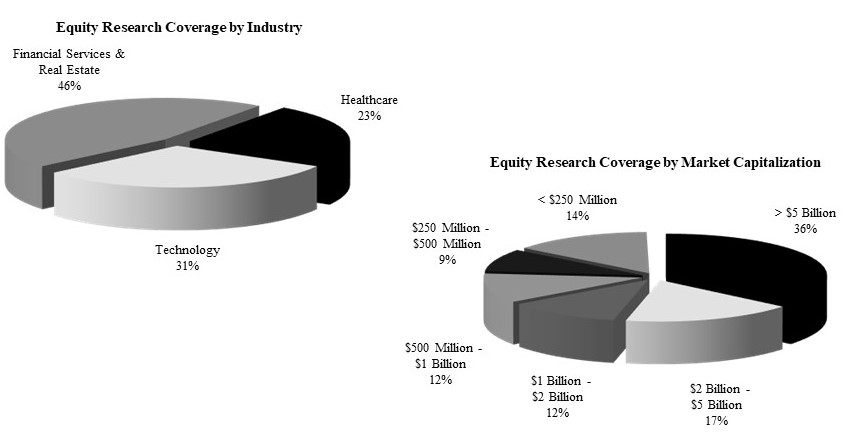
As of December 31, 2020, our research department included 20 publishing research analysts providing investment recommendations on 364 public companies divided among our three target sectors. Approximately 35% of the stocks under coverage had market capitalizations of less than $1.0 billion.
Through HCS, JMPAM and HCAP Advisors, we actively manage venture capital funds, private equity funds, a private debt fund, real estate funds, and a publicly-traded BDC that provides customized financing solutions to small and midsize companies.
As of December 31, 2020, we had a total of $5.6 billion in assets under management including $4.9 billion in assets under management of “sponsored” funds. Sponsored funds are asset management strategies in which JMP Group owns an economic interest and includes assets managed by Medalist Partners Corporate Finance, the former JMP Credit Advisors.
On March 20, 2019, we announced the sale of a majority interest in our corporate credit business, JMP Credit Advisors LLC (“JMPCA”), a platform established to underwrite and manage investments in senior secured debt, to Medalist Partners LP and to certain employees of JMPCA, leaving us with a minority interest of 45.0% in the since renamed Medalist Partners Corporate Finance LLC. Medalist Partners Corporate Finance currently manages three CLOs—JMP Credit Advisors CLO III(R) Ltd. (“CLO III”), JMP Credit Advisors CLO IV Ltd. (“CLO IV”), JMP Credit Advisors CLO V Ltd. (“CLO V”)—in which we have a remaining aggregate equity interest of $48 million as of December 31, 2020.
In the course of advising corporate clients on strategic or private capital raising transactions, our investment bankers may identify instances in which we could commit our own capital to transactions for which we are acting as an agent. In addition, other opportunities to invest equity and debt capital are frequently brought to the attention of our asset management professionals. As a result, in certain cases in the past we have made principal investments, and in some of those cases we have earned attractive returns on the capital we have committed. We expect that we will continue to make such investments in the future and believe that we may continue to earn attractive returns in some instances.
The objective of our multiple investment strategies is to diversify both revenue and risk while maintaining the attractive economics of the alternative asset management model. We view asset management as an attractive business due to its high margins and the recurring nature of its fee-based revenues, as well as its dependence on intellectual capital, which we believe is less susceptible to competitive threats from larger financial institutions.
Competition
All areas of our business are subject to a high level of competition. The principal competitive factors influencing our business include the capabilities of our professionals, our industry focus and expertise, our client relationships, our professional reputation, our product and service offerings, and the quality and price of our products and services.
Since the mid-1990s, there has been substantial consolidation among U.S. and global financial institutions. In particular, a number of large commercial banks, insurance companies and other diversified financial services firms have merged with other financial institutions or have established or acquired broker-dealers. During 2008, the failure or near-collapse of a number of very large financial institutions led to the acquisition of several of the most sizeable U.S. investment banking firms, consolidating the financial services industry to an even greater extent. Currently, our competitors are other investment banks, bank holding companies, securities brokerage firms, merchant banks and financial advisory firms. In addition, our focus on three specific industries subjects us to direct competition from a number of institutional brokerage firms and investment banking boutiques that also specialize in providing services to these industries and their investors.
The trend toward consolidation within the financial services sector has significantly increased the capital base and geographic reach of many of our competitors. Our larger and better-capitalized competitors may be more able than we are to respond to changes in the investment banking industry, to recruit and retain skilled professionals, to finance acquisitions, to fund internal growth and to compete for market share generally. Many of these firms have the ability to offer a wider range of products than we do, including lending, deposit-taking and insurance, all of which may enhance their competitive position relative to us. These firms also have the ability to support investment banking and capital markets products with commercial banking, insurance and other financial products in an effort to gain market share. This approach could result in downward pricing pressure across some or all of our businesses, as our competitors may be able to withstand losses in the areas in which we compete due to offsetting revenues and profits derived from other, complementary services that we do not offer. In particular, the trend in the equity underwriting business toward multiple bookrunners and co-managers, with bookrunners earning a disproportionately large portion of underwriting fees, has increased competition in the investment banking industry, while placing downward pressure on average transaction fees.
In our asset management business, we face competition in the pursuit of investors for our investment funds; in the identification of attractive investment opportunities and the completion of investments in portfolio companies, securities or real estate assets; and in the recruitment and retention of skilled asset management professionals.
Employees
As of December 31, 2020, we had 180 full time employees, including 68 managing directors. We believe that our managing directors and other professionals are attracted to our firm because of our reputation, our entrepreneurial culture, and our dedication to providing growth companies and growth investors with exceptional client service, objective advice and innovative solutions. None of our employees are subject to any collective bargaining agreements, and we believe our relationship with our employees to be satisfactory.
Risk Management and Compliance
Because we operate an investment bank and several different asset management platforms, risk is an inherent part of our business. Global markets, by their nature, are prone to uncertainty and subject participants to a variety of risks. The principal risks we face are market, liquidity, credit, operational, legal and reputational risks. We believe that we exercise sound practical judgment and undertake rigorous quantitative analysis before engaging in transactions to ensure that appropriate risk mitigators are in place. We mitigate risk by carefully considering the amount of capital allocated to each of our businesses, establishing trading limits, setting credit limits for individual counterparties and, to the extent that we make principal investments, committing capital to transactions in instances when we believe we have the advantage of industry- or company-specific expertise. Our focus is always on balancing risk and return, in that we attempt to achieve returns from each of our businesses that are commensurate with the risks we assume. Our participation in any underwritten securities offering is submitted for approval to a committee consisting of capital markets, investment banking, compliance and legal professionals. As part of our corporate credit and principal investment activities, we conduct due diligence before making any significant capital commitment, and all significant investments must be approved by our executive committee and/or board of directors. Nonetheless, the effectiveness of our approach to managing risks can never be completely assured. For example, unexpected large or rapid movements or disruptions in one or more markets or other unforeseen developments could have an adverse effect on our results of operations and financial condition. The consequences of these developments can include losses due to adverse changes in our principal investments and marketable security values, decreases in the liquidity of trading positions, increases in our credit exposure to customers and counterparties, and increases in general systemic risk.
Regulation
As a participant in the financial services industry, we are subject to complex and extensive regulation of most aspects of our business by U.S. federal and state regulatory agencies, self-regulatory organizations and securities exchanges. The laws, rules and regulations comprising the regulatory framework are constantly changing, as are the interpretation and enforcement of existing laws, rules and regulations. The effect of any such changes cannot be predicted and may impact our operations and affect our profitability.
Our broker-dealer subsidiary, JMP Securities, is subject to regulations governing every aspect of the securities business, including the execution of securities transactions; capital requirements; record-keeping and reporting procedures; relationships with customers, including the handling of cash and margin accounts; the experience of and training requirements for certain employees; and business interactions with firms that are not members of regulatory bodies.
JMP Securities is registered as a securities broker-dealer with the SEC and is a member of FINRA. FINRA is a self-regulatory body composed of members such as our broker-dealer subsidiary that have agreed to abide by the rules and regulations of FINRA. FINRA may expel, fine and otherwise discipline member firms and their employees. JMP Securities is also licensed as a broker-dealer in each of the 50 states in the U.S., requiring us to comply with the laws, rules and regulations of each state. Each state may revoke the license to conduct securities business, fine, and otherwise discipline broker-dealers and their employees.
JMP Securities is subject to the SEC’s Uniform Net Capital Rule, Rule 15c3-1, which may limit our ability to make withdrawals of capital from our broker-dealer subsidiary. The Uniform Net Capital Rule sets the minimum level of net capital a broker-dealer must maintain and also requires that a portion of a broker-dealer's assets be relatively liquid. In addition, JMP Securities is subject to certain notification requirements related to withdrawals of excess net capital.
We are also subject to the USA PATRIOT Act of 2001 (the “Patriot Act”), which imposes obligations regarding the prevention and detection of money-laundering activities, including the establishment of customer due diligence, customer verification and other compliance policies and procedures. The conduct of research analysts is also the subject of rule-making by the SEC, FINRA and the federal government through the Sarbanes-Oxley Act. These regulations require certain disclosures by, and restrict the activities of, research analysts and broker-dealers, among others. Failure to comply with these requirements may result in monetary, regulatory and, in the case of the USA Patriot Act, criminal penalties.
Our asset management subsidiaries, HCS, JMPAM, and HCAP Advisors, are SEC-registered investment advisers, or in the case of JMPAM, a relying advisor, and are accordingly subject to regulation by the SEC. Requirements under the Investment Advisors Act of 1940 include record-keeping, advertising and operating requirements, as well as prohibitions on fraudulent activities.
Various regulators, including the SEC, FINRA and state securities regulators and attorneys general, conduct both targeted and industry-wide investigations of certain practices relating to the financial services industry, including sales and marketing practices, valuation practices, and compensation arrangements. These investigations have involved mutual fund companies, broker-dealers, hedge funds, investors and others.
In addition, the SEC staff has conducted studies with respect to soft dollar practices in the brokerage and asset management industries and proposed interpretive guidance regarding the scope of permitted brokerage and research services in connection with soft dollar practices.
Accounting, Administration and Operations
Our accounting, administrative and operations personnel are responsible for financial controls, internal and external financial reporting, compliance with regulatory and legal requirements, office and personnel services, management information and telecommunications systems, and the processing of our securities transactions. We use a third-party service provider for payroll processing and our clearing operations are currently performed by National Financial Services LLC and Mirae Asset Securities (USA) Inc. All of our data processing functions are performed by our management information systems personnel.
Available Information
We are required to file current, annual and quarterly reports, proxy statements and other information required by the Exchange Act with the SEC. The SEC maintains an internet website at http://www.sec.gov from which interested persons can electronically access our SEC filings.
We provide our annual reports on Form 10-K; quarterly reports on Form 10-Q; current reports on Form 8-K; proxy statements; Forms 3, 4 and 5 filed by or on behalf of directors, executive officers and certain large shareholders; and any amendments to those documents filed or furnished pursuant to the Exchange Act free of charge in the Investor Relations section of our website, at http://www.jmpg.com. These filings will become available as soon as reasonably practicable after such material is electronically filed with, or furnished to, the SEC. From time to time we may use our website as a channel of distribution of material company information.
We also make available in the Investor Relations section of our website and will provide print copies to shareholders upon request (i) our corporate governance guidelines, (ii) our code of business conduct and ethics, and (iii) the charters of the audit, compensation, and corporate governance and nominating committees of our board of directors. These documents, as well as the information on our website, are not intended to be part of this Form 10-K, and inclusions of our internet address in this Form 10-K are inactive textual references only.
|
Risk Factors |
Risks Related to Our Business
Our operations and financial results are subject to various risks and uncertainties, including those described below, which could adversely affect our business, financial condition, results of operations, cash flows, and the trading price of our shares.
We focus principally on specific sectors of the economy, and deterioration in the business environment in these sectors or a decline in the market for securities of companies within these sectors could harm our business.
We focus our business activities principally in three target industries: technology, healthcare, financial services and real estate. Volatility in the business environment in these industries or in the market for securities of companies within these industries could adversely affect our financial results and the market value of our shares. The business environment for companies in some of these industries has been subject to high levels of volatility in recent years, and our financial results have consequently been subject to significant variations from year to year. The mix of our investment banking revenues has shifted over time. In 2007, the year of our initial public offering, the financial services and real estate sectors, together, represented 48% of our total investment banking revenues; in 2020, these two sectors represented 20% of such revenues. While the healthcare sector constituted 23% of our total investment banking revenues in 2007, the sector constituted 45% of such revenues in 2020.
The market for securities in each of our target industries may also be subject to industry-specific risks. For example, we have research, investment banking and principal investments focused in the areas of financial services and real estate. These industries have been negatively impacted at times by disruption in the financial markets, the COVID-19 pandemic and the broader economy, leading to severe downturns in real estate values, upheaval in the mortgage, credit and equity markets, and the distress or failure of both major and minor financial institutions. Volatility or prolonged dislocation in one or more of the industries on which we focus our efforts could impair our ability to conduct business and generate revenues in those sectors. Underwriting and other corporate finance activities, strategic advisory engagements, and sales and trading activities in our target industries represent a significant portion of our business. This concentration exposes us to the risk of a decline in revenue in the event of a downturn in any one of our three target industries, should our corporate clients in these industries or our institutional clients focused on these industries become unable or unwilling to continue to engage us for our services.
As an investment bank with an emphasis on certain growth sectors of the economy, we depend significantly on private company transactions for sources of revenue and potential business opportunities. Most of these private company clients are initially funded and controlled by venture capital funds and private equity firms. To the extent that the pace of these private company transactions slows or the average transaction size declines due to a decrease in venture capital and private equity financings, difficult market conditions in our target industries or other factors, our business and results of operations may be harmed.
Our ability to retain our senior professionals and recruit additional professionals is critical to the success of our business, and our failure to do so may adversely affect our reputation, business, results of operations and financial condition.
Our people are our most valuable resource. Our ability to generate and successfully execute the transactions that account for a significant portion of our revenues depends upon the reputation, judgment, business generation capabilities and project execution skills of our senior professionals, particularly our managing directors and the members of our executive committee. The reputations and relationships of our senior professionals with our clients are a critical element in obtaining and executing client engagements. Turnover in the investment banking industry is high, and we encounter intense competition for qualified employees from other companies in the investment banking industry, as well as from businesses outside the investment banking industry, such as hedge funds and private equity funds.
To the extent we continue to have annual compensation and benefits expense targets, we may not be able to retain our professionals or recruit additional professionals at compensation levels that are within our target range for compensation and benefits expense. If we were to lose the services of any of our investment bankers, senior equity research, sales and trading professionals, senior investment management personnel or executive officers to a new or existing competitor or otherwise, we may not be able to retain valuable relationships, and some of our clients could choose to use the services of a competitor instead of our services. If we are unable to retain our senior professionals or recruit additional professionals, our reputation, business, results of operations and financial condition will be adversely affected. Further, new business initiatives and efforts to expand existing businesses generally require that we incur compensation and benefits expense before generating additional revenues.
Our growth strategy relies on our ability to attract and retain productive senior professionals across all of our businesses. Due to the relatively early stage of development of many of our businesses and competition from other firms, we may face difficulties in recruiting and retaining professionals of a caliber consistent with our business strategy. In particular, many of our competitors are significantly larger, with greater financial resources, and may be able to offer more attractive compensation packages and broader career opportunities. Additionally, it may take more than one year for us to determine whether new professionals will be effective and will generate revenues, during which time we may incur significant expenses and expend significant time and resources on training, integration and business development.
Certain aspects of our cost structure are largely fixed, and we may incur costs associated with new or expanded lines of business prior to these lines of business generating significant revenue. If our revenue declines or fails to increase commensurately with the expenses associated with new or expanded lines of business, our profitability may be materially adversely affected.
We may incur costs associated with new or expanded lines of business, including guaranteed or fixed compensation costs, prior to generating significant revenue from these lines of business. In addition, certain aspects of our cost structure, such as costs for occupancy, communication and information technology services, and depreciation and amortization are largely fixed, and we may not be able to adjust these costs quickly enough to match fluctuations in revenue. If our revenue declines, or fails to increase commensurately with the expenses associated with new or expanded lines of business, our profitability may be materially adversely affected.
We face strong competition from larger firms, some of which have greater resources and name recognition than we do, which may impede our ability to grow our business.
The investment banking industry is intensely competitive, and we expect it to remain so. We compete on the basis of a number of factors, including client relationships, reputation, the abilities of our professionals, transaction execution, innovation, market focus and the relative quality and price of our services and products. We have experienced intense price competition in our various businesses. Pricing and other competitive pressures in investment banking, including the trends toward multiple book runners, co-managers and financial advisors handling transactions, could adversely affect our revenues, even if the size and number of our investment banking transactions increases.
Our investment bank subsidiary had 180 employees as of December 31, 2020. Many of our competitors have a broader range of products and services, greater financial and marketing resources, larger customer bases, greater name recognition, more senior professionals to serve their clients’ needs, greater global reach and more established relationships with clients than we have. These larger and better-capitalized competitors may be more able to respond to changes in the investment banking industry, compete for skilled professionals, finance acquisitions, fund internal growth and compete for market share generally. These firms have the ability to support investment banking with commercial banking, insurance and other financial services in an effort to gain market share, which has resulted, and could further result, in pricing pressure in our businesses. In particular, the ability to provide commercial financing has become an important advantage for some of our larger competitors; and, because we do not provide such financing, we may be unable to compete as effectively for clients in a significant part of the investment banking industry. In addition, if the number of capital markets and financial advisory transactions were to decline, larger investment banking firms could seek to enter into engagements with smaller companies and to execute transactions that traditionally would have been considered too small for these firms.
If we are unable to compete effectively with our competitors, our business, results of operations and financial condition will be adversely affected.
We face strong competition from middle-market investment banks.
We compete with specialized investment banks to provide access to capital and strategic advice to small and middle-market companies in our target industries. We compete with those investment banks on the basis of a number of factors, including client relationships, reputation, the abilities of our professionals, transaction execution, innovation, market focus and the relative quality and price of our services and products. We have experienced intense competition from similarly-sized firms over obtaining advisory mandates in recent years, and we may experience pricing pressures in our investment banking business in the future as some of our competitors seek to gain increased market share by reducing fees. Competition in the middle market may further intensify if larger Wall Street investment banks expand their focus farther into this sector of the market. Increased competition could reduce our market share and our ability to generate investment banking fees.
We also face increased competition due to a trend in recent years toward consolidation among companies in the financial services industry. This trend was amplified by the disruption and volatility in the financial markets in 2015 and 2016 and, before that, to a much greater degree in 2008 and 2009. As a result, a number of financial services companies have merged, been acquired or have fundamentally changed their business models. Many of these firms may have the ability to support investment banking, including financial advisory, with commercial banking, insurance and other financial services in an effort to gain market share, which could result in pricing pressure in our businesses.
Our share price has been volatile, and it may continue to be volatile in the future.
The market price of our shares could be subject to significant fluctuations due to factors such as:
|
• |
changes in book value due to principal investment valuations; |
|
• |
actual or anticipated fluctuations in our financial condition or results of operations; |
|
• |
failure to meet the expectations of securities analysts; |
|
• |
a decline in the stock prices of peer companies; |
|
• |
a discount in the trading multiple of our shares relative to that of shares of certain of our peer companies, due to perceived risks associated with our smaller size; |
|
• |
the success or failure of potential acquisitions, our operating strategies and our perceived prospects and those of the financial services industry in general; |
|
• |
changes in our distribution policy; |
|
• |
sales of substantial numbers of our shares by our employees or other shareholders, or the possibility of such sales; and |
|
• |
the realization of any of the other risks described in this section. |
Our financial results from investment banking activities may fluctuate substantially from period to period, which may impair our share price.
We have experienced, and expect to experience in the future, significant variations from period to period in our revenues and results of operations from investment banking activities. Future variations in investment banking revenues may be attributable in part to the fact that our investment banking revenues are typically earned upon the successful completion of a transaction, the timing of which is uncertain and beyond our control. In most cases, we receive little or no payment for investment banking engagements that do not result in the successful completion of a transaction. As a result, our business is highly dependent on market conditions as well as the decisions and actions of our clients and interested third parties. For example, a client’s acquisition transaction may be delayed or terminated because of a failure to agree upon final terms with the counterparty, failure to obtain necessary regulatory consents or board or shareholder approvals, failure to secure necessary financing, adverse market conditions or unexpected financial or other problems in the business of a client or a counterparty. If the parties fail to complete a transaction on which we are advising or an offering in which we are participating, we will earn little or no revenue from the contemplated transaction. In addition, we incur significant expenses related to a contemplated transaction, regardless of whether or not the contemplated transaction generates revenue. This risk may be intensified by our focus on growth companies in the technology, healthcare, financial services and real estate industries, as the market for securities of these companies has experienced significant variations in the number and size of equity offerings. In addition, our investment banking revenues are highly dependent on the level of merger and acquisition and capital raising activity in the U.S., which fluctuates substantially from period to period. Our investment banking revenues would be adversely affected in the event that the number and size of mergers and acquisitions and capital raising transactions in our sectors of focus decline. As a result, we may not achieve steady and predictable earnings on a quarterly basis, which could in turn adversely affect our share price.
Further, because a significant portion of our revenue is derived from investment banking fees and brokerage commissions, severe market fluctuations, weak economic conditions, or a decline in stock prices, trading volumes or liquidity could cause our financial results to fluctuate from period to period as a result of the following, among other things:
|
• |
the number and size of transactions for which we provide underwriting and merger and acquisition advisory services may decline; |
|
• |
the value of the securities we hold in inventory as assets, which we often purchase in connection with market-making and underwriting activities, may decline; and |
|
• |
the volume of trades we execute for our clients may decrease. |
To the extent our clients, or counterparties in transactions with us, are more likely to suffer financial setbacks in a volatile stock market environment, our risk of loss during these periods would increase.
Our corporate finance and strategic advisory engagements are singular in nature and do not generally provide for subsequent engagements.
Our investment banking clients generally retain us on a short-term, engagement-by-engagement basis in connection with specific corporate finance activities, merger and acquisition transactions (often as an advisor in the sale of a company) or other strategic advisory services, rather than on a recurring basis under long-term contracts. As these transactions are typically singular in nature and our engagements with these clients may not recur, we must seek new engagements when our existing engagements are successfully completed or terminated. As a result, high activity levels in any period are not necessarily indicative of continued high activity levels in any subsequent period. If we are unable to generate a substantial number of new engagements that generate fees from new or existing clients, our business, results of operations and financial condition could be adversely affected.
We are a “smaller reporting company,” and we cannot be certain if the reduced disclosure requirements applicable to smaller reporting companies will make our common stock less attractive to investors.
We are a “smaller reporting company,” as defined in Rule 12b-2 of the Exchange Act. As a smaller reporting company, we are planning to rely on an exemptions from certain disclosure requirements that are applicable to other public companies that are not smaller reporting companies. These exemptions include reduced financial disclosure and reduced disclosure obligations regarding executive compensation in our periodic reports and proxy statements. We may continue to rely on such exemptions for so long as we remain a smaller reporting company under applicable SEC rules and regulations. Accordingly, we cannot predict if investors will find our common stock less attractive because we rely on these exemptions. If some investors find our common stock less attractive as a result of our reduced disclosures, there may be less active trading in our common stock and our stock price may be more volatile.
Pricing and other competitive pressures may impair the revenues of our sales and trading business.
We derive a significant portion of our revenues from our sales and trading business, which accounted for 16% and 17% of our net revenues for the years ended December 31, 2020 and 2019, respectively. Along with other investment banking firms, we have experienced intense price competition and trading volume reduction in this business in recent years. In particular, the ability to execute trades electronically and through alternative trading systems has increased the downward pressure on trading commissions and spreads. We expect these trends toward alternative trading systems and downward pricing pressure in the business to continue. We believe we may experience competitive pressures in these and other areas in the future, as some of our competitors seek to obtain market share by competing on the basis of price or by using their own capital to facilitate client trading activities. In addition, we face pressure from our larger competitors, which may be better able to offer a broader range of complementary products and services to clients in order to win their trading business. Since we are committed to maintaining and improving our comprehensive research coverage in our target sectors to support our sales and trading business, we may be required to make substantial investments in our research capabilities to remain competitive. If we are unable to compete effectively in these areas, the revenues of our sales and trading business may decline, and our business, results of operations and financial condition may be harmed.
Some of our large institutional sales and trading clients as measured by brokerage revenues have entered into arrangements with us and with other investment banks, under which they separate payments for research products or services from trading commissions for sales and trading services and pay for research directly in cash, instead of compensating the research providers through trading commissions (referred to as “soft dollar” practices). In addition, we have entered into certain commission sharing arrangements in which institutional clients execute trades with a limited number of brokers and instruct those brokers to allocate a portion of their commissions directly to us, to another broker-dealer or to an independent research provider. If more such arrangements are reached between our clients and us, or if similar practices are adopted by more firms in the investment banking industry, it may further increase the competitive pressures on trading commissions and spreads and reduce the value our clients place on high-quality research. Conversely, if we are unable to make similar arrangements with other investment managers that insist on separating trading commissions from research products, volumes and trading commissions in our sales and trading business also would likely decrease.
Larger and more frequent capital commitments in our trading and underwriting businesses increase the potential for significant losses.
There is a trend toward larger and more frequent commitments of capital by financial services firms in many of their activities. For example, in order to win business, investment banks are increasingly committing to purchase large blocks of stock from publicly traded issuers or significant stockholders, instead of undertaking the more traditional underwriting process in which marketing is typically completed before an investment bank commits to purchase securities for resale. We may participate in this trend and, as a result, we may be subject to increased risk. Conversely, if we do not have sufficient regulatory capital to do so, our business may suffer. Furthermore, we may suffer losses as a result of the positions taken in these transactions, even when economic and market conditions are generally favorable for others in the industry.
We may increasingly commit our own capital as part of our trading business to facilitate client sales and trading activities. The number and size of these transactions may adversely affect our results of operations in a given period. We may also incur significant losses from our sales and trading activities due to market fluctuations and volatility in our results of operations. To the extent that we own assets (i.e., have long positions) in any of those markets, a downturn in the value of those assets or in those markets could result in losses. Conversely, to the extent that we have sold assets we do not own (i.e., have short positions) in any of those markets, an upturn in those markets could expose us to potentially large losses as we attempt to cover our short positions by acquiring assets in a rising market.
The asset management business is intensely competitive.
Over the past several years, the size and number of asset management funds, including hedge funds and private equity funds, has continued to increase. If this trend continues, it is possible that it will become increasingly difficult for our funds to raise capital. More significantly, as institutional and individual investors allocate increasing amounts of capital to alternative investment strategies, the size and duration of pricing inefficiencies is reduced. Many alternative investment strategies seek to exploit these inefficiencies, and in certain industries this trend drives prices for investments higher. Both of these situations can increase the difficulty of achieving targeted returns. In addition, if interest rates were to rise or there were to be a prolonged bull market in equities, the attractiveness of our funds relative to other investment products could decrease. Competition is based on a variety of factors, including:
|
• |
investment performance; |
|
• |
investor perception of the drive, focus and alignment of interest of an investment manager; |
|
• |
quality of service provided to, and duration of relationship with, investors; |
|
• |
business reputation; and |
|
• |
level of fees and expenses charged for services. |
We compete in the asset management business with a large number of investment management firms, private equity fund sponsors, hedge fund sponsors and other financial institutions. A number of factors serve to increase our competitive risks, as follows:
|
• |
Investors may develop concerns that we will allow a fund to grow to the detriment of its performance. |
|
• |
Some of our competitors have greater capital, lower targeted returns or greater sector or investment strategy-specific expertise than we do, which creates competitive disadvantages with respect to investment opportunities. |
|
• |
Some of our competitors may perceive risk differently than we do, which could allow those competitors either to outbid us for investments in particular sectors or to consider a wider variety of investments. |
|
• |
There are relatively few barriers to entry impeding new asset management firms, and the successful efforts of new entrants into our various lines of business, including former “star” portfolio managers at large diversified financial institutions as well as such institutions themselves, will continue to result in increased competition. |
|
• |
Other industry participants in the asset management business continuously seek to recruit our best and brightest investment professionals away from us. |
These and other factors could reduce our earnings and revenues and adversely affect our business. In addition, if we are forced to compete with other alternative asset managers on the basis of price, we may not be able to maintain our current base management and incentive fee structures. We have historically competed primarily on the performance of our funds, and not on the level of our fees relative to those of our competitors. However, there is a risk that fees in the alternative investment management industry will decline, without regard to the historical performance of a manager, including our managers. Fee reductions on our existing or future funds, without corresponding decreases in our cost structure, would adversely affect our revenues and distributable earnings.
Poor investment performance may decrease assets under management and reduce revenues from, and the profitability of, our asset management business.
Revenues from our asset management business are primarily derived from asset management fees. Asset management fees are comprised of base management and incentive fees. Management fees are typically based on assets under management, and incentive fees are earned on a quarterly or annual basis only if the return on our managed accounts exceeds a certain threshold return, or “high-water mark,” for each investor. We will not earn incentive fee income during a particular period, even when a fund had positive returns in that period, if we do not generate cumulative performance that surpasses a “high-water mark.” If a fund experiences losses, we will not earn incentive fees with regard to investors in that fund until its returns exceed the relevant “high-water mark.”
Our asset management fees may also decline over time due to factors such as increased competition and the renegotiation of contracts. In addition, investment performance is one of the most important factors in retaining existing investors and competing for new asset management business. Investment performance may be poor as a result of current or future difficult market or economic conditions, including changes in interest rates or inflation, terrorism or political uncertainty, our investment style, the particular investments that we make, and other factors. Poor investment performance may result in a decline in our revenues and income by causing (i) the net asset value of the assets under our management to decrease, which would result in lower management fees to us, (ii) lower investment returns, resulting in a reduction of incentive fee income to us, and (iii) investor redemptions, which would result in lower fees to us, because we would have fewer assets under management.
To the extent that our future investment performance is perceived to be poor in either relative or absolute terms, the revenues and profitability of our asset management business will likely be reduced, and our ability to grow existing funds and raise new funds in the future will likely be impaired. In addition, the market environment in recent years has resulted in a shift to passive investment products, which generate lower fees than actively managed products. A continued trend toward passive investments or changes in market values or in the fee structure of asset management accounts would affect our revenues, business, and financial condition.
The historical returns of our funds may not be indicative of the future results of our funds.
The historical returns of our funds should not be considered indicative of the future results that should be expected from such funds or from any future funds we may raise. Our rates of return reflect unrealized gains, as of the applicable measurement date, which may never be realized due to changes in market and other conditions not in our control that may adversely affect the ultimate valuation of the investments in a fund. The returns of our funds may have also benefited from investment opportunities and general market conditions that may not repeat themselves, and there can be no assurance that our current or future funds will be able to avail themselves of profitable investment opportunities. Furthermore, the historical and potential future returns of the funds we manage also may not necessarily bear any relationship to potential returns on our shares.
There is increasing regulatory supervision of alternative asset management companies, which may increase the risk of financial liability and reputational harm resulting from adverse regulatory actions.
As noted above, in the past several years, the financial services industry has been the subject of heightened scrutiny by regulators around the globe. The industry has experienced an extended period of significant change in laws and regulations governing the financial services industry, as well as increased scrutiny from various regulators, including the SEC, the Federal Reserve, the OCC, and the CFPB, in addition to stock exchanges, FINRA, and state attorneys general. For example, the Dodd-Frank Act resulted in sweeping changes to the regulatory regime, including a significant increase in the supervision and regulation of the financial services industry. Penalties and fines imposed by regulatory authorities have increased substantially in recent years. We may be adversely affected by changes in the interpretation or enforcement of existing laws, rules, and regulations.
Furthermore, the SEC and its staff have focused more narrowly on issues relevant to alternative asset management firms, forming specialized units devoted to examining such firms and, in certain cases, bringing enforcement actions against the firms, their principals and employees. In the last few years, there were a number of enforcement actions within the industry. However, it is unclear whether the SEC and its staff will maintain the same level of enforcement if, in the future, there is an effort on the part of the federal government to ease restrictions on business conduct, which could result in significant changes in, and uncertainty with respect to, legislation, regulation and government policy. Existing and new laws and regulations could affect our revenue, limit our ability to pursue business opportunities, impact the value of our assets, require us to alter at least some of our business practices, impose additional compliance costs, and otherwise adversely affect our businesses.
Broker-dealers and investment advisers are subject to regulations covering all aspects of the securities business, including, but not limited to: sales and trading methods; trade practices among broker-dealers; use and safekeeping of clients’ funds and securities; capital structure of securities firms; anti-money laundering efforts; recordkeeping; and the conduct of directors, officers and employees. Any violation of these laws or regulations could subject us to the following events, any of which could have a material adverse effect on our business, financial condition and prospects: civil and criminal liability; sanctions, which could include the revocation of our subsidiaries’ registrations as investment advisers or broker-dealers; the revocation of the licenses of our financial advisors; censures; fines; or a temporary suspension or permanent bar from conducting business.
Regulatory actions brought against us may result in judgments, settlements, fines, penalties or other results, any of which could have a material adverse effect on our business, financial condition or results of operations. There is no assurance that regulators will be satisfied with the policies and procedures implemented by our company and its subsidiaries. In addition, from time to time, we and our affiliates may become subject to additional findings with respect to supervisory, compliance or other regulatory deficiencies, which could subject us to additional liability, including penalties, and restrictions on our business activities. Among other things, these restrictions could limit our ability to make investments, complete acquisitions, expand into new business lines, pay dividends and/or engage in share repurchases. See Item 1, “Regulation,” of this report for additional information regarding our regulatory environment and Item 7, “Management’s Discussion and Analysis of Financial Condition and Results of Operations - Risk Management,” in this report regarding our approaches to managing regulatory risk.
Our asset management clients may redeem their investments, which could reduce our asset management fee revenues.
Certain asset management fund agreements permit investors to redeem their investments with us after an initial “lockup” period, during which redemptions are restricted or penalized. However, any such restrictions may be waived by us. Thereafter, redemptions are permitted at quarterly or annual intervals. If the return on the assets under our management does not meet investors’ expectations, investors may elect to redeem their investments and invest their assets elsewhere, including with our competitors. Our management fee revenues correlate directly with the amount of assets under our management; therefore, redemptions may cause our fee revenues to decrease. Investors may decide to reallocate their capital away from us and to other asset managers for a number of reasons, including poor relative investment performance, changes in prevailing interest rates that make other investments more attractive, changes in investor perception regarding our focus or alignment of interest, dissatisfaction with changes in or a broadening of a fund’s investment strategy, changes in our reputation, and departures or changes in responsibilities of key investment professionals. For these and other reasons, the pace of redemptions and corresponding reduction in our assets under management could accelerate. In the future, redemptions could require us to liquidate assets under unfavorable circumstances, which would further harm our reputation and results of operations.
We invest our own principal capital in equity securities and debt that expose us to a significant risk of capital loss.
We use, and to the limited extent permitted by applicable regulations, may continue to use a portion of our own capital in a variety of principal investment activities, each of which involves risks of illiquidity, loss of principal and revaluation of assets. The companies in which we invest may rely on new or developing technologies or novel business models, or concentrate on markets which are or may be disproportionately impacted by pressures in the financial services and/or real estate sectors that have not yet developed and that may never develop sufficiently to support successful operations, or their existing business operations may deteriorate or may not expand or perform as projected. We may be unable to realize our investment objectives if we cannot sell or otherwise dispose of our interests at attractive prices or complete a desirable exit strategy. In particular, these risks could arise from changes in the financial condition or prospects of the companies in which investments are made, changes in economic conditions or changes in laws, regulations, fiscal policies or political conditions. It could take a substantial period of time to identify attractive investment opportunities and then to realize the cash value of such investments. In addition, even if an investment proves to be profitable, it may be several years or longer before any profits can be realized in cash. As a result, we have suffered losses in the past, and we may suffer losses from our principal investment activities in the future.
We have made and may in the future make principal investments in relatively high-risk, illiquid assets that often have significantly leveraged capital structures, and we may fail to realize any profits from these activities for a considerable period of time or lose some or all of the principal amount we invest in these activities.
We may purchase equity securities and, to a lesser extent, debt securities in venture capital, seed and other high-risk financings of early-stage, pre-public companies, in “mezzanine stage” companies, and in turnaround and distressed situations, as well as in funds or other collective investment vehicles. We risk the loss of capital invested by us in these entities.
We may use our capital, including on a leveraged basis, in principal investments in both private and public company securities that may be illiquid and volatile. The equity securities of any privately held entity in which we make a principal investment are likely to be restricted as to resale and may otherwise be highly illiquid. In the case of fund or similar investments, our investments may be illiquid until such investment vehicles are liquidated. We expect that there will be restrictions on our ability to resell any such securities that we acquire for a period of at least six months after we acquire such securities. Thereafter, a public market sale may be subject to volume limitations or be dependent upon securing a registration statement for an initial, and potentially secondary, public offering of the securities. We may make principal investments that are significant relative to the overall capitalization of the investee company, and resale of significant amounts of these securities may be subject to significant limitations and adversely affect the market and the sales price for the securities in which we invest. In addition, our principal investments may involve entities or businesses with capital structures that have significant leverage. The large amount of borrowing in a leveraged capital structure increases the risk of losses, due to factors such as rising interest rates, downturns in the economy, or deteriorations in the condition of the investment or its industry. In the event of defaults under borrowings, the assets being financed would be at risk of foreclosure, and we could lose our entire investment.
Even if we make an appropriate investment decision based on the intrinsic value of an enterprise, we cannot assure you that general market conditions will not cause the market value of our investments to decline. For example, an increase in interest rates, a general decline in the stock markets, or other market and industry conditions adverse to companies of the type in which we invest and intend to invest could result in a decline in the value of our investments or a total loss of our investment.
In addition, some of these investments are, or may in the future be, in industries or sectors that are unstable, in distress or undergoing some uncertainty. Such investments may be subject to rapid changes in value caused by sudden company-specific or industry-wide developments. Contributing capital to these investments is risky, and we may lose some or all of the principal amount of our investments. There are no regularly quoted market prices for a number of the investments that we make. The value of our investments is determined using fair value methodologies described in valuation policies, which may consider, among other things, the nature of the investment, the expected cash flows from the investment, bid or ask prices provided by third parties for the investment, the trading price of recent sales of securities (in the case of publicly traded securities), restrictions on transfer, and other recognized valuation methodologies. The methodologies we use in valuing individual investments are based on estimates and assumptions specific to the particular investments. Therefore, the value of our investments does not necessarily reflect the prices that would actually be obtained by us when such investments are sold. Realizations at values significantly lower than the values at which investments have been previously held would result in loses of potential incentive income and principal investments.
We may experience write-downs of our investments and other losses related to the valuation of our investments in volatile and illiquid market conditions.
We have exposure to volatile or illiquid securities, including investments in companies that have and may hold mortgage-related products, such as residential and commercial mortgage-backed securities, mortgage loans, and other mortgage and real estate-related securities. We continue to have exposure to these markets and products and, as market conditions continue to evolve, the fair value of these mortgage-related instruments could deteriorate.
In addition, in our principal investment activities, our concentrated holdings, illiquidity and market volatility may make it difficult to value certain of our investment securities. Subsequent valuations, in light of factors then prevailing, may result in significant changes in the values of these securities in future periods. In addition, at the time of any sales and settlements of these securities, the price we ultimately realize will depend on the demand and liquidity in the market at that time and may be materially lower than their current fair value. Any of these factors could require us to take write-downs in the value of our investment and securities portfolio, which may have an adverse effect on our results of operations in future periods.
The effects of the outbreak of the novel coronavirus (“COVID-19”) have negatively affected the global economy, the United States economy and the global financial markets, and has and may continue to disrupt our operations and our clients’ operations, which could have an adverse effect on our business, financial condition and results of operations.
The ongoing COVID-19 global and national health emergency has caused significant disruption in the international and United States economies and financial markets. On March 11, 2020, the World Health Organization declared the COVID-19 outbreak a pandemic. The spread of COVID-19 has caused illness, quarantines, cancellation of events and travel, business and school shutdowns, reduction in business activity and financial transactions, labor shortages, supply chain interruptions and overall economic and financial market instability, and has and may continue to may affect our operations. The COVID-19 pandemic is evolving, and to date has led to the implementation of various responses, including government-imposed quarantines, travel restrictions and other public health safety measures. The continued impact of COVID-19 may result in a period of business disruption, including delays in our trading.
In addition, in response to the COVID-19 pandemic, and in accordance with direction from state and local government authorities, we have made temporary precautionary measures intended to help minimize the risk of the virus to our employees, including temporarily requiring most employees to work remotely (which in turn increases our threat to cyber security and data accessibility and communication matters) and suspending all non-essential travel worldwide for our employees. In addition, industry events and in-person work-related meetings have been cancelled, the continuation of which could negatively affect our business.
Many of the key service providers we rely on also have transitioned to working remotely. If we or they were to experience material disruptions in the ability for our or their employees to work remotely (e.g., disruption in Internet-based communications systems and networks; or the break-down in the availability of essential goods and services, such as material disruptions to the delivery of food or power), our ability to operate our business normally could be materially adversely disrupted. Similarly, to date our own employees and, we believe, the employees of our key service providers, have not experienced any material degree of illness due to the COVID-19 virus. In the event that our or their workforces, or key components thereof, were to experience significant illness levels, our ability to operate our business normally could be materially adversely disrupted. Any such material adverse disruptions to our business operations could have a material adverse impact on our results of operation or financial condition.
We are taking precautions to protect the safety and well-being of our employees and customers. However, no assurance can be given that the steps being taken will be deemed to be adequate or appropriate, nor can we predict the level of disruption which will occur to our employee’s ability to provide customer support and service. The ongoing COVID-19 pandemic has resulted in meaningfully lower stock prices for many companies, as well as the trading prices for our own securities. The further spread of the COVID-19 outbreak may materially disrupt banking and other financial activity generally and in the areas in which we operate. This would likely result in a decline in demand for our products and services, which would negatively impact our liquidity position and our growth strategy. Any one or more of these developments could have a material adverse effect on our and our consolidated subsidiaries’ business, operations, consolidated financial condition, and consolidated results of operations.
We are closely monitoring the global outbreak of COVID-19. At this time, we cannot predict the ultimate scope, severity or duration of the outbreak or its effects on, among other things, the global, national or local economy, the capital and credit markets, or our workforce, customers and third-party service providers. As a result, we cannot predict the full extent of the adverse financial impact that COVID-19 will have on our businesses, financial condition, liquidity and results of operations. If we or any of the third parties with whom we engage, however, were to experience shutdowns or other business disruptions, our ability to conduct our business in the manner and on the timelines presently planned could be materially and negatively affected, which could have a material adverse impact on our business and our results of operation and financial condition.
Difficult conditions in the global financial markets due to the COVID-19 pandemic and other domestic and international macroeconomic conditions have negatively impacted, and may continue to negatively impact, our ability to generate business and revenues, which may cause significant fluctuations in our share price.
All of our businesses have been in the past and may in the future be materially affected by conditions in the financial markets and general economic conditions, such as the level and volatility of interest rates, investor sentiment, the availability and the cost of credit, the U.S. mortgage market, the U.S. real estate market, volatile energy prices, consumer confidence, unemployment and geopolitical issues. While financial markets became more stable and generally improved since the extreme disruption from 2007 to 2009, there remains a certain degree of uncertainty about a sustained global economic recovery in light of increased volatility as a result of the COVID-19 pandemic and other domestic and international macroeconomic conditions. U.S. markets may be impacted by political and civil unrest occurring in the Middle East and in Eastern Europe and Russia. Concerns about the European Union (“EU”), including Brexit and its implementation's effects on the financial markets and the stability of the EU’s sovereign debt, may cause further uncertainty and disruption for financial markets globally. It is possible that other EU member states may experience financial troubles in the future, or may choose to follow Britain’s lead and leave the EU. Any negative impact on economic conditions and global markets from these developments could adversely affect our results of operations in future periods.
Weakness or disruption in equity markets and diminished trading volume of securities have adversely impacted our sales and trading business in the past and could continue to do so in the future. Industry-wide declines in the size and number of underwritings and mergers and acquisitions may also have an adverse effect on our revenues. Reductions in the trading prices for equity securities tend to reduce the transaction value of investment banking transactions, such as underwriting and merger and acquisition transactions, which in turn may reduce the fees we earn from these transactions. Market conditions may also affect the level and volatility of securities prices and the liquidity and value of investments in our funds and managed accounts, and we may not be able to manage our investment management business’ exposure to these market conditions. In addition to these factors, deterioration in the financial markets or economic conditions in the U.S. and globally could materially affect our business in other ways, including the following:
|
• |
Our opportunity to act as underwriter or placement agent could be adversely affected by a reduction in the number and size of capital raising transactions or by competing government sources of equity. |
|
• |
The number and size of merger and acquisition transactions or other strategic advisory engagements in which we act as adviser could be adversely affected by uncertainties in valuations related to asset quality and creditworthiness, volatility in the equity markets and diminished access to financing. |
|
• |
Market volatility could lead to a decline in the volume of transactions that we execute for our customers and, therefore, to a decline in the revenue we receive from commissions and spreads. |
|
• |
We may experience losses in securities trading activities, or write-downs in the value of securities that we own, as a result of deteriorations in the businesses or creditworthiness of the issuers of such securities. |
|
• |
We may experience losses or write-downs in the realizable value of our principal investments due to the inability of companies in which we invest to repay their borrowings. |
|
• |
Our access to liquidity and capital markets could be limited, preventing us from making principal investments and restricting our sales and trading businesses. |
|
• |
We may incur unexpected costs or losses as a result of the bankruptcy or other failure of companies for which we have performed investment banking services, and such companies may be unable to honor ongoing obligations such as indemnification or expense reimbursement agreements. |
We are exposed to interest rate risk which may harm our business
The revolving credit facility we have with City National Bank has a variable interest rate. Accordingly, if the interest rate increases, the interest payments on the borrowing on the facility, if any, will increase and could have an adverse impact on our results of operations.
We are exposed to credit risk which may harm our business
Our broker-dealer subsidiary places and executes customer orders. The orders are then settled by an unrelated clearing organization that maintains custody of customers’ securities and provides financing to customers.
Through indemnification provisions in our agreement with our clearing organization, customer activities may expose us to off-balance-sheet credit risk. We may be required to purchase or sell financial instruments at prevailing market prices in the event that a customer fails to settle a trade on its original terms or in the event that cash and securities in customer margin accounts are not sufficient to fully cover customer obligations. We seek to control the risks associated with brokerage services for our customers through customer screening and selection procedures as well as through requirements that customers maintain margin collateral in compliance with governmental and self-regulatory organization regulations and clearing organization policies.
Credit risk also includes the risk that we will not fully collect the principal we have invested in loans held for investment and loans collateralizing asset-backed securities issued due to borrower defaults which would diminish the return on equity of our CLO equity investments. While we feel that our origination and underwriting of these loans will help to mitigate the risk of significant borrower defaults on these loans, we cannot assure you that all borrowers will continue to satisfy their payment obligations under these loans, thereby avoiding default.
We are exposed to inflation risk which may harm our business
Because our assets are generally liquid in nature, they are not significantly affected by inflation. However, the rate of inflation affects such expenses as employee compensation and communications charges, which may not be readily recoverable in the prices of services we offer. To the extent inflation results in rising interest rates and has other adverse effects on the securities markets, it may adversely affect our combined financial condition and results of operations in certain businesses.
|
• |
Sudden sharp declines in market values of securities can result in illiquid markets and the failure of counterparties to perform their obligations, which could make it difficult for us to sell securities, hedge securities positions and invest assets under management. |
|
• |
As an introducing broker to a clearing firm, we are responsible to the clearing firm and could be held liable for the defaults of our customers, including losses incurred as the result of a customer’s failure to meet a margin call. Although we review credit exposure to specific customers, default risk may arise from events or circumstances that are difficult to detect or foresee. When we allow customers to purchase securities on margin, we are subject to risks inherent in extending credit. This risk increases when a market is rapidly declining and the value of the collateral held falls below the amount of a customer’s indebtedness. If a customer’s account is liquidated as the result of a margin call, we are liable to our clearing firm for any deficiency. |
|
• |
Competition in our investment banking and sales and trading businesses could intensify as a result of the increasing pressures on financial services companies and larger firms, which have led them to compete for transactions and business that historically would have been too small for them to consider. |
|
• |
Market volatility could result in lower prices for securities, which could result in reduced management fees calculated as a percentage of assets under management. |
|
• |
Market declines could increase claims and litigation, including arbitration claims from customers. |
|
• |
Our industry could face increased regulation as a result of legislative or regulatory initiatives. Compliance with such regulation may increase our costs and limit our ability to pursue business opportunities. |
|
• |
Government intervention may not succeed in improving the equity and credit markets and may have negative consequences for our business. |
It is difficult to predict how long current financial market and economic conditions will continue, whether they will deteriorate and, if they do, which of our business lines will be adversely affected. If one or more of the foregoing risks occurs, our revenues would likely decline; and, if we were then unable to reduce expenses at the same pace, our profit margins would erode.
Our businesses, profitability and liquidity may be adversely affected by deterioration in the credit quality of, or defaults by, third parties who owe us money, securities or other assets or whose securities or obligations we hold.
We are exposed to the risk that third parties that owe us money, securities or other assets will not perform their obligations. These parties may default on their obligations to us due to bankruptcy, lack of liquidity, operational failure or other reasons. Declines in the market value of securities can result in the failure of buyers and sellers of securities to fulfill their settlement obligations and in the failure of our clients to fulfill their credit obligations. During market downturns, counterparties to us in securities transactions may be less likely to complete transactions. In addition, particularly during market downturns, we may face additional expenses defending or pursuing claims or litigation related to counterparty or client defaults.
Our businesses may be adversely affected by the disruptions in the credit markets, including reduced access to credit and liquidity and higher costs of obtaining credit.
Generally we satisfy our need for funding from funds generated from operations, our revolving credit facility with City National Bank, and proceeds from issuance of Senior Notes. In the event that existing internal and external financial resources were not to satisfy our needs, we would have to seek additional outside financing. The availability of outside financing would depend on a variety of factors, such as our financial condition and results of operations, the availability of acceptable collateral, market conditions, the general availability of credit, the volume of trading activities, and the overall availability of credit to the financial services industry.
Widening credit spreads, as well as significant declines in the availability of credit, could adversely affect our ability to borrow on an unsecured basis. Disruptions in the credit markets could make it more difficult and more expensive to obtain funding for our businesses. If our available funding is limited or we are forced to fund our operations at a higher cost, these conditions may require us to curtail our business activities and increase our cost of funding, both of which could reduce our profitability, particularly in our businesses that involve investing and taking principal positions.
Liquidity, or ready access to funds, is essential to financial services firms, including ours. Failures of financial institutions have often been attributable in large part to insufficient liquidity. Liquidity is of particular importance to our sales and trading business, and perceived liquidity issues may affect the willingness of our clients and counterparties to engage in sales and trading transactions with us. Our liquidity could be impaired due to circumstances that we may be unable to control, such as a general market disruption or an operational problem that affects our sales and trading clients, third parties or us. Further, our ability to sell assets may be impaired if other market participants are seeking to sell similar assets at the same time.
Clients that engage us with respect to merger and acquisition transactions often rely on access to the secured and unsecured credit markets to finance their transactions. The lack of available credit and the increased cost of credit could adversely affect the size, volume and timing of our clients’ mergers and acquisitions, particularly in the case of large transactions, and adversely affect our investment banking business and revenues.
Increased leverage may harm our financial condition and results of operations
As of December 31, 2020, our total indebtedness was approximately $92.8 million, consisting of $50.0 million principal amount of 7.25% Senior Notes due 2027, $36.0 million in principal amount of 6.875% Senior Notes due 2029, $6.0 million under a credit agreement with City National Bank, and $0.8 million principal amount of a note payable due 2022 to an affiliate. Our level of indebtedness could have important consequences to you, because:
|
• |
it could affect our ability to satisfy our financial obligations, including those relating to the Senior Notes and outstanding borrowings under our credit facility; |
|
• |
a substantial portion of our cash flows from operations will have to be dedicated to interest and principal payments and may not be available for operations, working capital, capital expenditures, expansion, acquisitions or general corporate or other purposes; |
|
• |
it may impair our ability to obtain additional financing in the future; |
|
• |
it may limit our ability to refinance all or a portion of our indebtedness on or before maturity; |
|
• |
it may limit our flexibility in planning for, or reacting to, changes in our business and industry; and |
|
• |
it may make us more vulnerable to downturns in our business, our industry or the economy in general. |
Our operations may not generate sufficient cash to enable us to service our debt. If we fail to make a payment on the Senior Notes or fail to maintain a minimum level of liquidity, we could be in default on the Senior Notes, and this default could cause us to be in default on our other outstanding indebtedness. Conversely, a default on our other outstanding indebtedness may cause a default under the Senior Notes. In addition, we may incur additional indebtedness in the future; and, as a result, the related risks that we now face, including those described above, could intensify. A default, if not waived, could result in acceleration of the debt outstanding under the related agreement. If that should occur, we may not be able to pay all such debt or to borrow sufficient funds to refinance it. Even if new financing were then available, it may not be on terms that are acceptable to us. The indentures for the Senior Notes do not restrict our ability to incur additional indebtedness.
We may not receive any return on our investment in the CLOs or CLO warehouse in which we have invested.
As of December 31, 2020, we had $80.0 million par value invested in the subordinated securities issued by CLOs managed by MPCF. Subject to market conditions, we may continue to acquire subordinated securities of CLOs managed by MPCF (and/or third-party managers). These subordinated securities are the most junior class of securities issued by the CLOs and are subordinated in priority of payment to the senior securities issued by these CLOs. Therefore, they only receive cash distributions if the CLOs have made all cash interest payments to all other debt securities issued by the CLOs and are in compliance with their interest and over-collateralization coverage tests. Consequently, to the extent that the value of a CLO’s loan portfolio has been reduced as a result of conditions in the credit markets, such as defaulted loans or excess triple C-rated loans, the value of the subordinated securities could be reduced.
In addition, as of December 31, 2020, we had $4.0 million invested in a CLO warehouse managed by MPCF. The CLO warehouse enters into warehouse agreements with banks or other financial institutions to finance the purchase of investments that will be ultimately included in a CLO or other investment product. Such investments are primarily comprised of senior secured corporate loans rated below investment grade. Securities rated below investment grade are often referred to as “leveraged loans” or “high yield” securities, and may be considered “high risk” compared to debt instruments that are rated investment grade. If the relevant CLO transaction or other investment product is not consummated or issued, the investments may be liquidated, and we may lose some or all of our equity investment in the warehouse if the value of the loans held decreases. In addition, regardless of whether the CLO or other investment product is consummated or issued, if any of the warehoused investments are sold before such consummation or issuance, we would have to bear any resulting loss on the sale.
We are subject to net capital and other regulatory capital requirements; failure to comply with these rules would significantly harm our business.
JMP Securities, our broker-dealer subsidiary, is subject to the net capital requirements of the SEC, FINRA and various self-regulatory organizations of which it is a member. These requirements typically specify the minimum level of net capital a broker-dealer must maintain and also mandate that a significant part of its assets be kept in relatively liquid form. Failure to maintain the required net capital may subject a firm to limitation of its activities, including suspension or revocation of its registration by the SEC and suspension or expulsion by FINRA and other regulatory bodies, and ultimately may require its liquidation. Failure to comply with the net capital rules could have material and adverse consequences, such as:
|
• |
limiting our operations that require intensive use of capital, such as underwriting or trading activities; or |
|
• |
restricting us from withdrawing capital from our subsidiaries when our broker-dealer subsidiary has more than the minimum amount of required capital; this, in turn, could limit our ability to implement our business and growth strategies, pay interest on and repay the principal of our debt and/or repurchase our shares. |
In addition, a change in the net capital rules or the imposition of new rules affecting the scope, coverage, calculation or amount of net capital requirements, or a significant operating loss or any large charge against net capital, could have similar adverse effects.
As a holding company, JMP Group LLC depends on dividends, distributions and other payments from its subsidiaries to fund distribution payments and to fund all payments on its obligations, including debt obligations. As a result, regulatory actions could impede access to funds that JMP Group LLC needs to make payments on obligations, including debt obligations, or to make distribution payments. In addition, because JMP Group LLC holds equity interests in the firm’s subsidiaries, its rights as an equity holder to the assets of these subsidiaries may not materialize, if at all, until the claims of the creditors of these subsidiaries are first satisfied.
We cannot assure holders of our common shares that distributions will be paid in the future.
In February 2020, the Company suspended its quarterly distribution program. There can be no assurance that the distribution program will resume and that distributions will be paid in the future. In the past and in conjunction with our election to be treated as a C-corporation for tax purposes, rather than a partnership, effective January 1, 2019, we adopted a distribution policy to provide a steady quarterly distribution for each calendar year that will be based on our after-tax fee related earnings. From the second quarter of 2019 through the fourth quarter of 2019, we paid a common share distribution to reflect an annual payout ratio of approximately 50% of operating net income. Our distribution policy will be reassessed each year based upon the level and growth of our after-tax fee related earnings. The declaration, payment and determination of the amount of quarterly distributions, if any, will be at the sole discretion of our board of directors, which may change our distribution policy at any time. We cannot assure our common shareholders that any distributions, whether quarterly or otherwise, can or will be paid. In making decisions regarding our quarterly distribution, our board of directors considers general economic and business conditions, our strategic plans and prospects, our businesses and investment opportunities, our financial condition and operating results, working capital requirements and other anticipated cash needs, contractual restrictions and obligations, legal, tax, regulatory and other restrictions that may have implications on the payment of distributions by us to our common shareholders or by our subsidiaries to us, and such other factors as our board of directors may deem relevant.
There are contractual, legal and other restrictions that may prevent us from paying cash distributions on our shares, if our distribution program resumes, and, as a result, you may not receive any return on investment unless you sell your shares for a price greater than the price for which you paid.
There can be no assurance that in the future sufficient cash will be available for us to pay distributions on our shares to our shareholders. Our board of directors may at any time modify or revoke our current distribution policy. In February 2020, the Company suspended its quarterly distribution program. Any decision to declare and pay distributions in the future will be made at the discretion of our board of directors and will depend on, among other things, our results of operations, financial condition, cash requirements, contractual restrictions and other factors that our board of directors may deem relevant. We do not intend to borrow funds in order to pay distributions. In addition, JMP Group LLC, the entity from which we make our distribution payments, is a holding company that does not conduct any significant business operations of its own, and, therefore, it is dependent upon cash distributions and other transfers from our subsidiaries to make distribution payments on its shares. The amounts available to us to pay cash distributions are restricted by existing and future debt agreements. In general, under the credit agreement governing our revolving lines of credit and term loans with City National Bank, we are restricted under certain circumstances from making distributions if an event of default has occurred under that agreement. The indenture pursuant to which the 7.25% Senior Notes due 2027 were issued and the indenture pursuant to which the 6.875% Senior Notes due 2029 were issued also contain customary event of default and cure provisions. If an uncured default occurs and is continuing, the trustee or the holders of at least 25% in principal amount of the applicable Senior Notes may declare such Senior Notes immediately due and payable. SEC regulations also provide that JMP Securities may not pay cash distributions to us if certain minimum net capital requirements are not met. In addition, Delaware law permits the declaration of distributions only to the extent of our surplus (which is defined as total assets at fair market value, minus total liabilities, minus statutory capital) or, if there is no surplus, out of our net profits for the then current and/or immediately preceding fiscal years. In the event that we do not pay cash distributions on our shares as a result of these restrictions, you may not receive any return on an investment in our shares unless you sell your shares for a price greater than the price for which you purchased them.
We may incur losses as a result of ineffective risk management processes and strategies.
We seek to monitor and control our risk exposure through operational and compliance reporting systems, internal controls, management review processes and other mechanisms. Our investing and trading processes seek to balance our ability to profit from investment and trading positions with our exposure to potential losses. While we employ limits and other risk mitigation techniques, those techniques and the judgments that accompany their application cannot anticipate economic and financial outcomes or the specifics and timing of such outcomes. Thus, we may, in the course of our investment and trading activities, incur losses, which may be significant.
In addition, we are deploying our own capital in our funds and in principal investments, and limitations on our ability to withdraw some or all of our investments in these funds or liquidate our investment positions, whether for legal, reputational, illiquidity or other reasons, may make it more difficult for us to control the risk exposures relating to these investments.
Our risk management policies and procedures may leave us exposed to unidentified or unanticipated risks.
Our risk management strategies and techniques may not be fully effective in mitigating our risk exposure in all market environments or against all types of risk. We seek to manage, monitor and control our operational, legal and regulatory risk through operational and compliance reporting systems, internal controls, management review processes and other mechanisms; however, there can be no assurance that our procedures will be fully effective. Further, our risk management methods may not effectively predict future risk exposures, which could be significantly greater than historical measures indicate. In addition, some of our risk management methods are based on an evaluation of information regarding markets, clients and other matters that are based on assumptions that may no longer be accurate. A failure to adequately manage our growth, or to effectively manage our risk, could materially and adversely affect our business and financial condition.
We are exposed to the risk that third parties that owe us money, securities or other assets will not meet their obligations. These parties may default on their obligations to us due to bankruptcy, lack of liquidity, operational failure, and breach of contract or other reasons. We are also subject to the risk that our rights with regard to third parties may not be enforceable in all circumstances. As an introducing broker, we could be held responsible for the defaults or misconduct of our customers. These may present credit concerns, and default risks may arise from events or circumstances that are difficult to detect, foresee or reasonably guard against. In addition, concerns about, or a default by, one institution could lead to significant liquidity problems, losses or defaults by other institutions, which in turn could adversely affect us. If any of the variety of instruments, processes and strategies we utilize to manage our exposure to various types of risk are not effective, we may incur losses.
Our operations and infrastructure and those of the service providers upon which we rely, including other financial institutions or intermediaries, may malfunction or fail.
Our businesses are highly dependent on our ability to process and monitor, on a daily basis, a large number of complex transactions and securities across numerous and diverse markets. The inability of our systems to accommodate an increasing volume of transactions could constrain our ability to expand our businesses. If our financial, accounting, data processing, or other operating systems and facilities fail to operate properly or become disabled as a result of events that are wholly or partially beyond our control, we could suffer impairments, financial loss, a disruption of our businesses, liability to clients, regulatory intervention or reputational damage.
We have outsourced certain aspects of our technology, administrative and operational infrastructure, including data centers, disaster recovery systems and wide area networks, as well as some trading applications. We are dependent on our service providers to manage and monitor those functions. A disruption of any of the outsourced services would be out of our control and could negatively impact our business. We have experienced disruptions on occasion, none of which have been material to our operations and results. However, there can be no guarantee that future disruptions will not occur, and any that may occur could be severe in nature. We also face the risk of operational failure, capacity constraints or termination of relations with any of the clearing agents, exchanges, clearing houses or other financial intermediaries that we use to facilitate our securities transactions. As a result of the consolidation over the years among clearing agents, exchanges and clearing houses, our exposure to certain financial intermediaries has increased and could affect our ability to find adequate and cost-effective alternatives, should the need arise. Any such failure, constraint or termination of these intermediaries could adversely affect our ability to execute transactions and manage our exposure to risk.
In addition, our ability to conduct business may be adversely impacted by a disruption in the infrastructure that supports our businesses and the communities in which we are located. This may affect, among other things, our financial, accounting or other data processing systems. This may include a disruption involving electrical, communications, transportation or other services used by us or third parties with which we conduct business, whether due to fire, serious weather conditions, earthquakes or other natural disasters, power or communications failure, act of terrorism or war or otherwise. Nearly all of our employees in our primary locations in San Francisco, New York, Boston and Chicago work in close proximity to each other. Although we have a formal disaster recovery plan in place, if a disruption occurs in one location and our employees in that location are unable to communicate with or travel to other locations, our ability to service and interact with our clients may suffer, and we may not be successful in implementing contingency plans that depend on communication or travel.
Our operations also rely on the secure processing, storage and transmission of confidential and other information in our computer systems and networks. Although cybersecurity incidents among financial services firms are on the rise, to date, we have not experienced any material losses relating to cyberattacks or other information security breaches; however, there can be no assurance that we will not suffer such losses in the future. Notwithstanding that we take protective measures and endeavor to modify them as circumstances warrant, our computer systems, software and networks may be vulnerable to human error, natural disasters, power loss, spam attacks, unauthorized access, distributed denial of service attacks, computer viruses and other malicious code, and other events that could have a security impact. Breaches of our network security systems could involve attacks that are intended to obtain unauthorized access to our proprietary information, destroy data or disable, degrade or sabotage our systems, often through the introduction of computer viruses and other means, and could originate from a wide variety of sources, including unknown third parties outside the firm. Although we take various measures to ensure the integrity of our systems, there can be no assurance that these measures will provide protection. A cybersecurity incident affecting our computer systems, software and networks, or that of third-party vendors and clients, could subject us to significant liability and harm our reputation. If one or more of such events occur, this could jeopardize our or our clients’ or counterparties’ confidential and other information processed and stored in, and transmitted through, our computer systems and networks or otherwise cause interruptions or malfunctions in our, our clients’, our counterparties’ or third parties’ operations. We may be required to expend significant additional resources to modify our protective measures, to investigate and remediate vulnerabilities or other exposures, or to make required notifications, and we may be subject to litigation and financial losses that are either not insured or not fully covered through any insurance we maintain. A technological breakdown could also interfere with our ability to comply with financial reporting and other regulatory requirements, exposing us to potential disciplinary action by regulators. If our systems are compromised, do not operate properly or are disabled, we could suffer a disruption of our business, financial losses, liability to clients, regulatory sanctions and damage to our reputation.
In providing services to our clients, we may manage, utilize and store sensitive or confidential client or employee data, including personal data. As a result, we will be subject to numerous laws and regulations designed to protect this information, such as U.S. federal and state laws governing the protection of personally identifiable information and international laws. These laws and regulations are increasing in complexity and number. Any breach of these laws and regulations could subject us to significant monetary damages, regulatory enforcement actions, fines and/or criminal prosecution. Any disclosure of sensitive or confidential information or data could damage our reputation and cause us to lose clients.
Associate misconduct, which is difficult to detect and deter, could harm us by impairing our ability to attract and retain clients and subject us to significant legal liability and reputational harm.
There have been a number of highly-publicized cases involving fraud or other misconduct by associates in the financial services industry. There is a risk that our associates could engage in misconduct that adversely affects our business. For example, our business often requires that we deal with confidential matters of great significance to our clients. If our associates were to improperly use or disclose confidential information provided by our clients, we could be subject to regulatory sanctions and suffer serious harm to our reputation, financial position, current client relationships, and ability to attract future clients. We are also subject to a number of obligations and standards arising from our asset management business and our authority over the assets managed by our asset management business. The violation of these obligations and standards by any of our associates would adversely affect our clients and us. It is not always possible to deter associate misconduct, and the precautions we take to detect and prevent this activity may not be effective. If our associates engage in misconduct, our business would be adversely affected.
We are subject to risks in using prime brokers and custodians.
Our asset management subsidiary and its managed funds depend on the services of prime brokers and custodians to settle and report securities transactions. In the event of the insolvency of a prime broker or custodian, our funds might not be able to recover equivalent assets in whole or in part, as they will rank among the prime broker’s and the custodian’s unsecured creditors in relation to assets that the prime broker or custodian borrows, lends or otherwise uses. In addition, cash held by our funds with the prime broker or custodian will not be segregated from the prime broker’s or custodian’s own cash, and the funds will therefore rank as unsecured creditors in relation thereto.
Strategic investments or acquisitions and joint ventures, or our entry into new business areas, may result in additional risks and uncertainties in our business.
We intend to grow our core businesses both through internal expansion and through strategic investments, acquisitions or joint ventures. When we make strategic investments, acquisitions or enter into joint ventures, we face numerous risks and uncertainties in combining or integrating the relevant businesses and systems. In addition, conflicts or disagreements between us and the other members of a venture may negatively impact our businesses. In addition, future acquisitions or joint ventures may involve the issuance of additional shares, which may dilute your ownership in our firm. Furthermore, any future acquisitions of businesses or facilities by us could entail a number of risks, including:
|
• |
problems with the effective integration of operations; |
|
• |
the inability to maintain key pre-acquisition business relationships and integrate new relationships; |
|
• |
increased operating costs; |
|
• |
difficulties in realizing projected efficiencies, synergies and cost savings; |
|
• |
loss of key employees or customers; |
|
• |
risks of misconduct by employees not subject to our control; |
|
• |
the diversion of management’s attention from our day-to-day business as a result of the need to manage any disruptions and difficulties and the need to add management resources to do so; and |
|
• |
exposure to new, unknown or unanticipated liabilities. |
Any future growth of our business, such as further expansion of our asset management or principal investment activities, may require significant resources and/or result in significant unanticipated losses, costs or liabilities. In addition, expansions, acquisitions or joint ventures may require significant managerial attention, which may be diverted from our other operations. These capital, equity and managerial commitments may impair the operation of our businesses.
The preparation of the consolidated financial statements requires the use of estimates that may vary from actual results and new accounting standards could adversely affect future reported results
The preparation of the consolidated financial statements in conformity with U.S. generally accepted accounting principles (“GAAP”) requires management to make estimates and assumptions that affect the reported amounts of assets and liabilities, disclosure of contingent assets and liabilities at the date of the consolidated financial statements and the reported amounts of revenues and expenses during the reporting period. Such estimates and assumptions may require management to make difficult, subjective and complex judgments about matters that are inherently uncertain. One of our most critical estimates is our allowance for loan losses. At any given point in time, conditions in real estate and credit markets may increase the complexity and uncertainty involved in estimating the losses inherent in our loan portfolios. If management’s underlying assumptions and judgments prove to be inaccurate, the allowance for loan losses could be insufficient to cover actual losses. Our financial condition, including our liquidity and capital, and results of operations could be materially and adversely impacted. See Item 7 “Management’s Discussion and Analysis of Financial Condition and Results of Operations - Critical Accounting Estimates” of this report for additional information on the nature of these estimates.
Our financial instruments, including certain trading assets and liabilities, available-for-sale securities, certain loans, and private equity investments, among other items, require management to make a determination of their fair value in order to prepare our consolidated financial statements. Where quoted market prices are not available, we may make fair value determinations based on internally developed models or other means, which ultimately rely to some degree on our subjective judgment. Some of these instruments and other assets and liabilities may have no directly observable inputs, making their valuation particularly subjective and, consequently, based on significant estimation and judgment. In addition, sudden illiquidity in markets or declines in prices of certain securities may make it more difficult to value certain items, which may lead to the possibility that such valuations will be subject to further change or adjustment, as well as declines in our earnings in subsequent periods.
Our accounting policies and methods are fundamental to how we record and report our financial condition and results of operations. The Financial Accounting Standards Board (the “FASB”) and the SEC have at times revised the financial accounting and reporting standards that govern the preparation of our financial statements. In addition, accounting standard setters and those who interpret the accounting standards may change or even reverse their previous interpretations or positions on how these standards should be applied. These changes can be hard to predict and can materially impact how we record and report our financial condition and results of operations. In some cases, we could be required to apply a new or revised standard retroactively, resulting in our restating prior period financial statements. For further discussion of some of our significant accounting policies and standards, see Item 7 “Management’s Discussion and Analysis of Financial Condition and Results of Operations - Critical accounting estimates” of this report, and Note 2, Summary of Significant Accounting Policies, of the Notes to Consolidated Financial Statements of this Form 10-K.
The FASB has issued several new accounting standards, including on the topics of credit losses and leases and the Federal banking regulators have released implementation guidance and proposed implementation rules for some of these new standards. In particular, the new credit losses standard will replace multiple existing impairment models, including the replacement of the “incurred loss” model for loans with an “expected loss” model. We are evaluating the potential impact that the adoption of these standards and the proposed regulatory implementation rules will have on our financial position, results of operations as well as our regulatory capital. See Note 2, Summary of Significant Accounting Policies, of the Notes to Consolidated Financial Statements of this Form 10-K for further information.
We may incur losses as a result of unforeseen or catastrophic events, including the emergence of a pandemic, terrorist attacks, or natural disasters.
The occurrence of unforeseen or catastrophic events, including the emergence of a pandemic, such as COVID-19, the illness caused by the novel coronavirus which was identified at the end of 2019, or other widespread health emergency (or concerns over the possibility of such an emergency), terrorist attacks, or natural disasters, could create economic and financial disruptions in emerging markets or in other areas of the global economy that could adversely affect our businesses, could lead to operational difficulties (including travel limitations) and could lead to operational difficulties that could impair our ability to manage our businesses. For example, our investments are, and will continue to be, susceptible to economic slowdowns, recessions and rising interest rates, each of which may result from the occurrence of such unforeseen events, which may lead to financial losses in our investments and a decrease in revenues, net income and asset values. These events may reduce the value of our investments, reduce the number of attractive investment opportunities available to us and harm our operating results, which, in turn, may adversely affect our cash flow from operations.
In addition, if we were to experience a disaster or other business continuity problem, such as a pandemic, other man-made or natural disaster or disruption involving electronic communications or other services used by us or third parties with whom we conduct business, our continued success will depend, in part, on the availability of our personnel and office facilities and the proper functioning of our computer, software, telecommunications, transaction processing and other related systems and operations, as well as those of third parties on whom we rely. In particular, we depend on our headquarters in San Francisco and New York, where a large number of our personnel are located, for the continued operation of our business. Although we have developed business continuity plans, a disaster or a disruption in the infrastructure that supports our businesses, a disruption involving electronic communications or other services used by us or third parties with whom we conduct business, or a disruption that directly affects our headquarters, could have a material adverse impact on our ability to continue to operate our business without interruption. The incidence and severity of disasters or other business continuity problems are unpredictable, and our inability to timely and successfully recover could materially disrupt our businesses and cause material financial loss, regulatory actions, reputational harm or legal liability.
Risks Related to Our Industry
Financial services firms have been subject to increased scrutiny over the last several years, increasing the risk of financial liability and reputational harm resulting from adverse regulatory actions.
Firms in the financial services industry have been operating in a difficult regulatory environment, which we expect will become even more stringent in light of recent well-publicized failures of regulators to detect and prevent fraud. The industry has experienced increased scrutiny from a variety of regulatory authorities, including the SEC, the NYSE, NASDAQ, FINRA and state attorneys general. Penalties and fines sought by regulatory authorities have increased substantially over the last several years. This regulatory and enforcement environment has created uncertainty with respect to a number of types of transactions that had historically been entered into by financial services firms and that were generally believed to be permissible and appropriate. We may be adversely affected by changes in the interpretation or enforcement of existing laws and rules by these governmental authorities and self-regulatory organizations. Each of the regulatory bodies with jurisdiction over us has regulatory powers dealing with many aspects of financial services, including, but not limited to, the authority to fine us and to grant, cancel, restrict or otherwise impose conditions on the right to carry on particular businesses. For example, a failure to comply with the obligations imposed by the Exchange Act on broker-dealers and the Investment Advisers Act on investment advisers, including record-keeping, advertising and operating requirements, disclosure obligations and prohibitions on fraudulent activities, or by the Investment Company Act could result in investigations, sanctions and reputational damage. We also may be adversely affected as a result of new or revised legislation or regulations imposed by the SEC, other U.S. or foreign governmental regulatory authorities, or FINRA or other self-regulatory organizations that supervise the financial markets. Substantial legal liability or significant regulatory action against us could have adverse financial effects on us or cause reputational harm to us, which could harm our business prospects.
In addition, financial services firms are subject to numerous conflicts of interest or perceived conflicts. The SEC and other federal and state regulators have increased their scrutiny of potential conflicts of interest. We have adopted various policies, controls and procedures to address or limit actual or perceived conflicts of interest and regularly review and update our policies, controls and procedures. However, appropriately addressing conflicts of interest is complex and difficult, and our reputation could be damaged if we fail, or appear to fail, to appropriately address conflicts of interest. Our policies and procedures to address or limit actual or perceived conflicts of interest may also result in increased costs and additional operational personnel. Failure to adhere to these policies and procedures may result in regulatory sanctions or litigation against us. For example, the research operations of investment banks have been and remain the subject of heightened regulatory scrutiny, which has led to increased restrictions on the interaction between equity research analysts and investment banking professionals at securities firms. Several securities firms in the U.S. reached a global settlement in 2003 and 2004 with certain federal and state securities regulators and self-regulatory organizations to resolve investigations into the alleged conflicts of interest of research analysts, which resulted in rules that have imposed additional costs and limitations on the conduct of our business.
Asset management businesses have experienced a number of highly publicized regulatory inquiries that have resulted in increased scrutiny within the industry and new rules and regulations for mutual funds, investment advisors and broker-dealers. Although we do not act as an investment advisor to mutual funds, we are registered as an investment advisor with the SEC, and the regulatory scrutiny and rulemaking initiatives may result in an increase in operational and compliance costs or the assessment of significant fines or penalties against our asset management business and may otherwise limit our ability to engage in certain activities. In addition, the SEC staff has conducted studies with respect to soft dollar practices in the brokerage and asset management industries and has proposed interpretive guidance regarding the scope of permitted brokerage and research services in connection with soft dollar practices. The SEC staff has indicated that it is considering additional rulemaking in this and other areas, and we cannot predict the effect that additional rulemaking may have on our asset management or brokerage business or whether it will be adverse to us. It is impossible to determine the extent of the impact of any new laws, regulations or initiatives that may be proposed, or whether any of the proposals will become law. Compliance with any new laws or regulations could make compliance more difficult and expensive and could affect the manner in which we conduct business.
Governmental fiscal and monetary policy could adversely affect our small business lending activities, financial position and profitability.
Our small business lending activities are affected by the fiscal and monetary policies of the federal government and its agencies. The Federal Reserve Board (“FRB”) regulates the supply of money and credit in the U.S. Among the instruments of monetary policy available to the FRB are conducting open market operations, changing the discount rates of borrowings of depository institutions, and changing reserve requirements against depository institutions’ deposits. These methods are used in varying degrees and combinations to directly affect the availability of bank loans and deposits, as well as the interest rates charged on loans and paid on deposits. The FRB’s policies determine in large part our cost of funds for lending, investing and capital raising activities and the return we earn on those loans and investments, both of which affect our net interest margin.
Our exposure to legal liability is significant, and damages and other costs that we may be required to pay in connection with litigation and regulatory inquiries, and the reputational harm that could result from legal action against us, could adversely affect our businesses.
Many aspects of our business involve substantial risks of potential liability to customers and to regulatory enforcement proceedings by state and federal regulators arising in the normal course of business. We and other participants in the financial services industry face significant legal risks in our businesses, and in recent years the volume of claims and financial value of damages sought in litigation and regulatory proceedings against financial institutions have been increasing. Dissatisfied clients regularly make claims against securities firms and their employees for, among other reasons, negligence, fraud, unauthorized trading, suitability, churning, failure to supervise, breach of fiduciary duty, employee errors, intentional misconduct, unauthorized transactions by traders, improper recruiting activity, and failures in the processing of securities transactions. These types of claims expose us to the risk of significant loss that may be difficult to assess or quantify, and the existence and magnitude of potential claims often remain unknown for substantial periods of time. Acts of fraud are difficult to detect and deter, and, while we believe our supervisory procedures are reasonably designed to detect and prevent violations of applicable laws, rules and regulations, we cannot assure investors that our risk management procedures and controls will prevent losses from fraudulent activity. Additional risks include potential liability under securities or other laws for materially false or misleading statements made in connection with securities offerings and other transactions, employment claims, potential liability for “fairness opinions” and other advice we provide to participants in strategic transactions, and disputes over the terms and conditions of complex trading arrangements. Generally, pursuant to applicable agreements, investors in our funds do not have legal recourse against us or HCS for underperformance or errors of judgment in connection with the funds, nor will any act or omission be a breach of duty to the fund or limited partner unless it constituted gross negligence or willful violation of law. At any point in time, the aggregate number of existing claims against us could be material. While we do not expect the outcome of any existing claims against us to have a material adverse impact on our business, financial condition, or results of operations, we cannot assure you that these types of proceedings will not materially and adversely affect us. We do not carry insurance that would cover payments regarding these liabilities, with the exception of fidelity coverage with respect to certain fraudulent acts of our employees. In addition, our by-laws provide for the indemnification of our officers, directors and employees to the maximum extent permitted under Delaware law. In the future, we may be the subject of indemnification assertions under these documents by our officers, directors or employees who have or may become defendants in litigation. These claims for indemnification may subject us to substantial risks of potential liability.
As an investment banking and asset management firm, we depend to a large extent on our reputation for integrity and high-quality professional services to attract and retain clients. As a result, if a client is not satisfied with our services, it can be more damaging to our business than it would be to another sort of business. Moreover, our role as advisor to our clients on important underwriting or merger and acquisition transactions involves complex analysis and the exercise of professional judgment, including rendering “fairness opinions” in connection with merger and acquisition and other transactions. As an underwriter, we also are subject to heightened standards regarding liability for material misstatements or omissions in prospectuses and other offering documents relating to offerings in which we are involved. Therefore, our activities may subject us to the risk of significant legal liabilities to our clients and aggrieved third parties, including stockholders of our clients, who could bring securities class actions against us. Our investment banking engagements typically include broad indemnities from our clients and provisions to limit our exposure to legal claims relating to our services; however, there can be no assurance that these provisions will protect us or be enforceable in all cases. As a result, we may incur significant legal and other expenses in defending against litigation and may be required to pay substantial damages for settlements and adverse judgments. We have in the past been, currently are, and may in the future be subject to such securities litigation. Substantial legal liability or significant regulatory action against us could harm our results of operations or cause reputational harm to us, which could adversely affect our business and prospects. In addition to the foregoing financial costs and risks associated with potential liability, the defense of litigation has increased costs associated with attorneys’ fees. Outside attorneys’ fees incurred in connection with the defense of litigation could be substantial and could materially and adversely affect our results of operations as such fees arise. Securities class action litigation in particular is highly complex and can extend for a protracted period of time, thereby substantially increasing the costs incurred to resolve any such litigation.
Our failure to deal appropriately with conflicts of interest could damage our reputation and adversely affect our business.
As we have expanded the number and scope of our businesses, we increasingly confront potential conflicts of interest relating to our and our funds’ and clients’ investment and other activities. Certain of our funds have overlapping investment objectives, including funds which have different fee structures, and potential conflicts may arise with respect to our decisions regarding how to allocate investment opportunities among ourselves and those funds. For example, a decision to acquire material non-public information about a company while pursuing an investment opportunity for a particular fund gives rise to a potential conflict of interest when it results in our having to restrict our own ability or the ability of other funds to take any action.
In addition, there may be conflicts of interest regarding investment decisions for funds in which our officers, directors and employees, who have made and may continue to make significant personal investments in a variety of funds, are personally invested. Similarly, conflicts of interest may exist or develop regarding decisions about the allocation of specific investment opportunities between the Company and the funds.
We also have potential conflicts of interest with our investment banking and institutional clients, including situations in which our services to a particular client or to our own proprietary or fund investments conflict or are perceived to conflict with the interests of a client. It is possible that potential or perceived conflicts could give rise to investor or client dissatisfaction or litigation or regulatory enforcement actions. Appropriately dealing with conflicts of interest is complex and difficult, and our reputation could be damaged if we fail, or appear to fail, to deal appropriately with one or more potential or actual conflicts of interest. Regulatory scrutiny of, or litigation in connection with, conflicts of interest would have a material adverse effect on our reputation, which would materially adversely affect our business in a number of ways, including redemptions by our investors from our hedge funds, an inability to raise additional funds, and a reluctance of counterparties to do business with us.
Misconduct by our employees or by the employees of our business partners could harm us and is difficult to detect and prevent.
There have been a number of highly publicized cases involving fraud or other misconduct by employees in the financial services industry in recent years, and we run the risk that employee misconduct could occur at our firm. For example, misconduct could involve the improper use or disclosure of confidential information, which could result in regulatory sanctions and serious reputational or financial harm. It is not always possible to deter misconduct, and the precautions we take to detect and prevent this activity may not be effective in all cases. Our ability to detect and prevent misconduct by entities with which we do business may be even more limited. We may suffer reputational harm for any misconduct by our employees or those entities with which we do business.
If we were deemed an investment company under the Investment Company Act, applicable restrictions could make it impractical for us to continue our business as contemplated and could have an adverse effect on our business and the price of our shares.
We are not an investment company under the Investment Company Act. However, if we were to cease operating and controlling the business and affairs of JMP Securities, JMPAM and HCS, or if these subsidiaries were deemed to be an investment company, our interest in those entities could be deemed an investment security for purposes of the Investment Company Act. We intend to conduct our operations so that we will not be deemed an investment company. However, we do commit some of our capital to principal investments. If we were to be deemed an investment company, restrictions imposed by the Investment Company Act, including limitations on our capital structure and our ability to transact with affiliates, could make it impractical for us to continue our business as contemplated and would harm our business and the price of our shares.
Tax Risks to Holders of our Shares
We are treated as a corporation for U.S. federal income tax purposes, which will reduce the amount available for distributions to holders of our common shares and could adversely affect the value of our common shareholders’ investment.
We elected to be taxed as a corporation for U.S. federal income tax purposes effective January 1, 2019. Consequently, we could be liable for significant U.S. federal income taxes and applicable state and local taxes that would not otherwise be incurred if we were treated as a partnership for U.S. federal income tax purposes, which could reduce the amount of cash available for distributions to holders of our common shares and adversely affect the value of their investment.
We could incur a significant tax liability if the IRS successfully asserts that the “anti-stapling” rules apply to JMP Group LLC’s investments in JMP Group Inc. and certain non-U.S. CLO issuers, which could result in a reduction in cash flow and after-tax return for holders of shares and, thus, could result in a reduction of the value of those shares.
In 2020, JMP Group LLC’s ownership in all non-U.S. corporate entities is less than 50% of the total value. However, if JMP Group LLC were subject to the “anti-stapling” rules of Section 269B of the Code, the Company could incur a significant tax liability as a result of owning more than 50% of the value of both a domestic corporation and a non-U.S. CLO issuer. The Reorganization Transaction is considered in determining the impact to the consolidated group as the non-U.S. CLO issuers would be treated as a corporation under the consolidated group, which would include JMP Group, Inc. JMP Group LLC and the non-U.S. CLO issuers would be treated as a single entity for purposes of U.S. federal corporate income taxation. Since the Company is treated as a consolidated corporation after the Reorganization Transaction and the ownership in the non-U.S corporate entities is less than 50% of the total value, the Company believes that the “anti-stapling” rules will not apply. However, there can be no assurance that the IRS would not successfully assert a contrary position, which could result in a reduction in cash flow and after-tax return for holders of shares and a reduction in the value of those shares.
Changes to and replacement of the London Interbank Offered Rate ("LIBOR") benchmark interest rate could adversely affect our business, financial condition, and results of operations.
In July 2017, the United Kingdom's Financial Conduct Authority ("FCA"), a regulator of financial services firms and financial markets in the U.K., stated that they will plan for a phase out of regulatory oversight of LIBOR interest rate indices. The FCA has indicated they will support the LIBOR indices through 2021 to allow for an orderly transition to an alternative reference rate. Other financial services regulators and industry groups, including the International Swaps and Derivatives Association and the Alternative Reference Rates Committee ("ARRC"), have evaluated and are continuing to evaluate the phase-out of LIBOR. The ARRC has settled on the establishment of the Secured Overnight Financing Rate ("SOFR") as its recommended alternative to U.S. dollar LIBOR. SOFR is based on a broad segment of the overnight Treasuries repurchase market and is intended to be a measure of the cost of borrowing cash overnight collateralized by Treasury securities. The Federal Reserve Bank of New York began publishing SOFR in April 2018 and since then a number of market participants have utilized SOFR through the issuance of variable rate debt securities indexed to SOFR. In November 2018, the FHLBank System offered its first SOFR linked consolidated obligation and began offering SOFR linked advances. Given the large volume of LIBOR-based financial instruments, the basis adjustment to the replacement floating rate will receive extraordinary scrutiny, but whether the net impact is positive or negative cannot yet be ascertained. The infrastructure changes necessary to manage hedging in the alternative reference rate still need to be completed, and the transition in the markets, and adjustments in systems, could be disruptive. Many assets and liabilities are indexed to LIBOR including certain CLO portfolios that had a LIBOR floor. We are planning for the eventual replacement of its LIBOR-indexed instruments away from the LIBOR benchmark interest rate, including the possibility of SOFR as the dominant replacement. We are not currently able to predict whether LIBOR will remain as an available rate index, whether and when an alternative rate such as SOFR will become a robust market benchmark rate in place of LIBOR, or what the impact of such a transition may be on our business, financial condition, and results of operations.
Although we anticipate that foreign CLO issuers will not be subject to U.S. federal income tax on a net income basis, no assurance can be given that such CLO issuers will not be subject to U.S. federal income tax on a net income basis in any given taxable year.
We anticipate that foreign CLO issuers that are taxed as corporations for U.S. federal income tax purposes generally will continue to conduct their activities in such a way as not to be deemed to be engaged in a U.S. trade or business and not to be subject to U.S. federal income tax. There can be no assurance, however, that foreign CLO issuers will not pursue investments or engage in activities that may cause them to be engaged in a U.S. trade or business. Moreover, there can be no assurance that, as a result of any change in applicable law, treaty, rule or regulation or interpretation thereof, the activities of any of foreign CLO issuers will not become subject to U.S. federal income tax. Further, there can be no assurance that unanticipated activities of foreign CLO issuers will not cause such entities to become subject to U.S. federal income tax. If any foreign CLO issuers became subject to U.S. federal income tax (including the U.S. federal branch profits tax), it would significantly reduce the amount of cash available for distribution to us, which in turn could have an adverse impact on the value of our shares. Although foreign CLO issuers generally are not expected to be subject to U.S. federal income tax on a net income basis, such entities may receive income that is subject to withholding taxes imposed by the U.S. or other countries.
|
Unresolved Staff Comments |
None.
|
Properties |
We occupy four principal offices, with our headquarters in San Francisco and other offices in New York, Boston and Chicago. We occupy additional space in a few other cities in the U.S. All of our properties are leased. Our San Francisco headquarters is located at 600 Montgomery Street and comprises approximately 37,808 square feet of leased space pursuant to lease agreements expiring in 2024. In New York, we lease approximately 20,570 square feet at 450 Park Avenue pursuant to a lease agreement expiring in 2025 and approximately 4,293 square feet at 767 Third Avenue pursuant to a lease agreement expiring in 2023. In Boston, we lease approximately 2,490 square feet at 265 Franklin Street pursuant to a lease agreement expiring in 2021. In Chicago, we lease approximately 2,400 square feet at 10 South Wacker Drive pursuant to a lease agreement expiring in 2025. Additionally we lease approximately 600 square feet in other cities in the U.S. which the Company is committed to until 2022.
|
Legal Proceedings |
We are involved in a number of judicial, regulatory and arbitration matters arising in connection with the ordinary course of our business. The outcome of matters we have been, and currently are, involved in cannot be determined at this time, and the results cannot be predicted with certainty, except for the matter described below. There can be no assurance that these matters will not have a material adverse effect on our results of operations in any future period and a significant judgment could have a material adverse impact on our financial condition, results of operations and cash flows. We may in the future become involved in additional litigation in the ordinary course of our business, including litigation that could be material to our business. Our management, after consultation with legal counsel, believes that the currently known actions or threats against us will not result in any material adverse effect on our financial condition, results of operations or cash flows.
|
Mine Safety Disclosures |
Not applicable.
|
Market for Registrant’s Common Equity, Related Shareholder Matters and Issuer Purchases of Equity Securities |
Market Information
Our common shares trade on the NYSE under the symbol “JMP.” As of December 31, 2020, there were 35 holders of record of our shares.
Our 7.25% Senior Notes due 2027 and 6.875% Senior Notes due 2029 are each listed on the Nasdaq Global Market under the symbols “JMPNL” and “JMPNZ”, respectively.
Dividend and Distribution Policy
On February 19, 2020 the Company suspended its quarterly distribution program.
Issuer Purchases of Equity Securities
During the fourth quarter ended December 31, 2020, no purchases of the Company's shares was made by or on behalf of JMP Group LLC. As of December 31, 2020, there were no shares available to be repurchased as part of publicly announced programs or plans.
|
Selected Financial Data |
Not required as a Smaller Reporting Company.
|
Management’s Discussion and Analysis of Financial Condition and Results of Operations |
The following discussion should be read together with our consolidated financial statements and the accompanying notes appearing in Item 8 “Financial Statements and Supplementary Data” of this Annual Report on Form 10-K. In addition to historical information, the following discussion contains forward-looking statements that involve risks and uncertainties. Our actual results and the timing of events may differ significantly from those projected in such forward-looking statements due to a number of factors, including those discussed under the caption “Special Note Regarding Forward-Looking Statements” and elsewhere in this Annual Report on Form 10-K. These forward-looking statements should not be relied upon as representing our views as of any subsequent date, and we undertake no obligation to update or revise forward-looking statements to reflect events or circumstances after the date they were made.
Overview
The Company, is a diversified capital markets firm headquartered in San Francisco, California. We have a diversified business model with a focus on small and middle-market companies and provide:
|
• |
investment banking services, including corporate finance, mergers and acquisitions and other strategic advisory services, to corporate clients; |
|
• |
sales and trading and related securities brokerage services to institutional investors; |
|
• |
equity research coverage of three target industries; |
|
• |
asset management products and services to institutional investors, high net-worth individuals and for our own account; and |
|
• |
management of collateralized loan obligations (through March 19, 2019) and a specialty finance company. |
Operating Results
A summary of the Company’s operating results for the year ended December 31, 2020, and for comparable prior periods, is set forth below.
|
Year Ended December 31, |
||||||||
|
(in thousands, except per share amounts) |
2020 |
2019 |
||||||
|
Total net revenues |
$ | 115,499 | $ | 100,081 | ||||
|
Net income/(loss) attributable to JMP Group |
(4,697 | ) | (6,549 | ) | ||||
|
Net income/(loss) attributable to JMP Group per share |
(0.24 | ) | (0.32 | ) | ||||
|
Operating Net Income/(Loss)* |
12,558 | (851 | ) | |||||
|
Operating Net Income/(Loss) per share* |
0.63 | (0.04 | ) | |||||
*Operating Net Income (Loss) is a non-GAAP measure. See the section titled Operating Net Income (Non-GAAP Financial Measure) for more information about this non-GAAP measure, including a reconciliation to net income (loss).
Recent Developments
On January 30, 2020, the spread of novel coronavirus (“COVID-19”) was declared a Public Health Emergency of International Concern by the World Health Organization (“WHO”). Subsequently, on March 11, 2020, WHO characterized the COVID-19 outbreak as a pandemic. In March 2020, the U.S. equities market saw sharp declines and extreme volatility in reaction to the COVID-19 pandemic.
In the second quarter of 2020, unprecedented fiscal and monetary stimuli by the U.S. government spurred a sharp recovery in U.S. equity prices directly. The U.S. equities market continued to recover from the impact of the COVID-19 pandemic during the second half of 2020. The Company's equity capital markets and brokerage revenues directly benefited from the improved capital market condition.
We continue to closely monitor the status of the COVID-19 pandemic and its impact on our business, the economy and capital markets globally. An economic recession could have a material adverse effect on our business, financial condition, results of operations, or cash flows. While we are optimistic that the equity market could remain active through year-end, we cannot reliably estimate the extent to which the COVID-19 pandemic will impact our business in the 4th quarter and beyond.
On December 23, 2020, HCC and Portman Ridge Finance Corporation (“PTMN”) announced that they have entered into a definitive agreement under which HCC will merge with and into PTMN, a business development company managed by Sierra Crest Investment Management LLC (“Sierra Crest”), an affiliate of BC Partners Advisors L.P. The parties currently expect the transaction to be completed in the second calendar quarter of 2021. The Company’s partially-owned subsidiary HCAP Advisors provides investment advisory services to HCC. In addition, the Company had investments in HCC common stock of $7.5 million as of December 31, 2020. In connection with the above transaction, HCC stockholders will receive aggregate consideration equal to HCC’s net asset value at closing. This consideration will be funded using PTMN shares (valued at 100% of PTMN’s net asset value per share at the time of closing of the transaction) and, to the extent the required number of PTMN shares exceeds 19.9% of the issued and outstanding shares of PTMN common stock immediately prior to the transaction closing, cash consideration in the amount of such excess. As described below, HCAP stockholders will have an opportunity, subject to certain limitations, to elect to receive either cash or PTMN shares in consideration for their HCAP shares. Additionally, all HCAP stockholders will receive an additional cash payment from Sierra Crest of $2.15 million in the aggregate, or approximately $0.36 per share.
Deconsolidation of the CLOs and JMPCA
On January 17, 2019, the non-call period of JMP Credit Advisors CLO III(R) Ltd. (“CLO III”) expired, which resulted in a change in the entity with the control over the most significant activities of the variable interest entity (“VIE”). The expiration of the non-call period resulted in the Company losing control over the most significant activities of CLO III. The Company deconsolidated CLO III as of January 17, 2019. The Company continues to hold approximately 47% of the outstanding junior subordinated notes of CLO III and the Company accounts for its ownership of the CLO III subordinated notes as an investment in a CLO debt security. The Company recognized a gain of $1.6 million as revenue from principal transactions on the deconsolidation of CLO III for the year ended December 31, 2019.
On March 19, 2019, the Company sold a 50.1% equity interest in JMP Credit Advisors LLC ("JMPCA") to Medalist Partners LP (“Medalist”), an alternative asset management firm specializing in structured credit and asset-backed lending, and a 4.9% interest to management employees of JMPCA. JMP Holding LLC, a wholly-owned subsidiary of the Company, retained 45.0% of the equity interest in JMPCA. The sale of JMPCA was considered a reconsideration event as defined in Accounting Standard Codification (“ASC”) 810, Consolidation, which requires a new consolidation analysis, and the Company determined that JMPCA is a VIE after the transaction date. The Company determined that we are not the primary beneficiary of JMPCA as we are not the party with the power to direct the most significant activities of JMPCA. As the Company was determined to not be the primary beneficiary, the Company deconsolidated JMPCA as of the date of sale. As the Company still retains 45.0% of the equity interest of JMPCA and has significant influence, the Company has determined that it will account for its retained interest as an equity method investment after the date of deconsolidation, however; the Company has made the election to use the fair value option to account for the investment. The Company received a cash payment of $0.3 million in consideration for the limited liability company interest and recorded a gain of $3.4 million on deconsolidation as revenue from principal transactions. The transaction agreement also required Medalist to provide additional capital to purchase an equity interest in JMP Credit Advisors CLO VI Long-Term Warehouse Ltd (the "CLO VI warehouse") to finance the acquisition of broadly syndicated corporate loans, which resulted in Medalist related entities purchasing approximately 66% of the outstanding equity of the CLO VI warehouse. The Company will receive a portion of the subordinated management fees from the CLOs JMPCA managed as of the date of the sale. After the sale, JMPCA was renamed Medalist Partners Corporate Finance LLC (“MPCF”).
.
After the sale of JMPCA, the Company concluded that it has lost the ability to direct the most significant activities of the VIEs: JMP Credit Advisors CLO IV Ltd. (“CLO IV”), JMP Credit Advisors CLO V Ltd. (“CLO V”), and the CLO VI warehouse (collectively with CLO III the “CLOs”) and also deconsolidated those CLOs as of March 19, 2019. The Company continues to hold 100% of the junior subordinated notes of CLO IV and CLO V and approximately 33% of the equity interests of the CLO VI warehouse. The Company owned 100% and 25% of the senior subordinated notes in CLO IV and CLO V, respectively, at the date of deconsolidation. The Company sold all of its senior subordinated notes in CLO IV and CLO V in May 2019. The Company accounts for its ownership of the subordinated notes as a beneficial interest in a debt security and accounts for its equity interests of the CLO VI warehouse as an equity investment. The Company classifies the junior subordinated notes as available-for-sale securities and classified the senior subordinated notes as trading securities up until their sale. Collectively, the Company recognized a loss on the deconsolidation of CLO IV, CLO V, and CLO VI warehouse of $1.8 million and a loss of $0.1 million on the sale of the senior subordinated notes of CLO IV and CLO V for the year ended December 31, 2019 in revenues from principal transactions.
The Election for JMP Group LLC to be Taxed as a C Corporation
Since January 2015, JMP Group LLC had been a publicly traded partnership and, as such, was taxed as a partnership, and not as a corporation, for U.S. federal income tax purposes, so long as 90% or more of its gross income for each taxable year constitutes “qualifying income.” On January 31, 2019, the Company filed an election with the U.S. Internal Revenue Service to be treated as a C corporation for tax purposes, rather than as a partnership, going forward. The election was approved and became retroactively effective as of January 1, 2019.
An entity taxed as a partnership generally does not incur any U.S. federal income tax liability, and any income, gains, losses or deductions are taken in by the owners of the partnership in computing their U.S. federal income tax liability, regardless of any distributions from the partnership. In contrast, an entity treated as a corporation for U.S. federal income tax purposes generally pays U.S. federal income tax on its taxable income as it is considered a taxable entity. For years beginning after December 31, 2017, the maximum U.S. federal tax rate imposed on the net income of corporations is 21%. This rate may be subject to change in the future. Owners of a corporate entity generally do not incur any U.S. federal income tax liability on any earnings of the corporation unless the corporation makes a distribution of cash or property. Any distributions paid from current or accumulated earnings are treated as dividends, and these "qualifying dividends" are generally taxed at a lower rate than the ordinary income tax rate. For corporate entities, as both the corporation and distributions from the corporation are taxed, there are two levels of potential tax on the income earned.
Components of Revenues
We derive revenues primarily from: fees from our investment banking business, net commissions from our sales and trading business, management fees and incentive fees from our asset management business, and interest income earned on collateralized loan obligations we manage. We also generate revenues from principal transactions, interest, dividends and other income.
Investment Banking
We earn investment banking revenues from underwriting securities offerings, arranging private capital markets transactions and providing advisory services in mergers and acquisitions and other strategic transactions.
Underwriting Revenues
We earn revenues from securities offerings in which we act as an underwriter, such as initial public offerings and follow-on equity offerings. Underwriting revenues include management fees, underwriting fees, selling concessions, and realized and unrealized net gains and losses on equity positions held in inventory for a period of time to facilitate the completion of certain underwritten offerings. We record underwriting revenues, gross of related syndicate expenses, on the trade date which is typically the date of pricing an offering (or the following day). The Company has determined that its performance obligations are completed and the related income is reasonably determinable on the trade date. In syndicated transactions, management estimates our share of transaction-related expenses incurred by the syndicate, and we recognize revenues gross of such expense. On final settlement by the lead manager, typically 90 days from the trade date of the transaction, we adjust these amounts to reflect the actual transaction-related expenses and our resulting underwriting fee. We receive a higher proportion of total fees in underwritten transactions in which we act as a lead manager.
Strategic Advisory Revenues
Our strategic advisory revenues primarily consist of success fees received upon the closing of mergers and acquisitions but also include retainer fees received when we are first engaged to provide advisory services. We also earn fees for related advisory work and other services, such as fairness opinions, valuation analyses, due diligence, and pre-transaction structuring advice. These revenues may be earned for providing services to either the buyer or the seller involved in a transaction. Depending on the nature of the engagement letter and the agreed upon services, customers may simultaneously receive and consume the benefits of services or services may culminate in the delivery of the advisory services at a point in time. The Company evaluates each contract individually and the performance obligations identified to determine if revenue should be recognized ratably over the term of the agreement or at a specific point in time. Any retainer fees received in connection with these agreements are individually evaluated and any unearned fees are deferred for revenue recognition.
Private Capital Markets and Other Revenues
We earn fees for private capital markets and other services in connection with transactions that are not underwritten, such as private placements of equity securities, PIPE transactions and Rule 144A offerings. We record private placement revenues on the closing date of these transactions. Client reimbursements for costs associated for private placement fees are recorded gross within Investment banking and various expense captions, excluding compensation.
Since our investment banking revenues are generally recognized at the time of completion of a transaction or the services to be performed, these revenues typically vary between periods and may be affected considerably by the timing of the closing of significant transactions.
Brokerage Revenues
Our brokerage revenues include trading commissions paid by customers for purchases or sales of exchange-listed and over-the-counter equity securities. Commissions resulting from equity securities transactions executed on behalf of customers are recorded on a trade date basis. The Company believes that the performance obligation is satisfied on the trade date because that is when the underlying financial instrument or purchaser is identified, the pricing is agreed upon, and the risks and rewards of ownership have been transferred to/from the customer. Brokerage revenues also include net trading gains and losses that result from market-making activities and from our commitment of capital to facilitate customer transactions. Our brokerage revenues may vary between periods, in part depending on commission rates, trading volumes and our ability to deliver equity research and other value-added services to our clients. The ability to execute trades electronically, through the internet and through other alternative trading systems, has increased pressure on trading commissions and spreads across our industry. We expect this trend toward alternative trading systems and the related pricing pressure in the brokerage business to continue. We are, to some extent, compensated through brokerage commissions for the equity research and other value-added services we deliver to our clients. These “soft dollar” practices have been the subject of discussion among regulators, the investment banking community and our sales and trading clients. In particular, commission sharing arrangements have been adopted by some large institutional investors. In these arrangements, an institutional investor concentrates its trading with fewer “execution” brokers and pays a fixed amount for execution, with a designated amount set aside for payments to other firms for research or other brokerage services. Accordingly, trading volume directed to us by investors that enter into such arrangements may be reduced, or eliminated, but we may be compensated for our research and sales efforts through allocations of the designated amounts. Depending on the extent to which we agree to this practice and depending on our ability to enter into arrangements on terms acceptable to us, this trend would likely impair the revenues and profitability of our brokerage business by negatively affecting both volumes and trading commissions.
Asset Management Fees
We earn asset management fees for managing a family of investment partnerships, including hedge funds, hedge funds of funds, private equity funds, real estate funds, a capital debt fund, as well as a publicly traded specialty finance company, Harvest Capital Credit Corporation ("HCC"). These fees include base management fees and incentive fees. Base management fees are generally determined by the fair value of the assets under management ("AUM") or the aggregate capital commitment and the fee schedule for each fund or account. Incentive fees are based upon the investment performance of the funds or accounts. For most of our funds, incentive fees equate to a percentage of the excess investment return above a specified high-water mark or hurdle rate over a defined period of time. For private equity funds, incentive fees equate to a percentage of the realized gain from the disposition of each portfolio investment in which each investor participates, which we earn after returning contributions by an investor for a portfolio investment. Some of these incentive fees are subject to contingent repayments to investors or clawback and cannot be recognized until it is probable that there will not be a significant reversal of revenue. Any such fees earned are deferred for revenue recognition until the contingency is removed or the Company determines that it is not probable that a significant reversal of revenue will occur.
For the year ended December 31, 2020 the contractual base management fees earned from each of our investment funds or companies ranged between 1% and 2% of AUM or were between 1% and 2% of aggregate committed capital. The contractual incentive fees were generally 20%, subject to high-water marks, for the hedge funds; 5% to 20%, subject to high-water marks or a performance hurdle rate, for the hedge funds of funds; 20%, subject to high-water marks, for Harvest Growth Capital LLC (“HGC”), Harvest Growth Capital II LLC (“HGC II”) and Harvest Growth Capital III LLC (“HGC III”); and 30% for JMP Capital I LLC ("JMP Capital I"). Our asset management revenues are subject to fluctuations due to a variety of factors that are unpredictable, including the overall condition of the economy, the securities markets as a whole and our core sectors. These market and industry conditions can have a material effect on the inflows and outflows of AUM and on the performance of our asset management funds. For example, a significant portion of the performance-based or incentive fee revenues that we recognize are based on the value of securities held in the funds we manage. The value of these securities includes unrealized gains or losses that may change from one period to another.
Prior to the sale of the majority equity interest in JMPCA, the asset management fees for the CLOs under management during the period consisted only of senior and subordinated base management fees. We recognized base management fees for the CLOs on a monthly basis over the period during which the collateral management services are performed. The base management fees for the CLOs were calculated as a percentage of the average aggregate collateral balances for a specified period. As we consolidated the CLOs, the management fees earned at JMPCA from the CLOs were eliminated on consolidation in accordance with GAAP. For the period from January 1, 2019 through January 17, 2019 (deconsolidation date), the contractual senior and subordinated base management fees earned from CLO III were 0.35% of the average aggregate collateral balance. For the period from January 1, 2019 through March 19, 2019 (deconsolidation date) , the contractual base and subordinated fees earned from CLO IV were 0.50% of the average aggregate collateral balance. For the period from January 1, 2019 through March 19, 2019 (deconsolidation date), the contractual base and subordinated fees earned from CLO V were 0.50% of the average aggregate collateral balance. For the period from January 1, 2019 through March 19, 2019 (deconsolidation date), the contractual base and subordinated fees earned from CLO VI warehouse portfolio were 1.0% of the average equity contributions.
The redemption provisions of our funds require at least 90 days’ advance notice. Redemptions are not permitted in our private equity funds or our private debt capital vehicles. The redemption provisions do not apply to the CLOs.
Principal Transactions
Principal transaction revenues include realized and unrealized net gains and losses resulting from our principal investments in equity, CLO and other debt securities. Principal transaction revenues also include unrealized net gains and losses resulting from our principal investments in various investment funds managed by the Company or by third parties.
Loss on Sale, Payoff, and Mark-to-Market of Loans
Loss on sale, payoff, and mark-to-market of loans consists of gains and losses from the sale and payoff of loans collateralizing asset-backed securities ("ABS", through March 2019). Gains are recorded when the proceeds exceed the carrying value of the loan.
Net Dividend Income
Net dividend income includes dividends from our investments offset by dividend expense resulting from short positions in our principal investment portfolio.
Other Income
Other income includes revenues from equity method investments, revenues from fee-sharing arrangements with our funds, contingent revenue from a sale of a general partnership, subordinated management fees earned on CLO investments, and fees earned to raise capital for third-party investment partnerships.
Interest Income
Interest income primarily consists of interest income earned on loans collateralizing ABS issued (through March 2019), investments in CLO debt securities, and loans held for investment. Interest income on loans is comprised of the stated coupon as a percentage of the face amount receivable as well as accretion of purchase discounts and deferred fees. Interest income is recorded on an accrual basis, in accordance with the terms of the respective loans, unless such loans are placed on non-accrual status. Interest on CLO debt securities are recognized in interest income using the effective yield method.
Interest Expense
Interest expense primarily consists of interest expense related to ABS issued and CLO warehouse credit facilities (through March 2019), Senior Notes, lines of credit, and notes payable, as well as the amortization of bond issuance costs. Interest expense on ABS is the stated coupon payable as a percentage of the principal amount payable adjusted for amortization of any discounts. Interest expense is recorded on an accrual basis, in accordance with the terms of the respective debt instruments.
Gain (Loss) on Repurchase, Reissuance, or Early Retirement of Debt
Loss on repurchase, reissuance, or early retirement of debt primarily consists of losses incurred in the write-off of debt issuance costs related to Senior Notes that have been repurchased or retired sooner than the life of the instrument.
Provision for Loan Losses
Provision for loan losses includes the provision for losses recognized on loans held for investment in order to record those loans at their estimated net realizable value. We maintain an allowance for loan losses that is intended to estimate loan losses inherent in individual loans or in the homogenous loan portfolio. A provision for loan losses is charged to expense to establish the allowance for loan losses. The allowance for loan losses is maintained at a level, in the opinion of management, sufficient to offset estimated losses inherent in individual loans or in the homogenous loan portfolio as of the date of the financial statements. The appropriateness of the allowance and the allowance components are reviewed quarterly. Our estimate of each allowance component is based on observable information and on market and third-party data that we believe are reflective of the underlying loan losses being estimated. We employ internally developed and third-party estimation tools for measuring credit risk.
A specific reserve is provided for loans that are considered impaired. A loan is considered impaired when it is probable that we will be unable to collect all amounts due according to the contractual terms of the loan agreement. We measure impairment of a loan based upon either the present value of expected future cash flows discounted at the loan’s effective interest rate, the loan’s observable market price, or the fair value of the collateral securing the loan, if the loan is collateral-dependent, depending on the circumstances and our collection strategy.
Loans which are deemed to be uncollectible are charged off, and the charged-off amount is deducted from the allowance.
Components of Expenses
We classify our expenses as compensation and benefits; administration; brokerage, clearing and exchange fees; travel and business development; managed deal expenses, communications and technology; occupancy; professional fees, depreciation, and other. A significant portion of our expense base is variable, including compensation and benefits; brokerage, clearing and exchange fees; travel and business development; managed deal expenses, communication and technology expenses.
Compensation and Benefits
Compensation and benefits is the largest component of our expenses and includes employees’ base pay, performance bonuses, sales commissions, related payroll taxes, and medical and benefits expenses, as well as expenses for contractors, temporary employees, and equity-based compensation. Our employees receive a substantial portion of their compensation in the form of an individual, performance-based bonus. As is the widespread practice in our industry, we pay bonuses, for the most part, on an annual basis, and for senior professionals these bonuses typically make up a large portion of their total compensation. A portion of the performance-based bonuses paid to certain senior professionals is paid in the form of deferred compensation. Bonus payments may have a greater impact on our cash position and liquidity in the periods in which they are paid than would otherwise be reflected in our Consolidated Statements of Operations. We accrue for the estimated amount of these bonus payments ratably over the applicable service period.
Compensation is accrued with specific ratios of total compensation and benefits to total revenues applied to specific revenue categories, with adjustments made if, in management’s opinion, such adjustments are necessary and appropriate to maintain competitive compensation levels.
Administration
Administration expense primarily includes the cost of hosted conferences, non-capitalized systems and software expenditures, insurance, business tax (non-income), office supplies, recruiting, and regulatory fees.
Brokerage, Clearing, and Exchange Fees
Brokerage, clearing, and exchange fees include the cost of floor and electronic brokerage and execution, securities clearance, and exchange fees. Changes in brokerage, clearing, and exchange fees fluctuate largely in line with the volume of our sales and trading activity.
Travel and Business Development
Travel and business development expense primarily consists of costs incurred traveling to client locations for the purposes of executing transactions or meeting potential new clients, travel for administrative functions, and other costs incurred in developing new business. Travel costs related to existing clients for mergers and acquisitions and underwriting deals are sometimes reimbursed by clients. Under the new revenue standard ASC 606, reimbursed costs are presented as revenue on the Consolidated Statements of Operations.
Managed Deal Expenses
Managed deal expenses primarily relate to costs incurred and/or allocated in the execution of investment banking transactions, including reimbursable costs. Under the new revenue standard ASC 606, reimbursed costs are presented as revenue on the Consolidated Statements of Operations.
Communications and Technology
Communications and technology expense primarily relates to the cost of communication and connectivity, information processing and subscriptions to certain market data feeds and services.
Occupancy Expenses
Occupancy costs primarily include payments made under operating leases that are recognized on a straight-line basis over the period of the lease and the accretion of any lease incentives.
Professional Fees
Professional fees primarily relate to legal and accounting professional services.
Depreciation
Depreciation expenses include the straight-line amortization of purchases of certain furniture and fixtures, computer and office equipment, certain software costs, and leasehold improvements to allocate their depreciation amounts over their estimated useful life.
Other Expenses
Other operating expenses primarily include occupancy, depreciation, and administration expense.
Income Taxes
As of January 31, 2019, the Company filed an election with the U.S. Internal Revenue Service to be treated as a C corporation for tax purposes, rather than a partnership, going forward. The election was approved and became retroactively effective as of January 1, 2019.
The Company recognizes deferred tax assets and liabilities in accordance with ASC 740, Income Taxes, which are determined based upon the temporary differences between the financial reporting and tax basis of the Company’s assets and liabilities using the tax rates and laws in effect when the differences are expected to reverse. Valuation allowances are established when necessary to reduce the deferred tax assets when it is more likely than not that a portion or all of the deferred tax assets will not be realized. The Company does not have a valuation allowance as of December 31, 2020.
The Company records uncertain tax positions using a two-step process: (i) the Company determines whether it is more likely than not that each tax position will be sustained on the basis of the technical merits of the position; and (ii) for those tax positions that meet the more-likely-than not recognition threshold, the Company recognizes the largest amount of tax benefit that is more than fifty percent likely to be realized upon ultimate settlement with the related tax authority
The Company’s policy for recording interest and penalties associated with the tax audits or unrecognized tax benefits, if any, is to record such items as a component of income tax.
Non-controlling Interest
Non-controlling interest represents the pro rata share of the income or loss partially-owned subsidiaries consolidated in our financial statements.
Results of Operations
The following table sets forth our results of operations for the years ended December 31, 2020 and 2019, and is not necessarily indicative of the results to be expected for any future period.
|
(In thousands) |
Year Ended December 31, |
Change from 2019 to 2020 |
||||||||||||||
|
2020 |
2019 |
$ |
% |
|||||||||||||
|
Revenues |
||||||||||||||||
|
Investment banking |
$ | 100,384 | $ | 65,716 | $ | 34,668 | 52.8 | % | ||||||||
|
Brokerage |
18,926 | 17,628 | 1,298 | 7.4 | % | |||||||||||
|
Asset management fees |
8,320 | 7,427 | 893 | 12.0 | % | |||||||||||
|
Principal transactions |
(18,528 | ) | 1,344 | (19,872 | ) | -1478.6 | % | |||||||||
|
Loss on sale, payoff and mark-to-market of loans |
- | (38 | ) | 38 | 100.0 | % | ||||||||||
|
Net dividend income |
400 | 1,184 | (784 | ) | -66.2 | % | ||||||||||
|
Other income |
3,735 | 2,373 | 1,362 | 57.4 | % | |||||||||||
|
Non-interest revenues |
113,237 | 95,634 | 17,603 | 18.4 | % | |||||||||||
|
Interest income |
8,654 | 21,801 | (13,147 | ) | -60.3 | % | ||||||||||
|
Interest expense |
(6,977 | ) | (16,458 | ) | 9,481 | 57.6 | % | |||||||||
|
Net interest income |
1,677 | 5,343 | (3,666 | ) | -68.6 | % | ||||||||||
|
Loss on repurchase, reissuance, or early retirement of debt |
697 | (458 | ) | 1,155 | 252.2 | % | ||||||||||
|
Provision for loan losses |
(112 | ) | (438 | ) | 326 | 74.4 | % | |||||||||
|
Total net revenues after provision for loan losses |
115,499 | 100,081 | 15,418 | 15.4 | % | |||||||||||
|
Non-interest expenses |
||||||||||||||||
|
Compensation and benefits |
95,138 | 77,314 | 17,824 | 23.1 | % | |||||||||||
|
Administration |
6,590 | 9,387 | (2,797 | ) | -29.8 | % | ||||||||||
|
Brokerage, clearing and exchange fees |
2,610 | 2,706 | (96 | ) | -3.5 | % | ||||||||||
|
Travel and business development |
1,252 | 5,240 | (3,988 | ) | -76.1 | % | ||||||||||
|
Managed deal expenses |
3,605 | 3,136 | 469 | 15.0 | % | |||||||||||
|
Communication and technology |
4,394 | 4,390 | 4 | 0.1 | % | |||||||||||
|
Occupancy |
4,785 | 5,229 | (444 | ) | -8.5 | % | ||||||||||
|
Professional fees |
3,658 | 4,359 | (701 | ) | -16.1 | % | ||||||||||
| Depreciation | 1,500 | 1,203 | 297 | 24.7 | % | |||||||||||
|
Other |
42 | 500 | (458 | ) | -91.6 | % | ||||||||||
|
Total non-interest expenses |
123,574 | 113,464 | 10,110 | 8.9 | % | |||||||||||
|
Net loss before income taxes |
(8,075 | ) | (13,383 | ) | 5,308 | 39.7 | % | |||||||||
|
Income tax expense (benefit) |
(3,284 | ) | (6,827 | ) | 3,543 | 51.9 | % | |||||||||
|
Net loss |
(4,791 | ) | (6,556 | ) | 1,765 | 26.9 | % | |||||||||
|
Less: Net loss attributable to non-controlling interest |
(94 | ) | (7 | ) | (87 | ) | -1242.9 | % | ||||||||
|
Net loss attributable to JMP Group LLC |
$ | (4,697 | ) | $ | (6,549 | ) | $ | 1,852 | 28.3 | % | ||||||
Operating Net Income (Non-GAAP Financial Measure)
Management uses Operating Net Income as a key, non-GAAP metric when evaluating the performance of JMP Group LLC’s core business strategy and ongoing operations, as management believes that this metric appropriately illustrates the operating results of JMP Group LLC’s core operations and business activities. Operating Net Income is derived from our segment reported results and is the measure of segment profitability on an after-tax basis used by management to evaluate our performance. This non-GAAP measure is presented to enhance investors’ overall understanding of the Company’s current financial performance. Additionally, management believes that Operating Net Income is a useful measure because it allows for a better evaluation of the performance of JMP Group LLC’s ongoing business and facilitates a meaningful comparison of the Company’s results in a given period to those in prior and future periods.
However, Operating Net Income should not be considered a substitute for results that are presented in a manner consistent with GAAP. A limitation of the non-GAAP financial measures presented is that, unless otherwise indicated, the adjustments concern gains, losses or expenses that JMP Group LLC generally expects to continue to recognize, and the adjustment of these items should not always be construed as an inference that these gains or expenses are unusual, infrequent or non-recurring. Therefore, management believes that both JMP Group LLC’s GAAP measures of its financial performance and the respective non-GAAP measures should be considered together. Operating Net Income may not be comparable to a similarly titled measure presented by other companies.
Operating Net Income is a non-GAAP financial measure that adjusts the Company’s GAAP net income as follows:
|
(i) |
reverses compensation expense recognized under GAAP related to equity awards; |
|
(ii) |
recognizes 100% of the cost of deferred compensation in the period for which such compensation was awarded, instead of recognizing such cost over the vesting period as required under GAAP, in order to match compensation expense with the actual period upon which the compensation was based; |
|
(iii) |
reverses amortization expense related to an intangible asset resulting from the repurchase of a portion of the equity of CLO III prior to March 2019; |
|
(iv) |
unrealized gains or losses on commercial real estate investments, adjusted for non-cash expenditures, including depreciation and amortization; |
|
(v) |
reverses net unrealized gains and losses on strategic equity investments and certain warrant positions; |
|
(vi) |
reverses impairment of CLO debt securities recognized in principal transaction revenues, as the Company believes that the forecasted reduction in future cash flows will be mitigated by a change in the interest rate environment and that distributions will be larger than currently projected; |
| (vii) | reverses the one-time transaction costs related to the refinancing or repurchase of the debt; | |
|
(viii) |
includes a combined federal, state and local income tax rate of 26% at the consolidated taxable parent company, JMP Group LLC; | |
| (xi) |
presents revenues and expenses on a basis that deconsolidates the CLOs (through March 19, 2019) and removes any non-controlling interest in consolidated but less than wholly owned subsidiaries; and |
|
| (x) | excludes a charge recorded in connection with severance costs deriving from a strategic restructuring and reduction in headcount in September 2020. |
Discussed below is our Operating Net Income (Loss) by segment. This information is reflected in a manner utilized by management to assess the financial operations of the Company's various business lines.
|
Year Ended December 31, 2020 |
||||||||||||||||||||||||||||
|
(In thousands) |
Broker-Dealer |
Asset Management |
Corporate Costs |
Eliminations |
Total Segments |
|||||||||||||||||||||||
|
Asset Management Fee Income |
Investment Income |
Total Asset Management |
||||||||||||||||||||||||||
|
Revenues |
||||||||||||||||||||||||||||
|
Investment banking |
$ | 100,384 | $ | - | $ | - | $ | - | $ | - | $ | - | $ | 100,384 | ||||||||||||||
|
Brokerage |
18,926 | - | - | - | - | - | 18,926 | |||||||||||||||||||||
|
Asset management related fees |
180 | 9,264 | 1,462 | 10,726 | - | (149 | ) | 10,757 | ||||||||||||||||||||
|
Principal transactions |
1,491 | - | 4,706 | 4,706 | - | - | 6,197 | |||||||||||||||||||||
|
Net dividend income |
- | - | 539 | 539 | - | - | 539 | |||||||||||||||||||||
|
Net interest income |
- | - | 1,780 | 1,780 | - | - | 1,780 | |||||||||||||||||||||
| Gain on repurchase, reissuance or early retirement of debt | - | - | 786 | 786 | - | - | 786 | |||||||||||||||||||||
|
Provision for loan losses |
- | - | (113 | ) | (113 | ) | - | - | (113 | ) | ||||||||||||||||||
|
Adjusted net revenues |
120,981 | 9,264 | 9,160 | 18,424 | - | (149 | ) | 139,256 | ||||||||||||||||||||
|
Non-interest expenses |
||||||||||||||||||||||||||||
|
Non-interest expenses |
102,888 | 8,983 | 928 | 9,911 | 9,637 | (149 | ) | 122,287 | ||||||||||||||||||||
|
Operating pre-tax net income (loss) |
18,093 | 281 | 8,232 | 8,513 | (9,637 | ) | - | 16,969 | ||||||||||||||||||||
|
Income tax expense (benefit) |
4,696 | 72 | 2,148 | 2,220 | (2,505 | ) | - | 4,412 | ||||||||||||||||||||
|
Operating net income (loss) |
$ | 13,397 | $ | 209 | $ | 6,084 | $ | 6,293 | $ | (7,133 | ) | $ | - | $ | 12,558 | |||||||||||||
|
Year Ended December 31, 2019 |
||||||||||||||||||||||||||||
|
(In thousands) |
Broker-Dealer |
Asset Management |
Corporate Costs |
Eliminations |
Total Segments |
|||||||||||||||||||||||
|
Asset Management Fee Income |
Investment Income |
Total Asset Management |
||||||||||||||||||||||||||
|
Revenues |
||||||||||||||||||||||||||||
|
Investment banking |
$ | 65,716 | $ | - | $ | - | $ | - | $ | - | $ | - | $ | 65,716 | ||||||||||||||
|
Brokerage |
17,628 | - | - | - | - | - | 17,628 | |||||||||||||||||||||
|
Asset management related fees |
20 | 8,691 | 989 | 9,680 | - | (1,140 | ) | 8,560 | ||||||||||||||||||||
|
Principal transactions |
- | - | 8,465 | 8,465 | - | - | 8,465 | |||||||||||||||||||||
|
Loss on sale, payoff, and mark-to-market of loans |
- | - | (39 | ) | (39 | ) | - | - | (39 | ) | ||||||||||||||||||
|
Net dividend income |
- | - | 1,337 | 1,337 | - | - | 1,337 | |||||||||||||||||||||
|
Net interest income |
- | - | 5,317 | 5,317 | - | - | 5,317 | |||||||||||||||||||||
|
Provision for loan losses |
- | - | (438 | ) | (438 | ) | - | - | (438 | ) | ||||||||||||||||||
|
Adjusted net revenues |
83,364 | 8,691 | 15,631 | 24,322 | - | (1,140 | ) | 106,546 | ||||||||||||||||||||
|
Non-interest expenses |
||||||||||||||||||||||||||||
|
Non-interest expenses |
90,066 | 9,352 | 2,351 | 11,703 | 7,067 | (1,140 | ) | 107,696 | ||||||||||||||||||||
|
Operating pre-tax net income (loss) |
(6,702 | ) | (661 | ) | 13,280 | 12,619 | (7,067 | ) | - | (1,150 | ) | |||||||||||||||||
|
Income tax expense (benefit) |
(1,742 | ) | (172 | ) | 3,432 | 3,260 | (1,817 | ) | - | (299 | ) | |||||||||||||||||
|
Operating net income (loss) |
$ | (4,960 | ) | $ | (489 | ) | $ | 9,848 | $ | 9,359 | $ | (5,250 | ) | $ | - | $ | (851 | ) | ||||||||||
The following table reconciles consolidated net loss attributable to JMP Group LLC to total Operating Net Income (Loss) for the years ended December 31, 2020 and 2019.
|
(In thousands) |
Year Ended December 31, |
|||||
|
2020 |
2019 |
|||||
|
Consolidated Net loss attributable to JMP Group LLC |
$ | (4,697 | ) | $ | (6,549 | ) |
|
Income tax expense (benefit) |
(3,284 | ) | (6,827 | ) | ||
|
Consolidated pre-tax net loss attributable to JMP Group LLC |
(7,981 | ) | (13,376 | ) | ||
|
Addback (subtract) |
||||||
|
Share-based awards and deferred compensation |
(1,953 | ) | 4,079 | |||
|
Early retirement/repurchase of debt |
89 | 625 | ||||
| Impairment – CLO equity | 21,702 | 4,204 | ||||
|
Strategic restructuring charge |
2,056 | - | ||||
|
Amortization of intangible asset – CLO III |
- | 277 | ||||
|
Unrealized loss – real estate-related depreciation and amortization |
1,856 | 1,779 | ||||
|
Unrealized mark-to-market loss -strategic equity investments |
1,200 | 1,262 | ||||
|
Total Consolidation Adjustments and Reconciling Items |
24,950 | 12,226 | ||||
|
Total segments operating pre-tax net income (loss) |
16,969 | (1,150 | ) | |||
|
Subtract (addback) segment income tax expense (benefit) |
4,412 | (299 | ) | |||
|
Operating Net Income (Loss) |
$ | 12,558 | $ | (851 | ) | |
Year Ended December 31, 2020 Compared to the Year Ended December 31, 2019
Revenues
Investment Banking
Investment banking revenues, earned in our Broker-Dealer segment, increased $34.7 million, or 52.8%, from $65.7 million for the year ended December 31, 2019 to $100.4 million for the same period in 2020. As a percentage of total net revenues after provision for loan losses, investment banking revenues increased from 65.7% for the year ended December 31, 2019 to 86.9% for the year ended December 31, 2020. On an operating basis, investment banking revenues were 72.1% and 61.7% for the years ended December 31, 2020 and 2019, respectively, as a percentage of adjusted net revenues.
|
(Dollars in thousands) |
Year Ended December 31, |
Change from 2019 to 2020 |
||||||||||||||||||||||||||
|
2020 |
2019 |
|||||||||||||||||||||||||||
|
Count |
Revenues |
Count |
Revenues |
Count |
$% |
|||||||||||||||||||||||
|
Equity and debt origination |
101 | $ | 59,936 | 78 | $ | 42,236 | 23 | $ | 17,700 | 41.9 | % | |||||||||||||||||
|
Strategic advisory and private placements |
25 | 40,448 | 18 | 23,480 | 7 | 16,967 | 72.3 | % | ||||||||||||||||||||
|
Total |
126 | $ | 100,383 | 96 | $ | 65,716 | 30 | $ | 34,667 | 52.8 | % | |||||||||||||||||
The increase in revenues was primarily driven by a 41.9% increase in equity and debt origination revenues as JMP executed 101 deals in the year ended December 31, 2020 compared to 78 for the same period in 2019. We also saw a 72.3% increase in strategic advisory and private placements revenues, which increased from $23.5 million for the year ended December 31, 2019 to $40.4 million for the year ended December 31, 2020. The number of transactions in which we acted as a bookrunning manager was 9 and 19 for the years ended December 31, 2020 and 2019, respectively.
Brokerage Revenues
Brokerage revenues earned in our Broker-Dealer segment were $18.9 million and $17.6 million for the years ended December 31, 2020 and 2019, respectively. Brokerage revenues decreased as a percentage of total net revenues after provision for loan losses, from 17.6% for the year ended December 31, 2019 to 16.4% for the year ended December 31, 2020. On an operating basis, brokerage revenues were 13.6% and 16.5% for the years ended December 31, 2020 and 2019, respectively, as a percentage of adjusted net revenues.
Asset Management Fees
|
(In thousands) |
Year Ended December 31, |
|||||||
|
2020 |
2019 |
|||||||
|
Asset management related fees: |
||||||||
|
Fees reported as asset management fees |
$ | 8,320 | $ | 7,427 | ||||
|
Fees reported as other income |
3,735 | 2,373 | ||||||
|
Less: Non-controlling interest in HCAP Advisors |
(1,298 | ) | (1,240 | ) | ||||
|
Total segment asset management related fee revenues |
$ | 10,757 | $ | 8,560 | ||||
Fees reported as asset management fees were $8.3 million and $7.4 million for the years ended December 31, 2020 and 2019, respectively. As a percentage of total net revenues after provision for loan losses, asset management revenues decreased from 7.4% for the year ended December 31, 2019 to 7.2% for the year ended December 31, 2020. Fees reported as other income were $3.7 million and $2.4 million for years ended December 31, 2020 and 2019, respectively. As a percentage of total net revenues after provision for loan losses, other income were 3.2% and 2.4% for both of the years ended December 31, 2020 and 2019, respectively.
Total segment asset management-related fees include base management fees and incentive fees from our assets under management, as well as other income from fee-sharing arrangements with, and fees earned to raise capital for, third-party or equity-method investment partnerships or funds. Total segment asset management-related fee revenues are reconciled to the GAAP measure, total asset management fee revenues, in the table above. We believe that presenting operating asset management-related fees is useful to investors as a means of assessing the performance of our combined asset management activities, including fundraising and other services for third parties. We also believe that asset management-related fee revenue is a more meaningful measure than standalone asset management fees as reported, because asset management-related fee revenues represent the combined impact of the various asset management activities on the Company’s total net revenues.
Total segment asset management related fee revenue increased $2.2 million, from $8.6 million for the year ended December 31, 2019 to $10.8 million for the year ended December 31, 2020. On an operating basis, asset management related fee revenues were 7.7% and 8.0% for the years ended December 31, 2020 and 2019, respectively, as a percentage of adjusted net revenues.
The following table represents a summary of the Company’s client assets under management with respect to the assets managed by HCS, JMP Asset Management LLC (“JMPAM”), HCAP Advisors LLC (“HCAP Advisors”) and assets managed by sponsored funds:
|
(In thousands) |
Client Assets Under Management at |
|||||||
|
December 31, |
December 31, |
|||||||
|
2020 |
2019 |
|||||||
|
Client Assets Managed by HCS, JMPAM, and HCAP Advisors (1) |
$ | 659,695 | $ | 607,381 | ||||
|
Client Assets Under Management by Sponsored Funds (2) |
4,933,913 | 5,381,432 | ||||||
|
JMP Group LLC total client assets under management |
$ | 5,593,608 | $ | 5,988,813 | ||||
| (1) | For HCS, JMPAM, and HCAP Advisors, client assets under management represent the net assets of such funds or the commitment amount. |
| (2) | Sponsored funds are third-party asset managers in which the Company owns an economic interest. |
Principal Transactions
Principal transaction revenues decreased $19.9 million, from a gain of $1.3 million for the year ended December 31, 2019 to a loss of $18.5 million for the same period in 2020. The decrease was primarily driven by a $21.7 million impairment loss on CLO debt securities for the year ended December 31, 2020 compared to the loss for the year ended December 31, 2019 of $4.2 million. In addition, we recognized a $3.4 million gain on deconsolidation of JMPCA in the year ended December 31, 2019.
Total segment principal transaction revenues decreased from $8.5 million for the year ended December 31, 2019 to $6.2 million for the same period in 2020. Total segment principal transaction revenues are a non-GAAP financial measure that aggregates our segment reported principal transaction revenues across each segment. The principal transaction revenues for both 2020 and 2019 were included in our Investment Income segment. Total segment principal transaction revenues are reconciled to the GAAP measure, total principal transaction revenues, in the table below. See the Operating Net Income section above for additional information on the adjustments made to arrive at the non-GAAP measure and why management believes that this non-GAAP number is useful and important to the users of these financial statements.
|
(In thousands) |
Year Ended December 31, |
|||||||
|
2020 |
2019 |
|||||||
|
Equity and other securities |
$ | 152 | $ | 1,412 | ||||
|
Warrants and other investments |
4,884 | 6,927 | ||||||
| Investment partnerships | 1,161 | 126 | ||||||
|
Total segment principal transaction revenues |
6,197 | 8,465 | ||||||
|
Operating adjustment addbacks |
(24,725 | ) | (7,121 | ) | ||||
|
Total principal transaction revenues |
$ | (18,528 | ) | $ | 1,344 | |||
On an operating basis, as a percentage of total adjusted net revenues, principal transaction revenues decreased from 7.9% for the year ended December 31, 2019 to 4.5% for the year ended December 31, 2020.
Net Interest Income/Expense
Total segment net interest income decreased $8.4 million from $5.3 million the year ended December 31, 2019 to $1.8 million for the year ended December 31, 2020, driven by the deconsolidation of the CLOs in the first quarter of 2019. Net interest income is earned in our Investment Income segment. Total segment net interest income after deconsolidation reflects the effective yield of the Company's ownership of subordinated notes in CLO III, CLO IV, and CLO V, net of bond interest expense. Total segment net interest income is reconciled to the GAAP measure, total net interest income, in the table above. As a percentage of total adjusted net revenues, net interest income was 1.3% and 5.0% for the years ended December 31, 2020 and 2019, respectively.
Expenses
Non-Interest Expenses
Compensation and Benefits
Compensation and benefits, which includes employee payroll, taxes and benefits, performance-based cash bonus and commissions, as well as equity-based compensation to our employees and managing directors, increased $17.8 million, or 23.1%, from $77.3 million for the year ended December 31, 2019 to $95.1 million for the year ended December 31, 2020.
Employee payroll, taxes and benefits, and consultant fees were $40.8 million and $42.1 million for the years ended December 31, 2020 and 2019, respectively. Performance-based bonus and commission increased $19.3 million from $33.2 million for the year ended December 31, 2019 to $52.5 million for the year ended December 31, 2020.
Equity-based compensation was $1.7 million and $2.0 million for the years ended December 31, 2020 and 2019, respectively.
Compensation and benefits as a percentage of total net revenues after provision for loan losses increased from 77.3% for the year ended December 31, 2019 to 82.4% for the year ended December 31, 2020.
Administration
Administration expense was $6.6 million for the year ended December 31, 2020 and $9.4 million for the year ended December 31, 2019. As a percentage of total net revenues after provision for loan losses, administration expense decreased from 9.4% for the year ended December 31, 2019 to 5.7% for the same period in 2020.
Brokerage, Clearing and Exchange Fees
Brokerage, clearing and exchange fees was $2.7 million for the year ended December 31, 2019 and $2.6 million for the same period in 2020. As a percentage of total net revenues after provision for loan losses, our brokerage, clearing and exchange fees decreased from 2.7% for the year ended December 31, 2019 to 2.3% for the same period in 2020.
Travel and Business Development
Travel and business development expenses decreased $4.0 million, from $5.2 million for the year ended December 31, 2019 to $1.2 million for the year ended December 31, 2020, driven by lower volume of business travel due to the COVID-19 pandemic. As a percentage of total net revenues after provision for loan losses, travel and business development expense was 1.1% and 5.2% and for the years ended December 31, 2020 and 2019, respectively.
Managed deal expenses
Managed deal expenses were $3.6 million and $3.1 million for the years ended December 31, 2020 and 2019, respectively. As a percentage of total equity and debt origination revenues, managed deal expenses remained consistent at 6.0% percent and 7.4% for the years ended December 31 2020 and 2019, respectively.
Communications and Technology
Communications and technology expenses were $4.4 million for the years ended December 31, 2020 and 2019. As a percentage of total net revenues after provision for loan losses, communications and technology expense increased to 3.8% for the year ended December 31, 2020 from 4.4% for the year ended December 31, 2019.
Occupancy
Occupancy expenses were $4.8 and $5.2 million for the years ended December 31, 2020 and 2019, respectively. As a percentage of total net revenues after provision for loan losses, occupancy expenses were 4.1% for the year ended December 31, 2020 and were 5.2% for the year ended December 31, 2019.
Professional Fees
Professional fees were $3.7 million and $4.4 million for the years ended December 31, 2020 and 2019, respectively. As a percentage of total net revenues after provision for loan losses, professional fees were 3.2% and 4.4% for the years ended December 31, 2020 and 2019, respectively.
Depreciation
Depreciation expenses were $1.5 million and $1.2 million for the years ended December 31, 2020 and 2019, respectively. As a percentage of total net revenues after provision for loan losses, depreciation was 1.2% for the year ended December 31, 2019 and 1.3% for the year ended December 31, 2020.
Provision for Income Taxes
Income tax benefit was $3.2 million for the year ended December 31, 2020, while an income tax benefit of $6.8 million for the year ended December 31, 2019.
Segment income tax was an expense of $4.4 million and a benefit of $0.3 million for the years ended December 31, 2020 and 2019, respectively. An effective tax rate of 26% is assumed for our taxable parent company, based on our best estimation of the subsidiary’s average rate of taxation over the long term.
On March 27, 2020, the Coronavirus Aid, Relief, and Economic Security (CARES) Act was enacted in response to market conditions related to the COVID-19 pandemic. The CARES Act includes many measures to help companies, including changes that are temporary and non-income based tax laws, some of which were part of the Tax Cuts and Jobs Act (TCJA). The Company has made reasonable assessments in accounting for certain effects of the CARES Act that was passed. However, the provisional impacts may be refined over the prescribed measurement period.
During the year ended December 31, 2020, the Company carried back net operating losses that were created prior to 2020 which was subsequently used to offset years with taxable income that was derived from a different corporate tax rate.
Summarized Financial Information
JMP Group Inc., a wholly-owned subsidiary of JMP Group LLC, is the primary obligor of the Company’s 7.25% Senior Notes due 2027 (the “2027 Senior Notes”) (see Note 6, Loans). Pursuant to the indenture of the 2027 Senior Notes, JMP Group LLC and JMP Investment Holdings LLC (the “Guarantors”) are the guarantors of the 2027 Senior Notes. The Guarantors jointly and severally provide a full and unconditional guarantee of the due and punctual payment of the principal and interest on the 2027 Senior Notes and the due and punctual payment or performance of all other obligations of JMP Group Inc. under the indenture governing the 2027 Senior Notes.
The following summarized financial information presents the information of JMP Group LLC, JMP Investment Holdings LLC and JMP Group Inc. on a combined basis and eliminates intercompany balances. It does not include or present investments in subsidiaries that are not an issuer or guarantor. One of the non-guarantor subsidiaries not combined, JMP Securities, is subject to certain regulations, which require the maintenance of minimum net capital. This requirement may limit the issuer’s access to this subsidiary’s assets.
These disclosures are in accordance with the new disclosure requirements under SEC Regulation S-X Rule 3-10 and Rule 13-02 issued in March 2020. The amended financial disclosures will consist of summarized financial information, as defined in Rule 1-02(bb)(1) of Regulation S-X, of the issuers and guarantors, which may be presented on a combined basis, and reduce the number of periods presented. The amended non-financial disclosures, among other matters, will expand the qualitative disclosures about the guarantees and the issuers and guarantors. Consistent with the existing rule, disclosure of additional information about each guarantor will be required if it would be material for investors to evaluate the sufficiency of the guarantee. We have early adopted these disclosure rules. The tables below present summarized financial information as of December 31, 2020 and December 31, 2019 and for the year ended December 31, 2020.
The tables below present summarized financial information as of December 31, 2020 and December 31, 2019 and for the year ended December 31, 2020.
|
(In thousands) |
As of |
|||||||
|
December 31, |
December 31, |
|||||||
|
2020 |
2019 |
|||||||
|
Cash and cash equivalents |
$ | 8,761 | $ | 12,557 | ||||
|
Marketable securities owned, at fair value |
26,843 | 34,203 | ||||||
|
Due from non-obligated subsidiaries |
1,221 | 200 | ||||||
|
Deferred tax asset |
15,911 | 18,547 | ||||||
|
Operating lease right-of-use asset |
16,244 | 19,632 | ||||||
|
Total assets |
82,901 | 99,100 | ||||||
|
Bond payable, net of debt issuance costs |
80,912 | 82,584 | ||||||
|
Due to non-obligated subsidiaries |
19,200 | 20,912 | ||||||
|
Operating lease liability |
21,130 | 25,394 | ||||||
|
Total liabilities |
134,778 | 140,377 | ||||||
|
Total equity |
(51,877 | ) | (41,276 | ) | ||||
|
Total liabilities and equity |
82,901 | 99,101 | ||||||
|
(In thousands) |
Year Ended |
|||
|
December 31, 2020 |
||||
|
Total net revenues after provision for loan losses |
$ | 12,882 | ||
|
Total non-interest expenses |
12,237 | |||
|
Net loss |
(17,047 | ) | ||
Financial Condition, Liquidity and Capital Resources
In the section that follows, we discuss the significant changes in the components of our balance sheet, cash flows, and capital resources and liquidity for the year ended December 31, 2020 to demonstrate where our capital is invested and the financial condition of the Company.
Overview
As a result of the ongoing COVID-19 pandemic, certain costs declined in 2020 as the underlying activities are restricted by the COVID-19 pandemic, including travel and related expenses. In addition, after a careful review of our cost structure, we reduced headcount modestly during the quarter ended September 30, 2020. While the headcount reduction resulted in recognition of severance costs, the reduced ongoing cost should increase cash flows in the future periods. However, the extent to which the COVID-19 pandemic will impact our liquidity in future periods still remains uncertain.
As of December 31, 2020, we had $91.4 million in cash and cash equivalents and $17.9 million in undrawn borrowing capacity on our revolving line of credit (some of which borrowing capacity may be used for working capital – See the section entitled JMP Holding LLC Credit Agreement with CNB, below). Based on our historical results, management's experience and our current business strategy, we believe that our existing cash resources and available credit will be sufficient to meet anticipated working capital and capital expenditure requirements for at least the next twelve months.
As of December 31, 2020, we had net liquid assets of $108.0 million consisting of cash and cash equivalents, receivable from clearing broker, marketable securities owned, investment banking fee receivable, net of marketable securities sold but not yet purchased and accrued compensation. We have satisfied our capital and liquidity requirements primarily through the issuance of the Senior Notes, draws on a line of credit and internally generated cash from operations. Most of our financial instruments, other than certain marketable securities, are recorded at fair value or amounts that approximate fair value.
Liquidity Considerations
As of December 31, 2020, our material indebtedness consisted of our then outstanding Senior Notes and borrowing on our revolving line of credit with City National Bank (“CNB”) under the Credit Agreement described below.
Senior Notes
In November 2017, JMP Group Inc. raised $50.0 million from the issuance of 7.25% Senior Notes (“2027 Senior Notes”). The 2027 Senior Notes will mature on November 15, 2027 and may be redeemed in whole or in part at any time or from time to time at JMP Group Inc.’s option on or after November 28, 2020 at a redemption price equal to the principal amount redeemed plus accrued and unpaid interest. The 2027 Senior Notes bear interest at a rate of 7.25% per year, payable quarterly on February 15, May 15, August 15 and November 15 of each year. Pursuant to the indenture of the 2027 Senior Notes, JMP Group LLC and JMP Investment Holdings LLC (the “Guarantors”) are the guarantors of the 2027 Senior Notes. The Guarantors jointly and severally provide a full and unconditional guarantee of the due and punctual payment of the principal and interest on the 2027 Senior Notes and the due and punctual payment or performance of all other obligations of JMP Group Inc. under the indenture governing the 2027 Senior Notes.
In September 2019, JMP Group LLC raised $36.0 million from the issuance of 6.875% Senior Notes (“2029 Senior Notes”). The 2029 Senior Notes will mature on September 30, 2029 and may be redeemed in whole or in part at any time or from time to time at the Company’s option on or after September 30, 2021 at a redemption price equal to the principal amount redeemed plus accrued and unpaid interest. The 2029 Senior Notes bear interest at a rate of 6.875% per year, payable quarterly on March 30, June 30, September 30, and December 30 of each year.
In March 2020, the Company repurchased $1.4 million and $0.7 million par value of its issued and outstanding 2029 Senior Notes and 2027 Senior Notes, respectively. Since they were repurchased at less than carrying value, a gain of $0.7 million was recognized upon the repurchase of the bonds, which has been included in the Consolidated Statements of Operations, gain on repurchase, reissuance or early retirement of debt.
On January 4, 2021, the Company announced that JMP Group Inc. gave notice of its intention to redeem $10.0 million principal amount of the 2027 Notes which was completed on February 4, 2021.
JMP Holding LLC Credit Agreement with CNB
JMP Holding LLC (the “Borrower”), a wholly owned subsidiary of the Company, entered into a Second Amended and Restated Credit Agreement dated April 30, 2014 among the Borrower, the lenders from time to time party thereto (the “Lenders”) and CNB, as administrative agent for the Lenders (as amended, the “Credit Agreement”).
On December 31, 2020, the Borrower entered into an Amendment Number Eight (the “Eighth Amendment”) to that certain Second Amended and Restated Credit Agreement dated April 30, 2014 among the Borrower, the Lenders and CNB. The Eighth Amendment extended the outside maturity date of the Revolving Loan under the Credit Facility from December 31, 2020 to December 31, 2022 and removed the mechanism whereby the Revolving Loan would convert into a term loan for 12 months after the revolving period ends. The Eighth Amendment amended certain financial covenants and introduced a definition of “Borrowing Base”, which is a sum of certain assets of the Loan Parties, and added a provision that caps the total amount that can be borrowed under the Revolving Loan to the amount of the Borrowing Base if the Borrowing Base is lower than the Maximum Revolver Amount of $25 million. As of December 31, 2020, the Borrowing Base exceeded $25 million.
The Credit Agreement provides a $25.0 million revolving line of credit (the “Revolver”) through December 31, 2022 bears interest at a rate of LIBOR plus 225 bps.
The Credit Agreement provides that the Revolver may be used, on a revolving basis, to fund specified permitted investments in collateralized loan obligation vehicles. In addition, up to $5.0 million of the Revolver may be used, on a revolving basis, to fund other types of permitted investments and acquisitions and for working capital.
As of December 31, 2020 and 2019, the Borrower had drawn $6.0 million against the Revolver and had letters of credit outstanding under this facility to support office lease obligations of approximately $1.1 million in the aggregate.
The Credit Agreement contains financial and other covenants, including, but not limited to, limitations on debt, liens and investments, as well as the maintenance of certain financial covenants. The Credit Agreement also includes an event of default for a “change of control” that tests, in part, the composition of our ownership and an event of default if three or more of the members of the Company’s executive committee fail to be involved actively on an ongoing basis in the management of the Company or any of its subsidiaries. A violation of any one of these covenants could result in a default under the Credit Agreement, which would permit CNB to terminate our Revolver or Converted Term Loan and require the immediate repayment of any outstanding principal and interest. In addition, our subsidiaries are restricted under the Credit Agreement under certain circumstances from making distributions to us if an event of default has occurred under the Credit Agreement.
As of December 31, 2020 and December 30, 2019, we were in compliance with the loan covenants under the Credit Agreement.
The Borrower’s obligations under the Credit Agreement are guaranteed by all of the Company’s other wholly owned subsidiaries (other than JMP Securities and certain dormant subsidiaries) and are secured by substantially all of its and the guarantors’ assets. In addition, we have entered into a limited recourse pledge agreement with CNB whereby JMP Group LLC granted a lien on the equity interests in JMP Investment Holdings LLC and JMPAM to secure the Borrower’s obligations under the Credit Agreement. In July 2020, the Company earned into a Seventh Amendment to its Credit Facility with CNB, that among other things, requires the Company maintain a minimum of $6.0 million of CLO debt securities, based on their fair value as of June 30, 2020 pledged as collateral supporting the obligations under the Credit Agreement. See Note 9, Loans, for more information on the Seventh Amendment.
JMP Securities LLC Revolving Note Agreement with CNB
Under a Revolving Note and Cash Subordination Agreement (as amended, the “Revolving Note Agreement”) and related Revolving Note (as amended, the “Revolving Note”), each dated April 8, 2011, JMP Securities holds a $20.0 million revolving line of credit with CNB to be used for regulatory capital purposes in connection with its securities underwriting activities. Advances under the Revolving Note Agreement bear interest at CNB’s announced prime interest rate. The unused portion of the line bears interest at the rate of 0.25% per annum, paid monthly.
On June 29, 2020, JMP Securities entered Amendment Number Eleven to the Revolving Note Agreement. Pursuant to this amendment, the $20.0 million Revolving Note Agreement was extended for one year until June 30, 2021. On June 20, 2021, any existing outstanding amount under the Revolving Note will convert to a term loan maturing the following year.
There was no borrowing on the Revolving Note as of December 31, 2020 and December 31, 2019.
The Revolving Note Agreement contains financial and other covenants. A violation of any one of these covenants could result in a default under the Revolving Note, which would permit CNB to terminate the Revolving Note and require the immediate repayment of any outstanding principal and interest, subject to the terms of the Revolving Note Agreement.
At both December 31, 2020 and December 31, 2019, JMP Securities was in compliance with the loan covenants under the Revolving Note Agreement.
JMP Securities’ obligations under the Revolving Note Agreement are guaranteed by all of the Company’s wholly owned subsidiaries (other than JMP Securities and certain dormant subsidiaries) and are secured by substantially all the guarantors’ assets.
Other JMP Group LLC considerations
On May 13, 2019, the Company launched a self-tender offer (the “Tender Offer”) to repurchase for cash up to 3,000,000 of shares representing limited liability company interests of the Company. On June 13, 2019, the Company repurchased 1,816,732 shares under the Tender Offer at a price $3.95 per share for a total purchase price of $7.2 million, excluding fees and expenses related to the Tender Offer.
On February 24, 2020 the Company launched a second self-tender offer (the “Second Tender Offer”) to repurchase for cash up to 3,000,000 of shares at $3.25 a share, representing limited liability company interests of the Company, which was terminated on March 19, 2020 as a result of multiple conditions to the Self Tender Offer not having been satisfied.
During the three months ended December 31, 2020, the Company did not repurchase any of the Company's shares.
On February 19, 2020, the Company suspended its quarterly cash distributions program on outstanding shares.
Upon the securitization of Medalist Partners Corporate Finance CLO VI in February 2020, the Company received $13.7 million in cash from the CLO VI warehouse and recognized a gain of $1.0 million.
We had total restricted cash of $1.2 million comprised primarily of restricted cash at JMP Group Inc. related to the Company's letters of credit on leasing arrangements.
The timing of bonus compensation payments to our employees may significantly affect our cash position and liquidity from period to period. While our employees and managing directors are generally paid semi-monthly during the year, bonus compensation, which makes up a larger portion of total compensation, is generally paid once a year during the first two months of the following year. In the first two months of 2020, we paid out $26.9 million of cash bonuses for 2019, including employer payroll tax expense.
Because of the nature of our investment banking and sales and trading businesses, liquidity is important to us. Accordingly, we regularly monitor our liquidity position, including our cash and net capital positions. We believe that our available liquidity and current level of equity capital, combined with the funds anticipated to be provided by our operating activities, will be adequate to meet our liquidity and regulatory capital requirements for at least the next twelve months. If circumstances required it, we could improve our liquidity position by discontinuing repurchases of the Company’s common shares, halting cash distributions on our common shares and reducing cash bonus compensation paid.
JMP Securities, our wholly-owned subsidiary and a registered securities broker-dealer, is subject to the SEC’s Uniform Net Capital Rule (Rule 15c3-1), which requires the maintenance of minimum net capital, as defined, and requires that the ratio of aggregate indebtedness to net capital, both as defined, shall not exceed 15 to 1. JMP Securities had net capital of $42.3 million and $16.9 million, which were $40.6 million and $15.5 million in excess of the required net capital of $1.7 million and $1.4 million, at December 31, 2020 and 2019, respectively. JMP Securities’ ratio of aggregate indebtedness to net capital was 0.62 to 1 and 1.25 to 1 at December 31, 2020 and 2019, respectively.
A condensed table of cash flows for the years ended December 31, 2020 and 2019 is presented below.
|
(Dollars in thousands) |
Year Ended December 31, |
Change from 2019 to 2020 |
||||||||||||||
|
2020 |
2019 |
$ |
% |
|||||||||||||
|
Cash flows provided by (used in) operating activities |
$ | 27,068 | $ | (18,891 | ) | $ | 45,959 | 243.3 | % | |||||||
|
Cash flows provided by (used in) investing activities |
12,708 | (60,448 | ) | 73,156 | 121.0 | % | ||||||||||
|
Cash flows provided by (used in) financing activities |
2,039 | (2,552 | ) | 4,591 | 179.9 | % | ||||||||||
| Total cash flows | $ | 41,815 | $ | (81,891 | ) | $ | 123,706 | 544.2 | % | |||||||
Cash Flows for the year ended December 31, 2020
Cash increased by $41.8 million during the year ended December 31, 2020, as a result of cash used in operating, investing and financing activities.
Our operating activities provided $27.1 million of cash from the net loss of $7.8 million, adjusted for the cash provided by operating assets and liabilities of $35.8 million, and used by non-cash revenue and expense items of $0.9 million. The cash provided by operating assets and liabilities was primarily due to a decrease in marketable securities of $23.6 million, an increase in accrued compensation of $16.1 million, partially offset by a $6.0 million decrease in receivables.
Our investing activities provided $12.7 million of cash primarily due to $15.0 million from the sale of other investments, partially offset by the $2.0 million used to purchase other investments.
Our financing activities provided $2.0 million of cash primarily due to $3.8 million in proceeds from a Paycheck Protection Program loan, partially offset by $1.4 million in repurchase of bonds payable.
Cash Flows for the year ended December 31, 2019
Contractual Obligations
As of December 31, 2020, our aggregate minimum future commitment on our leases was $23.2 million. See Note 10 to the notes to the consolidated financial statements for more information.
As of December 31, 2020, $86.0 million of bonds payable were outstanding, of which $36.0 million carries interest at a rate of 6.875% per annum and is due in 2029 and the remaining $50.00 million carries interest at a rate of 7.25% per annum and is due in 2027. The bonds require quarterly payments of interest.
Off-Balance Sheet Arrangements
Unfunded commitments are agreements to lend to a borrower, provided that all conditions have been met. The Company had no material unfunded commitments to lend at both December 31, 2020 and 2019.
We had no other material off-balance sheet arrangements as of December 31, 2020. However, through indemnification provisions in our clearing agreements with our clearing broker, customer activities may expose us to off-balance sheet credit risk, which we seek to mitigate through customer screening and collateral requirements.
Critical Accounting Policies and Estimates
The preparation of our consolidated financial statements requires us to make estimates and assumptions that affect the reported amounts of assets and liabilities and of revenues and expenses during the reporting periods. We base our estimates and assumptions on historical experience and on various other factors that we believe are reasonable under the circumstances. The use of different estimates and assumptions could produce materially different results. For example, if factors such as those described under the caption Special Note About Forward-Looking Statements in our Annual Report cause actual events to differ from the assumptions we used in applying the accounting policies, our results of operations, financial condition and liquidity could be adversely affected.
Our significant accounting policies are summarized in Note 2 to our consolidated financial statements included elsewhere in this Form 10-K. On an ongoing basis, we evaluate our estimates and assumptions, particularly as they relate to accounting policies that we believe are most important to the presentation of our financial condition and results of operations. We regard an accounting estimate or assumption to be most important to the presentation of our financial condition and results of operations where:
|
• |
the nature of the estimates or assumptions is material due to the level of subjectivity and judgment necessary to account for highly uncertain matters or the susceptibility of such matters to change; and |
|
• |
the impact of the estimates or assumptions on our financial condition or operating performance is material. |
Using the foregoing criteria, we consider the following to be our critical accounting policies:
Valuation of Financial Instruments
The Company measures fair value in accordance with GAAP and expands disclosures with respect to fair value measurements. The accounting principles related to fair value measurement apply to all financial instruments that are being measured and reported on a fair value basis. This includes those items currently reported in marketable securities owned, at fair value, other investments and marketable securities sold, not yet purchased, at fair value on the Consolidated Statements of Financial Condition. Fair value is defined as the price that would be received to sell an asset or paid to transfer a liability in an orderly transaction between market participants at the measurement date.
Most of our financial instruments are recorded at fair value or amounts that approximate fair value. Marketable securities owned, other investments, including warrant positions and investments in partnerships in which HCS is the general partner, and marketable securities sold, but not yet purchased, are stated at fair value, with related changes in unrealized appreciation or depreciation reflected in the line item Principal transactions in the accompanying Consolidated Statements of Operations.
Fair value of our financial instruments is generally obtained from quoted market prices, third-party pricing services, or alternative pricing methodologies that we believe offer reasonable levels of price transparency. Valuations obtained from pricing services are considered reflective of executable prices. Data obtained from multiple sources are compared for consistency and reasonableness. To the extent that certain financial instruments trade infrequently or are non-marketable securities and, therefore, do not have readily determinable fair values, we estimate the fair value of these instruments using various pricing models and the information available to us that we deem most relevant. Among the factors considered by us in determining the fair value of financial instruments are discounted anticipated cash flows, the cost, terms and liquidity of the instrument, the financial condition, operating results and credit ratings of the issuer or underlying company, the quoted market price of publicly traded securities with similar duration and yield, the Black-Scholes Options Valuation methodology and other factors generally pertinent to the valuation of financial instruments.
Marketable securities owned and securities sold, but not yet purchased, consist of U.S. listed and over-the-counter equity securities. Other investments include investments in private investment funds managed by us or our affiliates, as well as cash paid for a subscription in a private investment fund managed by a third party. Such investments held by non-broker-dealer entities are accounted for under the equity method based on our share of the earnings (or losses) of the investee. The financial position and operating results of the private investment funds are generally determined on an estimated fair value basis. Generally, securities are valued (i) at their last published sale price if they are listed on an established exchange or (ii) if last sales prices are not published, at the highest closing “bid” price (for securities held “long”) and the lowest closing “asked” price (for “short” positions) as recorded by the composite tape system or such principal exchange, as the case may be. Where the general partner determines that market prices or quotations do not fairly represent the value of a security in the investment fund’s portfolio (for example, if a security is a restricted security of a class that is publicly traded) the general partner may assign a different value. The general partner will determine the estimated fair value of any assets that are not publicly traded.
The Company estimates the fair value of its investments in private investment funds managed by third parties using the net asset value per share of those funds, as a practical expedient.
The Company uses the fair value option which allows an entity to report selected financial assets and financial liabilities at fair value. The fair value of those assets and liabilities for which the fair value option has been chosen is reflected on the face of the balance sheet. Subsequent changes in fair value are recorded in the Consolidated Statements of Operations.
CLO Debt Securities
Investments in CLO debt securities are classified and accounted for according to their purpose and holding period. As of December 31, 2020 and 2019, all of the Company’s investments in CLO debt securities are classified as available-for-sale. Available-for-sale securities may be sold before maturity and are reported at fair value with unrealized gains and losses, net of taxes, reported as a component of other comprehensive income (“OCI”).
Interest income on CLO debt securities is recognized in accordance with ASC 835, using the effective yield method. The effective yield on these securities is based on the projected cash flows from each security, which is estimated based on the Company’s observation of the then current information and events, where applicable, and will include assumptions related to interest rates, prepayment rates and the timing and amount of credit losses. On at least a quarterly basis, the Company reviews and, if appropriate, makes adjustments to its cash flow projections based on input and analysis received from external sources, internal models, and its judgment about interest rates, prepayment rates, the timing and amount of credit losses, and other factors. Changes in cash flows from those originally projected, or from those estimated at the last evaluation, may result in a prospective change in the yield/interest income recognized on such securities. Realized gains and losses on the sale of debt securities are determined using the specific identification method and recognized in current period earnings in revenues from principal transactions.
The Company evaluates the available-for-sale CLO debt securities for impairment quarterly. As part of the evaluation, the Company obtains the new cash flow projections for the CLO debt securities at period end and determines, based on those cash flows and other current information, if there has been a favorable or adverse change in the cash flows expected to be collected as compared to the projected cash flows from the prior period. An adverse change in cash flows is determined in the context of both the timing and the amount of the cash flows. An impairment would be recorded if the net present value of the cash flows of the investment is below the amortized cost basis of the investment and the Company does not expect to recover the amortized cost basis before the security is expected to be sold or the security matures, whichever comes first. Should the Company determine that there is an impairment, the amount of the impairment is recognized in revenues from principal transactions. The Company recorded $21.7 million of impairment on CLO debt securities for the year ended December 31, 2020 and $4.2 million for the year ended December 31, 2019.
Asset Management Investment Partnerships
Investments in partnerships include our general partnership and limited partnership interests in investment partnerships, managed by our asset management subsidiaries. Such investments are accounted for under the equity method based on our proportionate share of the earnings (or losses) of the investment partnership or under the fair value option using the net asset value per share of those funds, as a practical expedient. Under the fair value option, these interests are carried at estimated fair value based on our capital accounts in the underlying partnerships. The assets of the investment partnerships consist primarily of investments in marketable and non-marketable securities, real estate and real estate-related enterprises and corporate loans. The underlying investments held by such partnerships are valued based on quoted market prices or estimated fair value if there is no public market for such assets. Such estimates of fair value of the partnerships’ non-marketable investments are ultimately determined by our asset management subsidiaries in their capacity as general partner. Due to the inherent uncertainty of valuation, fair values of these non-marketable investments may differ from the values that would have been used had a ready market existed for these investments, and the differences could be material. Adjustments to carrying value are made, as required by GAAP, if there are third-party transactions evidencing a change in value. Downward adjustments are also made, in the absence of third-party transactions, if the general partner determines that the expected realizable value of the investment is less than the carrying value.
We earn base management fees from the investment partnerships that we manage generally based on the net assets of the underlying partnerships. In addition, we are entitled to allocations of the appreciation and depreciation in the fair value of the underlying partnerships from our general partnership interests in the partnerships. Such allocations are based on the terms of the respective partnership agreements.
We are also entitled to receive incentive fee allocations from the investment partnerships when the return exceeds a specified high-water mark or hurdle rate over a defined performance period. Incentive fees are recorded after the quarterly or annual investment performance period is complete and may vary depending on the terms of the fee structure applicable to an investor.
Legal and Other Contingent Liabilities
We are involved in various pending and potential claims, arbitrations, legal actions, investigations and proceedings related to our business from time to time. Some of these matters involve claims for substantial amounts, including claims for punitive and other special damages. The number of claims, legal actions, investigations and regulatory proceedings against financial institutions like us has been increasing in recent years. We have, after consultation with counsel and consideration of facts currently known by management, recorded estimated losses in accordance with authoritative guidance under GAAP on contingencies, to the extent that a claim may result in a probable loss and the amount of the loss can be reasonably estimated. The determination of these reserve amounts requires significant judgment on the part of management and our ultimate liabilities may be materially different. In making these determinations, management considers many factors, including, but not limited to, the loss and damages sought by the plaintiff or claimant, the basis and validity of the claim, the likelihood of successful defense against the claim and the potential for, and magnitude of, damages or settlements from such pending and potential claims, legal actions, arbitrations, investigations and proceedings, and fines and penalties or orders from regulatory agencies.
If a potential adverse contingency should become probable or resolved for an amount in excess of the established reserves during any period, our results of operations in that period and, in some cases, succeeding periods, could be adversely affected.
Income Taxes
The Company recognizes deferred tax assets and liabilities in accordance with ASC 740, Income Taxes, and are determined based upon the temporary differences between the financial reporting and tax basis of the Company’s assets and liabilities using the tax rates and laws in effect when the differences are expected to reverse. Valuation allowances are established when necessary to reduce the deferred tax assets when it is more likely than not that a portion or all of the deferred tax assets will not be realized.
The Company records uncertain tax positions using a two-step process: (i) the Company determines whether it is more likely than not that each tax position will be sustained on the basis of the technical merits of the position; and (ii) for those tax positions that meet the more-likely-than not recognition threshold, the Company recognizes the largest amount of tax benefit that is more than fifty percent likely to be realized upon ultimate settlement with the related tax authority.
The Company’s policy for recording interest and penalties associated with the tax audits or unrecognized tax benefits, if any, is to record such items as a component of income tax.
Recent Accounting Pronouncements
For a description of recent accounting pronouncements affecting the Company, refer to Note 3 in the accompanying consolidated financial statements.
|
Quantitative and Qualitative Disclosures About Market Risk |
Not required as a Smaller Reporting Company.
|
Financial Statements and Supplementary Data |
REPORT OF INDEPENDENT REGISTERED PUBLIC ACCOUNTING FIRM
To the Shareholders and Board of Directors of
JMP Group LLC
Opinion on the Financial Statements
We have audited the accompanying consolidated statement of financial condition of JMP Group LLC (the “Company”) as of December 31, 2020, and the related consolidated statements of operations, of comprehensive income, of changes in equity and of cash flows for the year then ended, and the related notes (collectively referred to as the “financial statements”). In our opinion, the financial statements present fairly, in all material respects, the financial position of the Company as of December 31, 2020, and the results of its operations and its cash flows for the year then ended in conformity with accounting principles generally accepted in the United States of America.
Basis for Opinion
These consolidated financial statements are the responsibility of the Company's management. Our responsibility is to express an opinion on the Company's financial statements based on our audit. We are a public accounting firm registered with the Public Company Accounting Oversight Board (United States) ("PCAOB") and are required to be independent with respect to the Company in accordance with the U.S. federal securities laws and the applicable rules and regulations of the Securities and Exchange Commission and the PCAOB.
We conducted our audit in accordance with the standards of the PCAOB. Those standards require that we plan and perform the audit to obtain reasonable assurance about whether the consolidated financial statements are free of material misstatement, whether due to error or fraud. The Company is not required to have, nor were we engaged to perform, an audit of its internal control over financial reporting. As part of our audit we are required to obtain an understanding of internal control over financial reporting but not for the purpose of expressing an opinion on the effectiveness of the Company's internal control over financial reporting. Accordingly, we express no such opinion.
Our audit included performing procedures to assess the risks of material misstatement of the consolidated financial statements, whether due to error or fraud, and performing procedures that respond to those risks. Such procedures included examining, on a test basis, evidence regarding the amounts and disclosures in the financial statements. Our audit also included evaluating the accounting principles used and significant estimates made by management, as well as evaluating the overall presentation of the financial statements. We believe that our audit provides a reasonable basis for our opinion.
Critical Audit Matter
The critical audit matter communicated below is a matter arising from the current period audit of the financial statements that was communicated or required to be communicated to the audit committee and that: (1) related to accounts or disclosures that are material to the financial statements and (2) involved our especially challenging, subjective, or complex judgments. The communication of the critical audit matter does not alter in any way our opinion on the financial statements, taken as a whole, and we are not, by communicating the critical audit matter below, providing a separate opinion on the critical audit matter or on the accounts or disclosures to which they relate.
Valuation of Investments – Level 3 Investments in Marketable Securities and Equity Investments
As described in Note 4 to the consolidated financial statements, approximately 22% of the Company’s $241 million total assets as of December 31, 2020 represents investments in level 3 Marketable Securities Owned and Equity Investments. The fair values of these investments, as disclosed by management, are determined in good faith by management.
The principal considerations for our determination that performing procedures relating to the valuation of level 3 investments in marketable securities and other investments is a critical audit matter are the significant judgment involved by management in determining the fair value of these level 3 investments, including the use of various valuation techniques and significant unobservable inputs, which in turn led to a high degree of auditor judgment, subjectivity, and effort in performing audit procedures and evaluating the audit evidence obtained relating to the valuation techniques and significant unobservable inputs.
Addressing the matter involved performing procedures and evaluating audit evidence in connection with forming our overall opinion on the consolidated financial statements and financial highlights. Our principle audit procedures included, among others:
(i) testing the completeness and mathematical accuracy of management’s valuations, including evaluating the appropriateness of management’s methodologies, evaluating the reasonableness of assumptions and significant unobservable inputs, and testing data inputs for completeness and accuracy and;
(ii) involving professionals with specialized skill and knowledge to assist in the assessment of the fair values, including reviewing management’s valuation methodologies and assumptions utilized in developing the estimate, or deriving an independent valuation and evaluating the reasonableness of management’s conclusions.
/s/ Marcum LLP
San Francisco, California
March 29, 2021
We have served as the Company’s auditor since 2020.
Report of Independent Registered Public Accounting Firm
To the Board of Directors and Shareholders of JMP Group LLC:
Opinion on the Financial Statements
We have audited the consolidated statement of financial condition of JMP Group LLC and its subsidiaries (the “Company”) as of December 31, 2019, and the related consolidated statements of operations, of comprehensive income, of changes in equity and of cash flows for the year ended December 31, 2019, including the related notes (collectively referred to as the “consolidated financial statements”). In our opinion, the consolidated financial statements present fairly, in all material respects, the financial position of the Company as of December 31, 2019, and the results of its operations and its cash flows for the year ended December 31, 2019 in conformity with accounting principles generally accepted in the United States of America.
Basis for Opinion
These consolidated financial statements are the responsibility of the Company's management. Our responsibility is to express an opinion on the Company’s consolidated financial statements based on our audits. We are a public accounting firm registered with the Public Company Accounting Oversight Board (United States) (PCAOB) and are required to be independent with respect to the Company in accordance with the U.S. federal securities laws and the applicable rules and regulations of the Securities and Exchange Commission and the PCAOB.
We conducted our audits of these consolidated financial statements in accordance with the standards of the PCAOB. Those standards require that we plan and perform the audit to obtain reasonable assurance about whether the consolidated financial statements are free of material misstatement, whether due to error or fraud.
Our audits included performing procedures to assess the risks of material misstatement of the consolidated financial statements, whether due to error or fraud, and performing procedures that respond to those risks. Such procedures included examining, on a test basis, evidence regarding the amounts and disclosures in the consolidated financial statements. Our audits also included evaluating the accounting principles used and significant estimates made by management, as well as evaluating the overall presentation of the consolidated financial statements. We believe that our audits provide a reasonable basis for our opinion.
/s/ PricewaterhouseCoopers LLP
San Francisco, California
March 30, 2020
We served as the Company's auditor from 2001 to 2020.
Consolidated Statements of Financial Condition
(Dollars in thousands, except per share data)
|
As of December 31, |
||||||||
|
2020 |
2019 |
|||||||
|
Assets |
||||||||
|
Cash and cash equivalents |
$ | 91,444 | $ | 49,630 | ||||
|
Restricted cash |
1,287 | 1,287 | ||||||
|
Investment banking fees receivable |
13,676 | 9,066 | ||||||
|
Marketable securities owned (includes $5,696 and $0 pledged as collateral at December 31, 2020 and 2019, respectively) |
55,494 | 73,101 | ||||||
|
Other investments (includes $17,611 and $14,206 measured at fair value at December 31, 2020 and 2019, respectively) |
26,821 | 35,309 | ||||||
|
Loans held for investment, net of allowance for loan losses |
994 | 1,210 | ||||||
|
Interest receivable |
336 | 502 | ||||||
|
Fixed assets, net |
3,118 | 4,267 | ||||||
| Operating lease right-of-use asset | 16,244 | 19,632 | ||||||
| Deferred tax asset | 17,895 | - | ||||||
|
Other assets |
14,022 | 36,253 | ||||||
|
Total assets |
$ | 241,331 | $ | 230,257 | ||||
|
Liabilities and Equity |
||||||||
|
Liabilities: |
||||||||
|
Marketable securities sold, but not yet purchased, at fair value |
$ | - | $ | 3,855 | ||||
|
Accrued compensation |
46,353 | 30,253 | ||||||
|
Interest payable |
706 | 520 | ||||||
|
Note payable |
10,610 | 6,812 | ||||||
|
Bond payable (net of debt issuance costs of $2,953 and $3,416 at December 31, 2020 and 2019, respectively) |
80,912 | 82,584 | ||||||
| Operating lease liability | 21,130 | 25,394 | ||||||
| Deferred tax liability | 8,482 | - | ||||||
|
Other liabilities |
10,730 | 19,478 | ||||||
|
Total liabilities |
178,923 | 168,896 | ||||||
|
Commitments and Contingencies (Note 17) |
||||||||
|
JMP Group LLC Shareholders' Equity |
||||||||
|
Common shares, $0.001 par value, 100,000,000 shares authorized; 22,797,092 shares issued at December 31, 2020 and 2019; 19,789,821 and 19,509,349 shares outstanding at December 31, 2020 and 2019, respectively |
23 | 23 | ||||||
|
Additional paid-in capital |
134,065 | 133,894 | ||||||
|
Treasury shares at cost, 3,007,271 and 3,287,743 shares at December 31, 2020 and 2019, respectively |
(13,478 | ) | (14,872 | ) | ||||
| Accumulated other comprehensive loss | (369 | ) | (4,769 | ) | ||||
|
Accumulated deficit |
(57,301 | ) | (52,588 | ) | ||||
|
Total JMP Group LLC shareholders' equity |
62,940 | 61,688 | ||||||
|
Non-controlling Interest |
(532 | ) | (327 | ) | ||||
|
Total equity |
62,408 | 61,361 | ||||||
|
Total liabilities and equity |
$ | 241,331 | $ | 230,257 | ||||
See accompanying notes to consolidated financial statements.
Consolidated Statements of Operations
(In thousands, except per share data)
|
Year Ended December 31, |
||||||||
|
2020 |
2019 |
|||||||
|
Revenues |
||||||||
|
Investment banking |
$ | 100,384 | $ | 65,716 | ||||
|
Brokerage |
18,926 | 17,628 | ||||||
|
Asset management fees |
8,320 | 7,427 | ||||||
|
Principal transactions |
(18,528 | ) | 1,344 | |||||
|
Loss on sale, payoff and mark-to-market of loans |
- | (38 | ) | |||||
|
Net dividend income |
400 | 1,184 | ||||||
|
Other income |
3,735 | 2,373 | ||||||
|
Non-interest revenues |
113,237 | 95,634 | ||||||
|
Interest income |
8,654 | 21,801 | ||||||
|
Interest expense |
(6,977 | ) | (16,458 | ) | ||||
|
Net interest income |
1,677 | 5,343 | ||||||
|
Gain (loss) on repurchase, reissuance or early retirement of debt |
697 | (458 | ) | |||||
|
Provision for loan losses |
(112 | ) | (438 | ) | ||||
|
Total net revenues after provision for loan losses |
115,499 | 100,081 | ||||||
|
Non-interest expenses |
||||||||
|
Compensation and benefits |
95,138 | 77,314 | ||||||
|
Administration |
6,590 | 9,387 | ||||||
|
Brokerage, clearing and exchange fees |
2,610 | 2,706 | ||||||
|
Travel and business development |
1,252 | 5,240 | ||||||
|
Managed deal expenses |
3,605 | 3,136 | ||||||
|
Communication and technology |
4,394 | 4,390 | ||||||
|
Occupancy |
4,785 | 5,229 | ||||||
|
Professional fees |
3,658 | 4,359 | ||||||
|
Depreciation |
1,500 | 1,203 | ||||||
|
Other |
42 | 500 | ||||||
|
Total non-interest expenses |
123,574 | 113,464 | ||||||
|
Net loss before income taxes |
(8,075 | ) | (13,383 | ) | ||||
|
Income tax expense (benefit) |
(3,284 | ) | (6,827 | ) | ||||
|
Net loss |
(4,791 | ) | (6,556 | ) | ||||
|
Less: Net loss attributable to non-controlling interest |
(94 | ) | (7 | ) | ||||
|
Net loss attributable to JMP Group LLC |
$ | (4,697 | ) | $ | (6,549 | ) | ||
|
Net loss attributable to JMP Group LLC per common share: |
||||||||
|
Basic |
$ | (0.24 | ) | $ | (0.32 | ) | ||
|
Diluted |
$ | (0.24 | ) | $ | (0.32 | ) | ||
|
Weighted average common shares outstanding: |
||||||||
|
Basic |
19,613 | 20,189 | ||||||
|
Diluted |
19,613 | 20,189 | ||||||
See accompanying notes to consolidated financial statements.
Consolidated Statements of Comprehensive Income
(In thousands)
|
Year Ended |
||||||||
|
2020 |
2019 |
|||||||
|
Net income (loss) |
$ | (4,791 | ) | $ | (6,556 | ) | ||
| Other comprehensive income (loss): | ||||||||
| Net unrealized gains (losses) on available-for-sale securities, during the period, net of income tax provision (benefit) of ($4,165) and ($2,882) | (11,517 | ) | (7,843 | ) | ||||
| Less: Reclassification adjustments for net (gains) losses on available-for-sale securities, net of income tax provision (benefit) of $5,784 and $1,130 | 15,917 | 3,074 | ||||||
| Net other comprehensive income (loss), net of income tax provision (benefit) of $1,619 and ($1,752) | 4,400 | (4,769 | ) | |||||
|
Comprehensive income (loss) |
(391 | ) | (11,325 | ) | ||||
|
Less: Comprehensive income (loss) attributable to non-controlling interest |
(94 | ) | (7 | ) | ||||
|
Comprehensive income (loss) attributable to JMP Group LLC |
$ | (297 | ) | $ | (11,318 | ) | ||
See accompanying notes to consolidated financial statements.
Consolidated Statements of Changes in Equity
(In thousands)
|
JMP Group LLC's Equity |
||||||||||||||||||||||||||||||||
|
Common Shares |
Treasury |
Additional Paid-In |
Accumulated |
Accumulated Other Comprehensive |
Non-controlling |
|||||||||||||||||||||||||||
|
Shares |
Amount |
Shares |
Capital |
Deficit |
Loss |
Interest |
Total Equity |
|||||||||||||||||||||||||
|
Balance, December 31, 2019 |
22,797 | $ | 23 | $ | (14,872 | ) | $ | 133,894 | $ | (52,588 | ) | $ | (4,769 | ) | $ | (327 | ) | $ | 61,361 | |||||||||||||
|
Net income (loss) |
- | - | - | (4,697 | ) | - | (94 | ) | (4,791 | ) | ||||||||||||||||||||||
|
Additional paid-in capital - share-based compensation |
- | - | - | 171 | - | - | - | 171 | ||||||||||||||||||||||||
|
Distribution equivalents declared on restricted share units |
- | - | - | - | (16 | ) | - | - | (16 | ) | ||||||||||||||||||||||
|
Purchases of shares of common shares for treasury |
- | - | 1,394 | - | - | - | - | 1,394 | ||||||||||||||||||||||||
|
Distributions to non-controlling interest holders |
- | - | - | - | - | - | (111 | ) | (111 | ) | ||||||||||||||||||||||
|
Unrealized gain (loss) on available-for-sale securities, net of tax |
- | - | - | - | - | 4,400 | - | 4,400 | ||||||||||||||||||||||||
|
Balance, December 31, 2020 |
22,797 | $ | 23 | $ | (13,478 | ) | $ | 134,065 | $ | (57,301 | ) | $ | (369 | ) | $ | (532 | ) | $ | 62,409 | |||||||||||||
|
JMP Group LLC's Equity |
||||||||||||||||||||||||||||||||
|
Common Shares |
Treasury |
Additional Paid-In |
Accumulated |
Accumulated Other Comprehensive |
Non-controlling |
|||||||||||||||||||||||||||
|
Shares |
Amount |
Shares |
Capital |
Deficit |
Loss |
Interest |
Total Equity |
|||||||||||||||||||||||||
|
Balance, December 31, 2018 |
22,780 | $ | 23 | $ | (7,932 | ) | $ | 134,129 | $ | (42,513 | ) | $ | - | $ | 13,499 | $ | 97,206 | |||||||||||||||
|
Net income (loss) |
- | - | - | (6,549 | ) | - | (7 | ) | (6,556 | ) | ||||||||||||||||||||||
|
Additional paid-in capital - share-based compensation |
- | - | - | (216 | ) | - | - | - | (216 | ) | ||||||||||||||||||||||
|
Distributions and distribution equivalents declared on common shares and restricted share units (1) |
- | - | - | - | (3,526 | ) | - | - | (3,526 | ) | ||||||||||||||||||||||
|
Purchases of shares of common shares for treasury |
- | - | (9,134 | ) | - | - | - | - | (9,134 | ) | ||||||||||||||||||||||
|
Reissuance of shares of common shares from treasury |
- | - | 2,194 | (112 | ) | - | - | - | 2,082 | |||||||||||||||||||||||
| Common shares issued | 17 | - | 93 | - | - | 93 | ||||||||||||||||||||||||||
|
Distributions to non-controlling interest holders |
- | - | - | - | - | - | (977 | ) | (977 | ) | ||||||||||||||||||||||
|
Derecognition of non-controlling interest due to deconsolidation |
(12,842 | ) | (12,842 | ) | ||||||||||||||||||||||||||||
|
Unrealized gain (loss) on available-for-sale securities, net of tax |
- | - | - | - | - | (4,769 | ) | - | (4,769 | ) | ||||||||||||||||||||||
|
Balance, December 31, 2019 |
22,797 | $ | 23 | $ | (14,872 | ) | $ | 133,894 | $ | (52,588 | ) | $ | (4,769 | ) | $ | (327 | ) | $ | 61,361 | |||||||||||||
| (1) | $3.5 million of distributions were dividends paid to shareholders and $0.1 million of distributions were dividend equivalents paid on restricted share units |
See accompanying notes to consolidated financial statements.
Consolidated Statements of Cash Flows
(In thousands)
|
Year Ended December 31, |
||||||||
|
2020 |
2019 |
|||||||
|
Cash flows from operating activities: |
||||||||
|
Net loss |
$ | (4,791 | ) | $ | (6,556 | ) | ||
|
Adjustments to reconcile net loss to net cash provided by (used in) operating activities: |
||||||||
|
Provision for loan losses |
112 | 438 | ||||||
|
Loss on sale and payoff of loans and mark-to-market of loans |
- | 38 | ||||||
|
(Gain) loss on repurchase, reissuance or early retirement of debt |
(697 | ) | 458 | |||||
|
Change in other investments: |
||||||||
|
Income from investments in equity method investees |
(1,183 | ) | (1,557 | ) | ||||
|
Gain on other investments |
(3,319 | ) | (1,781 | ) | ||||
|
Depreciation and amortization |
1,196 | 1,659 | ||||||
|
Share-based compensation expense |
1,728 | 1,994 | ||||||
|
Gain on deconsolidation |
- | (3,520 | ) | |||||
|
Distributions of investment income from equity method investments |
1,300 | 1,558 | ||||||
| Deferred income tax expense (benefit) | 3,348 | - | ||||||
| Other, net | 47 | 114 | ||||||
|
Net change in operating assets and liabilities: |
||||||||
|
Decrease (increase) in interest receivable |
166 | (5,029 | ) | |||||
|
Increase in receivables |
(4,610 | ) | (2,419 | ) | ||||
|
Decrease in marketable securities |
23,632 | 16,131 | ||||||
|
Increase in other assets |
(2,189 | ) | (9,479 | ) | ||||
|
Decrease in marketable securities sold, but not yet purchased |
(3,855 | ) | (771 | ) | ||||
|
Increase (decrease) in interest payable |
186 | (4,063 | ) | |||||
|
Increase (decrease) in accrued compensation |
16,100 | (11,089 | ) | |||||
|
Decrease (increase) in other liabilities |
(103 | ) | 4,983 | |||||
|
Net cash provided by (used in) operating activities |
27,068 | (18,891 | ) | |||||
|
Cash flows from investing activities: |
||||||||
|
Purchases of fixed assets |
(355 | ) | (1,388 | ) | ||||
|
Purchases of other investments |
(2,042 | ) | (12,604 | ) | ||||
|
Sales or distributions from other investments |
14,979 | 10,400 | ||||||
|
Funding of loans collateralizing asset-backed securities issued |
- | (35,153 | ) | |||||
|
Funding of loans held for investment |
- | (25,679 | ) | |||||
|
Sale, payoff and principal receipts of loans collateralizing asset-backed securities issued |
- | 23,806 | ||||||
|
Sale, payoff and principal receipts on loans held for investment |
126 | 7,941 | ||||||
| Net decrease in cash and restricted cash due to deconsolidation of subsidiaries | - | (27,771 | ) | |||||
|
Net cash provided by (used in) investing activities |
12,708 | (60,448 | ) | |||||
See accompanying notes to consolidated financial statements.
JMP Group LLC
Consolidated Statements of Cash Flows - (Continued)
(In thousands)
|
Year Ended December 31, |
||||||||
|
2020 |
2019 |
|||||||
|
Cash flows from financing activities: |
||||||||
|
Repayment of bonds payable |
- | (35,925 | ) | |||||
| Repurchase of bonds payable | (1,361 | ) | - | |||||
|
Proceeds from bond issuance |
- | 36,000 | ||||||
|
Proceeds from drawdowns on line of credit and other borrowings |
3,798 | 16,583 | ||||||
| Repayment of note payable | - | (10,600 | ) | |||||
|
Proceeds from drawdowns on CLO warehouse facilities |
- | 7,750 | ||||||
|
Payment of debt issuance costs |
- | (1,887 | ) | |||||
|
Repayment of asset-backed securities issued |
- | (801 | ) | |||||
|
Distributions and distribution equivalents paid on RSUs |
(17 | ) | (3,526 | ) | ||||
|
Purchase of common shares for treasury |
- | (8,615 | ) | |||||
|
Distributions to non-controlling interest shareholders |
(111 | ) | (977 | ) | ||||
|
Employee taxes paid on shares withheld for tax-withholding purposes |
(270 | ) | (554 | ) | ||||
|
Net cash provided by (used in) financing activities |
2,039 | (2,552 | ) | |||||
|
Net increase (decrease) in cash, cash equivalents, and restricted cash |
41,815 | (81,891 | ) | |||||
|
Cash, cash equivalents and restricted cash, beginning of period |
50,917 | 132,808 | ||||||
|
Cash, cash equivalents and restricted cash, end of period |
$ | 92,732 | $ | 50,917 | ||||
|
Supplemental disclosures of cash flow information: |
||||||||
|
Cash paid during the period for interest |
$ | 6,978 | $ | 20,521 | ||||
|
Cash (received) during the period for taxes, net of refunds |
$ | (5,218 | ) | $ | (2,485 | ) | ||
|
Non-cash investing and financing activities: |
||||||||
|
Reissuance of common shares from treasury related to vesting of restricted share units |
$ | 1,664 | $ | 2,194 | ||||
|
Acquisition of equity securities in restructuring of loans |
$ | - | $ | 736 | ||||
| Leasehold improvement directly paid for by the lessor | $ | - | $ | 1,890 | ||||
| Initial recognition of operating lease right-of-use assets | $ | - | $ | 23,604 | ||||
| Initial recognition of operating lease right-of-use liabilities | $ | - | $ | 29,278 | ||||
| Carrying value of noncash assets derecognized on deconsolidation of subsidiaries | $ | - | $ | 1,226,848 | ||||
| Carrying value of noncash liabilities derecognized on deconsolidation of subsidiaries | $ | - | $ | 1,161,933 | ||||
| Carrying value of non-controlling interest derecognized on deconsolidation of subsidiaries | $ | - | $ | 12,842 | ||||
| Fair value of marketable securities recognized on deconsolidation of subsidiaries | $ | - | $ | 76,879 | ||||
| Fair value of other investments recognized on deconsolidation of subsidiaries | $ | - | $ | 7,516 | ||||
See accompanying notes to consolidated financial statements.
Notes to Consolidated Financial Statements
1. Organization and Description of Business
JMP Group LLC, together with its subsidiaries (collectively, the “Company”), is a diversified capital markets firm headquartered in San Francisco, California. The Company conducts its investment banking and institutional brokerage business through JMP Securities LLC (“JMP Securities”) and its asset management business through Harvest Capital Strategies LLC (“HCS”), HCAP Advisors LLC (“HCAP Advisors”), JMP Asset Management LLC (“JMPAM”) and JMP Credit Advisors LLC (“JMPCA”) (through March 19, 2019). The Company conducts certain principal investment transactions through JMP Investment Holdings LLC (“JMP Investment Holdings”) and other subsidiaries. The above entities, other than HCAP Advisors, are wholly-owned subsidiaries. JMP Securities is a U.S. registered broker-dealer under the Securities Exchange Act of 1934, as amended (the “Exchange Act”), and is a member of the Financial Industry Regulatory Authority (“FINRA”). JMP Securities operates as an introducing broker and does not hold funds or securities for, or owe any money or securities to, customers and does not carry accounts for customers. All customer transactions are cleared through another broker-dealer on a fully disclosed basis. HCS is a registered investment advisor under the Investment Advisers Act of 1940, as amended, and provides investment management services for sophisticated investors in investment partnerships and other entities managed by HCS. HCAP Advisors provides investment advisory services to Harvest Capital Credit Corporation (“HCC”), a publicly-traded business development company. JMPAM currently manages two fund strategies: one that invests in real estate and real estate-related enterprises and another that provides credit to small and midsized private companies. JMPCA is an asset management platform that underwrites and manages investments in senior secured debt. The Company completed a Reorganization Transaction in January 2015 pursuant to which JMP Group Inc. became a wholly-owned subsidiary of JMP Group LLC (the “Reorganization Transaction”). The Company entered into a Contribution Agreement in November 2017 pursuant to which JMP Group Inc. became a wholly-owned subsidiary of JMP Investment Holdings, which is a wholly-owned subsidiary of JMP Group LLC.
Recent Transactions
On January 4, 2021, the Company announced that JMP Group Inc. has given notice of its intention to redeem $10.0 million principal amount (400,000 Units) of the 2027 Notes which was completed on February 4, 2021 (the “Redemption Date”). As of January 4, 2021, $50.0 million in aggregate principal amount of the 2027 Notes were outstanding. The redemption is being made pursuant to the terms of the 2027 Notes and the indenture governing the 2027 Notes. The redemption price per 2027 Note will be $25 plus accrued and unpaid interest up to, but excluding, the Redemption Date. The redeemed 2027 Notes will be cancelled and not subject to reissuance.
On December 23, 2020, HCC and Portman Ridge Finance Corporation (“PTMN”) announced that they have entered into a definitive agreement under which HCC will merge with and into PTMN, a business development company managed by Sierra Crest Investment Management LLC (“Sierra Crest”), an affiliate of BC Partners Advisors L.P. The parties currently expect the transaction to be completed in the second calendar quarter of 2021. The Company’s partially-owned subsidiary HCAP Advisors provides investment advisory services to HCC. In addition, the Company had investments in HCC common stock of $7.5 million as of December 31, 2020. In connection with the above transaction, HCC stockholders will receive aggregate consideration equal to HCC’s net asset value at closing. This consideration will be funded using PTMN shares (valued at 100% of PTMN’s net asset value per share at the time of closing of the transaction) and, to the extent the required number of PTMN shares exceeds 19.9% of the issued and outstanding shares of PTMN common stock immediately prior to the transaction closing, cash consideration in the amount of such excess. As described below, HCAP stockholders will have an opportunity, subject to certain limitations, to elect to receive either cash or PTMN shares in consideration for their HCAP shares. Additionally, all HCAP stockholders will receive an additional cash payment from Sierra Crest of $2.15 million in the aggregate, or approximately $0.36 per share.
Deconsolidation
On January 17, 2019, the non-call period of JMP Credit Advisors CLO III(R) Ltd. (“CLO III”) expired, which resulted in a change in the entity with the control over the most significant activities of the variable interest entity (“VIE”). During the non-call period the Company concluded that it was the primary beneficiary of CLO III through its combination of control over the manager and its economic interest in CLO III. When the non-call period expired, holders of a majority of the subordinated notes could refinance or liquidate the CLO and the Company determined this to be the most significant activity. The expiration of the non-call period resulted in the Company losing control over the most significant activity of CLO III as it cannot unilaterally direct this activity. The Company deconsolidated CLO III as of January 17, 2019. The Company continues to hold approximately 47% of the outstanding subordinated notes of CLO III and accounts for its ownership of the CLO III subordinated notes as an investment in a debt security. The Company recognized a gain of $1.6 million as revenue from principal transactions on the deconsolidation of CLO III in March 2019.
On March 19, 2019, the Company sold a 50.1% equity interest in JMPCA to Medalist Partners LP (“Medalist”), an alternative asset management firm specializing in structured credit and asset-backed lending, and a 4.9% interest to management employees of JMPCA. The Company retained 45.0% of the equity interest in JMPCA. The sale of JMPCA was considered a reconsideration event as defined in Accounting Standard Codification (“ASC”) 810, Consolidation, which requires a new consolidation analysis, and the Company determined that JMPCA is a VIE after the transaction date. The Company determined that it was not the primary beneficiary of JMPCA as the Company is not the party with the power to direct the most significant activities of JMPCA. As the Company determined that it is not the primary beneficiary, the Company deconsolidated JMPCA as of the date of sale. As the Company retained 45.0% of the equity interest of JMPCA and has significant influence, the Company has determined that it is required to account for its retained interest as an equity method investment, however the Company has made the election to apply the fair value option to this investment. The Company received a cash payment of $0.3 million in consideration for the limited liability company interest sold and recorded a gain of $3.4 million on deconsolidation as revenue from principal transactions. The Company will receive a portion of the subordinated management fees from the CLOs JMPCA managed as of the date of the sale. After the sale, JMPCA was renamed Medalist Partners Corporate Finance LLC (“MPCF”).
The sale of JMPCA also required Medalist to provide additional capital to purchase an equity interest in JMP Credit Advisors Long-Term Warehouse Ltd (“CLO VI”) to finance the acquisition of broadly syndicated corporate loans. On March 19, 2019, Medalist related entities purchased 66% of the outstanding equity interest of CLO VI for $7.6 million. There was no gain or loss recognized on the sale of the equity interest.
After the sale of JMPCA, the Company lost the ability to direct the most significant activities of the following VIEs: JMP Credit Advisors CLO IV Ltd (“CLO IV”), JMP Credit Advisors CLO V Ltd (“CLO V”), and CLO VI (collectively with CLO III, the “CLOs”) and as a result, deconsolidated the aforementioned CLOs as of March 19, 2019 (except CLO III which was deconsolidated on January 17, 2019). Previously the Company concluded that it was the primary beneficiary of CLO IV, CLO V, and CLO VI through its control over JMPCA and its ownership of 100% of the equity interests of these CLOs. The Company continues to hold 100% of the junior subordinated notes of CLO IV and CLO V and approximately 33% of the equity interests of CLO VI as of December 31, 2019. The Company owned 100% and 25% of the senior subordinated notes of CLO IV and CLO V, respectively, as of the date of deconsolidation. The Company sold all of its senior subordinated notes in CLO IV and CLO V in May 2019. The Company accounts for its ownership of the subordinated notes as an investment in a debt security and accounts for its ownership of the CLO VI equity interest as an equity investment. The Company classifies the junior subordinated notes of CLO IV and CLO V as available-for-sale securities and classified the senior subordinated notes as trading securities. Collectively, the Company recognized a loss on the deconsolidation of CLO IV, CLO V, and CLO VI of $1.8 million in March 2019 in revenues from principal transactions. The Company recorded a loss of $0.1 million on the sale of the senior subordinated notes of CLO IV and CLO V in May 2019 in revenues from principal transactions.
The deconsolidation of the CLOs and JMPCA was accounted for based on the guidance in ASC 810, Consolidation. According to that guidance, the gain or loss on deconsolidation is calculated as the difference between (i) the aggregate of the fair value of the retained interest in the former subsidiaries, the fair value of any consideration received, and the carrying value of the non-controlling interest in the former subsidiaries; and (ii) the carrying value of the assets and liabilities of the former subsidiaries. The gain recognized by the Company is primarily the result of the remeasurement of the retained interest in the CLOs and JMPCA. The difference between these was recorded as a gain on deconsolidation in the Consolidated Statements of Operations under principal transactions revenue. The following table represents the consideration received, the fair value of the retained interest, and the resulting gain on deconsolidation of the CLOs and JMPCA:
|
Cash received |
$ | 7,942 | ||
|
Retained interest, at fair value (1) |
74,989 | |||
|
Non-controlling interest, as book value |
12,842 | |||
|
Total of consideration received, retained interest, and non-controlling interest |
$ | 95,773 | ||
|
Less: |
||||
|
Net assets of deconsolidated subsidiaries at carrying value (2) |
92,581 | |||
|
Gain on deconsolidation |
3,192 | |||
|
Gain on remeasurement of CLO IV and CLO V senior subordinated notes |
328 | |||
|
Total gain on deconsolidation |
$ | 3,520 |
| (1) | The fair value of the Company's retained interest in CLO III, CLO IV, CLO V, CLO VI, and JMPCA as of the deconsolidation date was $13.3 million, $27.8 million, $26.5 million, $3.8 million, and $3.6 million, respectively | |
| (2) | The book value of the net assets of CLO III, CLO IV, CLO V, CLO VI, and JMPCA as of the deconsolidation date was $24.5 million, $30.2 million, $25.8 million, $11.6 million, and $0.5 million, respectively |
2. Summary of Significant Accounting Policies
Basis of Presentation
The consolidated accounts of the Company include the wholly-owned subsidiaries and the partially-owned subsidiaries of which we are the majority owner or the primary beneficiary. All material intercompany accounts and transactions have been eliminated in consolidation. Non-controlling interests on the Consolidated Statements of Financial Condition at December 31, 2020 and 2019 relate to the interest of third parties in the partially-owned subsidiaries. Certain prior year amounts have been reclassified to conform to current year presentation.
The Company performs consolidation analyses on entities to identify variable interest entities (“VIEs”) and determine the appropriate accounting treatment. An entity is considered a VIE and, therefore, would be subject to the consolidation provisions of ASC 810-10-15 if, by design, equity investors do not have the characteristics of a controlling financial interest or do not have sufficient equity at risk for the entity to finance its activities without additional subordinated financial support from other parties. ASU 2015-2, Amendments to Consolidation Analysis, was issued February 2015, which amended the consolidation requirements in ASC 810, Consolidation. Under the amended guidance, an entity also is considered a VIE if it has equity investors who lack substantive participating or kick-out rights. VIEs are consolidated by their primary beneficiaries. When the Company enters into a transaction with a VIE, the Company determines if it is the primary beneficiary by determining whether it (a) has the power to direct the activities that most significantly impact the entity’s economic performance and (b) the obligation to absorb losses of the entity or the right to receive benefits from the entity that could potentially be significant to the VIE. If determined to be the primary beneficiary, the Company consolidates the entity. The Company reconsiders the conclusion continually.
See Note 1, Organization and Description of a Business, for more information related to the deconsolidation of the CLOs and JMPCA in the first quarter of 2019.
Use of Estimates
The preparation of consolidated financial statements in conformity with accounting principles generally accepted in the United States of America (“GAAP”) requires the use of estimates and assumptions that affect both the reported amounts of assets and liabilities and the disclosure of contingent assets and liabilities at the date of the financial statements, as well as the reported amounts of revenues and expenses during the reporting period. Actual results may differ from those estimates.
Investment banking revenues
Investment banking revenues consist of underwriting revenues, strategic advisory revenues and private placement fees. The Company generally does not incur costs to obtain contracts with customers that are eligible for deferral or receive fees prior to recognizing revenue related to investment banking transactions, and therefore, as of December 31, 2020, the Company did not have any contract assets or liabilities related to these revenues on its Statement of Financial Condition.
Underwriting revenues arise from securities offerings in which the Company acts as an underwriter and include management fees, selling concessions and underwriting fees, gross of the Company’s share of allocated syndicate expenses. Underwriting fees, management fees, and selling concessions, gross of the Company’s share of allocated syndicated expenses, are recorded on the trade date, which is typically the day of pricing an offering (or the following day). The Company has determined that its performance obligations are completed and the related income is reasonably determinable on the trade date. For these transactions, management estimates the Company’s share of the transaction-related expenses incurred by the syndicate, and recognizes revenues gross of such expense. Expenses associated with such transactions are generally expensed as incurred, rather than being deferred, as the Company is unable to determine that collection of any reimbursement is reasonably assured until the trade date. On final settlement, typically 90 days from the trade date of the transaction, these amounts are adjusted to reflect the actual transaction-related expenses and the resulting underwriting fee. In connection with some underwritten transactions, the Company may hold in inventory, for a period of time, equity and other positions to facilitate the completion of the underwritten transactions. Realized and unrealized net gains and losses on these positions are recorded within investment banking revenues.
Strategic advisory revenues primarily include success fees on closed merger and acquisition transactions, as well as retainer fees, earned in connection with advising on both buyers’ and sellers’ transactions. Fees are also earned for related advisory work and other services such as providing fairness opinions, valuation analyses, due diligence, and pre-transaction structuring advice. Depending on the nature of the engagement letter and the agreed upon services, customers may simultaneously receive and consume the benefits of services or services may culminate in the delivery of the advisory services at a point in time. The Company evaluates each contract individually and the performance obligations identified to determine if revenue should be recognized ratably over the term of the agreement or at a specific point in time. Valuation reports, fairness opinions, and advisory fees from merger or acquisition engagements are typically recognized when the transaction is substantially completed. Should these engagements contain any earn outs or other variable fees in the contract, revenue is recognized once the variability associated with the performance obligations have been removed, which is typically when the client has reached a specific milestone post-transaction. Fees from due diligence and pre-transaction structuring advice are typically recognized ratably over the term of the agreement. Any retainer fees received in connection with these agreements are individually evaluated and any unearned fees are deferred for revenue recognition until the performance obligation is met. The Company generally receives payments for strategic advisory services either upfront as a retainer fee, at the completion of the engagement, or in the case of any variable considerations, once the agreed-upon goals have been met by the client post-transaction. The Company evaluated these contracts individually and did not identify any significant financing components as the Company is not provided with any benefit of financing due to the short-term nature of the contracts.
Private placement fees are related to non-underwritten transactions such as private placements of equity securities, private investments in public equity, Rule 144A private offerings and trust preferred securities offerings and are recorded on the closing date of the transaction. Unreimbursed expenses associated with strategic advisory and private placement transactions are recorded in the Statement of Operations within various expense captions excluding compensation expense. Client reimbursements for costs associated for private placement fees are recorded gross within Investment banking and various expense captions, excluding compensation. The Company typically receives payments on private placements transactions shortly after completion of the contract.
Brokerage revenues
Brokerage revenues consist of (i) commissions resulting from equity securities transactions executed as agent or principal, (ii) related net trading gains and losses from market making activities and from the commitment of capital to facilitate customer orders and (iii) fees paid for equity research. Commissions resulting from equity securities transactions executed on behalf of customers are recorded on a trade date basis. The Company believes that the performance obligation is satisfied on the trade date because that is when the underlying financial instrument or purchaser is identified, the pricing is agreed upon and the risks and rewards of ownership have been transferred to/from the customer. The Company currently generates revenues from research activities through three types of arrangements. First, through what is commonly known as a “soft dollar” practice, a portion of a client’s commissions may be compensation for the value of access to our research. Those commissions are recognized on a trade date basis, as the Company has satisfied the performance obligation by transferring control of the service to customer. In these transactions, the Company generally receives payment for these services on settlement date. Second, a client may issue a cash payment directly to the Company for access to research. Third, the Company has entered into certain commission-sharing or tri-party arrangements in which institutional clients execute trades with a limited number of brokers and instruct those brokers to allocate a portion of the commission to the Company or to issue a cash payment to the Company. In these commission-sharing or tri-party arrangements, the amount of the fee is determined by the client on a case-by-case basis and agreed to by the Company. For the second and third types of arrangements, revenue is recognized once an arrangement exists, access to research has been provided, a specific amount is fixed or determinable, and collectability is reasonably assured. None of these arrangements obligate clients to a fixed amount of fees for research, either through trading commissions or direct or indirect cash payments, nor do they obligate the Company to provide a fixed quantity of research or execute a fixed number of trades. Furthermore, the Company is not obligated under any arrangement to make commission payments to third parties on behalf of clients. For the second and third types of arrangements, the Company typically receives payment shortly after the Company has met the revenue recognition criteria.
The Company generally does not incur any costs to obtain contracts with customers for brokerage revenues that are eligible for deferral or receive fees prior to recognizing revenue, and therefore, as of December 31, 2020, the Company did not have any contract assets or liabilities related to these revenues on its Statement of Financial Condition.
Asset Management Fees
Asset management fees include base management fees and incentive fees earned from managing our families of investment funds and other investment vehicles. The Company recognizes base management fees on a monthly basis over the period in which the investment management services are performed. Base management fees earned by the Company are generally based on the fair value of assets under management or aggregate capital commitments and the fee schedule for each fund and account. Base management fees for hedge funds and hedge funds of funds are calculated at the investor level using their quarter-beginning capital balance adjusted for any contributions or withdrawals. Base management fees for private equity funds are calculated at the investor level using their aggregate capital commitments during the commitment period, which is generally three years from first closing, and on invested capital after the commitment period. Base management fees for capital or private debt are calculated based on the average value of the gross assets at the end of the most recently completed calendar quarter. The Company also earns incentive fees for hedge funds and hedge funds of funds that are based upon the performance of investment funds and accounts. Such fees are either a specified percentage of the total investment return of a fund or account or a percentage of the excess of an investment return over a specified high-water mark or hurdle rate over a defined performance period. For most funds, the high-water mark is calculated using the greatest value of a partner’s capital account as of the end of any performance period, increased for contributions and decreased for withdrawals. Incentive fees are recognized as revenue at the end of the specified performance period, once the uncertainty regarding the variable consideration is removed. Generally, the performance period used to determine the incentive fee is quarterly for the hedge funds and annually for the hedge funds of funds. For these funds, the incentive fees are not subject to any contingent repayments to investors or any other clawback arrangements. Incentive fees for private equity funds and capital or private debt are based on a specified percentage of realized gains from the disposition of each portfolio investment in which each investor participates, and are earned by the Company after returning contributions by the investors for that portfolio investment and for all other portfolio investments in which each such investor participates that have been disposed of at the time of distribution. Some of these incentive fees are subject to contingent repayments to investors or clawback and cannot be recognized until it is probable that there will not be a significant reversal of revenue. Any such fees earned are deferred for revenue recognition until the contingency is removed or the Company determines that is not probable that a significant reversal of revenue would occur. Incentive fees recognized represent fees for which the contingency has been removed during the current or prior periods.
Principal transactions
Principal transaction revenues include realized and unrealized net gains and losses resulting from our principal investments in equity, CLO and other debt securities. Principal transaction revenues also include unrealized net gains and losses resulting from our principal investments in various investment funds managed by the Company or by third parties.
The Company's principal transaction revenues for these categories for the years ended December 31, 2020 and 2019 are as follows:
|
(In thousands) |
Year Ended December 31, |
|||||||
|
2020 |
2019 |
|||||||
|
Equity and other securities excluding non-controlling interest |
$ | 113 | $ | 295 | ||||
|
Warrants and other investments |
(18,674 | ) | 944 | |||||
|
Investment partnerships |
33 | 105 | ||||||
|
Total principal transaction revenues |
$ | (18,528 | ) | $ | 1,344 | |||
Gain and Loss on Sale, Payoff and Mark-to-Market of Loans
Gain and loss on sale, payoff and mark-to-market of loans consists of gains from the sale and payoff of loans collateralizing asset-backed securities (through March 2019) and loans held for investment. Gains are recorded when the proceeds exceed the carrying value of the loan.
Interest Income
Interest income primarily consists of interest income earned on loans collateralizing ABS issued (through March 2019), CLO debt securities and loans held for investment. Interest income on loans comprises the stated coupon as a percentage of the face amount receivable as well as accretion of purchase discounts and deferred fees. Interest income is recorded on the accrual basis in accordance with the terms of the respective loans unless such loans are placed on non-accrual status. Interest on CLO debt securities are recognized in interest income using the effective yield method.
Interest Expense
Interest expense primarily consists of interest expense incurred on asset-backed securities issued (through March 2019), notes payable, CLO warehouse credit facilities (through March 2019), lines of credit, bonds payable, and the amortization of bond issuance costs. Interest expense on asset-backed securities issued is the stated coupon as a percentage of the principal amount payable adjusted for amortization of any discounts. Interest expense is recorded on the accrual basis in accordance with the terms of the respective debt instruments.
Cash and Cash Equivalents
The Company considers highly liquid investments with original maturities or remaining maturities upon purchase of three months or less to be cash equivalents. The Company holds cash in financial institutions in excess of the FDIC insured limits. The Company periodically reviews the financial condition of the financial institutions and assesses the credit risk of such investments.
Restricted Cash and Deposits
Restricted cash consisted of security deposits for operating leases at December 31, 2020 and 2019. As of December 31, 2020, we had net liquid assets of $108.0 million consisting of cash and cash equivalents, receivable from clearing broker, marketable securities owned, investment banking fee receivable, net of marketable securities sold but not yet purchased and accrued compensation. We have satisfied our capital and liquidity requirements primarily through the issuance of the Senior Notes, draws on a line of credit and internally generated cash from operations. Most of our financial instruments, other than certain marketable securities, are recorded at fair value or amounts that approximate fair value.
Investment Banking Fees Receivable
Investment banking fees receivable includes receivables relating to the Company’s investment banking or advisory engagements. The Company records an allowance for doubtful accounts on these receivables on a specific identification basis. Investment banking fees receivable which are deemed to be uncollectible are charged off and deducted from the allowance. The allowance for doubtful accounts related to investment banking fees receivable was zero as of December 31, 2020 and 2019.
Fair Value of Financial Instruments
Fair value is defined as the price that would be received to sell an asset or paid to transfer a liability in an orderly transaction between market participants at the measurement date. See Note 4, Fair Value Measurements, for the disclosures related to the fair value of our marketable securities and other investments.
Most of the Company’s financial instruments, other than loans collateralizing asset-backed securities issued, loans held for investment, asset-backed securities issued, and notes payable are recorded at fair value or amounts that approximate fair value.
Marketable securities owned, other investments at fair value, and marketable securities sold, but not yet purchased are stated at fair value, with related changes in unrealized appreciation or depreciation reflected in the line item principal transactions in the accompanying Consolidated Statements of Operations.
Fair value of the Company’s financial instruments is generally obtained from quoted market prices, third-party pricing services, or alternative pricing methodologies that the Company believes offer reasonable levels of price transparency. To the extent that certain financial instruments trade infrequently or are non-marketable securities and, therefore, do not have readily determinable fair values, the Company estimates the fair value of these instruments using various pricing models and the information available to the Company that it deems most relevant. Among the factors considered by the Company in determining the fair value of financial instruments are discounted anticipated cash flows, the cost, terms and liquidity of the instrument, the financial condition, operating results and credit ratings of the issuer or underlying company, the quoted market price of publicly traded securities with similar duration and yield, the Black-Scholes Options Valuation methodology adjusted for active market and other considerations on a case-by-case basis and other factors generally pertinent to the valuation of financial instruments.
Marketable securities owned and securities sold, but not yet purchased, consist of U.S. listed and over-the-counter (“OTC”) equity securities. Other investments include investments in private investment funds managed by the Company and investments in private investment funds managed by third parties. Such investments are accounted for under the equity method based on the Company’s share of the earnings (or losses) of the investee or under the fair value option using the net asset value per share of those funds, as a practical expedient. The financial position and operating results of the private investment funds are generally determined on an estimated fair value basis. Generally, securities are valued (i) at their last published sale price if they are listed on an established exchange or (ii) if last sales prices are not published, at the highest closing “bid” price (for securities held “long”) and the lowest closing “asked” price (for “short” positions) as recorded by the composite tape system or such principal exchange, as the case may be. Where the fund manager determines that market prices or quotations do not fairly represent the value of a security in the investment fund’s portfolio (for example, if a security is a restricted security of a class that is publicly traded) the fund manager may assign a different value. The general partner will determine the estimated fair value of any assets that are not publicly traded.
The Company uses the fair value option which allows an entity to report selected financial assets and financial liabilities at fair value. The fair value of those assets and liabilities for which the fair value option has been chosen is reflected on the face of the balance sheet. Subsequent changes in fair value are recorded in the Consolidated Statements of Operations. The Company elected to apply the fair value option to the investments in HCC common stock, its investment in MPCF, and its investments in private equity and debt funds. The primary reason for electing the fair value option was to measure these gains on our investments on the same basis as our other equity securities, all of which are stated at fair value. The gains/losses on the investments that result from the election of the fair value option are reported in Principal Transactions in the Consolidated Statements of Operations.
Fair Value Hierarchy
In determining fair value, the Company uses various methods including market, income and cost approaches. Based on these approaches, the Company often utilizes certain assumptions that market participants would use in pricing the asset or liability, including assumptions about risk and the risks inherent in the inputs to the valuation technique. These inputs can be readily observable, market corroborated, or generally unobservable firm inputs. The Company generally utilizes valuation techniques that maximize the use of observable inputs and minimize the use of unobservable inputs. Based on the observability of the inputs used in the valuation techniques, the Company provides the following information according to the fair value hierarchy. The fair value hierarchy ranks the quality and reliability of the information used to determine fair values. Financial instrument assets and liabilities carried at fair value have been classified and disclosed in one of the following three levels of fair value hierarchy:
|
Level 1 |
|
Quoted market prices in active markets for identical assets or liabilities. |
|
Level 2 |
|
Observable market based inputs or unobservable inputs that are corroborated by market data. |
|
Level 3 |
|
Unobservable inputs that are not corroborated by market data. |
Level 1 primarily consists of financial instruments whose value is based on quoted market prices such as U.S. listed and OTC equity securities, as well as quasi-government agency securities, all of which are carried at fair value.
Level 2 includes those financial instruments that are valued using models or other valuation methodologies. These models are primarily industry-standard models that consider various assumptions, including discounted anticipated cash flows, the cost, terms and liquidity of the instrument, the financial condition, operating results and credit ratings of the issuer or underlying company, the quoted market price of publicly traded securities with similar duration and yield, time value, yield curve, prepayment speeds, default rates, loss severity, as well as other measurements. Substantially all of these assumptions are observable in the marketplace, can be derived from observable data or are supported by observable levels at which transactions are executed in the marketplace. Included in this category is the general partner investment in hedge funds, where the underlying hedge funds are mainly invested in publicly traded stocks whose value is based on quoted market prices.
Level 3 is comprised of financial instruments whose fair value is estimated based on internally developed models or methodologies utilizing significant inputs that are generally less readily observable from objective sources.
At each reporting period, all assets and liabilities for which the fair value measurement is based on significant unobservable inputs are classified as “Level 3.”
Loans Held for Investment
Loans held for investment are carried at their unpaid principal balance, net of any allowance for credit losses and deferred loan origination, commitment and other fees. For loans held for investment, the Company establishes and maintains an allowance for credit losses based on management’s estimate of credit losses in our loans as of each reporting date. The Company records the allowance against loans held for investment on a specific identification basis, or reviews its loan portfolio at the end of each quarter to record losses inherent in the homogenous loan portfolio. Loans are charged off against the reserve for credit losses if the principal is deemed not recoverable within a reasonable timeframe. Loan origination, commitment or other fees are deferred and recognized into interest income in the Consolidated Statements of Operations over the life of the related loan. The Company does not accrue interest on loans which are in default for more than 90 days and loans for which the Company expects full principal payments may not be received. When loans are placed on non-accrual status, all interest previously accrued but not collected is reversed against current period interest income. Any reversals of income from previous years are recorded against the allowance for loan losses. When the Company receives a cash interest payment on a non-accrual loan, it is applied as a reduction of the principal balance. Non-accrual loans are returned to accrual status when the borrower becomes current as to principal and interest and has demonstrated a sustained period of payment performance. The amortization of loan fees is discontinued on non-accrual loans. The Company applies the above non-accrual policy consistently to all loans classified as loans held for investment without further disaggregation. Loans that are deemed to be uncollectible are charged off and the charged-off amount is deducted from the allowance.
Restructured loans are considered a troubled debt restructuring (“TDR”) if the Company, for economic or legal reasons related to the debtor’s financial difficulties, grants a concession to the debtor that it would not otherwise consider. The Company may receive an asset from the debtor in a TDR, but the value of the asset received is typically significantly less than the amount of the debt forgiven. The Company has received equity interest in certain debtors as compensation for reducing the loan principal balance in some cases.
CLO Debt Securities
Investments in CLO debt securities are classified and accounted for according to their purpose and holding period. As of December 31, 2020 and 2019, all of the Company's investments in CLO debt securities were classified as available-for-sale securities, as the Company may sell those securities before maturity. The CLO debt securities are reported at fair value with unrealized gains and losses, net of taxes, reported as a component of other comprehensive income ("OCI").
Interest income on CLO debt securities is recognized in accordance with ASC 835, using the effective yield method. The effective yield on these securities is based on the projected cash flows from each security, which is estimated based on the Company’s observation of the then current information and events, where applicable, and will include assumptions related to interest rates, prepayment rates and the timing and amount of credit losses. On at least a quarterly basis, the Company reviews and, if appropriate, makes adjustments to its cash flow projections based on input and analysis received from external sources, internal models, and its judgment about interest rates, prepayment rates, the timing and amount of credit losses, and other factors. Changes in cash flows from those originally projected, or from those estimated at the last evaluation, may result in a prospective change in the yield/interest income recognized on such securities. Realized gains and losses on the sale of debt securities are determined using the specific identification method and recognized in current period earnings in revenues from principal transactions.
The Company evaluates the available-for-sale CLO debt securities for impairment quarterly. As part of the evaluation, the Company obtains the new cash flow projections for the CLO debt securities at period end and determines, based on those cash flows and other current information, if there has been a favorable or adverse change in the cash flows expected to be collected as compared to the projected cash flows from the prior period. An adverse change in cash flows is determined in the context of both the timing and the amount of the cash flows. An impairment would be recorded if the net present value of the cash flows of the investment is below the amortized cost basis of the investment and the Company does not expect to recover the amortized cost basis before the security is expected to be sold or the security matures, whichever comes first. Should the Company determine that there is an impairment, the amount of the impairment is recognized in revenues from principal transactions. The Company recorded -$21.7 million of impairment on CLO debt securities for the year ended December 31, 2020 and -$4.2 million for the year ended December 31, 2019.
Fixed Assets
Fixed assets represent furniture and fixtures, computer and office equipment, certain software costs, and leasehold improvements, which are stated at cost less accumulated depreciation and amortization. Depreciation is computed on a straight-line basis over the estimated useful lives of the respective assets, ranging from three to five years.
Leasehold improvements, including landlord funded assets, are capitalized and amortized over the shorter of the respective lease terms or the estimated useful lives of the improvements.
The Company capitalizes certain costs of computer software developed or obtained for internal use and amortizes the amount over the estimated useful life of the software, generally not exceeding three years.
Income Taxes
As of January 31, 2019, the Company filed an election with the U.S. Internal Revenue Service to be treated as a C corporation for tax purposes, rather than a partnership, going forward. The election was approved and became retroactively effective as of January 1, 2019.
The Company recognizes deferred tax assets and liabilities in accordance with ASC 740, Income Taxes, and are determined based upon the temporary differences between the financial reporting and tax basis of the Company’s assets and liabilities using the tax rates and laws in effect when the differences are expected to reverse. A valuation allowance is established when it is necessary to reduce the deferred tax assets when it is more likely than not that a portion or all of the deferred tax assets will not be realized.
The Company records uncertain tax positions using a two-step process: (i) the Company determines whether it is more likely than not that each tax position will be sustained on the basis of the technical merits of the position; and (ii) for those tax positions that meet the more-likely-than not recognition threshold, the Company recognizes the largest amount of tax benefit that is more than fifty percent likely to be realized upon ultimate settlement with the related tax authority.
The Company’s policy for recording interest and penalties associated with the tax audits or unrecognized tax benefits, if any, is to record such items as a component of income tax.
Share-Based Compensation
The Company recognizes compensation cost for share-based awards at their fair value on the date of grant and records compensation expense over the service period for awards expected to vest. Such grants are recognized as expense, net of estimated forfeitures.
Share-based compensation includes restricted share units ("RSUs"), share appreciation rights, and share options granted under the Company’s Equity Incentive Plan.
In accordance with generally accepted valuation practices for share-based awards issued as compensation, the Company uses the Black-Scholes option-pricing model or other quantitative models to calculate the fair value of option awards. The quantitative models require subjective assumptions regarding variables such as future share price volatility, dividend yield and expected time to exercise, which greatly affect the calculated values.
The fair value of RSUs is determined based on the closing price of the underlying share on the grant date, discounted for future distributions not expected to be paid on unvested units during the vesting period. If applicable, a liquidity discount for post-vesting transfer restrictions is also applied.
Treasury Shares
The Company accounts for its treasury shares under the cost method, using an average cost assumption, and includes treasury shares as a component of shareholders’ equity.
3. Recent Accounting Pronouncements
Recently Adopted Accounting Guidance
In August 2018, the Financial Accounting Standards Board (“FASB”) issued Accounting Standards Update (“ASU”) 2018-13, Fair Value Measurement (Topic 820): Disclosure Framework – Changes to the Disclosure Requirements for Fair Value Measurement. ASU 2018-13 eliminates, adds and modifies certain disclosure requirements for fair value measurements as part of the FASB’s disclosure framework project. The Company adopted ASU 2018-13 effective January 1, 2020. The adoption did not materially impact the Company’s consolidated financial statements or its disclosures.
Accounting Standards to be Adopted in Future Periods
In June 2016, the FASB issued ASU 2016-13, Financial Instruments – Credit Losses (Topic 326): Measurement of Credit Losses on Financial Instruments (CECL), with subsequent amendments to clarify the guidance, provide transitional relief provisions and minor updates to the original ASU. ASU 2016-13 replaces the existing incurred loss impairment methodology with a methodology that reflects expected credit losses and requires consideration of a broader range of reasonable and supportable information to inform credit loss estimates. This ASU is required to be adopted using a modified retrospective approach with a cumulative-effect adjustment to beginning retained earnings, as of the beginning of the first reporting period the guidance is effective for. As a result of one of the amendments to ASU 2016-13, the new guidance will be effective for public business entities that meet the definition of a smaller reporting company for fiscal years and all interim periods within those fiscal years, beginning after December 15, 2022, with early adoption permitted. The Company does not plan to early adopt this standard, but continues to work through implementation and does not expect the impact to be material.
In December 2019, the FASB issued ASU 2019-12, Income Taxes (Topic 740): Simplifying the Accounting for Income Taxes, to simplify the accounting for income taxes. This guidance eliminates certain exceptions to the general approach to the income tax accounting model, and adds new guidance to reduce the complexity in accounting for income taxes. This guidance is effective for annual periods beginning after December 15, 2020, including interim periods within those annual periods. The Company is currently evaluating the impact of the adoption of this standard and its impact on the Company’s disclosures.
Other new pronouncements issued but not effective as of December 31, 2020 are not expected to have a material impact on the Company's consolidated financial statements.
4. Fair Value Measurements
The following tables provide fair value information related to the Company’s financial instruments at December 31, 2020 and 2019:
|
December 31, 2020 |
||||||||||||||||||||
|
(In thousands) |
Carrying Value |
Fair Value |
||||||||||||||||||
|
Level 1 |
Level 2 |
Level 3 |
Total |
|||||||||||||||||
|
Assets: |
||||||||||||||||||||
|
Cash and cash equivalents |
$ | 91,444 | $ | 91,444 | $ | - | $ | - | $ | 91,444 | ||||||||||
|
Restricted cash and deposits |
1,287 | 1,287 | - | - | 1,287 | |||||||||||||||
|
Marketable securities owned |
55,494 | 7,491 | - | 48,003 | 55,494 | |||||||||||||||
|
Equity investments |
6,457 | - | 2,251 | 4,206 | 6,457 | |||||||||||||||
|
Other investments measured at net asset value (1) |
11,155 | - | - | - | - | |||||||||||||||
| Loans held for sale (2) | 2,412 | - | - | 2,412 | 2,412 | |||||||||||||||
|
Loans held for investment, net of allowance for loan losses |
994 | - | - | 994 | 994 | |||||||||||||||
|
Total assets: |
$ | 169,243 | $ | 100,222 | $ | 2,251 | $ | 55,615 | $ | 158,088 | ||||||||||
|
Liabilities: |
||||||||||||||||||||
|
Notes payable |
$ | 10,610 | $ | - | $ | 5,983 | $ | 4,627 | $ | 10,610 | ||||||||||
|
Bond payable |
80,912 | - | 79,472 | - | 79,472 | |||||||||||||||
|
Total liabilities: |
$ | 91,522 | $ | - | $ | 85,455 | $ | 4,627 | $ | 90,082 | ||||||||||
|
(1) |
In accordance with ASC 820-10, certain investments that are measured at fair value using the net asset value per share (or its equivalent) have not been classified in the fair value hierarchy. The fair value amounts presented in this table are intended to permit reconciliation of the fair value hierarchy to the amounts presented in the statement of financial position. The carrying values of these lines reconciles to the parenthetical disclosure of other investments on the Consolidated Statements of Financial Condition. |
|
| (2) | Included in Other Assets on the Consolidated Statements of Financial Condition. |
|
December 31, 2019 |
||||||||||||||||||||
|
(In thousands) |
Carrying Value |
Fair Value |
||||||||||||||||||
|
Level 1 |
Level 2 |
Level 3 |
Total |
|||||||||||||||||
|
Assets: |
||||||||||||||||||||
|
Cash and cash equivalents |
$ | 49,630 | $ | 49,630 | $ | - | $ | - | $ | 49,630 | ||||||||||
|
Restricted cash and deposits |
1,287 | 1,287 | - | - | 1,287 | |||||||||||||||
|
Marketable securities owned |
73,101 | 15,245 | - | 57,856 | 73,101 | |||||||||||||||
|
Equity investments |
3,956 | - | - | 3,956 | 3956 | |||||||||||||||
|
Other investments measured at net asset value (1) |
10,250 | - | - | - | 0 | |||||||||||||||
| Loans held for sale | 2,412 | - | - | 2,476 | 2,476 | |||||||||||||||
|
Loans held for investment, net of allowance for loan losses |
1,210 | - | - | 1,087 | 1,087 | |||||||||||||||
|
Total assets: |
$ | 141,846 | $ | 66,162 | $ | - | $ | 65,375 | $ | 131,537 | ||||||||||
|
Liabilities: |
||||||||||||||||||||
|
Marketable securities sold, but not yet purchased |
$ | 3,855 | $ | 3,855 | $ | - | $ | - | $ | 3,855 | ||||||||||
|
Notes payable |
6,812 | - | 5,983 | 829 | 6812 | |||||||||||||||
|
Bond payable |
82,584 | - | 84,821 | - | 84,821 | |||||||||||||||
|
Total liabilities: |
$ | 93,251 | $ | 3,855 | $ | 90,804 | $ | 829 | $ | 95,488 | ||||||||||
|
(1) |
In accordance with ASC 820-10, certain investments that are measured at fair value using the net asset value per share (or its equivalent) have not been classified in the fair value hierarchy. The fair value amounts presented in this table are intended to permit reconciliation of the fair value hierarchy to the amounts presented in the statement of financial position. The carrying values of these lines reconciles to the parenthetical disclosure of other investments on the Consolidated Statements of Financial Condition. |
Recurring Fair Value Measurement
The following tables provide information related to the Company’s assets and liabilities carried at fair value on a recurring basis at December 31, 2020 and 2019:
|
(In thousands) |
December 31, 2020 |
|||||||||||||||||||
|
Carrying Value |
Level 1 |
Level 2 |
Level 3 |
Total |
||||||||||||||||
|
Marketable securities owned |
$ | 55,494 | $ | 7,491 | $ | - | $ | 48,003 | $ | 55,494 | ||||||||||
|
Other investments: |
||||||||||||||||||||
|
Equity investments |
6,457 | - | 2,251 | 4,206 | 6,457 | |||||||||||||||
|
Investments in other funds managed by the Company (1) |
4,943 | - | - | - | - | |||||||||||||||
|
Limited partnership in investments in private equity/ real estate funds (1) |
6,212 | - | - | - | - | |||||||||||||||
|
Total other investments |
17,611 | - | 2,251 | 4,206 | 6,457 | |||||||||||||||
|
Total assets: |
$ | 73,105 | $ | 7,491 | $ | 2,251 | $ | 52,209 | $ | 61,951 | ||||||||||
|
(1) |
In accordance with ASC 820-10, certain investments that are measured at fair value using the net asset value per share (or its equivalent) have not been classified in the fair value hierarchy. The fair value amounts presented in this table are intended to permit reconciliation of the fair value hierarchy to the amounts presented in the statement of financial position. The carrying values of these lines reconciles to the parenthetical disclosure of other investments on the Consolidated Statements of Financial Condition. |
|
(In thousands) |
December 31, 2019 |
|||||||||||||||||||
|
Carrying Value |
Level 1 |
Level 2 |
Level 3 |
Total |
||||||||||||||||
|
Marketable securities owned |
$ | 73,101 | $ | 15,245 | $ | - | $ | 57,856 | $ | 73,101 | ||||||||||
|
Other investments: |
||||||||||||||||||||
|
Equity investments |
3,956 | - | - | 3,956 | 3,956 | |||||||||||||||
|
Investments in other funds managed by the Company (1) |
5,188 | - | - | - | - | |||||||||||||||
|
Limited partnership in investments in private equity/ real estate funds (1) |
5,062 | - | - | - | - | |||||||||||||||
|
Total other investments |
14,206 | - | - | 3,956 | 3,956 | |||||||||||||||
|
Total assets: |
$ | 87,307 | $ | 15,245 | $ | - | $ | 61,812 | $ | 77,057 | ||||||||||
|
Marketable securities sold, but not yet purchased |
$ | 3,855 | $ | 3,855 | $ | - | $ | - | $ | 3,855 | ||||||||||
|
Total liabilities: |
$ | 3,855 | $ | 3,855 | $ | - | $ | - | $ | 3,855 | ||||||||||
|
(1) |
In accordance with ASC 820-10, certain investments that are measured at fair value using the net asset value per share (or its equivalent) have not been classified in the fair value hierarchy. The fair value amounts presented in this table are intended to permit reconciliation of the fair value hierarchy to the amounts presented in the statement of financial position. The carrying values of these lines reconciles to the parenthetical disclosure of other investments on the Consolidated Statements of Financial Condition. |
As of December 31, 2020 and 2019, marketable securities was comprised of U.S. listed equity securities and CLO debt securities. As of December 31, 2019, marketable securities sold, but not yet purchased, was primarily comprised of U.S. listed equity securities. As of December 31, 2020, marketable securities sold, but not yet purchased, were zero.
The fair value of the investments in private equity, real estate and credit funds was measured using the net asset value as a practical expedient. These investments are nonredeemable and had unfunded commitments of $3.5 million and $3.8 million as of December 31, 2020 and 2019 respectively.
The Company’s policy is to recognize the fair value of transfers among Levels 1, 2 and 3 as of the end of the reporting period. For recurring fair value measurements, there were no transfers between Levels 1, 2 and 3 for the years ended December 31, 2020 and 2019.
The Company’s Level 2 assets held in other investments as of December 31, 2020 consist of investments in hedge funds managed by HCS and publicly traded stocks. The carrying value of investments in hedge funds are calculated using the equity method and approximates fair value. Earnings or losses attributable to these investments are recorded in principal transactions. These assets are considered Level 2 as the underlying hedge funds are mainly invested in publicly traded stocks whose value is based on quoted market prices. The Company’s proportionate share of those investments is included in the tables above.
As of December 31, 2020, the Company also owns securities in two public companies subject to restrictions on transfer or sale and is therefore recorded as Level 2 assets.
The investments in private equity funds managed by HCS and real estate funds managed by JMPAM are recognized using the fair value option. The Company uses the reported net asset value per share as a practical expedient to estimate the fair value of the funds. The risks associated with these investments are limited to the amounts of invested capital, remaining commitment and any management and incentive fees receivable.
The Company determined the fair value of short-term debt, which consists of notes payable to approximate their carrying values. This was determined as the debt has either (1) a variable interest rate tied to LIBOR and therefore reflects market conditions, or (2) a term less than one year and there have been no observable changes in the credit quality of the Company since the issuance of the debt. Based on the fair value methodology, the Company has identified short-term debt as Level 2 liabilities.
The Company’s Level 3 asset in other investments is primarily comprised of an equity investment in a private company. The Company determines the fair value of this investment using the net present value of discounted cash flows. The significant unobservable inputs used in the fair value measurement of this investment are presented in the Significant Unobservable Inputs table below. For this investment, the Company elected the fair value option. While the Company has made other investments in private equity securities, it has not elected the fair value option for those investments as it is impractical to determine the fair value of those investments.
For the year ended December 31, 2020 and 2019, the changes in Level 3 assets measured at fair value on a recurring basis were as follows:
|
(In thousands) |
CLO junior subordinated notes | CLO senior subordinated notes |
Equity Investment |
Total |
||||||||||||
| Balance as of December 31, 2018 | $ | - | $ | - | $ | 57 | $ | 57 | ||||||||
|
Fair value at recognition date |
67,589 | 9,289 | 3,568 | 80,446 | ||||||||||||
|
Purchases |
- | - | 182 | 182 | ||||||||||||
| Investment distributions | (6,102 | ) | (883 | ) | - | (6,985 | ) | |||||||||
|
Accrued interest |
7,094 | 103 | - | 7,197 | ||||||||||||
| Unrealized gains (losses) on investments, recognized in earnings | (4,204 | ) | - | 305 | (3,899 | ) | ||||||||||
| Unrealized losses on investments, recognized in OCI | (6,521 | ) | - | - | (6,521 | ) | ||||||||||
| Realized losses on sales, recognized in earnings | - | (112 | ) | (156 | ) | (268 | ) | |||||||||
|
Sales |
- | (8,397 | ) | - | (8,397 | ) | ||||||||||
|
Balance as of December 31, 2019 |
$ | 57,856 | $ | - | $ | 3,956 | $ | 61,812 | ||||||||
| Investment distributions | (2,330 | ) | - | - | (2,330 | ) | ||||||||||
| Accrued interest | 8,155 | - | - | 8,155 | ||||||||||||
| Unrealized gains (losses) on investments, recognized in earnings | (21,703 | ) | - | 249 | (21,454 | ) | ||||||||||
| Unrealized gains on investments, recognized in OCI | 6,025 | - | - | 6,025 | ||||||||||||
|
Balance as of December 31, 2020 |
$ | 48,003 | $ | - | $ | 4,205 | $ | 52,208 | ||||||||
The Company’s Level 3 assets held in marketable securities consist of investments in CLO debt securities. The fair value of the CLO debt securities is determined using the discounted cash flow approach. The significant unobservable inputs used in the fair value of these investments are presented in the Significant Unobservable Inputs table below. The Company also uses covenant compliance information provided by the CLO manager when valuing these investments. During the year ended December 31, 2020 and during the fourth quarter of 2019, the fair value of the Company’s investment in CLO debt securities declined due to a decrease in the expected future cash flows, primarily due to an increase in estimated credit losses in the CLO portfolios.
For assets classified in the Level 3 hierarchy, any changes to any of the inputs to the fair value measurement could result in a significant increase or decrease in the fair value measurement. For CLO debt securities, a significant increase (decrease) in the discount rate, default rate, and severity rate would result in a significant decrease (increase) in the fair value of the instruments. For the equity investment, a significant increase (decrease) in the credit factor or the discount rate would result in a significantly lower (higher) fair value measurement. For Level 3 assets measured at fair value on a recurring basis as of December 31, 2020 and December 31, 2019, the significant unobservable inputs used in the fair value measurements were as follows:
|
Significant Unobservable Inputs |
|||||||||||||||||||
|
(In thousands) |
Range (Weighted-average (1)) |
Fair value |
|||||||||||||||||
|
Valuation Technique |
Description |
December 31, 2020 |
December 31, 2019 |
December 31, 2020 |
December 31, 2019 |
||||||||||||||
|
CLO debt securities |
Discounted cash flows |
Discount rate |
17.5% (N/A) | 17.5% (N/A) | $ | 48,003 | $ | 57,856 | |||||||||||
| Default rate | 2.0% (N/A) | 2.0% (N/A) | |||||||||||||||||
|
Severity rate |
25.0% (N/A) |
25.0% (N/A) | |||||||||||||||||
|
Prepayment rate |
10.0%-25.0% (18.5%) | 25.0% (N/A) | |||||||||||||||||
|
Collateral liquidation price |
98.0%-99.0% (98.8%) | 98.0%-99.0% (98.7%) | |||||||||||||||||
|
Equity investment |
Discounted cash flows |
Credit factor |
20% (N/A) | 20% (N/A) | $ | 3,378 | $ | 3,550 | |||||||||||
| Discount rate | 16% (N/A) | 17.7% (N/A) | |||||||||||||||||
| Market | EBITDA multiple | 12.0x (N/A) | N/A | $ | 828 | $ | - | ||||||||||||
| (1) | The weighted average was calculated based on the relative collateral balance of each CLO. |
Non-recurring Fair Value Measurements
The Company's assets that are measured at fair value on a non-recurring basis result from the application of lower of cost or market accounting or write-downs of individual assets and were $2.4 million and $0.1 million as of December 31, 2020 and December 31, 2019, respectively.
5. Available-for-Sale Securities
The following table summarizes available-for-sale securities in an unrealized position as of December 31, 2020 and 2019:
|
December 31, 2020 |
December 31, 2019 |
||||||||||||||||||||||||||||||
|
(In thousands) |
Amortized Cost |
Gross Unrealized Gains |
Gross Unrealized Losses |
Fair Value |
Number of Positions |
Amortized Cost |
Gross Unrealized Gains |
Gross Unrealized Losses |
Fair Value |
Number of Positions |
|||||||||||||||||||||
|
CLO debt securities |
$ | 48,499 | $ | - | $ | (496) | $ | 48,003 | 3 | $ | 64,377 | $ | - | $ | (6,521) | $ | 57,856 | 3 | |||||||||||||
The following table summarizes the fair value and amortized cost of the available-for-sale securities by contractual maturity as of December 31, 2020:
|
(In thousands) |
December 31, 2020 |
December 31, 2019 |
|||||||||||
|
Available-for-Sale |
Available-for-Sale |
||||||||||||
|
Amortized Cost |
Fair Value |
Amortized Cost |
Fair Value |
||||||||||
|
Less than 5 years |
$ | 9,109 | $ | 8,245 | $ | - | $ | - | |||||
|
5-10 years |
39,390 | 39,758 | 38,451 | 33,877 | |||||||||
|
More than 10 years |
- | - | 25,926 | 23,979 | |||||||||
|
Total |
$ | 48,499 | $ | 48,003 | $ | 64,377 | $ | 57,856 | |||||
In July 2020, the Company entered into a Seventh Amendment to its Credit Facility with CNB, that among other things, requires the Company maintain a minimum of $6.0 million of CLO debt securities, based on their fair value as of June 30, 2020, pledged as collateral supporting the obligations under the Credit Agreement. See Note 9, Loans, for more information on the Seventh Amendment.
6. Loans
Loans Collateralizing Asset-Backed Securities issued (through March 2019)
During the period ended March 31, 2019, the Company deconsolidated its investments in the CLOs and as a result, no longer has loans collateralizing ABS on its Consolidated Statements of Financial Condition and therefore there is no activity following this date. See Note 1, Organization and Description of Business, for additional information on deconsolidation.
A summary of the activity in the allowance for loan losses for the years ended December 31, 2019 is as follows:
|
(In thousands) |
Year Ended December 31, |
|||||
|
2019 |
||||||
|
Impaired |
Non-Impaired |
|||||
|
Balance at beginning of period |
$ | (836) | $ | (9,751 | ) | |
|
Charge off |
181 | - | ||||
|
Derecognition due to deconsolidation |
655 | 9,751 | ||||
|
Balance at end of period |
$ | - | $ | - | ||
Loans Held for Investment
As of December 31, 2020 and 2019, the number of loans held for investment was two and four, respectively. The Company reviews the credit quality of these loans within this portfolio segment on a loan by loan basis mainly focusing on the borrower’s financial position and results of operations as well as the current and expected future cash flows on the loans.
There were no loans past due as of December 31, 2020 and 2019. A summary of activity in loan losses for the years ended December 31, 2020 and 2019 is as follows:
|
(in thousands) |
Year Ended December 31, |
|||||||
|
2020 |
2019 |
|||||||
|
Balance, at beginning of the period |
$ | - | $ | (218 | ) | |||
|
Provision for loan losses |
(112 | ) | (438 | ) | ||||
|
Charge off |
112 | 218 | ||||||
|
Reversal of provision due to restructure of loan |
- | 438 | ||||||
|
Balance, at end of the period |
$ | - | $ | - | ||||
A loan is considered to be impaired when, based on current information, it is probable that the Company will be unable to collect all amounts due in accordance with the contractual terms of the original loan agreement, including scheduled principal and interest payments. As of December 31, 2020 and 2019, zero of recorded investment amount of loans issued were individually evaluated for impairment, respectively.
During the year ended December 31, 2020 and 2019, the Company recorded $0.1 million and $0.4 million of impairment, respectively, on the $1.0 million loans evaluated for impairment.
The Company had zero and two troubled debt restructurings during the years ended December 31, 2020 and 2019, respectively.
7. Fixed Assets
At December 31, 2020 and 2019, fixed assets consisted of the following:
|
(In thousands) |
As of December 31, |
||||||
|
2020 |
2019 |
||||||
|
Furniture and fixtures |
$ | 2,750 | $ | 2,675 | |||
|
Computer and office equipment |
5,617 | 5,499 | |||||
|
Leasehold improvements |
9,879 | 9,739 | |||||
|
Software |
601 | 601 | |||||
|
Less: accumulated depreciation |
(15,729) | (14,247 | ) | ||||
|
Total fixed assets, net |
$ | 3,118 | $ | 4,267 | |||
Depreciation expense was $1.5 million and $1.2 million for the years ended December 31, 2020 and 2019, respectively.
8. Other Assets and Other Liabilities
At December 31, 2020 and 2019, other assets and other liabilities consisted of the following:
|
(In thousands) |
As of December 31, |
|||||||
|
2020 |
2019 |
|||||||
| Accounts receivable | $ | 4,333 | $ | 7,053 | ||||
|
Prepaid expenses |
6,954 | 5,152 | ||||||
|
Deferred tax asset (2) |
- | 21,406 | ||||||
|
Loans held for sale (1) |
2,412 | 2,412 | ||||||
|
Other assets |
323 | 230 | ||||||
| Total other assets | $ | 14,022 | $ | 36,253 | ||||
(1) Loans held for sale are carried at the lower of cost or fair value less cost to sell.
|
(In thousands) |
As of December 31, |
|||||||
|
2020 |
2019 |
|||||||
|
Accounts payable & accrued liabilities |
$ | 6,726 | $ | 5,015 | ||||
|
Deferred compensation liabilities |
3,621 | 2,517 | ||||||
|
Deferred tax liability (2) |
- | 8,645 | ||||||
|
Other liabilities |
383 | 3,301 | ||||||
|
Total other liabilities |
$ | 10,730 | $ | 19,478 | ||||
(2) Deferred tax asset and liability have been presented as their own caption on the balance sheet and are therefore not included in other assets and other liabilities as of December 31, 2020.
9. Debt
Bond Payable
|
(In thousands) |
December 31, 2020 |
December 31, 2019 |
||||||
|
7.25% Senior Notes due 2027 |
$ | 50,000 | $ | 50,000 | ||||
| 6.875% Senior Notes due 2029 | 36,000 | 36,000 | ||||||
|
Total outstanding principal |
$ | 86,000 | $ | 86,000 | ||||
|
Less: Debt issuance costs |
(2,953 | ) | (3,416 | ) | ||||
|
Less: Senior Notes repurchased (1) |
(2,135 | ) | - | |||||
|
Total bond payable, net |
$ | 80,912 | $ | 82,584 | ||||
| (1) | In March 2020, the Company repurchased $1.4 million and $0.7 million par value of its issued and outstanding 2029 Senior Notes and 2027 Senior Notes, respectively. Since they were repurchased at less than carrying value, a gain of $0.7 million was recognized upon the repurchase of the bonds, which is included in “Gain on repurchase, reissuance or early retirement of debt” on the Consolidated Statements of Operations. |
On September 26, 2019, the Company issued $36.0 million of 6.875% senior notes (the “2029 Senior Notes”). The 2029 Senior Notes will mature on September 30, 2029, may be redeemable in whole or in part at any time or from time to time at JMP Group LLC’s option on or after September 30, 2021, at a redemption price equal to the principal amount redeemed plus accrued and unpaid interest. The notes bear interest at a rate of 6.875% per year, payable quarterly on March 30, June 30, September 30, and December 30 of each year, and commencing on December 30, 2019.
The 7.25% senior notes due 2027 (the “2027 Senior Notes”) and the 2029 Senior Notes (collectively with the 2027 Senior Notes the “Senior Notes”) were issued by JMP Group Inc. and JMP Group LLC, respectively, pursuant to indentures with U.S. Bank National Association, as trustee. The Senior Notes indentures contain customary event of default and cure provisions. If an uncured default occurs and is continuing, the trustee or the holders of at least 25% in principal amount of the Senior Notes may declare the Senior Notes immediately due and payable. The Senior Notes are JMP Group Inc.’s and JMP Group LLC's general unsecured senior obligations, and rank equally with all existing and future senior unsecured indebtedness and are senior to any other indebtedness expressly made subordinate to the notes. At both December 31, 2020 and 2019, the Company was in compliance with the debt covenants in the indentures.
The future scheduled principal payments of the bond payable as of December 31, 2020 are as follows:
|
(In thousands) |
||||
|
2021 |
$ | - | ||
|
2022 |
- | |||
|
2023 |
- | |||
|
2024 |
- | |||
|
2025 |
- | |||
|
Thereafter |
86,000 | |||
|
Total |
$ | 86,000 |
Note Payable, Lines of Credit and CLO Warehouse Credit Facility
|
(In thousands) |
Outstanding Balance |
|||||||
|
December 31, 2020 |
December 31, 2019 |
|||||||
|
$25 million, JMP Holding credit agreement through December 31, 2020 |
$ | 5,983 | $ | 5,983 | ||||
|
Paycheck Protection Program (the "PPP") loan |
3,798 | - | ||||||
|
Note payable to an affiliate (Note 18) |
829 | 829 | ||||||
|
Total note payable, lines of credit, and credit facilities |
$ | 10,610 | $ | 6,812 | ||||
JMP Holding LLC (the “Borrower”), a wholly owned subsidiary of the Company, entered into a Second Amended and Restated Credit Agreement dated April 30, 2014 among the Borrower, the lenders from time to time party thereto (the “Lenders”) and CNB, as administrative agent for the Lenders (as amended, the “Credit Agreement”).
On December 31, 2020, the Borrower entered into an Amendment Number Eight (the “Eighth Amendment”) to that certain Second Amended and Restated Credit Agreement dated April 30, 2014 among the Borrower, the Lenders and CNB. The Eighth Amendment extended the outside maturity date of the Revolving Loan under the Credit Facility from December 31, 2020 to December 31, 2022 and removed the mechanism whereby the Revolving Loan would convert into a term loan for 12 months after the revolving period ends. The Eighth Amendment amended certain financial covenants and introduced a definition of “Borrowing Base”, which is a sum of certain assets of the Loan Parties, and added a provision that caps the total amount that can be borrowed under the Revolving Loan to the amount of the Borrowing Base if the Borrowing Base is lower than the Maximum Revolver Amount of $25 million. As of December 31, 2020, the Borrowing Base exceeded $25 million.
The Credit Agreement provides a $25.0 million revolving line of credit (the “Revolver”) through December 31, 2022 bears interest at a rate of LIBOR plus 225 bps.
The Credit Agreement provides that the Revolver may be used, on a revolving basis, to fund specified permitted investments in collateralized loan obligation vehicles. In addition, up to $5.0 million of the Revolver may be used, on a revolving basis, to fund other types of permitted investments and acquisitions and for working capital.
As of December 31, 2020 and 2019, the Borrower had drawn $6.0 million against the Revolver and had letters of credit outstanding under this facility to support office lease obligations of approximately $1.1 million in the aggregate.
The Credit Agreement contains financial and other covenants, including, but not limited to, limitations on debt, liens and investments, as well as the maintenance of certain financial covenants. A violation of any one of these covenants could result in a default under the Credit Agreement, which would permit CNB to terminate the Company’s note and require the immediate repayment of any outstanding principal and interest. As of December 31, 2020 and December 30, 2019, the Company was in compliance with the covenants under the Credit Agreement.
JMP Holding's obligations under the Credit Agreement are guaranteed by all of its wholly owned subsidiaries (other than JMP Securities and certain dormant subsidiaries) and are secured by substantially all of its and the guarantors' assets. In addition, the Company has entered into a limited recourse pledge agreement whereby the Company has granted a lien on all of our equity interests in JMP Investment Holdings and JMPAM to secure JMP Holding's obligations under the Credit Agreement.
Separately, under a Revolving Note and Cash Subordination Agreement, JMP Securities holds a $20.0 million revolving line of credit (the "Line of Credit") with CNB to be used for regulatory capital purposes during its securities underwriting activities. On June 30, 2021, any outstanding amount under the Line of Credit will convert to a term loan maturing on June 30, 2022. There was no borrowing on this Line of Credit as of December 31, 2020 and 2019. Borrowings under the Line of Credit will bear interest at a rate to be agreed upon at the time of advance between the Company and CNB.
On March 27, 2020, the Coronavirus Aid, Relief, and Economic Security (CARES) Act (the “CARES Act”) was enacted in response to market conditions related to the coronavirus ("COVID-19") pandemic. The CARES Act includes many measures to help companies, including providing loans to qualifying companies, under the Paycheck Protection Program (the "PPP") offered by the U.S. Small Business Administration (the “SBA”). On April 17, 2020, JMP Securities entered into a promissory note (the “PPP Loan”) with CNB as the lender (the “Lender”), pursuant to which the Lender agreed to loan the Company $3.8 million. The proceeds of the PPP Loan were available to be used to pay for payroll costs, rent and other eligible costs. As of December 31, 2020, the Company has used all of the PPP Loan proceeds for eligible costs and expects to apply for forgiveness.
The PPP Loan bears interest at the rate of 1% per annum. To the extent that amounts owed under the PPP Loan, or a portion of them, are not forgiven, the Company will be required to make principal and interest payments. No payments are required until the date the SBA makes a determination on the amount of loan forgiveness. If not forgiven, the PPP Loan matures in June 2022. The PPP Loan includes events of default. Upon the occurrence of an event of default, the Lender will have the right to exercise remedies against the Company, including the right to require immediate payment of all amounts due under the PPP Loan.
The calculated amount of the ROU asset and lease liability are impacted by the length of the lease term and the discount rate used to present value the minimum lease payments. Regarding the discount rate, Topic 842 requires the use of the rate implicit in the lease whenever this rate is readily determinable. As this rate is rarely determinable, the Company utilizes its incremental borrowing rate at lease inception, on a collateralized basis, over a similar term. The incremental borrowing rate used to calculate the lease liability was determined based on the Company’s outstanding debt and consideration of other factors including credit standing and term of debt as of the effective date of ASC 842. Additionally, the lease term and lease payments were also considered in determining the rate. Based on these considerations, the Company determined a collateralized borrowing rate that could be matched to total lease terms and total lease payments in ultimately calculating the implied borrowing rate in each lease contract.
For operating leases existing prior to January 1, 2019, the rate for the remaining lease term as of January 1, 2019 was used. As of December 31, 2020, the weighted-average remaining lease term and discount rate for the Company's operating leases were as follows:
|
Year Ended December 31, 2020 |
|||
|
Weighted-average remaining lease term |
|||
|
Operating leases |
4.36 | ||
|
Weighted-average discount rate |
|||
|
Operating leases |
5.94 | % | |
|
(In thousands) |
Minimum Future Lease Commitments |
|||
|
Year Ending December 31, |
||||
|
2021 |
$ | 5,486 | ||
|
2022 |
5,416 | |||
|
2023 |
5,659 | |||
|
2024 |
4,225 | |||
|
2025 |
2,458 | |||
|
Thereafter |
- | |||
|
Total minimum future lease payments |
23,244 | |||
|
Amounts representing interest |
(2,114 | ) | ||
|
Present value of net future minimum lease payments |
$ | 21,130 | ||
|
December 31, 2020 |
||||
|
Cash paid for amounts included in the measurement of lease liabilities |
||||
|
Cash used in operating activities |
$ | 6,533 | ||
|
Operating leases |
$ | 6,533 | ||
11. Shareholders’ Equity
Distributions on Common Shares
On February 19, 2020, the Company suspended its quarterly cash distributions program on outstanding shares. The Company's board of directors declared the following distributions in the year ended December 31, 2019:
|
Distribution |
Record |
Total |
Payable |
|||||||
|
Declaration Date |
Per Share |
Date |
Amount |
Date |
||||||
|
January 17, 2019 |
$ | 0.050 |
January 31, 2019 |
$ | 1,064,484 |
February 15, 2019 |
||||
|
April 29, 2019 |
$ | 0.040 |
May 17, 2019 |
$ | 844,087 |
May 31, 2019 |
||||
|
August 1, 2019 |
$ | 0.040 |
August 16, 2019 |
$ | 772,977 |
August 30, 2019 |
||||
|
November 4, 2019 |
$ | 0.040 |
November 15, 2019 |
$ | 773,982 |
November 29, 2019 |
||||
Share Repurchase Program
On February 17, 2017, our board of directors authorized the repurchase of up to 1,000,000 shares through December 31, 2018. Such authorization was extended multiple times through June 30, 2019. During the six month period ended June 30, 2019, the Company repurchased 318,826 of the Company’s shares, at an average price of $4.09 per share, for an aggregate purchase price of $1.3 million on the open market. The Company terminated its repurchase program effective May 8, 2019, prior to the launch of a self-tender offer.
Self-Tender Offer
On February 24, 2020, the Company launched a tender offer (the “2020 Tender Offer”) to repurchase for cash up to 3,000,000 shares representing limited liability company interests in the Company. The 2020 Tender Offer was terminated on March 19, 2020 as a result of multiple conditions to the 2020 Tender Offer, including share price and market index conditions, not having been satisfied.
On May 13, 2019, the Company launched a self-tender offer (the "Self Tender Offer") to repurchase for cash up to 3,000,000 shares representing limited liability interests of the Company, or approximately 14.2% of the Company's outstanding common shares. The Tender Offer expired on June 13, 2019. The Tender Offer resulted in the Company's repurchase of 1,816,732 shares at a purchase price of $3.95 per share for a total purchase price of $7.2 million, excluding fees and expenses related to the Tender Offer.
12. Share-Based Compensation
On January 27, 2015, the Company's board of directors adopted the JMP Group LLC Amended and Restated Equity Incentive Plan (“JMP Group Plan”). The JMP Group Plan maintains authorization of the issuance of 4,000,000 shares, as originally approved by shareholders on April 12, 2007 and subsequently approved by shareholders on June 6, 2011. This amount is increased by any shares the Company purchases on the open market, or through any share repurchase or share exchange program, initiated by the Company unless the board of directors or its appointee determines otherwise. The Company will issue shares upon exercises or vesting from authorized but unissued shares or from treasury shares.
The following table summarizes the share-based compensation expense for the year ended December 31, 2020 and 2019:
|
Year Ended December 31, |
||||||||
|
(In thousands) |
2020 |
2019 |
||||||
|
Restricted stock unit awards |
$ | 1,184 | $ | 1,994 | ||||
|
Stock option awards |
543 | - | ||||||
|
Share-based compensation expense |
$ | 1,728 | $ | 1,994 | ||||
Share Options
The following table summarizes the share option activity for the years ended December 31, 2020 and 2019:
|
Year Ended December 31, |
||||||||||||||||
|
2020 |
2019 |
|||||||||||||||
|
Shares Subject |
Weighted Average |
Shares Subject |
Weighted Average |
|||||||||||||
|
to Option |
Exercise Price |
to Option |
Exercise Price |
|||||||||||||
|
Balance, beginning of year |
- | $ | - | 1,300,000 | $ | 6.85 | ||||||||||
| Granted | 2,400,000 | 3.04 | - | - | ||||||||||||
|
Forfeited |
(400,000 | ) | 3.04 | (1,300,000 | ) | 6.85 | ||||||||||
|
Balance, end of period |
2,000,000 | $ | 3.04 | - | $ | - | ||||||||||
|
Options exercisable at end of period |
- | $ | - | - | $ | - | ||||||||||
The following table summarizes the share options outstanding as well as share options vested and exercisable as of December 31, 2020 and 2019:
|
December 31, 2020 |
||||||||
|
Options Outstanding |
Options Vested and Exercisable |
|||||||
|
Weighted |
Weighted |
|||||||
|
Average |
Weighted |
Average |
Weighted |
|||||
|
Range of |
Remaining |
Average |
Aggregate |
Remaining |
Average |
Aggregate |
||
|
Exercise |
Number |
Contractual |
Exercise |
Intrinsic |
Number |
Contractual |
Exercise |
Intrinsic |
|
Prices |
Outstanding |
Life in Years |
Price |
Value |
Exercisable |
Life in Years |
Price |
Value |
|
3.04 |
2,000,000 |
4.10 |
$ 3.04 |
$ 1,620,000 |
- |
- |
$ - |
$ - |
The Company recognizes share-based compensation expense for share options over the vesting period using the accelerated attribution method when they are subject to graded vesting and on a straight-line basis when they are subject to cliff vesting.
There were no share options exercised during the years ended December 31, 2020 and December 31, 2020. As a result, the Company did not recognize any current income tax benefits from the exercise of share options during both years.
On February 5, 2020, the Company granted approximately 77,000 RSUs to certain employees of the Company as part of the 2019 deferred compensation program. 50% of these units vested on December 1, 2020 and the remaining 50% will vest on December 1, 2021, subject to the grantees’ continued employment through such dates. On the same date, February 5, 2020, the Company granted approximately 122,000 RSUs to its independent directors, 25% of these units vested on April 1, 2020, July 1, 2020, October 1, 2020 and January 1, 2021, respectively.
On February 6, 2019, the Company granted approximately 280,000 RSUs to certain employees of the Company as part of the 2018 deferred compensation program. 50% of these units vested on December 1, 2019 and the remaining 50% will vest on December 1, 2020, subject to the grantees’ continued employment through such dates. The Company also granted RSUs for new hires throughout the year which have various vesting schedules.
The following table summarizes RSU activity for the years ended December 31, 2020 and 2019:
|
Year Ended December 31, |
||||||||||||||||
|
2020 |
2019 |
|||||||||||||||
|
Restricted |
Weighted Average |
Restricted |
Weighted Average |
|||||||||||||
|
Share Units |
Grant Date Fair Value |
Share Units |
Grant Date Fair Value |
|||||||||||||
|
Balance, beginning of year |
387,006 | $ | 3.97 | 297,639 | $ | 4.79 | ||||||||||
|
Granted |
201,804 | 2.98 | 572,695 | 4.06 | ||||||||||||
|
Vested |
(368,601 | ) | 3.82 | (483,328 | ) | 4.58 | ||||||||||
|
Balance, end of period |
220,209 | $ | 3.32 | 387,006 | $ | 3.97 | ||||||||||
The aggregate fair value of RSUs vested during the years ended December 31, 2020 and 2019 were $1.4 million and $2.2 million, respectively. The income tax benefits realized from the vested RSUs were $0.3 million and $0.5 million for the years ended December 31, 2020 and 2019, respectively.
The Company recognizes compensation expense for RSUs over the vesting period using the accelerated attribution method when they are subject to graded vesting and on a straight-line basis when they are subject to cliff vesting.
For the years ended December 31, 2020 and 2019, the Company recognized income tax benefits of $0.3 million and $0.5 million, respectively, related to the compensation expense recognized for RSUs. As of December 31, 2020 and 2019, there was $0.3 million and $0.8 million, respectively, of unrecognized compensation expense related to RSUs expected to be recognized over a weighted average period of 1.3 years and 1.75 years, respectively.
The Company pays cash distribution equivalents on certain eligible unvested RSUs in the event the Company declares any cash distributions on its common shares during such eligible RSU’s vesting period. Distribution equivalents paid on RSUs are generally charged to retained earnings. Distribution equivalents paid on RSUs expected to be forfeited are included in compensation expense. The Company accounts for the tax benefit related to distribution equivalents paid on RSUs as an increase in additional paid-in capital.
Share Appreciation Rights
In February 2015, the Company granted an aggregate of 2,865,000 share appreciation rights (“SARs”) to certain employees and the Company’s independent directors. These SARs have a base price of $7.33 per share, an exercise period of five years and have vested and became exercisable on December 31, 2017 subject to the terms and conditions of the applicable grant agreements. The fair value of the SARs was determined using a quantitative model, using the following assumptions: expected life of 2.0 years, risk-free interest rate of 2.73%, distribution yield of 13.67%, and volatility of 20.00%. The risk-free rate was interpolated from the U.S. constant maturity treasuries for a term corresponding to the maturity of the SAR. The volatility was estimated from the historical weekly share prices of the Company as of the grant date for a term corresponding to the maturity of the SAR. The distribution yield was calculated as the sum of the last twelve-month distributions over the share price as of the grant date.
The following table summarizes the SARs activity for the years ended December 31, 2019:
|
Year Ended December 31, |
||||||||
|
2019 |
||||||||
|
Share Appreciation |
Weighted Average |
|||||||
|
Rights |
Exercise Price |
|||||||
|
Balance, beginning of year |
2,485,000 | $ | 7.33 | |||||
|
Expired |
(2,485,000 | ) | $ | 7.33 | ||||
|
Balance, end of period |
- | $ | - | |||||
The Company recognizes compensation expense for SARs over the vesting period. On December 31, 2020 and 2019, all of the SARs expired. For the years ended December 31, 2020 and 2019, the Company recorded no compensation or income tax benefit related to SARs.
As of December 31, 2020 and 2019, there was no unrecognized compensation expense related to SARs. In addition, no SARs were exercised during the years ended December 31, 2020 and 2019; as a result, the Company did not recognize any current income tax benefits from the exercise of SARs in both years.
13. Net Income (Loss) per Common Share
Basic net income (loss) per share for the Company is calculated by dividing net income by the weighted average number of common shares outstanding for the reporting period. Diluted net income (loss) per share is calculated by adjusting the weighted average number of outstanding shares to reflect the potential dilutive impact as if all potentially dilutive share options or RSUs were exercised or converted under the treasury share method. However, for periods that the Company has a net loss, the effect of outstanding share options or RSUs is anti-dilutive and, accordingly, is excluded from the calculation of diluted loss per share.
The computations of basic and diluted net loss per share for the years ended December 31, 2020 and 2019 are shown in the tables below:
|
(In thousands, except per share data) |
Year Ended December 31, |
|||||||
|
2020 |
2019 |
|||||||
|
Numerator: |
||||||||
|
Net loss attributable to JMP Group LLC |
$ | (4,697 | ) | $ | (6,549 | ) | ||
|
Denominator: |
||||||||
|
Basic weighted average shares outstanding |
19,613 | 20,189 | ||||||
|
Effect of potential dilutive securities: |
||||||||
|
Restricted share units |
- | - | ||||||
|
Diluted weighted average shares outstanding |
19,613 | 20,189 | ||||||
|
Net loss per share |
||||||||
|
Basic |
$ | (0.24 | ) | $ | (0.32 | ) | ||
|
Diluted |
$ | (0.24 | ) | $ | (0.32 | ) | ||
Share options to purchase 2,000,000 and 1,300,000 of common shares for both years ended December 31, 2020 and 2019, respectively, were anti-dilutive and, therefore, were not included in the computation of diluted weighted-average common shares outstanding.
RSUs for 347,106 and 579,341 common shares for the years ended December 31, 2020 and 2019, respectively, were anti-dilutive and, therefore, were not included in the computation of diluted weighted-average common shares outstanding. Due to the net loss for the years ended December 31, 2020 and 2019, all of the share options and RSUs outstanding, were anti-dilutive and, therefore, were not included in the computation of diluted weighted-average common shares outstanding.
14. Revenue from contracts with customers
The following tables represent the Company's total revenues from contracts with customers, disaggregated by major business activity, for the years ended December 31, 2020 and 2019, respectively.
|
(in thousands) |
Year Ended December 31, 2020 |
|||||||||||||||
|
Broker -Dealer |
Asset Management |
Eliminations |
Total |
|||||||||||||
|
Total revenues from contracts with customers |
||||||||||||||||
|
Equity and debt origination |
$ | 59,936 | $ | - | $ | - | $ | 59,936 | ||||||||
|
Strategic advisory and private placements |
40,449 | - | - | 40,449 | ||||||||||||
|
Total investment banking revenues |
100,384 | - | - | 100,384 | ||||||||||||
|
Commissions |
14,391 | - | - | 14,391 | ||||||||||||
|
Research payments |
4,925 | - | - | 4,925 | ||||||||||||
|
Net trading losses |
(391 | ) | - | - | (391 | ) | ||||||||||
|
Total brokerage revenues |
18,926 | - | - | 18,926 | ||||||||||||
|
Base management fees |
- | 6,704 | - | 6,704 | ||||||||||||
|
Incentive management fees |
- | 1,616 | - | 1,616 | ||||||||||||
|
Total asset management fees |
- | 8,320 | - | 8,320 | ||||||||||||
|
Total revenues from contracts with customers |
$ | 119,310 | $ | 8,320 | $ | - | $ | 127,630 | ||||||||
|
(in thousands) |
Year Ended December 31, 2019 |
|||||||||||||||
|
Broker -Dealer |
Asset Management |
Eliminations |
Total |
|||||||||||||
|
Total revenues from contracts with customers |
||||||||||||||||
|
Equity and debt origination |
$ | 42,236 | $ | - | $ | - | $ | 42,236 | ||||||||
|
Strategic advisory and private placements |
23,480 | - | - | 23,480 | ||||||||||||
|
Total investment banking revenues |
65,716 | - | - | 65,716 | ||||||||||||
|
Commissions |
12,062 | - | - | 12,062 | ||||||||||||
|
Research payments |
5,671 | - | - | 5,671 | ||||||||||||
|
Net trading losses |
(105 | ) | - | - | (105 | ) | ||||||||||
|
Total brokerage revenues |
17,628 | - | - | 17,628 | ||||||||||||
|
Base management fees |
- | 7,573 | (1,083 | ) | 6,490 | |||||||||||
|
Incentive management fees |
- | 937 | - | 937 | ||||||||||||
|
Total asset management fees |
- | 8,510 | (1,083 | ) | 7,427 | |||||||||||
|
Total revenues from contracts with customers |
$ | 83,344 | $ | 8,510 | $ | (1,083 | ) | $ | 90,771 | |||||||
15. Employee Benefits
The Company sponsors a 401(k) defined contribution plan for the benefit of all employees at their date of hire. The plan allows eligible employees to contribute a portion of their annual compensation, not to exceed annual limits established by the federal government. The Company makes matching contributions for participating employees up to a certain percentage of the employee contributions. Matching contributions totaled approximately $1.4 million for both the years ended December 31, 2020 and 2019. Benefits under this plan are available to all employees, and employees are fully vested in the employer contribution upon receipt.
16. Income Taxes
As of January 1, 2019, JMP Group LLC is taxed as a corporation for United States federal income tax purposes. Taxable income is derived from investment activities that are taxed at a U.S. federal and state corporate rate, along with the Company’s corporate subsidiaries.
The components of the Company’s income tax expense (benefit) for the years ended December 31, 2020 and 2019 are as follows:
|
(In thousands) |
Year Ended December 31, |
|||||||
|
2020 |
2019 |
|||||||
|
Federal |
$ | (2,007 | ) | $ | 248 | |||
|
State |
44 | 45 | ||||||
|
Total current income tax expense (benefit) |
(1,963 | ) | 293 | |||||
|
Federal |
(1,504 | ) | (5,487 | ) | ||||
|
State |
183 | (1,633 | ) | |||||
|
Total deferred income tax expense (benefit) |
(1,321 | ) | (7,120 | ) | ||||
|
Total income tax expense (benefit) |
$ | (3,284 | ) | $ | (6,827 | ) | ||
As of December 31, 2020 and 2019, the components of deferred tax assets and liabilities have been recorded in other assets and other liabilities in the Statements of Financial Condition and are as follows:
|
(In thousands) |
As of December 31, |
|||||||
|
2020 |
2019 |
|||||||
|
Deferred tax assets: |
||||||||
|
Equity based compensation |
$ | 141 | $ | 59 | ||||
|
Interest expense limitation |
1,045 | 59 | ||||||
|
Reserves and allowances |
133 | 222 | ||||||
|
California Enterprise Zone credit |
304 | 304 | ||||||
|
Federal and other state net operating loss |
1,426 | 4,928 | ||||||
|
Accrued compensation and related expenses |
1,671 | 2,502 | ||||||
|
Deferred compensation |
919 | 636 | ||||||
| Available for sale securities | 128 | 1,752 | ||||||
|
Investment in partnerships |
2,217 | 1,922 | ||||||
|
Tax basis difference - CLOs |
4,453 | 1,689 | ||||||
| Lease liability | 5,455 | 6,823 | ||||||
|
Other |
3 | 510 | ||||||
|
Total deferred tax assets |
17,895 | 21,406 | ||||||
|
Deferred tax liabilities: |
||||||||
|
Investment in partnerships |
(2,458 | ) | (1,772 | ) | ||||
|
Net unrealized gains on investments |
- | (457 | ) | |||||
| Right of use assets | (4,194 | ) | (5,275 | ) | ||||
| Other | (1,830 | ) | (1,141 | ) | ||||
|
Total deferred tax liabilities |
(8,482 | ) | (8,645 | ) | ||||
|
Net deferred tax asset before valuation allowance |
9,413 | 12,761 | ||||||
|
Valuation allowance |
- | - | ||||||
| Net deferred tax assets | $ | 9,413 | $ | 12,761 | ||||
As of December 31, 2020, the Company has federal and various state (post-apportioned) net operating losses of $3.0 million and $17.2 million, respectively. The federal net operating losses have no expiration date and the various state net operating losses will begin to expire in 2034. The Company also has tax credits generated under the California Enterprise Zone Program totaling $0.3 million which expire between 2023 and 2026. Management believes that the federal and state deferred tax assets will be realized based on positive evidence of significant reversing taxable temporary differences and forecasted income over the next few years.
A reconciliation of the statutory U.S. federal income tax rate to the effective tax rate for the years ended December 31, 2020 and 2019 is as follows:
|
Year Ended December 31, |
||||||||
|
2020 |
2019 |
|||||||
|
Tax at federal statutory tax rate |
21.00 | % | 21.00 | % | ||||
|
State income tax, net of federal tax benefit |
(3.02 | )% | 11.78 | % | ||||
|
Non-CLO non-controlling interest |
(0.24 | )% | (0.01 | )% | ||||
|
Adjustment for permanent items (Other) |
(1.20 | )% | (1.27 | )% | ||||
|
Adjustment for prior year taxes |
(0.05 | )% | (0.36 | )% | ||||
| Adjustment for change in tax status | 0.00 | % | 25.01 | % | ||||
|
Net operating loss carryback rate impact |
25.11 | % | 0.00 | % | ||||
|
Equity compensation shortfall |
(0.92 | )% | (5.12 | )% | ||||
|
Effective tax rate |
40.68 | % | 51.03 | % | ||||
The difference between the statutory tax rate and the effective tax rate for the year ended December 31, 2020 is primarily attributable to the net operating loss carryback that was created in prior year which was subsequently carried back to offset years with taxable income that was derived from a different corporate tax rate, as permitted by the CARES Act.
The Company files its tax returns as prescribed by the tax laws of the jurisdictions in which it operates; with the limited exception of certain jurisdictions which do not have a significant adverse effect on the Company’s overall tax exposure. The Company recognizes tax benefits related to its tax positions only where the position is “more likely than not” to be sustained in the event of examination by tax authorities. The Company filed income tax returns with the federal government and various state and local income tax examinations for years prior to 2020. The Company filed income tax returns with the federal government and various state and local jurisdictions. As of December 31, 2020, there is no material state exposure.
17. Commitments and Contingencies
In connection with its underwriting activities, JMP Securities may, from time to time, enter into firm commitments for the purchase of securities in return for a fee. These commitments require JMP Securities to purchase securities at a specified price. Securities underwriting exposes JMP Securities to market and credit risk, primarily in the event that, for any reason, securities purchased by JMP Securities cannot be distributed at anticipated price levels. At both December 31, 2020 and 2019, JMP Securities had no open underwriting commitments.
The marketable securities owned and the restricted cash, as well as the cash held by the clearing broker may be used to maintain margin requirements. The Company had $0.5 million and $0.3 million of cash on deposit with JMP Securities’ clearing broker at December 31, 2020 and 2019, respectively. Furthermore, the marketable securities owned may be hypothecated or borrowed by the clearing broker.
Unfunded commitments are agreements to lend to a borrower, provided that all conditions have been met. The Company had no material unfunded commitments to lend as of December 31, 2020 and 2019.
18. Regulatory Requirements
JMP Securities is subject to the SEC’s Uniform Net Capital Rule (Rule 15c3-1), which requires the maintenance of minimum net capital, as defined, and requires that the ratio of aggregate indebtedness to net capital, both as defined, shall not exceed 15 to 1. JMP Securities had net capital of $42.3 million and $16.9 million, which were $40.6 million and $15.5 million in excess of the required net capital of $1.7 million and $1.4 million at December 31, 2020 and 2019, respectively. JMP Securities’ ratio of aggregate indebtedness to net capital was 0.62 to 1 and 1.25 to 1 at December 31, 2020 and 2019,
Since all customer transactions are cleared through another broker-dealer on a fully disclosed basis, JMP Securities is not required to maintain a separate bank account for the exclusive benefit of customers in accordance with Rule 15c3-3 under the Exchange Act.
19. Related Party Transactions
The Company earns base management fees and incentive fees from serving as investment advisor for various entities, including corporations, partnerships limited liability companies, and offshore investment companies. The Company also owns an investment in some of such affiliated entities. As of December 31, 2020 and 2019, the aggregate fair value of the Company’s investments in the affiliated entities for which the Company serves as the investment advisor was $17.3 million for both periods which consisted of investments in hedge and other private funds of $9.8 and 8.6 million, respectively and an investment in HCC common stock of $7.5 million and $8.7 million, respectively. Base management fees earned from these affiliated entities were $6.7 million and $6.5 million for the years ended December 31, 2020 and 2019. Also, the Company earned incentive fees of $1.6 million and $0.9 million, from these affiliated entities for the years ended December 31, 2020 and 2019, respectively.
On September 19, 2017, the Company made a loan to a registered investment adviser of $3.4 million, at an interest rate of 15% per year. In October 2019, the Company sold 30% of the loan, or $1.0 million, to an affiliate. As of December 31, 2020 and December 31, 2019, the Company’s portion of the outstanding loan balance to this entity was $2.4 million. The Company determined the fair value of the loan was $2.4 million and $2.5 million as of December 31, 2020 and December 31, 2019, respectively, using the bid price.
On November 20, 2017, the Company entered into a purchase agreement with the same registered investment advisor for the purchase of 24.9% ownership of the entity. The Company recognized its investment using the equity method, with related gains recognized in other income. The company recognized $0.6 million in other income for the year ended December 31, 2020. As of December 31, 2020 the investment balance is $4.5 million.
20. Litigation
The Company is involved in a number of judicial, regulatory and arbitration matters arising in connection with our business. The outcome of matters the Company has been and currently is involved in cannot be determined at this time, and the results cannot be predicted with certainty, except for the matter described below. There can be no assurance that these matters will not have a material adverse effect on our results of operations in any future period and a significant judgment could have a material adverse impact on our financial condition, results of operations and cash flows. The Company may in the future become involved in additional litigation in the ordinary course of our business, including litigation that could be material to our business.
The Company reviews the need for any loss contingency reserves and establishes reserves when, in the opinion of management, it is probable that a matter would result in liability and the amount of loss, if any, can be reasonably estimated. Management, after consultation with legal counsel, believes that the currently known actions or threats will not result in any material adverse effect on the Company’s financial condition, results of operations or cash flows.
21. Financial Instruments with Off-Balance Sheet Risk, Credit Risk or Market Risk
The majority of the Company’s transactions, and consequently the concentration of its credit exposure, is with its clearing brokers. The Company may enter into margin transactions in its principal trading accounts held at a clearing broker. Such margin transactions are collateralized by the Company’s cash and securities held in those accounts. Clearing brokers have the right to pledge or hypothecate such collateralized assets under the margin transaction agreement. The receivable from the clearing brokers include commissions receivable related to security transactions of customers and amounts receivable in connection with the trading of proprietary positions. The Company is also exposed to credit risk from other brokers, dealers and other financial institutions with which it transacts business. In the event that these other parties do not fulfill their obligations in the course of business dealings, the Company may be exposed to credit risk.
The Company’s trading activities include providing securities brokerage services to institutional clients. To facilitate these customer transactions, the Company purchases proprietary securities positions (“long positions”) in equity securities. The Company also enters into transactions to sell securities not yet purchased (“short positions”), which are recorded as liabilities on the Consolidated Statements of Financial Condition. The Company is exposed to market risk on these long and short securities positions as a result of decreases in market value of long positions and increases in market value of short positions. Short positions create a liability to purchase the security in the market at prevailing prices. Such transactions result in off-balance sheet market risk as the Company’s ultimate obligation to satisfy the sale of securities sold, but not yet purchased, may exceed the amount recorded in the Consolidated Statements of Financial Condition. To mitigate the risk of losses, these securities positions are marked to market daily and are monitored by management to assure compliance with limits established by the Company.
JMP Securities has agreed to indemnify its clearing brokers for losses that the clearing brokers may sustain from the accounts of customers introduced by JMP Securities. Should a customer not fulfill its obligation on a transaction, JMP Securities may be required to buy or sell securities at prevailing market prices in the future on behalf of its customer. JMP Securities’ indemnification obligations to its clearing brokers have no maximum amount. All unsettled trades at December 31, 2020 and 2019 have subsequently settled with no resulting material liability to the Company. For the year ended December 31, 2020 and 2019, the Company had no material loss due to counterparty failure, and had no obligations outstanding under the indemnification arrangement as of December 31, 2020 and 2019.
The Company is engaged in various investment banking and brokerage activities whose counterparties primarily include broker-dealers, banks and other financial institutions. In the event counterparties do not fulfill their obligations, the Company may be exposed to risk. The risk of default depends on the creditworthiness of the counterparty or issuer of the instrument. It is the Company’s policy to review, as necessary, the credit standing of each counterparty with which it conducts business.
Standby letters of credit are conditional commitments issued by the Company to guarantee the performance by a borrower to a third party. The Company’s exposure to credit loss in the event of nonperformance by the other party to the financial instrument for standby letters of credit is represented by the contractual amount of those instruments. The Company uses the same credit policies in making commitments and conditional obligations as it does for on balance sheet instruments. The credit risk involved in issuing letters of credit is essentially the same as that involved in extending loans to borrowers. The Company had no material unfunded commitments to lend to a borrower as of December 31, 2020 and 2019.
22. Business Segments
The Company’s business results are categorized into the following four business segments: Broker-Dealer, Asset Management Fee Income, Investment Income, and Corporate costs. The Broker-Dealer segment includes a broad range of services, such as underwriting and acting as a placement agent for public and private capital markets raising transactions and financial advisory services in M&A, restructuring and other strategic transactions. The Broker-Dealer segment also includes institutional brokerage services and equity research services to our institutional investor clients. The Asset Management Fee Income segment includes the management of a broad range of pooled investment vehicles, including the Company’s hedge funds, private equity funds, hedge funds of funds, and collateralized loan obligations (through March 2019). The Investment income segment includes income from the Company’s principal investments in public and private securities and investment funds managed by HCS, as well as any other net interest and income from investing activities, and interest expense related to the Company's bond issuance. The Corporate Costs segment also includes expenses related to JMP Group LLC, JMP Holding LLC and JMP Group Inc., and is mainly comprised of corporate overhead expenses.
Management uses operating net income, a Non-GAAP financial measure, as a key metric when evaluating the performance of the Company's core business strategy and ongoing operations. This measure adjusts the Company’s net income as follows: (i) reverses share-based compensation expense recognized during the period, (ii) recognizes 100% of the share-based compensation expense in the period the award was granted, instead of recognizing it over the vesting period as required under GAAP, (iii) reverses amortization expense related to an intangible asset resulting from the repurchase of a portion of the equity of CLO III prior to March 31, 2019; (iv) unrealized gains or losses on commercial real estate investments, adjusted for non-cash expenditures, including depreciation and amortization; (v) reverses net unrealized gains and losses on strategic equity investments and warrants; (vi) reverses any impairment of CLO debt securities recognized in principal transactions, (vii) reverses one-time transaction costs related to the refinancing or repurchase of debt; (viii) reverses a charge recorded in connection with severance costs deriving from a strategic restructuring and reduction in headcount in September 2020; (ix) a combined federal, state and local income tax rate of 26% at the consolidated taxable parent company, JMP Group LLC; and (x) presents revenues and expenses on a basis that deconsolidates the CLOs (through March 31, 2019) and removes any non-controlling interest in consolidated but less than wholly owned subsidiaries. In management's view of the Company's performance, these charges may obscure the Company’s operating income and complicate an assessment of the Company’s core business activities. The operating pre-tax net income facilitates a meaningful comparison of the Company’s results from period to period.
Segment Operating Results
Discussed below is our Operating Net Income by segment. This information is reflected in a manner utilized by management to assess the financial operations of the Company's various business lines.
|
Year Ended December 31, 2020 |
||||||||||||||||||||||||||||||||||||
|
(In thousands) |
Broker-Dealer |
Asset Management |
Corporate Costs |
Eliminations |
Total Segments |
Adjustments |
Consolidated GAAP |
|||||||||||||||||||||||||||||
|
Asset Management Fee Income |
Investment Income |
Total Asset Management |
||||||||||||||||||||||||||||||||||
|
Revenues |
||||||||||||||||||||||||||||||||||||
|
Investment banking |
$ | 100,384 | $ | - | $ | - | $ | - | $ | - | $ | - | $ | 100,384 | $ | - | $ | 100,384 | ||||||||||||||||||
|
Brokerage |
18,926 | - | - | - | - | - | 18,926 | - | 18,926 | |||||||||||||||||||||||||||
|
Asset management related fees |
180 | 9,264 | 1,462 | 10,726 | - | (149 | ) | 10,757 | (2,437 | ) |
(a) |
8,320 | ||||||||||||||||||||||||
|
Principal transactions |
1,491 | - | 4,706 | 4,706 | - | - | 6,197 | (24,725 | ) |
(b) |
(18,528 | ) | ||||||||||||||||||||||||
|
Net dividend income |
- | - | 539 | 539 | - | - | 539 | (139 | ) |
(c) |
400 | |||||||||||||||||||||||||
|
Other income |
- | - | - | - | - | - | - | 3,735 |
(a) |
3,735 | ||||||||||||||||||||||||||
|
Net interest income |
- | - | 1,780 | 1,780 | - | - | 1,780 | (103 | ) |
(c) |
1,677 | |||||||||||||||||||||||||
|
Gain (loss) on repurchase, reissuance or early retirement of debt |
- | - | 786 | 786 | - | - | 786 | (89 | ) |
(d) |
697 | |||||||||||||||||||||||||
| Provision for loan losses | - | - | (113 | ) | (113 | ) | - | - | (113 | ) | 1 | (112 | ) | |||||||||||||||||||||||
|
Total net revenues |
120,981 | 9,264 | 9,160 | 18,424 | - | (149 | ) | 139,256 | (23,757 | ) | 115,499 | |||||||||||||||||||||||||
|
Non-interest expenses |
102,888 | 8,983 | 928 | 9,911 | 9,637 | (149 | ) | 122,287 | 1,287 |
(e) |
123,574 | |||||||||||||||||||||||||
|
Operating income (loss) before taxes |
18,093 | 281 | 8,232 | 8,513 | (9,637 | ) | - | 16,969 | (25,044 | ) | (8,075 | ) | ||||||||||||||||||||||||
|
Income tax expense (benefit) |
4,696 | 72 | 2,148 | 2,220 | (2,505 | ) | - | 4,412 | (7,696 | ) |
(f) |
(3,284 | ) | |||||||||||||||||||||||
|
Net loss attributable to non-controlling interest |
- | - | - | - | - | - | - | (94 | ) |
(a),(c),(e) |
(94 | ) | ||||||||||||||||||||||||
|
Operating net income (loss) |
$ | 13,397 | $ | 209 | $ | 6,084 | $ | 6,293 | $ | (7,133 | ) | $ | - | $ | 12,558 | $ | (17,254 | ) |
(g) |
$ | (4,697 | ) | ||||||||||||||
|
As of December 31, 2020 |
||||||||||||||||||||||||||||||||||||
|
(In thousands) |
Broker-Dealer |
Asset Management |
Corporate Costs |
Eliminations |
Total Segments |
Adjustments |
Consolidated GAAP |
|||||||||||||||||||||||||||||
|
Asset Management Fee Income |
Investment Income |
Total Asset Management |
||||||||||||||||||||||||||||||||||
|
Segment assets |
$ | 90,604 | $ | 13,701 | $ | 75,654 | $ | 89,354 | $ | 147,196 | $ | (85,822 | ) | $ | 241,331 | $ | - | $ | 241,331 | |||||||||||||||||
|
(a) |
Total segment asset management-related fees include income from fee sharing arrangements with, and fees earned to raise capital for, third-party or equity-method investment partnerships or funds, which are reported as other income under GAAP. In addition, total segment asset management-related fees exclude base management fees and incentive fees attributable to non-controlling interest. |
|
(b) |
Total segment principal transaction revenues exclude certain unrealized mark-to-market gains or losses, including those related to impairment of CLO debt securities and the Company's investment in Harvest Capital Credit Corporation, as well as unrealized losses derived from depreciation and amortization of real estate investment properties. |
|
(c) |
Total segment net dividend income and net interest income exclude those attributable to non-controlling interests. |
|
(d) |
Total segment gain/(loss) repurchase/early retirement of debt excludes losses on write offs of debt issuance costs related to early retirement or repurchase of debt. |
|
(e) |
Total segments non-interest expenses exclude compensation expense recognized under GAAP related to equity awards, one-time charge recorded in connection with severance costs deriving from strategic restructuring and reduction of headcount, and expenses attributable to non-controlling interests. |
|
(f) |
Total segment income tax (benefit) assumes a combined federal, state and local income tax rate of 26%. |
|
(g) |
Operating net income (loss) is reconciled to GAAP net income (loss) attributable to JMP Group LLC. |
|
Year Ended December 31, 2019 |
||||||||||||||||||||||||||||||||||||
|
(In thousands) |
Broker-Dealer |
Asset Management |
Corporate Costs |
Eliminations |
Total Segments |
Adjustments |
Consolidated GAAP |
|||||||||||||||||||||||||||||
|
Asset Management Fee Income |
Investment Income |
Total Asset Management |
||||||||||||||||||||||||||||||||||
|
Revenues |
||||||||||||||||||||||||||||||||||||
|
Investment banking |
$ | 65,716 | $ | - | $ | - | $ | - | $ | - | $ | - | $ | 65,716 | $ | - | $ | 65,716 | ||||||||||||||||||
|
Brokerage |
17,628 | - | - | - | - | - | 17,628 | - | 17,628 | |||||||||||||||||||||||||||
|
Asset management related fees |
20 | 8,691 | 989 | 9,680 | - | (1,140 | ) | 8,560 | (1,133 | ) |
(a) |
7,427 | ||||||||||||||||||||||||
|
Principal transactions |
- | - | 8,465 | 8,465 | - | - | 8,465 | (7,121 | ) |
(b) |
1,344 | |||||||||||||||||||||||||
| Gain on sale, payoff, and mark-to-market of loans | - | - | (39 | ) | (39 | ) | - | - | (39 | ) | 1 | (38 | ) | |||||||||||||||||||||||
|
Net dividend income |
- | - | 1,337 | 1,337 | - | - | 1,337 | (153 | ) |
(c) |
1,184 | |||||||||||||||||||||||||
|
Other income |
- | - | - | - | - | - | - | 2,373 |
(a) |
2,373 | ||||||||||||||||||||||||||
|
Gain (loss) on repurchase. reissuance or early retirement of debt |
- | - | - | - | - | - | - | (458 | ) |
(d) |
(458 | ) | ||||||||||||||||||||||||
|
Provision for loan losses |
- | - | (438 | ) | (438 | ) | - | - | (438 | ) | - | (438 | ) | |||||||||||||||||||||||
|
Net interest income |
- | - | 5,317 | 5,317 | - | - | 5,317 | 26 |
(c) |
5,343 | ||||||||||||||||||||||||||
|
Total net revenues |
83,364 | 8,691 | 15,631 | 24,322 | - | (1,140 | ) | 106,546 | (6,465 | ) | 100,081 | |||||||||||||||||||||||||
|
Non-interest expenses |
90,066 | 9,352 | 2,351 | 11,703 | 7,067 | (1,140 | ) | 107,696 | 5,768 |
(e) |
113,464 | |||||||||||||||||||||||||
|
Operating income (loss) before taxes |
(6,702 | ) | (661 | ) | 13,280 | 12,619 | (7,067 | ) | - | (1,150 | ) | (12,233 | ) | (13,383 | ) | |||||||||||||||||||||
|
Income tax expense (benefit) |
(1,742 | ) | (172 | ) | 3,432 | 3,260 | (1,817 | ) | - | (299 | ) | (6,528 | ) |
(f) |
(6,827 | ) | ||||||||||||||||||||
|
Net income attributable to non-controlling interest |
- | - | - | - | - | - | - | (7 | ) |
(a),(c),(e) |
(7 | ) | ||||||||||||||||||||||||
|
Operating net income (loss) |
$ | (4,960 | ) | $ | (489 | ) | $ | 9,848 | $ | 9,359 | $ | (5,250 | ) | $ | - | $ | (851 | ) | $ | (5,698 | ) |
(g) |
$ | (6,549 | ) | |||||||||||
|
As of December 31, 2019 |
||||||||||||||||||||||||||||||||||||
|
(In thousands) |
Broker-Dealer |
Asset Management |
Corporate Costs |
Eliminations |
Total Segments |
Adjustments |
Consolidated GAAP |
|||||||||||||||||||||||||||||
|
Asset Management Fee Income |
Investment Income |
Total Asset Management |
||||||||||||||||||||||||||||||||||
|
Segment assets |
$ | 62,425 | $ | 12,281 | $ | 84,003 | $ | 96,284 | $ | 234,443 | $ | (162,895 | ) | $ | 230,257 | $ | - | $ | 230,257 | |||||||||||||||||
|
(a) |
Total segment asset management-related fees include income from fee sharing arrangements with, and fees earned to raise capital for, third-party or equity-method investment partnerships or funds, which are reported as other income under GAAP. In addition, total segment asset management-related fees exclude base management fees and incentive fees attributable to non-controlling interest. |
|
(b) |
Total segment principal transaction revenues exclude certain unrealized mark-to-market gains or losses, including those related to impairment of CLO debt securities and the Company's investment in Harvest Capital Credit Corporation, as well as unrealized losses derived from depreciation and amortization of real estate investment properties. |
|
(c) |
Total segment net dividend income and net interest income exclude those attributable to non-controlling interests. |
|
(d) |
Total segment gain/(loss) repurchase/early retirement of debt excludes losses on write offs of debt issuance costs related to early retirement or repurchase of debt. |
|
(e) |
Total segments non-interest expenses exclude compensation expense recognized under GAAP related to equity awards and expenses attributable to non-controlling interests. |
|
(f) |
Total segment income tax (benefit) assumes a combined federal, state and local income tax rate of 26%. |
|
(g) |
Operating net income (loss) is reconciled to GAAP net income (loss) attributable to JMP Group LLC. |
23. Summarized financial information for equity method investments
The Company had a significant investment in real estate entities as of December 31, 2020 and 2019. Summarized combined consolidated financial information as of and for the years ended December 31, 2020 and 2019, is presented as follows:
|
As of December 31, |
||||||||
|
(In thousands) |
2020 |
2019 |
||||||
|
Real estate properties, net |
$ | 986,088 | $ | 1,005,927 | ||||
|
Total assets |
$ | 1,112,789 | $ | 1,137,263 | ||||
|
Mortgages payable, net |
$ | 1,290,270 | $ | 1,281,738 | ||||
|
Total liabilities |
$ | 1,330,237 | $ | 1,318,941 | ||||
|
Total owners' deficit |
$ | (217,448 | ) | $ | (181,678 | ) | ||
|
Total liabilities and owners' deficit |
$ | 1,112,789 | $ | 1,137,263 | ||||
|
Year Ended December 31, |
||||||||
|
(In thousands) |
2020 |
2019 |
||||||
|
Total revenues |
$ | 193,324 | $ | 194,428 | ||||
|
Net loss |
$ | (8,554 | ) | $ | (18,001 | ) | ||
24. Nonconsolidated Variable Interest Entities
VIEs for which the Company is not the primary beneficiary consists of private equity funds, CLO investments, and other investments in which the Company has an equity ownership interest. In the first quarter of 2019, the Company deconsolidated its CLOs from its Consolidated Statements of Financial Condition but retained an ownership investment in the CLOs. As the CLOs are VIEs, the CLOs are presented in the nonconsolidated VIE table as of December 31, 2020 and 2019. See Note 1, Organization and Description of a Business, for additional information on deconsolidation of the CLOs. The Company's maximum exposure to loss from its non-consolidated VIEs consists of equity investments and receivables as follows:
|
(In thousands) |
As of |
|||||||||||||||||||||||||||||||
|
December 31, 2020 |
December 31, 2019 |
|||||||||||||||||||||||||||||||
|
Financial Statement |
Maximum |
Financial Statement |
Maximum |
|||||||||||||||||||||||||||||
|
Carrying Amount |
Exposure to |
Carrying Amount |
Exposure to |
|||||||||||||||||||||||||||||
|
Assets |
Liabilities |
Loss |
VIE Assets |
Assets |
Liabilities |
Loss |
VIE Assets |
|||||||||||||||||||||||||
|
CLOs |
$ | 52,714 | $ | - | $ | 52,714 | $ | 1,169,243 | $ | 73,266 | $ | - | $ | 73,266 | $ | 1,439,442 | ||||||||||||||||
|
Fund investments |
10,765 | 311 | 14,311 | 465,365 | 10,396 | 207 | 14,196 | 346,206 | ||||||||||||||||||||||||
|
Other investments |
4,404 | 25 | 4,404 | 1,172,018 | 4,424 | 95 | 4,424 | 1,140,128 | ||||||||||||||||||||||||
|
Total |
$ | 67,883 | $ | 336 | $ | 71,429 | $ | 2,806,626 | $ | 88,086 | $ | 302 | $ | 91,886 | $ | 2,925,776 | ||||||||||||||||
25. Subsequent Events
|
Changes in and Disagreements With Accountants on Accounting and Financial Disclosure |
None.
|
Controls and Procedures |
The Company’s management, with the participation of the Company’s Chairman and Chief Executive Officer and the Chief Financial Officer (the principal executive officer and principal financial officer, respectively), has evaluated the disclosure controls and procedures as defined in Rules 13a-15(e) and 15d-15(e) under the Securities and Exchange Act of 1934, as amended as of December 31, 2020, based on the criteria established in Internal Control- Integrated Framework (2013) issued by the Committee of Sponsoring Organizations (“COSO”) of the Treadway Commission.
Based on their evaluation, the Chairman and Chief Executive Officer and Chief Financial Officer have concluded that, as of December 31, 2020, the disclosure controls and procedures were effective to provide reasonable assurance that the information required to be disclosed in the reports filed or submitted by the Company under the Exchange Act, was (i) recorded, processed, summarized and reported within the time periods specified in the SEC’s rules and forms, and (ii) accumulated and communicated to the Company management, including the Chairman and Chief Executive Officer and the Chief Financial Officer, as appropriate, to allow timely decisions regarding required disclosure.
The management of JMP Group LLC is responsible for establishing and maintaining adequate internal control over financial reporting to provide reasonable assurance regarding the reliability of our financial reporting and the preparation of financial statements for external reporting purposes in accordance with GAAP.
The Company’s internal control over financial reporting includes those policies and procedures that (i) pertain to the maintenance of records that, in reasonable detail, accurately and fairly reflect the transactions and dispositions of the assets of the company; (ii) provide reasonable assurance that transactions are recorded as necessary to permit preparation of financial statements in accordance with generally accepted accounting principles, and that receipts and expenditures of the company are being made only in accordance with authorizations of management and directors of the company; and (iii) provide reasonable assurance regarding prevention or timely detection of unauthorized acquisition, use, or disposition of the company’s assets that could have a material effect on the financial statements.
Internal control over financial reporting cannot provide absolute assurance of achieving financial reporting objectives because of the inherent limitations of any system of internal control. Internal control over financial reporting is a process that involves human diligence and compliance and is subject to lapses of judgment and breakdowns resulting from human failures. Internal control over financial reporting also can be circumvented by collusion or improper overriding of controls. As a result of such limitations, there is risk that material misstatements may not be prevented or detected on a timely basis by internal control over financial reporting. Also, projections of any evaluation of effectiveness to future periods are subject to the risk that controls may become inadequate because of changes in conditions, or that the degree of compliance with the policies or procedures may deteriorate. However, these inherent limitations are known features of the financial reporting process. Therefore, it is possible to design into the process safeguards to reduce, though not eliminate, this risk.
Management assessed the effectiveness of the Company’s internal control over financial reporting as of December 31, 2020. This assessment was based on criteria for effective internal control over financial reporting described in “Internal Control—Integrated Framework (2013),” issued by the Committee of Sponsoring Organizations of the Treadway Commission. Based on this assessment, management concluded that, as of December 31, 2020, the Company maintained effective internal control over financial reporting.
There was no change in the Company’s internal control over financial reporting that occurred during the three months ended December 31, 2020 that has materially affected, or is reasonably likely to materially affect, the Company’s internal control over financial reporting.
|
Other Information |
None.
|
Directors, Executive Officers and Corporate Governance |
The information required by this item will be contained in the sections of the Company’s Proxy Statement for the 2020 Annual Meeting of Shareholders, captioned “Board of Directors,” “Compensation of Directors,” and “Delinquent Section 16(a) Reports,” to the extent required, which are incorporated herein by reference.
|
Executive Compensation |
Information with respect to this item will be contained in the sections of the Company’s Proxy Statement for the 2020 Annual Meeting of Shareholders, captioned “Executive Compensation” which is incorporated herein by reference.
|
Security Ownership of Certain Beneficial Owners and Management and Related Shareholder Matters |
Information with respect to this item will be contained in the sections of the Company’s Proxy Statement for the 2020 Annual Meeting of Shareholders, captioned “Security Ownership of Certain Beneficial Owners and Management” and “Equity Compensation Plan Information” which are incorporated herein by reference.
|
Certain Relationships and Related Transactions, and Director Independence |
Information with respect to this item will be contained in the sections of the Company’s Proxy Statement for the 2020 Annual Meeting of Shareholders, captioned “Related Party Transactions” and “Director Independence” which are incorporated herein by reference.
|
Principal Accountant Fees and Services |
Information with respect to this item will be contained in the sections of the Company’s Proxy Statement for the 2020 Annual Meeting of Shareholders, captioned “Fees Paid to Independent Registered Public Accounting Firm” which is incorporated herein by reference.
|
Exhibits and Financial Statement Schedules |
(a) Documents filed as part of this Form 10-K:
1. Financial Statements
The following financial statements of JMP Group LLC, together with the report thereon of Marcum LLP, an independent registered public accounting firm, are included in this Annual Report:
INDEX TO CONSOLIDATED FINANCIAL STATEMENTS
The Report of Independent Registered Public Accounting Firm, the financial statements and the notes to the financial statements listed above are set forth beginning on page 55 of this Annual Report.
|
2. |
Financial Statement Schedules |
Separate financial statement schedules have been omitted either because they are not applicable or because the required information is included in the consolidated financial statements.
|
3. |
Exhibits Required to be Filed by Item 601 of Regulation S-K. |
See the Exhibit Index immediately following this page for a list of the exhibits being filed or furnished with or incorporated by reference into this Form 10-K.
None.
|
* |
Filed herewith |
Date: March 29, 2021
JMP GROUP LLC
|
By: |
|
/ S / JOSEPH A. JOLSON
|
|
|
Joseph A. Jolson |
|
|
|
Chairman and Chief Executive Officer
|
Date: March 29, 2021
|
Signature |
|
Title |
|
/ S / JOSEPH A. JOLSON
|
|
Director, Chairman and Chief Executive Officer
|
| Joseph A. Jolson | (principal executive officer) | |
|
|
||
|
/ S / RAYMOND S. JACKSON
|
|
Chief Financial Officer
|
| Raymond S. Jackson | (principal financial and accounting officer) | |
|
|
||
|
/ S / CRAIG R. JOHNSON
|
|
Director
|
| Craig R. Johnson | ||
|
|
||
|
/ S / DAVID M. DIPIETRO
|
|
Director
|
| David M. DiPietro | ||
|
|
||
|
/ S / KENNETH M. KARMIN
|
|
Director
|
| Kenneth M. Karmin | ||
|
|
||
|
/ S / MARK L. LEHMANN
|
|
Director
|
| Mark L. Lehmann | ||
|
|
||
|
/ S / H. MARK LUNENBURG
|
|
Director
|
| H. Mark Lunenburg | ||
|
|
||
|
/ S / CARTER D. MACK
|
Director | |
| Carter D. Mack | ||
|
/ S / JONATHAN M. ORSZAG
|
|
Director
|
| Jonathan M. Orszag | ||
|
|
||
|
/ S / STACI SLAUGHTER
|
Director
|
|
| Staci Slaughter | ||
|
/ S / GLENN H. TONGUE
|
|
Director
|
| Glenn H. Tongue | ||