Attached files
| file | filename |
|---|---|
| EX-99.1 - PRESS RELEASE, DATED MARCH 29, 2021, REPORTING FINANCIAL RESULTS FOR THE FOURTH - Danimer Scientific, Inc. | ea138515ex99-1_danimersci.htm |
| 8-K - CURRENT REPORT - Danimer Scientific, Inc. | ea138515-8k_danimersci.htm |
Exhibit 99.2

2020 Earnings Presentation March 29, 2021

Disclai m er 2 This presentation (“Presentation”) is for informational purposes only . This Presentation shall not constitute an offer to sell, or the solicitation of an offer to buy, any securities, nor shall there be any sale of securities in any states or jurisdictions in which such offer, solicitation or sale would be unlawful . No representations or warranties, express or implied, are given in, or in respect of, this Presentation . To the fullest extent permitted by law in no circumstances will Danimer Scientific, Inc . (the “Company”) or any of its subsidiaries, stockholders, affiliates, representatives, directors, officers, employees, advisers, or agents be responsible or liable for a direct, indirect, or consequential loss or loss of profit arising from the use of this Presentation, its contents, its omissions, reliance on the information contained within it, or on opinions communicated in relation thereto or otherwise arising in connection therewith . Industry and market data used in this Presentation have been obtained from third - party industry publications and sources as well as from research reports prepared for other purposes . The Company has not independently verified the data obtained from these sources and cannot assure you of the data’s accuracy or completeness . This data is subject to change . In addition, this Presentation does not purport to be all - inclusive or to contain all of the information that may be required to make a full analysis of investigations as they deem necessary . FORWARD - LOOKING STATEMENTS Please note that in this Presentation, we may use words such as “appears,” “anticipates,” “believes,” “plans,” “expects,” “intends,” “future,” and similar expressions which constitute forward - looking statements within the meaning of the safe harbor provisions of the Private Securities Litigation Reform Act of 1995 . Forward - looking statements are made based on Management’s expectations and beliefs concerning future events impacting the Company and therefore involve a number of risks and uncertainties . The Company cautions that forward - looking statements are not guarantees and that actual results could differ materially from those expressed or implied in the forward - looking statements . Potential risks and uncertainties that could cause the actual results of operations or financial condition of the Company to differ materially from those expressed or implied by forward - looking statements in this Presentation include, but are not limited to, the overall level of consumer demand on its products ; general economic conditions and other factors affecting consumer confidence, preferences, and behavior ; disruption and volatility in the global currency, capital, and credit markets ; the financial strength of the Company's customers ; the Company's ability to implement its business strategy, including, but not limited to, its ability to expand its production facilities and plants to meet customer demand for its products and the timing thereof ; risks relating to the uncertainty of the projected financial information with respect to the Company ; the ability of the Company to execute and integrate acquisitions ; changes in governmental regulation, legislation or public opinion relating to its products ; the Company’s exposure to product liability or product warranty claims and other loss contingencies ; disruptions and other impacts to the Company’s business, as a result of the COVID - 19 global pandemic and government actions and restrictive measures implemented in response ; stability of the Company’s manufacturing facilities and suppliers, as well as consumer demand for its products, in light of disease epidemics and health - related concerns such as the COVID - 19 global pandemic ; the impact that global climate change trends may have on the Company and its suppliers and customers ; the Company's ability to protect patents, trademarks and other intellectual property rights ; any breaches of, or interruptions in, its information systems ; the ability of its information technology systems or information security systems to operate effectively, including as a result of security breaches, viruses, hackers, malware, natural disasters, vendor business interruptions or other causes ; its ability to properly maintain, protect, repair or upgrade its information technology systems or information security systems, or problems with its transitioning to upgraded or replacement systems ; the impact of adverse publicity about the Company and/or its brands, including without limitation, through social media or in connection with brand damaging events and/or public perception ; fluctuations in the price, availability and quality of raw materials and contracted products as well as foreign currency fluctuations ; its ability to utilize potential net operating loss carryforwards ; and changes in tax laws and liabilities, tariffs, legal, regulatory, political and economic risks . More information on potential factors that could affect the Company's financial results is included from time to time in the Company's public reports filed with the Securities and Exchange Commission, including the Company's Annual Report on Form 10 - K, Quarterly Reports on Form 10 - Q, and Current Reports on Form 8 - K . All forward - looking statements included in this Presentation are based upon information available to the Company as of the date of this Presentation and speak only as of the date hereof . The Company assumes no obligation to update any forward - looking statements to reflect events or circumstances after the date of this presentation . USE OF PROJECTIONS This Presentation contains projected financial information with respect to the Company . Such projected financial information constitutes forward - looking information and is for illustrative purposes only and should not be relied upon as necessarily being indicative of future results . The assumptions and estimates underlying such financial information are inherently uncertain and are subject to a wide variety of significant business, economic, competitive, and other risks and uncertainties . See “Forward - Looking Statements” above . Actual results may differ materially from the results contemplated by the financial forecast information contained in this Presentation, and the inclusion of such information in this Presentation should not be regarded as a representation by any person that the results reflected in such forecasts will be achieved .. FINANCIAL INFORMATION; NON - GAAP FINANCIAL MEASURES Some of the financial information and data contained in this Presentation, such as Adjusted EBITDA, Adjusted EBITDAR and Adjusted Gross Profit has not been prepared in accordance with United States generally accepted accounting principles (“GAAP”) . The Company believes these non - GAAP measures of financial results provide useful information to management and investors regarding certain financial and business trends relating to the Company’s financial condition and results of operations . The Company’s management uses these non - GAAP measures for trend analyses and for budgeting and planning purposes . A reconciliation of these non - GAAP financial measures to the closest GAAP measure is included in the Appendix to the Presentation . You should review the Company’s audited financial statements prepared in accordance with GAAP, which will be included in its Annual Report on Form 10 - K to be filed with the SEC . TRADEMARKS This Presentation contained trademarks, service marks, trade names, and copyrights of, the Company, and other companies, which are the property of their respective owners. The information contained herein is as of March 29, 2021, and does not reflect any subsequent events.
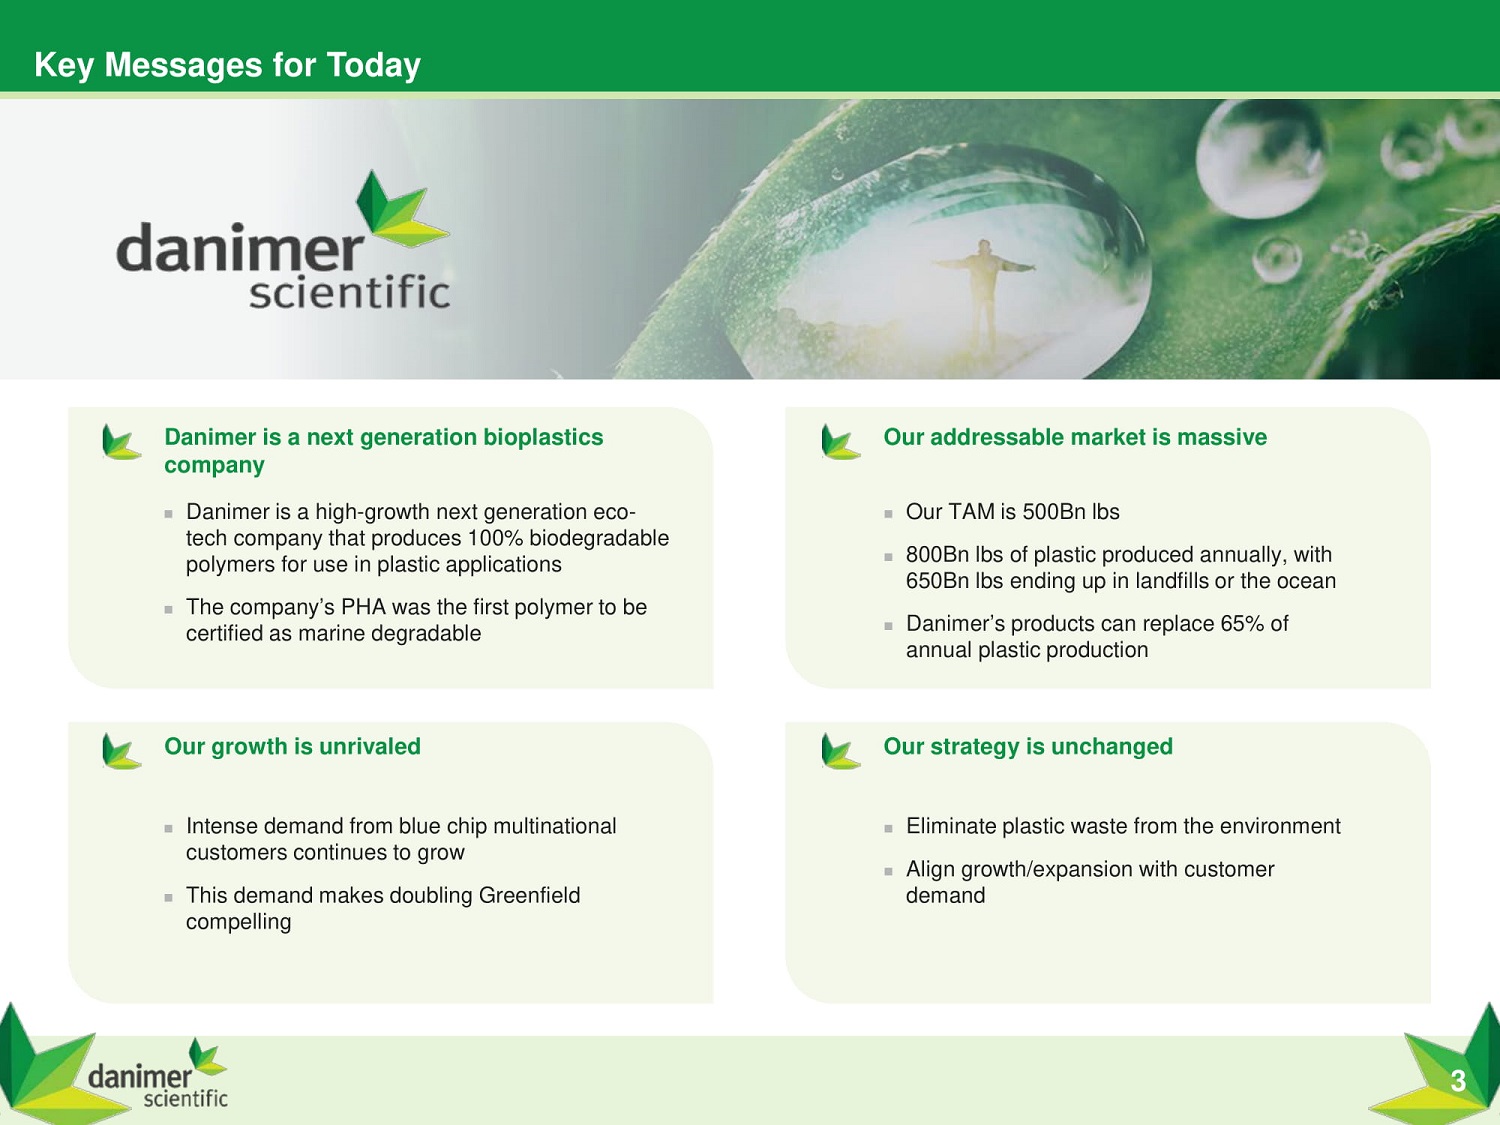
Key Messages for Today Danimer is a next generation bioplastics company Danimer is a high - growth next generation eco - tech company that produces 100% biodegradable polymers for use in plastic applications The company’s PHA was the first polymer to be certified as marine degradable Our addressable market is massive Our TAM is 500Bn lbs 800Bn lbs of plastic produced annually, with 650Bn lbs ending up in landfills or the ocean Danimer’s products can replace 65% of annual plastic production Our growth is unrivaled Intense demand from blue chip multinational customers continues to grow This demand makes doubling Greenfield compelling 3 Our strategy is unchanged Eliminate plastic waste from the environment Align growth/expansion with customer demand

Danimer is a Next Generation Bioplastics Company Experienced Leadership Team and Board of Directors with Proven Track Record 6 Significant Tailwinds From Increased Corporate and Legislative Initiatives on Environmental Impact of Global Pollution Crisis 2 Highly Attractive PHA Technology Serves as a Best End - of - Life Solution for Plastics 1 Rapidly Growing Blue Chip Customer Base Driving Demand in Excess of Current Capacity 5 Leading PHA Innovator with Patent Protected Technology and 13 Years of Production Know - How 3 Strong Partnerships with CPG Brands, Including Pepsi and Nestle, and Key Converters such as Wincup and Genpak 4 4
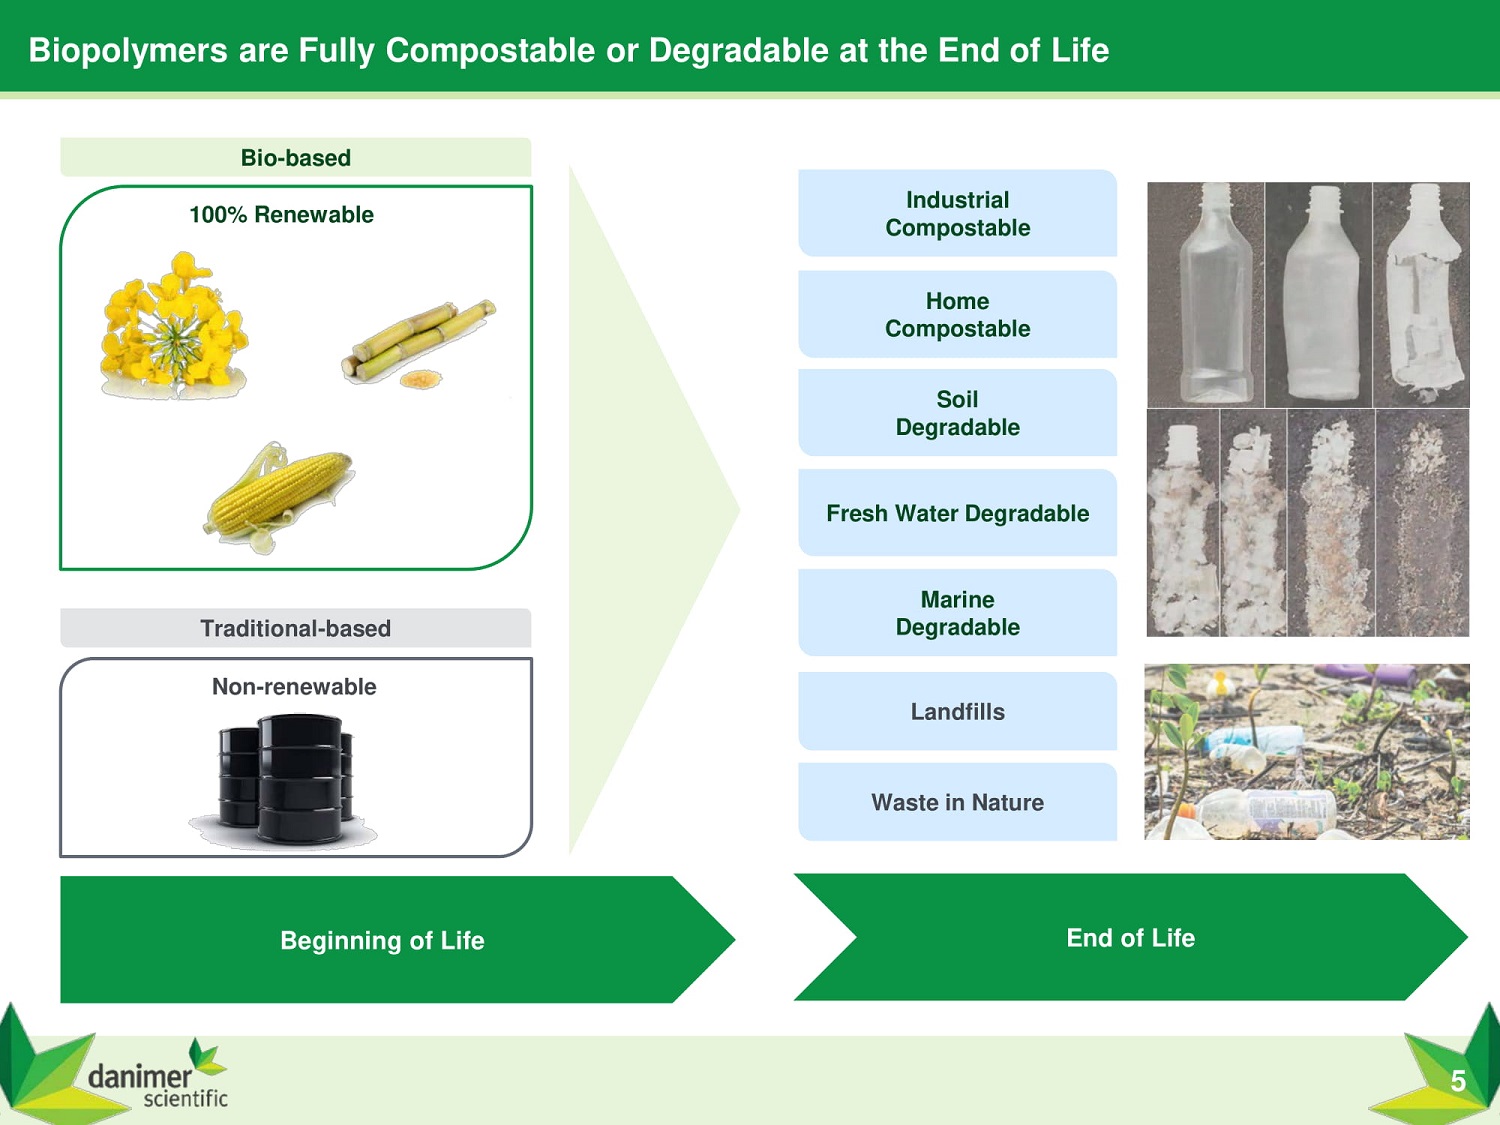
Beginning of Life End of Life 100% Renewable Non - renewable Bio - based Traditional - based Industrial C o m pos t ab l e Home C o m pos t ab l e Soil D eg r adab l e Fresh Water Degradable Landfills Waste in Nature Biopolymers are Fully Compostable or Degradable at the End of Life Marine D eg r adab l e 5
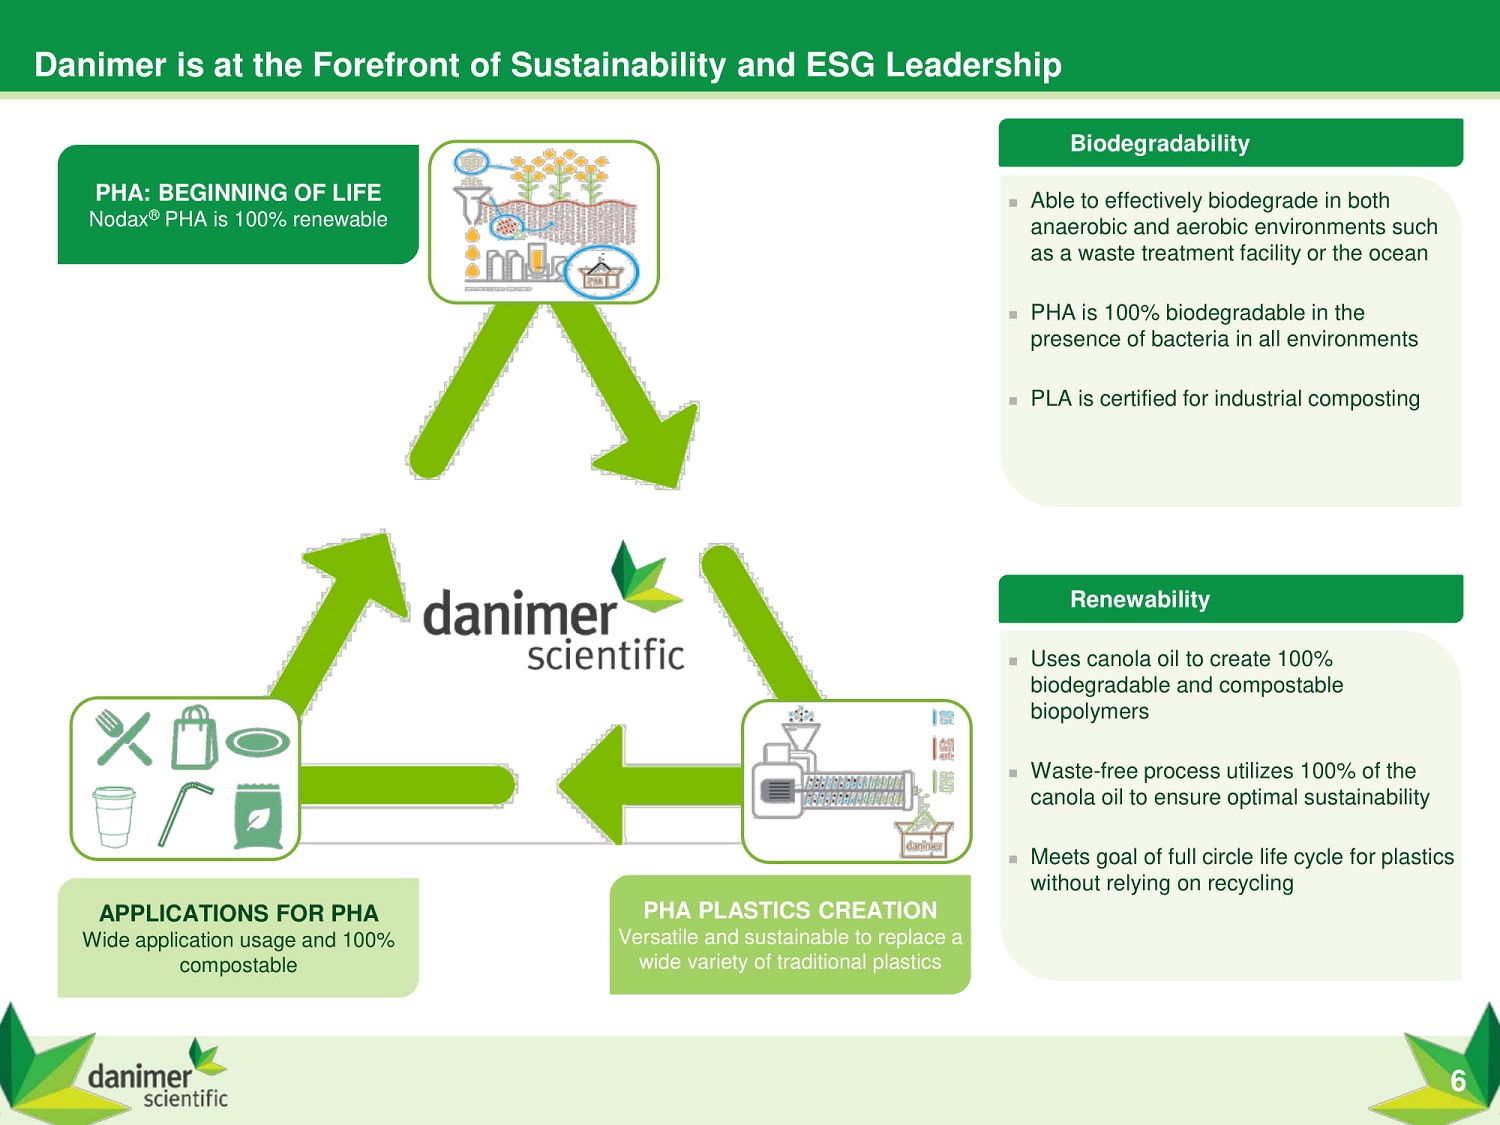
Danimer is at the Forefront of Sustainability and ESG Leadership PHA: BEGINNING OF LIFE Nodax ® PHA is 100% renewable PHA PLASTICS CREATION Versatile and sustainable to replace a wide variety of traditional plastics APPLICATIONS FOR PHA Wide application usage and 100% compostable B i odeg r adab ili ty Renewability Uses canola oil to create 100% biodegradable and compostable biopolymers Waste - free process utilizes 100% of the canola oil to ensure optimal sustainability Meets goal of full circle life cycle for plastics without relying on recycling 6 Able to effectively biodegrade in both anaerobic and aerobic environments such as a waste treatment facility or the ocean PHA is 100% biodegradable in the presence of bacteria in all environments PLA is certified for industrial composting
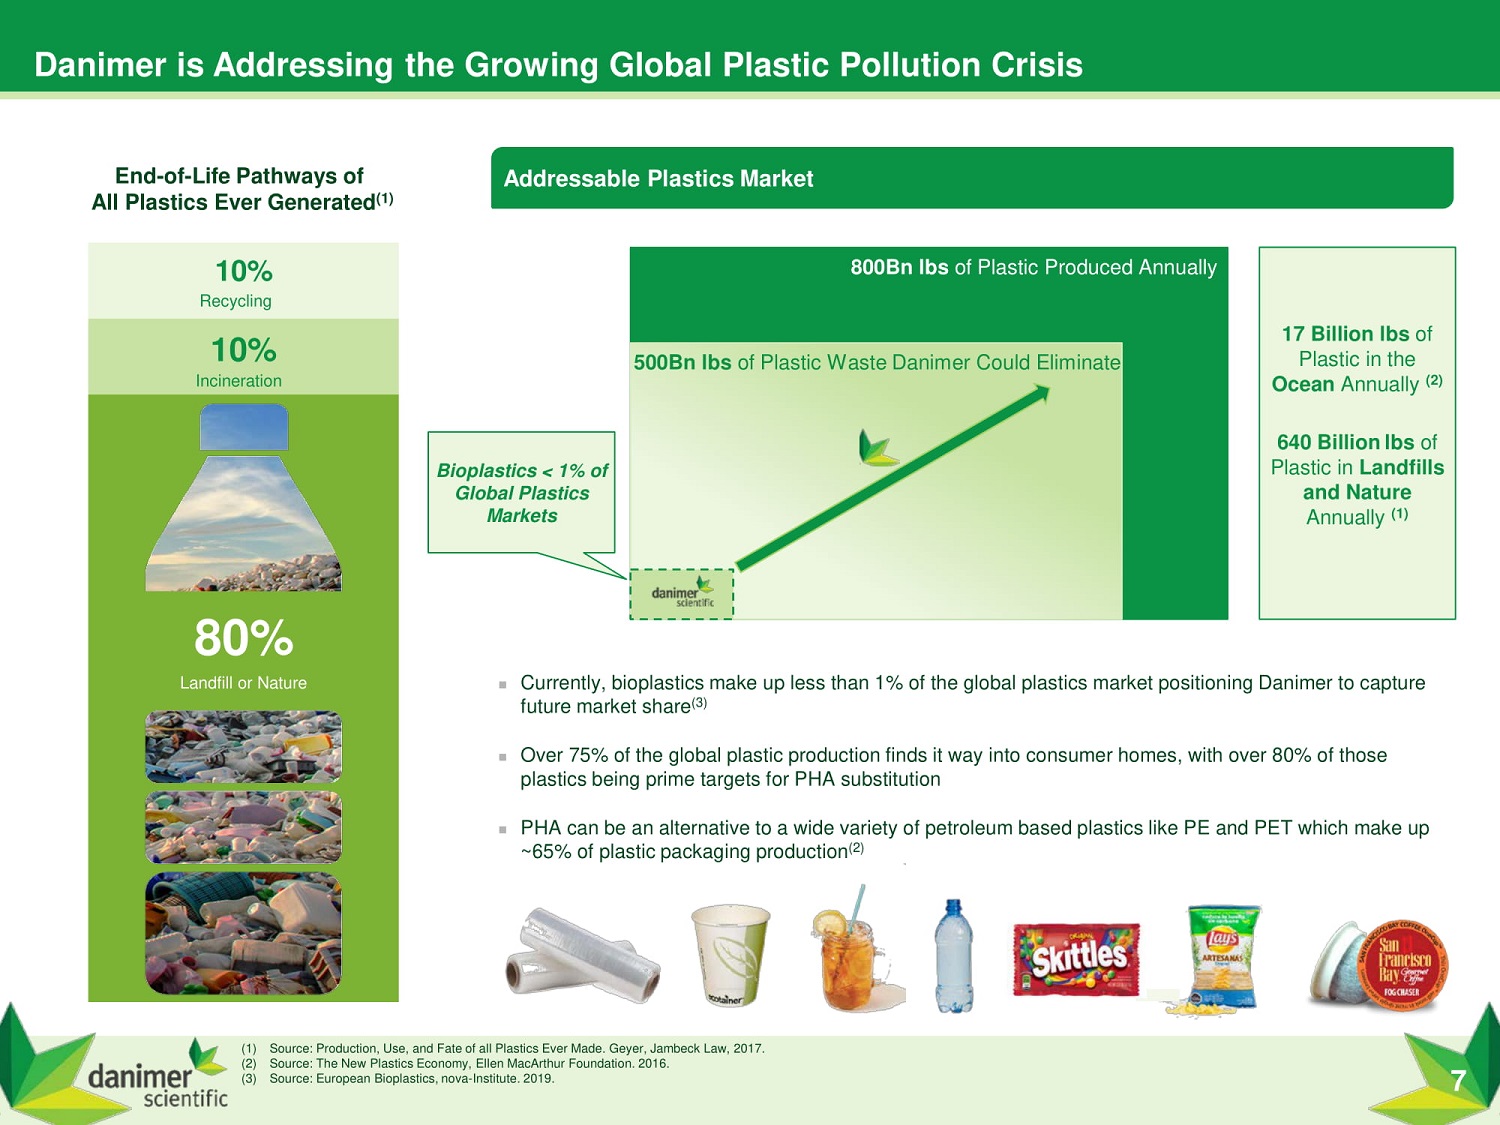
Danimer is Addressing the Growing Global Plastic Pollution Crisis 7 Addressable Plastics Market (1) Source: Production, Use, and Fate of all Plastics Ever Made. Geyer, Jambeck Law, 2017. (2) Source: The New Plastics Economy, Ellen MacArthur Foundation. 2016. (3) Source: European Bioplastics, nova - Institute. 2019. Currently, bioplastics make up less than 1% of the global plastics market positioning Danimer to capture future market share (3) Over 75% of the global plastic production finds it way into consumer homes, with over 80% of those plastics being prime targets for PHA substitution PHA can be an alternative to a wide variety of petroleum based plastics like PE and PET which make up ~65% of plastic packaging production (2) 800Bn lbs of Plastic Produced Annually 10% Recycling 10% Incineration End - of - Life Pathways of All Plastics Ever Generated (1) 80% Landfill or Nature Bioplastics < 1% of Global Plastics Markets 17 Billion lbs of Plastic in the Ocean Annually (2) 64 0 B illi on l bs of Plastic in Landfills and Nature Annually (1) 500Bn lbs of Plastic Waste Danimer Could Eliminate

A history of continuous innovation and research poised for the next phase of rapid commercial expansion Danimer is at an Inflection Point in its Growth 8 2020 Public Listing of Danimer on NYSE 2006 F i r s t C o m po st able Extrusion Coating 2016 R&D Agreement with PepsiCo (snack food packaging) 2018 Purchase of Winchester, KY Fa c ili ty (r e tr o fitte d to produce Nodax ® PHA); simultaneously entered into a sale and leaseback with the current REIT owner 2014 P H A C o mm e r c ial Demonstration Plant 2018 Received equity in v e st m ent from PepsiCo 2021 New Partnership Agreement with Mars Wrigley to develop home compostable packaging 2019 First PHA Supply Contracts Executed 2007 Bought PHA Intellectual Property from Procter & Gamble 2018 R&D Agreement with Nestle (water bottles, labels & caps) 2018 First Marine D egradable P H A Straws Created 2015 Danimer’s Nodax ® PHA is the first polymer to be designated as marine degradable 2020 First Shipment from Kentucky F a c ilit y in M a r c h 2020 New Partnership with Bacardi to create a 100% biodegradable spirits bottle
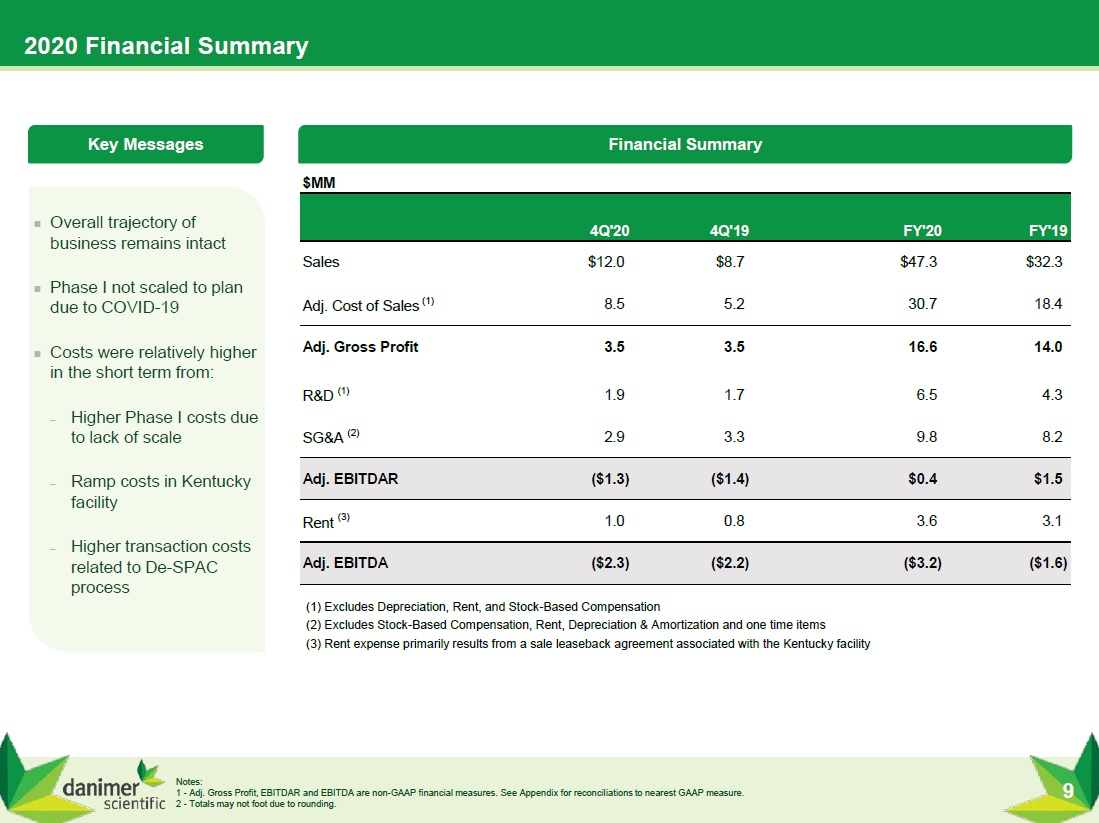
$MM 4Q'20 4Q'19 FY'20 FY'19 Sales $12.0 $8.7 $47.3 $32.3 Ad j . C ost of Sa l es (1 ) 8.5 5.2 30.7 18.4 Gross Profit R&D (1) 3.5 1.9 3.5 1.7 16.6 6.5 14.0 4.3 SG&A (2) 2.9 3.3 9.8 8.2 Adj. EBITDAR ($1.3) ($1.4) $0.4 $1.5 Rent (3) 1.0 0.8 3.6 3.1 Adj. EBITDA ($2.3) ($2.2) ($3.2) ($1.6) 2020 Financial Summary 9 Overall trajectory of business remains intact Phase I not scaled to plan due to COVID - 19 Costs were relatively higher in the short term from: – Higher Phase I costs due to lack of scale – Ramp costs in Kentucky facility – Higher transaction costs related to De - SPAC process (1) Excludes Depreciation, Rent, and Stock - Based Compensation (2) Excludes Stock - Based Compensation, Rent, Depreciation & Amortization and one time items (3) Rent expense primarily results from a sale leaseback agreement associated with the Kentucky facility Key Messages Financial Summary Notes: 1 - Adj. Gross Profit, EBITDAR and EBITDA are non - GAAP financial measures. See Appendix for reconciliations to nearest GAAP measure. 2 - Totals may not foot due to rounding.
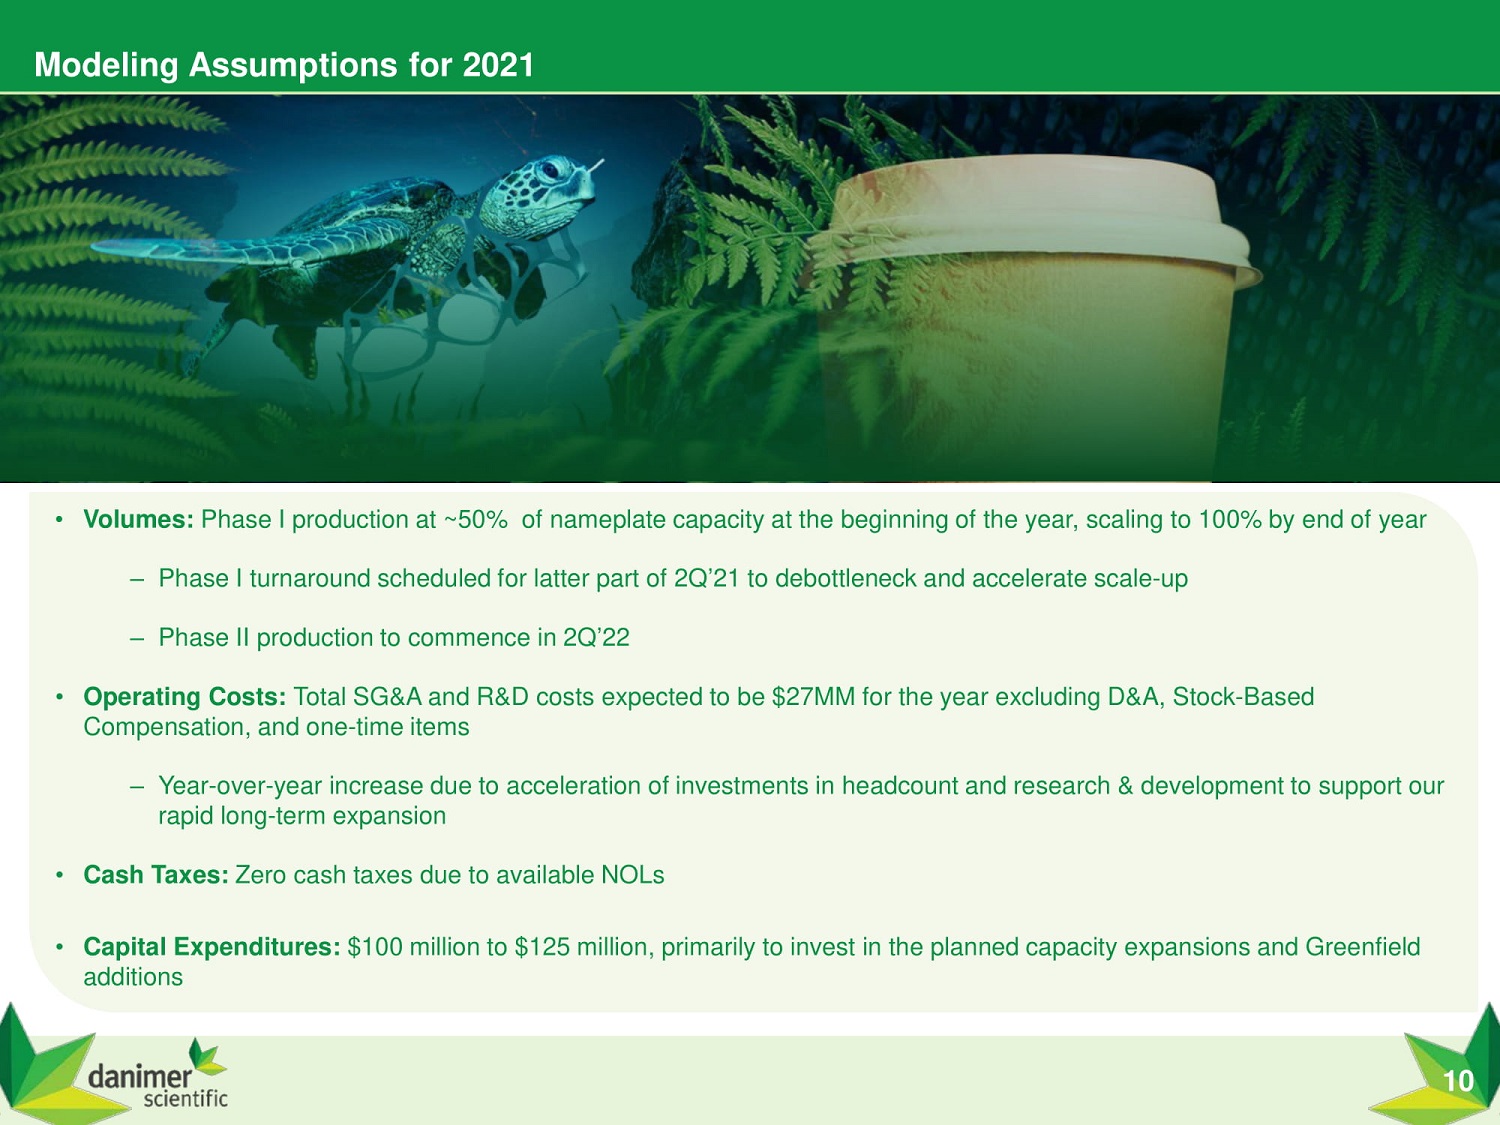
Modeling Assumptions for 2021 • Volumes: Phase I production at ~50% of nameplate capacity at the beginning of the year, scaling to 100% by end of year – Phase I turnaround scheduled for latter part of 2Q’21 to debottleneck and accelerate scale - up – Phase II production to commence in 2Q’22 • Operating Costs: Total SG&A and R&D costs expected to be $27MM for the year excluding D&A, Stock - Based Compensation, and one - time items – Year - over - year increase due to acceleration of investments in headcount and research & development to support our rapid long - term expansion • Cash Taxes: Zero cash taxes due to available NOLs • Capital Expenditures: $100 million to $125 million, primarily to invest in the planned capacity expansions and Greenfield additions 10

Growing Blue Chip Customer Base Has Fueled Demand Select Customers Customer since 2006 Customer since 2012 Customer since 2016 Customer since 2018 Customer since 2019 Customer since 2019 Customer since 2020 Customer since 2020 Customer since 2020 Customer since 2020 Customer since 2020 Customer since 2021 11

Summarizing Our Growth Plans We will grow with c u s t om e r s’ d e m a n d f or our products We will look to de - risk our growth We are a returns - focused company Our returns are well above our cost of capital Customer - driven demand continues to be significant We will grow to meet this demand Focus on contracted volumes Customer demand in place before production begins Unit economics and investor returns will drive our decisions We Are Accelerating and Increasing Our Expansion Plans Timing and Size of Future Expansions Will Follow Similar Framework 12

Greenfield Expansion Announcement • Today, Danimer is announcing the acceleration of its Greenfield Expansion Plan • Greenfield expansion will be on a single site in Bainbridge, Georgia, consisting of 6 fermenters and 250MM total lbs. of finished product • Previously - announced Greenfield had a nameplate capacity of 125MM lbs. of finished product • With the expansion, Greenfield will have a nameplate capacity of 250MM lbs. of finished product, and is expected to start producing product in mid - 2023 • Total capital for Greenfield is expected to be ~$700MM (+ / - 30% estimate) – We will have a + / - 10% engineering estimate before breaking ground • Cash ROIC – Year 2 returns of ~30% • The State of Georgia is a proud supporter of Danimer’s local expansion, as the Greenfield investment will create hundreds of new manufacturing jobs and lead the way towards a “green manufacturing future” 13

Our Growth Plans 2019 2020 2021 2022 2023 2024 2025 2026 2027 2030 Phase I Kentucky (Nameplate capacity: 20MM lbs. of finished product) Production Production Phase II Kentucky (Nameplate capacity: 45MM lbs. of finished product) Greenfield Expansion (Nameplate capacity 250MM lbs. of finished product) Production Expansion Benefits • Leverage single team • Concurrent project planning • Reduces lead times and costs Matching customer demand with our growth Attractive unit economics to drive returns Each project has high returns on invested capital + + Engineering Initiated in 2021 Construction Construction Construction Initiated in late 2020 Timing and construction to be determined as demand warrants Market Demand and Unit Economics Support Additional Capacity of 250MM lbs of finished product per year Additional Plants (250MM lbs. of finished product each) Production Production Production Production Production Production Production Production Production Production 1 2 3 4 5 6 7 8 9 10 Construction Construction Construction Construction Construction Construction Construction Construction Construction Construction Production Construction 14 11

Danimer is a Next Generation Bioplastics Company Experienced Leadership Team and Board of Directors with Proven Track Record 6 Significant Tailwinds From Increased Corporate and Legislative Initiatives on Environmental Impact of Global Pollution Crisis 2 Highly Attractive PHA Technology Serves as a Best End - of - Life Solution for Plastics 1 Rapidly Growing Blue Chip Customer Base Driving Demand in Excess of Current Capacity 5 Leading PHA Innovator with Patent Protected Technology and 13 Years of Production Know - How 3 Strong Partnerships with CPG Brands, Including Pepsi and Nestle, and Key Converters such as Wincup and Genpak 4 15

Appendix 16
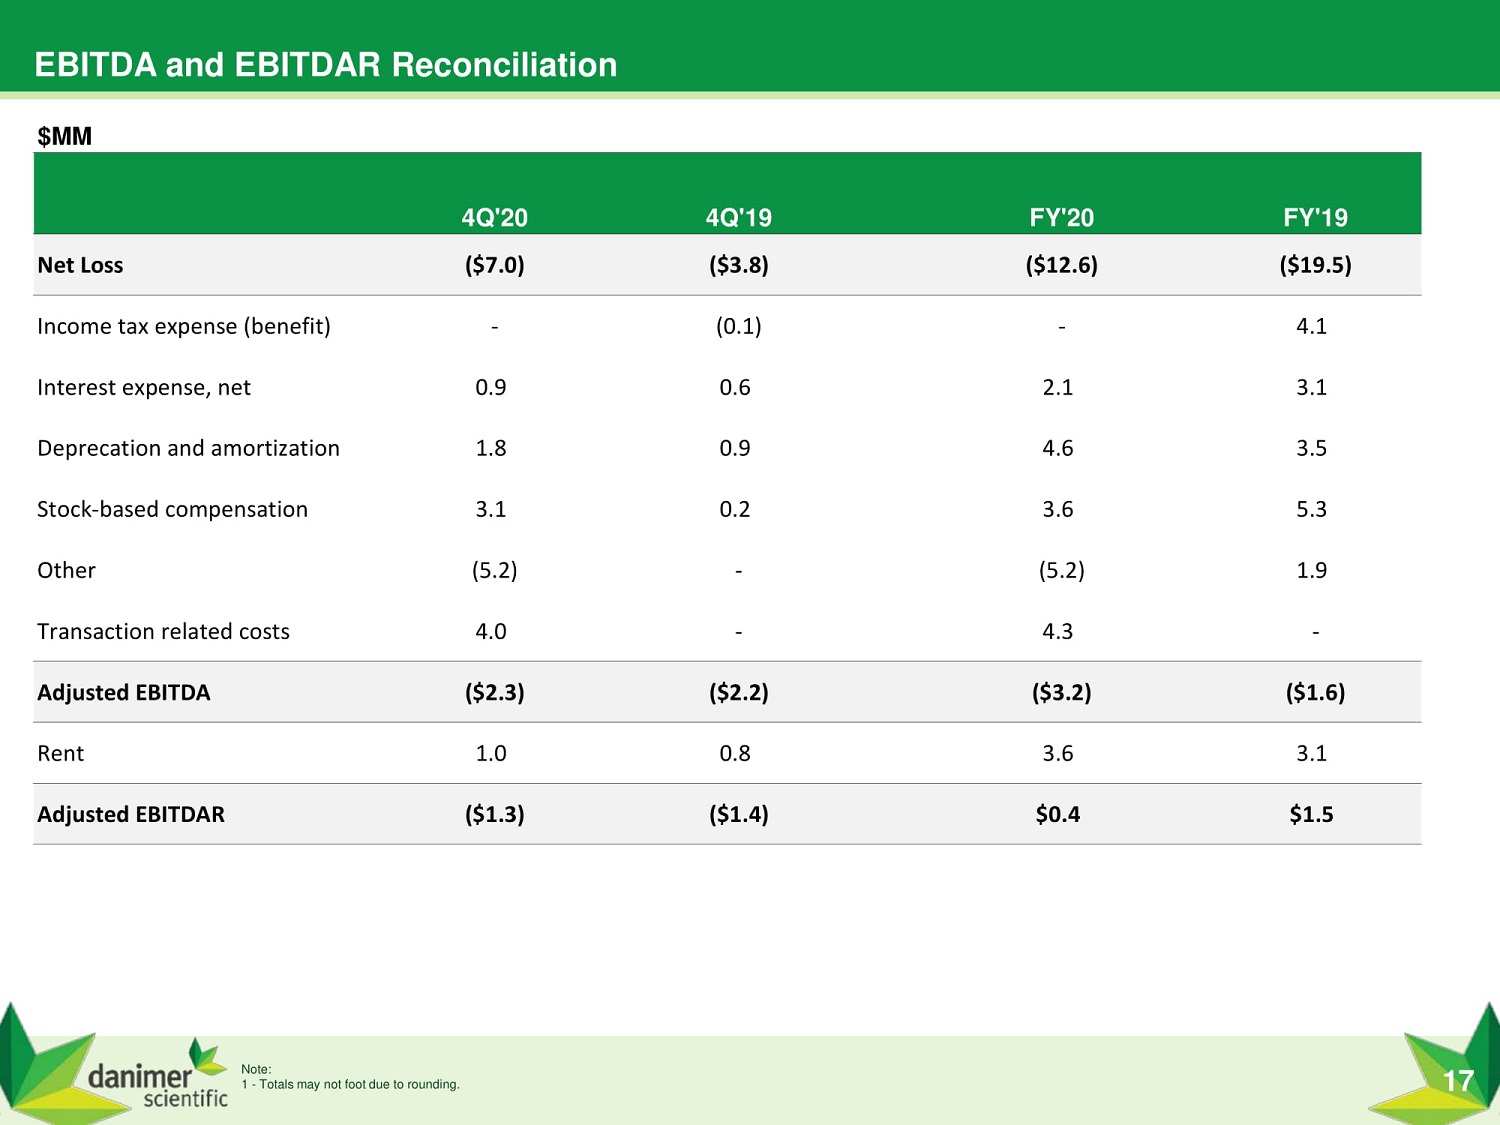
4Q'20 4Q'19 FY'20 FY'19 Net Loss ($7.0) ($3.8) ($12.6) ($19.5) Note: 1 - Totals may not foot due to rounding. 17 Income tax expense (benefit) - (0.1) - 4.1 Interest expense, net 0.9 0.6 2.1 3.1 Deprecation and amortization 1.8 0.9 4.6 3.5 Stock - based compensation 3.1 0.2 3.6 5.3 Other (5.2) - (5.2) 1.9 Transaction related costs 4.0 - 4.3 - Adjusted EBITDA ($2.3) ($2.2) ($3.2) ($1.6) Rent 1.0 0.8 3.6 3.1 Adjusted EBITDAR ($1.3) ($1.4) $0.4 $1.5 $ MM EBITDA and EBITDAR Reconciliation

$MM 4Q'20 4Q'19 FY'20 FY'19 Total Revenue $12.0 $8.7 $47.3 $32.3 Cost of Revenue 10.8 5.8 35.9 21.2 Gross Profit $1.2 $2.9 $11.5 $11.1 Depreciation 1.6 0.5 3.6 2.4 Stock - based compensation - - 0.1 0.1 Rent 0.7 0.1 1.4 0.4 Adjusted Gross Profit $3.5 $3.5 $16.6 $14.0 Note: 1 - Totals may not foot due to rounding. 18 Adjusted Gross Profit Reconciliation
