Attached files
| file | filename |
|---|---|
| 8-K - FORM 8-K - Goodness Growth Holdings, Inc. | tm2110495d1_8k.htm |
| EX-99.1 - EXHIBIT 99.1 - Goodness Growth Holdings, Inc. | tm2110495d1_ex99-1.htm |
Exhibit 99.2

“We are building the cannabis company of the future by bringing the best of science, medicine and engineering to the cannabis industry.” - Kyle Kingsley, M.D. Founder & CEO CSE: VREO OTCQX: VREOF Q4 2020 Earnings Conference Call March 25, 2021

Q4 2020 Results Conference Call || 2 Disclaimer CAUTIONARY NOTE REGARDING FORWARD - LOOKING INFORMATION : This document includes information, statements, beliefs and opinions which are forward - looking, and which reflect current estimates, expectations and projections about future events, referred to herein and which constitute “forward - looking statements” or “forward - looking information” within the meaning of Canadian and U . S . securities laws . Statements containing the words “believe”, “expect”, “intend”, “should”, “seek”, “anticipate”, “will”, “positioned”, “plan”, “may”, “estimate”, “could”, “continue”, “outlook”, “strategy”, “initiative”, “foreseeable”, or, in each case, their negative and words of similar meaning are intended to identify forward - looking statements . By their nature, forward - looking statements involve a number of known and unknown risks, uncertainties and assumptions concerning, among other things, the Company’s anticipated business strategies, anticipated trends in the Company’s business and anticipated market share, that could cause actual results or events to differ materially from those expressed or implied by the forward - looking statements . These risks, uncertainties and assumptions could adversely affect the outcome and financial effects of the plans and events described herein . In addition, even if the outcome and financial effects of the plans and events described herein are consistent with the forward - looking statements contained in this document, those results or developments may not be indicative of results or developments in subsequent periods . Although the Company has attempted to identify important risks and factors that could cause actual actions, events or results to differ materially from those described in forward - looking information, there may be other factors and risks that cause actions, events or results not to be as anticipated, estimated or intended . Forward - looking information contained in this presentation is based on the Company’s current estimates, expectations and projections, which the Company believes are reasonable as of the current date . The Company can give no assurance that these estimates, expectations and projections will prove to have been correct . You should not place undue reliance on forward - looking statements, which are based on the information available as of the date of this document . Forward - looking statements contained in this document are made of the date of this presentation and, except as required by applicable law, the Company assumes no obligation to update or revise them to reflect new events or circumstances . Historical statements contained in this document regarding past trends or activities should not be taken as a representation that such trends or activities will continue in the future . In this regard, certain financial information contained herein has been extracted from, or based upon, information available in the public domain and/or provided by the Company . In particular historical results should not be taken as a representation that such trends will be replicated in the future . No statement in this document is intended to be nor may be construed as a profit forecast . CAUTIONARY NOTE REGARDING FUTURE - ORIENTED FINANCIAL INFORMATION : To the extent any forward - looking information in this presentation constitutes “future - oriented financial information” or “financial outlooks” within the meaning of applicable Canadian securities laws, such information is being provided to demonstrate the anticipated market penetration and the reader is cautioned that this information may not be appropriate for any other purpose and the reader should not place undue reliance on such future - oriented financial information and financial outlooks . Future - oriented financial information and financial outlooks, as with forward - looking information generally, are, without limitation, based on the assumptions and subject to the risks set out above under the heading “Cautionary Note Regarding Forward - Looking Information” . Vireo’s actual financial position and results of operations may differ materially from management’s current expectations and, as a result, Vireo’s revenue and expenses may differ materially from the revenue and expenses profiles provided in this presentation . Such information is presented for illustrative purposes only and may not be an indication of Vireo’s actual financial position or results of operations . RECONCILATION OF NON - GAAP FINANCIAL MEASURES : EBITDA, and Adjusted EBITDA are non - GAAP measures and do not have standardized definitions under U . S . GAAP accounting principles . This presentation provides reconciliations of the supplemental non - GAAP financial measures, presented herein to the most directly comparable financial measures calculated and presented in accordance with GAAP . The Company has provided the non - GAAP financial measures, which are not calculated or presented in accordance with GAAP, as supplemental information and in addition to the financial measures that are calculated and presented in accordance with GAAP . These supplemental non - GAAP financial measures are presented because management has evaluated the financial results both including and excluding the adjusted items and believe that the supplemental non - GAAP financial measures presented provide additional perspective and insights when analyzing the core operating performance of the business . These supplemental non - GAAP financial measures should not be considered superior to, as a substitute for or as an alternative to, and should be considered in conjunction with, the GAAP financial measures presented .

Today’s Presenters Kyle Kingsley, M.D. Chairman & Chief Executive Officer John Heller Chief Financial Officer Sam Gibbons Vice President, Investor Relations Dial - in & Webcast Details: Conference Call Registration: http://www.directeventreg.com/registration/ event/7871948 Webcast Registration: https://event.on24.com/wcc/r/2947732/7426 ED93AF2EB2DD22B3005FEBFE65D8 Q4 2020 Results Conference Call || 3

Full Year 2020 Highlights • Total revenue of $ 49 . 2 million increased 64 . 3 percent YoY, driven by organic growth and the successful execution of management’s core market strategies during the year . • Gross profit increased by $ 9 . 8 million to $ 17 . 1 million, or 34 . 8 percent of sales as compared to $ 7 . 3 million, or 24 . 5 percent of sales in fiscal year 2019 . • During the year, the Company completed the expansion of its Green Goods Œ retail stores in Minnesota . All eight of Vireo’s dispensary licenses in Minnesota are now operational . • The Company opened 4 new Green Goods Œ dispensaries in fiscal year 2020 and ended the year with 15 operational dispensaries across its nationwide operating footprint . • During the year, the Company divested its former subsidiaries in the state of Pennsylvania for total consideration of $ 26 . 0 million and utilized a portion of the proceeds to invest in more attractive opportunities in the Arizona and Maryland markets . • The Company ended fiscal year 2020 with $ 25 . 5 million in cash on its balance sheet . Q4 2020 Results Conference Call || 4
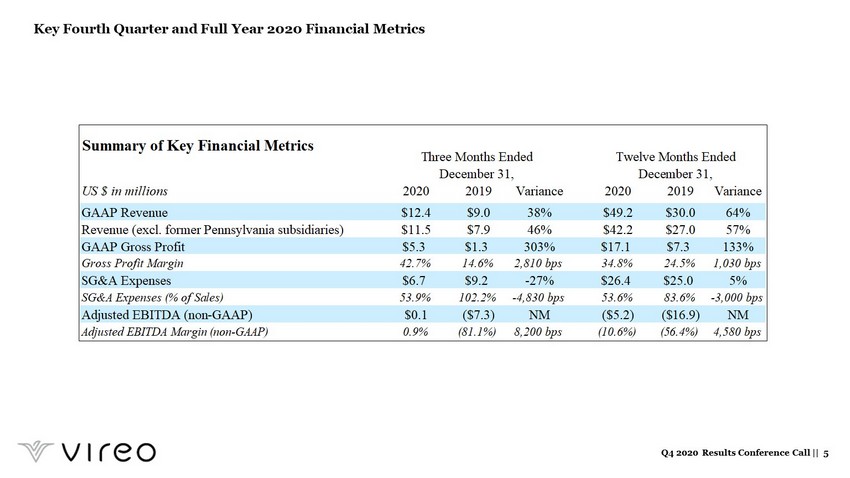
Key Fourth Quarter and Full Year 2020 Financial Metrics Q4 2020 Results Conference Call || 5 Three Months Ended Twelve Months Ended December 31, December 31, US $ in millions 2020 2019 Variance 2020 2019 Variance GAAP Revenue $12.4 $9.0 38% $49.2 $30.0 64% Revenue (excl. former Pennsylvania subsidiaries) $11.5 $7.9 46% $42.2 $27.0 57% GAAP Gross Profit $5.3 $1.3 303% $17.1 $7.3 133% Gross Profit Margin 42.7% 14.6% 2,810 bps 34.8% 24.5% 1,030 bps SG&A Expenses $6.7 $9.2 -27% $26.4 $25.0 5% SG&A Expenses (% of Sales) 53.9% 102.2% -4,830 bps 53.6% 83.6% -3,000 bps Adjusted EBITDA (non-GAAP) $0.1 ($7.3) NM ($5.2) ($16.9) NM Adjusted EBITDA Margin (non-GAAP) 0.9% (81.1%) 8,200 bps (10.6%) (56.4%) 4,580 bps Summary of Key Financial Metrics

Fiscal Year 2020 Performance • Total GAAP revenue increased 64 . 3 percent year - over - year, driven by organic growth across all of Vireo’s operational markets and the successful execution of management’s core market strategies . • Excluding results from the Company’s former subsidiaries in Pennsylvania, revenue increased 57 . 0 percent to $ 42 . 2 million . • Adjusted EBITDA loss of $ 5 . 2 million improved compared to a loss of $ 16 . 9 million in 2019 . The favorable variance was driven by higher gross margin, and increased sales and other income, partially offset by a slight increase in SG&A expenses . • SG&A expenses as a percentage of revenue improved year - over - year to 53 . 6 percent of sales as compared to 83 . 6 percent of sales in 2019 . • As of December 31 , 2020 , the Company had 113 , 016 , 459 equity shares issued and outstanding on an as - converted basis, and 157 , 274 , 493 shares outstanding on an as - converted, fully diluted basis . Q4 2020 Results Conference Call || 6

Fourth Quarter 2020 Performance • Total GAAP revenue of $ 12 . 4 million increased 38 percent year - over - year, driven by organic growth across all of Vireo’s operational markets and the successful execution of management’s core market strategies . • Excluding results from the Company’s former subsidiaries in Pennsylvania, revenue of $ 11 . 5 million increased approximately 46 percent year - over - year and 9 . 0 percent sequentially . • Adjusted EBITDA of $ 0 . 1 million improved compared to a loss of $ 7 . 3 million in Q 4 2019 . The favorable variance was driven by higher gross margin, increased sales, lower SG&A and one - time expenses related to the Company’s transition from IFRS to U . S . GAAP accounting standards, partially offset by depreciation . • SG&A expenses as a percentage of revenue improved year - over - year to 53 . 9 percent of sales as compared to 102 . 2 percent of sales in Q 4 2019 . Q4 2020 Results Conference Call || 7

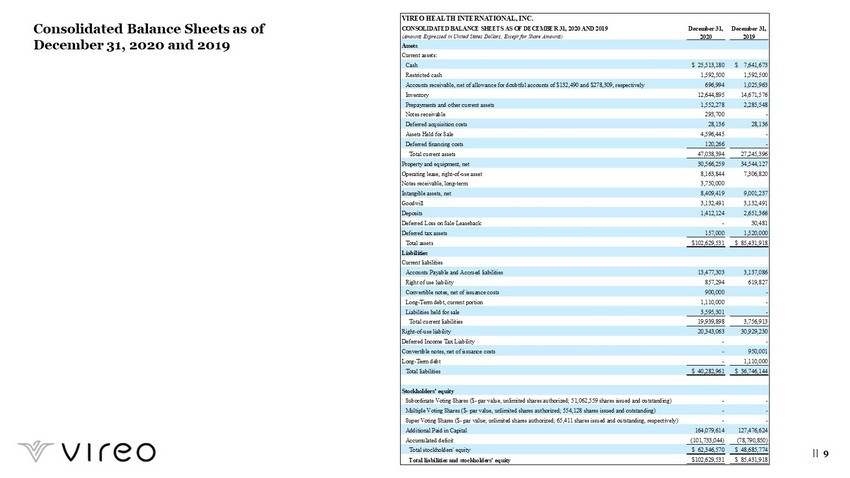
Consolidated Balance Sheets as of December 31, 2020 and 2019 || 9 VIREO HEALTH INTERNATIONAL, INC. CONSOLIDATED BALANCE SHEETS AS OF DECEMBER 31, 2020 AND 2019 December 31, December 31, (Amounts Expressed in United States Dollars, Except for Share Amounts) 2020 2019 Assets Current assets: Cash $ 25,513,180 $ 7,641,673 Restricted cash 1,592,500 1,592,500 Accounts receivable, net of allowance for doubtful accounts of $132,490 and $278,309, respectively 696,994 1,025,963 Inventory 12,644,895 14,671,576 Prepayments and other current assets 1,552,278 2,285,548 Notes receivable 293,700 - Deferred acquisition costs 28,136 28,136 Assets Held for Sale 4,596,445 - Deferred financing costs 120,266 - Total current assets 47,038,394 27,245,396 Property and equipment, net 30,566,259 34,544,127 Operating lease, right-of-use asset 8,163,844 7,306,820 Notes receivable, long-term 3,750,000 Intangible assets, net 8,409,419 9,001,237 Goodwill 3,132,491 3,132,491 Deposits 1,412,124 2,651,366 Deferred Loss on Sale Leaseback - 30,481 Deferred tax assets 157,000 1,520,000 Total assets $102,629,531 $ 85,431,918 Liabilities Current liabilities Accounts Payable and Accrued liabilities 13,477,303 3,137,086 Right of use liability 857,294 619,827 Convertible notes, net of issuance costs 900,000 - Long-Term debt, current portion 1,110,000 - Liabilities held for sale 3,595,301 - Total current liabilities 19,939,898 3,756,913 Right-of-use liability 20,343,063 30,929,230 Deferred Income Tax Liability - - Convertible notes, net of issuance costs - 950,001 Long-Term debt - 1,110,000 Total liabilities $ 40,282,961 $ 36,746,144 Stockholders’ equity Subordinate Voting Shares ($- par value, unlimited shares authorized; 51,062,559 shares issued and outstanding) - - Multiple Voting Shares ($- par value, unlimited shares authorized; 554,128 shares issued and outstanding) - - Super Voting Shares ($- par value; unlimited shares authorized; 65,411 shares issued and outstanding, respectively) - - Additional Paid in Capital 164,079,614 127,476,624 Accumulated deficit (101,733,044) (78,790,850) Total stockholders' equity $ 62,346,570 $ 48,685,774 Total liabilities and stockholders' equity $102,629,531 $ 85,431,918
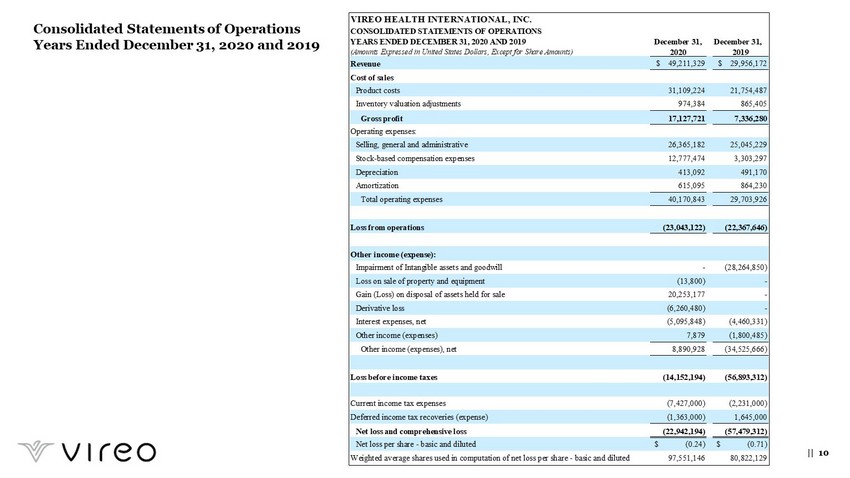
Consolidated Statements of Operations Years Ended December 31, 2020 and 2019 || 10 VIREO HEALTH INTERNATIONAL, INC. CONSOLIDATED STATEMENTS OF OPERATIONS YEARS ENDED DECEMBER 31, 2020 AND 2019 December 31, December 31, (Amounts Expressed in United States Dollars, Except for Share Amounts) 2020 2019 Revenue $ 49,211,329 $ 29,956,172 Cost of sales Product costs 31,109,224 21,754,487 Inventory valuation adjustments 974,384 865,405 Gross profit 17,127,721 7,336,280 Operating expenses: Selling, general and administrative 26,365,182 25,045,229 Stock-based compensation expenses 12,777,474 3,303,297 Depreciation 413,092 491,170 Amortization 615,095 864,230 Total operating expenses 40,170,843 29,703,926 Loss from operations (23,043,122) (22,367,646) Other income (expense): Impairment of Intangible assets and goodwill - (28,264,850) Loss on sale of property and equipment (13,800) - Gain (Loss) on disposal of assets held for sale 20,253,177 - Derivative loss (6,260,480) - Interest expenses, net (5,095,848) (4,460,331) Other income (expenses) 7,879 (1,800,485) Other income (expenses), net 8,890,928 (34,525,666) Loss before income taxes (14,152,194) (56,893,312) Current income tax expenses (7,427,000) (2,231,000) Deferred income tax recoveries (expense) (1,363,000) 1,645,000 Net loss and comprehensive loss (22,942,194) (57,479,312) Net loss per share - basic and diluted $ (0.24) $ (0.71) Weighted average shares used in computation of net loss per share - basic and diluted 97,551,146 80,822,129

Consolidated Statements of Operations 3 - Months Ended December 31, 2020 and 2019 || 11 VIREO HEALTH INTERNATIONAL, INC. CONSOLIDATED STATEMENTS OF OPERATIONS THREE MONTHS ENDED DECEMBER 31, 2020 AND 2019 (Amounts Expressed in United States Dollars, Except for Share Amounts) Q4 2020 Q4 2019 Revenue $ 12,401,615 $ 8,991,909 Cost of sales Product costs 6,616,393 7,335,957 Inventory valuation adjustments 489,814 343,179 Gross profit 5,295,408 1,312,773 Operating expenses: Selling, general and administrative 6,687,250 9,192,976 Stock-based compensation expenses 532,062 2,616,429 Depreciation 152,367 80,993 Amortization 153,358 (648,545) Total operating expenses 7,525,037 11,241,853 Loss from operations (2,229,629) (9,929,080) Other income (expense): Impairment of Intangible assets and goodwill - (28,264,850) Gain (Loss) on disposal of assets held for sale 3,815,548 - Derivative loss (1,227,943) - Interest expenses, net (846,758) (1,628,867) Other expenses (income) 212,940 (263,517) Other expenses (income), net 1,953,787 (30,157,234) Loss before income taxes (275,842) (40,086,314) Current income tax expenses (2,852,000) (1,301,000) Deferred income tax recoveries (expense) 862,000 1,893,000 Net loss and comprehensive loss (2,265,842) (39,494,314) Net loss per share - basic and diluted $ (0.02) $ (0.46) Weighted average shares used in computation of net loss per share - basic and diluted 103,862,278 85,243,627
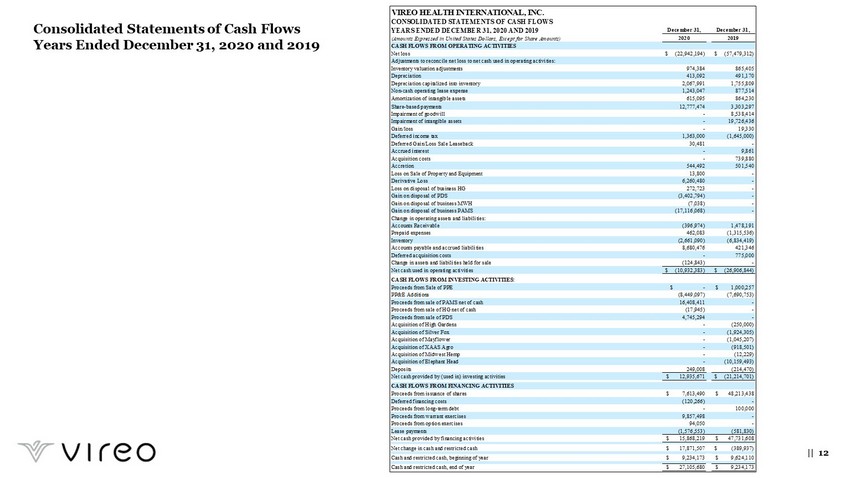
Consolidated Statements of Cash Flows Years Ended December 31, 2020 and 2019 || 12 VIREO HEALTH INTERNATIONAL, INC. CONSOLIDATED STATEMENTS OF CASH FLOWS YEARS ENDED DECEMBER 31, 2020 AND 2019 December 31, December 31, (Amounts Expressed in United States Dollars, Except for Share Amounts) 2020 2019 CASH FLOWS FROM OPERATING ACTIVITIES Net loss $ (22,942,194) $ (57,479,312) Adjustments to reconcile net loss to net cash used in operating activities: Inventory valuation adjustments 974,384 865,405 Depreciation 413,092 491,170 Depreciation capitalized into inventory 2,067,991 1,755,809 Non-cash operating lease expense 1,243,047 877,514 Amortization of intangible assets 615,095 864,230 Share-based payments 12,777,474 3,303,297 Impairment of goodwill - 8,538,414 Impairment of intangible assets - 19,726,436 Gain/loss - 19,330 Deferred income tax 1,363,000 (1,645,000) Deferred Gain/Loss Sale Leaseback 30,481 - Accrued interest - 9,861 Acquisition costs - 739,880 Accretion 544,492 501,540 Loss on Sale of Property and Equipment 13,800 - Derivative Loss 6,260,480 - Loss on disposal of business HG 272,723 - Gain on disposal of PDS (3,402,794) - Gain on disposal of business MWH (7,038) - Gain on disposal of business PAMS (17,116,068) - Change in operating assets and liabilities: Accounts Receivable (396,974) 1,478,191 Prepaid expenses 462,083 (1,315,536) Inventory (2,661,090) (6,834,419) Accounts payable and accrued liabilities 8,680,476 421,346 Deferred acquisition costs - 775,000 Change in assets and liabilities held for sale (124,843) - Net cash used in operating activities $ (10,932,383) $ (26,906,844) CASH FLOWS FROM INVESTING ACTIVITIES: Proceeds from Sale of PPE $ - $ 1,000,257 PP&E Additions (8,449,097) (7,690,753) Proceeds from sale of PAMS net of cash 16,408,411 - Proceeds from sale of HG net of cash (17,945) - Proceeds from sale of PDS 4,745,294 - Acquisition of High Gardens - (250,000) Acquisition of Silver Fox - (1,924,305) Acquisition of Mayflower - (1,045,207) Acquisition of XAAS Agro - (918,501) Acquisition of Midwest Hemp - (12,229) Acquisition of Elephant Head - (10,159,493) Deposits 249,008 (214,470) Net cash provided by (used in) investing activities $ 12,935,671 $ (21,214,701) CASH FLOWS FROM FINANCING ACTIVITIES Proceeds from issuance of shares $ 7,613,490 $ 48,213,438 Deferred financing costs (120,266) - Proceeds from long-term debt - 100,000 Proceeds from warrant exercises 9,857,498 - Proceeds from option exercises 94,050 - Lease payments (1,576,553) (581,830) Net cash provided by financing activities $ 15,868,219 $ 47,731,608 Net change in cash and restricted cash $ 17,871,507 $ (389,937) Cash and restricted cash, beginning of year $ 9,234,173 $ 9,624,110 Cash and restricted cash, end of year $ 27,105,680 $ 9,234,173

Reconciliation of Non - GAAP to GAAP Financial Measures Q4 2020 Results Conference Call || 13 Three Months Ended Twelve Months Ended December 31, December 31, 2020 2019 2020 2019 Net income (loss) (2,265,842)$ (39,494,314)$ (22,942,194)$ (57,479,312)$ Interest expense, net 846,758 1,628,867 5,095,848 4,460,331 Income taxes 1,990,000 (592,000) 8,790,000 586,000 Depreciation & Amortization 305,725 (567,552) 1,028,187 1,355,400 Depreciation included in cost of goods sold 304,123 508,436 2,067,991 1,755,809 EBITDA (non-GAAP) 1,180,764$ (38,516,563)$ (5,960,168)$ (49,321,772)$ Derivative Loss 1,227,943 - 6,260,480 - Inventory adjustment 489,814 343,179 974,384 865,405 Share-based compensation 532,062 2,616,429 12,777,474 3,303,297 Severance Expense - - 339,997 - Impairment of intangible assets and goodwill - 28,264,850 - 28,264,850 Gain on sale of discontinued operations (3,815,548) - (20,253,177) - Costs associated with IFRS to GAAP transition 497,617 - 630,282 - Adjusted EBITDA (non-GAAP) 112,652$ (7,292,105)$ (5,230,728)$ (16,888,220)$