Attached files
| file | filename |
|---|---|
| EX-99.1 - EXHIBIT 99.1 - Thryv Holdings, Inc. | brhc10022252_ex99-1.htm |
| 8-K - 8-K - Thryv Holdings, Inc. | brhc10022252_8k.htm |
Exhibit 99.2


Investor SupplementFourth Quarter 2020
Safe Harbor This Presentation may include certain forward-looking statements, including,
without limitation, statements concerning the conditions of our industry and our operations, performance, and financial condition, including, in particular, statements relating to our business, growth strategies, product development efforts,
and future expenses. Forward-looking statements can be identified by words such as ‘‘anticipates,’’ ‘‘intends,’’ ‘‘plans,’’ ‘‘seeks,’’ ‘‘believes,’’ ‘‘estimates,’’ ‘‘expects,’’ and similar references to future periods, or by the inclusion of
forecasts or projections. Forward-looking statements are based on our current expectations and assumptions regarding our business, the economy, and other future conditions. Because forward-looking statements relate to the future, by their
nature, they are subject to inherent uncertainties and risks (some of which are beyond our control) and changes in circumstances or other assumptions that may cause actual results or performance to be materially different from those expressed
or implied by these forward-looking statements. As a result, our actual results may differ materially from those contemplated by the forward-looking statements. Except as required by law, we are under no obligation to, and expressly disclaim
any obligation to, update or alter any forward-looking statements whether as a result of any such changes, new information, subsequent events or otherwise.Market data and industry information used throughout this Presentation are based on
management’s knowledge of the industry and the good faith estimates of management. We also relied, to the extent available, upon management’s review of independent industry surveys and publications and other publicly available information
prepared by a number of third party sources. All of the market data and industry information used in this Presentation involves a number of assumptions and limitations, and you are cautioned not to give undue weight to such estimates.
Although we believe that these sources are reliable, we cannot guarantee the accuracy or completeness of this information, and we have not independently verified this information. While we believe the estimated market position, market
opportunity and market size information included in this presentation are generally reliable, such information, which is derived in part from management’s estimates and beliefs, is inherently uncertain and imprecise. Projections, assumptions
and estimates of our future performance and the future performance of the industry in which we operate are necessarily subject to a high degree of uncertainty and risk due to a variety of factors. These factors could cause results to differ
materially from those expressed in our estimates and beliefs and in the estimates prepared by independent parties. You should not construe the contents of this Presentation as legal, tax, accounting or investment advice or a recommendation to
take (or refrain from taking) any particular action. You should consult your own counsel and tax and financial advisors as to legal and related matters concerning the matters described herein.In addition to financial measures prepared in
accordance with U.S. generally accepted accounting principles (“GAAP”), this press release and the accompanying tables contain, and the conference call will contain, non-GAAP financial measures. We present non-GAAP measures including:
adjusted EBITDA, and adjusted EBITDA margin. The non-GAAP financial information is presented for supplemental informational purposes only and is not intended to be considered in isolation or as a substitute for, or superior to, financial
information prepared and presented in accordance with GAAP. Please refer to the supplemental information presented in the tables for reconciliations of the non-GAAP financial measures used in this press release to the most comparable GAAP
financial measures.We believe that these non-GAAP financial measures provide useful information about our financial performance, enhance the overall understanding of our past performance and future prospects and allow for greater transparency
with respect to important metrics used by our management for financial and operational decision-making. We believe that these measures provide an additional tool for investors to use in comparing our core financial performance over multiple
periods with other companies in our industry. However, it is important to note that the particular items we exclude from, or include in, our non-GAAP financial measures may differ from the items excluded from, or included in, similar non-GAAP
financial measures used by other companies in the same industry.Financial results are presented herein were prepared in accordance with ASC 606 “Revenue Recognition” and ASC 842 “Leases” 2
Fourth Quarter Highlights 3 SaaSRevenue of $34.9M, up 8% YoYBillings of $38.8M, up 13%
YoYARPU increased to $293, compared to $260 in Q3 2020Churn improved to 2.4%, compared to 2.7% in Q3 2020Ending Clients 44k, flat when compared to Q3 f Marketing ServicesRevenue of $212.1M, down 32% YoYBillings of $232.5M, down 21% YoY33%
EBITDA Margin Debt RepaymentDebt Repayment of $57.4MLeverage Ratio was 1.3x (fifth consecutive quarter under 1.5x)
4th Quarter & FY 2020 Revenue Highlights 4 Key Highlights:Q4 SaaS revenue increased
+8% YoY and returned to annual growth as revenue and client mix improved following strategic shift to focus up-marketAs expected, FY 2020 Marketing Services revenue declined 24% influenced by print publication timing differences throughout
the year
Historical Segment Financials 5 Key Highlights:SaaS revenue accelerated to end FY 2020
as demand for cloud-based software increased.SaaS revenue increased sequentially and YoY in Q4 2020.Marketing Services decline rate less in 1H 2020 than 2H 2020 due to print publication timing. Despite lumpiness, annual revenue decline and
high EBITDA margins consistent with prior years.
SaaS 2020 Quarterly Financial Highlights 6 SaaS business accelerating due to SMB
industry tailwinds and product innovation. Business has returned to growth trajectory with renewed focus on our core target market Positive momentum will carry into 2021 and beyond. SaaS business benefitting from scaling of
operations with healthy EBITDA margins.
Marketing Services 2020 Quarterly Financial Highlights 7 Gradual structural change in
market driving predictable declines Current industry has significant runway left with sales canvass process allowing for strong visibility into future revenuesPrint remains strong within target demo (55+, suburban, homeowners)3.8 billion
references representing over 90% of industry totalHighly variable cost structure to maintain strong EBITDA margins for many years Source of low CAC for conversion into Thryv SaaS platform
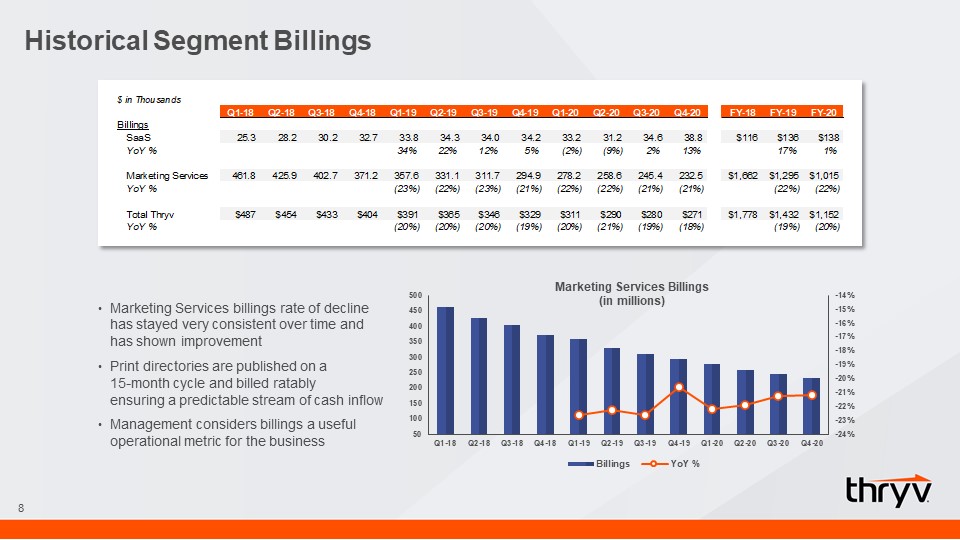
Historical Segment Billings 8 Marketing Services billings rate of decline has stayed very
consistent over time and has shown improvementPrint directories are published on a 15-month cycle and billed ratably ensuring a predictable stream of cash inflowManagement considers billings a useful operational metric for the business
SaaS Metrics 9
Engagement 10 +47% YoY
Enhanced CRM – Announced March 2021 11 Enables more robust customizable 1-to-many
relationships Thryv now enables SMBs to track, and manage their day-to-day work.
12 Expands Thryv InternationallyProvides access to market of +100k SMBs in
AustraliaLess highly-penetrated market than U.S. Simple IntegrationSensis well-run asset with +40% EBITDA marginsEnglish-speaking countrySubstantially similar to Thryv’s Marketing Services business AccretiveFavorable purchase price of
<2x FY2020 EBITDA (audited) SynergiesInitial cost savings of AU$10 millionSignificant revenue synergy opportunity from SaaS cross-sell Acquisition of Sensis HoldingsClosed March 1, 2021
ThryvPay Update 13 ThryvPay shows strength in use and adoption since Q4 2020 launch$8M
TPV1,300 merchant sign-ups Requesting payments with Thryv digital invoices has greatly reduced friction and helps clients get paid faster Minimizes late or missed payments thru scheduled pay, installment, and membership plans Avg
Transaction Size ~$400
FY 2021 Outlook 14 FY 2021 Management Commentary SaaS Revenue $140 to $145 million
Raised from $139 to $143 millionLow double-digit growth in 1H 2021 Marketing Services Revenue $740M to $760 million Maintaining guidance due to visibility in sales canvass process Q1: $214 to $217 millionQ2: $192 to $197 millionQ3: $192
to $197 millionQ4: $142 to $149 million Note: Guidance does not include impact from Sensis acquisition
15 EngagementContinue to educate clients on features and how to leverage capabilities
within platformExpand app marketplace and drive time in-app Drive Cloud Adoption In SMB MarketAggressively sell Thryv via new channels as business environment recoversConvert “unclouded”Efficiently effectively onboard clients Sensis
Integration & SaaS LaunchConnect the two businessesPenetrate existing Sensis clientsSign new clients De-leverCapital allocation priorities focus on paying down debtManage to high EBITDA margins and continue to de-lever Top Priorities
for FY 2021
16 Appendix
Appendix: Non-GAAP Financial Reconciliation 17