Attached files
| file | filename |
|---|---|
| EX-99.1 - EXHIBIT 99.1 - Golden Nugget Online Gaming, Inc. | tm2110629d1_ex99-1.htm |
| 8-K - FORM 8-K - Golden Nugget Online Gaming, Inc. | tm2110629d1_8k.htm |
Exhibit 99.2

Q4 Earnings Presentation March 23rd, 2021

Disclaimer 2 Forward - Looking Statements This presentation contains forward - looking statements within the meaning of Section 27A of the Securities Act of 1933, as amende d, or the Securities Act, and Section 21E of the Securities Exchange Act of 1934, as amended, or the Exchange Act, about us and our industry that involve substantial risks and uncertainties. All statements other than statement s o f historical facts contained in this presentation, including guidance, our expected results of operations or financial condition, business strategy and plans, user growth and engagement, product initiatives, and objectives of manageme nt for future operations, and the impact of COVID - 19 on our business and the economy as a whole, are forward - looking statements. In some cases, you can identify forward - looking statements because they contain words such as "antic ipate," "believe," "contemplate," "continue," "could," "estimate," "expect," "expectations," "forecast," "going to," "intend," "may," "plan," "potential," "predict," "project," "propose," "should," "target," "will," or "would" or the negative of these words or other similar terms or expressions. We caution you that the foregoing may not include all of the forward - looking statements made in this presentation. The financial results included in this presentation are preliminary, estimated and unaudited. The preliminary financial results i ncl uded in this presentation reflect management’s estimates based solely upon information available to management as of the date of this presentation and are subject to change upon the completion of GNOG’s financial closing proc edu res, final adjustments and other developments, including audit and review by GNOG’s independent registered public accounting firm, that may arise between now and the time the financial results for the fourth quarter and y ear - end are finalized. During the course of that process, GNOG may identify items that would require it to make adjustments, which may be material, to the information in this presentation. As a result, the preliminary unaudited fina nci al information included in this presentation is forward - looking information and is subject to risks and uncertainties, including possible material adjustments to the preliminary financial information and the other risks and uncer tai nties described below under “Forward - Looking Statements.” Accordingly, you should not place undue reliance on these estimates. The information presented herein should not be considered a substitute for the financial information to b e f iled with the SEC in GNOG’s Annual Report on Form 10 - K for the fiscal year ended December 31, 2020 once it becomes available . You should not rely on forward - looking statements as predictions of future events. We have based the forward - looking statements contained in this Presentation primarily on our current expectations and projections about future events and trends, including the ongoing COVID - 19 pandemic that we believe may affect our business, financial condition, results of ope rations, and prospects. These forward - looking statements are not guarantees of future performance, conditions or results, and involve a number of known and unknown risks, uncertainties, assumptions and other important factor s, many of which are outside GNOG's control, that could cause actual results or outcomes to differ materially from those discussed in the forward - looking statements. Important factors, among others, that may affect actual results or out comes include the inability to recognize the anticipated benefits of GNOG's acquisition transaction; costs related to the acquisition transaction; the inability to maintain the listing of GNOG's shares on Nasdaq; GNOG's ability to man age growth; GNOG's ability to execute its business plan and meet its projections; potential litigation involving GNOG; changes in applicable laws or regulations, particularly with respect to gaming; general economic and market condition s i mpacting demand for GNOG's products and services, and in particular economic and market conditions in the media / entertainment / gaming / software industry in the markets in which GNOG's operates; the potential adverse effect s o f the ongoing global coronavirus (COVID - 19) pandemic on capital markets, general economic conditions, unemployment and GNOG's liquidity, operations and personnel, as well as risks, uncertainties, and other factors described i n t he section entitled "Risk Factors" in GNOG's filings with the SEC, which are available on the SEC's website at www.sec.gov. Additional information will be made available in other filings that we make from time to time with the SEC. In add ition, any forward - looking statements contained in this presentation are based on assumptions that we believe to be reasonable as of this date. We undertake no obligation to update any forward - looking statements to reflect events or circumstances after the date of this presentation or to reflect new information or the occurrence of unanticipated events, including future developments related to the COVID - 19 pandemic, except as required by law. Non - GAAP Financial Measures EBITDA and adjusted EBITDA are supplemental non - GAAP financial measures that are used by management and external users of our fi nancial statements, such as industry analysts, investors, lenders and rating agencies. We define "EBITDA" as earnings (or loss) before interest, taxes, depreciation, and amortization, and we define "Adjusted EBITDA" as EBI TDA before stock - based compensation, acquisition transaction related expenses, debt extinguishment expenses and other non - recurring items. Neither EBITDA nor Adjusted EBITDA is a measure of net income as determined by U.S. generally acc epted accounting principles ("GAAP "). Management believes EBITDA and Adjusted EBITDA are useful because they allow management to more effectively evaluate our oper ati ng performance and compare the results of our operations from period to period and against our peers without regard to our financing methods or capital structure or non - recurring, non - cash transactions. We exclude the items listed above in calculating EBITDA and Adjusted EBITDA because these amounts can vary substantially from company to company depending upon capital structures and the method by which assets were acquired. None of EBITDA or Adjusted EB ITDA should be considered an alternative to, or more meaningful than, net income (loss), the most closely comparable financial measure calculated in accordance with GAAP. Certain items excluded from EBITDA and Adjusted EBIT DA are significant components in understanding and assessing a company's financial performance, such as a company's return on assets, cost of capital and tax structure. Our presentation EBITDA and Adjusted EBITDA should not be co nst rued as an inference that our results will be unaffected by unusual or non - recurring items. Our computations of EBITDA and Adjusted EBITDA may not be comparable to other similarly titled measures of other companies .

Agenda 3 FY 2020 / Q4 2020 Accomplishments iGaming: A Large A nd Rapidly Growing Market Opportunity Financials
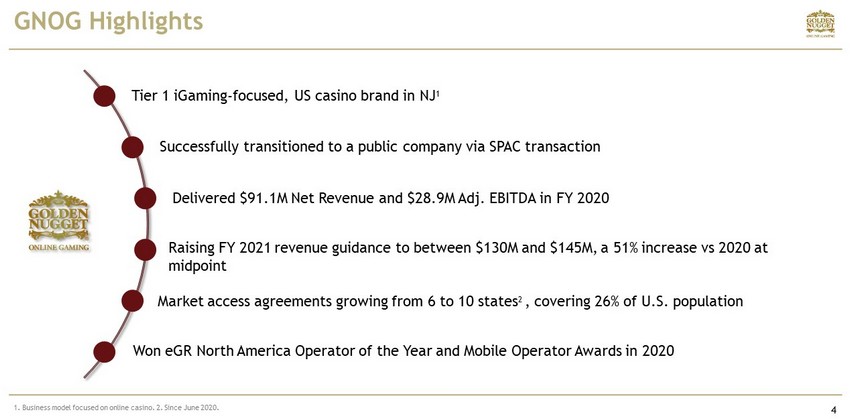
1. Business model focused on online casino. 2. Since June 2020. GNOG Highlights 4 Tier 1 iGaming - focused, US casino brand in NJ 1 Successfully transitioned to a public company via SPAC transaction Delivered $91.1M Net Revenue and $28.9M Adj. EBITDA in FY 2020 Market access agreements growing from 6 to 10 states 2 , covering 26% of U.S. population Won eGR North America Operator of the Year and Mobile Operator Awards in 2020 Raising FY 2021 revenue guidance to between $130M and $145M, a 51% increase vs 2020 at midpoint

$55.4M $91.1M $4.8M $6.2M $ 17.8M $28.9M $15.6M $23.0M 1 . Adjusted EBITDA is before corporate expenses related to new markets and SPAC transaction. Revenue and adjusted EBITDA are non audited for 2020 . For a reconciliation of EBITDA and Adjusted ABITDA to Revenue, please refer to page 25. 2020 Performance 5 4 th Quarter and Full - Year 2020 Highlights $23M Q4 2020 Revenues, up 48% over Q4 2019 $ 28.9M Adj. EBITDA 1 in 2020, ~32% of Revenue, confirms GNOG ability to deliver high returns and the relevance of its focus on iGaming. Revenues grew by 64% in 2020 compared to 2019. Growth delivered in New Jersey, the most mature and competitive market in the U.S. $6.2M Q4 2020 Adj. EBITDA 1 , up 31% over Q4 2019 STRONG REVENUE GROWTH DISCIPLINED OPERATIONS FY 2020 Revenues 2019 2020 2019 2020 Q4 2020 Revenues 2019 2020 2019 2020 FY 2020 Adj. EBITDA 1 Q4 Adj. EBITDA 1

US Online Casino With First - Class Pedigree 6 Strong Revenue Growth Coupled with Proven Experience Monetizing Online Casino Players $18.2M $27.8M $42.9M $55.4M $91.1M $1.7M $5.1M $12.0M $17.8M $28.9M 0 10 20 30 40 50 60 70 80 90 100 2016 2017 2018 2019 2020 Revenues Adj. EBITDA Adj. EBITDA 1 s 9 % s 18% s 28% s 32% s 32% 1 . Adjusted EBITDA is before corporate expenses related to new markets and SPAC transaction. Revenue and adjusted EBITDA are n on audited for 2020. . For a reconciliation of EBITDA and Adjusted ABITDA to Revenue, please refer to page 25.

Player Acquisition & Retention Expertise 7 Record player acquisition, with 2020 new active depositors 1 up 67% Year over Year. Strong player retention with 2020 returning active depositors 2 up 28% vs 2019. Payers acquisition and retention combined to 30,000+ Active Depositors 3 in 2020, up 48% vs 2019. 1. New players who have made a deposit and placed a wager 2. Players acquired in prior years who have made a deposit and placed a wager during the current year. 3. Any player who has made a deposit and placed a wager during the period. 2018 2019 2020 New and Returning Active Depositors Returning Active Depositors New Active Depositors 20.3k 30.0k 18.7k

Increasing Revenue Per User 8 GNOG iGaming Players Are 32% More Valuable On a Monthly Basis Compared to 2016 $566 $ 633 $552 $480 $518 2018 2016 2019 2020 2017 + 32% Casino Net ARPU Avg. Monthly Casino ARPU 1 (NGR) by Year, 2016 to 2020 1. Average Monthly Casino Net ARPU is the Annual Casino Net Gaming Revenue divided by the sum of monthly active depositors durin g t he year. See definition of Net Gaming Revenue page 26. 2. Source : GNOG management, GNOG management estimates . + 1 2%
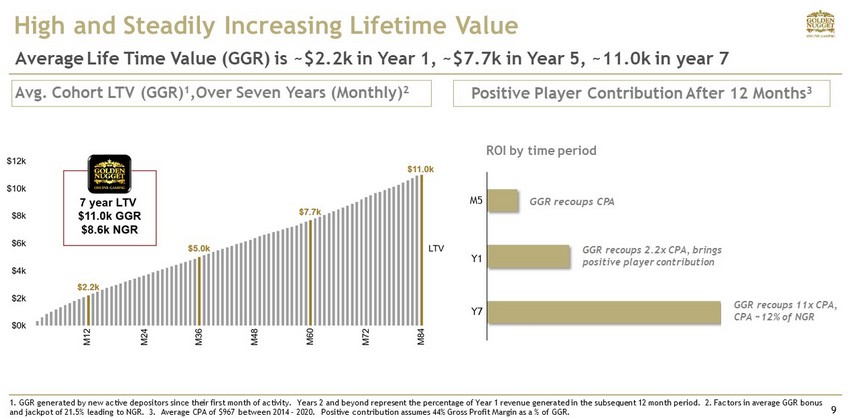
1. GGR generated by new active depositors since their first month of activity. Years 2 and beyond represent the percentage o f Y ear 1 revenue generated in the subsequent 12 month period. 2. Factors in average GGR bonus and jackpot of 21.5% leading to NGR. 3. Average CPA of $967 between 2014 – 2020. Positive contribution assumes 44% Gross Prof it Margin as a % of GGR. High and Steadily Increasing Lifetime Value 9 Average Life Time Value (GGR) is ~$ 2.2k in Year 1, ~$7.7k in Year 5, ~11.0k in year 7 Avg. Cohort LTV ( GGR ) 1 ,Over Seven Years ( Monthly) 2 Y7 GGR recoups CPA GGR recoups 2.2x CPA, brings positive player contribution GGR recoups 11x CPA, CPA ~12% of NGR ROI by time period M5 Y1 Positive Player Contribution A fter 12 Months 3

30% Highly Loyal and Valuable Player Base 10 50%+ of 2020 GGR From Cohorts Acquired Before 2019, Steady Revenue Retention Over Time GNOG GGR by Yearly Cohort, 2013 to 2020 1 % of 2020 GGR Source : GNOG management . Represents GGR a cohort has generated over time. Cohort defined as any player who made a deposit and placed a wager in a giv en year. 0 10 20 30 40 50 60 70 80 90 100 2013 2014 2015 2016 2017 2018 2019 2020 Millions 2013 2014 2015 2016 2017 2018 2019 2020 18% 16% 12% 8% 6% 10% 1% 2020 2019 2018 2017 2016 2015 2014 2013 Cohort

Agenda 11 FY 2020 / Q4 2020 Accomplishments iGaming: A Large A nd Rapidly Growing Market Opportunity Financials

Source: New Jersey Gaming Commission for 2014 - 2020 actuals, GNOG management estimates of Online Casino and Land - based Casino GGR for 2021 - 2023 . Land - based casino GGR includes tables and slots, excludes sports betting. Pandemic Has Accelerated Online Gaming Growth 12 NJ GGR by Online vs. Retail Casino, 2014 to 2023F iGaming Expected To Account For ~40% Of New Jersey Land - Based GGR post pandemic 4% 5% 7% 9% 11% 17% 62% 45% 40% 40% 0% 10% 20% 30% 40% 50% 60% 70% 2014 2015 2016 2017 2018 2019 2020 2021F 2022F 2023F $0 $1 $1 $2 $2 $3 $3 $4 Billions Online Casino GGR s a % of Land Based Casino GGR Land Based Casino GGR

iGaming A Larger Vertical Than Online Sportsbetting in NJ 13 NJ GGR by Online Sportsbetting vs. iGaming, 2018 to 2023F Source: New Jersey Gaming Commission for 2018 - 2020 actuals, GNOG management estimates for Online sports betting and online casino GGR for the period 2021 - 2023. ($ in millions) $54 $ 244 $ 359 $ 500 $ 575 $650 $ 277 $ 462 $ 931 $1,100 $1,150 $1,200 2018 2019 2020F 2021F 2022F 2023F Online Sports GGR iGaming GGR 2020

Igaming Versus Sports GGR – Top 3 iGaming Markets 14 Online Casino Generates Much Higher Revenues than Online Sports Betting In All States Where Both Are Available $ 932 M $359M New Jersey FY 2020 Casino Sports $ 712 M $ 241 M Pennsylvania FY 2020 Casino Sports $ 109 M $ 23 M Michigan 2021 YTD Casino Sports Sources: Eilers & Krejcik , New Jersey Division of Gaming Enforcement, Pennsylvania Gaming Control Board, Michigan Gaming Control Board
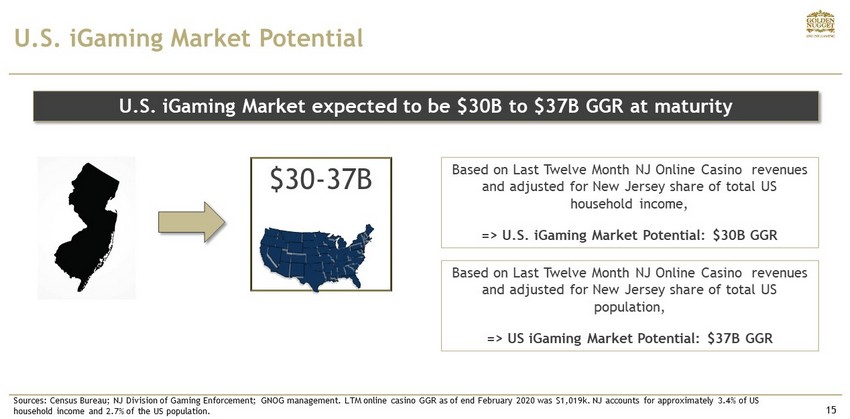
U.S. iGaming Market Potential 15 Based on Last Twelve Month NJ Online Casino revenues and adjusted for New Jersey share of total US household income, => U.S. iGaming Market Potential: $30B GGR U.S. iGaming Market expected to be $30B to $37B GGR at maturity Based on Last Twelve Month NJ Online Casino revenues and adjusted for New Jersey share of total US population, => US iGaming Market P otential: $37B GGR $30 - 37B W A O R M T I D U T W Y C O O K K S N B S D N D M N I A M O T N N C I L O H I N K Y W V M T S D Sources: Census Bureau; NJ Division of Gaming Enforcement; GNOG management . LTM online casino GGR as of end February 2020 was $1,019k. NJ accounts for approximately 3.4% of US household income and 2.7% of the US population.

iGaming Revenue Ramp Up Much Quicker in New Markets 16 PA Online Casino vs NJ Online Casino iGaming Market Size (GGR) by Year NJ iGaming vs MI iGaming in Month 1 & 2 $83 $117 $288 $553 - 100 200 300 400 500 600 Year 1 Year 2 Millions New Jersey Pennsylvania Sources: Eilers & Krejcik ‘Pennsylvania Online Casino Update’; New Jersey Division of Gaming Enforcement; Michigan Gaming Control Board. NJ iGaming and M I iGaming include online casino and online poker. $1.0 $7.4 $13.3 $79.7 - 10 20 30 40 50 60 70 80 90 Month 1 Month 2 Millions New Jersey Michigan

Market Access 1. GNOG currently in application phase of license process. 2. Golden Nugget Danville is a new casino, not yet in operations. iGaming subject to state laws and regulations. 3. New York has not passed legislation to date on iGaming; agreement with Tioga Downs LLC is for a 2 nd skin for iGaming 4. Nevada, Mississippi and Louisiana have not regulated iGaming to date 17 Market Access to 10 States Michigan (Live) Illinois 2 West Virginia Keweenaw Bay Indian Community Danville Development LLC The Greenbrier Hotel Corporation Casino & Sports Casino & Sports Casino & Sports State Partner Vertical These states are in addition to access GNOG already have in place in New Jersey, Nevada, Mississippi and Louisiana via the Golden Nugget land based casinos Pennsylvania 1 Qualified Gaming Entity (own license) Casino New York 2 Tioga Downs LLC Casino Virginia Untethered License Sports

Market Access Outlook 18 GNOG Taking An Aggressive Approach To Secure Market Access iGaming M arket of $30B - $37B 3 at maturity W A O R M T I D U T W Y C O O K K S N B S D N D M N I A M O T N N C I L O H I N K Y W V NJ MI PA 1 WV IL MS LA NV NY 1 Ongoing discussions to secure access to more states. Live/Contracted in 10 States ~26% of US population VA 2 1. Casino only 2. Untethered sports license 3. GNOG management estimate, see also page 15.

Agenda 19 FY 2020 / Q4 2020 Accomplishments iGaming: A Large And Rapidly Growing Market Opportunity Financials

Financial Results 20 $23.0M net revenues in Q4 2020 and $91.1M FY 2020 Acquisition transaction completed December 29 th Ended 2020 with $77.9M cash, warrant redemption completed on March 8, 2021 raising an additional $110.2M in proceeds $6.2M Adj. EBITDA in Q4 2020 and $28.9M FY 2020 Q4 2020 Q4 2019 FY 2020 FY 2019 Gaming 20,029 13,363 79,919 47,694 Other 3,000 2,203 11,201 7,727 Net Revenue 23,029 15,566 91,120 55,421 YoY Growth 48% 64% Total Operating Costs & Expenses 21,042 10,846 66,628 37,784 Operating Income 1,987 4,720 24,492 17,637 Other Expenses 44,799 1 63,876 6 Net income (loss) before income taxes (42,812) 4,719 (39,384) 17,631 Provisions for income taxes (8,565) 1,525 (7,651) 5,960 Net income (loss) (34,247) 3,194 (31,733) 11,671 Provision for income taxes (8,565) 1,525 (7,651) 5,960 Interest Expense 19,415 1 38,492 6 Depreciation and amortization 52 34 190 135 EBITDA (23,345) 4,754 (702) 17,772 Debt extinguishment expenses 25,384 - 25,384 - Acquisition Transaction Related expenses 4,137 - 4,137 - Stock Based Comp 35 - 35 - Adjusted EBITDA 6,211 4,754 28,854 17,772 YoY Growth 31% 62%
Guidance 21 • Increasing FY2021 Revenue Guidance to between $130M and $145M, which at the midpoint represents an increase of 51% over 2020 revenues. • Accelerated investments in 5 new markets expected to yield losses in these markets in the short term and greater returns to the global business over the long - term.
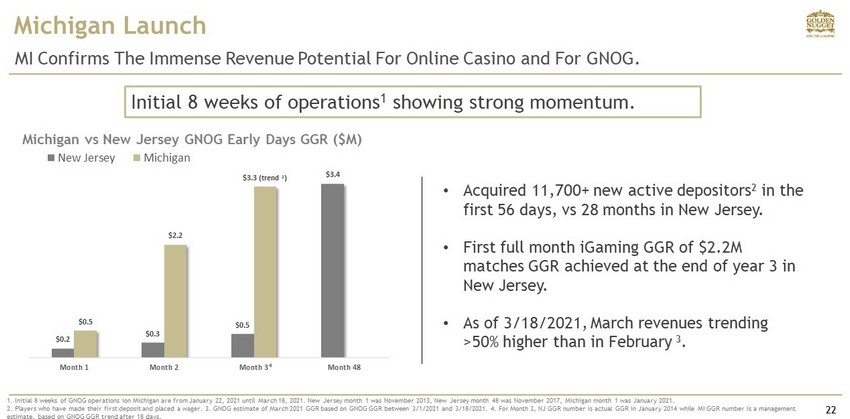
Michigan Launch 22 MI Confirms The Immense Revenue Potential For Online Casino and For GNOG. 1. Initial 8 weeks of GNOG operations ion Michigan are from January 22, 2021 until March 18, 2021. New Jersey month 1 was Nov emb er 2013, New Jersey month 48 was November 2017, Michigan month 1 was January 2021. 2 . Players who have made their first deposit and placed a wager. 3. GNOG estimate of March 2021 GGR based on GNOG GGR between 3/1/2021 and 3/18/2021. 4 . For Month 3, NJ GGR number is actual GGR in January 2014 while MI GGR number is a management estimate, based on GNOG GGR trend after 18 days. Michigan vs New Jersey GNOG Early Days GGR ($M) Initial 8 weeks of operations 1 showing strong momentum. • Acquired 11,700+ new active depositors 2 in the first 56 days, vs 28 months in New Jersey. • First full month iGaming GGR of $2.2M matches GGR achieved at the end of year 3 in New Jersey. • As of 3/18/2021, March revenues trending >50% higher than in February 3 . $0.2 $0.3 $0.5 $3.4 $0.5 $2.2 $3.3 (trend 2 ) Month 1 Month 2 Month 3 Month 48 New Jersey Michigan 4
Positioned for Growth 23 New Jersey revenue and profitability track record demonstrate GNOG winning business model and ability to execute in a competitive environment. PA and MI markets are larger than anticipated and quickly ramping up iGaming revenues validate GNOG choice to focus on online casino, a larger and highly profitable product vertical. Well positioned to be a leading operator in what could become a $30B+ iGaming market. An iconic brand, strong customer value proposition and loyal player base. Newly enhanced cash position allows GNOG to secure access to more markets , increase marketing investments to grow faster in new markets and further upgrade Customer Value Proposition.

Appendix 24
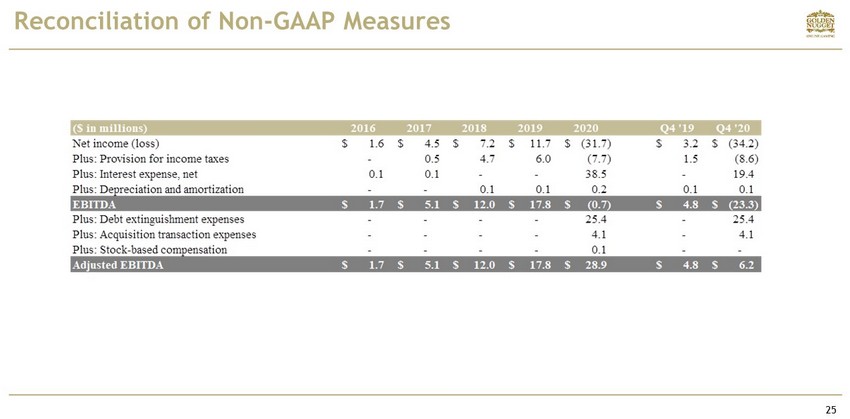
Reconciliation of Non - GAAP Measures 25
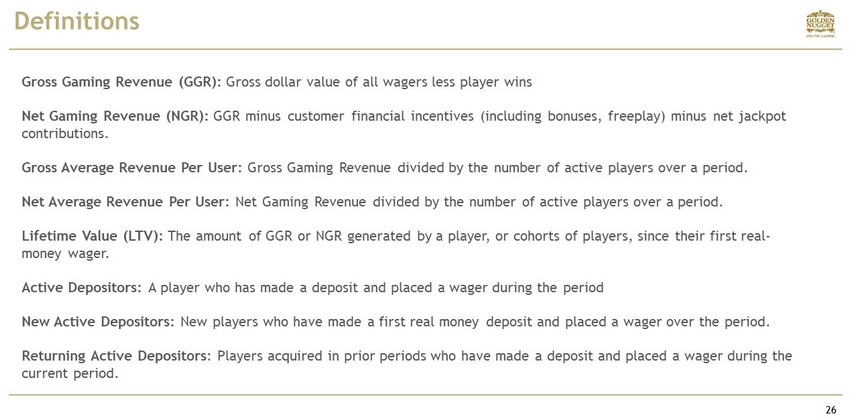
Definitions 26 Gross Gaming Revenue (GGR): G ross dollar value of all wagers less player wins Net Gaming Revenue (NGR): GGR minus customer financial incentives (including bonuses, freeplay ) minus net jackpot contributions. Gross Average Revenue Per User: Gross Gaming Revenue divided by the number of active players over a period. Net Average Revenue Per User: Net Gaming Revenue divided by the number of active players over a period. Lifetime Value (LTV): The amount of GGR or NGR generated by a player, or cohorts of players, since their first real - money wager. Active Depositors: A player who has made a deposit and placed a wager during the period New Active Depositors: New players who have made a first real money deposit and placed a wager over the period. Returning Active Depositors : Players acquired in prior periods who have made a deposit and placed a wager during the current period.
