Attached files
| file | filename |
|---|---|
| EX-32.2 - EX-32.2 - Ortho Clinical Diagnostics Holdings plc | ocdx-ex322_15.htm |
| EX-32.1 - EX-32.1 - Ortho Clinical Diagnostics Holdings plc | ocdx-ex321_13.htm |
| EX-31.2 - EX-31.2 - Ortho Clinical Diagnostics Holdings plc | ocdx-ex312_12.htm |
| EX-31.1 - EX-31.1 - Ortho Clinical Diagnostics Holdings plc | ocdx-ex311_11.htm |
| EX-23.1 - EX-23.1 - Ortho Clinical Diagnostics Holdings plc | ocdx-ex231_10.htm |
| EX-10.3 - EX-10.3 - Ortho Clinical Diagnostics Holdings plc | ocdx-ex103_9.htm |
| EX-10.2 - EX-10.2 - Ortho Clinical Diagnostics Holdings plc | ocdx-ex102_8.htm |
| EX-4.4 - EX-4.4 - Ortho Clinical Diagnostics Holdings plc | ocdx-ex44_14.htm |
UNITED STATES
SECURITIES AND EXCHANGE COMMISSION
Washington, D.C. 20549
FORM 10-K
(Mark One)
|
☒ |
ANNUAL REPORT PURSUANT TO SECTION 13 OR 15(d) OF THE SECURITIES EXCHANGE ACT OF 1934 |
For the fiscal year ended January 3, 2021
OR
|
☐ |
TRANSITION REPORT PURSUANT TO SECTION 13 OR 15(d) OF THE SECURITIES EXCHANGE ACT OF 1934 FOR THE TRANSITION PERIOD FROM TO |
Commission File Number: 001-39956
Ortho Clinical Diagnostics Holdings plc
(Exact name of Registrant as specified in its Charter)
|
England and Wales |
98-1574150 |
|
(State or other jurisdiction of incorporation or organization) |
(I.R.S. Employer Identification No.) |
|
1001 Route 202 Raritan, New Jersey |
08869 |
|
(Address of principal executive offices) |
(Zip Code) |
Registrant’s telephone number, including area code: 908-218-8000
Securities registered pursuant to Section 12(b) of the Act:
|
Title of each class |
|
Trading Symbol(s) |
|
Name of each exchange on which registered |
|
Ordinary shares, $0.00001 par value per ordinary share |
|
OCDX |
|
Nasdaq Global Select Market |
Securities registered pursuant to Section 12(g) of the Act: None
Indicate by check mark if the Registrant is a well-known seasoned issuer, as defined in Rule 405 of the Securities Act. YES ☐ NO ☒
Indicate by check mark if the Registrant is not required to file reports pursuant to Section 13 or 15(d) of the Act. YES ☐ NO ☒
Indicate by check mark whether the Registrant: (1) has filed all reports required to be filed by Section 13 or 15(d) of the Securities Exchange Act of 1934 during the preceding 12 months (or for such shorter period that the Registrant was required to file such reports), and (2) has been subject to such filing requirements for the past 90 days. YES ☐ NO ☒
Indicate by check mark whether the Registrant has submitted electronically every Interactive Data File required to be submitted pursuant to Rule 405 of Regulation S-T (§232.405 of this chapter) during the preceding 12 months (or for such shorter period that the Registrant was required to submit such files). YES ☐ NO ☒
Indicate by check mark whether the registrant is a large accelerated filer, an accelerated filer, a non-accelerated filer, smaller reporting company, or an emerging growth company. See the definitions of “large accelerated filer,” “accelerated filer,” “smaller reporting company,” and “emerging growth company” in Rule 12b-2 of the Exchange Act.
|
Large accelerated filer |
|
☐ |
|
Accelerated filer |
|
☐ |
|
|
|
|
|
|||
|
Non-accelerated filer |
|
☒ |
|
Smaller reporting company |
|
☐ |
|
|
|
|
|
|
|
|
|
|
|
|
|
Emerging growth company |
|
☐ |
If an emerging growth company, indicate by check mark if the registrant has elected not to use the extended transition period for complying with any new or revised financial accounting standards provided pursuant to Section 13(a) of the Exchange Act. ☐
Indicate by check mark whether the registrant has filed a report on and attestation to its management’s assessment of the effectiveness of its internal control over financial reporting under Section 404(b) of the Sarbanes-Oxley Act (15 U.S.C. 7262(b)) by the registered public accounting firm that prepared or issued its audit report. ☐
Indicate by check mark whether the Registrant is a shell company (as defined in Rule 12b-2 of the Exchange Act). YES ☐ NO ☒
As of June 28, 2020, the last business day of the registrant’s most recently completed fiscal second quarter, the registrant’s ordinary shares were not publicly traded. The registrant’s ordinary shares, $0.00001 nominal value per share, began trading on The Nasdaq Global Select Market (“Nasdaq”) on January 28, 2021. As of March 3, 2021, the aggregate market value of the registrant’s ordinary shares held by non-affiliates was approximately $1,582,048,957, based on the closing sale price of the ordinary shares on that date on Nasdaq.
As of March 3, 2021, 234,742,792 of the registrant’s ordinary shares were outstanding.
DOCUMENTS INCORPORATED BY REFERENCE
No items are incorporated by reference into this Annual Report on Form 10-K.
|
|
|
Page |
|
|
|
|
|
Item 1. |
4 |
|
|
Item 1A. |
24 |
|
|
Item 1B. |
54 |
|
|
Item 2. |
55 |
|
|
Item 3. |
55 |
|
|
Item 4. |
55 |
|
|
|
|
|
|
|
|
|
|
Item 5. |
56 |
|
|
Item 6. |
56 |
|
|
Item 7. |
Management’s Discussion and Analysis of Financial Condition and Results of Operations |
59 |
|
Item 7A. |
81 |
|
|
Item 8. |
83 |
|
|
Item 9. |
Changes in and Disagreements With Accountants on Accounting and Financial Disclosure |
83 |
|
Item 9A. |
83 |
|
|
Item 9B. |
83 |
|
|
|
|
|
|
|
|
|
|
Item 10. |
84 |
|
|
Item 11. |
90 |
|
|
Item 12. |
Security Ownership of Certain Beneficial Owners and Management and Related Stockholder Matters |
102 |
|
Item 13. |
Certain Relationships and Related Transactions, and Director Independence |
103 |
|
Item 14. |
105 |
|
|
|
|
|
|
|
|
|
|
Item 15. |
107 |
|
|
Item 16 |
109 |
i
Unless otherwise indicated or the context otherwise requires, references in this Annual Report on Form 10-K to:
|
|
• |
the term “2025 Notes” refers to the $400.0 million in aggregate principal amount of 7.375% Senior Notes due 2025 issued by the Lux Co-Issuer and the U.S. Co-Issuer. We redeemed $160 million in aggregate principal amount of 2025 Notes in February 2021 in connection with our IPO. As of the date of this Annual Report on Form 10-K, $240 million in aggregate principal amount of 2025 Notes was outstanding; |
|
|
• |
the term “2025 Notes Indenture” refers to the indenture governing the 2025 Notes, as amended, supplemented or otherwise modified from time to time; |
|
|
• |
the term “2028 Notes” refers to the $675.0 million in aggregate principal amount of 7.250% Senior Notes due 2028 issued by the Lux Co-Issuer and the U.S. Co-Issuer. We redeemed $270 million in aggregate principal amount of 2028 Notes in February 2021 in connection with our IPO. As of the date of this Annual Report on Form 10-K, $405 million in aggregate principal amount of 2028 Notes was outstanding; |
|
|
• |
the term “2028 Notes Indenture” refers to the indenture governing the 2028 Notes, as amended, supplemented or otherwise modified from time to time; |
|
|
• |
the term “Acquisition” refers to the acquisition by Bermuda Holdco pursuant to a stock and asset purchase agreement, dated January 16, 2014 (the “Acquisition Agreement”), of (i) certain assets and liabilities and (ii) all of the equity interests and substantially all of the assets and liabilities of certain entities which, together with their subsidiaries, comprised the Ortho Clinical Diagnostics business from Johnson & Johnson; |
|
|
• |
the term “assay” refers to an investigative (analytic) procedure in laboratory medicine, pharmacology, environmental biology and molecular biology for qualitatively assessing or quantitatively measuring the presence or amount or the functional activity of a target entity (the analyte), which can be a drug or biochemical substance or a cell in an organism or organic sample; |
|
|
• |
the term “Bermuda Holdco” refers to Ortho-Clinical Diagnostics Bermuda Co. Ltd., a Bermuda exempted limited liability company. As part of the Reorganization Transactions, the existing ordinary shares of Bermuda Holdco were contributed to UK Holdco in exchange for ordinary shares of UK Holdco; |
|
|
• |
the term “consumables” refers to miscellaneous items such as calibrators, pipettes and controls, which are run on our instruments in conjunction with and in support of assays and reagents; |
|
|
• |
the term “Credit Agreement” refers to that certain credit agreement governing our Senior Secured Credit Facilities; |
|
|
• |
the term “emerging markets” refers to all countries where we operate other than Australia, Austria, Belgium, Canada, Denmark, Finland, France, Germany, Italy, Japan, Luxembourg, the Netherlands, New Zealand, Norway, Portugal, Spain, Sweden, Switzerland, the United Kingdom, the United States and certain other developed countries; |
|
|
• |
the term “GAAP” refers to the generally accepted accounting principles in the United States of America; |
|
|
• |
the term “Holdings” refers to Ortho-Clinical Diagnostics Holdings Luxembourg S.à r.l., a société à responsabilité limitée organized under the laws of the Grand Duchy of Luxembourg, having its registered office at 89C, rue Pafebruch, L-8308 Capellen, Grand Duchy of Luxembourg and registered with the Luxembourg trade and companies register (Registre de Commerce et des Sociétés de Luxembourg) under number B185679 and an indirect, wholly owned subsidiary of UK Holdco; |
|
|
• |
the term “Joint Business” refers to a long-term collaboration agreement with Grifols Diagnostic Solutions, Inc. that encompasses certain Clinical Laboratories and Donor Screening products; |
|
|
• |
the term “laboratories,” when we refer to our customers, refers to testing sites that process and provide results for in vitro diagnostic tests within hospitals, independent reference labs, physician office labs or physician clinics; |
|
|
• |
the term “Lux Co-Issuer” refers to Ortho-Clinical Diagnostics S.A., a société anonyme organized under the laws of the Grand Duchy of Luxembourg, having its registered office at 89C, rue Pafebruch, L-8308 Capellen Luxembourg and registered with the Luxembourg trade and companies register (Registre de Commerce et des Sociétés de Luxembourg) under number B 185693 and an indirect, wholly owned subsidiary of UK Holdco; |
|
|
• |
the terms “Principal Shareholder” and “Carlyle” refer to The Carlyle Group Inc. and its affiliates; |
|
|
• |
the term “reagent” refers to a substance that is added during a test in order to bring about a reaction. The resulting reaction is used to confirm the presence of another substance. Our reagents are used to identify different properties of blood; |
|
|
• |
the term “Reorganization Transactions” refers to the transactions described under “—Reorganization transactions”; |
1
|
|
• |
the term “Senior Secured Credit Facilities” refers to (a) the senior secured term loan facility in an original amount of $2,175.0 million, as increased by the incremental term loan (the “Incremental Term Loan”) of $200 million (collectively, the “Dollar Term Loan Facility”), (b) the euro-denominated senior secured term loan facility in an amount equal to €337.4 million (the “Euro Term Loan Facility” and, together with the Dollar Term Loan Facility, the “Term Loan Facilities”), and (c) the multi-currency senior secured revolving facility with commitments of $500.0 million (the “Revolving Credit Facility”). We repaid $892.7 million in aggregate principal amount of borrowings under our Dollar Term Loan Facility in connection with our IPO. As of the date of this Annual Report on Form 10-K, approximately $1,292.8 million in aggregate principal amount of borrowings under our Dollar Term Loan Facility were outstanding; |
|
|
• |
the term “throughput” refers to the number of tests performed during a certain time period; |
|
|
• |
the term “UK Holdco” refers to Ortho Clinical Diagnostics Holdings plc, a public limited company incorporated under the laws of England and Wales. As part of the Reorganization Transactions, the existing ordinary shares of Bermuda Holdco were contributed to UK Holdco in exchange for ordinary shares of UK Holdco; |
|
|
• |
the term “U.S. Co-Issuer” refers to Ortho-Clinical Diagnostics, Inc., a corporation incorporated under the laws of the State of New York and an indirect, wholly owned subsidiary of UK Holdco; |
|
|
• |
the terms “we,” “us,” “our,” “its,” our “Company” and “Ortho” refer to UK Holdco and its consolidated subsidiaries after giving effect to the Reorganization Transactions; |
References to a year refer to our fiscal years ended on the Sunday nearest December 31 of the specified year and consist of 52 weeks (for example, the terms “2020” and “fiscal 2020” refer to our fiscal year ended January 3, 2021, the terms “2019” and “fiscal 2019” refer to our fiscal year ended December 29, 2019 and the terms “2018” and “fiscal 2018” refer to our fiscal year ended December 30, 2018).
References to our customers mean those customers we directly sell our products and services to, such as hospitals, clinics and our distributors. References to our end-customers mean customers who use our products, which include hospitals and clinics.
Reorganization Transactions
UK Holdco is a public limited company incorporated under the laws of England and Wales for purposes of becoming the new holding company of Bermuda Holdco and its subsidiaries and upon incorporation, it had an initial share capital of one ordinary share and 50,000 preferred redeemable shares (“Incorporation Shares”). Prior to the consummation of the Reorganization Transactions, UK Holdco had no subsidiaries or operations. On January 25, 2021, Carlyle and all other shareholders of Bermuda Holdco contributed all of their outstanding equity interests in Bermuda Holdco to UK Holdco in exchange for ordinary shares of UK Holdco on a 1-for-1 basis (the “Reorganization Transactions”). Following the Reorganization Transactions, the Incorporation Shares held by Carlyle were deferred, with no economic or voting rights attributable to such shares.
Following the completion of our initial public offering (“IPO”), we expect that Bermuda Holdco will be dissolved and UK Holdco will directly own all outstanding equity interests of Holdings and will indirectly own all outstanding equity interests of Holdings’ subsidiaries. Prior to the Reorganization Transactions, UK Holdco had no operations and no material assets or liabilities. As a result of the Reorganization Transactions, UK Holdco superseded Bermuda Holdco as the ultimate parent of Ortho and succeeded to the business and operations of Bermuda Holdco.
Trademarks and service marks
We own or have rights to trademarks, service marks or trade names that we use in connection with the operation of our business. In addition, our names, logos and website names and addresses are our service marks or trademarks. Other trademarks, service marks and trade names appearing in this Annual Report on Form 10-K are the property of their respective owners. The trademarks we own or have the right to use include, among others, ORTHO®, ORTHO CLINICAL DIAGNOSTICS®, ORTHO VISION™, BIOVUE® and VITROS®. Solely for convenience, in some cases, the trademarks, service marks and trade names referred to in this Annual Report on Form 10-K are listed without the applicable ® and ™ symbols, but we will assert, to the fullest extent under applicable law, our rights to these trademarks, service marks and trade names.
Market, industry and other data
Throughout this Annual Report on Form 10-K, we refer to our market position or market share in various markets or regions. These references represent our best estimates of our market share at the time of this Annual Report on Form 10-K and are based on management’s knowledge of the industry and the market data and other statistical information obtained from independent industry publications, reports by market research firms or other published independent sources. We confirm that such information has been accurately reproduced and that, so far as we are aware, and are able to ascertain from information published by publicly available sources
2
and other publications, no facts have been omitted which would render the reproduced information inaccurate or misleading. Industry publications, reports and other published data generally state that the information contained therein has been obtained from sources believed to be reliable. Certain other market and industry data included in this Annual Report on Form 10-K, including the size of certain markets, are based on estimates of our management. These estimates have been derived from our management’s knowledge and experience in the markets in which we operate, as well as information obtained from surveys, reports by market research firms, our customers, distributors, suppliers, trade and business organizations and other contacts in the markets in which we operate. Projections, assumptions and estimates of our future performance and the future performance of the industry in which we operate are necessarily subject to a high degree of uncertainty and risk due to a variety of factors, including those described in “Risk Factors” in Part I, Item 1A of this Annual Report on Form 10-K and elsewhere in this Annual Report on Form 10-K. These and other factors could cause results to differ materially from those expressed in our estimates and beliefs and in the estimates prepared by independent parties.
Unless specifically noted otherwise, information presented in this Annual Report on Form 10-K with respect to our position relative to other industry participants is based on information or sources for the year ended December 31, 2019. Market size and market growth information presented in this Annual Report on Form 10-K reflects estimates of market sizes and growth in such markets for the year ended December 31, 2020 and for the years ended December 31, 2020 through 2024, respectively. In each such case, management believes such information presented represents the most recent data available to the Company.
Certain monetary amounts, percentages and other figures included in this Annual Report on Form 10-K have been subject to rounding adjustments. Accordingly, figures shown as totals in certain tables and charts may not be the arithmetic aggregation of the figures that precede them, and figures expressed as percentages in the text may not total 100% or, as applicable, when aggregated may not be the arithmetic aggregation of the percentages that precede them.
Forward-looking statements
This Annual Report on Form 10-K contains forward-looking statements within the meaning of Section 27A of the Securities Act of 1933, as amended (the “Securities Act”), and Section 21E of the Securities Exchange Act of 1934, as amended (the “Exchange Act”). Such forward-looking statements reflect, among other things, our current expectations and anticipated results of operations, all of which are subject to known and unknown risks, uncertainties and other factors that may cause our actual results, performance or achievements, market trends, or industry results to differ materially from those expressed or implied by such forward-looking statements. Therefore, any statements contained herein that are not statements of historical fact may be forward-looking statements and should be evaluated as such. Without limiting the foregoing, the words as “anticipate,” “expect,” “suggest,” “plan,” “believe,” “intend,” “project,” “forecast,” “estimates,” “targets,” “projections,” “should,” “could,” “would,” “may,” “might,” “will,” and the negative thereof and similar words and expressions are intended to identify forward-looking statements. These forward-looking statements are subject to a number of risks, uncertainties and assumptions, including those described in “Risk Factors” in Part I, Item 1A of this report. Unless legally required, we assume no obligation to update any such forward-looking information to reflect actual results or changes in the factors affecting such forward-looking information.
When we use the terms “Ortho,” the “Company,” “we,” “us” or “our” in this Annual Report on Form 10-K, we mean Ortho Clinical Diagnostics Holdings plc and its subsidiaries on a consolidated basis, unless the context indicates otherwise.
3
Our company
We are a pure-play in vitro diagnostics (“IVD”) business driven by our credo, “Because Every Test is A Life.” This guiding principle reflects the crucial role diagnostics play in global health and guides our priorities as an organization. As a leader in IVD, we impact approximately 800,000 patients every day. We are dedicated to improving outcomes for these patients and saving lives through providing innovative and reliable diagnostic testing solutions to the clinical laboratory and transfusion medicine communities. Our global infrastructure and commercial reach allow us to serve these markets with significant scale. We have an intense focus on the customer. We support our customers with high quality diagnostic instrumentation, a broad test portfolio and market leading service. Our products deliver consistently fast, accurate and reliable results that allow clinicians to make better-informed treatment decisions. Our business model generates significant recurring revenues and strong cash flow streams from ongoing sales of high margin consumables. In 2020, these consumables contributed more than 91% of our total revenue and approximately 93% of our core revenue. We maintain close connectivity with our customers through our global presence, with more than 4,500 employees, including approximately 2,200 commercial sales, service and marketing teammates. This global organization allows us to support our customers across more than 130 countries and territories.
We have been pioneering life-impacting advances in diagnostics for over 80 years, from our earliest work in blood typing, to our innovation in infectious diseases and our latest developments in laboratory solutions. In 2014, we were acquired by The Carlyle Group from Johnson & Johnson and became an independent organization, solely focused on delivering high quality IVD products and service to our diagnostic customer base. At the time of the separation, our business had global scale, a reputation for high quality products, a strong quality management system and a research and development team with extensive scientific expertise. Over the past six years, we have significantly invested in our business with the objective of creating a highly efficient, innovative and lean organization capable of scaling to meet our customers’ needs. These investments included the following focus areas:
|
• |
Infrastructure: We invested over $500 million in IT, finance, supply chain and other support functions to build out our infrastructure and capabilities as a standalone business and drive long-term, profitable growth. |
|
• |
Research and Development: We increased our focus on innovation by investing approximately $550 million in research and development to enhance our existing capabilities and develop new instruments and assays to supplement our portfolio. |
|
• |
Commercial: We redesigned our go-to-market strategy across all key regions, expanded our sales force, implemented new customer information systems and launched ORTHOCARE to enhance our service capabilities. |
|
• |
Operations: We consolidated and streamlined our manufacturing capabilities and other global functions to improve profitability and cash flow, achieving more than $200 million in savings since our acquisition by Carlyle. |
|
• |
Leadership: To capitalize on these investments, we recruited a highly qualified management team of experienced diagnostic and healthcare leaders focused on our customers and accelerated growth. |
With these investments, we have reinvigorated our portfolio, transformed our commercial model and emerged as a focused leader in the IVD market, which we believe positions our business for future growth.
IVD testing is a critical tool in evaluating health in many different settings around the world. IVD is a core component of routine health care check-ups for those who are presenting with symptoms or require procedures, and it influences up to 70% of critical healthcare clinical decision-making. Consequently, our IVD solutions have a profound impact on the assessment of health and the delivery of care. IVD is also critical in monitoring the transmission and spread of infectious disease outbreaks, where Ortho’s longstanding excellence in infectious disease testing is particularly relevant. Our solutions are central to the operations of hospitals, clinics, blood banks and donor centers around the world, where they are used to help diagnose certain conditions, such as cancer or heart attacks, and infectious diseases, such as hepatitis, HIV, and most recently, COVID-19, where we have launched two antibody tests and an antigen test, and we are actively expanding our menu of tests to address the global pandemic.
We operate in an approximately $26 billion addressable market, which is expected to grow at a CAGR of approximately 5% from 2020 to 2024. We compete in the two largest IVD markets, Immunoassay and Clinical Chemistry, which together comprise our Clinical Laboratories business and represent approximately $24 billion of our current addressable market. We expect our Clinical Laboratories business will be favorably impacted by an aging population, an increased need for testing of chronic conditions, the expansion of access to healthcare services, the emergence of new disease states and other macro trends. We are also the global leader in Transfusion Medicine, which includes hospital-based Immunohematology and Donor Screening for blood and plasma at hospitals and other donation centers. Transfusion Medicine represents approximately $2 billion of our current addressable market. We expect our
4
Transfusion Medicine business will be favorably impacted by increases in the number and type of surgical procedures, an aging population and other macro trends. There is significant overlap in our customer base given we currently sell to about 70% of the hospitals in the United States, and we are often able to leverage our leadership within Transfusion Medicine to cross-sell our Clinical Laboratories solutions. Because we focus primarily on acute or critical care diagnostics that are core to therapeutic decisions in hospitals, our markets are relatively resilient across business cycles. We offer our products and services globally, with distinct offerings targeted to the needs of customers in developed and emerging markets.
Today, we operate two lines of business, Clinical Laboratories and Transfusion Medicine, which together generate our core revenue:
|
• |
Clinical Laboratories: Comprised of Clinical Chemistry, which is the measurement of target chemicals in bodily fluids for the evaluation of health and the clinical management of patients, and Immunoassay, which is the measurement of proteins as they act as antigens in the spread of disease, antibodies in the immune response spurred by disease, or markers of proper organ function and health. |
|
• |
Transfusion Medicine: Comprised of Donor Screening, where blood and plasma is screened at donation for blood type and target diseases, and Immunohematology, where blood is typed and screened at the hospital blood bank before being transfused into the patient. |
Our broad offerings allow us to support our customer base and maximize the opportunity to provide each of our customers with a comprehensive array of products and services over time. We refer to this mutually beneficial approach as focusing on Lifetime Customer Value (“LCV”). Our focus on LCV underpins everything we do, from the design and execution of our commercial and service model, to our instrument and assay innovation, to the composition of our global footprint. Our approach has informed our choice to focus on medium- to high-volume laboratories, which in turn has helped us become a leader in our Focus Markets and transformed our financial profile. We intend to continue to invest in and evolve our LCV framework to best support our customers and maximize our financial results.
As an example, we may begin a Clinical Laboratories customer relationship by providing a standalone instrument (often a clinical chemistry analyzer) and a set of assays that are relevant to that customer’s specific testing needs. In 2020, approximately 73% of our Clinical Laboratories installed base was comprised of standalone instruments. As the customer and its testing needs grow, we look to migrate the customer, where appropriate, to an integrated analyzer that performs both clinical chemistry and immunoassay testing. This migration helps us increase our customers’ testing capabilities as well as the revenue we generate from customers. Building on our differentiation in dry chemistry, we grew our integrated instrument installed base at a CAGR of approximately 12% from 2015 to 2020, and in 2020, approximately 24% of our Clinical Laboratories installed base was comprised of integrated instruments. For our larger customers, we ultimately may expand their testing throughput by installing automation tracks that connect multiple analyzers along the automation track, while providing the full suite of our ever-expanding assay menu. In 2020, approximately 1% of our Clinical Laboratories installed base was comprised of automated systems. As we have significantly expanded our test menu offering, our integrated analyzers are now more often where our Clinical Laboratories relationship starts. In Transfusion Medicine, the life cycle is similar, as customers graduate from manual testing processes to semi-automated capabilities to fully-automated blood and plasma screening instrumentation as their testing volumes and technical competencies grow over time. In 2020, our installed base of Immunohematology instruments grew approximately 4%. We focus on building long-term customer relationships and continuing to enhance both our offering and the customer’s ability to care for their patients—ultimately deepening our commercial relationship and driving our financial model.
We believe that the strong clinical performance of our assays, our instruments’ ease-of-use and reliability, our best-in-class customer service and low total cost of ownership contribute to our high revenue retention rate of approximately 98% in 2020. We have longstanding relationships with our customers, with an average Clinical Laboratories customer relationship of almost 13 years and an average Transfusion Medicine customer relationship of almost 15 years. Our customer relationships are particularly strong in the medium- to high-volume laboratories (our “Focus Markets”), which compares to the broader market that includes low- and ultra high-volume laboratories. Our Focus Markets comprise approximately 70% of the total Clinical Laboratories market, and we believe that our Focus Markets will grow at a CAGR of approximately 5% from 2020 to 2024. In addition, our dry slide technology has an environmentally friendly profile as it does not require water system plumbing, it reduces hazardous waste and it requires less space for liquid storage. All of these attributes resonate particularly well with customers who are pursuing environmental goals or customers who operate in regions with scarce water supply.
Our revenue is driven by a “razor-razor blade” business model. Through this model, we generally sell or place instruments under long-term contracts, which support the ongoing sale of our assays, reagents and consumables. Our instruments are closed systems, requiring customers to purchase the assays, reagents and consumables from us. These sales generate a high proportion of recurring revenues. As of January 3, 2021, we had an installed base of approximately 20,000 instruments, which increased approximately 4%
5
since December 29, 2019. We also generate non-core revenue, including through our contract manufacturing business and certain business collaborations, which accounted for approximately 3% of our net revenue during the fiscal year ended January 3, 2021. During the fiscal year ended January 3, 2021, we recorded net revenue of $1,766.2 million, net loss of $211.9 million and Adjusted EBITDA of $456.0 million. As of January 3, 2021, we had total indebtedness of $3,718.5 million, and for the fiscal year ended January 3, 2021, our interest expense was $198.2 million. We note that our net revenue for the fiscal year ended January 3, 2021 was approximately 2.0% lower as compared to the prior year period, primarily due to decreased shipments to customers as a result of the global COVID-19 pandemic.
Our competitive strengths
We believe we are well positioned to drive sustained and profitable growth through our relentless focus on LCV. This customer-centric approach informs the execution of our commercial and service model and underpins our go-to-market strategy. Our customer focus allows us to retain and grow our customers by providing a superior customer experience driven by unparalleled quality of service, continuous innovation and access to a diverse product portfolio. We are able to leverage our global footprint to gain differentiated and leading positions across our Focus Markets. This intense focus on our customers has resulted in an attractive business model with high recurring revenues that allows us to continue to invest to reinforce our competitive strengths, which include:
Intense customer focus enabled by our broad portfolio and market leading positions
Our broad portfolio of Clinical Laboratories and Transfusion Medicine instruments covering the full spectrum of manual to fully automated systems allows us to effectively target our Focus Markets. In addition to our instrument portfolio, we offer a diverse menu of assays for the most commonly tested items, including infectious diseases, sepsis, cardiovascular conditions and both blood and plasma typing and screening. Our ability to respond to the full spectrum of our customers’ needs allows us to focus on and enhance LCV. We supplement our instrument and assay offerings with our leading service, commercial, and operational excellence, which we believe improves our customer retention, sales growth and profitability.
We are a leader in our Focus Markets with leading positions in Clinical Laboratories and Transfusion Medicine. The market opportunities for our Clinical Laboratories and Transfusion Medicine businesses are largely connected and, in both Clinical Laboratories and Transfusion Medicine, we can adapt and grow with our customers as they move from lower throughput to more automated solutions. In addition, we have developed a strategy for new product introductions in order to enhance LCV. For example, in our Transfusion Medicine business, we introduced semi-automated capabilities to increase our participation in certain emerging markets, such as China, Asia Pacific and Latin America, and continue the shift of certain customers from manual to semi-automated testing.
In Donor Screening, we are a leading player and we recently won a 5-year contract with a 5-year extension option with Creative Testing Solutions, the largest U.S. blood donation testing organization, which provides testing for a majority of the U.S. blood supply and is jointly owned by three of the leading U.S. blood service providers: the American Red Cross, OneBlood and Vitalant. Pursuant to this contract, we are Creative Testing Solutions’ sole supplier of serology Donor Screening testing in the United States. We expect this contract will start contributing revenues in the first quarter of 2021 and provides for collaborative research and development on our next generation Donor Screening instrument. With renewed commitment to the Donor Screening market and joint innovation with this new customer, we believe this relationship has the potential to support further growth in other international Donor Screening markets over time.
Our business model and customer-centric approach results in strong customer loyalty and a compelling financial profile with greater than 90% recurring revenue during 2020. The combination of our revenue growth and leading margin profile allows us to reinvest in innovation and commercial opportunities. In addition, we believe our broad portfolio and diversified end markets provide a resilient growth profile. For instance, our strength in acute care and infectious disease testing is durable as it requires on-demand testing. Most of these tests are conducted in in-patient laboratories and demand tends to be insulated from economic downturns. In addition, we believe the on-site laboratory contributes meaningfully to many of our hospital customers’ earnings and that our core market is relatively insulated from outsourcing to reference laboratories. We believe this combination of product and end market diversification allowed us to generally outperform the market on a core revenue growth basis during the recent COVID-19 pandemic and we believe this resiliency will continue into the future.
Superior customer experience and brand loyalty resulting in high customer retention and win rates
We deliver industry-leading test performance in a way that is easy for laboratory directors and technical staff to manage their operations on a daily basis, which leads to excellent customer appeal and loyalty. In 2015, we launched ORTHOCARE with the goal of providing best-in-class service and support program for hospitals, hospital networks, blood banks and laboratories. Our ORTHOCARE service program is a critical element of the superior customer experience that we deliver to our customers. Since forming ORTHOCARE, we were the highest recommended manufacturer for the last five consecutive years (2016 through 2020) in a survey of clinical laboratory professionals in U.S. hospitals conducted by ServiceTrak. In the same survey in 2020, we were ranked #1 in seven out of eight categories relating to our manufacturing, system and service performance.
6
In our Focus Markets, the simplicity and reliability of our instruments and tests often reduces the need for staff hands-on time, producing a lower total cost of ownership for our customers. We believe that after instrument cost, the quality of service is the largest driver of customer choice when selecting a Clinical Laboratories vendor. Our superior service and customer performance contribute to our revenue retention rate of approximately 98% in 2020 and our average Clinical Laboratories and Transfusion Medicine customer relationships of almost 13 years and 15 years, respectively.
In Clinical Laboratories, beyond the simplicity of dry chemistry slides, we offer instrument e-connectivity, customizable automation tracks, a suite of upgraded quality control reagents and market-leading calibration stability, producing higher efficiency and lower total cost of ownership. In Transfusion Medicine, our ORTHO VISION platform has expanded our leadership position because it automated and simplified the test workflow for time-strained blood bank staff, increasing throughput and efficiency.
Highly compelling solutions supported by our leading and innovative research and development capabilities
We have a rich history of innovation spanning over eight decades and now have a portfolio of 17 instruments and over 240 assays across Clinical Laboratories and Transfusion Medicine. Our unique dry slide technology for clinical chemistry delivers accurate results, stability and reliability in challenging laboratory environments, an environmentally friendly profile and superior ease-of-use. Our recently launched XT Slides provide the ability to perform two tests on one slide, resulting in 40% greater VITROS throughput with 96% first-pass yield. Combined with our robust instrument design and development capabilities, we engineer laboratory testing solutions for our customers that offer industry leading cost effectiveness for medium- and high-throughput testing applications, particularly where space is constrained. We have partnered with Quotient to commercialize, when approved, the next generation product in IH that enables a high level of multiplexing and addresses the ultra-high throughput market. In the last five years, we have engineered and delivered six new instrument platforms to market and expanded our assay offering by over 75 new or improved assays, which has increased our product vitality, market share and revenue growth.
Extensive and balanced global commercial footprint with reinvigorated focus on growth
We sell our products and services in more than 130 countries worldwide and have a direct presence in 35 countries. We support these commercial operations with approximately 2,200 commercial sales, service and regional marketing teammates and a network of more than 300 distributors globally. We also have an extensive global network of manufacturing and distribution centers that allows us to be closer and more responsive to our customers while managing and optimizing our cost structure. Our global footprint allows us to effectively launch our new product innovations, including instrument platform developments and new assays, across the globe. Our geographic balance also provides revenue diversification, which helps us to hedge against currency fluctuations and potential regional economic downturns.
We believe that opportunities in emerging markets represent a strong area of growth and profitability for our business. We are using targeted commercial activities to expand in these attractive end markets. In addition, we are developing lower cost instruments and market-specific assays to compete directly with low cost local players in certain regions.
Disciplined approach to streamline operations and optimize our cost structure
We have taken a rigorous approach to continuously improve our operational and administrative resources and cost structure. We have an efficient network of manufacturing, distribution and support centers to support worldwide product availability, with assay manufacturing in the United States and Wales, partner instrument manufacturing in Switzerland and Mexico, product distribution centers in multiple locations across the globe, shared service centers in the United States and Prague and certain operations in India. This not only brings us closer to our customers, but consolidates manufacturing and several other support functions to lower-cost geographies. We have seen margin expansion over the last two years and hope to continue capitalizing on operational efficiencies going forward.
Deeply committed leadership team with broad experience in healthcare and diagnostics
Our dedicated and highly respected Global Leadership Team (“GLT”) is comprised of 16 members with significant experience in the IVD and healthcare industries. For instance, our Chairman and Chief Executive Officer, Chief Financial Officer, Chief Operating Officer, Chief Innovation Officer, General Counsel, and Executive Vice President of Strategy and Commercial Excellence each have more than 25 years of experience in their respective fields of expertise and together have more than 125 years of experience with IVD or commercial healthcare companies. These individuals are supported by their GLT colleagues with extensive industry knowledge and long-term experience leading at Ortho or other multinational companies in the IVD industry. Under their leadership we have transformed our mindset from standing up the business to executing on our growth strategies by increasing our customer focus and our emphasis on innovation and operational efficiency. We believe that the industry knowledge and dedication of our GLT members, combined with their long-term experience profitably growing multinational companies, are instrumental for the successful execution of our growth strategy going forward.
Our growth strategy
Our heritage and strength lie in our long-term customer relationships and trusted brand, which create a steady base of recurring revenue and a foundation for future growth. By focusing on LCV, we identify ways in which we can utilize product innovation and
7
impactful customer service and solutions to deepen these partnerships and add value over time. We plan to grow our business by broadening our existing relationships, winning new customers and targeting high-growth end markets and adjacencies. We are focused on sustainable long-term growth through commercial excellence that maximizes LCV, strengthens existing relationships through superior service and delivers innovative products for our customers and their patients. The key elements of our strategy to accelerate and sustain revenue growth and operating leverage include:
Focusing relentlessly on maximizing LCV, which is designed to produce and maintain a growing and recurring, high margin, durable financial profile and contributes to growth
Over our more than 80 years supporting the IVD testing needs of our customers, we have developed deep and enduring relationships with our customers. We seek to expand our relationship with both new and existing customers by offering them higher throughput integrated instrumentation, automation, and an expanding assay menu that grows with them as their needs evolve. On average globally, when one of our Clinical Laboratories customers upgrades from a standalone instrument to an integrated instrument, we typically see an increase in annual consumable revenues of approximately 65%. After this initial increase in utilization, we typically see that customer’s recurring revenues increase by approximately 3% to 7% on an annual basis. In our experience, by the time a customer is running sufficient volumes of tests to consider automation, annual reagent purchases have roughly doubled, and upgrading to an automated instrument increases this average by an additional 27%. This combined effect leads to an average increase of approximately 300% in annual revenues as a customer upgrades from an initial integrated placement to automation installation. In Transfusion Medicine, the pattern is even more striking. When a customer moves from manual testing to a semi-automated solution, the customer typically experiences an approximately 70% increase in workflow efficiency, and we see an average 600% increase in revenues. When they graduate to our fully automated ORTHO VISION instruments, these customers typically experience a 90% improvement in workflow efficiency and we see an additional increase of approximately 90% on average in recurring revenue.
LCV is both a critical measure of our customer relationships and a way to target increased value-add over time. Our focus on LCV contributes to our revenue retention rate of approximately 98% and our average Clinical Laboratories and Transfusion Medicine customer relationships of almost 13 years and 15 years, respectively. A significant number of our customers have long-term contracts with us and, combined with our greater than 90% recurring revenue profile, we believe our financial profile enables us to continue to invest and drive future growth.
Providing an unparalleled customer experience to retain and attract our existing and new customers
We continue to invest in both technology and business model innovation to expand our service advantages. For instance, improvements in instrument and assay reliability have reduced our service intervention rate by more than 30 percent since mid-2014. In addition to our core product innovations that continuously improve instrument reliability and ease-of-use—for instance, e-connectivity, improved controls, e-calibration and laboratory informatics—we are implementing exciting technology applications to support our award-winning service team. From smart mobile applications that enable service alerts and remote monitoring to merged reality on mobile devices, including smart glasses that support field engineers and customers in service calls, we continue to improve the efficiency and effectiveness of our service offerings. Over time, we will also seek to increase our ability to monetize our service differentiation beyond simply enhancing customer retention and contract wins.
Leveraging our global footprint to deliver innovative solutions to meet our customers’ needs in both developed and emerging markets
Our global commercial organization is comprised of approximately 2,200 commercial sales, service and regional marketing teammates. We recently invested in expanding and improving our commercial capabilities in our two most critical markets—North America and China—adding sales and regional marketing personnel, strengthening our distributor networks, increasing sales analytics and targeting support though our customer relationship management system. We focused our commercial teams more squarely on our Focus Markets, which increased our win rate and allowed our team to allocate resources and focus on relationship management, menu utilization and new assay adoption, helping drive our recent revenue growth in these markets. Since the execution of our U.S. commercial excellence program, we have enjoyed eight consecutive quarters of North America core recurring revenue growth and, up until the COVID-19 pandemic, we experienced similar results following implementation of our China program.
We are also focused on high growth emerging markets including China, Asia Pacific, the Middle East, Africa, Eastern Europe and Latin America. We are targeting increased investment in market-appropriate products and local capabilities in order to gain market share in these emerging markets and enhance our overall growth profile. For instance, we are planning the development of lower cost instruments and assays that are suitable for these emerging markets. In some countries, the government is playing a significant role in expanding population access to healthcare and diagnostic testing, particularly in more rural populations. The Chinese government, for instance, has dramatically increased the portion of the population with access to healthcare services and is actively pushing diagnostic volumes to tiers of smaller hospitals at the regional and provincial level, hospitals that fit well into our Focus Markets.
8
Creating meaningful product innovation through menu expansion, development of novel instruments and enhancement of automation and informatics
Since our separation from Johnson & Johnson, we have focused significant investment on improving and expanding our test menu, with the introduction of over 75 new or improved tests in the last five years, which we believe has contributed meaningfully to our accelerating growth. We continue to focus on developing significant new assays that are critical to our Focus Market customers while continuing to build our strength and differentiation in acute and critical care assays. In particular, recent launches in cardiac (hs troponin), HIV (HIV combo), sepsis (PCT) and COVID-19 are generating new growth.
We will continue to invest in the next generation of instruments for Clinical Laboratories and Transfusion Medicine. Given the longer cycle of innovation, it is important that we remain focused on the next platforms to drive customer acquisition and retention. In addition, our team is looking into novel technologies that we can leverage across Clinical Laboratories and Transfusion Medicine. We are also evaluating using our dry technology to increase multiplexing beyond dual slides and extending into dry immunoassay by leveraging patented microfluidics approaches. A completely dry integrated platform would likely reduce our instrument footprint, increase test throughput and reduce user complexity with excellent test reliability and performance.
We continue to build on advantages in ease-of-use and test workflow in the laboratory, with a primary focus on the needs of our target customer. We are co-developing improved automation track components and a new quality control menu with one of our partners. ORTHO CONNECT continues to evolve and develop across CL and TM as next generation middleware that enables the customer to track and control data and key performance metrics across their laboratories. Beyond this new platform, we plan to explore and seek to develop new digital solutions, such as laboratory informatics dashboards, to improve customer performance and workflow.
To support menu expansion and development of novel instruments, we are pursuing “Follow the Sun” research and development and manufacturing capabilities and partnerships in targeted locations across the globe that we believe will increase our local market access, tailor products for local market needs, reduce the time and cost required for product launches and accelerate our cadence of assay and instrument launches over time. As an example, we have built up research and development capabilities at our Pencoed, Wales site, which has a lower cost basis and ensures proximity to manufacturing for sustaining engineering of products.
Continuing to identify operating efficiencies to allow for reinvestment in growth and improve margins
Our leadership team has taken a disciplined, continuous improvement approach to streamlining our operational resources and cost structure. Executing on our value capture program over the last several years, our team has identified areas to improve margins and cash flows through consolidation of manufacturing to lower-cost geographies, annual Six Sigma projects in areas such as procurement, and information technology improvements. We opened a shared service center in Prague and have shifted several support functions abroad to manage costs. We continue to reinvest a significant portion of these savings in commercial and research and development projects to spur further growth. We expect to leverage our fixed cost base and the expansion of our diversified product portfolio to drive incremental margin improvement.
Pursuing business development opportunities, partnerships and strategic acquisitions to enter adjacencies or expand our current business units
We have a successful track record of partnering with a range of companies to accelerate research and development, add incremental competencies and/or co-develop products. We believe that our partnerships with Thermo Fisher, IDEXX and Quotient will help expand our capabilities in laboratory automation, veterinary and ultra-high throughput Immunohematology applications, respectively. In addition to these types of opportunities, we plan to explore adjacencies in both Clinical Laboratories and Transfusion Medicine that will leverage our global footprint, hospital and donor center call points and/or technology advantages.
Our management team is focused on mergers and acquisitions, partnerships and business development opportunities that we believe will ultimately enhance LCV and drive incremental top-line growth and profitability. We intend to pursue strategic opportunities that will accelerate our expansion or entry into attractive end-markets and geographies. We plan to maintain a disciplined approach to mergers and acquisitions and are constantly evaluating a wide range of opportunities that are natural adjacencies with the hospital and other call points in our Focus Markets.
Our industry
IVD involves testing of human tissue or fluid samples outside of the body to screen and detect diseases, infections and medical conditions. IVD testing is a core component of routine health care check-ups for those who are presenting with symptoms or require procedures. It influences up to 70% of critical healthcare clinical decision-making and can occur in a range of clinical settings from large reference laboratories and hospitals, to physician offices and retail clinics.
9
The global IVD market represents approximately $76 billion in global revenue in 2020. IVD is divided among multiple testing disciplines, including Immunoassay, Clinical Chemistry, Molecular Diagnostics, Anatomical Pathology, Microbiology, Hematology and Coagulation, among others. We compete in the two largest testing disciplines (excluding the impact of COVID-19), Immunoassay and Clinical Chemistry, which together comprise Clinical Laboratories, and represent approximately $24 billion of our current addressable market in 2020. We are also the global leader in Transfusion Medicine, which includes hospital-based Immunohematology and Donor Screening for blood and plasma at hospitals and other donation centers, and represents approximately $2 billion of our current addressable market. Today, we sell diagnostic instruments and reagents in a global market worth approximately $26 billion that is projected to grow at a CAGR of approximately 5% from 2020 to 2024.
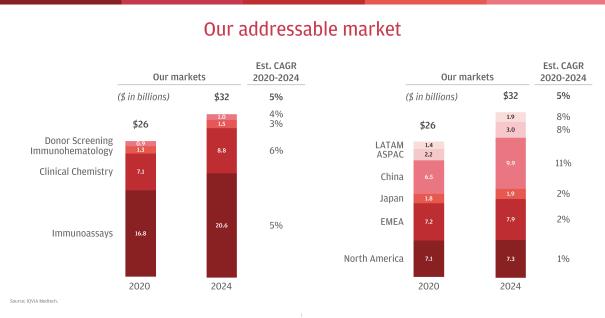
Of the approximately $26 billion market where we currently play, approximately 62% resides in the more developed regions of North America, Europe, the Middle East and Africa and Japan, which are projected to grow at a CAGR of approximately 1% to 2% from 2020 to 2024. Approximately 38% is concentrated in the faster-growing regions of China, Asia Pacific and Latin America, which are projected to grow at a CAGR of approximately 8% to 11%. With approximately 31% of our core revenue coming from emerging markets, we have a strong position in these growing markets, which we expect will represent approximately 46% of our served market by 2024. We are focusing increased investment in market-appropriate products and local capabilities in order to gain market share in emerging markets and enhance our overall growth.
We believe there are six key trends affecting our end markets that will drive increasing demand for our products and solutions and offer new opportunities for business expansion:
|
• |
Aging population and increased need for testing of chronic conditions. Populations continue to age, particularly in the developed economies, which is driving increased prevalence of both chronic conditions and the acute diseases of later life, such as cancer, cardiac disease, and neurodegenerative disorders. This demographic trend is leading to an increase in surgical volumes and supports growing demand for diagnostic testing and pre-surgical screening on both an acute and routine health screening basis, and accounts for a significant portion of ongoing test menu expansion. |
|
• |
Expansion of healthcare, particularly in emerging markets. Continuing economic growth in emerging markets is increasing the size of the middle class and available disposable income, expanding resources available for healthcare. With most health decisions informed by diagnostic testing, economic development is driving instrument purchases and higher test volumes. In some countries, the government is also playing a significant role in expanding population access to healthcare and diagnostic testing, particularly in more rural populations. The Chinese government, for instance, has dramatically increased the portion of the population with access to healthcare and is actively pushing diagnostic volumes to tiers of smaller hospitals at the regional and provincial level. |
10
|
standalone specialty instruments. To enhance productivity, these platforms are also often connected by software and automation tracks to enable more seamless routing and testing of patient samples. |
|
• |
Digital solutions and informatics. Diagnostic tests generate information that aids in clinical practice or the study of health and disease. This data, combined with the advancement of internet applications and software, offer new ways to create value for hospital and laboratory customers. Tying test data into laboratory information and electronic medical record systems is only the starting point. Digital solutions can also help laboratories manage test utilization, efficiency and inventory, aid in clinical decision support and pool test data for research purposes. |
|
• |
New diagnostic technologies and continued decentralization. Diagnostics continue to advance with new technologies changing and improving test accuracy and operational performance. New modalities have emerged with the advent of molecular and genetic diagnostics, the expansion of proteomics supporting improved and broader immunoassay testing, and technologies like miniaturization, sensors, and microfluidics enabling point-of-care testing. Diagnostic testing at emergency room and intensive care unit bedsides in the hospital, physician offices, urgent care centers, pharmacy minute clinics and at the patient’s home is increasing. These technologies are creating new opportunities within IVD and growth for the broader IVD market overall. As the COVID-19 pandemic has underscored, point-of-care tests typically have lower test accuracy than those performed on central lab instruments, are often more expensive on a per test basis and can struggle with throughput for mass screening. |
|
• |
Emergence and identification of new diseases and treatments to include plasma based therapies. The COVID-19 pandemic is the most salient example of the continuing emergence of new infectious diseases on a global scale which highlights the importance of accurate and efficient diagnostic testing. We have witnessed the emergence of HIV, Ebola, Zika, SARS and MERS, and it is estimated that one new infectious disease is emerging every year. New diagnostic tests and test volumes are driven both by the emergence of new diseases and by the discovery of new or improved markers for disease. Beyond infectious diseases, significant assay innovation is occurring in a range of therapy areas, including oncology, neurology and cardiovascular disease. |
Our products, pipeline and services
Throughout eight decades of innovation, we have been a leader in the diagnostics field and brought multiple innovations to market such as testing for RH phenotyping, HCV, Chagas’ Disease, and most recently COVID-19. In the last five years, we have engineered and delivered six new instrument platforms to market and expanded our assay offering with over 75 new or improved assays, which has increased our product vitality and revenue growth.
Clinical Laboratories
We have been a pioneer of important technological advances in clinical diagnostics, including our unique dry slide technology which offers customers superior test performance with clear ease-of-use advantages and lower total cost of ownership. Dry slide technology combines the spreading, masking, scavenger and reagent layers into one postage-stamp-sized slide that provides clinicians with high-quality results quickly, efficiently and economically. Our slides are very stable. The current approximate 6-month span between calibrations for slides is industry-leading and we expect this to be significantly improved through ongoing research and development. We carry a comprehensive clinical chemistry test menu, and dry slides have long shelf life with lower laboratory shelf space required. Our new XT7600 and XT3400 instruments extend these advantages with digital accuracy and XT multi-test slides, and we have a pipeline opportunity to increase plex further over time. Our dry slide chemistry is well positioned for rising environmental concerns given its eco-friendly profile with no water usage and significantly reduced clinical waste and biohazard.
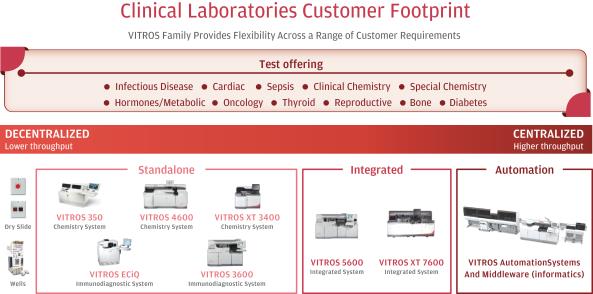
Our flagship Clinical Laboratories platform is the VITROS family of instruments, which includes a series of clinical chemistry, immunoassay and integrated (combined chemistry and immunoassay) systems and automation and middleware solutions. The VITROS instruments run a wide range of assays, from infectious diseases, sepsis, cardiovascular conditions and anemia, to bone disease, diabetes, drugs of abuse / toxicology, oncology and renal disease. We have six VITROS instrument analyzers that provide standardized performance, and are still sufficiently flexible to meet the needs of our customers across the spectrum of laboratory sizes and volumes. Our VITROS instruments are placed in centralized, higher-throughput testing sites (hospitals and laboratories) and decentralized, lower-throughput sites (physician offices, clinics and specialty settings).
11
We launched the next generation of VITROS instruments—the XT 7600 integrated system and XT 3400 clinical chemistry analyzer—in 2018 and 2019, respectively. Both instruments deploy a new, highly accurate, digital reflectometer that measures test results and takes advantage of new XT chemistry slides, combining two tests that are frequently used together, and improving the economics for us and our customers. Additionally, we believe that digital sensing will enable improved test accuracy through better image processing over time. We believe the XT instruments offer several important advancements over prior generations:
|
• |
40% greater test throughput when using our XT-slides |
|
• |
96% first-pass yield on test results |
|
• |
Designed to offer high reliability with a 98% up-time guarantee for U.S. customers |
Our Clinical Laboratories assay menu is quite broad, covering 24 different therapeutic areas and approximately 90% of a typical laboratory’s testing needs. We are particularly known for the strength of our dry clinical chemistry tests, as well as infectious disease and acute care immunoassays, including our high-performing cardiac markers for heart attack and congestive heart failure. In Greater China, for example, we believe we are the clinical chemistry market leader in separate “STAT” testing laboratories that seek rapid, high-performing assays to drive rapid clinical decisions.
Key products—Clinical Laboratories
|
|
|
|
|
Category |
Description |
Examples |
|
|
|
|
|
Standalone CC instrument(s) |
High efficiency scalable analyzers that run our broad menu of general and special chemistry tests, including our differentiated dry chemistry Microslides, with no external water supply required |
•VITROS 350 Chemistry System •VITROS XT3400 Chemistry System •VITROS 4600 Chemistry System |
|
|
|
|
|
Standalone IA instrument(s) |
Random access, scalable throughput analyzers that run our broad immunoassay menu with no external water supply required |
•VITROS ECiQ Immunodiagnostic System •VITROS 3600 Immunodiagnostic System |
|
|
|
|
|
Integrated instruments (CC+IA) |
Random access, high throughput analyzers that run our expansive chemistry and immunoassay test menu within the same unit with no external water supply required |
•VITROS 5600 Integrated System •VITROS XT7600 Integrated System |
|
|
|
|
|
Dry chemistry slides & XT multi-slides |
Differentiated “dry” Microslide technology avoids the potential variability caused by water impurities and the frequent calibration common in wet chemistry products. XT slides deliver higher efficiency with two tests per slide |
•VITROS XT MicroSlide Clinical Chemistry Technology |
|
|
|
|
12
|
|
|
|
|
Category |
Description |
Examples |
|
Critical care assays that help deliver accurate, reliable results in acute care situations |
•VITROS Immunodiagnostic Products High-sensitivity Troponin •VITROS Immunodiagnostic Products NT-proBNP II •VITROS Immunodiagnostic Products B•R•A•H•M•S PCT (Procalcitonin) |
|
|
|
|
|
|
Infectious Diseases—Assays for patient management and blood donor screening |
High performing assays to identify presence of antigen and antibodies across a wide spectrum of infectious diseases |
•VITROS HIV Combo Immunodiagnostic Assay •VITROS Anti-HCV Immunodiagnostic Assay •VITROS Anti-SARS IgG Immunodiagnostic Assay (1) •VITROS Anti-SARS-CoV2 Total Immunodiagnostic Assay (2) •VITROS SARS Antigen Immunodiagnostic Assay (3) |
|
|
|
|
|
Other Key Assays |
Microtip assays offer a wide range of special chemistry testing using wet reagents but with no external water supply needed. |
•VITROS HbA1c MicroTip Assay |
|
|
||
|
(1) |
Marketed pursuant to FDA Emergency Use Authorization originally granted on April 24, 2020. Ortho’s VITROS Anti-SARS-CoV-2 IgG antibody test has an estimated 100% specificity (95% confidence interval = 99.1-100%). Under the FDA’s Emergency Use Authorization for the use of COVID-19 convalescent plasma, before a plasma donation can be released to hospitals and patients, the donation must be tested in order to confirm the level or amounts of antibodies in such donation. Ortho’s VITROS Anti-SARS-CoV-2 IgG antibody test is currently specified by the FDA as acceptable for use in this manufacturing step to determine whether a donation qualifies as a high or low titer unit of COVID-19 convalescent plasma. |
|
(2) |
Marketed pursuant to FDA Emergency Use Authorization originally granted on April 14, 2020. |
|
(3) |
Marketed throughout the European Union under CE Mark authority, designed to detect active SARS-CoV-2 (COVID-19) infection in symptomatic and asymptomatic individuals. Marketed in the United States pursuant to FDA Emergency Use Authorization originally granted on January 11, 2021 (product claims and indications for use vary between the European Union and U.S. markets). |
Transfusion Medicine
Immunohematology
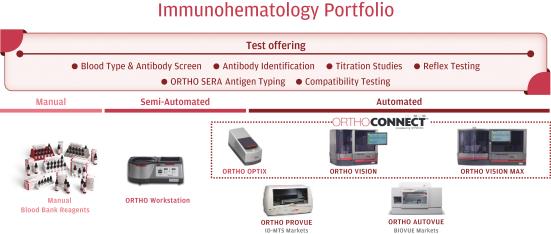
In Immunohematology, we are the global market leader based on the strength of our instruments and assays. Our flagship IH analyzers are the ORTHO VISION and ORTHO VISION Max systems that automate blood typing and serology disease screening for blood banks. ORTHO VISION was originally launched in 2015, followed by the ORTHO VISION Max and soon, the new ORTHO VISION Swift, which is designed to be faster, quieter and even more cyber-secure than previous generations of our products. ORTHO VISION has been extremely successful in driving workflow simplification and automation for the customer. In addition, we sell the semi-automated Ortho Workstation for blood bank customers that have lower volumes or need for test automation.
13
In the near-term, pending FDA clearance, we plan to launch the new ORTHO OPTIX reader targeted at blood banks who desire greater precision reading their manual test results. OPTIX is designed to provide improved software and integration with laboratory information systems, improved workflow and 99.9% concordance with ORTHO VISION test results. OPTIX will provide an entry point for customers that want to move from manual to semi-automated testing.
We also have a partnership with Quotient for the Immunohematology application of the MosaiQTM analyzer, which is designed to employ a cutting-edge microarray technology to allow advanced multiplexing. MosaiQ multiplexing is expected to enable multiple tests to be run simultaneously on a single, low-volume patient sample and drive significantly higher test throughput, which would strengthen our position in the ultra-high throughput segment of the IH market. It also offers the potential for streamlined inventory management and concordant results across donor screening and pre-transfusion testing and matching.
Our Immunohematology instruments operate with two different modalities of test consumables. In the United States, our automated systems use patented ID-Micro Typing System (“IS-MTS”) gel cards and outside the United States, we sell BIOVUE cassettes that utilize column agglutination technology (“CAT”). Both approaches are designed to provide reliable test results and simplify test workflow. With the 2016 launch of ORTHO SERA reagents, we offer a comprehensive test Immunohematology menu that we believe covers more than 99% of most tested blood antigens and all the diseases regularly required for transfusion screening globally.
Donor Screening
Our Donor Screening business is focused on instruments and tests used for blood and plasma screening for infectious diseases for customers, which include some of the largest donor testing institutions, primarily in the United States. In Donor Screening, our core instrument offering is the ORTHO VERSEIA Integrated Processor (“VIP”)—an automated pipetting and processing system that brings together the ORTHO VERSEIA pipettor and ORTHO Summit Processor to enable end-to-end pipetting and processing. We are currently upgrading the VIP system in collaboration with a key U.S. customer and expect to launch the next generation in 2021. For Donor Screening, our serology test menu covers the full range of blood types and a comprehensive set of infectious disease screens, including important tests for tropical diseases like Chagas’ that are critical for care in emerging markets.
Key products—Transfusion Medicine
|
|
|
|
|
|
|
|
|
Category |
Description |
Examples |
|
|
|
|
|
Immunohematology Manual and Semi-automated |
The only 2-in-1 blood testing system using reliable Column Agglutination Technology (CAT). The Reader delivers objective grading, results interpretation concordant with the ORTHO VISION Analyzer |
•Manual Blood Bank Reagents •ORTHO Workstation •ORTHO OPTIX™ Reader |
|
|
|
|
|
Immunohematology Automated |
A suite of automated instrument solutions connected with an optional middleware software that bridges the gap between instruments and hospital IT networks |
•ORTHO VISION Analyzer •ORTHO VISION Max Analyzer •ORTHO CONNECT Middleware •ORTHO PROVUE •ORTHO AUTOVUE |
|
|
|
|
|
Immunohematology BIOVUE |
Safe, cost-effective test format that can be used manually or with the fully automated analyzers, the ORTHO BIOVUE cassette is easy to use and ideal for both routine and specialized immunohematology testing. |
•BIOVUE Cassettes |
|
|
|
|
|
Immunohematology ID-MTS Gel Cards |
Safe, cost-effective test format that can be used manually or with the fully automated analyzers. The ID-MTS Gel card is easy to use and ideal for both routine and specialized immunohematology testing. |
•ID-MTS Gel Cards |
|
|
|
|
|
Immunohematology Key Screening & Typing Assays |
BIOVUE and ID-MTS product lines offer comprehensive testing solutions including: Type and screen, Donor confirmation, Antibody screening and identification, Rh phenotype, Rare antigen testing, DAT |
•Anti-Fya, Anti-Fyb, Anti-Jka, Anti-Jkb, Anti-S, Anti-s, Anti-K, Anti-D (IAT), Anti-D (DVI), Anti-P1, Anti-Lea, Anti-Leb and Anti-N |
|
|
|
|
|
U.S. Donor Screening |
Ultra-high throughput Donor Testing platform capable of 264 tests per hour. Designed to run a comprehensive panel of highly sensitive and specific assays for use in Donor Testing |
•ORTHO VERSEIA Integrated Processor •ORTHO HBc ELISA •ORTHO T. cruzi ELISA •ORTHO HCV 3.0 ELISA |
|
|
||
14
Our services
In addition to the products we provide, ORTHOCARE Services are a critical element of how we deliver value to our customers. As of December 2020, we had approximately 900 service teammates globally. We employ highly trained service professionals including over 340 laboratory specialists with advanced qualifications. For example, more than 95% of our U.S. laboratory specialists have medical technician degrees.
Our highly valued suite of ORTHOCARE service offerings includes:
|
• |
Guarantee 98% up-time to our U.S. customers—High instrument reliability and a proactive maintenance program. |
|
• |
E-CONNECTIVITY Remote Monitoring Software—More than 80% of our installed base of VITROS 5600, XT 7600 and ORTHO VISION platforms are e-connected, enabling remote monitoring and improved analyzer availability. |
|
• |
Laboratory Informatics—Solutions designed to deliver incremental value to the laboratory, including inventory planning, laboratory productivity metrics and technical documentation. |
|
• |
ValuMetrix—A highly valued consulting service proven to increase laboratory workflow, productivity and laboratory service levels utilizing Lean principles and process excellence. This service offering provides actionable insights into demand for new products, services and workflow. |
|
• |
Global Technical Solution Center—Seven technical solution centers delivering first line support in over 15 languages, meaning we can resolve service issues remotely without an on-site visit approximately two-thirds of the time. |
|
• |
Smart Service Mobile App—First in class technology enabled on iPhone and Android devices that allows our service teams to receive up-to-date analyzer health checks, proactive alerts and performance monitoring to ensure the highest level of reliability is achieved. |
|
• |
Training and Education—Flexible educational resources for the lifetime of the customer relationship, including virtual technical training, continuing education and professional development. |
|
• |
Smart Start—Concierge implementation program led by certified project managers. Easier implementation using collaborative software to keep up to date with real- time progress reports, customized dashboards and status updates. |
|
• |
Merged Reality—Enables product experts to provide remote ‘side by side’ assistance to field service engineers and customers through mobile devices, including smart glasses. This allows both parties to see the same thing at the same time and provide guided instruction leading to better and faster fix rates. |
We are globally recognized for service excellence and continue to invest in people and technology to increase value for our customers.
Sales, marketing and distribution
We use state-of-the-art manufacturing and distribution capabilities to produce and deliver diagnostic instruments and assays for hospitals, laboratories and blood and plasma centers worldwide. Our primary distribution center locations are centrally located in the United States and Europe and have extended hours and efficient transportation processes.
Our sales team is comprised of highly skilled and experienced professionals. In the United States, we use a generalized sales force for Immunohematology and Clinical Laboratories and a separate specialist sales force for Donor Screening. Across this global footprint, we operate a region-specific sales model. Our developed markets, specifically in North America and Western Europe, are served primarily through direct sales; however, we generally utilize third-party distributors in emerging markets, such as China, the Middle East, Africa and Eastern Europe as this model is more commercially effective.
Our global team strives to deliver a differentiated level of customer service and support by surrounding our customers with devoted and experienced professionals. Our network of field engineers is responsible for installing our instruments and providing customer support. In addition, our call center team and laboratory specialists are available to provide customer training and ongoing customer support.
Research and development
Our research and development focus is on designing and developing products while balancing our research and development team’s capacity, development timelines and overall cost. We have been a pioneer of important technological advances in diagnostics, including our unique dry slide technology and our automated and semi-automated blood banking systems. Our research and development team is comprised of a balanced mix of experienced professionals with years of experience in the diagnostics industry and recently
15
trained technologists, and together have the know-how and technical capabilities in information technology, biomedical science and engineering required to continue to innovate. Key strengths include new assay format development, new instrument systems development and the complex integration of the two. In addition, in order to create new opportunities, manage costs and adapt to a rapidly changing industry, we also enter into strategic partnerships as part of our research and development process. Our primary research and development facility is located in Rochester, New York, with certain functions conducted out of Raritan, New Jersey and Pencoed, Wales.
Suppliers and raw materials
We obtain raw materials from reputable outside suppliers and believe our business relationships with them are good. Some of our products are derived from source biologic materials, which are available from a limited number of sources. To date, we have been able to obtain sufficient quantities of required materials for use in manufacturing our products, but there can be no assurance that a sufficient supply of required materials will always be available to us. We employ a number of strategies to mitigate raw material supply risk, including managing safety stock inventories as well as developing second sources for key raw materials.
We source certain instruments from industry specific suppliers. We believe that our business relationships with our instrument suppliers are good. Each instrument supplier is placed under a contract that provides terms and conditions designed to preserve business continuity. In the event either party terminates the agreement, the “out clauses” provide sufficient time to effect a transition to a new supplier and maintain supply continuity. This transition would also be characterized by the build of a strategic inventory to bridge any time period required to initiate supply from an alternate provider.
Manufacturing
Our manufacturing operation benefits from our broad global footprint, scale and workforce capabilities. We believe our plant capacity and available space is sufficient to accommodate growth, maintain quality and ensure continuity. We use state-of-the-art manufacturing capabilities to produce the instruments and assays that we sell. Our manufacturing function has extensive process excellence and high operating standards, which provide us with the capabilities to offset inflation and control costs. Our primary manufacturing facilities are located in Raritan, New Jersey, Rochester, New York and Pencoed, Wales. Each is regulated by the FDA or other international public health and regulatory agencies.
Competition
Clinical Laboratories
The Clinical Laboratories market is fragmented and highly competitive. A majority of the key players compete globally and face competition from regional and local companies focused on particular markets and/or technologies.
Transfusion Medicine
The Transfusion Medicine market is comprised of Donor Screening, where blood and plasma is screened at donation for blood type and target diseases, and Immunohematology, where blood is typed and screened at the hospital blood bank before being transfused into the patient. The Transfusion Medicine market is highly competitive, with a variety of competitors globally .
We also compete in the serology portion of Donor Screening, which features many significant competitors globally.
Intellectual property
In the course of our business, we have developed and will continue to develop proprietary products, technologies, software systems, processes and other intellectual property (“IP”). We protect our IP through filing of patents, trademarks and domain names, as may be deemed applicable and appropriate, with appropriate regional coverage. For example, we have applied for and/or obtained and maintain registrations in the United States and other countries numerous trademarks, including ORTHO CLINICAL DIAGNOSTICS, ORTHO, VITROS and ORTHO VISION. We also seek to protect our proprietary and confidential information and trade secrets through confidentiality agreements with employees, customers, vendors and other third parties, as well as administrative and technical safeguards.
We also enter into agreements with third parties for the license and use of their intellectual property, although no one such license is material to the business as a whole.
IP is an essential part of our business, and IP assets are, as a whole, material to the performance of our business. No single IP asset, however, whether owned or licensed, is material to our business as a whole.
As of December 2020, we owned approximately 675 patents and 1,120 trademarks and we had an additional approximately 60 trademark applications and more than 100 patent applications pending. The majority of our patents and patent applications are in our Clinical Laboratories line of business.
16
As of December 2020, we were not subject to any material claim or legal action alleging infringement of third-party owned IP.
Collaboration arrangements
We have various collaboration arrangements, which provide us with the rights to develop, produce and market products using certain know-how, technology and patent rights maintained by our collaborative partners. These arrangements are often entered into in order to share risks and rewards related to a specific program or product. Our collaborative arrangements include a number of ongoing relationships for test development, instrument development and automation track design and distribution.
Our Joint Business is a collaboration with Grifols relating to our Hepatitis and HIV diagnostics business. The arrangement is governed by an agreement originally entered into in 1989 with a 50-year term, which, among other things, provides for a profit sharing arrangement whereby, the profits we generate from our production and sale of Hepatitis and HIV diagnostics products are shared with Grifols, and the profits generated by Grifols from its sale of certain antigens and licensing of certain intellectual property rights are shared with us. The agreement also gives us the right to use such intellectual property. The majority of the patents underlying these intellectual property rights have expired. Grifols also supplies us with a portion of the antigens used in our production of these diagnostics products.
Human capital resources
As of December 2020, we had approximately 4,500 employees. Approximately 51% of our employees are located outside of the United States, primarily in Europe and Asia. We employ approximately 950 manufacturing employees, approximately 2,200 in commercial sales, service and regional marketing positions worldwide including approximately 900 service teammates. Our highly trained service professionals include over 340 laboratory specialists with advanced qualifications. For example, more than 95% of our U.S. laboratory specialists have medical technician degrees, and customer excellence training has been prepared for all teammates. We support unions and/or works councils in Austria, Brazil, France, Germany, Italy, Spain, Sweden and the United Kingdom, with approximately 20% of our associates globally participating in a union, collective bargaining agreement or works council. We believe that our relations with our employees are generally good.
Our human capital resources objectives include, as applicable, identifying, recruiting, retaining, incentivizing and integrating our employees. We believe our success depends on our ability to attract, retain, develop and motivate diverse highly skilled personnel. In particular, we depend upon the personal efforts and abilities of the principal members of our senior management to partner effectively as a team, and who provide strategic direction, develop our business, manage our operations and maintain a cohesive and stable work environment. We also rely on qualified managers and skilled employees, such as scientists, engineers and laboratory technicians, with technical expertise in operations, scientific knowledge, engineering and quality management experience in order to operate our business successfully.
Our compensation program is designed to retain, motivate and, as needed, attract highly qualified executives. Accordingly, we use a mix of competitive base salary, cash-based annual incentive compensation, performance-based equity compensation awards and other employee benefits.
We are committed to employee health and safety in the workplace and we have an excellent safety record. In the United States, our manufacturing facilities hold various certifications depending on the site .Our Raritan, NJ and Rochester, NY sites have both received the Gold award for American Heart Association Workplace Solutions for the third year in a row. The Raritan and Rochester sites are also certified as part of the OSHA Voluntary Protection Programs. Our facility in Pencoed, Wales has received recognition by the Welsh Government for facility safety and environmental performance. Additionally, several of our locations across the globe have received accolades for being a great place to work.
Health, safety and environmental
Our operations and facilities are subject to various laws and regulations domestically and around the world governing the protection of the environment and health and safety, including the discharge and emissions of pollutants to air and water and the handling, management and disposal of hazardous substances. We have an excellent safety record. In the United States, our manufacturing facilities hold various certifications depending on the site and our facility in Pencoed, Wales has received recognition by the Welsh Government for facility safety and environmental performance.
We believe that all of our manufacturing and distribution facilities are operated in compliance with existing environmental requirements in all material respects, including the operating permits required thereunder. Although we do not currently expect the costs of compliance with existing environmental requirements to have a material impact on our financial position, we may incur additional costs or obligations to comply with environmental and health and safety requirements as a result of changes in law or customer demands, including those relating to our products. In addition, many of our manufacturing sites have a long history of industrial operations, and remediation is or may be required at a number of these locations. Although we do not currently expect outstanding remediation obligations to have a material impact on our financial position, the ultimate cost of remediation is subject to a number of variables and
17
is difficult to accurately predict. See “Risk factors—Risks related to our business—We could incur costs complying with environmental and health and safety requirements, or as a result of liability for contamination or other potential environmental harm or liability caused by our operations.”
Government regulation
Our products and operations are subject to extensive regulation by the FDA and other federal and state authorities in the United States, as well as comparable authorities in foreign jurisdictions. In the United States, our products are regulated as either medical devices under the Federal Food, Drug, and Cosmetic Act (“FDCA”) and its implementing regulations, or as biological products under the FDCA and the Public Health Service Act (“PHSA”) and their implementing regulations, each as amended and enforced by the FDA. The FDA regulates the development, design, non-clinical and clinical research, manufacturing, safety, efficacy, labeling, packaging, storage, installation, servicing, recordkeeping, premarket clearance or approval, adverse event reporting, advertising, promotion, marketing and distribution, and import and export of medical devices and biological products to ensure that such products distributed domestically are safe and effective for their intended uses and otherwise meet the applicable requirements of the FDCA and PHSA.
U.S. regulation of medical devices
The majority of our diagnostic products and analyzers are regulated by the FDA as medical devices in the United States. Unless an exemption applies, each medical device commercially distributed in the United States requires either FDA clearance of a 510(k) premarket notification, or approval of a premarket approval (“PMA”) application. Under the FDCA, medical devices are classified into one of three classes—Class I, Class II or Class III—depending on the degree of risk associated with each medical device and the extent of manufacturer and regulatory control needed to ensure its safety and effectiveness. Class I devices are those with the lowest risk to the patient and are those for which safety and effectiveness can be assured by adherence to the FDA’s General Controls for medical devices, which include compliance with the applicable portions of current good manufacturing practices (“cGMPs”) for medical devices known as the Quality System Regulation (“QSR”) facility registration and product listing, reporting of adverse medical events, and truthful and non-misleading labeling, advertising, and promotional materials. Class II devices are subject to the FDA’s General Controls, and special controls as deemed necessary by the FDA to ensure the safety and effectiveness of the device. These special controls can include performance standards, post-market surveillance, patient registries and FDA guidance documents. Devices deemed by the FDA to pose the greatest risks, such as life sustaining, life supporting or some implantable devices, or devices that have a new intended use, or use advanced technology that is not substantially equivalent to that of a legally marketed device, are placed in Class III.
While most Class I devices are exempt from the 510(k) premarket notification requirement, manufacturers of most Class II devices are required to submit to the FDA a premarket notification under Section 510(k) of the FDCA requesting permission to commercially distribute the device. The FDA’s permission to commercially distribute a device subject to a 510(k) premarket notification is generally known as 510(k) clearance. Class III devices require approval of a PMA application evidencing safety and effectiveness of the device. We currently market the majority of our diagnostic products in the United States pursuant to 510(k) clearances and PMA approvals.
To obtain 510(k) clearance, a manufacturer must submit a premarket notification demonstrating to the FDA’s satisfaction that the proposed device is “substantially equivalent” to another legally marketed device that itself does not require PMA approval (a predicate device). A predicate device is a legally marketed device that is not subject to premarket approval, i.e., a device that was legally marketed prior to May 28, 1976 (pre-amendments device) and for which a PMA is not required, a device that has been reclassified from Class III to Class II or I, or a device that was found substantially equivalent through the 510(k) process. The FDA’s 510(k) clearance process usually takes from three to twelve months, but often takes longer. FDA may require additional information, including clinical data, to make a determination regarding substantial equivalence. In addition, the FDA collects user fees for certain medical device submissions and annual fees for medical device establishments.
If the FDA agrees that the device is substantially equivalent to a lawfully marketed predicate device, it will grant 510(k) clearance to authorize the device for commercialization. If the FDA determines that the device is “not substantially equivalent,” the device is automatically designated as a Class III device. The device sponsor must then fulfill more rigorous PMA requirements, or can request a risk-based classification determination for the device in accordance with the de novo classification process, which is a route to market for novel medical devices that are low to moderate risk and are not substantially equivalent to a predicate device.
After a device receives 510(k) clearance, any modification that could significantly affect its safety or effectiveness, or that would constitute a major change or modification in its intended use, will require a new 510(k) clearance or, depending on the modification, PMA approval or de novo classification. The FDA requires each manufacturer to determine whether the proposed change requires submission of a 510(k), de novo classification request or a PMA in the first instance, but the FDA can review any such decision and disagree with a manufacturer’s determination. If the FDA disagrees with a manufacturer’s determination not to seek a new 510(k) or other form of marketing authorization for the modification to the 510(k)-cleared product, the FDA can require the manufacturer to cease marketing and/or request the recall of the modified device until 510(k) clearance or PMA approval is obtained or a de novo classification is granted.
18
The PMA process is more demanding than the 510(k) premarket notification process. In a PMA, the manufacturer must demonstrate that the device is safe and effective, and the PMA must be supported by extensive data, including data from preclinical studies and human clinical trials. All clinical investigations of devices to determine safety and effectiveness must be conducted in accordance with the FDA’s investigational device exemption (“IDE”) regulations which govern investigational device labeling, prohibit promotion of the investigational device, and specify an array of recordkeeping, reporting and monitoring responsibilities of study sponsors and study investigators. If the device presents a “significant risk,” to human health, as defined by the FDA, the FDA requires the device sponsor to submit an IDE application to the FDA, which must become effective prior to commencing human clinical trials. A significant risk device is one that presents a potential for serious risk to the health, safety or welfare of a patient and either is implanted, used in supporting or sustaining human life, substantially important in diagnosing, curing, mitigating or treating disease or otherwise preventing impairment of human health, or otherwise presents a potential for serious risk to a subject. In addition, the study must be approved by, and conducted under the oversight of, an Institutional Review Board (“IRB”) for each clinical site. The IRB is responsible for the initial and continuing review of the IDE, and may pose additional requirements for the conduct of the study. If the device presents a non-significant risk to the patient, a sponsor may begin the clinical trial after obtaining approval for the trial by one or more IRBs without separate approval from the FDA, but must still follow abbreviated IDE requirements, such as monitoring the investigation, ensuring that the investigators obtain informed consent, and labeling and record-keeping requirements.
In addition to clinical and preclinical data, the PMA must contain a full description of the device and its components, a full description of the methods, facilities, and controls used for manufacturing, and proposed labeling. Following receipt of a PMA, the FDA determines whether the application is sufficiently complete to permit a substantive review. If FDA accepts the application for review, it has 180 days under the FDCA to complete its review of a PMA, although in practice, the FDA’s review often takes significantly longer, and can take up to several years. An advisory panel of experts from outside the FDA may be convened to review and evaluate the application and provide recommendations to the FDA as to the approvability of the device. The FDA may or may not accept the panel’s recommendation. In addition, the FDA will generally conduct a pre-approval inspection of the applicant or its third-party manufacturers’ or suppliers’ facilities to ensure compliance with the QSR.
The FDA will approve the new device for commercial distribution if it determines that the data and information in the PMA constitute valid scientific evidence and that there is reasonable assurance that the device is safe and effective for its intended use(s). The FDA may approve a PMA with post-approval conditions intended to ensure the safety and effectiveness of the device, including, among other things, restrictions on labeling, promotion, sale and distribution, and collection of long-term follow-up data from patients in the clinical study that supported PMA approval or requirements to conduct additional clinical studies post-approval. The FDA may condition PMA approval on some form of post-market surveillance when deemed necessary to protect the public health or to provide additional safety and efficacy data for the device in a larger population or for a longer period of use. In such cases, the manufacturer might be required to follow certain patient groups for a number of years and to make periodic reports to the FDA on the clinical status of those patients. Failure to comply with the conditions of approval can result in material adverse enforcement action, including withdrawal of the approval. Certain changes to an approved device, such as changes in manufacturing facilities, methods, or quality control procedures, or changes in the design performance specifications, which affect the safety or effectiveness of the device, require submission of a PMA supplement, or in some cases a new PMA.
In addition to the 510(k) clearance, PMA, and de novo classification pathways to market, the Commissioner of the FDA, under delegated authority from the Secretary of Health and Human Services (“HHS”) may, under certain circumstances in connection with a declared public health emergency, allow for the marketing of a product that does not otherwise comply with FDA regulations by issuing an EUA for such product. Before an EUA may be issued by HHS, the Secretary must declare an emergency based a determination that public health emergency exists that effects or has the significant potential to affect, national security, and that involves a specified biological, chemical, radiological, or nuclear agent or agents, or a specified disease or condition that may be attributable to such agent or agents. On February 4, 2020, the HHS Secretary determined that the novel coronavirus presented a public health emergency that has a significant potential to affect national security or the health and security of U.S. citizens living abroad and declared that circumstances existed justifying the authorization of emergency use of in vitro diagnostics for detection and/or diagnosis of the novel coronavirus that causes COVID-19.
In order to be the subject of an EUA, the FDA Commissioner must conclude that, based on the totality of scientific evidence available, it is reasonable to believe that the product may be effective in diagnosing, treating, or preventing a disease attributable to the agents described above, that the product’s potential benefits outweigh its potential risks and that there is no adequate, approved alternative to the product. Products subject to an EUA must still comply with the conditions of the EUA, including labeling and marketing requirements. Moreover, the authorization to market products under an EUA is limited to the period of time the public health emergency declaration is in effect. We currently market our Anti-SARS-CoV-2 IgG Antibody test and calibrators and controls and Anti-SARS-CoV-2 Total Antibody test and calibrators and controls pursuant to EUAs granted by the FDA in April 2020, and we market our Anti-SARS-CoV-2 Antigen test pursuant to an EUA originally granted by the FDA on January 11, 2021.
19
After a device is cleared or approved or otherwise authorized for marketing, numerous pervasive regulatory requirements continue to apply unless explicitly exempt. These include:
|
• |
establishment registration and device listing with the FDA; |
|
• |
QSR requirements, which require manufacturers, including third-party manufacturers, to follow stringent design, testing, control, documentation and other quality assurance procedures during all aspects of the design and manufacturing process; |
|
• |
labeling and marketing regulations, which require that promotion is truthful, not misleading, fairly balanced and provide adequate directions for use and that all claims are substantiated, and also prohibit the promotion of products for unapproved or “off-label” uses and impose other restrictions on labeling; FDA guidance on off-label dissemination of information and responding to unsolicited requests for information; |
|
• |
clearance or approval of product modifications to 510(k)-cleared devices that could significantly affect safety or effectiveness or that would constitute a major change in intended use of one of our cleared devices; |
|
• |
medical device reporting regulations, which require that a manufacturer report to the FDA if a device it markets may have caused or contributed to a death or serious injury, or has malfunctioned and the device or a similar device that it markets would be likely to cause or contribute to a death or serious injury, if the malfunction were to recur; |
|
• |
correction, removal and recall reporting regulations, which require that manufacturers report to the FDA field corrections and product recalls or removals if undertaken to reduce a risk to health posed by the device or to remedy a violation of the FDCA that may present a risk to health; |
|
• |
complying with requirements governing Unique Device Identifiers (“UDI”) on devices and also requiring the submission of certain information about each device to the FDA’s Global Unique Device Identification Database; |
|
• |
the FDA’s recall authority, whereby the agency can order device manufacturers to recall from the market a product that is in violation of governing laws and regulations; and |
|
• |
post-market surveillance activities and regulations, which apply when deemed by the FDA to be necessary to protect the public health or to provide additional safety and effectiveness data for the device. |
U.S. regulation of biological products
Certain of our blood screening products are regulated in by the FDA as biological products, also called biologics. In the United States, biologics are subject to regulation under the FDCA, PHSA, and other federal, state, local and foreign statutes and regulations. The process required by the FDA before biologics may be marketed in the United States generally involves the following:
|
• |
completion of preclinical laboratory tests and animal studies performed in accordance with the FDA’s Good Laboratory Practice requirements; |
|
• |
submission to the FDA of an Investigational New Drug application (“IND”) which must become effective before clinical trials may begin; |
|
• |
approval by an institutional review board (“IRB”) or ethics committee at each clinical site before the trial is commenced; |
|
• |
performance of adequate and well-controlled human clinical trials to establish the safety, purity and potency of the proposed biologic product candidate for its intended purpose; |
|
• |
preparation of and submission to the FDA of a biologics license application (“BLA”) after completion of all pivotal clinical trials; |
|
• |
satisfactory completion of an FDA Advisory Committee review, if applicable; |
|
• |
a determination by the FDA within 60 days of its receipt of a BLA to file the application for review; |
|
• |
satisfactory completion of an FDA pre-approval inspection of the manufacturing facility or facilities at which the proposed product is produced to assess compliance with cGMPs and to assure that the facilities, methods and controls are adequate to preserve the biological product’s continued safety, purity and potency, and of selected clinical investigation sites to assess compliance with Good Clinical Practices (“GCPs”); and |
|
• |
FDA review and approval of the BLA to permit commercial marketing of the product for particular indications for use in the United States. |
20
Prior to beginning the first clinical trial of a biologic product candidate in the United States, we must submit an IND to the FDA. An IND is a request for authorization from the FDA to administer an investigational new drug product to humans. An IND must become effective before human clinical trials may begin.
Assuming successful completion of all required testing in accordance with all applicable regulatory requirements, the results of product development, nonclinical studies and clinical trials are submitted to the FDA as part of a BLA requesting approval to market the product for one or more indications. The BLA must include all relevant data available from preclinical and clinical studies, including negative or ambiguous results as well as positive findings, together with detailed information relating to the product’s chemistry, manufacturing, controls, and proposed labeling, among other things. Data can come from company-sponsored clinical studies intended to test the safety and effectiveness of a use of the product, or from a number of alternative sources, including studies initiated by independent investigators. The submission of a BLA requires payment of a substantial application user fee to the FDA, unless a waiver or exemption applies.
After the FDA evaluates a BLA and conducts inspections of manufacturing facilities where the investigational product and/or its drug substance will be produced and of select clinical trial sites, the FDA may issue an approval letter or a Complete Response Letter (“CRL”). An approval letter authorizes commercial marketing of the product with specific prescribing information for specific indications. A CRL will describe all of the deficiencies that the FDA has identified in the BLA, except that where the FDA determines that the data supporting the application are inadequate to support approval, the FDA may issue the CRL without first conducting required inspections, testing submitted product lots, and/or reviewing proposed labeling. In issuing the CRL, the FDA may recommend actions that the applicant might take to place the BLA in condition for approval, including requests for additional information or clarification. The FDA may delay or refuse approval of a BLA if applicable regulatory criteria are not satisfied, require additional testing or information and/or require post-marketing testing and surveillance to monitor safety or efficacy of a product.
If regulatory approval of a product is granted, such approval will be granted for particular indications and may entail limitations on the indicated uses for which such product may be marketed. The FDA also may condition approval on, among other things, changes to proposed labeling or the development of adequate controls and specifications. Once approved, the FDA may withdraw the product approval if compliance with pre- and post-marketing requirements is not maintained or if problems occur after the product reaches the marketplace. The FDA may require one or more post-market studies and surveillance to further assess and monitor the product’s safety and effectiveness after commercialization, and may limit further marketing of the product based on the results of these post-marketing studies.
Any biologics manufactured or distributed pursuant to FDA approvals are subject to pervasive and continuing regulation by the FDA, including, among other things, requirements relating to record-keeping, reporting of adverse experiences, periodic reporting, product sampling and distribution, and advertising and promotion of the product. After approval, most changes to the approved product, such as adding new indications or other labeling claims, are subject to prior FDA review and approval. There also are continuing, annual program fees for any marketed products. Biologic manufacturers and their subcontractors are required to register their establishments with the FDA and certain state agencies, and are subject to periodic unannounced inspections by the FDA and certain state agencies for compliance with cGMP, which impose certain procedural and documentation requirements upon us and our third-party manufacturers. Changes to the manufacturing process are strictly regulated, and, depending on the significance of the change, may require prior FDA approval before being implemented. FDA regulations also require investigation and correction of any deviations from cGMP and impose reporting requirements upon us and any third-party manufacturers that we may decide to use. Accordingly, manufacturers must continue to expend time, money and effort in the area of production and quality control to maintain compliance with cGMP and other aspects of regulatory compliance.
FDA enforcement
The FDA may withdraw marketing authorization if compliance with regulatory requirements and standards is not maintained or if problems occur after the product reaches the market. Later discovery of previously unknown problems with a product, including adverse events of unanticipated severity or frequency, or with manufacturing processes, or failure to comply with regulatory requirements, may result in revisions to the approved labeling to add new safety information, imposition of post-market studies or clinical studies to assess new safety risks, or imposition of distribution restrictions or other restrictions. Other potential consequences include, among other things: restrictions on the marketing or manufacturing of the product, complete withdrawal of the product from the market, product recalls, fines, warning letters, untitled letters, clinical holds on clinical studies, refusal of the FDA to approve pending applications or supplements to approved applications, product seizures or detention, refusal to permit the import or export of products, consent decrees, corporate integrity agreements, debarment or exclusion from federal healthcare programs, the issuance of corrective information, injunctions, or the imposition of civil or criminal penalties.
In addition, the FDA closely regulates the marketing, labeling, advertising and promotion of biologics and medical devices. A company can make only those claims relating to safety and efficacy, purity and potency that are cleared or approved by the FDA and in accordance with the provisions of the authorized label. The FDA and other agencies actively enforce the laws and regulations prohibiting
21
the promotion of off-label uses. Failure to comply with these requirements can result in, among other things, adverse publicity, warning letters, corrective advertising and potential civil and criminal penalties.
U.S. healthcare laws
The costs of healthcare have been and continue to be a subject of study, investigation and regulation by governmental agencies and legislative bodies around the world. In the United States, attention has been focused on programs that encourage doctors to recommend, use or purchase particular medical devices. Payers have become a more potent force in the marketplace and increased attention is being paid to medical device pricing, appropriate medical device utilization and the quality and costs of healthcare generally.
Following the U.S. Supreme Court decision in June 2012 upholding the PPACA, there has been an increase in the pace of regulatory issuances by those U.S. government agencies designated to carry out the extensive requirements of the PPACA. There also have been judicial and Congressional challenges to certain aspects of the PPACA, as well as efforts by the current administration to repeal or replace certain aspects of the PPACA or otherwise circumvent some of the requirements for health insurance mandated by the PPACA. These have both positive and negative impacts on the U.S. healthcare industry with much remaining uncertain as to how various provisions of the PPACA will ultimately affect the industry. For instance, the TCJA removed the penalties for not complying with the PPACA’s individual mandate to carry health insurance. On December 14, 2018, a U.S. district court judge in the Northern District of Texas ruled that the individual mandate is a critical and inseverable feature of the PPACA, and therefore, because it was repealed as part of the TCJA, the remaining provisions of the PPACA are invalid. The U.S. Court of Appeals for the Fifth Circuit affirmed the decision of the district court that the individual mandate, as amended by the TCJA, was unconstitutional. The Fifth Circuit remanded the case to the district court to consider a remedy, including to consider and explain which provisions of the PPACA are inseverable and invalid. On March 2, 2020, the U.S. Supreme Court granted the petitions for writ of certiorari to review this case, and it heard oral arguments in the matter in November 2020. A decision in the case is expected in 2021. There may be additional challenges and amendments to the PPACA in the future. In addition, Congress could consider subsequent legislation to replace repealed elements of the PPACA.
The MACRA repealed the formula by which Medicare made annual physician payment adjustments and replaced the former formula with a long-term schedule of Medicare payment adjustments for physicians. MACRA extended existing payment rates under the Physician Fee Schedule through June 30, 2015, with a 0.5% payment increase for the period between July 1, 2015 and December 31, 2015, and for each calendar year thereafter through 2019. The Bipartisan Budget Act of 2018 subsequently reduced this increase in 2019 to 0.25%. Effective beginning in 2019 through 2025, there will be a 0% annual update each year. In addition, MACRA established the MIPS, under which physicians may receive performance-based payment incentives and reductions, effective beginning in 2019, that are based on physicians’ performance with respect to clinical quality, resource use, clinical improvement activities, and meaningful use of electronic health records. MACRA also requires CMS to provide incentive payments to physicians and other eligible professionals that participate in alternative payment models, such as accountable care organizations, that emphasize quality and value over the traditional fee-for-service model.
On January 1, 2018, CMS implemented certain provisions of the PAMA, which made substantial changes to the way in which clinical laboratory services are paid under Medicare. Under PAMA, laboratories that receive the majority of their Medicare revenue from payments made under the CLFS or the Physician Fee Schedule are required to report to CMS, beginning in 2017 and every three years thereafter (or annually for “advanced diagnostics laboratory tests”), private payer payment rates and volumes for their tests. Laboratories that fail to report the required payment information may be subject to substantial civil monetary penalties. CMS uses the data to calculate a weighted median payment rate for each test, which is used to establish a revised Medicare reimbursement rate. Under PAMA, the revised Medicare reimbursement rates were scheduled to apply to clinical diagnostic laboratory tests furnished on or after January 1, 2018. The revised reimbursement methodology is expected to generally result in relatively lower reimbursement under Medicare for clinical diagnostic lab tests that has been historically available. Any reduction to payment rates resulting from the new methodology is limited to 10% per test per year in 2018 through 2020, and to 15% per test per year in 2021 through 2023. For clinical diagnostic laboratory tests that are assigned a new or substantially revised HCPCS code, initial payment rates for clinical diagnostic laboratory tests that are not advanced diagnostic laboratory tests will be assigned by the cross-walk or gap-fill methodology. Initial payment rates for new advanced diagnostic laboratory tests will be based on the actual list charge for the laboratory test. The CARES Act, which was signed into law on March 27, 2020, amended the timeline for reporting private payer payment rates and delayed by one year the payment reductions scheduled for 2021.
In addition to the CARES Act, Congress has enacted other laws in response to the COVID-19 pandemic to provide financial relief to healthcare providers and suppliers, including diagnostic laboratories, and encourage implementation of diagnostic testing and treatment for COVID-19. For instance, the FFCRA, enacted on March 18, 2020, requires certain governmental and commercial insurance plans to provide coverage of COVID-19 diagnostic testing services without imposing cost-sharing (e.g., copays, deductibles or coinsurance) or other utilization management requirements. The CARES Act and the PPPHCEA, enacted on April 24, 2020, each appropriated approximately $100 billion to provide financial relief for certain healthcare providers and to expand treatment and diagnostic testing capacity for COVID-19. The Consolidated Appropriations Act of 2021 (“CAA”), which was enacted on December
22
27, 2020 and included further pandemic relief measures, temporarily increased payment rates under the Medicare Physician Fee Schedule by 3.75% beginning January 1, 2021 through December 31, 2021. The CARES Act, as subsequently amended by the CAA, also suspended, for the period from May 1, 2020 to March 31, 2021, the 2% payment reduction created under the sequestration required by the Budget Control Act of 2011 (as amended by the American Taxpayer Relief Act of 2012), and extended the sequester by one year, through 2030.
The regulatory agencies under whose purview we operate have administrative powers that may subject us to actions such as product withdrawals, recalls, seizure of products and other civil and criminal sanctions.
In addition, business practices in the healthcare industry have come under increased scrutiny, particularly in the United States, by government agencies and state attorneys general, and resulting investigations and prosecutions carry the risk of significant civil and criminal penalties under applicable laws. These laws include anti-kickback, false claims laws, civil monetary penalties laws, data privacy and security laws, and physician payment transparency laws. See “Risk factors—Risks related to our business—We are subject to healthcare regulations that could result in liability, require us to change our business practices and restrict our operations in the future.”
Our website address is www.orthoclinicaldiagnostics.com, and our investor relations website is located at https://ir.orthoclinicaldiagnostics.com/. Information on our website is not incorporated by reference herein and inclusion of the website address in this Annual Report on Form 10-K is an inactive textual reference only. We will make available on our website, free of charge, our Annual Report on Form 10-K, Quarterly Reports on Form 10-Q, Current Reports on Form 8-K and any amendments to those reports filed or furnished pursuant to Section 13(a) or 15(d) of the Exchange Act, as soon as reasonably practicable after we electronically file such material with, or furnish it to, the SEC. The SEC maintains an Internet site (http://www.sec.gov) containing reports, proxy and information statements, and other information regarding issuers that file electronically with the SEC.
We use our website and our corporate Facebook, LinkedIn, and Twitter accounts as channels of distribution of Company information. The information we post through these channels may be deemed material. Accordingly, investors should monitor these channels, in addition to following our press releases, SEC filings and public conference calls and webcasts. The contents of our website and social media channels are not, however, a part of this Annual Report on Form 10-K.
23
In addition to the other information contained in this Annual Report on Form 10-K and the exhibits hereto, the following risk factors should be considered carefully in evaluating our business. The risks and uncertainties described below are not the only risks and uncertainties that we face. Additional risks and uncertainties not known to us or that we currently deem immaterial may also impair our business operations. The occurrence of any of the following risks may materially and adversely affect our business, financial condition, results of operations and future prospects .
The following is a summary of the principal risks that could adversely affect our business, results of operations and financial condition:
|
|
• |
manufacturing problems or delays or failure to develop and market new or enhanced products or services; |
|
|
• |
our ability to obtain additional capital on commercially reasonable terms may be limited or non-existent; |
|
|
• |
a need to recognize impairment charges related to goodwill, identified intangible assets and fixed assets; |
|
|
• |
our ability to operate according to our business strategy should our collaboration partners fail to fulfill their obligations; |
|
|
• |
product recalls or negative publicity may harm our reputation or market acceptance of our products; |
|
|
• |
decreases in the number of surgical procedures performed, and the resulting decrease in blood demand; |
|
|
• |
terrorist acts, conflicts, wars and natural disasters that may materially adversely affect our business, financial condition and results of operations; |
|
|
• |
risks associated with our non-U.S. operations, including currency translation risks, the impact of possible new tariffs and compliance with applicable trade embargoes; |
|
|
• |
significant changes in the healthcare industry and related industries that we serve, in an effort to reduce costs; |
|
|
• |
price increases or interruptions in the supply of raw materials, components for our products, and products and services provided to us by certain key suppliers and manufacturers; |
|
|
• |
work stoppages, union negotiations, labor disputes and other matters associated with our labor force; |
24
|
|
• |
failure to comply with applicable regulations, which may result in significant costs or the suspension or withdrawal of previously obtained clearances or approvals; |
|
|
• |
our inability to protect and enforce our intellectual property rights or defend against intellectual property infringement suits against us by third parties; |
|
|
• |
risks related to the ownership of our ordinary shares, including the fact that we are a “controlled company” within the meaning of the corporate governance standards of Nasdaq. |
The following is a more complete discussion of the material risks facing our business.
Risks related to our business, operations and growth strategies
We have significant international sales and operations and face risks related to health epidemics, including the ongoing global pandemic related to a novel coronavirus (“COVID-19”). The COVID-19 pandemic has significantly and adversely affected our consolidated results of operations, financial position and cash flows, and may continue to do so.
Any significant outbreak of contagious diseases and other adverse public health developments in countries where we operate could have a material and adverse effect on our business, financial condition and results of operations. For example, in March 2020, the World Health Organization characterized a novel strain of coronavirus (COVID-19) as a pandemic amidst a rising number of confirmed cases and thousands of deaths worldwide. Many countries, including the United States, have taken steps to restrict travel and temporarily close businesses, schools and other public gathering spaces, and almost all states in the United States have previously or currently issued orders and directives requiring residents to stay in their homes. It remains unclear how long such measures will remain in place and when the COVID-19 pandemic will abate. The global COVID-19 pandemic has resulted in significant governmental measures being implemented to control the spread of the virus, including restrictions on manufacturing, shipping and the movement of employees. As a result of such restrictions, we have experienced some supply-chain disruptions and some restrictions on our ability to efficiently distribute products in the regions affected. In addition, we have seen a decline in overall testing volume and shipments to our customers, which has adversely impacted our revenues. We have also seen an increase in idle facility costs and freight and distribution costs. Any prolonged and significant supply-chain disruptions or inability to provide products in countries adversely impacted by the COVID-19 pandemic would continue to impact our revenues in the affected region, increase our costs and negatively affect our business relationships and reputation, as well as our operating results. Although we started to ship COVID-19 antibody tests during the fiscal second quarter of 2020, the duration and level of the demand for COVID-19 antibody tests is uncertain. It is also possible that we will experience an adverse impact on collections and timing of cash receipts as a result of the impact of the COVID-19 pandemic. We could experience significant fluctuations in our cash flows from period to period during the pandemic and in the periods that follow the end of the COVID-19 pandemic.
We maintain a commercial presence in more than 130 countries and territories, with a direct presence in 35 countries, including in countries that have been severely impacted by the COVID-19 pandemic. Government imposed travel restrictions and local statutory quarantines, as well as potential impact to personnel, to the extent our employees become ill, may result in direct operational and administrative disruptions. We may also face increased risks of disputes with our business partners, litigation and governmental and
25
regulatory scrutiny as a result of the effects of COVID-19. The COVID-19 pandemic has resulted, and future significant outbreaks of contagious diseases in the human population could result, in a widespread health crisis that could adversely affect the economies and financial markets of many countries, resulting in an economic downturn that could affect demand for our products and services and likely impact our operating results.
Health regulatory agencies globally may also experience disruptions in their operations as a result of the COVID-19 pandemic. The U.S. Food and Drug Administration (“FDA”) and comparable foreign regulatory agencies may have slower response times or be under-resourced and, as a result, review and approval of product registrations may be materially delayed. For example, as health authorities have redeployed resources to focus on the management of the pandemic, there is a reduction in available capacity for the review and approval of other less-critical product submissions. As a result, manufacturers may incur a delay in obtaining product registrations.
The extent to which the COVID-19 pandemic, in particular, impacts our results will depend on future developments, which are highly uncertain and cannot be predicted, including new information which may emerge concerning the severity and duration of the COVID-19 pandemic and the actions to contain it or treat its impact, among others.
To the extent the COVID-19 pandemic adversely affects our business and financial results or those of our customers, it may also have the effect of heightening many of the other risks described in this Part I, Item 1A “Risk factors” section. The ultimate impact of the COVID-19 outbreak on our business, financial condition and results of operations depends on many factors, including those discussed above, that are not within our control.
We face significant competition, and our failure to compete effectively could adversely affect our sales and results of operations.
The markets in which we and our competitors operate are rapidly evolving, and developments are expected to continue at a rapid pace. Competition in these markets is intense and expected to increase as new products, services and technologies become available and as new competitors enter the market. We face competition from diagnostics divisions of large multinational healthcare companies and conglomerates. Some of our existing or potential competitors have substantially greater research and development capabilities, clinical, manufacturing, regulatory and marketing experience and financial and managerial resources than we do. Some of these competitors are divisions or subsidiaries of corporations with substantial resources. Our sales and results of operations may be adversely affected by:
|
|
• |
customers’ perceptions of the comparative quality of our competitors’ products or services; |
|
|
• |
our ability to manufacture, in a cost-effective way, sufficient quantities of our products to meet customer demand; |
|
|
• |
the ability of our competitors to develop products, services and technologies that are more effective than ours or that render ours obsolete; |
|
|
• |
our competitors’ ability to obtain patent protection or other intellectual property rights that would prevent us from offering competing products or services; |
|
|
• |
the ability of our competitors to obtain regulatory approval for the commercialization of products or services more rapidly or effectively than we do; and |
|
|
• |
competitive pricing by our competitors. |
We expect competition to intensify in the future as more companies enter our markets. Increased competition and potential new entrants in these industries may result in lower prices and volumes, higher costs for resources and lower profitability for us. Moreover, competitive and regulatory conditions in many markets in which we and our competitors operate restrict our ability to fully recover through price increases, higher costs of acquired goods and services resulting from inflation and other drivers of cost increases. We may not be able to supply customers with products and services that they deem superior and at competitive prices, and we may lose business to our competitors. We also face risks related to customers finding alternative methods for testing, which could result in lower demand for our products. If we are unable to compete successfully in these highly competitive industries, it could have a material effect on our business, financial condition and results of operations.
We may experience difficulties that delay or prevent our development, introduction or marketing of new or enhanced products or services.
Our success depends on our ability to effectively introduce new and competitive products and services. The development of new or enhanced products or services is a complex, costly and uncertain process and is becoming increasingly complex and uncertain in the United States. Furthermore, developing and manufacturing new products and services requires us to anticipate customers’ and patients’ needs and emerging technology trends accurately. We may experience research and development, manufacturing, regulatory,
26
marketing and other difficulties that could delay or prevent our introduction of new or enhanced products and services, including the timelines for the introduction of new products as described in this Annual Report on Form 10-K. The research and development process in the healthcare industry generally takes a significant amount of time from design stage to product launch. This process is conducted in various stages, and each stage presents the risk that we will not achieve our goals. In addition, innovations may not be accepted quickly in the marketplace because of, among other things, entrenched patterns of clinical practice or uncertainty over third-party reimbursements. In the event of such failure, we may have to abandon a product in which we have invested substantial resources. We cannot be certain that:
|
|
• |
any of our products or services under development will prove to be safe and effective in clinical trials; |
|
|
• |
we will be able to obtain, in a timely manner or at all, necessary regulatory approvals; |
|
|
• |
the products and services we develop can be manufactured or provided at acceptable cost and with appropriate quality; or |
|
|
• |
these products and services, if and when approved, can be successfully marketed. |
These factors, as well as manufacturing or distribution problems or other factors beyond our control, could delay the launch of new products or services. Any delay in the development, approval, production, marketing or distribution of a new product or service could materially and adversely affect our competitive position, our branding and our results of operations. Additionally, customers could adopt alternative technologies, instead of our technology, which could result in lower demand for our products.
Global market, economic and political conditions may adversely affect our operations and performance.
The growth of our business and demand for our products is affected by changes in the health of the overall global economy and, in particular, of the healthcare industry. Demand for our products and services could change more dramatically than in previous years based on activity, funding reimbursement constraints and support levels from governments, universities, hospitals and the private industry, including laboratories. Our global business is adversely affected by decreases in the general level of economic activity, such as decreases in business and consumer spending, increases in unemployment rates and budgeting constraints of governmental entities. Disruptions in the United States, Europe or in other economies, or weakening of emerging markets, including China, could adversely affect our sales, profitability and/or liquidity.
We cannot assure you that there will not be a future deterioration in financial markets or confidence in major economies. These economic developments affect businesses such as ours in a number of ways. A tightening of credit in financial markets could adversely affect the ability of our customers and suppliers to obtain financing for significant purchases and operations, could result in a decrease in or cancellation of orders for our products and services and could impact the ability of our customers to make payments. Similarly, a tightening of credit may adversely affect our supplier base and increase the potential for one or more of our suppliers to experience financial distress or bankruptcy.
Our financial position, results of operations and cash flows could be materially adversely affected by difficult conditions and volatility in the capital, credit and commodities markets. Difficult conditions in these markets or in the overall economy could affect our business in a number of ways. For example:
|
|
• |
under such conditions, we cannot assure you that borrowings under our Revolving Credit Facility will be available or sufficient, and in such a case, we may not be able to obtain additional financing on reasonable terms or at all; and |
|
|
• |
in order to respond to market conditions, we may need to seek waivers of various provisions in our Credit Agreement, and we might not be able to obtain such waivers on reasonable terms, if at all. |
Our ability to obtain additional capital on commercially reasonable terms may be limited or non-existent.
Although we believe our cash, cash equivalents and short-term investments, as well as future cash generated from operations and availability under our Revolving Credit Facility, provide adequate resources to fund ongoing debt service and working capital requirements, capital expenditures and transition costs for the foreseeable future, we may need to seek additional financing to compete effectively.
If we are unable to obtain capital on commercially reasonable terms, or at all, it could:
|
|
• |
result in reduced funds available to us for purposes such as working capital, capital expenditures, research and development, strategic acquisitions and other general corporate purposes; |
|
|
• |
restrict our ability to introduce new services or products or exploit business opportunities; |
|
|
• |
increase our vulnerability to economic downturns and competitive pressures in the markets in which we operate; and |
27
We may engage in acquisitions and divestitures, and may encounter difficulties integrating acquired businesses with, or disposing of divested businesses from, our current operations; therefore, we may not realize the anticipated benefits of these acquisitions and divestitures.
We may seek to grow through strategic acquisitions. Our due diligence reviews of our acquisition targets may not identify all of the material issues necessary to accurately estimate the cost or potential loss contingencies with respect to a particular transaction, including potential exposure to regulatory sanctions resulting from an acquisition target’s previous activities as well as potential vulnerability to cybersecurity risks. We may incur unanticipated costs or expenses, including post-closing asset impairment charges, expenses associated with eliminating duplicate facilities, litigation and other liabilities. We also may encounter difficulties in integrating acquisitions with our operations, applying our internal controls processes to these acquisitions, retaining key technical and management personnel, complying with regulatory requirements or in managing strategic investments. Additionally, we may not achieve the benefits we anticipate when we first enter into a transaction in the amount or timeframe anticipated. Any of the foregoing could adversely affect our business and results of operations. In addition, accounting requirements relating to business combinations, including the requirement to expense certain acquisition costs as incurred, may cause us to experience greater earnings volatility and generally lower earnings during periods in which we acquire new businesses. Furthermore, we may make strategic divestitures from time to time. These divestitures may result in continued financial involvement in the divested businesses, such as through guarantees, indemnity obligations or other financial arrangements, following those transactions. Under these arrangements, nonperformance by those divested businesses could result in financial obligations imposed upon us and could affect our future financial results.
It may be difficult for us to implement our strategies for improving growth.
We plan to continue expanding our commercial capabilities and scope of our business, both domestically and internationally, while maintaining our commercial operations and administrative activities. For example, we intend to pursue the following growth strategies: (i) maximize LCV to produce and maintain a growing and recurring, high margin, durable financial profile; (ii) provide an unparalleled customer experience to retain and attract existing and new customers; (iii) leverage our global footprint to deliver innovative solutions to meet our customers’ needs in both developed and emerging markets; (iv) create meaningful product innovation through menu expansion, development of novel instruments and enhancement of automation and informatics; (v) continue to identify operating efficiencies to allow for reinvestment in growth and improve margins; and (vi) pursue business development opportunities, partnerships and strategic acquisitions to enter adjacencies or expand our current business units. However, our ability to manage our business and conduct our global operations while also pursuing the aforementioned growth strategies requires considerable management attention and resources. Furthermore, it is subject to the challenges of supporting a growing business on a global basis.
Our failure to implement these strategies in a cost-effective and timely manner could have an adverse effect on our business, results of operations and financial condition.
We may need to recognize impairment charges related to goodwill, identified intangible assets and fixed assets.
Under the acquisition method of accounting for business combinations, the net assets acquired are recorded at their fair value as of the date of the acquisition, with any excess purchase price recorded as goodwill. The Acquisition resulted in significant balances of goodwill and identified intangible assets. As of January 3, 2021, the balance of goodwill and identified intangible assets was $580.1 million and $1,016.7 million, respectively. We are required to test goodwill and any other intangible asset with an indefinite life for possible impairment on the same date each year and on an interim basis if there are indicators of a possible impairment. We are also required to evaluate amortizable intangible assets and fixed assets for impairment if there are indicators of a possible impairment.
There is significant judgment required in the analysis of a potential impairment of goodwill, identified intangible assets and fixed assets. If, as a result of a general economic slowdown, deterioration in one or more of the markets in which we operate or impairment in our financial performance and/or future outlook, the estimated fair value of our long-lived assets decreases, we may determine that one or more of our long-lived assets is impaired. An impairment charge would be determined based on the estimated fair value of the assets and any such impairment charge could have a material adverse effect on our results of operations and financial position.
We may be unable to achieve some or all of the operational cost improvements and other benefits that we expect to realize.
We estimate that we will be able to achieve approximately $43 million of aggregate cost savings in fiscal years 2021 and 2022 as a result of certain initiatives, particularly by pursuing a number of operational cost improvements associated with procurement, manufacturing, a field service organization, distribution and logistics, quality and regulatory and other general and administrative, not including certain related one-time costs necessary to achieve such operational cost improvements, which may be material. We have announced several initiatives to strengthen our operational performance and have begun to execute certain of these initiatives. However, we cannot be certain that we will be able to successfully realize all the expected benefits of these initiatives. A variety of risks could cause us not to realize some or all of the expected benefits. These risks include, among others, higher than expected standalone overhead expenses, delays in the anticipated timing of activities related to such initiatives, increased difficulty and cost in establishing ourselves
28
as a standalone business and the incurrence of other unexpected costs associated with operating the business. Moreover, our continued implementation of these initiatives may disrupt our operations and performance and our estimated cost savings from these initiatives are based on several assumptions that may prove to be inaccurate and, as a result, we cannot assure you that we will realize these cost savings. If, for any reason, the benefits we realize are less than our estimates or our improvement initiatives adversely affect our operations or cost more or take longer to implement than we project, or if our assumptions prove inaccurate, our results of operations may be materially adversely affected.
Our collaboration arrangements may not operate according to our business strategy if our collaboration arrangement partners fail to fulfill their obligations.
As part of our business, we have entered into collaboration arrangements with other companies, including the Joint Business with Grifols, which is structured as a license, research and supply agreement, and we may enter into additional collaboration arrangements in the future.
The nature of a collaboration arrangement requires us to share control over significant decisions with unaffiliated third parties. Since we may not exercise exclusive control over our current or future collaboration arrangements, we may not be able to require our collaboration arrangement partners to take actions that we believe are necessary to implement our business strategy. Additionally, differences in views among collaboration arrangement partners may result in delayed decisions or failures to agree on major issues. Disputes between us and our collaboration arrangement partners could also result in litigation, which can be expensive and time-consuming. If these differences cause our collaboration arrangements to deviate from our business strategy, our results of operations could be materially adversely affected.
If we deliver products with defects, we may be subject to product recalls or negative publicity, our credibility may be harmed, market acceptance of our products may decrease and we may be exposed to liability.
The manufacturing and marketing of professional and consumer diagnostics involve an inherent risk of product liability claims. For example, a defect in one of our diagnostic products could lead to a false positive or false negative result, affecting the eventual diagnosis. Our product development and production are extremely complex and could expose our products to defects. Our Immunohematology business in particular is subject to the risk of product liability claims, as even the slightest inaccuracies in a specimen’s analysis can lead to critical outcomes in the life of a patient, thereby leaving little to no room for error in the precision and accuracy of such testing. Manufacturing and design defects could lead to recalls (either voluntary or required by the FDA or other government authorities) and could result in the removal of a product from the market. Depending on the corrective action we take to redress a product’s deficiencies, we may be required to obtain new clearances or approvals before we may market or distribute the corrected device. Defects in our products could also harm our reputation, lead to negative publicity and decrease sales of our products, and we could also face additional regulatory enforcement action, including FDA warning letters, untitled letters, product seizure, injunctions, administrative penalties, or civil or criminal fines.
In addition, our marketing of monitoring services may cause us to be subjected to various product liability or other claims, including, among others, claims that inaccurate monitoring results lead to injury or death, or, in the case of our toxicology monitoring services, the imposition of criminal sanctions. Any product liability or other claim brought against us, regardless of merit, could be costly to defend and could result in an increase to our insurance premiums. If we are held liable for a claim, that claim could materially affect our business and financial condition.
A decrease in the number of surgical procedures performed, and the resulting decrease in blood demand, could negatively impact our financial results.
Our Immunohematology and Donor Screening products are frequently used in connection with the testing of blood prior to transfusion, which is typically associated with surgical procedures. A decrease in the number of surgeries being performed in the markets in which we operate could result in decreased demand for blood for transfusions, which would in turn result in lower testing volumes and, therefore, decreased sales of our products. For example, we believe the market in developed countries has, at times, seen a decrease in the number of surgical procedures and lower demand for blood in recent years. A decrease in the number of surgical procedures performed could result from a variety of factors, such as fewer elective procedures and the improved efficacy and popularity of non-surgical treatments. In addition to lower surgical volumes, blood demand could also be negatively affected by more efficient blood utilization by hospitals. Blood is a large expense for hospital laboratories and pressure on hospital budgets due to macroeconomic factors and healthcare reform could force changes in the ways in which blood is used. Fewer surgeries and lower blood demand could negatively impact our revenue, profitability and cash flows.
Our reagent rental model reduces our cash flows during the initial part of the applicable contract, which causes our cash flows to fluctuate from quarter to quarter.
Leases, rather than sales, of instruments under our reagent rental model have the effect of reducing cash flows during the initial part of the applicable contract as we support those commercial transactions until we are able to recover our investment over the life of
29
the contract. The use of cash in connection with this model causes our cash flows to fluctuate from quarter to quarter and may have a negative effect on our financial condition.
Johnson & Johnson’s historical and future actions, or failure to comply with its indemnification obligations, may materially affect our business and operating results.
Although we are an independent company as a result of the Acquisition, Johnson & Johnson’s historical and future actions may still have a material impact on our business and operating results. In connection with the Acquisition, we entered into certain agreements with Johnson & Johnson, including the Acquisition Agreement and certain other transitional services agreements. In addition, Johnson & Johnson has, subject to certain exceptions and exclusions, agreed to indemnify us under the Acquisition Agreement for certain liabilities relating to historical litigation matters and divestiture agreements, tax liabilities existing at the date of the Acquisition and certain employee-related liabilities. We could incur material additional costs if Johnson & Johnson fails to meet its obligations or if we otherwise are unable to recover costs associated with such liabilities.
Risks related to our international operations
As a global business, we are subject to risks associated with our non-U.S. operations where such risks are not present in the United States.
We conduct our business on a global basis, with sales outside the United States constituting approximately 49% of our total revenue for the fiscal year ended January 3, 2021 and a significant number of employees and contractors located in foreign countries. We anticipate that international sales will continue to represent a substantial portion of our revenue and that our strategy for continued growth and profitability will entail further international expansion, particularly in emerging markets. Conducting business outside the United States subjects us to numerous risks, including:
|
|
• |
lost revenue as a result of macroeconomic developments; |
|
|
• |
decreased liquidity resulting from longer accounts receivable collection cycles typical of foreign countries; |
|
|
• |
lower productivity resulting from difficulties we encounter in staffing and managing sales, support and research and development operations across many countries; |
|
|
• |
difficulties associated with enforcing agreements and collecting receivables through foreign legal systems; |
|
|
• |
disputes with third-party distributors of our products or from third parties claiming distribution rights to our products; |
|
|
• |
difficulties associated with navigating foreign laws and legal systems; |
|
|
• |
difficulties in identifying potential third-party distributors or distribution channels; |
|
|
• |
the imposition by foreign governments of trade barriers such as tariffs, quotas, preferential bidding and import restrictions; |
|
|
• |
import or export licensing requirements, both by the United States and foreign countries; |
|
|
• |
acts of war, terrorism, theft or other lawless conduct or other economic, social or political instability in or affecting foreign countries in which we sell our products or operate; |
|
|
• |
international sanctions regimes; |
|
|
• |
adverse effects resulting from changes in foreign regulations, rules, policies or other laws affecting sales of our products or our foreign operations; |
|
|
• |
tax liability resulting from international tax laws; |
|
|
• |
increased financial accounting and reporting burdens and complexities; |
|
|
• |
increased costs to comply with changes in legislative or regulatory requirements; |
|
|
• |
failure of laws to protect our intellectual property rights; and |
|
|
• |
delays in obtaining import or export licenses, transportation difficulties and delays resulting from inadequate local infrastructure. |
The occurrence of any of these, or other factors over which we do not have control, could lead to reduced revenue and profitability.
30
Currency translation risk and currency transaction risk may adversely affect our financial condition, results of operations and cash flows.
We derive a significant portion of our revenue from outside the United States (approximately 49% for the fiscal year ended January 3, 2021), and we conduct our business and incur costs in the local currency of most countries in which we operate. Because our financial statements are presented in U.S. dollars, we must translate earnings as well as assets and liabilities into U.S. dollars at exchange rates in effect during or at the end of each reporting period, as applicable. Therefore, increases or decreases in the value of the U.S. dollar against other currencies in countries where we operate will affect our results of operations and the value of balance sheet items denominated in foreign currencies. Furthermore, many of our local businesses generate revenues and incur costs in a currency other than their functional currency, which can impact the operating results for these operations if we are unable to mitigate the impact of foreign currency fluctuations. Additionally, in order to fund the purchase price for certain assets of Ortho and the capital stock of certain other non-U.S. entities, a combination of equity contributions and intercompany loans were utilized to capitalize certain non-U.S. subsidiaries. In many instances, the intercompany loans are denominated in currencies other than the functional currency of the affected subsidiaries. Where intercompany loans are not a component of permanently invested capital of the affected subsidiaries, increases or decreases in the value of the subsidiaries’ functional currency against other currencies will affect our results of operations. We cannot accurately predict the effects of exchange rate fluctuations upon our future operating results because of the number of currencies involved, the variability of currency exposures and the potential volatility of currency exchange rates. Accordingly, our profitability could be affected by fluctuations in foreign exchange rates. Given the volatility of exchange rates, we may not be able to effectively manage our currency transaction and/or translation risks, and any volatility in currency exchange rates may have an adverse effect on our financial condition, results of operations and cash flows. We have entered into hedging agreements to address certain of our currency risks and intend to utilize local currency funding of expansions when appropriate. We do not intend to hold financial instruments for trading or speculative purposes.
New tariffs and other trade measures could adversely affect our business and financial results.
Governments sometimes impose additional taxes on certain imported products. Any such new import tariffs or restrictions, or other changes in U.S. trade policy, could trigger retaliatory actions by affected countries. For instance, the United States and China have announced import tariffs and retaliatory tariffs on certain categories of goods, including from time to time some of our reagent products sold in China. These tariffs, depending upon their ultimate scope, how they are implemented and if and when they are declared effective, could negatively impact our business by increasing our costs and by making our products less cost competitive in China. While it is not possible to predict whether or when any additional changes will occur or what form they may take, the imposition of additional tariffs by the United States could result in the adoption of additional tariffs by China and other countries, as well as further retaliatory actions by any affected country, which could negatively impact our financial performance.
The United Kingdom’s withdrawal from the European Union may have a negative effect on global economic conditions, financial markets and our business, which could reduce the price of our ordinary shares.
We are a multinational company with worldwide operations, including significant business operations in Europe. Following a national referendum in which a majority of voters in the United Kingdom elected to withdraw from the European Union and the enactment of legislation by the government of the United Kingdom, the United Kingdom formally withdrew from the European Union on January 31, 2020. On 24 December 2020, the United Kingdom and the European Commission reached an agreement on the terms of its future cooperation with the European Union (the “UK-EU Trade and Cooperation Agreement”). On 30 December 2020, the UK Parliament provided its approval of the European Union (Future Relationship) Bill. Significant political and economic uncertainty remains about whether the terms of the relationship will differ materially in practice from the terms before withdrawal.
These developments, or the perception that any of them could occur, have had and may continue to have a material adverse effect on global economic conditions and the stability of global financial markets, and could significantly reduce global market liquidity and restrict the ability of key market participants to operate in certain financial markets. Asset valuations, currency exchange rates and credit ratings have been and may continue to be subject to increased market volatility. Lack of clarity about future United Kingdom laws and regulations as the United Kingdom determines which European Union laws to replace or replicate could depress economic activity and restrict our access to capital. The tax implications of the United Kingdom’s departure from the European Union are not certain as of the date of this Annual Report on Form 10-K.
Any of these factors could have a material adverse effect on our business, financial condition and results of operations and reduce the price of our ordinary shares.
Risks related to our employees, customers and suppliers
We must deliver products and services that meet customers’ needs and expectations or our business and results of operations will be adversely impacted.
Our ability to retain customers, attract new customers, grow our business and enhance our brand depends on our success in delivering products and services that meet our customers’ needs and expectations. If we are unable to deliver reliable products in a timely manner, promptly respond to and address quality issues, provide expected levels of customer service, develop and maintain cross-
31
functional communication within our company and comply with applicable regulations and rules, our ability to deliver products that meet our customers’ needs and expectations, our competitive position, our branding and our results of operations may be adversely and materially affected. Furthermore, any improvement in the perception of the quality of our competitors’ products or services relative to the quality of our products and services could adversely and materially affect our ability to retain our customers and attract new customers. Additionally, the introduction of counterfeit products into the markets we serve may have the effect of eroding confidence in our products or in our industry as a whole.
The success of many of our products depends heavily on acceptance by directors of clinical laboratories, blood banks and hospitals, and our failure to maintain a high level of confidence in our products could adversely affect our business.
We maintain customer relationships with numerous directors of clinical laboratories, blood banks and hospitals. We believe that sales of our products depend significantly on our customers’ confidence in, and recommendations of, our products. In addition, our success depends on technicians’ acceptance and confidence in the effectiveness and ease-of-use of our products, including our new products. In order to achieve acceptance by healthcare professionals, we seek to educate the healthcare community as to the distinctive characteristics, perceived benefits, clinical efficacy and cost-effectiveness of our products compared to alternative products, including the products offered by our competitors. Acceptance of our products also requires effective training of healthcare professionals in the proper use and application of our products. Failure to effectively educate and train our technician end-users and failure to continue to develop relationships with leading healthcare professionals could result in less frequent recommendations of our products, which may adversely affect our sales and profitability.
The healthcare industry and related industries that we serve have undergone, and are in the process of undergoing, significant changes in an effort to reduce costs, which could adversely affect our business, financial condition and results of operations.
The healthcare industry and related industries that we serve have undergone, and are in the process of undergoing, significant changes in an effort to reduce costs, including the following:
|
|
• |
Many of our customers, and the end-customers to whom our customers supply products, rely on government funding of and reimbursement for healthcare products and services and research activities. The PPACA, healthcare austerity measures in Europe and other potential healthcare reform changes and government austerity measures may reduce the amount of government funding or reimbursement available to customers or end-customers of our products and services and/or the volume of medical procedures using our products and services. Global economic uncertainty or deterioration can also adversely impact government funding and reimbursement. |
|
|
• |
The PPACA imposed a 2.3% excise tax on any entity that manufactures or imports medical devices offered for sale in the United States as well as reporting and disclosure requirements on medical device manufacturers, the impact of which is reflected in our audited financial statements included elsewhere in this Annual Report on Form 10-K. Under the Consolidated Appropriations Act of 2016 and subsequent legislation, the excise tax was suspended as of January 1, 2016, and repealed altogether on December 20, 2019. |
|
|
• |
Governmental and private healthcare providers and payors around the world are increasingly utilizing managed care for the delivery of healthcare services, forming group purchasing organizations to improve their purchasing leverage and using competitive bid processes to procure healthcare products and services. |
|
|
• |
Health insurance premiums, co-payments and deductibles have generally increased in recent years. These increases may cause individuals to forgo health insurance, as well as medical attention. This behavior may reduce the number of lives managed by our health information solutions, including our health improvement programs. |
These changes have increased tax costs and may cause participants in the healthcare industry to purchase fewer of our products and services, reduce the prices they are willing to pay for our products or services, reduce the amounts of reimbursement and funding available for our products or services from governmental agencies or third-party payors, reduce the volume of medical procedures that use our products and services and increase our compliance and other costs. In addition, we may be unable to enter into contracts with group purchasing organizations and integrated health networks on terms acceptable to us, and even if we do enter into such contracts, they may be on terms that negatively affect our current or future profitability. All of the factors described above could adversely affect our business, financial condition and results of operations.
Reductions in government funding and reimbursement to our customers could negatively impact our sales and results of operations.
Many of our customers rely on government funding and on prompt and full reimbursement by Medicare and Medicaid and equivalent programs outside of the United States. Global economic uncertainty can result in lower levels of government funding or reimbursement. A reduction in the amount or types of government funding or reimbursement that affect our customers could have a negative impact on our sales. Additionally, the PPACA, which was enacted in 2010, substantially changed the way healthcare is financed by both governmental and private insurers in the United States and expanded Medicaid program eligibility and access to commercial health insurance coverage. Since its enactment, there have been judicial and Congressional challenges to certain aspects of the PPACA,
32
as well as efforts by the current administration to repeal or replace certain aspects of the PPACA or otherwise circumvent some of the requirements for health insurance mandated by the PPACA. Most recently, the Tax Cuts and Jobs Act of 2017 (“TCJA”) was enacted, which, among other things, removes the penalties for not complying with the PPACA’s individual mandate to carry health insurance. On December 14, 2018, a U.S. district court judge in the Northern District of Texas ruled that the individual mandate is a critical and inseverable feature of the PPACA, and therefore, because it was repealed as part of the TCJA, the remaining provisions of the PPACA are invalid as well. This decision was subsequently appealed, and on December 18, 2019, the U.S. Court of Appeals for the Fifth Circuit affirmed the decision of the district court that the individual mandate, as amended by the TCJA, was unconstitutional. The Fifth Circuit remanded the case to the district court to consider a remedy, including to consider and explain which provisions of the PPACA are inseverable and invalid. On March 2, 2020, the U.S. Supreme Court granted the petitions for writ of certiorari to review this case, and it heard oral arguments in the matter in November 2020. A decision in the case is expected in 2021. It is unclear how this litigation or other efforts to challenge, repeal or replace the PPACA will impact the PPACA and our business. There may be additional challenges and amendments to the PPACA in the future. In addition, Congress could consider subsequent legislation to replace repealed elements of the PPACA. At this time, the full effect of the PPACA and any future litigation, subsequent legislation or related regulatory actions on our business remains unclear.
Some of our customers receive Medicare reimbursement for our products under the Medicare Physician Fee Schedule, which is updated on an annual basis. The Medicare Access and CHIP Reauthorization Act of 2015 (“MACRA”) repealed the formula by which Medicare made annual physician payment adjustments and replaced the former formula with a long-term schedule of Medicare payment adjustments for physicians. MACRA extended existing payment rates under the Physician Fee Schedule through June 30, 2015, with a 0.5% payment increase for the period between July 1, 2015 and December 31, 2015, and for each calendar year thereafter through 2019. The Bipartisan Budget Act of 2018 subsequently reduced this increase in 2019 to 0.25%. After 2019, there will be a 0% annual update each year through 2025. In addition, MACRA established the Merit-Based Incentive System (“MIPS”), under which physicians may receive performance-based payment incentives and reductions, effective beginning in 2019, that are based on physicians’ performance with respect to clinical quality, resource use, clinical improvement activities and meaningful use of electronic health records. MACRA also requires CMS to provide incentive payments to physicians and other eligible professionals that participate in alternative payment models, such as accountable care organizations, that emphasize quality and value over the traditional fee-for-service model.
On January 1, 2018, CMS implemented certain provisions of the Protecting Access to Medicare Act of 2014 (“PAMA”), which made substantial changes to the way in which clinical laboratory services are paid under Medicare. Under PAMA, laboratories that receive the majority of their Medicare revenue from payments made under the CLFS or the Physician Fee Schedule are required to report to CMS, beginning in 2017 and every three years thereafter (or annually for “advanced diagnostics laboratory tests”), private payer payment rates and volumes for their tests. Laboratories that fail to report the required payment information may be subject to substantial civil monetary penalties. CMS uses the data to calculate a weighted median payment rate for each test, which is used to establish a revised Medicare reimbursement rate. Under PAMA, the revised Medicare reimbursement rates were scheduled to apply to clinical diagnostic laboratory tests furnished on or after January 1, 2018. The revised reimbursement methodology is expected to generally result in relatively lower reimbursement under Medicare for clinical diagnostic lab tests that has been historically available. Any reduction to payment rates resulting from the new methodology is limited to 10% per test per year in 2018 through 2020, and to 15% per test per year in 2021 through 2023. For clinical diagnostic laboratory tests that are assigned a new or substantially revised Healthcare Common Procedure Coding System (“HCPCS”) code, initial payment rates for clinical diagnostic laboratory tests that are not advanced diagnostic laboratory tests will be assigned by the cross-walk or gap-fill methodology. Initial payment rates for new advanced diagnostic laboratory tests will be based on the actual list charge for the laboratory test. The Coronavirus Aid, Relief and Economic Security Act (the “CARES Act”), which was signed into law on March 27, 2020, amended the timeline for reporting private payer payment rates and delayed by one year the payment reductions scheduled for 2021.
In addition to the CARES Act, Congress has enacted other laws in response to the COVID-19 pandemic to provide financial relief to healthcare providers and suppliers, including diagnostic laboratories, and encourage implementation of diagnostic testing and treatment for COVID-19. For instance, the Families First Coronavirus Response Act (“FFCRA”), enacted on March 18, 2020, requires certain governmental and commercial insurance plans to provide coverage of COVID-19 diagnostic testing services without imposing cost-sharing (e.g., copays, deductibles or coinsurance) or other utilization management requirements. The CARES Act and the Paycheck Protection Program and Health Care Enhancement Act (“PPPHCEA”), enacted on April 24, 2020, each appropriated approximately $100 billion to provide financial relief for certain healthcare providers and to expand treatment and diagnostic testing capacity for COVID-19. The Consolidated Appropriations Act of 2021 (“CAA”), which was enacted on December 27, 2020 and included further pandemic relief measures, temporarily increased payment rates under the Medicare Physician Fee Schedule by 3.75% beginning January 1, 2021 through December 31, 2021. The CARES Act, as subsequently amended by the CAA, also suspended, for the period from May 1, 2020 to March 31, 2021, the 2% payment reduction created under the sequestration required by the Budget Control Act of 2011 (as amended by the American Taxpayer Relief Act of 2012), and extended the sequester by one year, through 2030.
33
It is unclear what impact new quality and payment programs, such as MACRA, or new pricing structures, such as those adopted under PAMA, the CARES Act, or other legislative measures enacted in response to the COVID-19 pandemic, may have on our business, financial condition, results of operations or cash flows.
We rely on certain suppliers and manufacturers for raw materials, components for our products and services, and fluctuations in the availability and price of such materials, products and services may interfere with our ability to meet our customers’ needs.
For certain of our products, including finished products, we are dependent on a small number of key suppliers and manufacturers. We also depend on key suppliers for critical raw materials and components. As a result, our ability to obtain, enter into and maintain contracts with these manufacturers and suppliers is important to our business. We cannot assure you that we will be able to obtain, enter into or maintain all such contracts in the future, and difficulty in obtaining such products or raw materials could affect our ability to achieve anticipated production levels. On occasion, we have been forced to revalidate the raw materials and components of products when a supplier of critical raw materials or components terminated its contract or no longer made the materials or components available to us. Stringent requirements of the FDA and other regulatory authorities regarding the manufacture of our products may prevent us from quickly establishing additional or replacement sources for the raw materials, products, components or manufacturing services that we use, or from doing so without excessive cost. Further, our suppliers may be subject to regulation by the FDA and other regulatory authorities that could hinder their ability to produce necessary raw materials, products and components. As a result, a reduction or interruption in supply or an inability to secure alternative sources of raw materials, products, components or manufacturing services could have a material adverse effect on our business, result of operations, financial condition and cash flows. If we are unable to achieve anticipated production levels and meet our customers’ needs, our operating results could be adversely affected. In addition, our results of operations may be significantly impacted by unanticipated increases in the cost of labor, raw materials, freight, utilities and other items needed to develop, manufacture and maintain our products and operate our business. For example, we may be disadvantaged when negotiating contract terms with our suppliers, which could increase costs and reduce our margins. Suppliers may also deliver products, components or materials that do not meet specifications, preventing us from manufacturing or supplying products that meet our design specifications or customer needs.
We may not be able to recruit and retain the experienced and skilled personnel we need to compete.
Our future success depends on our ability to attract, retain, develop and motivate highly skilled personnel. We must have talented personnel to succeed and competition for senior management in our industry is intense. Our ability to meet our performance goals depends upon the personal efforts and abilities of the principal members of our senior management who provide strategic direction, develop our business, manage our operations and maintain a cohesive and stable work environment and upon their ability to work effectively as a team. We cannot assure you that we will retain or successfully recruit senior executives, or that their services will remain available to us.
Additionally, as part of their ongoing effort to maximize our performance, Carlyle and our board of directors regularly evaluate our senior management capabilities in light of, among other things, our business strategy, changes to our capital structure, developments in our industry and markets and our ongoing financial performance, and will consider, where appropriate, supplementing, changing or otherwise enhancing our senior management team and operational and financial management capabilities in order to maximize our performance. Accordingly, our organizational structure and senior management team may change in the future, which could result in a material business interruption and the incurrence of material costs, including as a result of severance or other termination payments.
We rely on qualified managers and skilled employees, such as scientists, engineers and laboratory technicians, with technical expertise in operations, scientific knowledge, engineering and quality management experience in order to operate our business successfully. From time to time, there may be a shortage of skilled labor, which may make it more difficult and expensive for us to attract and retain qualified employees. If we are unable to attract and retain sufficient numbers of qualified individuals or our costs to do so increase significantly, our operations could be materially adversely affected. Additionally, if we were to lose a sufficient number of our research and development scientists and were unable to replace them or satisfy our needs for research and development through outsourcing, it could adversely affect our business.
Consolidation of our customer base and the formation of group purchasing organizations could materially adversely affect our sales and results of operations.
Consolidation among healthcare providers and the formation of buying groups and, with respect to our international operations, government-sponsored tendering processes, have put pressure on pricing and sales of our products, and in some instances, required payment of fees to group purchasing organizations or providing lower pricing in the tendering process. Our success in these areas depends partly on our ability to enter into contracts with integrated health networks and group purchasing organizations. If we are unable to enter into contracts with these group purchasing organizations and integrated health networks on terms acceptable to us or fail to have our pricing terms accepted in the tendering process, our sales and results of operations may be adversely affected. Even if we are able to enter into these contracts, or have our pricing terms accepted in the tendering process, they may be on terms that negatively affect our current or future profitability. Furthermore, given the average industry contract length of 5 to 7 years, if we are unable to enter into a contract with a new customer or renew a given contract with an existing customer, it may be several years before we have an opportunity
34
to acquire or reacquire, as applicable, such customer’s business, which may have a material adverse effect on our results of operations in the interim period.
We may experience manufacturing or warehousing problems or delays due to, among other reasons, our volume and specialized processes, and any interruption in supply from certain of our contract manufacturers, suppliers of raw materials and other third party vendors, which could result in decreased revenue or increased costs.
The global supply of our products depends on the uninterrupted efficient operation of our manufacturing facilities, and the continued performance of our contract manufacturers, suppliers of raw materials and other third party vendors under our contractual arrangements. Many of our manufacturing processes are complex and involve sensitive scientific processes involving the use of unique and often proprietary antibodies and other raw materials that cannot be replicated or acquired through alternative sources without undue delay or expense. Other processes present difficult technical challenges to obtain the manufacturing yields necessary to operate profitably. In addition, our manufacturing processes may require complex and specialized equipment, which can be expensive to repair or replace with required lead times of up to a year.
The manufacturing of certain of our products is concentrated in one or more of our plants, with limited alternate facilities. Any event that negatively impacts our manufacturing facilities, our manufacturing systems or equipment, or the facilities, systems or equipment of our contract manufacturers or suppliers, could delay or suspend shipments of products or the release of new products or could result in the delivery of inferior products. Our revenue from the affected products would decline and we could incur losses until such time as we or our contract manufacturers are able to restore our or their production processes or we are able to put in place alternative contract manufacturers or suppliers. Similarly, given the specialized storage requirements for our supplies and our products, any disruption to one of our two primary warehouse facilities in Memphis, Tennessee and Strasbourg, France could result in decreased revenue or increased costs given the challenge in finding suitable alternative facilities.
We also rely on contract manufacturers to manufacture certain of our products, such as the instruments for our Transfusion Medicine and Clinical Laboratories businesses, as well as suppliers of raw materials and other third party vendors. Any change in our relationship with our contract manufacturers, suppliers of raw materials and other third party vendors or changes to contractual terms of our agreements with any of them could adversely affect our financial condition and results of operations. Our reliance on a small number of contract manufacturers and a large number of single and sole source suppliers makes us vulnerable to possible capacity constraints, reduced control over product availability, delivery schedules and costs and reduced ability to monitor compliance with our product manufacturing specifications.
If our current contract manufacturers, suppliers of raw materials and other third party vendors were unable or unwilling to manufacture or supply our products or requirements for raw materials in required volumes and at required quality levels or renew existing terms under supply agreements, we may be required to replace such manufacturers, suppliers and vendors and we may be unable to do so in a timely or cost-effective manner, or at all. Any interruption of supply or any increase in price of the instruments or raw materials and other key products produced by such contract manufacturers or raw materials supplied by such suppliers and vendors could adversely affect our profitability.
Risks related to government regulation
If we are unable to obtain required clearances or approvals for the commercialization of our products in the United States, we would not be able to sell those products in the United States.
Our future performance depends on, among other matters, the timely receipt of necessary regulatory clearances and approvals for our products. Regulatory clearance and approval can be a lengthy, expensive and uncertain process. In addition, regulatory processes are subject to change, and new or changed regulations can result in increased costs and unanticipated delays.
In the United States, clearance or approval to commercially distribute new medical devices is received from the FDA through clearance of a Premarket Notification under Section 510(k) of the Federal Food, Drug, and Cosmetic Act (a “510(k)”), or through approval of a Premarket Approval application (a “PMA”). Approval to commercially distribute biologics is received from the FDA through approval of a Biologics License Application (a “BLA”) and may also require state licensing for the movement of biologics products in interstate commerce. The FDA may deny 510(k) clearance because, among other reasons, it determines that our product is not substantially equivalent to another U.S. legally marketed device. The FDA may deny approval of a PMA or BLA because, among other reasons, it determines that our product is not sufficiently safe or effective. Failure to obtain FDA clearance or approval would preclude commercialization in the United States, which could materially and adversely affect our future results of operations.
Modifications or enhancements to a cleared or approved product that could significantly affect safety or effectiveness, or that constitute a major change in the intended use of the product, could require new 510(k) clearances or possibly approval of a new PMA or BLA, or a supplement to those applications. The FDA requires every manufacturer to make the determination regarding the need for a new 510(k) submission in the first instance, but the FDA may review a manufacturer’s decision not to seek a new 510(k). We have
35
made modifications to some of our products since receipt of initial 510(k) clearance. With respect to several of these modifications, we filed new 510(k)s or PMAs; however, we determined that submission was not necessary for all of the modifications. The FDA may not agree with any of our determinations not to submit a new 510(k), PMA or PMA supplement, or BLA or BLA supplement for any modifications made to our products. If the FDA requires us to submit a new 510(k), PMA or PMA supplement, or BLA or BLA supplement for any product modification, we may be prohibited from marketing the modified products until the new submission is cleared or approved by the FDA. In that case, we may be required to recall and stop marketing our products as modified, which could require us to redesign our products, conduct clinical studies to support any modifications, and we could be subject to enforcement action.
If the results of clinical studies required to gain regulatory approval to sell our products are not available when expected, or do not demonstrate the safety and effectiveness of those products, we may be unable to sell those products.
Before we can sell certain of our products, we must conduct clinical studies intended to demonstrate that those products are safe and effective and perform as expected. The results of these clinical studies (which are experiments involving human patients having the diseases or medical conditions that the product is trying to evaluate or diagnose) are used to obtain regulatory clearance or approval from government authorities, such as the FDA. Conducting clinical studies is a complex, time-consuming and expensive process. In some cases, we may spend several years completing the necessary clinical studies.
If we fail to adequately manage our clinical studies, those clinical studies and corresponding regulatory clearances or approvals may be delayed or we may fail to gain clearance or approval for our products altogether. Even if we successfully manage our clinical studies, we may not obtain favorable results and may not obtain regulatory clearance or approval. If we are unable to market and sell our new products or are unable to obtain clearances or approvals in the timeframe needed to execute our product strategies, our business and results of operations would be materially and adversely affected.
We are subject to the regulatory approval requirements of the foreign countries in which we sell our products, and these requirements may prevent or delay us from marketing our products in those countries.
We are subject to the regulatory approval requirements for each foreign country in which we sell our products. The process for complying with these approval requirements can be lengthy and expensive. Any changes in foreign approval requirements and processes may cause us to incur additional costs or lengthen review times of our products. We may not be able to obtain foreign regulatory approvals on a timely basis, if at all, and any failure to do so may cause us to incur additional costs or prevent us from marketing our products in foreign countries, which may have a material adverse effect on our business, financial condition and results of operations.
Our business is subject to substantial regulatory oversight, and our failure to comply with applicable regulations may result in significant costs or, in certain circumstances, the suspension or withdrawal of previously obtained clearances or approvals.
Our businesses are extensively regulated by the FDA and other federal, state and foreign regulatory agencies. These regulations impact many aspects of our operations, including development, manufacturing, labeling, packaging, adverse event reporting, storage, advertising, promotion, physician interaction and record-keeping.
The FDA and corresponding foreign regulatory agencies may require post-market testing and surveillance to monitor the performance of cleared or approved products or may place conditions on any product clearances or approvals that could restrict the commercial applications of those products. The discovery of problems with a product may result in restrictions on the product, including withdrawal of the product from the market. In addition, in some cases we may sell products or provide services which are reliant on the use or commercial availability of products of third parties, including medical devices or equipment, and regulatory restrictions placed upon any such third-party products could have a material adverse impact on the sales or commercial viability of our related products or services.
We are subject to routine inspection by the FDA and other agencies for compliance with the FDA’s requirements applicable to our products, including, without limitation, the Quality System Regulation and Medical Device Reporting requirements in the United States, and other applicable regulations worldwide. Our manufacturing facilities and those of our suppliers and distributors also are, or can be, subject to periodic regulatory inspections.
We are also subject to laws relating to matters such as privacy, safe working conditions, manufacturing practices, environmental protection, fire hazard control and disposal of hazardous or potentially hazardous substances. We may incur significant costs to comply with these laws and regulations. If we fail to comply with applicable regulatory requirements, we may be subject to fines, suspension or withdrawal of regulatory approvals, product recalls, seizure of products or injunctions against our distribution of products, termination of our service agreements by our customers, disgorgement of money, operating restrictions and criminal prosecution.
Changes in applicable laws, changes in the interpretation or application of such laws, or any failure to comply with existing or future laws, regulations or standards could have a material adverse effect on our results of operations, financial condition, business and prospects. Moreover, new laws may be enacted, or regulatory agencies may impose new or enhanced standards, that would increase our costs, as well as expose us to risks associated with non-compliance. Over the last several years, the FDA has proposed reforms to its
36
510(k) clearance process, and such proposals could include increased requirements for clinical data and a longer review period, or could make it more difficult for manufacturers to utilize the 510(k) clearance process for their products. For example, in November 2018, FDA officials announced steps that the FDA intended to take to modernize the premarket notification pathway under Section 510(k) of the Federal Food, Drug, and Cosmetic Act. Among other things, the FDA announced that it planned to develop proposals to drive manufacturers utilizing the 510(k) pathway toward the use of newer predicates. These proposals included plans to potentially sunset certain older devices that were used as predicates under the 510(k) clearance pathway, and to potentially publish a list of devices that have been cleared on the basis of demonstrated substantial equivalence to predicate devices that are more than 10 years old. These proposals have not yet been finalized or adopted, although the FDA may work with Congress to implement such proposals through legislation. Accordingly, it is unclear the extent to which any proposals, if adopted, could impose additional regulatory requirements on us that could delay our ability to obtain new 510(k) clearances, increase the costs of compliance, restrict our ability to maintain our current clearances, or otherwise create competition that may negatively affect our business.
More recently, in September 2019, the FDA issued revised final guidance describing an optional “safety and performance based” premarket review pathway for manufacturers of “certain, well-understood device types” to demonstrate substantial equivalence under the 510(k) clearance pathway by showing that such device meets objective safety and performance criteria established by the FDA, thereby obviating the need for manufacturers to compare the safety and performance of their medical devices to specific predicate devices in the clearance process. The FDA maintains a list of device types appropriate for the “safety and performance based” pathway and continues to develop product-specific guidance documents that identify the performance criteria for each such device type, as well as recommended testing methods, where feasible. The FDA may establish performance criteria for classes of devices for which we or our competitors seek or currently have received clearance, and it is unclear the extent to which such performance standards, if established, could impact our ability to obtain new 510(k) clearances or otherwise create competition that may negatively affect our business.
In addition, the results of the 2020 U.S. Presidential Election may impact our business and industry. Namely, the former Trump administration took several executive actions, including the issuance of a number of Executive Orders, that could impose significant burdens on, or otherwise materially delay, the FDA’s ability to engage in routine oversight activities such as implementing statutes through rulemaking, issuance of guidance, and review and approval of marketing applications. It is difficult to predict whether or how these orders will be implemented, or whether they will be rescinded and replaced under the Biden administration. The policies and priorities of the new administration are unknown and could materially impact the regulations governing our products.
We are subject to extensive regulatory requirements in connection with the EUAs that we have received from the FDA for our COVID-19 antibody and antigen tests. If we fail to comply with these requirements, or if the FDA otherwise determines that the conditions no longer warrant such authorization, we will be unable to market our products pursuant to this authorization and our business may be harmed.
We have received emergency use authorizations (“EUAs”) from the FDA authorizing us to market our Anti-SARS-CoV-2 IgG Antibody test, Anti-SARS-CoV-2 Total Antibody test, SARS-CoV-2 Antigen test and related calibrators and controls on our VITROS analyzers. These EUAs allow us to market and sell our antibody tests to health care professionals for the detection of certain SARS-CoV-2 antibodies to aid in identifying individuals with an adaptive immune response to SARS-CoV-2 and, for our Antigen test, for the detection of acute infection of SARS-CoV-2, without the need to obtain premarket clearance or approval under the FDA’s standard review pathways, for the duration of the COVID-19 public health emergency. The FDA has also established certain conditions which must be met in order to maintain authorization under these EUAs. The requirements that apply to the manufacture and sale of these products may be unclear and are subject to change.
The FDA has the authority to issue an EUA during a public health emergency if it determines that based on the totality of the scientific evidence that it is reasonable to believe that the product may be effective, that the known and potential benefits of a product outweigh the known and potential risks, that there is no adequate, approved and available alternative and if other regulatory criteria are met. These standards for marketing authorization are lower than if the FDA had reviewed our test under its traditional marketing authorization pathways, and we cannot assure you that our test would be cleared or approved under those more onerous clearance and approval standards. Moreover, the FDA’s policies regarding EUAs can change unexpectedly, and the FDA may revoke an EUA where it determines that the underlying health emergency no longer exists or warrants such authorization or if problems are identified with the authorized product. We cannot predict how long our authorization will remain in place. FDA policies regarding diagnostic tests, therapies and other products used to diagnose, treat or mitigate COVID-19 remain in flux as the FDA responds to new and evolving public health information and clinical evidence. Changes to FDA regulations or requirements could require changes to our authorized tests, necessitate additional measures or make it impractical or impossible for us to market our test. The termination of an EUA for our products could adversely impact our business, financial condition and results of operations.
37
Disruptions at the FDA and other government agencies caused by funding shortages or global health concerns could hinder their ability to hire, retain or deploy key leadership and other personnel, or otherwise prevent new or modified products from being developed, cleared or approved or commercialized in a timely manner or at all, which could negatively impact our business.
The ability of the FDA to review and approve new products can be affected by a variety of factors, including government budget and funding levels, statutory, regulatory and policy changes, the FDA’s ability to hire and retain key personnel and accept the payment of user fees, and other events that may otherwise affect the FDA’s ability to perform routine functions. Average review times at the FDA have fluctuated in recent years as a result. In addition, government funding of other government agencies that fund research and development activities is subject to the political process, which is inherently fluid and unpredictable. Disruptions at the FDA and other agencies may also slow the time necessary for new medical devices and biologics or modifications to approved or cleared medical devices and biologics to be reviewed and/or cleared or approved by necessary government agencies, which would adversely affect our business. For example, over the last several years, including for 35 days beginning on December 22, 2018, the U.S. government has shut down several times and certain regulatory agencies, such as the FDA, have had to furlough critical employees and stop critical activities.
Separately, in response to the COVID-19 pandemic, on March 10, 2020, the FDA announced its intention to postpone most inspections of foreign manufacturing facilities and products, and on March 18, 2020, the FDA temporarily postponed routine surveillance inspections of domestic manufacturing facilities. Subsequently, on July 10, 2020, the FDA announced its intention to resume certain on-site inspections of domestic manufacturing facilities subject to a risk-based prioritization system. The FDA intends to use this risk-based assessment system to identify the categories of regulatory activity that can occur within a given geographic area, ranging from mission critical inspections to resumption of all regulatory activities. Regulatory authorities outside the United States may adopt similar restrictions or other policy measures in response to the COVID-19 pandemic. If a prolonged government shutdown occurs, or if global health concerns continue to prevent the FDA or other regulatory authorities from conducting their regular inspections, reviews or other regulatory activities, it could significantly impact the ability of the FDA or other regulatory authorities to timely review and process our regulatory submissions, which could have a material adverse effect on our business.
We may face business disruption and related risks resulting from former President Trump’s invocation of the Defense Production Act, which could have a material adverse effect on our business.
In response to the COVID-19 pandemic, former President Trump invoked the Defense Production Act, codified at 50 U.S.C. §§ 4501 et seq. (the “Defense Production Act”). Pursuant to the Defense Production Act, the federal government may, among other things, require domestic industries to provide essential goods and services needed for the national defense. While we have not experienced any impact on our business as a result of such actions, we continue to assess the potential impact that the invocation of the Defense Production Act may have on our ability to effectively conduct our business operations as planned, either as a result of becoming directly subject to the requirements of the Defense Production Act, our suppliers becoming so subject and diverting deliveries of raw materials elsewhere, or otherwise. There can be no assurance that we will not be impacted by any action taken by the federal government under the Defense Production Act, and any resulting disruption on our ability to conduct business could have a material adverse effect on our financial condition and results or operations.
We could incur costs complying with environmental and health and safety requirements, or as a result of liability for contamination or other potential environmental harm or liability caused by our operations.
Our operations and facilities are subject to various foreign, federal, state and local environmental, health and safety laws, rules, regulations and other requirements, including those governing the generation, use, manufacture, handling, transport, storage, treatment and disposal of, or exposure to, regulated materials, discharges and emissions to air and water, the cleanup of contamination and occupational health and safety matters. Noncompliance with these laws, rules, regulations and other requirements can result in fines or penalties or limitations on our operations or liability for remediation costs, as well as claims alleging personal injury, property, natural resource or environmental damages. We believe that our operations and facilities are operated in compliance in all material respects with existing environmental, health and safety requirements, including the operating permits required thereunder.
Our research and development and manufacturing processes involve the use of regulated materials subject to environmental, health and safety regulations. We may incur liability as a result of any contamination or injury arising from a release of or exposure to such regulated materials. Under some environmental laws and regulations, we could also be held responsible for costs relating to any contamination at our past or present facilities and at third-party disposal sites where we have sent wastes for treatment or disposal. Liability for contamination at contaminated sites may be imposed without regard to whether we knew of, or caused, the release or disposal of such regulated substances and, in some cases, liability may be joint or several. Any such future expenses or liability could have a negative impact on our financial condition and results of operations. The enactment of stricter laws or regulations, the stricter interpretation of existing laws and regulations or the requirement to undertake the investigation or remediation of currently unknown environmental contamination at our current or former facilities or at third-party sites where we have sent waste for treatment or disposal may require us to make additional expenditures or subject us to additional liability or claims.
In addition, our workers, properties and equipment may be exposed to potential operational hazards such as fires, process safety incidents, releases of regulated materials, malfunction of equipment, accidents and natural disasters, which could result in personal
38
injury or loss of life, damage to or destruction of property and equipment or environmental damage, and could potentially result in a suspension of operations, harm to our reputation and the imposition of civil or criminal fines or penalties, all of which could adversely affect our business. See “Business–Health, safety and environmental.”
We are subject to healthcare regulations that could result in liability, require us to change our business practices and restrict our operations in the future.
We are subject to healthcare fraud and abuse regulation and enforcement by both the federal government and the governments of states and foreign countries in which we conduct our business. In the United States, these healthcare laws and regulations include, for example:
|
|
• |
the federal Anti-Kickback Law, which prohibits, among other things, persons or entities from soliciting, receiving, offering or providing remuneration, directly or indirectly, where one purpose is to induce either the referral of an individual for, or the purchase order or recommendation of, any item or services for which payment may be made under a federal healthcare program such as the Medicare and Medicaid programs. Violations of the federal Anti-Kickback Statute may result in civil monetary penalties up to $100,000 for each violation, plus up to three times the remuneration involved. Civil penalties for such conduct can further be assessed under the federal False Claims Act. Violations can also result in criminal penalties, including criminal fines of up to $100,000 and imprisonment of up to ten years. Similarly, violations can result in exclusion from participation in government healthcare programs, including Medicare and Medicaid; |
|
|
• |
federal false claims laws, which prohibit, among other things, individuals or entities from knowingly presenting, or causing to be presented, claims for payment from Medicare, Medicaid, or other third-party payors that are false or fraudulent, and which may apply to entities like us to the extent that our interactions with customers may affect their billing or coding practices. When an entity is determined to have violated the federal civil False Claims Act, the government may impose civil fines and penalties for each false claim, plus treble damages, and exclude the entity from participation in Medicare, Medicaid and other federal healthcare programs; and |
|
|
• |
state law equivalents of each of the above federal laws, such as anti-kickback and false claims laws, which may apply to items or services reimbursed by any third-party payor, including commercial insurers. |
If our operations are found to be in violation of any of the laws described above, similar laws of the international jurisdictions in which we operate or any other governmental regulations that apply to us, we may be subject to penalties, including civil and criminal penalties, damages, fines, exclusion from the Medicare and Medicaid programs, corporate integrity agreements and the curtailment or restructuring of our operations. Any penalties, damages, fines, exclusions, curtailment or restructuring of our operations could adversely affect our ability to operate our business and our financial results. The risk of our being found in violation of these laws is increased by the fact that many of these laws are broad and their provisions are open to a variety of interpretations. Further, the Patient Protection and Affordable Care Act, as amended by the Health Care and Education Affordability Reconciliation Act (collectively, the “PPACA”), amends the intent requirement of the federal anti-kickback and criminal healthcare fraud statutes. A person or entity no longer needs to have actual knowledge of this statute or specific intent to violate it. In addition, the government or an individual acting on behalf of the government through a qui tam action may assert that a claim including items or services resulting from a violation of the federal anti-kickback statute constitutes a false or fraudulent claim for purposes of the false claims statutes. Any action against us for violation of these laws, even if we successfully defend against it, could cause us to incur significant legal expenses and divert our management’s attention from the operation of our business.
Further, the PPACA included provisions known as the Physician Payment Sunshine Act, which require certain applicable manufacturers of drugs, biologics, devices and medical supplies for which payment is available under a federal healthcare program such as Medicare, Medicaid or the Children’s Health Insurance Program to record and annually report to the Centers for Medicare and Medicaid Services (“CMS”) any transfers of value to U.S. physicians, certain other healthcare providers and U.S. teaching hospitals (or entities or individuals at the request of, or designated by U.S. physicians or teaching hospitals). Applicable manufacturers must also disclose ownership and investment interests held by physicians and their immediate family members. Beginning in 2022, applicable manufacturers will be required to report such information regarding payments and transfers of value provided, as well as ownership and investment interests held, during the previous year to physician assistants, nurse practitioners, clinical nurse specialists, certified nurse anesthetists and certified nurse-midwives. Failure to submit the required information may result in civil monetary penalties for any payments, transfers of value or ownership or investment interests that are not timely, accurately and completely reported in an annual submission, and may result in liability under other federal laws or regulations. Manufacturers are required to collect and report data annually to CMS by the ninetieth day of each calendar year. Several states in the United States have implemented similar reporting requirements, and an increasing number of countries worldwide either have adopted or are considering similar laws requiring transparency of interactions with healthcare professionals. These laws have imposed administrative costs and compliance burdens on us. If we are found to be in violation of any of these laws and other applicable state and country laws, we may be subject to penalties, including fines.
39
Our failure to comply with the anti-corruption laws of the United States and various international jurisdictions could negatively impact our reputation and results of operations.
Doing business on a worldwide basis requires us to comply with the laws and regulations of the U.S. government and those of various international and sub-national jurisdictions, and our failure to successfully comply with these rules and regulations may expose us to liabilities. These laws and regulations apply to companies, individual directors, officers, employees and agents, and may restrict our operations, trade practices, investment decisions and partnering activities. In particular, our international operations are subject to U.S. and foreign anti-corruption laws and regulations, such as the U.S. Foreign Corrupt Practices Act (the “FCPA”), as well as anti-corruption laws of the various jurisdictions in which we operate. The FCPA and other laws prohibit us, and our officers, directors, employees and agents acting on our behalf, from corruptly offering, promising, authorizing or providing anything of value to foreign officials or entities for the purposes of influencing official decisions or obtaining or retaining business or otherwise obtaining favorable treatment. As part of our business, we deal with state-owned business enterprises, the employees and representatives of which may be considered foreign officials for purposes of the FCPA. We are subject to the jurisdiction of various governments and regulatory agencies outside of the United States, which may bring our personnel into contact with foreign officials responsible for issuing or renewing permits, licenses or approvals or for enforcing other governmental regulations. In addition, some of the international locations in which we operate lack a developed legal system and have elevated levels of corruption. Our global operations expose us to the risk of violating, or being accused of violating, the foregoing or other anti-corruption laws, including similar anti-corruption laws, rules and regulations of the various jurisdictions in which we operate. Such violations could be punishable by criminal fines, imprisonment, civil penalties, disgorgement of profits, injunctions and debarment from government contracts, as well as other remedial measures. Investigations of alleged violations can be very expensive and disruptive. Additionally, we face a risk that our distributors and manufacturers may potentially violate the FCPA or similar laws, rules or regulations of the various jurisdictions in which we operate. Though these distributors and manufacturers are not our affiliated legal entities, such violations could expose us to FCPA liability or liabilities under similar laws of the various jurisdictions in which we operate and/or our reputation may potentially be harmed by the distributors and manufacturers’ violations and resulting sanctions and fines.
Our international operations require us to comply with anti-terrorism laws and regulations and applicable trade embargoes.
We are subject to trade and economic sanctions laws and other restrictions on international trade. The United States and other governments and their agencies impose sanctions and embargoes on certain countries, their governments and designated parties. In the United States, the economic and trade sanctions programs are principally administered and enforced by the U.S. Treasury Department’s Office of Foreign Assets Control (“OFAC”). Currently, OFAC maintains comprehensive trade and economic sanctions against the following countries and territories: Cuba, Iran, Syria, North Korea and the Crimea region of Ukraine. If we fail to comply with these laws, we could be subject to civil or criminal penalties, other remedial measures and legal expenses, which could adversely affect our business, financial condition and results of operations.
We cannot predict the nature, scope or effect of future regulatory requirements to which our international sales and manufacturing operations might be subject or the manner in which existing laws might be administered or interpreted. Future regulations could limit the countries in which some of our products may be manufactured or sold, or could restrict our access to, or increase the cost of obtaining, products from foreign sources. The occurrence of any of the foregoing could have a material adverse effect on our business, financial condition and results of operations.
Our collection, use and disclosure of personal information, including health information, is subject to federal and state privacy and security regulations, as well as data privacy and security laws outside the United States, including in the European Economic Area (the “EEA”) and the United Kingdom, and our failure to comply with those laws and regulations or to adequately secure the information we hold could result in significant liability or reputational harm.
The Health Insurance Portability and Accountability Act of 1996, as amended by the Health Information Technology for Economic and Clinical Health Act of 2009 and their implementing regulations (collectively referred to as “HIPAA”) as well as numerous other federal and state laws and regulations, govern the collection, dissemination, use, privacy, security, confidentiality, integrity and availability of personally identifiable information (“PII”), including protected health information (“PHI”). HIPAA applies national privacy and security standards for PHI to covered entities, including certain types of health care entities and their service providers that access PHI, known as business associates. HIPAA requires covered entities and business associates to maintain policies and procedures governing PHI that is used or disclosed, and to implement administrative, physical and technical safeguards to protect PHI, including PHI maintained, used and disclosed in electronic form. These safeguards include employee training, identifying business associates with whom covered entities need to enter into HIPAA-compliant contractual arrangements and various other measures. While we undertake substantial efforts to secure the PHI we maintain, use and disclose in electronic form, a cyber-attack or other intrusion that bypasses our information security systems causing an information security breach, loss of PHI, PII or other data subject to privacy laws or a material disruption of our operational systems could result in a material adverse impact on our business, along with potentially substantial fines and penalties. Ongoing implementation and oversight of these security measures involves significant time, effort and expense.
HIPAA requires covered entities and their business associates to report breaches of unsecured PHI to affected individuals without unreasonable delay and in no case later than 60 days after the discovery of the breach by the covered entity or its agents.
40
Notification must also be made to the U.S. Department of Health and Human Services (“HHS”) and, in certain situations involving large breaches, to the media. The HIPAA rules created a presumption that all non-permitted uses or disclosures of unsecured PHI are breaches unless the covered entity establishes that there is a low probability the information has been compromised. A data breach affecting sensitive personal information, including health information, also could result in significant legal and financial exposure and reputational damages that could potentially have an adverse effect on our business.
HIPAA also authorizes state attorneys general to bring civil actions seeking either an injunction or damages in response to violations of HIPAA privacy and security regulations that threaten the privacy of state residents. While HIPAA does not create a private right of action allowing individuals to sue us in civil court for violations of HIPAA’s requirements, its standards have been used as a basis for the duty of care in state civil suits, such as those for negligence or recklessness in the handling of PHI. In addition, HIPAA mandates that the Secretary of HHS conduct periodic compliance audits of covered entities and business associates.
In addition, many states in which we operate may impose laws that are more protective of the privacy and security of PII than HIPAA. Where these state laws are more protective than HIPAA, we may have to comply with their stricter provisions. Not only may some of these state laws impose fines and penalties upon violators, but some may afford private rights of action to individuals who believe their PII has been misused.
Both state and federal laws and regulations are subject to modification or enhancement of privacy and security protections at any time. Our business will continue to remain subject to any federal and state privacy-related laws and regulations that are more restrictive than the privacy regulations issued under HIPAA. Sweeping privacy measures in certain states such as the California Consumer Privacy Act impose European-like standards for the protection of personal data and allow for a private right of action. These statutes vary and could impose additional requirements on us and more severe penalties for disclosures of confidential health information. New health and consumer information standards could have a significant effect on the manner in which we do business, and the cost of complying with new standards could be significant. We may not remain in compliance with the diverse privacy and security requirements in all of the jurisdictions in which we do business. If we fail to comply with such state laws, we could incur substantial civil monetary or criminal penalties.
We are also subject to data privacy and security laws in jurisdictions outside of the United States. For example, in the EEA and the United Kingdom, we are subject to the General Data Protection Regulation 2016/679 (the “GDPR”), which could limit our ability to collect, control, process, share, disclose and otherwise use personal data (including health and medical information which are subject to strict requirements). Complying with the GDPR could cause our compliance costs to increase, ultimately having an adverse impact on our business. We are implementing measures to comply with these laws as part of our comprehensive compliance program with input from external advisors to address our compliance with these obligations under GDPR. Failure to comply with the GDPR may result in fines up to the greater of €20 million or 4% of total annual revenue. In addition to the foregoing, a breach of the GDPR could result in regulatory investigations, reputational damage, orders to cease or change our processing of our data, enforcement notices or assessment notices (for a compulsory audit). We may also face civil claims including representative actions and other class action type litigation (where individuals have suffered harm), potentially amounting to significant compensation or damages liabilities, as well as associated costs, diversion of internal resources and reputational harm. In addition, beginning in 2021 when the transitional period following Brexit expires, we will be required to comply with both the GDPR and the U.K. GDPR, with each regime having the ability to fine up to the greater of €20 million (in the case of the GDPR) or £17 million (in the case of the U.K. GDPR) and 4% of total annual revenue. The relationship between the United Kingdom and the European Union in relation to certain aspects of data protection law remains unclear including, for example, how data transfers between EU member states and the United Kingdom will be treated and the role of the Information Commissioner’s Office following the end of the transitional period. These changes could lead to additional costs and increase our overall risk exposure.
We are also subject to European Union rules with respect to cross-border transfers of personal data out of the EEA and the United Kingdom. Recent legal developments in Europe have created complexity and uncertainty regarding transfers of personal data from the EEA to the United States. For instance, on July 16, 2020, the Court of Justice of the European Union (the “CJEU”) invalidated the EU-U.S. Privacy Shield Framework (the “Privacy Shield”) under which personal data could be transferred from the EEA to U.S. entities who had self-certified under the Privacy Shield scheme.
While the CJEU did not invalidate standard contractual clauses (a standard form of contract approved by the European Commission as an adequate personal data transfer mechanism, and potential alternative to the Privacy Shield), it made clear that reliance on them alone may not necessarily be sufficient in all circumstances. We currently rely on the standard contractual clauses among other data transfer mechanisms allowed pursuant to the GDPR to transfer personal data outside the EEA or the United Kingdom, including to the United States. These recent developments will require us to review and consider amending the legal mechanisms by which we make and receive personal data transfers to the United States. As supervisory authorities issue further guidance on personal data export mechanisms, including circumstances where the standard contractual clauses cannot be used, and/or start taking enforcement action, we could suffer additional costs, complaints, regulatory investigations or fines, and if we are otherwise unable to transfer personal data
41
between and among countries and regions in which we operate, it could affect the manner in which we provide our services and the geographical location or segregation of our relevant systems and operations, which could adversely affect our financial results.
We depend on a number of third parties in relation to the operation of our business, a number of which process personal data on our behalf. With each such third party, we attempt to mitigate the associated risks of using third parties by performing applicable security assessments and detailed due diligence, entering into contractual arrangements to require that providers only process personal data according to our instructions, and that they have sufficient technical and organizational security measures in place. Where we transfer personal data outside the EEA or the United Kingdom to such third parties, we do so in compliance with the relevant data export requirements, as described above. There is no assurance that these contractual measures and our own privacy and security-related safeguards will fully protect us from the risks associated with the third-party processing. Any violation of data or security laws by our third party processors could have a material adverse effect on our business and result in the fines and penalties outlined below.
We are also subject to evolving privacy laws on cookies and e-marketing. In the European Union, regulators are increasingly focusing on compliance with requirements in the online behavioral advertising ecosystem, and current national laws that implement the ePrivacy Directive will be replaced by an EU regulation known as the ePrivacy Regulation which will significantly increase fines for non-compliance. While the text of the ePrivacy Regulation is still under development, a recent European court decision and regulators’ recent guidance are driving increased attention to cookies and tracking technologies. In the United States, the Federal Trade Commission and many state laws have increasingly focused on the collection and use of behavioral data including geolocation and biometric information. As regulators start to enforce a strict approach (which has already started in Germany), this could lead to substantial costs, require significant systems changes, limit the effectiveness of our marketing activities, divert the attention of our technology personnel, adversely affect our margins, increase costs and subject us to additional liabilities.
Recently many countries have enacted legislation to strengthen privacy laws to protect their residents’ personal data. Some countries’ laws have been modeled on GDPR, including fines and penalties such as Brazil’s enacted data protection law and similar pending legislation in Chile. We are currently monitoring the evolving data protection landscape so that we can comply with the requirements in the countries in which we do business.
Data compliance in other countries outside EEA, the United Kingdom and the United States are even more complex and varied making it difficult to comply with them all. China’s legislation and regulation of the health care industry involves multiple pieces of legislation prescribing complex regulatory requirements governing different types of data across a continuum of care, and various supervisory authorities frequently conduct inspections and investigations. Any collection, use, transfer and storage of personal information of a Chinese citizen should be based on the three principles of China’s Cybersecurity Law (legitimacy, justification and necessity) and requires the consent of the data subject. The rules, purposes, methods and ranges of such collection should also be disclosed to the data subject. China’s data localization requirements are expensive for multinational companies as they have strict requirements regarding storage of health care data including big data and human genetic information in local, secured and trusted servers.
Risks related to our information technology and intellectual property
Our data management and information technology systems are critical to maintaining and growing our business.
Our business is dependent on the effective use of information technology and, consequently, technology failure or obsolescence may negatively impact our business. In addition, data acquisition, data quality control, data privacy, data security and data analysis are intense and complex processes subject to error. Untimely, incomplete or inaccurate data, flawed analysis of data or our inability to properly integrate, implement, protect and update systems could have a material adverse impact on our business and results of operations. We expect that we will need to continue to improve and further integrate our information technology systems on an ongoing basis in order to effectively run our business. If we fail to successfully manage our information technology systems, our business and operating results could be adversely affected.
Our ability to protect our information systems and electronic transmissions of sensitive data from data corruption, cyber-based attacks, security breaches or privacy violations is critical to the success of our business.
We are highly dependent on information technology networks and systems, including our office networks, operational environment, special purpose networks, systems and software used to operate our instruments and devices and those networks and systems managed by vendors or third parties, to securely process, transmit and store electronic information (including sensitive data such as trade secrets, confidential business information and personally identifiable data relating to employees, customers and business partners). Like any large corporation, from time to time the information systems on which we rely, including those controlled and managed by third-parties, may be subject to computer viruses, malicious software, attacks by hackers and other forms of cyber intrusions or unauthorized access, any of which can create system disruptions, shutdowns or unauthorized disclosure of sensitive data. In addition, a security breach that leads to disclosure of information protected by privacy laws (including PII or PHI) could compel us to comply with breach notification requirements under U.S. state laws and HIPAA regulations or other local country government requirements
42
outside the United States, potentially resulting in litigation or regulatory action, or otherwise subjecting us to liability under laws that protect personal data.
If we experience a significant technology incident, such as a serious product vulnerability, security breach or a failure of a system that is critical for the operations of our business, it could impair our ability to operate our business, including our ability to provide maintenance and support services to our customers. If this happens, our revenues could decline and our business could suffer, and we may need to make significant further investments to protect data and infrastructure. An actual or perceived vulnerability, failure, disruption or breach of our network or privileged account security in our systems also could adversely affect the market perception of our products and services, as well as our perception among new and existing customers. Additionally, a significant security breach could subject us to potential liability, litigation and regulatory or other government action. If any of the foregoing were to occur, our business may suffer.
We attempt to mitigate the above risks by employing a number of measures, including monitoring and testing of our security controls, employee training and maintenance of protective systems and contingency plans. Further, our contractual arrangements with service providers aim to ensure that third-party cybersecurity risks are appropriately mitigated. We also maintain insurance relating to cybersecurity incidents, which we cannot guarantee will be adequate. It is impossible to eliminate all cybersecurity risk and thus our systems, products and services, as well as those of our service providers, remain potentially vulnerable to known or unknown threats. Additionally, our information technology systems may also be vulnerable to damage or interruption from circumstances beyond our control, including fire, natural disasters, power outages and system failures. Any system outages or security breaches, whether caused intentionally or unintentionally, can interrupt our operations, delay production and shipments, result in theft of trade secrets and intellectual property, damage our reputation, result in defective products or services, give rise to legal proceedings, liabilities and penalties, and cause us to incur increased costs for insurance premiums, security, remediation, and regulatory compliance.
Information security risks have generally increased in recent years because of the increased proliferation, sophistication and availability of complex malware and hacking tools to carry out cyber-attacks. As cyber threats continue to evolve, we may be required to expend additional resources to mitigate new and emerging threats while continuing to enhance our information security capabilities or to investigate and remediate security vulnerabilities.
In addition, the interpretation and application of data protection and security laws in the United States, Europe and elsewhere are often uncertain, contradictory and in flux. For instance, California enacted the California Consumer Privacy Act (“CCPA”) on June 28, 2018, which went into effect on January 1, 2020. The CCPA, among other things, creates new data privacy obligations for covered companies and provides new privacy rights to California residents, including the right to opt out of certain disclosures of their information. The CCPA also creates a private right of action with statutory damages of up to $7,500 per person for certain data breaches which is expected to increase data breach litigation as well as the privacy and security obligations of entities handling certain personal data. The CCPA may increase our compliance costs and potential liability, and many similar laws have been proposed at the federal level and in other states. Further, the European Union enacted stricter data protection laws under the GDPR, which took effect in May 2018 and replaced Directive 95/46/EC. The obligations under the GDPR may conflict with the requirements of privacy laws and regulations in other jurisdictions and our practices relating to personal data may differ globally in response to local requirements. This may result in government-imposed fines or orders requiring that we change our data practices, which could have an adverse effect on our business. Complying with these various laws could cause us to incur substantial costs or require us to change our business practices in a manner adverse to our business.
Our inability to protect and enforce our intellectual property rights could adversely affect our financial results.
Intellectual property rights both in the United States and in foreign countries, including patents, trade secrets, proprietary information, trademarks and trade names, are important to our business and will be critical to our ability to grow and succeed in the future. We make strategic decisions on whether to apply for intellectual property protection and what kind of protection to pursue based on a cost-benefit analysis. While we endeavor to protect our intellectual property rights in certain jurisdictions in which our products are produced or used and in jurisdictions into which our products are imported, the decision to file for intellectual property protection is made on a case-by-case basis. Because of the differences in foreign trademark, patent and other laws concerning proprietary rights, our intellectual property rights may not receive the same degree of protection in foreign countries as they would in the United States. Additionally, certain of our intellectual property rights are held through our license agreements and collaboration arrangements with third parties. Because of the nature of these licenses and arrangements, we cannot assure you that we would be able to retain all of these intellectual property rights upon termination of such licenses and collaboration arrangements. Our failure to obtain or maintain adequate protection of our intellectual property rights for any reason could have a material adverse effect on our business, results of operations and financial condition.
We have applied for patent protection relating to certain existing and proposed products, processes and services in certain jurisdictions. While we generally consider applying for patents in those countries where we intend to make, have made, use or sell patented products, we may not accurately assess all of the countries where patent protection will ultimately be desirable. If we fail to
43
timely file a patent application in any such country, we may be precluded from doing so at a later date. Furthermore, we cannot assure you that our pending patent applications will not be challenged by third parties or that such applications will eventually be issued by the applicable patent offices as patents. We also cannot assure you that the patents issued as a result of our foreign patent applications will have the same scope of coverage as our U.S. patents. It is possible that only a limited number of the pending patent applications will result in issued patents, which may have a materially adverse effect on our business and results of operations.
The patents we own could be challenged, invalidated or circumvented by others and may not be of sufficient scope or strength to provide us with any meaningful protection or commercial advantage. Furthermore, our existing patents are subject to challenges from third parties which may result in invalidations and will all eventually expire, after which we will not be able to prevent our competitors from using our previously patented technologies, which could materially adversely affect our competitive advantage stemming from those products and technologies. We also cannot assure you that competitors will not infringe our patents, or that we will have adequate resources to enforce our patents.
We also license third parties to use our patents and know-how. In an effort to preserve our intellectual property rights, we enter into license agreements with these third parties, which govern the use of our patents, know-how and other confidential, proprietary information. Although we make efforts to police the use of our intellectual property by our licensees, we cannot assure you that these efforts will be sufficient to ensure that our licensees abide by the terms of their licenses. In the event that our licensees fail to do so, our intellectual rights could be impaired.
We also rely on unpatented proprietary technology. It is possible that others will independently develop the same or similar technology or otherwise obtain access to our unpatented technology. To protect our trade secrets and other proprietary information, we require certain employees, consultants, advisors and collaborators to enter into confidentiality agreements as we deem appropriate. We cannot assure you that we will be able to enter into these confidentiality agreements or that these agreements will provide meaningful protection for our trade secrets, know-how or other proprietary information in the event of any unauthorized use, misappropriation or disclosure of such trade secrets, know-how or other proprietary information. If we are unable to maintain the proprietary nature of our technologies, we could be materially adversely affected.
We rely on our trademarks, trade names and brand names to distinguish our products from the products of our competitors, and have registered or applied to register many of these trademarks. We cannot assure you that our trademark applications will be approved. Third parties may also oppose our trademark applications, or otherwise challenge our use of the trademarks. In the event that our trademarks are successfully challenged, we could be forced to rebrand our products, which could result in loss of brand recognition, and could require us to devote resources to advertising and marketing new brands. Further, we cannot assure you that competitors will not infringe our trademarks, or that we will have adequate resources to enforce our trademarks.
Risks related to taxation
Legislative or taxation changes or HMRC enforcement actions may have a material adverse impact on our business, results of operations and financial condition.
We are subject to the laws of England and Wales and the taxation rules administered by HM Revenue & Customs (“HMRC”) and we are required to certify to HMRC that we have appropriate tax accounting arrangements in place. Changes in legislation or regulations and actions by regulators, including changes in administration and enforcement policies, could from time to time require operational improvements or modifications, the conduct of reviews and audits or the cessation of certain business practices or income streams that could result in higher costs or restrict our ability to operate our business and, as a result, have a material adverse effect on our business, results of operations and financial condition. HMRC may also take enforcement actions against us which may result in fines, penalties and/or interest charges being imposed on us which may have a material adverse effect on our business, results of operations and financial condition.
If we are classified as a passive foreign investment company for U.S. federal income tax purposes, U.S. Holders may incur adverse tax consequences.
Based on the nature and composition of our income, assets and operations and the income, assets and operations of our subsidiaries, we do not believe that we are currently a passive foreign investment company for U.S. federal income tax purposes (a “PFIC”), and we do not expect to be a PFIC in the foreseeable future. However, this is a factual determination that depends on, among other things, the nature and composition of our income and assets, and the market value of our shares and assets, including the nature and composition of income and assets and the market value of shares and assets of our subsidiaries, from time to time, and thus the determination can only be made annually after the close of each taxable year. Therefore, no assurance can be given that we will not be classified as a PFIC for the current taxable year or any future taxable year.
If we are considered a PFIC at any time that a U.S. Holder (as defined under “Material tax considerations—Material U.S. federal income tax considerations”) holds the ordinary shares, U.S. Holders may suffer material adverse tax consequences, including with respect to any “excess distribution” received from us and any gain from a sale or other taxable disposition of the ordinary shares.
44
Certain elections may be available that would result in alternative treatments (such as qualified electing fund treatment or mark-to-market treatment) of our ordinary shares if we are considered a PFIC. We do not intend to provide the information necessary for U.S. Holders of our ordinary shares to make qualified electing fund elections, which, if available, would result in tax treatment different from the general tax treatment for an investment in a PFIC described above. If we are treated as a PFIC with respect to a U.S. Holder for any taxable year, the U.S. Holder will be deemed to own shares in any of our subsidiaries that are also PFICs. However, an election for mark-to-market treatment would likely not be available with respect to any such subsidiaries.
U.S. Holders should consult their tax advisors about the potential application of the PFIC rules to an investment in the ordinary shares and the potential consequences related thereto. See “Material tax considerations—Material U.S. federal income tax considerations—Taxation of disposition of the ordinary shares—Passive foreign investment company rules.”
If a United States person is treated as owning at least 10% of our ordinary shares, such holder may be subject to adverse U.S. federal income tax consequences.
If a United States person is treated as owning (directly, indirectly, or constructively) at least 10% of the value or voting power of our ordinary shares, such person may be treated as a “United States shareholder” with respect to each “controlled foreign corporation” in our group. Because our group includes U.S. subsidiaries, certain of our non-U.S. subsidiaries could be treated as controlled foreign corporations (regardless of whether or not UK Holdco is treated as a controlled foreign corporation). A United States shareholder of a controlled foreign corporation may be required to report annually and include in its U.S. taxable income its pro rata share of “Subpart F income,” “global intangible low-taxed income,” and investments in U.S. property by controlled foreign corporations, regardless of whether we make any distributions. An individual that is a United States shareholder with respect to a controlled foreign corporation generally would not be allowed certain tax deductions or foreign tax credits that would be allowed to a United States shareholder that is a U.S. corporation. Failure to comply with these reporting obligations may subject a United States shareholder to significant monetary penalties and may prevent the statute of limitations with respect to such shareholder’s U.S. federal income tax return for the year for which reporting was due from starting. We cannot provide any assurances that we will assist investors in determining whether we are or any of our non-U.S. subsidiaries is treated as a controlled foreign corporation or whether any investor is treated as a United States shareholder with respect to any such controlled foreign corporation or furnish to any United States shareholders information that may be necessary to comply with the aforementioned reporting and tax paying obligations. A U.S. investor should consult its advisors regarding the potential application of these rules to an investment in our ordinary shares.
Changes in our tax rates or exposure to additional tax liabilities or assessments could affect our profitability, and audits by tax authorities could result in additional tax payments for prior periods.
We are affected by various U.S. and non-U.S. taxes, including direct and indirect taxes imposed on our global activities, such as corporate income, withholding, customs, excise, value-added, sales and other taxes. Significant judgment is required in determining our provisions for taxes, and there are many transactions and calculations where the ultimate tax determination is uncertain.
The amount of income tax we pay is subject to ongoing audits by U.S. federal, state and local tax authorities and by non-U.S. tax authorities. If audits result in payments or assessments different from our reserves, our future results may include unfavorable adjustments to our tax liabilities, and our financial statements could be adversely affected. Any significant changes to the tax system in the United States or in other jurisdictions could adversely affect our business, financial condition and results of operations.
Our ability to use our net operating loss carry forwards to offset future taxable income may be subject to certain limitations and we could be subject to tax audits or examinations that could result in a loss of our net operating losses and/or cash tax exposures.
As of January 3, 2021, we had net operating loss carryforwards (“NOLs”) of approximately $830 million in the United States (this amount reflects the impact of the Coronavirus, Aid, Relief and Security Act (“CARES Act”), which was enacted on March 27, 2020) and approximately $450 million in Luxembourg due to prior period losses. In addition, we had approximately $405 million of U.S. carryforward interest expense and approximately $173 million of Luxembourg carryforward interest expense as of January 3, 2021. Certain of these carryforwards, if not utilized, will begin to expire through 2037. Realization of these carryforwards depends on future income, and there is a risk that our existing carryforwards could expire unused and be unavailable to offset future income tax liabilities, which could adversely affect our cash flows.
In general, under Section 382 of the Internal Revenue Code of 1986, as amended (the “Code”), a corporation that undergoes an “ownership change” is subject to limitations on its ability to utilize its NOLs to offset future taxable income. Our IPO, as well as future changes in our stock ownership, could result in an ownership change under Section 382 of the Code. Our NOLs may also be impaired under state laws. There is also a risk that due to regulatory changes, or other unforeseen reasons, our existing NOLs could expire or otherwise be unavailable to offset future income tax liabilities. Furthermore, any available NOLs would have value only to the extent there is income in the future against which such NOLs may be offset. For these reasons, we may not be able to realize a tax benefit from the use of our NOLs, whether or not we attain profitability.
45
We are periodically subject to audits or examinations by taxing authorities, and in certain significant jurisdictions where we conduct business, the years that remain open under tax audit go back to tax year 2013. We are currently in the early stages of responding to an inquiry from taxing authorities in Luxembourg relating to certain intercompany transactions. If any such audits or examinations are resolved in a manner that is unfavorable to us, it could potentially result in a loss of NOLs and/or cash tax exposures, which could adversely affect our cash flows.
Risks associated with our indebtedness
Our substantial indebtedness could adversely affect our financial condition, limit our ability to raise additional capital to fund our operations and prevent us from fulfilling our obligations under our indebtedness.
We have a significant amount of indebtedness. As a result of our substantial indebtedness, a significant amount of our cash flows will be required to pay interest and principal on our outstanding indebtedness, and we may not generate sufficient cash flows from operations, or have future borrowings available under the Revolving Credit Facility, to enable us to repay our indebtedness or to fund our other liquidity needs. As of January 3, 2021, we had total indebtedness of $3,770.7 million and we had availability under our Revolving Credit Facility of $312.5 million (net of $37.5 million of outstanding letters of credit) and no availability under our three-year accounts receivable program (the “Financing Program”).
Subject to the limits contained in the Credit Agreement, the 2028 Notes Indenture, the 2025 Notes Indenture, the Financing Program and our other debt instruments, we may incur substantial additional debt from time to time to finance working capital, capital expenditures, investments or acquisitions, or for other purposes. If we do so, the risks related to our high level of debt would increase. Specifically, our high level of debt could have important consequences to you, including:
|
|
• |
making it more difficult for us to satisfy our obligations with respect to our debt, and if we fail to comply with these obligations, an event of default could result; |
|
|
• |
limiting our ability to obtain additional financing to fund future working capital, capital expenditures, investments or acquisitions or other general corporate requirements; |
|
|
• |
requiring a substantial portion of our cash flows to be dedicated to debt service payments instead of other purposes, thereby reducing the amount of cash flows available for working capital, capital expenditures, investments or acquisitions and other general corporate purposes; |
|
|
• |
increasing our vulnerability to general adverse economic and industry conditions; |
|
|
• |
exposing us to the risk of increased interest rates as certain of our borrowings, including borrowings under the Senior Secured Credit Facilities, are at variable rates of interest; |
|
|
• |
limiting our flexibility in planning for and reacting to changes in the industry in which we compete and to changing business and economic conditions; |
|
|
• |
restricting us from making strategic acquisitions or causing us to make non-strategic divestitures; |
|
|
• |
impairing our ability to obtain additional financing in the future; |
|
|
• |
preventing us from raising the funds necessary to repurchase all Senior Notes tendered to us upon the occurrence of certain changes of control, which failure to repurchase would constitute an event of default under the 2025 Notes Indenture or the 2028 Notes Indenture; |
|
|
• |
placing us at a disadvantage compared to other, less leveraged competitors and affecting our ability to compete; and |
|
|
• |
increasing our cost of borrowing. |
The occurrence of any one of these events could have a material adverse effect on our business, financial condition, results of operations and ability to satisfy our obligations in respect of our outstanding debt.
Furthermore, borrowings under our Senior Secured Credit Facilities are at variable rates of interest and expose us to interest rate risk. Recent interest rates have been at historically low levels. If interest rates increase, our debt service obligations on the variable rate indebtedness will increase even though the amount borrowed may remain the same, and our net income and cash flows, including cash available for servicing our indebtedness, will correspondingly decrease. As of January 3, 2021, $2,185.5 million in aggregate principal amount of indebtedness under our Term Loan Facilities is subject to variable interest rates subject to the London interbank offered rate (“LIBOR”). Assuming no prepayments of our Term Loan Facilities and that our Revolving Credit Facility is fully drawn (and to the extent that the LIBOR is in excess of the 0.00% floor rate applicable to our Senior Secured Credit Facilities), each one-eighth
46
percent change in interest rates, prior to the impact of derivative instruments, would result in a $3.7 million change in annual interest expense on the indebtedness under our Senior Secured Credit Facilities. In addition, certain of our variable rate indebtedness uses LIBOR as a benchmark for establishing the rate. LIBOR is the subject of recent national, international and other regulatory guidance and proposals for reform. These reforms and other pressures may cause LIBOR to disappear entirely or to perform differently than in the past. The consequences of these developments cannot be entirely predicted, but could include an increase in the cost of our variable rate indebtedness. We have entered into a series of interest rate cap and interest rate swap agreements to hedge our interest rate exposures related to our variable rate borrowings under the Senior Secured Credit Facilities. However, it is possible that these interest rate cap and interest rate swap agreements or any future interest rate cap agreements or swaps we enter into may not fully or effectively mitigate our interest rate risk and we may decide not to maintain interest rate swaps in the future.
In addition, amounts drawn under our Senior Secured Credit Facilities may bear interest rates in relation to LIBOR, depending on our selection of repayment options. On July 27, 2017, the Financial Conduct Authority in the U.K. announced that it would phase out LIBOR as a benchmark by the end of 2021. It is unclear whether new methods of calculating LIBOR will be established such that it continues to exist after 2021. The U.S. Federal Reserve is considering replacing U.S. dollar LIBOR with a newly created index called the Broad Treasury Financing Rate, calculated with a broad set of short-term repurchase agreements backed by treasury securities. If LIBOR ceases to exist, we may need to renegotiate certain provisions of our Senior Secured Credit Facilities and may not be able to do so with terms that are favorable to us. The overall financing market may be disrupted as a result of the phase-out or replacement of LIBOR. Disruption in the financial market or the inability to renegotiate our Senior Secured Credit Facilities with favorable terms could have a material adverse effect on our business, financial position, operating results and cash flows.
We may not be able to generate sufficient cash flows from operating activities to service all of our indebtedness, and may be forced to take other actions to satisfy our obligations under our indebtedness, which may not be successful.
Our inability to generate sufficient cash flows to satisfy our debt obligations, or to refinance our indebtedness on commercially reasonable terms or at all, would materially and adversely affect our business, financial position and results of operations and our ability to satisfy our debt obligations.
Additionally, if we cannot make scheduled payments on our debt we will be in default, and holders of the Senior Notes could declare all outstanding principal and interest to be due and payable, the lenders under the Senior Secured Credit Facilities could terminate their commitments to loan additional money to us, the lenders could foreclose against the assets securing their borrowings and we could be forced into bankruptcy or liquidation. All of these events could result in your losing all or a part of your investment.
Our ability to make scheduled payments on or refinance our debt obligations depends on our financial condition and operating performance, which are subject to prevailing economic and competitive conditions and to financial, business, legislative, regulatory and other factors beyond our control. We might not be able to maintain a level of cash flows from operating activities sufficient to permit us to pay the principal, premium, if any, and interest on our indebtedness.
If our cash flows and capital resources are insufficient to fund our debt service obligations, we could face substantial liquidity problems and could be forced to reduce or delay investments and capital expenditures or to dispose of material assets or operations, seek additional debt or equity capital or restructure or refinance our indebtedness. In addition, our cash flows may be negatively impacted if we are required to pay back borrowing under the Financing Program sooner than anticipated if there is a reduction in the borrowing base. We may not be able to effect any such alternative measures on commercially reasonable terms or at all and, even if successful, those alternative actions may not allow us to meet our scheduled debt service obligations. The Credit Agreement, the 2025 Notes Indenture and the 2028 Notes Indenture restrict our ability to dispose of assets and use the proceeds from such dispositions and may also restrict our ability to raise debt or equity capital to be used to repay other indebtedness when it becomes due. Because of these restrictions, we may not be able to consummate those dispositions or to obtain proceeds in an amount sufficient to meet any debt service obligations then due.
In addition, we conduct substantially all of our operations through our subsidiaries, some of which are not guarantors of our indebtedness. Accordingly, repayment of our indebtedness is dependent on the generation of cash flows by our subsidiaries and their ability to make such cash available to us, by dividend, debt repayment or otherwise. Unless they are guarantors of our indebtedness, our subsidiaries do not have any obligation to pay amounts due on our indebtedness or to make funds available for that purpose. Our subsidiaries may not be able to, or may not be permitted to, make distributions to enable us to make payments in respect of our indebtedness. Each subsidiary is a distinct legal entity, and, under certain circumstances, legal and contractual restrictions may limit our ability to obtain cash from our subsidiaries. While the Credit Agreement, the 2025 Notes Indenture and the 2028 Notes Indenture limit the ability of our subsidiaries to incur consensual restrictions on their ability to pay dividends or make other intercompany payments to us, these limitations are subject to qualifications and exceptions. In the event that we do not receive distributions from our subsidiaries, we may be unable to make required principal and interest payments on our indebtedness.
47
The terms of the Credit Agreement, the 2025 Notes Indenture and the 2028 Notes Indenture impose restrictions that may limit our current and future operating flexibility, particularly our ability to respond to changes in the economy or our industry or to take certain actions, which could harm our long-term interests and may limit our ability to make payments on our indebtedness.
The Credit Agreement, the 2025 Notes Indenture and the 2028 Notes Indenture contain a number of restrictive covenants that impose significant operating and financial restrictions on us and may limit our ability to engage in acts that may be in our long-term best interest, including restrictions on our ability, and the ability of our subsidiaries, to:
|
|
• |
incur additional indebtedness and guarantee indebtedness; |
|
|
• |
pay dividends or make other distributions in respect of, or repurchase or redeem, capital stock; |
|
|
• |
prepay, redeem or repurchase certain indebtedness; |
|
|
• |
make loans and investments; |
|
|
• |
sell, transfer or otherwise dispose of assets; |
|
|
• |
incur liens; |
|
|
• |
enter into transactions with affiliates; |
|
|
• |
enter into new lines of business or alter the businesses we conduct; |
|
|
• |
designate any of our subsidiaries as unrestricted subsidiaries; |
|
|
• |
enter into agreements restricting our subsidiaries’ ability to pay dividends; and |
|
|
• |
consolidate, merge, transfer or sell all or substantially all of our assets or the assets of our subsidiaries. |
As a result of all of these restrictions, we may be:
|
|
• |
limited in how we conduct our business; |
|
|
• |
unable to raise additional debt or equity financing to operate during general economic or business downturns; or |
|
|
• |
unable to compete effectively or to take advantage of new business opportunities. |
These restrictions might hinder our ability to grow in accordance with our strategy.
While we believe that they have not historically done so, these covenants could materially and adversely affect our ability to finance our future operations or capital needs. Furthermore, they may restrict our ability to expand, pursue our business strategies and otherwise conduct our business. Our ability to comply with these covenants may be affected by circumstances and events beyond our control, such as prevailing economic conditions and changes in regulations, and we cannot assure you that we will be able to comply with such covenants. These restrictions also limit our ability to obtain future financings to withstand a future downturn in our business or the economy in general. In addition, complying with these covenants may also cause us to take actions that are not favorable to holders of our ordinary shares and may make it more difficult for us to successfully execute our business strategy and compete against companies that are not subject to such restrictions.
In addition, the financial covenant in the Credit Agreement requires the maintenance of a maximum first lien leverage ratio, which ratio will be tested at the end of any quarter when borrowings under the Revolving Credit Facility (including swingline loans and any unreimbursed drawings under any letters of credit to the extent not cash-collateralized but excluding any guarantees and performance or similar bonds issued under our Revolving Credit Facility) exceed $105 million at such date. As of January 3, 2021, we had no borrowings outstanding under the Revolving Credit Facility and were therefore not subject to the financial covenant. Due to the current economic and business uncertainty resulting from the ongoing COVID-19 pandemic, we anticipate that we will maintain increased cash on hand in order to preserve financial flexibility and that, as a result, we may continue to borrow from our Revolving Credit Facility, if needed. Our ability to meet the financial covenant could be affected by events beyond our control.
A breach of the covenants under the Credit Agreement, the 2025 Notes Indenture or the 2028 Notes Indenture could result in an event of default under the applicable indebtedness. Such a default, if not cured or waived, may allow the creditors to accelerate the related debt and may result in the acceleration of any other debt that is subject to an applicable cross-acceleration or cross-default provision. In addition, an event of default under the Credit Agreement would permit the lenders under our Senior Secured Credit
48
Facilities to terminate all commitments to extend further credit under the facilities. Furthermore, if we were unable to repay the amounts due and payable under our Senior Secured Credit Facilities, those lenders could proceed against the collateral securing such indebtedness. In the event our lenders or holders of the Senior Notes accelerate the repayment of our borrowings, we and our subsidiaries may not have sufficient assets to repay that indebtedness.
Despite our level of indebtedness, we and our subsidiaries may still incur substantially more debt. This could further exacerbate the risks to our financial condition described above and impair our ability to operate our business.
We and our subsidiaries may incur significant additional indebtedness in the future. Although the Credit Agreement, the 2025 Notes Indenture and the 2028 Notes Indenture contain restrictions on the incurrence of additional indebtedness, these restrictions are subject to a number of qualifications and exceptions, including with respect to our ability to incur additional senior secured debt. The additional indebtedness we may incur in compliance with these restrictions could be substantial. These restrictions also will not prevent us from incurring obligations that do not constitute indebtedness. In addition, as of January 3, 2021, our Revolving Credit Facility provides for unused commitments of $312.5 million (net of $37.5 million of outstanding letters of credit). Additionally, our Senior Secured Credit Facilities may be increased by an amount equal to (x) a dollar amount of $375.0 million (which amount was utilized in connection with our incurrence of the Euro Term Loan Facility), plus (y) an unlimited amount so long as on a pro forma basis our consolidated first lien total debt ratio (as set forth in the Credit Agreement) does not exceed 4.00 to 1.00 plus (z) an amount equal to all voluntary prepayments of term loans borrowed under the Credit Agreement and revolving loans under the Credit Agreement to the extent accompanied by a permanent reduction in the commitments therefor, subject to certain conditions. On February 9, 2021, we increased our Revolving Credit Facility by $150.0 million to an aggregate principal amount of $500.0 million. If new debt is added to our current debt levels, the related risks that we now face would increase.
Risks related to ownership of our ordinary shares
Our share price may change significantly, and you may not be able to resell our ordinary shares at or above the price you paid or at all, and you could lose all or part of your investment as a result.
The trading price of our ordinary shares is likely to be volatile. The stock market has experienced extreme volatility. This volatility often has been unrelated or disproportionate to the operating performance of particular companies. Factors that could cause fluctuations in the trading price of our ordinary shares include the risk factors described herein as well as the following:
|
|
• |
results of operations that vary from the expectations of securities analysts and investors; |
|
|
• |
results of operations that vary from those of our competitors; |
|
|
• |
changes in expectations as to our future financial performance, including financial estimates and investment recommendations by securities analysts and investors; |
|
|
• |
declines in the market prices of stocks generally; |
|
|
• |
strategic actions by us or our competitors; |
|
|
• |
announcements by us or our competitors of significant contracts, new products, acquisitions, joint marketing relationships, joint ventures, other strategic relationships or capital commitments; |
|
|
• |
changes in general economic or market conditions or trends in our industry or markets; |
|
|
• |
changes in business or regulatory conditions; |
|
|
• |
additions or departures of key management personnel; |
|
|
• |
future sales of our ordinary shares or other securities by us or our existing shareholders, or the perception of such future sales; |
|
|
• |
investor perceptions of the investment opportunity associated with our ordinary shares relative to other investment alternatives; |
|
|
• |
the public’s response to press releases or other public announcements by us or third parties, including our filings with the SEC; |
|
|
• |
announcements relating to litigation; |
|
|
• |
guidance, if any, that we provide to the public, any changes in this guidance or our failure to meet this guidance; |
|
|
• |
the development and sustainability of an active trading market for our ordinary shares; |
49
|
|
• |
other events or factors, including those resulting from natural disasters, war, acts of terrorism or responses to these events. |
These broad market and industry fluctuations may materially adversely affect the market price of our ordinary shares, regardless of our actual operating performance. In addition, price volatility may be greater if the public float and trading volume of our ordinary shares are low.
In the past, following periods of market volatility, shareholders have instituted securities class action litigation. If we were involved in securities litigation, it could have a substantial cost and divert resources and the attention of executive management from our business regardless of the outcome of such litigation.
Our quarterly operating results fluctuate and may fall short of prior periods, our projections or the expectations of securities analysts or investors, which could materially adversely affect the price of our ordinary shares.
Our operating results have fluctuated from quarter to quarter at points in the past, and they may do so in the future. Therefore, results of any one fiscal quarter are not a reliable indication of results to be expected for any other fiscal quarter or for any year. If we fail to increase our results over prior periods, to achieve our projected results or to meet the expectations of securities analysts or investors, the price of our ordinary shares may decline, and the decrease in the price of our ordinary shares may be disproportionate to the shortfall in our financial performance. Results may be affected by various factors, including those described in these risk factors. We maintain a forecasting process that seeks to align expenses to backlog conversion. If we do not control costs or appropriately adjust costs to actual results, or if actual results differ significantly from our forecast, our financial performance could be materially adversely affected.
We are a holding company with no operations and may not have access to sufficient cash to meet our financial obligations.
We are a holding company and have limited direct operations. Our most significant assets are the equity interests we directly and indirectly hold in our subsidiaries. As a result, we are dependent upon dividends and other payments from our subsidiaries to generate the funds necessary to meet our outstanding debt service and other obligations and such dividends may be restricted by law or the instruments governing our indebtedness, including the Credit Agreement, the 2028 Notes Indenture, the 2025 Notes Indenture or other agreements of our subsidiaries. Our subsidiaries may not generate sufficient cash from operations to enable us to meet our financial obligations. In addition, our subsidiaries are separate and distinct legal entities and may be legally or contractually prohibited or restricted from paying dividends or otherwise making funds available to us. In addition, payments to us by our subsidiaries will be contingent upon our subsidiaries’ earnings. Additionally, we may be limited in our ability to cause any future collaborative arrangements under which our subsidiaries distribute their earnings to us. Subject to certain qualifications, our subsidiaries are permitted, under the terms of our indebtedness, to incur additional indebtedness that may restrict payments from those subsidiaries to us. We cannot assure you that agreements governing the current and future indebtedness of our subsidiaries will permit those subsidiaries to provide us with sufficient cash to fund our financial obligations.
We currently do not intend to declare dividends on our ordinary shares in the foreseeable future and, as a result, your only opportunity to achieve a return on your investment is if the price of our ordinary shares appreciates.
We currently do not expect to declare any dividends on our ordinary shares in the foreseeable future. Instead, we anticipate that all of our earnings in the foreseeable future will be used to provide working capital, to support our operations and to finance the growth and development of our business. Any determination to declare or pay dividends in the future will be at the discretion of our board of directors, subject to applicable laws and dependent upon a number of factors, including our earnings, capital requirements and overall financial conditions. In addition, because we are a holding company, our ability to pay dividends on our ordinary shares may be limited by restrictions on our ability to obtain sufficient funds through dividends from subsidiaries, including restrictions under the covenants of the Credit Agreement, the 2025 Notes Indenture and the 2028 Notes Indenture, and may be further restricted by the terms of any future debt or preferred securities. Accordingly, your only opportunity to achieve a return on your investment in our company may be if the market price of our ordinary shares appreciates and you sell your ordinary shares at a profit. The market price for our ordinary shares may never exceed, and may fall below, the price that you pay for such ordinary shares.
Future sales, or the perception of future sales, by us or our existing shareholders in the public market could cause the market price for our ordinary shares to decline.
The sale of additional ordinary shares in the public market, or the perception that such sales could occur, could harm the prevailing market price of our ordinary shares. These sales, or the possibility that these sales may occur, also might make it more difficult for us to sell equity securities in the future at a time and at a price that we deem appropriate. Ordinary shares held by the Principal Shareholder and certain of our directors, officers, employees and other shareholders represent approximately 62.8% of our total outstanding ordinary shares, based on the number of ordinary shares outstanding as of March 3, 2021. Such ordinary shares are “restricted securities” within the meaning of Rule 144 and subject to certain restrictions on resale. Restricted securities may be sold in
50
the public market only if they are registered under the Securities Act or are sold pursuant to an exemption from registration such as Rule 144.
In connection with our IPO, we, our directors and executive officers, and holders of substantially all of our ordinary shares prior to the IPO each agreed with the underwriters, subject to certain exceptions, not to dispose of or hedge any of our or their ordinary shares or securities convertible into or exchangeable for ordinary shares until July 18, 2021, except with the prior written consent of certain representatives of the underwriters.
Upon the expiration of the contractual lock-up agreements pertaining to our IPO, up to an additional 144,443,194 ordinary shares will be eligible for sale in the public market, all of which are held by directors, executive officers and other affiliates and will be subject to volume, manner of sale and other limitations under Rule 144. Ordinary shares covered by registration rights represented approximately 61.5% of our outstanding ordinary shares as of March 3, 2021. Registration of any of these outstanding ordinary shares would result in such ordinary shares becoming freely tradable without compliance with Rule 144.
As restrictions on resale end or if these shareholders exercise their registration rights, the market price of our ordinary shares could drop significantly if the holders of these shares sell them or are perceived by the market as intending to sell them. These factors could also make it more difficult for us to raise additional funds through future offerings of our ordinary shares or other securities.
In addition, our ordinary shares reserved for future issuance under the 2021 Incentive Award Plan will become eligible for sale in the public market once those ordinary shares are issued, subject to provisions relating to various vesting agreements, lock-up agreements and Rule 144, as applicable.
In the future, we may also issue our securities in connection with investments or acquisitions. The amount of our ordinary shares issued in connection with an investment or acquisition could constitute a material portion of our then-outstanding ordinary shares. Any issuance of additional securities in connection with investments or acquisitions may result in additional dilution to you.
Provisions in our organizational documents could delay or prevent a change of control.
Certain provisions of our articles of association and shareholders agreement may have the effect of delaying or preventing a merger, acquisition, tender offer, takeover attempt or other change of control transaction that a shareholder might consider to be in its best interest, including attempts that might result in a premium over the market price of our ordinary shares.
Subject to the provisions of the U.K. Companies Act 2006, these provisions provide for, among other things:
|
|
• |
the division of our board of directors into three classes, as nearly equal in size as possible, with directors in each class serving three-year terms and with terms of the directors of only one class expiring in any given year; |
|
|
• |
the reappointment of any member of our board of directors initially appointed by the Principal Shareholder in the event such director is removed in accordance with our articles of association and pursuant to the UK Companies Act 2006; |
|
|
• |
the ability of our board of directors to issue one or more series of preferred shares with voting or other rights or preferences that could have the effect of impeding the success of an attempt to acquire us or otherwise effect a change of control; |
|
|
• |
advance notice for nominations of directors by shareholders and for shareholders to include matters to be considered at shareholder meetings; |
|
|
• |
the right of the Principal Shareholder and certain of its respective affiliates to appoint the majority of the members of our board of directors for so long as the Principal Shareholder beneficially owns at least 25% of our ordinary shares, and such appointed members will serve as directors without standing for election by our shareholders; |
|
|
• |
certain limitations on convening special shareholder meetings; and |
|
|
• |
that certain provisions of our articles of association may be amended only with the consent of the Principal Shareholder for so long as the Principal Shareholder beneficially owns at least 5% of our ordinary shares. |
These provisions could make it more difficult for a third party to acquire us, even if the third-party’s offer may be considered beneficial by many of our shareholders. As a result, our shareholders may be limited in their ability to obtain a premium for their ordinary shares.
51
Private equity investment funds affiliated with the Principal Shareholder own a majority of our equity and their interests may not be aligned with yours.
The Principal Shareholder owns a majority of the fully diluted equity of UK Holdco, and, therefore, has the power to control our affairs and policies. The Principal Shareholder also controls, to a large degree, the election of directors, the appointment of management, the entry into mergers, sales of substantially all of our assets and other extraordinary transactions. The directors so elected have authority to issue additional shares, implement stock repurchase programs, declare interim dividends and recommend final dividends, and make other decisions. The interests of the Principal Shareholder could conflict with your interests. For example, the Principal Shareholder may also have an interest in pursuing acquisitions, divestitures, financings or other transactions that, in its judgment, could enhance its equity investments. Additionally, the Principal Shareholder is in the business of making investments in companies, and may from time to time acquire interests in businesses that directly or indirectly compete with certain portions of our business or are suppliers or customers of ours.
We are a “controlled company” within the meaning of Nasdaq rules and the rules of the SEC. As a result, we qualify for exemptions from certain corporate governance requirements that provide protection to shareholders of other companies.
The Principal Shareholder owns a majority of our outstanding ordinary shares. As a result, we are a “controlled company” within the meaning of the corporate governance standards of Nasdaq. Under these rules, a company of which more than 50% of the voting power is held by an individual, group or another company is a “controlled company” and may elect not to comply with certain corporate governance requirements, including:
|
|
• |
the requirement that a majority of our board of directors consist of “independent directors” as defined under the rules of Nasdaq; |
|
|
• |
the requirement that we have a compensation committee that is composed entirely of directors who meet the Nasdaq independence standards for compensation committee members; and |
|
|
• |
the requirement that our director nominations be made, or recommended to our full board of directors, by our independent directors or by a nominations committee that consists entirely of independent directors. |
We currently utilize certain of these exemptions and may continue to do so until such time that we no longer qualify as a “controlled company.” As a result, we may not have a majority of independent directors, our nominations committee and compensation committee will not consist entirely of independent directors and such committees may not be subject to annual performance evaluations. Accordingly, you do not have the same protections afforded to shareholders of companies that are subject to all of the corporate governance requirements of Nasdaq.
Failure to comply with requirements to design, implement and maintain effective internal controls could have a material adverse effect on our business and the price of our ordinary shares.
As a public company, we have significant requirements for enhanced financial reporting and internal controls. Our internal control over financial reporting is currently managed by a third party service provider. The process of designing and implementing effective internal controls is a continuous effort that requires us to anticipate and react to changes in our business and the economic and regulatory environments and to expend significant resources to maintain a system of internal controls that is adequate to satisfy our reporting obligations as a public company. If we are unable to establish or maintain appropriate internal financial reporting controls and procedures, it could cause us to fail to meet our reporting obligations on a timely basis, result in material misstatements in our consolidated financial statements and harm our results of operations. In addition, we will be required, pursuant to Section 404, to furnish a report by management on, among other things, the effectiveness of our internal controls over financial reporting in the second annual report following the completion of our IPO. This assessment will need to include disclosure of any material weaknesses identified by our management in our internal controls over financial reporting. The rules governing the standards that must be met for our management to assess our internal controls over financial reporting are complex and require significant documentation, testing and possible remediation. Testing internal controls may divert our management’s attention from other matters that are important to our business. Our independent registered public accounting firm may be required to issue an attestation report on effectiveness of our internal controls.
In connection with the implementation of the necessary procedures and practices related to internal controls over financial reporting, we may identify deficiencies that we may not be able to remediate in time to meet the deadline imposed by the Sarbanes-Oxley Act for compliance with the requirements of Section 404. In addition, we may encounter problems or delays in completing the remediation of any deficiencies identified by our independent registered public accounting firm in connection with the issuance of their attestation report.
Our testing, or the subsequent testing by our independent registered public accounting firm, may reveal deficiencies in our internal controls over financial reporting that are deemed to be material weaknesses. A material weakness in internal controls could result in our failure to detect a material misstatement of our annual or quarterly consolidated financial statements or disclosures. We
52
may not be able to conclude on an ongoing basis that we have effective internal controls over financial reporting in accordance with Section 404. If we are unable to conclude that we have effective internal controls over financial reporting, investors could lose confidence in our reported financial information, which could have a material adverse effect on the trading price of our ordinary shares.
Our board of directors is authorized to issue and designate preferred shares in additional series without shareholder approval.
Our articles of association authorize our board of directors, without the approval of our shareholders, to issue preferred shares, subject to limitations prescribed by applicable law, rules and regulations and the provisions of our articles of association, as preferred shares in series, to establish from time to time the number of preferred shares to be included in each such series and to fix the designation, powers, preferences and rights of the preferred shares of each such series and the qualifications, limitations or restrictions thereof. The powers, preferences and rights of these additional series of preferred shares may be senior to or on parity with our ordinary shares, which may reduce their value.
Our articles of association include exclusive jurisdiction and forum selection provisions, which may impact the ability of shareholders to bring actions against us or increase the costs of bringing such actions.
Our articles of association provide that the courts of England and Wales shall have exclusive jurisdiction to determine any and all disputes brought by a shareholder in their capacity as a shareholder against us, our officers or our board of directors arising out of or in connection with our articles of association or any non-contractual obligations arising out of or in connection with our articles of association, or otherwise. In addition, our articles of association provide that if a court were to find such provision invalid or unenforceable with respect to any complaint asserting a cause of action arising under the Securities Act, the federal courts of the United States will be the exclusive forum for resolving any such complaint. These limitations on the forum in which shareholders may initiate action against us may limit a shareholder’s ability to bring a claim in a judicial forum that it finds favorable and could increase the costs and inconvenience of pursing claims or otherwise adversely affect a shareholder’s ability to seek monetary or other relief.
A court could decline to enforce these exclusive jurisdiction and forum provisions. If a court were to find these provisions to be inapplicable or unenforceable in an action, we may incur additional costs associated with resolving such action in other jurisdictions.
General risk factors
The insurance we maintain may not fully cover all potential exposures.
Our product liability, property, business interruption, cybersecurity, casualty and other insurance may not cover all risks associated with the operation of our business and may not be sufficient to offset the costs of any losses, lost sales or increased costs experienced during business interruptions. For some risks, we may not obtain insurance if we believe the cost of available insurance is excessive related to the risks presented. As a result of market conditions, premiums and deductibles for certain insurance policies can increase substantially and, in some instances, certain insurance policies may become unavailable or available only for reduced amounts of coverage. As a result, we may not be able to renew our insurance policies or procure other desirable insurance on commercially reasonable terms, if at all. Losses and liabilities from uninsured or underinsured events and delay in the payment of insurance proceeds could have a material adverse effect on our financial condition and results of operations.
Terrorist acts, conflicts, wars and natural disasters may materially adversely affect our business, financial condition and results of operations.
As a multinational company with a large international footprint, we are subject to increased risk of damage or disruption to us, our employees, facilities, partners, suppliers, distributors, resellers or customers due to terrorist acts, conflicts, wars, adverse weather conditions, natural disasters, power outages, pandemics or other public health crises and environmental incidents, wherever located around the world. The potential for future terrorist attacks and natural disasters, the national and international responses to such attacks and natural disasters or perceived threats to national security and other actual or potential conflicts or wars may create economic and political uncertainties. In addition, as a multinational company with headquarters and significant operations located in the United States, actions against or by the United States could result in a decrease in demand for our products, make it difficult or impossible to deliver products to our customers or to receive components from our suppliers, create delays and inefficiencies in our supply chain and pose risks to our employees, resulting in the need to impose travel restrictions. Any interruption in production capability could require us to make substantial capital expenditures to remedy the situation, which could negatively affect our profitability and financial condition.
We are subject to work stoppages, union negotiations, labor disputes and other matters associated with our labor force, which may adversely impact our operations and cause us to incur incremental costs.
We have more than 4,500 employees located around the world consisting of commercial, supply chain, quality, regulatory and compliance, research and development and general administrative personnel. Approximately 20% of our associates globally participate in a union or works council. Historically we have not experienced work stoppages; however, in the future, we may be subject to potential union campaigns, work stoppages, union negotiations and other potential labor disputes. Additionally, future negotiations with unions or works councils in connection with existing labor agreements may (i) result in significant increases in our cost of labor, (ii) divert management’s attention away from operating our business or (iii) break down and result in the disruption of our operations. The
53
occurrence of any of the preceding outcomes could impair our ability to manufacture our products and result in increased costs and/or decreased operating results. Further, we may be subject to work stoppages at our suppliers or customers that are beyond our control.
If we are required to make unexpected payments to any pension plans applicable to our employees, our financial condition may be adversely affected.
Some of our current and former employees participate or participated in defined benefit pension plans and we assumed certain foreign underfunded and unfunded pension liabilities in relation to these plans. Several of these plans are unfunded and, while we do not believe the liabilities in relation to these plans are significant, they will need to be satisfied as they mature from our cash provided by operating activities. In jurisdictions where the defined benefit pension plans are intended to be funded with assets in a trust or other funding vehicle, we expect that, while not significant, the liabilities will exceed the corresponding assets in each of the plans. Various factors, such as changes in actuarial estimates and assumptions (including in relation to life expectancy, discount rates and rate of return on assets), as well as actual return on assets, can increase the expenses and liabilities of the defined benefit pension plans. The assets and liabilities of the plans must be valued from time to time under applicable funding rules and as a result we may be required to increase the cash payments we make in relation to these defined benefit pension plans.
We could also be required in some jurisdictions to make accelerated payments up to the full buy-out deficit in our defined benefit pension plans, which would likely be far higher than the normal ongoing funding cost of the plans. Our operations and financial condition may be adversely affected to the extent that we are required to (i) make any additional payments to any relevant defined benefit pension plans in excess of the amounts assumed in our current projections and assumptions or (ii) report higher pension plan expenses under relevant accounting rules.
If we are sued for infringing intellectual property rights of third parties, it will be costly and time-consuming, and an unfavorable outcome in any litigation would harm our business.
We cannot assure you that our activities will not, unintentionally or otherwise, infringe on the patents or other intellectual property rights owned by others. Significant litigation regarding patent rights exists in our industry. Our competitors in both the United States and foreign countries, many of which have substantially greater resources and have made substantial investments in competing technologies, may have applied for or obtained, or may in the future apply for and obtain, patents that will prevent, limit or otherwise interfere with our ability to make and sell our products. We may spend significant time and effort and incur significant litigation costs if we are required to defend ourselves against intellectual property rights claims brought against us, regardless of whether the claims have merit. If we are found to have infringed on the patents or other intellectual property rights of others, we may be subject to substantial claims for damages, which could materially impact our cash flow, business, financial condition and results of operations. We may also be required to cease development, use or sale of the relevant products or processes, or we may be required to obtain a license on the disputed rights, which may not be available on commercially reasonable terms, if at all, or may require us to re-design our products or processes.
If securities analysts do not publish research or reports about our business or if they downgrade our ordinary shares or our sector, the price of our ordinary shares and trading volume could decline.
The trading market for our ordinary shares will rely in part on the research and reports that industry or financial analysts publish about us or our business or industry. We do not control these analysts. Furthermore, if one or more of the analysts who do cover us downgrade our ordinary shares or our industry, or the stock of any of our competitors, or publish inaccurate or unfavorable research about our business or industry, the price of our ordinary shares could decline. If one or more of these analysts ceases coverage of us or fails to publish reports on us regularly, we could lose visibility in the market, which in turn could cause the price of our ordinary shares or trading volume to decline.
We will incur increased costs as a result of operating as a publicly traded company, and our management will be required to devote substantial time to new compliance initiatives.
As a publicly traded company, we will incur additional legal, accounting and other expenses that we did not previously incur. Although we are currently unable to estimate these costs with any degree of certainty, they may be material in amount. In addition, the Sarbanes-Oxley Act, the Dodd-Frank Wall Street Reform and Consumer Protection Act and the rules of the SEC, and the stock exchange on which our ordinary shares are listed, have imposed various requirements on public companies. Our management and other personnel will need to devote a substantial amount of time to these compliance initiatives as well as investor relations. Moreover, these rules and regulations will increase our legal and financial compliance costs and will make some activities more time-consuming and costly. For example, we expect these rules and regulations to make it more difficult and more expensive for us to obtain director and officer liability insurance, and we may be required to incur additional costs to maintain the same or similar coverage.
Item 1B. Unresolved Staff Comments.
None.
54
We operate production facilities, distribution warehouses, research and development centers, shared service centers and office buildings globally. As of January 3, 2021, we had 79 office, laboratory, production and other real estate facilities in 35 countries. We own 7 of these facilities and lease the remaining 72.
As of January 3, 2021, our material operating locations, which we define as the facilities we lease with more than 75,000 square feet plus all owned facilities of more than 20,000 square feet, were as follows:
|
Location |
|
Use(s) |
|
Owned or leased |
|
Approximate square footage |
|
|
Lease expiration (if applicable) |
|
|
Raritan, New Jersey |
|
Headquarters, manufacturing, R&D |
|
Owned |
|
|
569,000 |
|
|
N/A |
|
Rochester, New York (513 Technology Blvd) |
|
Manufacturing |
|
Owned |
|
|
438,628 |
|
|
N/A |
|
Rochester, New York (100 Indigo Creek) |
|
Office, R&D |
|
Owned |
|
|
260,221 |
|
|
N/A |
|
Pencoed, Wales |
|
Office, manufacturing |
|
Owned |
|
|
198,380 |
|
|
N/A |
|
Rochester, New York (130 Indigo Creek) |
|
Office, R&D |
|
Owned |
|
|
103,138 |
|
|
N/A |
|
Strasbourg, France |
|
Warehouse, service |
|
Owned |
|
|
96,208 |
|
|
N/A |
|
Ibaraki, Japan |
|
Warehouse |
|
Leased (land), Owned (building) |
|
|
92,990 |
|
|
March 30, 2038 |
|
Rochester, New York (1000 Lee Rd.) |
|
Manufacturing |
|
Leased |
|
|
92,452 |
|
|
December 31, 2021 |
|
Pompano Beach, Florida |
|
Manufacturing |
|
Owned |
|
|
21,500 |
|
|
N/A |
We are from time to time a party to legal proceedings which arise in the normal course of business. We do not believe any pending litigation to be material, the outcome of which would, in management’s judgment based on information currently available, have a material adverse effect on our results of operations or financial condition. See Note 21, “Commitments and contingencies,” to the audited consolidated financial statements included elsewhere in this Annual Report on Form 10-K.
Item 4. Mine Safety Disclosures.
Not applicable.
55
Item 5. Market for Registrant’s Common Equity, Related Stockholder Matters and Issuer Purchases of Equity Securities.
Market Information for Common Stock
On January 28, 2020, our ordinary shares began trading on Nasdaq under the symbol “OCDX.” Prior to that time, there was no public market for our ordinary shares.
Holders of Record
On March 3, 2021, we had approximately 82 ordinary shareholders of record as reported by our transfer agent. Holders of record are defined as those shareholders whose shares are registered in their names in our share records and do not include beneficial owners of ordinary shares whose shares are held in the names of brokers, dealers or clearing agencies.
Dividend Policy
We currently do not expect to declare any dividends on our ordinary shares in the foreseeable future. Instead, we anticipate that all of our earnings in the foreseeable future will be used to provide working capital, support our operations, finance the growth and development of our business and reduce debt. Any determination to declare dividends in the future will be at the discretion of our board of directors, subject to applicable laws, and will be dependent on a number of factors, including our earnings, capital requirements, and overall financial condition. We are controlled by the Principal Shareholder, who has the ability to appoint a majority of the members of our board of directors and therefore control the payment of dividends. See Part I, Item 1A, “Risk factors – Risks related to ownership of our ordinary shares–Private equity investment funds affiliated with the Principal Shareholder own substantially all of our equity and their interests may not be aligned with yours.” In addition, because we are a holding company, our ability to pay dividends on our ordinary shares may be limited by restrictions on our ability to obtain sufficient funds through dividends from subsidiaries, including restrictions under the covenants of the Credit Agreement, the 2025 Notes Indenture and the 2028 Notes Indenture, and may be further restricted by the terms of any future debt or preferred securities. See Part II, Item 7, “Management’s discussion and analysis of financial condition and results of operations–Liquidity and capital resources–Debt capitalization” for more information about our Senior Secured Credit Facilities and our Senior Notes.
Recent Sales of Unregistered Securities
Since December 30, 2019, we have granted under our equity incentive plans (1) stock options to purchase an aggregate of 2,552,093 shares of our ordinary shares, which options had exercise prices per ordinary share ranging between $6.28 and $14.13 when issued and (2) an aggregate of 693,129 restricted shares and restricted share units to our employees and directors.
The issuances of these stock options and ordinary shares were deemed to be exempt from registration under the Securities Act in reliance upon Section 4(a)(2) of the Securities Act or Regulation D promulgated thereunder, or Rule 701 promulgated under Section 3(b) of the Securities Act, as transactions by an issuer not involving any public offering or pursuant to benefit plans and contracts relating to compensation as provided under Rule 701. None of the foregoing transactions involved any underwriters, underwriting discounts or commissions or any public offering.
Purchases of Equity Securities by the Issuer
None.
Use of Proceeds from Public Offering of Ordinary Shares
On February 1, 2021, we completed the IPO of our ordinary shares at a price of $17.00 per share. We issued and sold 76,000,000 ordinary shares in the IPO, and issued and sold an additional 11,400,000 ordinary shares on February 4, 2021 pursuant to the full exercise of the underwriters option to purchase additional shares as previously disclosed in the IPO prospectus. The ordinary shares sold in the IPO were registered under the Securities Act pursuant to a Registration Statement on Form S-1 (the “IPO Registration Statement”), which was declared effective by the SEC on January 29, 2021. Our ordinary shares are listed on Nasdaq under the symbol “OCDX”. The offering generated net proceeds to us of approximately $1,426.4 million after deducting underwriting discounts and commissions and estimated offering expenses.
We used a portion of the net proceeds from the IPO (i) to redeem $160.0 million of our 2025 Notes, plus accrued interest thereon and $11.8 million of redemption premium, (ii) to redeem $270.0 million of our 2028 Notes, plus accrued interest thereon and $19.6 million of redemption premium, (iii) to repay $892.7 million in aggregate principal amount of borrowings under our Dollar Term Loan Facility and (iv) for working capital and general corporate purposes.
Item 6. Selected Financial Data.
The following tables set forth the selected consolidated financial data of UK Holdco for the periods and dates indicated. The selected historical consolidated financial data as of and for each of the fiscal years ended January 3, 2021, December 29, 2019, December 30, 2018, December 31, 2017 and January 1, 2017 have been prepared in accordance with GAAP. We have derived the following balance sheet data as of January 3, 2021 and December 29, 2019 and the statements of operations and cash flow data for the years ended January 3, 2021, December 29, 2019 and December 30, 2018 from our audited consolidated financial statements included
56
elsewhere in this Annual Report on Form 10-K. We have derived the following balance sheet data as of December 31, 2018, December 31, 2017 and January 1, 2017 and the statements of operations and cash flow data for the years ended December 31, 2017 and January 1, 2017 from our audited consolidated financial statements not included in this Annual Report on Form 10-K. You should read the consolidated financial data set forth below together with our audited consolidated financial statements and the related notes thereto included in Part II, Item 8, “Financial Statements and Supplementary Data,” and Part II, Item 7, “Management’s Discussion and Analysis of Financial Condition and Results of Operations,” in this Annual Report on Form 10-K. Our historical results are not necessarily indicative of future results of operations.
|
|
|
Fiscal year ended |
|
|||||||||||||||||
|
($ in millions, except per share data) |
|
January 3, 2021 |
|
|
December 29, 2019 |
|
|
December 30, 2018 |
|
|
December 31, 2017 |
|
|
January 1, 2017 |
|
|||||
|
|
|
|
|
|
|
|
|
|
|
|
|
|
|
|
|
|
|
|
|
|
|
Statement of operations data: |
|
|
|
|
|
|
|
|
|
|
|
|
|
|
|
|
|
|
|
|
|
Net revenue |
|
$ |
1,766.2 |
|
|
$ |
1,801.5 |
|
|
$ |
1,787.3 |
|
|
$ |
1,781.7 |
|
|
$ |
1,695.6 |
|
|
Cost of revenue, excluding amortization of intangible assets |
|
|
908.2 |
|
|
|
922.4 |
|
|
|
930.5 |
|
|
|
897.7 |
|
|
|
906.3 |
|
|
Gross profit |
|
|
858.0 |
|
|
|
879.1 |
|
|
|
856.8 |
|
|
|
884.0 |
|
|
|
789.3 |
|
|
Operating expenses: |
|
|
|
|
|
|
|
|
|
|
|
|
|
|
|
|
|
|
|
|
|
Selling, marketing and administrative expenses |
|
|
489.6 |
|
|
|
515.1 |
|
|
|
491.6 |
|
|
|
499.8 |
|
|
|
531.5 |
|
|
Research and development expense |
|
|
112.9 |
|
|
|
98.0 |
|
|
|
98.7 |
|
|
|
96.4 |
|
|
|
99.9 |
|
|
Amortization of intangible assets |
|
|
131.9 |
|
|
|
131.7 |
|
|
|
128.8 |
|
|
|
162.0 |
|
|
|
159.6 |
|
|
Intangible asset impairment charge |
|
|
— |
|
|
|
— |
|
|
|
— |
|
|
|
11.0 |
|
|
|
— |
|
|
Gain on bargain purchase of Day 2 Countries |
|
|
— |
|
|
|
— |
|
|
|
— |
|
|
|
— |
|
|
|
1.0 |
|
|
Other operating expense, net |
|
|
35.3 |
|
|
|
48.8 |
|
|
|
71.2 |
|
|
|
79.5 |
|
|
|
53.3 |
|
|
Total operating expenses |
|
|
769.7 |
|
|
|
793.6 |
|
|
|
790.3 |
|
|
|
848.7 |
|
|
|
845.3 |
|
|
Income (loss) from operations |
|
|
88.3 |
|
|
|
85.5 |
|
|
|
66.5 |
|
|
|
35.3 |
|
|
|
(56.0 |
) |
|
Other expense (income): |
|
|
|
|
|
|
|
|
|
|
|
|
|
|
|
|
|
|
|
|
|
Interest expense, net |
|
|
198.2 |
|
|
|
231.4 |
|
|
|
235.6 |
|
|
|
239.8 |
|
|
|
216.9 |
|
|
Tax indemnification expense (income) |
|
|
31.2 |
|
|
|
29.2 |
|
|
|
(13.1 |
) |
|
|
(124.1 |
) |
|
|
5.5 |
|
|
Other expense (income), net |
|
|
84.2 |
|
|
|
5.7 |
|
|
|
61.6 |
|
|
|
(66.1 |
) |
|
|
109.3 |
|
|
Total other expense |
|
|
313.6 |
|
|
|
266.3 |
|
|
|
284.1 |
|
|
|
49.6 |
|
|
|
331.7 |
|
|
Loss before (benefit from) provision for income taxes |
|
|
(225.3 |
) |
|
|
(180.8 |
) |
|
|
(217.6 |
) |
|
|
(14.3 |
) |
|
|
(387.7 |
) |
|
(Benefit from) provision for income taxes |
|
|
(13.4 |
) |
|
|
(23.9 |
) |
|
|
31.2 |
|
|
|
102.0 |
|
|
|
3.0 |
|
|
Net loss |
|
$ |
(211.9 |
) |
|
$ |
(156.9 |
) |
|
$ |
(248.8 |
) |
|
$ |
(116.3 |
) |
|
$ |
(390.7 |
) |
|
Per share data: |
|
|
|
|
|
|
|
|
|
|
|
|
|
|
|
|
|
|
|
|
|
Basic and diluted net loss per share attributable to common stockholders |
|
$ |
(1.45 |
) |
|
$ |
(1.08 |
) |
|
$ |
(1.72 |
) |
|
$ |
(0.80 |
) |
|
$ |
(2.71 |
) |
|
Basic and diluted weighted-average common shares outstanding |
|
|
146.3 |
|
|
|
145.5 |
|
|
|
145.1 |
|
|
|
144.8 |
|
|
|
144.4 |
|
|
|
|
Fiscal year ended |
|
|||||||||||||||||
|
($ in millions) |
|
January 3, 2021 |
|
|
December 29, 2019 |
|
|
December 30, 2018 |
|
|
December 31, 2017 |
|
|
January 1, 2017 |
|
|||||
|
|
|
|
|
|
|
|
|
|
|
|
|
|
|
|
|
|
|
|
|
|
|
Cash flow data: |
|
|
|
|
|
|
|
|
|
|
|
|
|
|
|
|
|
|
|
|
|
Net cash provided by (used in): |
|
|
|
|
|
|
|
|
|
|
|
|
|
|
|
|
|
|
|
|
|
Operating activities |
|
$ |
46.1 |
|
|
$ |
143.0 |
|
|
$ |
69.6 |
|
|
$ |
68.0 |
|
|
$ |
(59.9 |
) |
|
Investing activities |
|
|
(45.4 |
) |
|
|
(68.5 |
) |
|
|
(87.1 |
) |
|
|
(118.0 |
) |
|
|
(187.4 |
) |
|
Financing activities |
|
|
55.8 |
|
|
|
(64.4 |
) |
|
|
(8.2 |
) |
|
|
84.9 |
|
|
|
159.0 |
|
57
|
|
|
As of |
|
|||||||||||||||||
|
|
|
January 3, 2021 |
|
|
December 29, 2019 |
|
|
December 30, 2018 |
|
|
December 31, 2017 |
|
|
January 1, 2017 |
|
|||||
|
($ in millions) |
|
|
|
|
|
|
|
|
|
|
|
|
|
|
|
|
|
|
|
|
|
Consolidated balance sheet data: |
|
|
|
|
|
|
|
|
|
|
|
|
|
|
|
|
|
|
|
|
|
Cash and cash equivalents |
|
$ |
132.8 |
|
|
$ |
72.0 |
|
|
$ |
56.4 |
|
|
$ |
93.3 |
|
|
$ |
60.8 |
|
|
Total assets |
|
|
3,401.5 |
|
|
|
3,589.2 |
|
|
|
3,687.4 |
|
|
|
3,936.8 |
|
|
|
3,865.7 |
|
|
Total liabilities |
|
|
4,412.3 |
|
|
|
4,402.0 |
|
|
|
4,342.1 |
|
|
|
4,353.5 |
|
|
|
4,195.4 |
|
|
Accumulated deficit |
|
|
(1,917.5 |
) |
|
|
(1,705.6 |
) |
|
|
(1,548.9 |
) |
|
|
(1,312.0 |
) |
|
|
(1,195.7 |
) |
|
Total stockholders’ deficit |
|
|
(1,010.8 |
) |
|
|
(812.8 |
) |
|
|
(654.7 |
) |
|
|
(416.7 |
) |
|
|
(329.7 |
) |
58
Item 7. Management’s Discussion and Analysis of Financial Condition and Results of Operations.
The following discussion summarizes the significant factors affecting the operating results, financial condition, liquidity and cash flows of our company as of and for the periods presented below. The following discussion and analysis should be read in conjunction with the audited consolidated financial statements and the related notes thereto included elsewhere in this Annual Report on Form 10-K. Some of the discussion includes forward-looking statements related to future events and our future operating performance that are based on current expectations and are subject to risk and uncertainties. Actual results could differ materially from those discussed in or implied by forward-looking statements as a result of various factors, including those discussed below and in Part I, Item 1A,“Risk Factors” of this Annual Report on Form 10-K.
Overview
We are a pure-play IVD business driven by our credo, “Because Every Test is A Life.” This guiding principle reflects the crucial role diagnostics play in global health and guides our priorities as an organization. As a leader in IVD, we impact approximately 800,000 patients every day. We are dedicated to improving outcomes for these patients and saving lives through providing innovative and reliable diagnostic testing solutions to the clinical laboratory and transfusion medicine communities. Our global infrastructure and commercial reach allow us to serve these markets with significant scale. We have an intense focus on the customer. We support our customers with high quality diagnostic instrumentation, a broad test portfolio and market leading service. Our products deliver consistently fast, accurate and reliable results that allow clinicians to make better-informed treatment decisions. Our business model generates significant recurring revenues and strong cash flow streams from ongoing sales of high margin consumables. These consumables contribute more than 90% of our total revenue. We maintain close connectivity with our customers through our global presence, with more than 4,500 employees, including approximately 2,200 commercial sales, service and marketing teammates. This global organization allows us to support our customers across more than 130 countries and territories.
Key components of results of operations
Net revenue
We operate on a “razor/razor blade” model whereby we offer our customers a selection of automated instruments under long-term contracts along with the assays, reagents and other consumables that are used by these instruments to generate test results. This business model allows us to generate predictable recurring revenue and strong cash flow streams from ongoing sales of high-margin assays, reagents and other consumables and services, sales of which represented greater than 90% of our core revenue during the fiscal year ended January 3, 2021. We also employ a “closed system” strategy with our instruments, which allows only our assays, reagents and other consumables to be used by our instruments and further strengthens the predictability of our revenue. Finally, our typical customer contract length is approximately five years and we have benefitted from a good customer retention rate in recent years.
We manage our business geographically to better align with the market dynamics of the specific geographic region with our reportable segments being Americas, EMEA and Greater China. We generate revenue primarily in the following lines of business:
Core:
|
|
• |
Clinical Laboratories—Focused on clinical chemistry and immunoassay instruments and tests to detect and monitor disease progression across a broad spectrum of therapeutic areas, including grant revenue related to development of our COVID-19 antibody and antigen tests. |
|
|
• |
Transfusion Medicine—Focused on (i) immunohematology instruments and tests used for blood typing to ensure patient-donor compatibility in blood transfusions and (ii) donor screening instruments and tests used for blood and plasma screening for infectious diseases for customers primarily in the United States. |
Non-core:
|
|
• |
Other Product Revenue—Our other product revenue includes revenues primarily from contract manufacturing. |
|
|
• |
Collaboration and Other Revenue—We have entered into collaboration and license agreements pursuant to which we derive collaboration and royalty revenues. |
All non-core revenue is recorded in the Americas segment for all periods presented.
Cost of revenue, excluding amortization of intangible assets and gross profit
The primary components of our cost of revenue are purchased materials, the overhead costs related to our manufacturing operations and direct labor associated with the manufacture of our instruments, assays, reagents and other consumables and depreciation of customer leased instruments.
59
Selling, marketing and administrative expenses
The primary components of our selling, marketing and administrative expenses are employee-related costs in our sales, marketing and administrative and support functions, marketing costs, distribution costs and an allocation of facility and information technology costs and other overhead costs. Employee-related costs include compensation and benefits, including stock-based compensation expense and commissions, employee recruiting and relocation expenses, employee training costs and travel-related costs.
Research and development expense
The primary components of our research and development expense are costs related to clinical trials and regulatory-related spending, as well as employee-related costs in these functions, and an allocation of facility and information technology costs and other overhead costs.
Amortization of intangible assets
Amortization of intangible assets consists solely of the amortization of intangible assets related to the acquisition of Ortho from Johnson and Johnson by Carlyle.
Other operating expense, net
The primary components of other operating expense, net, are profit share expense related to our Joint Business and restructuring charges.
Interest expense, net
The primary components of interest expense, net are interest charges and amortization of deferred financing charges related to our borrowings.
Tax indemnification expense (income), net
The primary components of tax indemnification expense (income), net are gains and losses related to certain federal, state and foreign tax matters that relate to the period prior to the Acquisition and for which we have indemnification agreements. We are subject to income tax in approximately 34 jurisdictions outside the United States. Our most significant operations outside the United States are located in China, France, Japan and the United Kingdom. For these jurisdictions for which we have significant operations, the statute of limitations varies by jurisdiction, with 2013 being the oldest tax year still open. We are currently under audit in certain jurisdictions for tax years under the responsibility of Johnson & Johnson. Pursuant to the Acquisition Agreement, all tax liabilities related to these tax years will be indemnified by Johnson & Johnson.
Other expense (income), net
The primary components of other expense (income), net are foreign currency related gains and losses, including unrealized gains and losses on intercompany loans denominated in currencies other than the functional currency of the affected subsidiaries, and losses related to early extinguishment of certain borrowings.
Impact of the initial public offering
Use of proceeds and impact of debt extinguishment
On February 1, 2021, we completed the IPO of our ordinary shares at a price of $17.00 per share. We issued and sold 76,000,000 ordinary shares in the IPO, and issued and sold an additional 11,400,000 ordinary shares on February 4, 2021 pursuant to the full exercise of the underwriters’ option to purchase additional shares from us, as previously disclosed in the IPO prospectus. The ordinary shares sold in the IPO were registered under the Securities Act pursuant to (the “IPO Registration Statement”), which was declared effective by the SEC on January 29, 2021. Our ordinary shares are listed on Nasdaq under the symbol “OCDX”. The offering, including proceeds from the full exercise of the underwriters’ option to purchase additional shares, generated net proceeds to us of $1,426.4 million after deducting underwriting discounts and commissions and estimated offering expenses.
We used the net proceeds from the IPO (i) to redeem $160 million of our 2025 Notes, plus accrued interest thereon and $11.8 million of redemption premium, (ii) to redeem $270 million of our 2028 Notes, plus accrued interest thereon and $19.6 million of redemption premium, (iii) to repay $892.7 million in aggregate principal amount of borrowings under our Dollar Term Loan Facility and (iv) for working capital and general corporate purposes.
Incremental public company expenses
As a new public company, we will incur significant expenses on an ongoing basis that we did not incur as a private company, including increased director and officer liability insurance expense, as well as third-party and internal resources related to accounting, auditing, Sarbanes-Oxley Act compliance, legal and investor and public relations expenses. These costs will generally be included in selling, marketing and administrative expenses.
60
Stock-based compensation expense
In connection with our IPO, in the first quarter of fiscal year 2021, we may incur a one-time stock-based compensation expense related to options held by certain members of management that may vest upon the completion of certain liquidity and realization events. Furthermore, we implemented a new long-term equity incentive plan during 2021 in connection with our IPO in order to align our equity compensation program with public company plans and practices.
Impact of the COVID-19 pandemic
During the fiscal first quarter ended March 29, 2020, as the global COVID-19 pandemic began to affect certain countries, we began to see a decrease in the number of tests run in China in February, which spread to certain countries in Europe, the Middle East and Africa (“EMEA”) and Asia Pacific (“ASPAC”) in early March and resulted in a worldwide decrease in the number of tests run globally by the end of March. In many countries, we experienced a lag between the timing of the decrease in number of tests run and the decrease in shipments of additional products to our customers. The decrease in shipments to our customers began to occur during the fiscal second quarter ended June 28, 2020 in many countries, including the United States. During the fiscal third quarter ended September 27, 2020 and the fiscal fourth quarter ended January 3, 2021, we did experience some recovery in the base business of our core revenue, further supplemented with sales of our COVID-19 antibody tests, mainly in the North America region. As a result of the global COVID-19 pandemic, we have experienced decreased revenues, incurred idle or underutilized facilities costs, higher freight and higher distribution costs compared to the prior year for the fiscal year ended January 3, 2021. We believe that the decrease in the number of tests run by medical institutions is a result of government-imposed lockdown or stay at home orders and delays in elective medical procedures and we expect this will continue to negatively impact our revenues and Adjusted EBITDA during the remainder of the global COVID-19 pandemic. We believe that once these government measures are lifted or relaxed, demand will begin to slowly return.
In response to the global COVID-19 pandemic, we mobilized our research and development teams in order to bring to market COVID-19 antibody and antigen tests. We have received a combination of Emergency Use Authorization from the FDA, authority to affix a CE Mark for sale in the European Union and various other regulatory approvals globally for our COVID-19 antibody and antigen tests. We continue to work on gaining further regulatory approvals to sell the tests in other markets worldwide. Our COVID-19 antibody tests detect whether a patient has been previously infected by COVID-19 and our COVID-19 antigen test detects whether a patient is currently infected by COVID-19. All three of our COVID-19 antibody and antigen tests run on our existing instruments.
We are continually monitoring our business continuity plans due to the global COVID-19 pandemic. Due to the fact that our products and services are considered to be medically critical, our manufacturing and research and development sites are generally exempt from governmental orders in the United States and other countries requiring businesses to cease operations. For these sites, we have taken steps to protect our employees, and the majority of our office-based work is being conducted remotely. We have also implemented strict travel restrictions, which has reduced our travel-related operating expenses.
As the global COVID-19 pandemic is an ongoing matter, our future assessment of the magnitude and duration of the COVID-19 pandemic, as well as other factors, could result in material impacts to our consolidated financial statements in future reporting periods.
Results of operations
The following discussion should be read in conjunction with the information contained in the accompanying consolidated financial statements included elsewhere in this Annual Report on Form 10-K. Our historical results of operations may not necessarily reflect what will occur in the future.
Fiscal year ended January 3, 2021 compared with fiscal year ended December 29, 2019
Overview of results
During the fiscal year ended January 3, 2021, reported net loss of $211.9 million increased by $55.0 million compared with the fiscal year ended December 29, 2019. Our results were materially impacted by the global COVID-19 pandemic, as net revenue for the fiscal year ended January 3, 2021 decreased by $35.3 million compared with the fiscal year ended December 29, 2019. This decrease included operational net revenue declines of 1.3% and a negative impact of 0.7% from foreign currency fluctuations. We also incurred higher idle or underutilized facilities costs, higher freight costs and higher distribution costs, which were partially offset by cost containment measures to incur lower employee-related costs and lower travel-related costs. Our results were also affected by a research and development upfront payment of $7.5 million, higher foreign currency losses, primarily unrealized, and losses on early extinguishment of our 2022 Notes, partially offset by lower interest expense.
Net revenue
Net revenue for the fiscal year ended January 3, 2021 decreased by $35.3 million, or 2.0%, compared with the fiscal year ended December 29, 2019. Net revenue for the fiscal year ended January 3, 2021 included operational net revenue declines of 1.3% and a negative impact of 0.7% from foreign currency fluctuations, which was primarily driven by the strengthening of the U.S. Dollar against a variety of currencies. The decrease in net revenue for the fiscal year ended January 3, 2021, excluding the impact of foreign currency
61
exchange, was mainly driven by lower revenues in our Clinical Laboratories business in the EMEA, Greater China and other regions due primarily to the global COVID-19 pandemic and lower local HCV revenue in the Japan region of approximately $18 million, as well as lower revenues in our Transfusion Medicine business in all regions due primarily to the global COVID-19 pandemic. These decreases were partially offset by increases in our Clinical Laboratories business in the North America region related to sales of our COVID-19 antibody tests and other assays, instrument sales and grant revenue related to development of our COVID-19 antibody and antigen tests. The decrease in net revenue was also impacted by lower other product revenue due to the reduction and timing of certain performance obligations in a contract manufacturing arrangement.
The following table shows total net revenue by line of business:
|
|
|
Fiscal year ended |
|
|||||||||
|
($ in millions) |
|
January 3, 2021 |
|
|
December 29, 2019 |
|
|
% Change |
|
|||
|
Clinical Laboratories |
|
$ |
1,154.2 |
|
|
$ |
1,142.3 |
|
|
|
1.0 |
% |
|
Transfusion Medicine |
|
|
580.6 |
|
|
|
598.0 |
|
|
|
(2.9 |
)% |
|
Core Revenue |
|
|
1,734.8 |
|
|
|
1,740.3 |
|
|
|
(0.3 |
)% |
|
Other Product Revenue |
|
|
8.5 |
|
|
|
37.3 |
|
|
|
(77.2 |
)% |
|
Collaboration and Other Revenue |
|
|
22.9 |
|
|
|
23.9 |
|
|
|
(4.2 |
)% |
|
Non-Core Revenue |
|
|
31.4 |
|
|
|
61.2 |
|
|
|
(48.7 |
)% |
|
Net Revenue |
|
$ |
1,766.2 |
|
|
$ |
1,801.5 |
|
|
|
(2.0 |
)% |
Core revenue
Clinical Laboratories revenue for the fiscal year ended January 3, 2021 increased by $11.9 million, or 1.0%, compared with the fiscal year ended December 29, 2019. This increase included operational net revenue gains of 2.3% partially offset by a negative impact of 1.2% from foreign currency fluctuations. Clinical Laboratories revenue increased in the North America region related to sales of our COVID-19 antibody tests and other assays, instrument sales and grant revenue related to development of our COVID-19 antibody and antigen tests. These increases were offset by lower revenues in the EMEA, Greater China and other regions due primarily to decreased shipments to customers as a result of the global COVID-19 pandemic and lower local HCV revenue in the Japan region of approximately $18 million.
Transfusion Medicine revenue for the fiscal year ended January 3, 2021 decreased by $17.4 million, or 2.9%, compared with the fiscal year ended December 29, 2019. This decrease included operational net revenue declines of 3.3% partially offset by a positive impact of 0.3% from foreign currency fluctuations. The decrease in Transfusion Medicine revenue was primarily due to decreased shipments to customers in all regions as a result of the global COVID-19 pandemic.
Non-core revenue
Other Product Revenue for the fiscal year ended January 3, 2021 decreased by $28.8 million, or 77.2%, compared with the fiscal year ended December 29, 2019. The decrease was due to the reduction and timing of certain performance obligations in a contract manufacturing arrangement.
Collaboration and Other Revenue for the fiscal year ended January 3, 2021 decreased by $1.0 million, or 4.2%, compared with the fiscal year ended December 29, 2019. The decrease was primarily due to lower revenues related to our HCV/HIV license agreements, partially offset by $7.5 million of license revenue related to the Joint Business granting a customer a license to sell certain products in Canada.
Cost of revenue, excluding amortization of intangible assets and Gross profit
|
|
|
Fiscal year ended |
|
|||||||||||||
|
($ in millions) |
|
January 3, 2021 |
|
|
% of net revenue |
|
|
December 29, 2019 |
|
|
% of net revenue |
|
||||
|
Cost of revenue, excluding amortization of intangible assets |
|
$ |
908.2 |
|
|
|
51.4 |
% |
|
$ |
922.4 |
|
|
|
51.2 |
% |
|
Gross profit |
|
|
858.0 |
|
|
|
48.6 |
% |
|
|
879.1 |
|
|
|
48.8 |
% |
The increase in cost of revenue, excluding amortization of intangible assets and decrease in gross profit as a percentage of net revenue for the fiscal year ended January 3, 2021 compared with the fiscal year ended December 29, 2019 was primarily due to idle or underutilized facility costs of $14.8 million and freight costs of $6.9 million incurred as a result of the global COVID-19 pandemic. This increase was partially offset by $11.0 million of lower restructuring costs in the fiscal year ended January 3, 2021 compared with the fiscal year ended December 29, 2019, which were primarily related to depreciation related charges incurred in the fiscal year ended December 29, 2019 related to assets no longer in use due to the transfer of certain production lines. See “—Restructuring activities.”
62
The following table provides a summary of certain operating expenses:
|
|
|
Fiscal year ended |
|
|||||||||||||
|
($ in millions) |
|
January 3, 2021 |
|
|
% of net revenue |
|
|
December 29, 2019 |
|
|
% of net revenue |
|
||||
|
Selling, marketing and administrative expenses |
|
$ |
489.6 |
|
|
|
27.7 |
% |
|
$ |
515.1 |
|
|
|
28.6 |
% |
|
Research and development expense |
|
|
112.9 |
|
|
|
6.4 |
% |
|
|
98.0 |
|
|
|
5.4 |
% |
|
Amortization of intangible assets |
|
|
131.9 |
|
|
|
7.5 |
% |
|
|
131.7 |
|
|
|
7.3 |
% |
|
Other operating expense, net |
|
|
35.3 |
|
|
|
2.0 |
% |
|
|
48.8 |
|
|
|
2.7 |
% |
Selling, marketing and administrative expenses
Selling, marketing and administrative expenses were $489.6 million for the fiscal year ended January 3, 2021, or 27.7% of net revenue, as compared with $515.1 million for the fiscal year ended December 29, 2019, or 28.6% of net revenue, a decrease of $25.5 million. The decrease in selling, marketing and administrative expenses was primarily due to decreased employee-related costs, including stock-based compensation and severance expense, and decreased travel-related costs, partially offset by increased distribution costs and increased third-party costs.
Research and development expense
Research and development expense was $112.9 million for the fiscal year ended January 3, 2021, or 6.4% of net revenue, as compared with research and development expense of $98.0 million for the fiscal year ended December 29, 2019, or 5.4% of net revenue, an increase of $14.9 million. The increase was primarily due to a research and development upfront payment of $7.5 million made to Quotient upon the signing of a binding letter agreement and costs incurred to perform research and development activities related to developing our COVID-19 antibody and antigen tests.
Amortization of intangible assets
Amortization of intangible assets was $131.9 million for the fiscal year ended January 3, 2021 as compared with $131.7 million for the fiscal year ended December 29, 2019. There were no major changes in the composition of our intangible assets in the fiscal year ended January 3, 2021 compared to the fiscal year ended December 29, 2019.
Other operating expense, net
Other operating expense, net, was $35.3 million, or 2.0% of net revenue, for the fiscal year ended January 3, 2021, as compared with $48.8 million, or 2.7% of net revenue, for the fiscal year ended December 29, 2019, a decrease of $13.5 million. The decrease was primarily due to lower profit share expense in the current year from lower revenue related to our Joint Business.
Non-operating items
Interest expense, net
Interest expense was $198.2 million for the fiscal year ended January 3, 2021, compared with $231.4 million for the fiscal year ended December 29, 2019. The decrease of $33.2 million was primarily related to lower interest rates on the Dollar Term Loan Facility.
Tax indemnification expense, net
Tax indemnification expense was $31.2 million for the fiscal year ended January 3, 2021, and was primarily related to the release of certain tax reserves upon the settlement of certain U.S. federal and state tax matters, with an offsetting benefit recorded to income tax expense. Tax indemnification expense was $29.2 million for the fiscal year ended December 29, 2019, and was primarily related to the release of certain tax reserves upon the settlement of certain state tax matters, with an offsetting benefit recorded to income tax expense.
Other expense, net
Other expense, net was $84.2 million for the fiscal year ended January 3, 2021 and primarily related to $69.5 million of foreign currency losses, of which $68.2 million was unrealized and loss on early extinguishment of the 2022 Notes of $12.6 million. The unrealized foreign currency losses are mainly related to intercompany loans denominated in currencies other than the functional currency of the affected subsidiaries.
Other expense, net was $5.7 million for the fiscal year ended December 29, 2019 and primarily related to $16.0 million of fair value losses on interest rate caps that did not qualify for hedge accounting, partially offset by $10.5 million of net foreign currency
63
gains, of which $18.1 million was unrealized. The unrealized foreign currency gains are mainly related to intercompany loans denominated in currencies other than the functional currency of the affected subsidiaries.
Benefit from income taxes
During the fiscal year ended January 3, 2021, we incurred a loss before benefit from income taxes of $225.3 million and recognized a benefit from income taxes of $13.4 million resulting in an effective tax rate of 5.9%. The effective tax rate differs from the U.S. federal statutory rate primarily due to (1) the impact of operating losses in certain subsidiaries not being benefited due to the establishment of a valuation allowance (2) a decrease in our pre-Acquisition reserves for uncertain tax positions due to the settlement of certain tax matters, (3) partially offset by an increase in certain post-Acquisition non-U.S. reserves for uncertain tax positions, and (4) non-U.S. earnings being taxed at rates that are different than the U.S. statutory rate.
During the fiscal year ended December 29, 2019, we incurred a loss before benefit from income taxes of $180.8 million and recognized a benefit from income taxes of $23.9 million resulting in an effective tax rate of 13.3%. The effective tax rate for each period differs from the U.S. federal statutory rate primarily due to (1) the impact of operating losses in certain subsidiaries not being benefited due to the establishment of a valuation allowance, (2) a decrease in our pre-Acquisition state and non-U.S. reserves for uncertain tax positions due to the settlement of certain tax matters, (3) an increase in our interest expense on prior year reserves for uncertain tax positions and (4) non-U.S. earnings being taxed at rates that are different than the U.S. statutory rate.
Fiscal year ended December 29, 2019 compared with fiscal year ended December 30, 2018
Overview of results
Reported net loss of $156.9 million decreased $91.9 million during the fiscal year ended December 29, 2019 compared with the fiscal year ended December 30, 2018. The decrease in net loss during the fiscal year ended December 29, 2019 was primarily due to higher revenues, lower cost of revenue, primarily due to lower restructuring-related costs, lower debt refinancing costs and lower foreign exchange related losses. These items were partially offset by higher selling, marketing and administrative costs, primarily driven by increased stock-based compensation expense.
Net revenue
Net revenue for the fiscal year ended December 29, 2019 increased by $14.2 million, or 0.8%, compared with the fiscal year ended December 30, 2018. Revenues for the fiscal year ended December 29, 2019 included the impact of unfavorable foreign currency exchange of approximately $29 million, primarily driven by changes in the Chinese Yuan/Renminbi, Euro, British Pound and Brazilian Real. Excluding the impact of foreign currency exchange, the increase in revenues for the fiscal year ended December 29, 2019 was driven primarily by increased revenues in Japan, primarily as a result of a supply agreement related to our HCV business, the impact of which is included in our Clinical Laboratories business, as well as increased revenues in China, North America, LATAM, and ASPAC, primarily related to our Clinical Laboratories business. These increases were partially offset by lower revenues related to our Donor Screening business within Transfusion Medicine in Japan and other product and collaboration revenues, which are included in our U.S. results.
The following table shows net revenue by line of business:
|
|
|
Fiscal year ended |
|
|||||||||
|
($ in millions) |
|
December 29, 2019 |
|
|
December 30, 2018 |
|
|
% Change |
|
|||
|
Clinical Laboratories |
|
$ |
1,142.3 |
|
|
$ |
1,102.5 |
|
|
|
3.6 |
% |
|
Transfusion Medicine |
|
|
598.0 |
|
|
|
616.1 |
|
|
|
(2.9 |
)% |
|
Core Revenue |
|
|
1,740.3 |
|
|
|
1,718.6 |
|
|
|
1.3 |
% |
|
Other Product Revenue |
|
|
37.3 |
|
|
|
36.0 |
|
|
|
3.6 |
% |
|
Collaboration and Other Revenue |
|
|
23.9 |
|
|
|
32.7 |
|
|
|
(26.9 |
)% |
|
Non-Core Revenue |
|
|
61.2 |
|
|
|
68.7 |
|
|
|
(10.9 |
)% |
|
Net Revenue |
|
$ |
1,801.5 |
|
|
$ |
1,787.3 |
|
|
|
0.8 |
% |
Core revenue
Clinical Laboratories revenue increased $39.8 million, or 3.6%, during the fiscal year ended December 29, 2019 compared with the fiscal year ended December 30, 2018. Excluding the unfavorable impact of foreign currency exchange of approximately $22 million, the increase in Clinical Laboratories revenue was primarily driven by reagent sales in Japan, primarily as a result of a supply agreement related to our HCV business, China, North America, LATAM, and ASPAC, and instrument sales in China. These increases were partially offset by lower instrument sales in North America.
64
Transfusion Medicine revenue decreased $18.1 million, or 2.9%, during the fiscal year ended December 29, 2019 compared with the fiscal year ended December 30, 2018. Excluding the unfavorable impact of foreign currency exchange of approximately $9 million, the decrease in Transfusion Medicine revenue was primarily driven by decreased reagent sales in Japan in the Donor Screening business, partially offset by increased reagent sales in the Immunohematology business.
Non-core revenue
Other product revenue, related to our contract manufacturing business, increased $1.3 million, or 3.6%, during the fiscal year ended December 29, 2019 compared with the fiscal year ended December 30, 2018 primarily due to the timing of completion of certain performance obligations.
Collaboration and other revenue during the fiscal year ended December 29, 2019 decreased $8.8 million compared with the fiscal year ended December 30, 2018, primarily due to lower revenues recorded related to our HCV/HIV license agreements.
Cost of revenue, excluding amortization of intangible assets and Gross profit
|
|
|
Fiscal year ended |
|
|||||||||||||
|
($ in millions) |
|
December 29, 2019 |
|
|
% of total revenue |
|
|
December 30, 2018 |
|
|
% of total revenue |
|
||||
|
Cost of revenue, excluding amortization of intangible assets |
|
$ |
922.4 |
|
|
|
51.2 |
% |
|
$ |
930.5 |
|
|
|
52.1 |
% |
|
Gross profit |
|
|
879.1 |
|
|
|
48.8 |
% |
|
|
856.8 |
|
|
|
47.9 |
% |
The decrease in cost of revenue and increase in gross profit as a percentage of net revenue in the fiscal year ended December 29, 2019 compared with the fiscal year ended December 30, 2018 was primarily due to $20.8 million of lower restructuring costs in the fiscal year ended December 29, 2019 compared with the fiscal year ended December 30, 2018. This was partially offset by higher revenues primarily due to an increase in volume of reagent sales in our core business in the fiscal year ended December 29, 2019. See “—Restructuring activities.”
Operating expenses
The following table provides a summary of certain operating expenses:
|
|
|
Fiscal year ended |
|
|||||||||||||
|
($ in millions) |
|
December 29, 2019 |
|
|
% of net revenue |
|
|
December 30, 2018 |
|
|
% of net revenue |
|
||||
|
Selling, marketing and administrative expenses |
|
$ |
515.1 |
|
|
|
28.6 |
% |
|
$ |
491.6 |
|
|
|
27.5 |
% |
|
Research and development expense |
|
|
98.0 |
|
|
|
5.4 |
% |
|
|
98.7 |
|
|
|
5.5 |
% |
|
Amortization of intangible assets |
|
|
131.7 |
|
|
|
7.3 |
% |
|
|
128.8 |
|
|
|
7.2 |
% |
|
Other operating expense, net |
|
|
48.8 |
|
|
|
2.7 |
% |
|
|
71.2 |
|
|
|
4.0 |
% |
Selling, marketing and administrative expenses
Selling, marketing and administrative expenses were $515.1 million for the fiscal year ended December 29, 2019 as compared with $491.6 million for the fiscal year ended December 30, 2018, an increase of $23.5 million, or 4.8%. As a percentage of net revenue, selling, marketing and administrative expenses was 28.6% for the fiscal year ended December 29, 2019 as compared with 27.5% for the fiscal year ended December 30, 2018. The increase in selling, marketing and administrative expenses was primarily due to increased stock-based compensation expense of $11.4 million and other employee-related costs, including the strategic investments in our sales force in key markets, during the fiscal year ended December 29, 2019, partially offset by lower consulting-related expenses.
Research and development expense
Research and development expense was $98.0 million for the fiscal year ended December 29, 2019 as compared with $98.7 million for the fiscal year ended December 30, 2018, a decrease of $0.7 million, or 0.7%. As a percentage of net revenue, research and development expense was 5.4% for the fiscal year ended December 29, 2019 as compared with 5.5% for the fiscal year ended December 30, 2018. The decrease in research and development spending was primarily due to the timing of certain clinical trials and regulatory-related spending.
Amortization of intangible assets
Amortization of intangible assets was $131.7 million and $128.8 million for the fiscal year ended December 29, 2019 and December 30, 2018, respectively. The increase in amortization of intangible assets was due to the reclassification of our in-process research and development intangible to developed technology and the commencement of amortization during the third quarter of fiscal year 2018 upon receipt of CE Mark on the related instrument.
65
Other operating expense, net, of $48.8 million for the fiscal year ended December 29, 2019 decreased by $22.4 million compared with the fiscal year ended December 30, 2018. The decrease was primarily driven by $18.5 million of debt refinancing costs incurred during the fiscal year ended December 30, 2018 relating to the second amendment to our Senior Secured Credit Facilities on June 8, 2018, as well as higher restructuring costs of $3.6 million in fiscal year 2018.
Non-operating items
Interest expense, net
Interest expense was $231.4 million for the fiscal year ended December 29, 2019, compared with $235.6 million during the fiscal year ended December 30, 2018. The decrease of $4.2 million primarily resulted from lower amortization of deferred financing costs and original issue discounts.
Tax indemnification (income) expense
Tax indemnification expense was $29.2 million for the fiscal year ended December 29, 2019 and was primarily related to indemnification expense related to the release of certain tax reserves upon the settlement of certain state tax matters, with an offsetting benefit recorded to income tax expense. Tax indemnification income was $13.1 million for the fiscal year ended December 30, 2018 and was primarily related to interest on our indemnification receivables related to certain state tax matters included in our pre-Acquisition audit reserves.
Other expense (income), net
Other expense, net for the fiscal year ended December 29, 2019 was $5.7 million and primarily related to $16.0 million of fair value losses on interest rate caps that did not qualify for hedge accounting, partially offset by $10.5 million of net foreign currency gains, of which $18.1 million was unrealized. The unrealized foreign currency gains are mainly related to intercompany loans denominated in currencies other than the functional currency of the affected subsidiaries.
Other expense, net for the fiscal year ended December 30, 2018 was $61.6 million and primarily related to $53.0 million of net foreign currency losses, of which $43.3 million was unrealized and fair value losses of $2.7 million on interest rate caps that did not qualify for hedge accounting. The unrealized foreign currency losses are mainly related to intercompany loans denominated in currencies other than the functional currency of the affected subsidiaries.
Provision for income taxes
We recorded a benefit from income taxes of $23.9 million for the fiscal year ended December 29, 2019, which represents a 13.3% effective tax rate in relation to the loss before provision for taxes of $180.8 million. The effective tax rate for the fiscal year ended December 29, 2019 differs from the U.S. federal statutory tax rate primarily due to (1) the impact of operating losses in certain subsidiaries not being benefited due to the establishment of a valuation allowance, (2) a decrease in our pre-Acquisition state and non-U.S. reserves for uncertain tax positions due to the settlement of certain tax matters, (3) an increase in our interest expense on prior year reserves for uncertain tax positions and (4) non-U.S. earnings being taxed at rates that are different than the U.S. statutory rate. Deferred tax assets are reduced by valuation allowances when, based on available evidence, it is more likely than not that the tax benefit of loss carryforwards (or other deferred tax assets) will not be realized in the future. In periods when entities subject to a valuation allowance generate pre-tax earnings or losses, the corresponding increase or decrease in the valuation allowance has an overall impact on the effective tax rate.
We recorded a provision for income taxes of $31.2 million for the fiscal year ended December 30, 2018, which represents a negative 14.3% effective tax rate in relation to the loss before provision for taxes of $217.6 million. The effective tax rate for the fiscal year ended December 30, 2018 differs from the U.S. federal statutory rate primarily due to (1) the impact of operating losses in certain subsidiaries not being benefited due to the establishment of a valuation allowance, (2) an increase in our reserves for uncertain tax positions, (3) an increase in our interest expense on prior year reserves for uncertain tax positions and (4) non-U.S. earnings being taxed at rates that are different than the U.S. statutory rate.
Use of Non-GAAP Financial Measures
Reconciliation of Net Loss to Adjusted EBITDA
We believe that our financial statements and the other financial data included in this Annual Report on Form 10-K have been prepared in a manner that complies, in all material respects, with GAAP, and are consistent with current practice, with the exception of the inclusion of financial measures that differ from measures calculated in accordance with GAAP, including EBITDA, Adjusted EBITDA and Management EBITDA. Adjusted EBITDA consists of net loss before interest expense, net, provision for (benefit from) income taxes and depreciation and amortization and eliminates (i) non-operating income or expense and (ii) impacts of certain non-cash,
66
unusual or other items that are included in net loss that we do not consider indicative of our ongoing operating performance. Management EBITDA consists of Adjusted EBITDA plus certain other management adjustments.
We use these financial measures in the analysis of our financial and operating performance because they assist in the evaluation of underlying trends in our business. Additionally, Management EBITDA is the basis we use for assessing the profitability of our geographic-based reportable segments and is also utilized as a basis for calculating certain management incentive compensation programs. In the case of Adjusted EBITDA, we believe that making such adjustments provides management and investors meaningful information to understand our operating performance and ability to analyze financial and business trends on a period-to-period basis. We believe that the presentation of these financial measures enhances an investor’s understanding of our financial performance. We use certain of these financial measures for business planning purposes and measuring our performance relative to that of our competitors.
Other companies in our industry may calculate Adjusted EBITDA and Management EBITDA differently than we do. As a result, these financial measures have limitations as analytical and comparative tools and you should not consider these items in isolation, or as a substitute for analysis of our results as reported under GAAP. Adjusted EBITDA and Management EBITDA should not be considered as measures of discretionary cash available to us to invest in the growth of our business. In calculating these financial measures, we make certain adjustments that are based on assumptions and estimates that may prove to have been inaccurate. In addition, in evaluating these financial measures, you should be aware that in the future we may incur expenses similar to those eliminated in the presentation of these metrics included in this Annual Report on Form 10-K. Our presentation of Adjusted EBITDA and Management EBITDA should not be construed as an inference that our future results will be unaffected by unusual or non-recurring items.
Adjusted EBITDA and Management EBITDA have important limitations as analytical tools and you should not consider them in isolation or as substitutes for analysis of our results as reported under GAAP. Some of these limitations include the fact that:
|
|
• |
Adjusted EBITDA and Management EBITDA: |
|
|
• |
do not reflect the significant interest expense on our debt, including the Senior Secured Credit Facilities, the 2025 Notes and the 2028 Notes; |
|
|
• |
eliminate the impact of income taxes on our results of operations; and |
|
|
• |
although depreciation and amortization are non-cash charges, the assets being depreciated and amortized will often have to be replaced in the future, and Adjusted EBITDA and Management EBITDA do not reflect any cash requirements for such replacements; |
We compensate for these limitations by relying primarily on our GAAP results and using these financial measures only as a supplement to our GAAP results. In calculating these financial measures, we make certain adjustments that are based on assumptions and estimates that may prove to have been inaccurate. In addition, in evaluating these financial measures, you should be aware that in the future we may incur expenses similar to those eliminated in this presentation. Our presentation of these metrics should not be construed as an inference that our future results will not be affected by unusual or non-recurring items or changes in our customer base. Additionally, our presentation of Adjusted EBITDA may differ from that included in the Credit Agreement, the 2025 Notes Indenture and the 2028 Notes Indenture for purposes of covenant calculation.
67
The following tables reconcile Net loss to Adjusted EBITDA and Management EBITDA for the periods presented.
|
|
|
Fiscal year ended |
|
|||||||||
|
($ in millions) |
|
January 3, 2021 |
|
|
December 29, 2019 |
|
|
December 30, 2018 |
|
|||
|
Net loss |
|
$ |
(211.9 |
) |
|
$ |
(156.9 |
) |
|
$ |
(248.8 |
) |
|
Interest expense, net |
|
|
198.2 |
|
|
|
231.4 |
|
|
|
235.6 |
|
|
Depreciation and amortization |
|
|
325.9 |
|
|
|
327.5 |
|
|
|
332.2 |
|
|
(Benefit from) provision for income taxes |
|
|
(13.4 |
) |
|
|
(23.9 |
) |
|
|
31.2 |
|
|
Unrealized foreign currency exchanges losses (gains)(a) |
|
|
63.0 |
|
|
|
(19.6 |
) |
|
|
46.5 |
|
|
Restructuring and severance-related costs(b) |
|
|
11.7 |
|
|
|
36.0 |
|
|
|
38.3 |
|
|
Debt refinancing costs and loss on extinguishment of debt |
|
|
12.6 |
|
|
|
- |
|
|
|
20.6 |
|
|
Stock-based compensation(c) |
|
|
8.6 |
|
|
|
18.6 |
|
|
|
5.9 |
|
|
Tax indemnification expense (income), net(d) |
|
|
31.2 |
|
|
|
29.2 |
|
|
|
(13.1 |
) |
|
Quotient upfront payment(e) |
|
|
7.5 |
|
|
|
- |
|
|
|
- |
|
|
Other adjustments(f) |
|
|
22.6 |
|
|
|
35.2 |
|
|
|
19.4 |
|
|
Adjusted EBITDA |
|
|
456.0 |
|
|
|
477.5 |
|
|
|
467.8 |
|
|
Management adjustments and realized foreign exchange losses (g) |
|
|
70.7 |
|
|
|
25.1 |
|
|
|
17.7 |
|
|
Management EBITDA |
|
$ |
526.7 |
|
|
$ |
502.6 |
|
|
$ |
485.5 |
|
|
(a) |
Represents noncash unrealized gains and losses resulting from the remeasurement of transactions denominated in foreign currencies primarily related to intercompany loans. |
|
(b) |
Represents restructuring and severance costs related to several discrete initiatives intended to strengthen operational performance and to support building our commercial capabilities including a project announced in fiscal year ended January 3, 2016 to outsource equipment manufacturing operations in Rochester, New York and a project announced in fiscal year ended December 30, 2018 to transfer certain production lines among facilities. |
|
(c) |
Represents stock-based compensation expense including the $14.7 million modification impact of a 2019 amendment to our stock option agreement, where performance-based options that did not previously vest based on applicable minimum earnings targets will vest over a specified future period of time. |
|
(d) |
Represents the reversal of the impact of tax indemnification income with Johnson & Johnson, primarily related to certain state tax matters, for which we recorded a tax reserve and indemnification. These state tax matters primarily include the taxability of the sale of our assets on the Acquisition date from Johnson & Johnson. Additionally, during the second quarter ended June 30, 2019, we recorded indemnification expense related to the release of certain tax reserves upon the settlement of certain state tax matters that were settled for an amount lower than what we had estimated. |
|
(e) |
Represents an initial, non-refundable upfront payment made to Quotient Ltd. (“Quotient”), one of our partners and suppliers. See Note 13, “Collaborations and other relationships,” to our audited consolidated financial statements included elsewhere in this Annual Report on Form 10-K for further discussion of the Quotient relationship. |
|
(f) |
Represents miscellaneous other adjustments related to unusual items impacting our results including the elimination of management fees, non-cash derivative mark-to-market (gain) loss and certain asset write-downs. See information below: |
|
|
|
Fiscal year ended |
|
|||||||||
|
($ in millions) |
|
January 3, 2021 |
|
|
December 29, 2019 |
|
|
December 30, 2018 |
|
|||
|
EU medical device regulation transition costs |
|
$ |
4.3 |
|
|
$ |
3.2 |
|
|
$ |
0.6 |
|
|
Principal shareholder management fee |
|
|
3.0 |
|
|
|
3.1 |
|
|
|
3.0 |
|
|
Derivative mark-to-market (gain) loss |
|
|
1.5 |
|
|
|
16.0 |
|
|
|
2.7 |
|
|
Noncash losses on property, plant and equipment disposals |
|
|
0.6 |
|
|
|
2.5 |
|
|
|
2.9 |
|
|
Other |
|
|
13.2 |
|
|
|
10.4 |
|
|
|
10.2 |
|
|
Total other adjustments |
|
$ |
22.6 |
|
|
$ |
35.2 |
|
|
$ |
19.4 |
|
|
(g) |
Represents realized foreign currency losses (gains), impact from adoption of accounting standards, costs in connection with COVID-19 and other immaterial management adjustments. |
Segment Results
The key indicators that we monitor are as follows:
|
|
• |
Net revenue - This measure is discussed in the section entitled “Results of operations;” |
68
Fiscal year ended January 3, 2021 compared with fiscal year ended December 29, 2019
|
|
|
Fiscal year ended |
|
|||||||||
|
($ in millions) |
|
January 3, 2021 |
|
|
December 29, 2019 |
|
|
% Change |
|
|||
|
Segment net revenue |
|
|
|
|
|
|
|
|
|
|
|
|
|
Americas |
|
$ |
1,067.3 |
|
|
$ |
1,042.5 |
|
|
|
2.4 |
% |
|
EMEA |
|
|
240.6 |
|
|
|
251.5 |
|
|
|
(4.3 |
)% |
|
Greater China |
|
|
229.6 |
|
|
|
242.5 |
|
|
|
(5.3 |
)% |
|
Other |
|
|
228.7 |
|
|
|
265.0 |
|
|
|
(13.7 |
)% |
|
Net revenue |
|
$ |
1,766.2 |
|
|
$ |
1,801.5 |
|
|
|
(2.0 |
)% |
|
|
|
Fiscal year ended |
|
|||||||||
|
($ in millions) |
|
January 3, 2021 |
|
|
December 29, 2019 |
|
|
% Change |
|
|||
|
Segment Management EBITDA |
|
|
|
|
|
|
|
|
|
|
|
|
|
Americas |
|
$ |
486.8 |
|
|
$ |
418.4 |
|
|
|
16.3 |
% |
|
EMEA |
|
|
50.9 |
|
|
|
54.9 |
|
|
|
(7.3 |
)% |
|
Greater China |
|
|
107.3 |
|
|
|
118.4 |
|
|
|
(9.4 |
)% |
|
Other |
|
|
73.5 |
|
|
|
88.8 |
|
|
|
(17.2 |
)% |
|
Corporate |
|
|
(191.8 |
) |
|
|
(177.9 |
) |
|
|
7.8 |
% |
|
Total Management EBITDA |
|
$ |
526.7 |
|
|
$ |
502.6 |
|
|
|
4.8 |
% |
Americas
Net revenue was $1,067.3 million for the fiscal year ended January 3, 2021 compared to net revenue of $1,042.5 million for the fiscal year ended December 29, 2019. The increase of $24.8 million, or 2.4%, which included operational net revenue growth of 4.1% partially offset by a negative impact of 1.7% from foreign currency fluctuations, was primarily due to higher Clinical Laboratories revenue in the North America region related to sales of our COVID-19 antibody tests and other assays, instrument sales and grant revenue related to development of our COVID-19 antibody and antigen tests. These increases were partially offset by decreased shipments to customers in the North America region in the Transfusion Medicine business and in the LATAM region for both the Clinical Laboratories and Transfusion Medicine businesses as a result of the global COVID-19 pandemic.
Management EBITDA was $486.8 million for the fiscal year ended January 3, 2021 compared to management EBITDA of $418.4 million for the fiscal year ended December 29, 2019. The increase of $68.4 million, or 16.3%, was primarily due to higher revenues in the North America region, lower employee-related costs and lower travel-related costs.
EMEA
Net revenue was $240.6 million for the fiscal year ended January 3, 2021 compared to net revenue of $251.5 million for the fiscal year ended December 29, 2019. The decrease of $10.9 million, or 4.3%, which included operational net revenue declines of 5.3% partially offset by a positive impact of 1.0% from foreign currency fluctuations, was primarily due to decreased shipments to customers as a result of the global COVID-19 pandemic.
Management EBITDA was $50.9 million for the fiscal year ended January 3, 2021 compared to management EBITDA of $54.9 million for the fiscal year ended December 29, 2019. The decrease of $4.0 million, or 7.3%, was primarily due to decreased shipments
69
to customers as a result of the global COVID-19 pandemic, partially offset by lower employee-related costs and lower travel-related costs.
Greater China
Net revenue was $229.6 million for the fiscal year ended January 3, 2021 compared to net revenue of $242.5 million for the fiscal year ended December 29, 2019. The decrease of $12.9 million, or 5.3%, which included operational net revenue declines of 6.0% partially offset by a positive impact of 0.7% from foreign currency fluctuations, was primarily due to decreased shipments to customers as a result of the global COVID-19 pandemic.
Management EBITDA was $107.3 million for the fiscal year ended January 3, 2021 compared to management EBITDA of $118.4 million for the fiscal year ended December 29, 2019. The decrease of $11.1 million, or 9.4%, was primarily due to decreased shipments to customers as a result of the global COVID-19 pandemic, partially offset by lower travel-related costs.
Other
Net revenue was $228.7 million for the fiscal year ended January 3, 2021 compared to net revenue of $265.0 million for the fiscal year ended December 29, 2019. The decrease of $36.3 million, or 13.7%, which included operational net revenue declines of 14.0% partially offset by a positive impact of 0.3% from foreign currency fluctuations, was primarily due to decreased shipments to customers as a result of the global COVID-19 pandemic as well as the lower revenue related to a supply agreement in our HCV business in the Japan region.
Management EBITDA was $73.5 million for the fiscal year ended January 3, 2021 compared to management EBITDA of $88.8 million for the fiscal year ended December 29, 2019. The decrease of $15.3 million, or 17.2%, was primarily due to decreased shipments to customers as a result of the global COVID-19 pandemic as well lower revenue related to a supply agreement in our HCV business in the Japan region, partially offset by lower employee-related costs.
Fiscal year ended December 29, 2019 compared with fiscal year ended December 30, 2018
|
|
|
Fiscal year ended |
|
|||||||||
|
($ in millions) |
|
December 29, 2019 |
|
|
December 30, 2018 |
|
|
% Change |
|
|||
|
Segment net revenue |
|
|
|
|
|
|
|
|
|
|
|
|
|
Americas |
|
$ |
1,042.5 |
|
|
$ |
1,041.6 |
|
|
|
0.1 |
% |
|
EMEA |
|
|
251.5 |
|
|
|
263.6 |
|
|
|
(4.6 |
)% |
|
Greater China |
|
|
242.5 |
|
|
|
224.3 |
|
|
|
8.1 |
% |
|
Other |
|
|
265.0 |
|
|
|
257.8 |
|
|
|
2.8 |
% |
|
Net revenue |
|
$ |
1,801.5 |
|
|
$ |
1,787.3 |
|
|
|
0.8 |
% |
|
|
|
Fiscal year ended |
|
|||||||||
|
($ in millions) |
|
December 29, 2019 |
|
|
December 30, 2018 |
|
|
% Change |
|
|||
|
Segment Management EBITDA |
|
|
|
|
|
|
|
|
|
|
|
|
|
Americas |
|
$ |
418.4 |
|
|
$ |
420.4 |
|
|
|
(0.5 |
)% |
|
EMEA |
|
|
54.9 |
|
|
|
48.4 |
|
|
|
13.4 |
% |
|
Greater China |
|
|
118.4 |
|
|
|
102.5 |
|
|
|
15.5 |
% |
|
Other |
|
|
88.8 |
|
|
|
83.3 |
|
|
|
6.6 |
% |
|
Corporate |
|
|
(177.9 |
) |
|
|
(169.1 |
) |
|
|
5.2 |
% |
|
Total Management EBITDA |
|
$ |
502.6 |
|
|
$ |
485.5 |
|
|
|
3.5 |
% |
Americas
Net revenue was $1,042.5 million for the fiscal year ended December 29, 2019 compared to net revenue of $1,041.6 million for the fiscal year ended December 30, 2018. The increase of $0.9 million, or 0.1%, was primarily due to increased reagent sales in our Clinical Laboratories business partially offset by lower non-core collaboration and other revenue of $8.8 million and lower instrument sales in our Donor Screening business.
Management EBITDA was $418.4 million for the fiscal year ended December 29, 2019 compared to management EBITDA of $420.4 million for the fiscal year ended December 30, 2018. The decrease of $2.0 million, or 0.5%, was due to strategic investments in our sales force and higher customer service costs.
70
Net revenue was $251.5 million for the fiscal year ended December 29, 2019 compared to net revenue of $263.6 million for the fiscal year ended December 30, 2018. The decrease of $12.1 million, or 4.6%, was primarily due to negative impact of foreign currency of approximately $10 million.
Management EBITDA was $54.9 million for the fiscal year ended December 29, 2019 compared to management EBITDA of $48.4 million for the fiscal year ended December 30, 2018. The increase of $6.5 million, or 13.4%, was due to lower operating costs.
Greater China
Net revenue was $242.5 million for the fiscal year ended December 29, 2019 compared to net revenue of $224.3 million for the fiscal year ended December 30, 2018. The increase of $18.2 million, or 8.1%, was primarily due to higher reagent and instrument sales in our Clinical Laboratories business, partially offset by negative impact of foreign currency of approximately $10 million.
Management EBITDA was $118.4 million for the fiscal year ended December 29, 2019 compared to management EBITDA of $102.5 million for the fiscal year ended December 30, 2018. The increase of $15.9 million, or 15.5%, was primarily due to the increases in revenue described above, partially offset by strategic investments in the region.
Other
Net revenue was $265.0 million for the fiscal year ended December 29, 2019 compared to net revenue of $257.8 million for the fiscal year ended December 30, 2018. The increase of $7.2 million, or 2.8%, was due to strong growth in the ASPAC region, partially offset by negative impact of foreign currency of approximately $1.5 million.
Management EBITDA was $88.8 million for the fiscal year ended December 29, 2019 compared to management EBITDA of $83.3 million for the fiscal year ended December 30, 2018. The increase of $5.5 million, or 6.6%, was due to higher volumes, favorable product mix and lower operating expenses.
Liquidity and capital resources
During January 2020, we amended our Revolving Credit Facility, entered into the Euro Term Loan Facility and issued the 2028 Notes. Concurrently with the issuance of the 2028 Notes, we entered into a $350 million U.S. dollar-equivalent swap to Japanese Yen-denominated interest at a weighted average rate of 5.56% with a five-year term. During June 2020, we issued the 2025 Notes. During the fiscal years ended December 30, 2018 and December 31, 2017, we amended our Dollar Term Loan Facility and Revolving Credit Facility. See “—Debt capitalization” for additional details.
As of January 3, 2021 and December 29, 2019, we have no outstanding borrowings under the Revolving Credit Facility. Letters of credit issued under the Revolving Credit Facility totaled $37.5 million and $34.6 million as of January 3, 2021 and December 29, 2019, respectively. Our availability under the Revolving Credit Facility was $312.5 million and $315.4 million as of January 3, 2021 and December 29, 2019, respectively. On February 5, 2021, we increased the size of the Revolving Credit Facility by $150.0 million to an aggregate amount of $500.0 million.
In fiscal year 2016, we entered into the Financing Program with Wells Fargo Bank, N.A. The Financing Program is secured by receivables from the Ortho U.S. business that are sold or contributed to a wholly-owned, consolidated, bankruptcy remote subsidiary. The bankruptcy remote subsidiary’s sole business consists of the purchase or receipt of the receivables and subsequent granting of a security interest to the financial institution under the program, and its assets are available first to satisfy obligations and are not available to pay creditors of our other legal entities. Under the Financing Program, we may borrow up to the lower of $75 million or 85% of the eligible accounts receivable borrowing base. At January 3, 2021 and December 29, 2019, the eligible accounts receivable borrowing base was $81.4 million and $90.7 million, respectively. Interest on outstanding borrowing under the Financing Program is charged based on a per annum rate equal to LIBOR Rate (with a floor of zero percent and as defined in the agreement) plus the LIBOR Rate Margin (2.25 percentage points) if the related loan is a LIBOR Rate Loan. Otherwise, the per annum rate is equal to a Base Rate (as defined in the agreement) plus the Base Rate Margin (1.25 percentage points). Interest is due and payable, in arrears, on the first day of each month. The Financing Program is also subject to termination under standard events of default as defined. Costs related to the Financing Program of $1.0 million were recorded as a reduction of the principal amount of the borrowings and are amortized using the effective interest method as a component of interest expense over the life of the Financing Program. As of January 3, 2021 and December 29, 2019, the remaining unamortized balance was $0.2 million and $0.3 million, respectively. On January 24, 2019, we extended the maturity of our Financing Program from September 23, 2019 to January 24, 2022. In addition, we amended our Financing Program terms to increase availability under the terms of the program within the existing $75 million limit of the agreement.
In fiscal year 2016, we entered into a sale-leaseback financing arrangement with a third-party financing company (the “Buyer-lessor”) related to specific property and equipment of the Company. The property and equipment were sold for $36.3 million and leased
71
back over an initial term of two years. The monthly lease payments are $1.5 million until the equipment is repurchased or the lease is terminated. At the end of the initial term, we had the option to repurchase the property and equipment at a price to be negotiated with the Buyer-lessor or terminate the lease arrangement, return the property and (possibly) enter into a new lease agreement. During the fiscal second quarter ended July 1, 2018, we gave notice to the Buyer-lessor that we intended to negotiate with the Buyer-lessor the purchase of the property and equipment at the end of the initial term and have had discussions negotiating the repurchase price for the property and equipment. According to the agreement and subject to certain legal interpretations, if the parties do not reach an agreement to purchase the property and equipment at the end of the initial term, the lease will automatically renew for another year, after which the lease will automatically be renewed for successive 6-month periods, provided that each of the Company and the Buyer-lessor have a right to terminate the lease 30 days prior to the end of each 6-month renewal period. A security deposit for the leaseback was retained by the third-party financing company and will be refunded to us at the end of the lease term. The balance of the security deposit was $9.1 million as of January 3, 2021 and December 29, 2019, and was included in other current assets in the consolidated balance sheet. The transaction did not meet the criteria for sale-leaseback accounting as the security deposit constitutes a continuing involvement. Therefore, we are accounting for this arrangement as a financing and recorded a financing obligation amounting to $36.3 million at inception.
On February 9, 2021, the Company and the Buyer-lessor agreed on a repurchase price of $21.0 million for the property and equipment, net of the security deposit, by entering into a settlement agreement to resolve the outstanding legal proceedings with respect to the lease arrangement.
Historical cash flows
The following table presents a summary of our net cash inflows (outflows) for the periods shown
|
|
|
Fiscal year ended |
|
|||||||||
|
($ in millions) |
|
January 3, 2021 |
|
|
December 29, 2019 |
|
|
December 30, 2018 |
|
|||
|
Net cash provided by operating activities |
|
$ |
46.1 |
|
|
$ |
143.0 |
|
|
$ |
69.6 |
|
|
Net cash (used in) investing activities |
|
|
(45.4 |
) |
|
|
(68.5 |
) |
|
|
(87.1 |
) |
|
Net cash provided by (used in) financing activities |
|
|
55.8 |
|
|
|
(64.4 |
) |
|
|
(8.2 |
) |
Fiscal year ended January 3, 2021
Net cash flows provided by operating activities
Net cash provided by operating activities was $46.1 million for the fiscal year ended January 3, 2021. Factors resulting in cash provided by operating activities included cash inflows from earnings before interest, taxes, depreciation and amortization expense and other noncash items and lower accounts receivable of $33.3 million, partially offset by interest paid on borrowings of $191.8 million, net investment in inventories of $152.0 million, which includes $132.3 million of instrument inventories that were transferred from “Inventories” to “Property, plant and equipment, net”. Net cash provided by operating activities for fiscal year 2020 decreased $96.9 million compared to fiscal year 2019 primarily due to the impact of the global pandemic.
Net cash flows used in investing activities
Purchases of property, plant and equipment during the fiscal year ended January 3, 2021 were $44.1 million. As of January 3, 2021 and December 29, 2019 , accounts payable and accrued liabilities included amounts related to purchases of property, plant and equipment and capitalized internal-use software costs, which totaled $11.4 million and $14.1 million, respectively. In addition to the capital expenditures of $44.1 million, we made noncash transfers of $132.3 million of instrument inventories from “Inventories” to “Property, plant and equipment, net” further increasing our investment in property, plant and equipment.
Net cash flows used in financing activities
During the fiscal year ended January 3, 2021, net proceeds from the issuance of the 2025 Notes, 2028 Notes and Euro Term Loan Facility of $1,421.0 million were offset by payments on the 2022 Notes of $1,363.5 million. Net payments on short-term borrowings were $3.5 million.
Fiscal year ended December 29, 2019
Net cash flows provided by operating activities
Net cash provided by operating activities was $143.0 million for the fiscal year ended December 29, 2019. Factors resulting in cash provided by operating activities included cash inflows from earnings before interest, taxes, depreciation and amortization expense and other noncash items and higher accounts payable and accrued liabilities of $83.6 million , partially offset by interest paid on
72
borrowings of $189.7 million, net investment in inventories of $108.6 million, which includes $118.6 million of instrument inventories that were transferred from “Inventories” to “Property, plant and equipment, net”.
Net cash flows used in investing activities
Purchases of property, plant and equipment during the fiscal year ended December 29, 2019 were $66.2 million. As of December 29, 2019 and December 30, 2018, accounts payable and accrued liabilities included amounts related to purchases of property, plant and equipment and capitalized internal-use software costs, which totaled $14.1 million and $17.2 million, respectively. In addition to the capital expenditures of $66.2 million, we made noncash transfers of $118.6 million of instrument inventories from “Inventories” to “Property, plant and equipment, net” further increasing our investment in property, plant and equipment.
Net cash flows used in financing activities
Net cash used in financing activities was $64.4 million for the fiscal year ended December 29, 2019 and was primarily related to net short-term borrowings payments of $17.2 million and payments on long-term debt of $49.7 million.
Fiscal year ended December 30, 2018
Net cash flows provided by operating activities
Net cash provided by operating activities was $69.6 million for the fiscal year ended December 30, 2018. Factors resulting in cash provided by operating activities included cash inflows from earnings before interest, taxes, depreciation and amortization expense and other noncash items, partially offset by interest paid on borrowings of $218.8 million, net investment in inventories of $83.3 million, which includes $93.0 million of instrument inventories that were transferred from “Inventories” to “Property, plant and equipment, net,” and lower accounts payable and accrued liabilities of $22.4 million.
Net cash flows used in investing activities
Purchases of property, plant and equipment during the fiscal year ended December 30, 2018 were $79.2 million. As of December 30, 2018 and December 31, 2017, accounts payable and accrued liabilities included amounts related to purchases of property, plant and equipment and capitalized internal-use software costs, which totaled $17.2 million and $13.0 million, respectively. In addition to the capital expenditures of $79.2 million, we made noncash transfers of $93.0 million of instrument inventories from “Inventories” to “Property, plant and equipment, net” further increasing our investment in property, plant and equipment. We also paid working capital and fixed assets adjustments of $8.1 million related primarily to the Day 2 Country closing in Brazil.
Net cash flows used in financing activities
During the fiscal year ended December 30, 2018, we entered into a second amendment to our Senior Secured Credit Facilities, to, among other things, refinance a U.S. dollar-denominated term loan facility, with net proceeds of $101.3 million related to the new Dollar Term Loan Facility, of which $72.8 million was used to pay off the previous U.S. dollar-denominated term loan facility and $21.2 million was used to pay interest and third party fees, which were included in other operating expense. The remaining proceeds of $7.3 million were used for general corporate purposes. Net short-term borrowings were $15.2 million and payments on long-term debt were $125.5 million, which included $72.8 million related to the previous U.S. dollar-denominated term loan facility.
Debt capitalization
As of January 3, 2021 and December 29, 2019, we had $132.8 million and $72.0 million of cash and cash equivalents, respectively. As of January 3, 2021 and December 29, 2019, $108.8 million and $58.4 million, respectively, of these cash and cash equivalents were maintained in non-U.S. jurisdictions in foreign currencies. We believe our organizational structure allows us the necessary flexibility to move funds throughout our subsidiaries to meet our operational working capital needs.
73
The following table details our debt outstanding as of January 3, 2021 and December 29, 2019:
|
($ in millions) |
|
January 3, 2021 |
|
|
December 29, 2019 |
|
||
|
Senior Secured Credit Facilities |
|
|
|
|
|
|
|
|
|
Dollar Term Loan Facility |
|
$ |
2,185.5 |
|
|
$ |
2,243.6 |
|
|
Euro Term Loan Facility |
|
|
408.9 |
|
|
|
— |
|
|
Revolving Credit Facility |
|
|
— |
|
|
|
— |
|
|
2028 Notes |
|
|
675.0 |
|
|
|
— |
|
|
2025 Notes |
|
|
400.0 |
|
|
|
— |
|
|
2022 Notes |
|
|
— |
|
|
|
1,300.0 |
|
|
Accounts Receivable Financing |
|
|
75.0 |
|
|
|
75.0 |
|
|
Sale and Leaseback Financing |
|
|
20.5 |
|
|
|
20.5 |
|
|
Capital lease obligation |
|
|
1.0 |
|
|
|
2.6 |
|
|
Other short-term borrowings |
|
|
0.9 |
|
|
|
1.0 |
|
|
Other long-term borrowings |
|
|
3.9 |
|
|
|
4.6 |
|
|
Unamortized deferred financing costs |
|
|
(40.9 |
) |
|
|
(34.6 |
) |
|
Unamortized original issue discount |
|
|
(11.3 |
) |
|
|
(13.6 |
) |
|
Total borrowings |
|
|
3,718.5 |
|
|
|
3,599.1 |
|
|
Less: Current portion |
|
|
(160.0 |
) |
|
|
(156.7 |
) |
|
Long-term borrowings |
|
$ |
3,558.5 |
|
|
$ |
3,442.4 |
|
As of January 3, 2021 and December 29, 2019, there were no outstanding borrowings under the Revolving Credit Facility. As of January 3, 2021 and December 29, 2019, letters of credit issued under the Revolving Credit Facility totaled $37.5 million and $34.6 million, respectively, which reduced the availability under the Revolving Credit Facility. Availability under the Revolving Credit Facility was $312.5 million and $315.4 million as of January 3, 2021 and December 29, 2019, respectively. Our debt agreements contain various covenants that may restrict our ability to borrow on available credit facilities and future financing arrangements or require us to remain below a specific credit coverage threshold. We believe that we are and will continue to be in compliance with these covenants.
On June 6, 2017, we amended the Credit Agreement governing our Senior Secured Credit Facilities to, among other amendments, provide for the Incremental Term Loan of $200.0 million. The net proceeds of approximately $197.6 million were used primarily to reduce the outstanding borrowings on our existing Revolving Credit Facility and for general corporate purposes.
On June 8, 2018, we entered into a second amendment to our Senior Secured Credit Facilities, pursuant to which we refinanced our Dollar Term Loan Facility and Revolving Credit Facility. The net proceeds of approximately $101.3 million were used to repay outstanding borrowings under our existing Dollar Term Loan Facility and general corporate purposes. As part of the refinancing, we extended the maturity dates of our Dollar Term Loan Facility and Revolving Credit Facility to June 30, 2025 and June 30, 2023, respectively, subject to certain other limitations.
We accounted for the portion of lenders whose participation in the Senior Secured Credit Facilities terminated on June 8, 2018 as an extinguishment of debt. The remaining lenders that continued their participation in the Dollar Term Loan Facility and the extension of the Revolving Credit Facility were accounted for as a modification of our existing indebtedness. During the fiscal second quarter ended July 1, 2018, we recorded a $2.1 million loss on extinguishment of debt included as a component of “Other expense (income), net”, primarily related to unamortized debt issuance costs and investor discount costs. We incurred original issue discount costs of $5.8 million related to the Dollar Term Loan Facility, which was capitalized as deferred financing costs and are being amortized using the effective interest method as a component of interest expense over the life of the Dollar Term Loan Facility. We also incurred lender fees and third party fees of $5.0 million related to the Revolving Credit Facility, which was included in other assets and is being amortized on a straight-line basis over the term of the amended Revolving Credit Facility. As of January 3, 2021 and December 29, 2019 , the remaining balance of deferred financing costs related to the Dollar Term Loan Facility was $17.3 million and $20.9 million, respectively. As of January 3, 2021 and December 29, 2019 , the remaining unamortized balance related to the Revolving Credit Facility was $3.4 million and $4.8 million, respectively. The effective interest rate of the Dollar Term Loan Facility as of January 3, 2021 is 5.65%. During the fiscal year ended December 30, 2018, we expensed $18.5 million of debt refinancing costs, included in “Other operating expense, net” in the consolidated statement of operations.
On January 7, 2020, we entered into a third amendment to the Credit Agreement, which amended the financial covenant contained therein. After giving effect to the amendment, the financial covenant is tested when borrowings under the Revolving Credit Facility exceed $105 million at any period end reporting date and provides that Holdings will not permit the first lien net leverage ratio as of the end of such fiscal quarter of the Lux Co-Issuer and its restricted subsidiaries to be greater than (i) 6.00:1.00 for each fiscal
74
quarter ending after January 7, 2020 and on or prior to June 30, 2021, (ii) 5.50:1.00 for each fiscal quarter ending after June 30, 2021 and on or prior to September 30, 2022 and (iii) 5.00:1:00 for each fiscal quarter ending thereafter.
On January 27, 2020, we entered into a fourth amendment to the Credit Agreement, where we entered into the Euro Term Loan Facility in an amount equal to the Euro-equivalent of $375 million, which bears interest at a rate of Euribor + 350 basis points per annum. The Euro Term Loan Facility will mature on June 30, 2025. The Euro Term Loan Facility is expected to amortize in equal quarterly installments in an amount equal to 1.00% per annum of the original aggregate principal amount thereof, with the remaining balance due at final maturity. We incurred deferred financing costs of $5.4 million related to the Euro Term Loan Facility, which were capitalized as deferred financing costs and are being amortized using the effective interest method as a component of interest expense over the life of the Euro Term Loan Facility.
On February 5, 2021, we entered into a fifth amendment to the Credit Agreement, which increased the Revolving Credit Facility contained in the credit agreement by $150 million to an aggregate amount of $500 million and extended the maturity date to February 5, 2026, provided that such date may be accelerated subject to certain circumstances as set forth in the fifth amendment. To the extent that the aggregate principal amount of the Dollar Term Loan Facility and Euro Term Loan Facility (and any Refinancing Indebtedness (as defined in the Credit Agreement) with respect thereto that matures on or prior to June 30, 2025) outstanding as of March 31, 2025 exceeds $500 million then the maturity date with respect to the Revolving Credit Facility shall be March 31, 2025. All other terms of the Senior Secured Credit Facilities will remain substantially the same except as otherwise amended by the fifth amendment.
On February 5, 2021 and February 9, 2021, we used a portion of the proceeds from our IPO to repay $706.6 million and $186.1 million, respectively, of borrowings under the Dollar Term Loan Facility. In aggregate, we repaid $892.7 million of borrowings under the Dollar Term Loan Facility.
On January 27, 2020, we issued $675 million aggregate principal amount of the 2028 Notes, which bear interest at a rate of 7.250% per annum payable semi-annually in arrears on February 1 and August 1 of each year, commencing August 1, 2020. The 2028 Notes will mature on February 1, 2028. The 2028 Notes are our senior unsecured obligations and the 2028 Notes and the guarantees rank equally in right of payment with all of the Lux Co-Issuer’s and U.S. Co-Issuer’s (together, the “Issuers”) and guarantors’ existing and future senior debt, including the 2025 Notes. The 2028 Notes and the guarantees thereof are effectively subordinated to any of the Issuers’ and guarantors’ existing and future secured debt, including the Senior Secured Credit Facilities and the Financing Program, to the extent of the value of the assets securing such debt. In addition, the 2028 Notes and the guarantees thereof rank senior in right of payment to all of the Issuers’ and guarantors’ future subordinated debt and will be structurally subordinated to the liabilities of our non-guarantor subsidiaries. We incurred deferred financing costs of $12.9 million related to the 2028 Notes, which were capitalized as deferred financing costs and are being amortized using the effective interest method as a component of interest expense over the life of the 2028 Notes. Concurrent with the issuance of the $675 million aggregate principal amount of 2028 Notes, we entered into a $350 million U.S. dollar equivalent swap to Japanese Yen-denominated interest at a weighted average rate of 5.56%, for a five-year term. On February 5, 2021, we used a portion of the proceeds from our IPO to redeem $270 million of the 2028 Notes, plus accrued interest thereon and $19.6 million of redemption premium.
On June 11, 2020, we issued $400 million aggregate principal amount of the 2025 Notes, which bear interest at a rate of 7.375% per annum, payable semi-annually in arrears on June 1 and December 1 of each year, commencing December 1, 2020. The 2025 Notes will mature on June 1, 2025. The 2025 Notes are our unsecured obligations and the 2025 Notes and the guarantees thereof rank equally in right of payment with all of the Issuers’ and guarantors’ existing and future senior debt, including the 2028 Notes. The 2025 Notes and the guarantees thereof are effectively subordinated to any of the Issuers’ and guarantors’ existing and future secured debt, including the Senior Secured Credit Facilities and the Financing Program, to the extent of the value of the assets securing such debt. In addition, the 2025 Notes and the guarantees thereof rank senior in right of payment to all of the Issuers’ and guarantors’ future subordinated debt and will be structurally subordinated to the liabilities of the Issuers’ non-guarantor subsidiaries. We incurred deferred financing costs of $7.5 million related to the 2025 Notes, which were capitalized as deferred financing costs and are being amortized using the effective interest method as a component of interest expense over the life of the 2025 Notes. On February 5, 2021, we used a portion of the proceeds from our IPO to redeem $160 million of the 2025 Notes, plus accrued interest thereon and $11.8 million of redemption premium.
We or our affiliates, including investment funds affiliated with Carlyle, at any time and from time to time, may purchase Senior Notes or our other indebtedness. Any such purchases may be made through the open market or privately negotiated transactions with third parties or pursuant to one or more tender or exchange offers or otherwise, upon such terms and at such prices, as well as with such consideration, as we, or any of our affiliates, may determine. Such purchases could result in a change to the allocation between the Issuers of the indebtedness represented by the Senior Notes and could have important tax consequences for holders of the Senior Notes.
75
We have previously undertaken several initiatives intended to strengthen operational performance and to support building our capabilities to enable us to win in the marketplace. These activities to improve operational performance are primarily cost reduction and productivity improvement initiatives in procurement, manufacturing, supply chain and logistics. We expect these activities and other cost reduction and productivity improvement initiatives that we will implement to reduce pre-tax operating expenses and result in aggregate cost savings of approximately $43 million in fiscal years 2021 and 2022.
During the fiscal year ended January 3, 2016, we announced that we will outsource our equipment manufacturing operations in Rochester, New York and refurbishment operations in Neckargemund, Germany to a third-party contract manufacturing company. As a result of these initiatives, we had a reduction of approximately 110 positions worldwide from 2015 through 2018. These initiatives were substantially completed during the fiscal year ended December 29, 2019, with total charges incurred of $75.4 million. We made cash payments of $6.5 million during the fiscal year ended January 3, 2021 and have made cumulative cash payments of $71.0 million to date, respectively, related to these initiatives. The remaining cash payments, related to severances, of approximately $0.1 million are expected to be made during the fiscal first quarter of 2021.
During the fiscal year ended December 30, 2018, we announced that we will transfer certain production lines among facilities in order to achieve operational and cost efficiencies. We estimate that the implementation of these initiatives will result in pre-tax charges of approximately $22 million, comprised of approximately $12 million in accelerated depreciation, $5 million in severance charges and $5 million in other facility-related costs. These initiatives are expected to be substantially completed during fiscal 2021. We incurred net charges of $0.1 million and incurred charges of $19.1 million during the fiscal year ended January 3, 2021 and cumulative to date, respectively, related to these initiatives. We made cash payments of $1.8 million during the fiscal year ended January 3, 2021 and we have made cumulative cash payments of $5.8 million, respectively, related to these initiatives. The majority of the remaining cash payments are expected to be made during fiscal year 2021.
We also expect to incur approximately $10 million of capital expenditures related to the transferred production lines. We made cash payments of $9.3 million cumulative to date for capital expenditures related to these initiatives.
For additional information on our restructuring activities, see Note 13, “Collaborations and other relationships,” to our audited consolidated financial statements included elsewhere in this Annual Report on Form 10-K.
Outlook
Short-term liquidity outlook
We expect that our cash and cash equivalents, cash flows from operations and amounts available under the Revolving Credit Facility will be sufficient to meet debt service requirements, working capital requirements, and capital expenditures for at least the next twelve months from the issuance date of this Annual Report on Form 10-K. Our ability to make scheduled payments of principal or interest on, or to refinance, our indebtedness or to fund working capital requirements, capital expenditures and other current obligations will depend on our ability to generate cash from operations. Such cash generation is subject to general economic, financial, competitive, legislative, regulatory and other factors that are beyond our control.
We are focused on expanding the number of instruments placed in the field and solidifying long-term contractual relationships with customers. In order to achieve this goal, in certain jurisdictions where it is permitted, we have leveraged a reagent rental model that has been recognized as more attractive to certain customers. In this model, we lease, rather than sell, instruments to our customers. Over the term of the contract, the purchase price of the instrument is embedded in the price of the assays and reagents. Going forward, we intend to increase the number of reagent rental placements in developed markets, a strategy that we believe is beneficial to our commercial goals because it lowers our customers’ upfront capital costs and therefore allows purchasing decisions to be made at the lab manager level. For these same reasons, the reagent rental model also benefits our commercial strategy in emerging markets. We believe that the shift in our sales strategy will grow our installed base, thereby increasing sales of higher-margin assays, reagents and other consumables over the life of the customer contracts and enhancing our recurring revenue and cash flows. During the fiscal year ended January 3, 2021, we transferred $132.3 million of instrument inventories from “Inventories” to “Property, plant and equipment,” further increasing our investment in property, plant and equipment. We currently estimate that we will transfer additional instrument inventories of approximately $126 million during fiscal 2021.
Based on our forecasts, we believe that cash flow from operations, available cash on hand and available borrowing capacity under our Revolving Credit Facility will be sufficient to fund continuing operations for at least the next twelve months from the issuance date of the Annual Report on Form 10-K. Our debt agreements contain various covenants that may restrict our ability to borrow on available credit facilities and future financing arrangements and require us to remain below a specific credit coverage threshold. Our credit agreement has a financial covenant (ratio of Net First Lien Secured Debt to Adjusted EBITDA not to exceed 6-to-1, subject to two 50 basis point step-downs on June 30, 2021 and September 30, 2022) that is tested when more than 30% of the Revolving Credit
76
Facility (including letters of credit) is outstanding at the end of a fiscal quarter. As of January 3, 2021, we had no outstanding borrowings under our Revolving Credit Facility. We believe that we will continue to comply with the financial covenant for the next 12 months. In the event we do not comply with the financial covenant of the Revolving Credit Facility, the lenders will have the right to call on all of the borrowings under the revolving facility. If the lenders on the revolving facility terminate their commitments and accelerate the loans, this would become a cross default to other material indebtedness. We believe that we will continue to be in compliance with these covenants. However, should it become necessary, we may seek to raise additional capital within the next 12 months through borrowings on credit facilities, other financing activities and/or the private sale of equity securities.
Long-term liquidity outlook
UK Holdco is a holding company with no business operations or assets other than the capital stock of its direct and indirect subsidiaries and intercompany loan receivables. Consequently, UK Holdco is dependent on loans, dividends, interest and other payments from its subsidiaries to make principal and interest payments on our indebtedness, meet working capital requirements and make capital expenditures. As presently structured, its operating subsidiaries are the sole source of cash for such payments and there is no assurance that the cash for those interest payments will be available. We believe our organizational structure will allow the necessary flexibility to move funds throughout our subsidiaries to meet our operational working capital needs. In the future, the Issuers and borrowers under our Senior Secured Credit Facilities may also need to refinance all or a portion of the borrowings under the Senior Notes and the Senior Secured Credit Facilities on or prior to maturity. If refinancing is necessary, there can be no assurance that we will be able to secure such financing on acceptable terms, or at all.
Our ability to make payments on and to refinance our indebtedness and to fund planned capital expenditures will depend on our ability to generate cash in the future. This is subject to general economic, financial, competitive, legislative, regulatory and other factors that are beyond our control as well as the factors described in Part 1, Item 1A, “Risk factors” and “Special note regarding forward-looking statements.”
Recent accounting pronouncements
Information regarding new accounting pronouncements is included in note 3 to the consolidated financial statements included elsewhere in this Annual Report on Form 10-K.
Contractual obligations
The following table summarizes our contractual obligations as of January 3, 2021:
|
|
|
Obligations due in: |
|
|||||||||||||||||
|
($ in millions) |
|
Total |
|
|
2021 |
|
|
2022-2023 |
|
|
2024-2025 |
|
|
Thereafter |
|
|||||
|
Debt, including current provision(1) |
|
|
|
|
|
|
|
|
|
|
|
|
|
|
|
|
|
|
|
|
|
Dollar Term Loan |
|
$ |
2,185.5 |
|
|
$ |
58.1 |
|
|
$ |
116.2 |
|
|
$ |
2,011.2 |
|
|
$ |
— |
|
|
Euro Term Loan |
|
|
408.9 |
|
|
|
3.7 |
|
|
|
7.4 |
|
|
|
397.8 |
|
|
|
— |
|
|
Accounts Receivable Financing |
|
|
75.0 |
|
|
|
75.0 |
|
|
|
— |
|
|
|
— |
|
|
|
— |
|
|
2028 Notes |
|
|
675.0 |
|
|
|
— |
|
|
|
— |
|
|
|
— |
|
|
|
675.0 |
|
|
2025 Notes |
|
|
400.0 |
|
|
|
— |
|
|
|
— |
|
|
|
— |
|
|
|
400.0 |
|
|
Other borrowing |
|
|
26.2 |
|
|
|
23.2 |
|
|
|
2.4 |
|
|
|
0.6 |
|
|
|
— |
|
|
Interest payments(1) |
|
|
1,029.7 |
|
|
|
195.8 |
|
|
|
357.1 |
|
|
|
330.0 |
|
|
|
146.8 |
|
|
Operating leases |
|
|
30.2 |
|
|
|
16.4 |
|
|
|
10.6 |
|
|
|
1.2 |
|
|
|
2.0 |
|
|
Pension contributions(2) |
|
|
1.3 |
|
|
|
1.3 |
|
|
|
— |
|
|
|
— |
|
|
|
— |
|
|
Purchase obligations(3) |
|
|
127.3 |
|
|
|
127.3 |
|
|
|
|
|
|
|
|
|
|
|
|
|
|
Uncertain tax positions, including interest and penalties |
|
|
— |
|
|
|
— |
|
|
|
— |
|
|
|
— |
|
|
|
— |
|
|
Principal Shareholder management fee(4) |
|
|
10.5 |
|
|
|
3.0 |
|
|
|
6.0 |
|
|
|
1.5 |
|
|
|
— |
|
|
Total |
|
$ |
4,969.6 |
|
|
$ |
503.8 |
|
|
$ |
499.7 |
|
|
$ |
2,742.3 |
|
|
$ |
1,223.8 |
|
|
|
(1) |
Does not reflect the use of proceeds from our IPO to repay $892.7 million aggregate principal amount under the Dollar Term Loan Facility, $160.0 million aggregate principal amount of the 2025 Notes and $270 million aggregate principal amount of the 2028 Notes. The contractual obligations table assumes that the Senior Secured Credit Facilities are repaid upon maturity, and there are no further drawdowns from the Revolving Credit Facility, which may or may not reflect future events. Future interest payments include commitment fees on the unused portion of the Revolving Credit Facility, and reflect the interest payments on our Term Loan Facilities and Senior Notes. Future interest payments assume January 3, 2021 interest rates will prevail throughout all periods. Actual interest payments and repayment amounts may change. |
77
|
|
(3) |
Purchase obligations includes agreements to purchase goods or services that is enforceable and legally binding, and that specifies all significant terms, including (i) fixed or minimum quantities to be purchased, (ii) fixed, minimum or variable price provisions and (iii) the approximate timing of the transaction. |
Excluded from the above table are milestone payment obligations to partners and suppliers which are contingent on regulatory approval. Future launch-related milestone payments of up to $60.0 million may be owed to Quotient for MosaiQ, however the future timing of when such payments would be made, if ever, is unclear at this time. See Note 13, “Collaborations and other relationships,” to the audited consolidated financial statements for further discussion of the Quotient relationship.
As of January 3, 2021, we had approximately $27.5 million of uncertain tax positions, not including interest and penalties. Due to the high degree of uncertainty regarding future timing of cash flows associated with these liabilities, we are unable to estimate the years in which settlement will occur with the respective taxing authorities. These amounts have been excluded from the above table.
Critical accounting estimates and summary of significant accounting policies
The preparation of the audited consolidated financial statements in accordance with GAAP requires management to make estimates and assumptions that affect the reported amounts of some assets and liabilities and, in some instances, the reported amounts of revenues and expenses during the applicable reporting period. Actual results could differ from these estimates. Management believes the accounting estimates discussed below represent those accounting estimates requiring the exercise of judgment where a different set of judgments could result in the greatest changes to our reported results.
Revenue recognition
In May 2014, the FASB issued an accounting standards update, as amended, on revenue from contracts with customers. The new guidance outlined a single comprehensive model for entities to use in accounting for revenue from contracts with customers. We adopted ASC 606 on January 1, 2018 using the modified retrospective method for all contracts not completed as of the date of adoption.
Revenue is recognized when obligations under the terms of a contract with a customer are satisfied; this occurs with the transfer of control of our goods or services. We consider revenue to be earned when all of the following criteria are met: we have a contract with a customer that creates enforceable rights and obligations; promised products or services are identified; the transaction price, or consideration we expect to receive for transferring the goods or providing services, is determinable; and we have transferred control of the promised items to the customer. A promise in a contract to transfer a distinct good or service to the customer is identified as a performance obligation. A contract’s transaction price is allocated to each performance obligation and recognized as revenue when, or as, the performance obligation is satisfied.
Product revenue includes sales of consumable supplies and test kits for equipment, sales and leases of instruments, as well as services related thereto. Revenue from sales of consumable supplies and test kits is generally recognized upon shipment or delivery based on the contractual shipping terms of the respective customer contract. Revenue from instrument sales is generally recognized upon installation and customer acceptance. Service revenue on equipment and instrument maintenance contracts is recognized over the life of the service arrangement or as services are performed.
A portion of our revenue relates to equipment lease transactions with our customers. We evaluate these leases to determine proper classification, which involves specific determinations and judgment. Revenue earned from operating leases is generally recognized on a straight-line basis over the lease term, which is normally five to seven years. Revenue earned from sales-type leases is recognized at the beginning of the lease, as well as a lease receivable and unearned interest associated with the lease.
If the contract contains a single performance obligation, the entire transaction price is allocated to the single performance obligation. We may also enter into transactions that involve multiple performance obligations, such as the sale of products and related services. In accounting for these transactions, we allocate the consideration to the deliverables by use of the relative standalone selling price method.
A portion of our product revenue includes revenue earned under reagent rental programs which provide customers the right to use instruments at no separate cost to the customer in consideration for a multi-year agreement to purchase reagents, assays and
78
consumables. We allocate a portion of the revenue from the future consumable sale to the instrument based on the customers’ minimum volume commitment and recognize revenue at the time of the future sale of reagents, assays and consumables. The cost of the instrument is capitalized within property and equipment, and is charged to cost of product revenue on a straight-line basis over the term of the minimum purchase agreement. Revenue earned from operating leases is recognized over the lease term, which is normally five to seven years. Revenue earned under sales-type leases is recognized at the beginning of the lease, as well as a lease receivable and unearned interest associated with the lease. Revenue is recognized when control has transferred for the reagents, assays and consumables. Costs related to product sales are recognized at time of delivery.
We recognize product revenues at the net sales price, which includes estimates of variable consideration related to rebates and volume discounts. Rights of return are generally not included in our arrangements with customers. Our estimates of rebates and discounts are determined using the expected value method and take into consideration historical experience, contractual and statutory requirements, and other relevant information such as forecasted activity. These reserves reflect our best estimate of the amount of consideration to which it is entitled. The amount of variable consideration included in the net sales price is limited to the amount that is probable not to result in a significant future reversal of cumulative revenue under the contract.
We enter into collaboration arrangements that generate collaboration revenue and royalty revenue from license agreements. Revenue from collaborations is presented “gross” where we are deemed the principal in the arrangement and “net” where we are deemed the agent in the arrangement.
Inventories
Inventories are stated at the lower of cost and net realizable value on a first-in, first-out method. Elements of cost include raw materials, direct labor and manufacturing overhead.
We periodically review inventory for both potential obsolescence and potential declines in anticipated selling prices. In this review, we make assumptions about the future demand for and market value of the inventory and based upon these assumptions estimate the amount of any obsolete, unmarketable, slow moving or overvalued inventory. We write down the value of our inventories by an amount equal to the difference between the cost of the inventory and the net realizable value. Historically, such write-downs have not been significant. If actual market conditions are less favorable than those projected by management at the time of the assessment, however, additional inventory write-downs may be required, which could reduce our gross profit and earnings.
Customer leased instruments
Determining the economic life of our leased instruments requires significant accounting estimates and judgment. These estimates are based on our historical experience and existing contractual terms. Our estimate of the economic life of our instruments is ten years. We depreciate these assets over the lesser of the useful economic life and the length of the contract, which typically ranges between five and eight years. We believe these lives represent the periods during which the instruments are expected to be usable, with normal repairs and maintenance, for the purposes for which they are intended. We regularly evaluate the economic life of existing and new products for purposes of this determination.
Goodwill and other intangible assets
Goodwill
Goodwill represents costs in excess of fair values assigned to underlying net assets of acquired companies. We evaluate goodwill for impairment on an annual basis in our fiscal fourth quarter, unless conditions exist that would require a more frequent evaluation.
When testing goodwill for impairment, an entity has the option to first assess qualitative factors to determine whether the existence of events or circumstances leads to a determination that it is more likely than not (more than 50%) that the fair value of a reporting unit is less than its carrying amount. Such qualitative factors may include the following: macroeconomic conditions; industry and market considerations; cost factors; overall financial performance; and other relevant entity-specific events.
If we elect to perform a qualitative assessment and determine that an impairment is more likely than not, we will perform a quantitative impairment test, otherwise no further analysis is required. We may also elect not to perform the qualitative assessment and, instead, proceed directly to performing the quantitative impairment test, under which the evaluation of impairment involves comparing the current fair value of each reporting unit to its carrying value, including goodwill. The ultimate outcome of the goodwill impairment assessment for a reporting unit should be the same whether we choose to perform the qualitative assessment or proceed directly to the quantitative impairment test.
If the carrying amount of a reporting unit, including goodwill, exceeds the estimated fair value, then we would record an impairment charge based on the excess of a reporting unit’s carrying amount over its fair value (limited to the amount of goodwill).
79
We estimate the fair value of its reporting units by using forecasts of discounted future cash flows and peer market multiples. The inputs utilized in these analyses are classified as Level 3 inputs within the fair value hierarchy as defined in ASC 820, Fair Value Measurement.
The process of evaluating the potential impairment of goodwill is subjective because it requires the use of estimates and assumptions as to our future cash flows, which includes assumed revenue growth rates, long term growth rates and discount rates. Although we base cash flow forecasts on significant assumptions, including assumed revenue growth rates, long term growth rates and discount rates, that are consistent with plans and estimates we use to manage our Company, there is significant judgment in determining the cash flows. We also consider revenue and earnings trading multiples of the peer companies that have similar financial characteristics to the reporting units. Due to the inherent uncertainty in forecasting cash flows and earnings, actual future results may vary significantly from the forecasts. Based on the degree of uncertainty, we cannot quantify the potential effect of the change in estimate on our results of operations and financial position.
As of December 30, 2019, the beginning of fiscal year 2020, we changed the financial information that was regularly reviewed by the Chief Operating Decision Maker (“CODM”) to measure performance and allocate resources. This resulted in a change to the Company’s operating segments and reporting units. Goodwill was allocated to the newly identified reporting units and we performed impairment assessments on the new reporting units following the change. Based upon our quantitative impairment tests performed as of December 30, 2019 and September 28, 2020, the fair value of each of our reporting units is in excess of its carrying value.
Other indefinite-lived intangible assets
In-process research and development projects acquired in a business combination are recorded as intangible assets at their fair value as of the acquisition date. Subsequent costs related to acquired in-process research and development projects are expensed as incurred. Upon completion of the research and development process, the carrying value of acquired in- process research and development projects is reclassified as a definite-lived asset and is amortized over its useful life. If the project is abandoned, we record the write off as an impairment loss in the statement of operations. As of January 3, 2021, there are no in-process research and development intangible assets recorded within the consolidated balance sheet.
During the fiscal second quarter ended July 2, 2017, we revised the scope of an ongoing program to develop our next generation of dry slide technology and related instrument platforms in order to prioritize certain project deliverables and deprioritize other items. We also increased the estimated costs to obtain certain regulatory approvals in international markets for the next generation of dry slide technology. As a result, we performed an impairment test of our in-process research and development project during the fiscal second quarter ended July 2, 2017 based on the discounted estimated future cash flows using the relief from royalty method, which includes management’s estimates of future growth rates and discount rates. Based on the assessment, a noncash impairment charge of $11.0 million was recorded to write down the in-process research and development intangible asset to its estimated fair value. This charge is included in other operating expenses, net, in the consolidated statement of operations for the fiscal year ended December 31, 2017. We performed our annual indefinite-lived intangible assets impairment assessment during the fiscal fourth quarter ended December 31, 2017 and determined that there was no impairment. In July 2018, the in-process research and development project was completed upon the receipt of CE Mark on the related instrument. We performed a qualitative impairment assessment at the date of completion and determined there was no impairment. Accordingly, the carrying amount of the in-process research and development intangible asset was reclassified to developed technology and is subsequently being amortized over its estimated useful life of 15 years.
Impairment of long-lived assets
The process of evaluating the potential impairment of other long-lived assets, such as our property, plant and equipment and definite-lived intangible assets, such as technology, tradenames and customer relationships, is subjective and requires judgment. We review long-lived assets for impairment when events or changes in circumstances indicate that the carrying value of an asset may not be recoverable. This impairment test may be triggered by a decrease in the market price of a long-lived asset, an adverse change in the extent or manner in which the asset is being used, or a forecast of continuing losses associated with the use of the asset. If the fair value is less than the asset’s carrying amount, we recognize a loss for the difference. The fair value methodology used is an estimate of fair market value and is based on the discounted future cash flows of the asset or quoted market prices of similar assets. Based on these assumptions and estimates, we determine whether we need an impairment charge to reduce the value of the asset stated on our balance sheet to reflect its estimated fair value.
Income taxes
The provision for income taxes was determined using the asset and liability approach of accounting for income taxes. Under this approach, deferred taxes represent the future tax consequences expected to occur when the reported amounts of assets and liabilities are recovered or paid. The provision for income taxes represents income taxes paid or payable for the current year plus the change in deferred taxes during the period. Deferred taxes result from differences between the financial and tax basis of our assets and liabilities and are adjusted for changes in tax rates and tax laws when changes are enacted. Deferred tax assets are also recognized for operating losses and tax credit carryforwards. Valuation allowances are recorded to reduce deferred tax assets when it is more likely than not that
80
a tax benefit will not be realized. Deferred tax assets and liabilities are measured using enacted tax rates applicable in the years in which they are expected to be recovered or settled. The effect on deferred tax assets and liabilities of a change in tax law is recognized in income in the period that includes the enactment date.
We do not intend to permanently reinvest earnings of foreign subsidiaries at this time. As such, we provide for income taxes and foreign withholding taxes, where applicable, on undistributed earnings. Any repatriation of undistributed earnings would be done at little or no tax cost.
The breadth of our operations and the global complexity of tax regulations require assessments of uncertainties and judgments in estimating taxes we will ultimately pay. The final taxes paid are dependent upon many factors, including negotiations with taxing authorities in various jurisdictions, outcomes of tax litigation and resolution of disputes arising from federal, state and international tax audits in the normal course of business. A liability for uncertain tax positions is recorded when management concludes that the likelihood of sustaining such positions upon examination by taxing authorities is less than “more likely than not.” Interest and penalties accrued related to unrecognized tax benefits are included in the provision for taxes on income.
Stock-based compensation
Stock-based compensation, comprised of UK Holdco stock options and restricted shares, is measured at fair value on the grant date or date of modification, as applicable. Determining the amount of stock-based compensation expense to be recorded requires us to develop estimates to be used in calculating the grant-date fair value of stock options. Our valuation model requires us to make estimates of the following assumptions:
Fair value of our ordinary shares—The valuation of our ordinary shares was determined in accordance with the guidelines outlined in the American Institute of Certified Public Accountants, Valuation of Privately-Held-Company Equity Securities Issued as Compensation. We considered numerous objective and subjective factors to determine our best estimate of the fair value of our ordinary shares, including but not limited to, the following factors:
|
|
• |
the fact that we are a private company with illiquid securities; |
|
|
• |
historical operating results; |
|
|
• |
discounted future cash flows, based on projected operating results; |
|
|
• |
financial information of comparable public companies; and |
|
|
• |
the risk involved in the investment, as related to earnings stability, capital structure, competition and market potential. |
Expected volatility—We are responsible for estimating volatility and have considered a number of factors, including third-party estimates and comparable companies, when estimating volatility.
Expected term—We estimate the remaining expected life of options as the mid-point between the expected time to vest and the maturity of the options.
Risk-free interest rate—The yield interpolated from U.S. Constant Maturity Treasury rates for a period commensurate with the expected term assumption is used as the risk-free interest rate.
Off balance sheet arrangements
We do not have any significant off-balance sheet arrangements.
Item 7A. Quantitative and Qualitative Disclosures About Market Risk.
Our business and financial results are affected by fluctuations in world financial markets, including interest rates and currency exchange rates. We manage these risks through normal operating and financing activities and, when deemed appropriate, through the use of derivative financial instruments. We have policies governing our use of derivative instruments, and we do not enter into financial instruments for trading or speculative purposes.
Interest rate risk
We are subject to interest rate market risk in connection with our long-term debt. Our principal interest exposure will relate to outstanding amounts under our Senior Secured Credit Facilities. Our Senior Secured Credit Facilities provide for variable rate borrowings of up to $2,940.5 million, including up to $350.0 million under our Revolving Credit Facility (which increased to up to $500.0 million following our IPO). Assuming our Senior Secured Credit Facilities are fully drawn (and to the extent that LIBOR is in excess of the 0.00% floor rate of our Senior Secured Credit Facilities), each one-eighth percentage point increase or decrease in the
81
applicable interest rates would correspondingly change our interest expense on our Senior Secured Credit Facilities by approximately $3.7 million per year before considering the impact of derivative instruments. For further discussion of the risks related to our Senior Secured Credit Facilities, see Part 1, Item 1A “Risk factors—Risks related with our indebtedness—Our substantial indebtedness could adversely affect our financial condition, limit our ability to raise additional capital to fund our operations and prevent us from fulfilling our obligations under our indebtedness.”
We selectively use derivative instruments to reduce market risk associated with changes in interest rates. The use of derivatives is intended for hedging purposes only and we do not enter into derivative instruments for speculative purposes. As of January 3, 2021 and December 29, 2019, we have entered into various interest rate cap agreements to hedge our interest rate exposures related to our variable rate borrowings under the Senior Secured Credit Facilities. The interest rate cap amounts of these interest rate cap agreements range from 1.8% to 3.5%, with caplets that mature through December 31, 2023.
On July 19, 2019, we entered into an interest rate swap agreement, which fixed a portion of the variable interest due on our variable rate debt on September 27, 2019. Under the terms of the agreement, we will pay a fixed rate of 1.635% and receive a variable rate of interest based on one-month LIBOR (as defined) from the counterparty which is reset every month starting September 27, 2019, ending December 31, 2023. As of January 3, 2021, the notional amount of the interest rate swap was $700.0 million. The notional value of this instrument is expected to be $1,500 million in fiscal 2021, $1,000 million in fiscal 2022 and $500 million in fiscal 2023.
Foreign exchange rates risk
We are exposed to foreign currency risk by virtue of our international operations. We derived approximately 49% of our revenue for the fiscal year ended January 3, 2021 outside the United States. As discussed previously, we completed the acquisition of certain Day 2 Countries during fiscal year 2017. For translation of operations in non-U.S. dollar currencies, the local currency of most entities is the functional currency. Our foreign assets and liabilities are translated into U.S. dollars at the exchange rates existing at the respective balance sheet dates, and income and expense items are translated at the average exchange rate for each relevant period. Foreign exchange effects from the translation of our balance sheet resulted in a comprehensive gain of $59.4 million for the fiscal year ended January 3, 2021. Foreign exchange effects from the translation of our balance sheet resulted in a comprehensive loss of $0.9 million and $21.2 million for the fiscal years ended December 29, 2019 and December 30, 2018, respectively. Adjustments resulting from the re-measurement of transactions denominated in foreign currencies other than the functional currency of our subsidiaries are expensed as incurred.
In the majority of our jurisdictions, we earn revenue and incur costs in the currency used in such jurisdiction. We incur significant costs in foreign currencies including Brazilian Real, British Pound, Chinese Yuan/Renminbi, Euro, Indian Rupee, Japanese Yen, Mexican Peso, and the Swiss Franc. As a result, movements in exchange rates cause our revenue and expenses to fluctuate, impacting our profitability and cash flows. Future business operations and opportunities, including the continued expansion of our business outside North America, may further increase the risk that cash flows resulting from these activities may be adversely affected by changes in currency exchange rates.
Like many multi-national companies, we have exposure to the British Pound. We are negatively impacted by a lower British Pound exchange rate from translation impact when compared to the U.S. dollar, but we also benefit from expenses denominated in British Pound, as well as some cross-border transactions at a lower exchange rate. The magnitude of the impact is dependent on our business volumes in the UK, forward contract hedge positions, cross currency volume and the exchange rate.
Additionally, in order to fund the purchase price for the assets and capital stock of certain non-U.S. entities, a combination of equity contributions and intercompany loans were utilized to capitalize certain non-U.S. subsidiaries. In many instances, the intercompany loans are denominated in currencies other than the functional currency of the affected subsidiaries. Where intercompany loans are not a component of permanently invested capital of the affected subsidiaries, increases or decreases in the value of the subsidiaries’ functional currency against other currencies will affect our results of operations. During the fiscal year ended January 3, 2021 we recorded net foreign currency exchange losses of $69.5 million. During the fiscal year ended December 29, 2019 we recorded net foreign currency exchange gains of $10.5 million. During the fiscal year ended December 30, 2018, we recorded net foreign exchange losses of $53.0 million. The foreign currency gains/losses in each period primarily consist of unrealized gains/losses related to intercompany loans denominated in currencies other than the functional currency of the affected subsidiaries. We may enter into derivative instruments to manage our foreign currency exposure on these intercompany loans in the future.
We have entered into foreign-currency forward contracts to manage our foreign currency exposures on foreign currency denominated firm commitments and forecasted foreign currency denominated intercompany and third-party transactions. We had forward, option and cross currency swap contracts outstanding with total notional amount of $281.2 million as of January 3, 2021, with maturity dates through February 2025. We had forward and option contracts outstanding with total notional amount of $295.4 million as of December 29, 2019, with maturity dates through December 2020. Foreign-currency forward contracts that qualified and were designated for hedge accounting, these contracts are recorded at their fair value as of January 3, 2021 and the unrealized loss of
82
$4.8 million is reported as a component of other comprehensive loss, all of which is expected to be reclassified to earnings in the next 12 months. Actual gains (losses) upon settlement will be recognized in earnings, within the line item impacted, during the estimated time in which the transactions are incurred. Foreign-currency forward contracts that qualified and were designated for hedge accounting were recorded at their fair values as of December 29, 2019, with the unrealized gain of $2.7 million reported as a component of other comprehensive income (loss), all of which is expected to be reclassified to earnings in the next 12 months. Actual gains (losses) upon settlement will be recognized in earnings, within the line item impacted, during the estimated time in which the transactions are incurred. Actual gains upon settlement of $5.3 million and $1.0 million for the fiscal years ended January 3, 2021 and December 29, 2019, and losses upon settlement of $0.6 million for the fiscal year ended, December 30, 2018 were recognized in earnings.
Item 8. Financial Statements and Supplementary Data.
The financial statements required to be filed pursuant to this Item 8 are appended to this Annual Report on Form 10-K. An index of those financial statements is found in Item 15, Exhibits and Financial Statement Schedules, of this Annual Report on Form 10-K.
Item 9. Changes in and Disagreements With Accountants on Accounting and Financial Disclosure.
None.
Item 9A. Controls and Procedures.
Evaluation of Disclosure Controls and Procedures
As required by Rule 13a-15 under the Exchange Act, as amended, we carried out an evaluation under the supervision and with the participation of our management, including the Chief Executive Officer (“CEO”) and Chief Financial Officer (“CFO”), of the effectiveness of the design and operation of our disclosure controls and procedures. Regulations under the Exchange Act require public companies, including us, to maintain “disclosure controls and procedures,” as defined in Rule 13a-15(e) and 15d-15(e) under the Exchange Act to mean a company’s controls and other procedures that are designed to ensure that information required to be disclosed in reports that it files or submits under the Exchange Act is recorded, processed, summarized, and reported within the time periods specified in the SEC’s rules and forms and that such information is accumulated and communicated to management, including our CEO and CFO, or persons performing similar functions, as appropriate to allow timely decisions regarding required or necessary disclosures.
There are inherent limitations to the effectiveness of any system of disclosure controls and procedures, including the possibility of human error and the circumvention or overriding of the controls and procedures. Accordingly, even effective disclosure controls and procedures can only provide reasonable assurance of achieving their control objectives. Based upon our evaluation, our CEO and CFO concluded that our disclosure controls and procedures were effective at the reasonable assurance level
Changes in Internal Control Over Financial Reporting
There has been no change in our internal control over financial reporting (as defined in Rules 13a-15(f) and 15d-15(f) under the Exchange Act) during the quarter ended January 3, 2021 that has materially affected, or is reasonably likely to materially affect, our internal control over financial reporting.
Management’s Annual Report on Internal Control Over Financial Reporting
This Annual Report on Form 10-K does not include a report of management’s assessment regarding internal control over financial reporting or an attestation report of our registered public accounting firm due to a transition period established by rules of the SEC for newly public companies.
On March 17, 2021, our compensation committee approved 2020 annual bonuses for our named executive officers. The named executive officers’ compensation for 2020 was previously reported by the Company in the 2020 Summary Compensation Table included in our IPO prospectus. As of the date of our IPO prospectus, 2020 bonuses for the named executive officers had not yet been determined and, therefore, were not included in the 2020 Summary Compensation Table. Pursuant to SEC rules, we are required to provide updated information regarding 2020 bonuses and for such information, see “Item 11, “Executive compensation—Compensation discussion and analysis—Annual incentive compensation.”
83
Item 10. Directors, Executive Officers and Corporate Governance.
Executive officers and board of directors
The following table sets forth information about our current directors and executive officers as of March 3, 2021:
|
Name |
|
Age |
|
Position |
|
|
|
|
|
|
|
Chris Smith |
|
58 |
|
Chairman and Chief Executive Officer |
|
|
|
|
|
|
|
Joseph M. Busky |
|
53 |
|
Chief Financial Officer |
|
|
|
|
|
|
|
Chad Dale |
|
49 |
|
Chief Operating Officer |
|
|
|
|
|
|
|
Michael S. Iskra |
|
51 |
|
Executive Vice President, Commercial Excellence & Strategy |
|
|
|
|
|
|
|
Chockalingam Palaniappan |
|
56 |
|
Chief Innovation Officer |
|
|
|
|
|
|
|
Michael A. Schlesinger |
|
62 |
|
Executive Vice President, General Counsel and Secretary |
|
|
|
|
|
|
|
Karen H. Bechtel |
|
71 |
|
Director |
|
|
|
|
|
|
|
Evelyn Dilsaver |
|
65 |
|
Director |
|
|
|
|
|
|
|
Allan Holt |
|
68 |
|
Director |
|
|
|
|
|
|
|
Carl Hull |
|
63 |
|
Director |
|
|
|
|
|
|
|
Ron Labrum |
|
64 |
|
Director |
|
|
|
|
|
|
|
Thomas Mac Mahon |
|
74 |
|
Director |
|
|
|
|
|
|
|
David Perez |
|
61 |
|
Director |
|
|
|
|
|
|
|
Robert R. Schmidt |
|
38 |
|
Director |
|
|
|
|
|
|
|
Stephen H. Wise |
|
48 |
|
Director |
|
|
|
|
|
|
|
Robert Yates |
|
62 |
|
Director |
Set forth below is a brief description of the business experience of our directors and executive officers. All of our executive officers serve at the discretion of our board of directors.
Chris Smith. Chris Smith has been our Chief Executive Officer since September 2019 and he serves as a member of our board of directors. Mr. Smith was appointed Chairman in September 2020. From 2015 to 2018, Mr. Smith served as the Chief Executive Officer of Cochlear Limited. Prior to joining Cochlear Limited, he held senior executive roles at Gyrus Group Plc., KCI, Prism and Cardinal Health. Mr. Smith received a B.S. from Texas A&M University. Our board of directors has concluded that Mr. Smith should serve as a director because he brings extensive knowledge of the medical device industry within healthcare, which, together with his experience in leading the Company as our Chief Executive Officer, makes him well qualified to serve as one of our directors.
Joseph M. Busky. Joseph M. Busky has been our Chief Financial Officer since July 2020. Prior to joining Ortho, Busky served as chief financial officer for global medical device company, Vyaire Medical, Inc., from 2018 through 2020, as chief executive officer of Qualtek from 2017 to 2018, and as chief financial officer of FDH Velocitel from 2015 to 2017. He has also previously held leadership roles at InnerWorkings, Inc. and Siemens Medical Solutions Diagnostics/Dade Behring Holdings, Inc. Mr. Busky holds an MBA with a finance concentration, as well as a BBA in accounting, from Loyola University in Baltimore. He also holds a CPA certification in Maryland from the American Institute of Certified Public Accountants.
Chad Dale. Chad Dale has been our Chief Operating Officer since 2019 and was our Head of Global Functions from 2018 to 2019. From 2016 to 2018, he was Head of Operations and Supply Chain for Alcon’s surgical franchise within Novartis. Prior to that, he held leadership roles at Roche, Tyco International and Abbott Laboratories. Mr. Dale received an M.S. from Texas A&M University, an M.B.A. from the University of South Carolina and a B.S. from Marquette University.
84
Michael S. Iskra. Michael S. Iskra joined Ortho in 2015 and currently serves as the Executive Vice President of Commercial Excellence & Strategy. Mr. Iskra was the President, North America, for Ortho from 2015 through mid-2020. From 2014 to 2015, he served as Senior Vice President for business development at Healthways. Prior to that, he was Chief Operating Officer, from 2010 to 2012, and Chief Executive Officer, in 2013, for Simplex Healthcare. From 2007 to 2010, he was the Executive Vice President and General Manager at CCS Medical and prior to 2007, he spent 14 years at Bayer/Siemens Diagnostics in various sales and marketing roles. Mr. Iskra received a B.A. from the University of Delaware.
Chockalingam Palaniappan. Chockalingam Palaniappan joined Ortho in February 2020 as Chief Innovation Officer. Prior to joining Ortho, Mr. Palaniappan served as Chief Technology Officer at Epic Sciences from 2019 to 2020 and as a board member and Senior & Executive Vice President for Global Innovation and Development at Terumo BCT from 2013 to 2019. He also serves as a member of the board of directors of NemaMetrix, now renamed as Invivo Biosystems. Mr. Palaniappan received a Ph.D. from Northern Illinois University and was a post-doctoral research fellow with the department of biochemistry and biophysics at the University of Rochester.
Michael A. Schlesinger. Michael A. Schlesinger has been our Executive Vice President, General Counsel and Secretary since 2017 and was previously our Senior Vice President, General Counsel and Secretary from 2014 to 2017. Prior to joining Ortho, Mr. Schlesinger served as a partner and corporate lawyer at Latham & Watkins LLP from 2002 to 2014. From 2000 to 2002, he served as a partner at Venable LLP. Mr. Schlesinger received an LL.M. from Georgetown University Law Center, a J.D. from Boston University School of Law and a B.S. from Lehigh University.
Karen H. Bechtel. Karen H. Bechtel is a member of our board of directors. Ms. Bechtel previously led the Carlyle U.S. Buyout Healthcare team from 2005 to 2016 and continued to serve as a Senior Advisor at Carlyle until her retirement in 2018. She serves as a member of the board of directors of Massachusetts Mutual Life Insurance Company. Prior to joining Carlyle, Ms. Bechtel was at Morgan Stanley & Co., Incorporated (“Morgan Stanley”) for 28 years. As Managing Director of Morgan Stanley’s Private Equity Group, Ms. Bechtel was a member of the investment committee responsible for approving all investments in the Morgan Stanley Capital Partners IV Fund and led all of the healthcare investments. Ms. Bechtel also served as co-head of the Financial Sponsors Group, head of the Corporate Restructuring Group, founder and head of Princes Gate Private Equity Investors and Managing Director in the Mergers and Acquisitions Department at Morgan Stanley. Our board of directors has concluded that Ms. Bechtel should serve as a director because of her extensive background and knowledge across both financial and healthcare industries, as well as her experience on the board of several Carlyle portfolio companies.
Evelyn Dilsaver. Evelyn Dilsaver is a member of our board of directors. Ms. Dilsaver served as the president and CEO of Charles Schwab Investment Management, the mutual fund arm of The Charles Schwab Corporation from 2004 to 2007. She also served in various leadership roles at Schwab for more than 16 years, including as controller and chief of staff to the co-CEO. Ms. Dilsaver holds several corporate board of director positions, including Blue Shield of California, TempurSealy, Protiviti, Health Equity and Bailard Real Estate Investment Fund. She also serves as a board member of several nonprofit organizations, including Blue Shield Foundation and The Commonwealth Club. Ms. Dilsaver’s previous board positions include Aeropostale Inc., High Mark Funds and the Russell ETF. Our board of directors has concluded that Ms. Dilsaver should serve as a director because of her background and knowledge across both financial and healthcare industries, as well as her significant experience across various company boards.
Allan Holt. Allan Holt is a member of our board of directors. Mr. Holt is a Senior Partner and Managing Director of The Carlyle Group and Chairman of Carlyle’s U.S. Buyout group, which he joined in 1992. Prior to joining Carlyle, he spent over three years with Avenir Group, Inc., an investment and advisory group. Mr. Holt was also previously with MCI Communications Corporation, where, as Director of Planning and Budgets, he managed a group responsible for the development, review and analysis of MCI’s multibillion-dollar financial operating and capital plans. Mr. Holt is currently a member of the board of directors of Veritas Technologies, the chair of The Smithsonian National Air and Space Museum Board of Directors, Vice Chairman of the Council of the United States Holocaust Memorial Museum, a Member of the Johns Hopkins University Wilmer Eye Institute Board of Governors, and a Member of the George W. Bush Presidential Center’s Human Freedom Advisory Council. Our board of directors has concluded that Mr. Holt should serve as a director because of his deep financial and capital markets background, as well as his significant experience across various company boards, both within the Carlyle portfolio of companies and beyond.
Carl Hull. Carl Hull is a member of our board of directors. Mr. Hull has served as the Chief Executive Officer of Maravai Life Sciences since 2014 and serves as the Chairman of the Board of The Binding Site. He previously served as the Chairman and Chief Executive Officer of Gen-Probe from 2007 to 2013. Prior to joining Gen-Probe, Mr. Hull held executive positions at Applied Biosystems, Applied Imaging, Ventana Medical Systems and Abbott Diagnostics. Our board of directors has concluded that Mr. Hull should serve as a director because of his leadership background across the healthcare industry and specifically his expertise across the clinical diagnostics space.
85
Ron Labrum. Ron Labrum is a member of our board of directors. Mr. Labrum was an Operating Partner at Linden Capital Partners from 2015 to 2020. Before joining Linden, Mr. Labrum served as Chief Executive Officer of Fenwal, Inc., global leader in transfusion technology, from 2006 to 2012, and as Chairman and Chief Executive Officer of Cardinal Health’s Healthcare Supply Chain Services segment from 2002 to 2005. Mr. Labrum serves on the boards of Vyaire Medical, Flexan and Beaver-Visitec International. Our board of directors has concluded that Mr. Labrum should serve as a director because of his varied experiences and significant leadership positions across the healthcare industry and medical devices.
Thomas Mac Mahon. Thomas Mac Mahon is a member of our board of directors. Mr. Mac Mahon currently serves as Executive Partner at Flare Capital since 2013 and is former Chairman and Chief Executive Officer of Laboratory Corporation of America. Prior to his time at Laboratory Corporation of America, he served in a variety of different positions for 27 years at Hoffmann-La Roche. During the last ten years of his career at Hoffmann-La Roche, he served on the Executive Committee and was President of Roche Diagnostics. Mr. Mac Mahon also served as the Lead Director for Express Scripts. Mr. Mac Mahon serves on the board of NovoPath, St. Peter’s University and the Foundation for Morristown Medical Center. Our board of directors has concluded that Mr. Mac Mahon should serve as a director because of his extensive diagnostics industry expertise and leadership across multiple global organizations, including Laboratory Corporation of America and Hoffman-La Roche.
David Perez. David Perez is a member of our board of directors. Mr. Perez previously served as President and Chief Executive Officer of Terumo BCT from 2000 through 2019, and also served on the Terumo Corporation board of directors from 2014 through 2019. Mr. Perez currently serves as a member of the boards of Laborie, Sarnova, Molnlycke, the Department of Health and Human Services Advisory Committee on Blood & Tissue Safety and Availability, Nurse Family Partnership, Blackstone Entrepreneurs Network, Blood Centers of America, Centura Health St. Anthony Regional, Executives Partnering to Invest in Children (EPIC), Book Trust and Fitzsimons Innovation Community, previously served as a director of Mesa Labs from 2019 to 2020 and is expected to join the board of Advanced Instruments as Chairman in the near future, all of which are owned by Investor AB and Patricia Industries. Mr. Perez received a Bachelor of Arts degree in Political Science from Texas Tech University. Our board of directors has concluded that Mr. Perez should serve as a director because of his extensive experience in the healthcare industry, specifically in leading a blood and cell technology company in Terumo BCT.
Robert R. Schmidt. Robert R. Schmidt is a member of our board of directors. Mr. Schmidt is a Managing Director at Carlyle, where he focuses on investment opportunities in the healthcare sector. Since joining Carlyle in 2011, Mr. Schmidt has been involved in a number of Carlyle’s investments globally, including Beats Electronics, Grand Rounds, MedRisk, One Medical and Sedgwick. He is currently a member of the board of directors of Grand Rounds, MedRisk and One Medical. Prior to joining Carlyle, Mr. Schmidt worked at Welsh, Carson, Anderson & Stowe, a private equity firm focused on information business services and healthcare investments, and Merrill Lynch Global Private Equity, which is focused on buyouts in North America. Mr. Schmidt received an M.B.A. from Harvard Business School and a B.S. from The Wharton School at the University of Pennsylvania. Our board of directors has concluded that Mr. Schmidt should serve as a director because of his financial expertise and experience across a variety of healthcare investments, as well as the experience gained from advising and serving as a director of multiple Carlyle portfolio companies.
Stephen H. Wise. Stephen H. Wise is a Managing Director and Global Head of Healthcare at The Carlyle Group. He is based in New York. Since joining Carlyle in 2006, Carlyle’s Healthcare team has invested approximately $15 billion of equity in health care companies around the world. He serves as a member of the board of directors of Albany Molecular Research, Inc., a pharmaceutical contract development and manufacturing organization, CorroHealth, a business service provider for healthcare companies, MedRisk, a physical therapy-focused workers’ compensation solutions company, Millicent Pharma Limited, a pharmaceutical company, Ortho-Clinical Diagnostics, a global provider of in vitro diagnostic solutions for screening, diagnosing, monitoring and confirming diseases, PPD, Inc., a global contract research organization, Rede D’Or São Luiz S.A., a leading hospital provider in Brazil, Sedgwick Inc., a global multiline claims management firm, TriNetX, Inc., a global health research network optimizing clinical research, and WellDyneRx, LLC, an independent pharmacy benefit manager. Mr. Wise also serves on the Leadership Council of the Harvard School of Public Health. Prior to joining Carlyle, Mr. Wise worked with JLL Partners, a New York-based private equity firm, where he focused on health care-related investments. Previously, he worked with J.W. Childs Associates, a Boston-based private equity firm, and prior to that, in the leveraged finance group of Credit Suisse. Mr. Wise earned a bachelor’s degree in economics and finance from Bucknell University and received his master’s in business administration from Harvard Business School. Our board of directors has concluded that Mr. Wise should serve as a director because of his extensive knowledge and experience across the healthcare industry as well as his financial and corporate governance experience, as gained through his leadership of Carlyle’s Global Health Care team as well as his director positions across a variety of Carlyle portfolio companies.
Robert Yates. Robert Yates is a member of our board of directors. Mr. Yates previously served as Chairman and Chief Executive Officer of Ortho from February 2019 to August 2019 and non-executive Chairman from September 2019 to September 2020. Mr. Yates has been a member of our board of directors since 2014. Prior to his role as Chief Executive Officer, Mr. Yates held several executive roles at Ortho since joining in 2014, including as its Chief Operating Officer, President and Executive Advisor on Strategy, Partnerships and M&A. Mr. Yates previously served as an advisor to Carlyle for healthcare investment opportunities and as president
86
and Chief Executive Officer of EMD/Merck Millipore. Our board of directors has concluded that Mr. Yates should serve as a director because of his prior in-depth knowledge and experience with Ortho, as well as his expertise and leadership across various diagnostics businesses, most notably EMD/Merck Millipore.
Board of directors
Our business and affairs are managed under the direction of our board of directors. Our board of directors currently consists of 11 directors.
Our articles of association provide that, subject to the right of holders of any series of preferred shares, our board of directors is divided into three classes of directors, with the classes to be as nearly equal in number as possible, and with the directors serving staggered three-year terms, with only one class of directors being elected at each annual meeting of shareholders. As a result, approximately one-third of our board of directors will be elected each year. Our initial Class I directors are Messrs. Schmidt and Perez and Ms. Bechtel (with their terms expiring at the annual meeting of shareholders to be held in 2022), our Class II directors are Messrs. Wise, Hull, Labrum and Mac Mahon (with their terms expiring at the annual meeting of shareholders to be held in 2023) and our Class III directors are Messrs. Smith, Holt and Yates and Ms. Dilsaver (with their terms expiring at the annual meeting of shareholders to be held in 2024).
Subject to certain exceptions described below, newly created director positions resulting from an increase in size of the board of directors and vacancies may be filled by our board of directors.
Our articles of association provide that the Principal Shareholder has the right to appoint a certain number of directors to our board of directors (such persons, the “Principal Shareholder appointees”). The number of Principal Shareholder appointees our Principal Shareholder (or any permitted transferee or affiliate) is entitled to appoint is subject to maintaining certain ownership thresholds. If our Principal Shareholder (or such permitted transferee or affiliate) loses its right to appoint any directors pursuant to the terms of our articles of association, these positions will be filled by our shareholders in accordance with our articles of association.
Pursuant to our articles of association, for so long as the Principal Shareholder has the right to appoint any persons to our board of directors, the Principal Shareholder (or any permitted transferee or affiliate) will notify us in writing of any such appointment and, within five business days, we will appoint, or re-appoint, as the case may be, such Principal Shareholder appointee as a member of our board of directors.
In the event that a Principal Shareholder appointee ceases to serve as a director for any reason, the persons entitled to appoint such appointee director under our articles of association will be entitled to appoint another person to fill the resulting vacancy.
Background and experience of directors
When considering whether directors and nominees have the experience, qualifications, attributes or skills, taken as a whole, to enable our board of directors to satisfy its oversight responsibilities effectively in light of our business and structure, the board of directors focused primarily on each person’s background and experience as reflected in the information discussed in each of the directors’ individual biographies set forth above. We believe that our directors provide an appropriate mix of experience and skills relevant to the size and nature of our business. Once appointed, directors serve until their term expires, they resign or they are removed by the shareholders.
Role of board of directors in risk oversight
The board of directors has extensive involvement in the oversight of risk management related to us and our business and accomplishes this oversight through the regular reporting by the Audit Committee of the board of directors (the “Audit Committee”). The purpose of the Audit Committee is to assist the board of directors in fulfilling its fiduciary oversight responsibilities relating to (1) the quality and integrity of our financial statements, including oversight of our accounting and financial reporting processes, internal controls and financial statement audits, (2) our compliance with legal and regulatory requirements, (3) our independent registered public accounting firm’s qualifications, performance and independence, (4) our corporate compliance program, including our code of conduct and anti-corruption compliance policy, and investigating possible violations thereunder, (5) our risk management policies and procedures and (6) following implementation, the review of the performance of our internal audit function. Through its regular meetings with management, including the finance, legal and, following implementation, internal audit functions, the Audit Committee reviews and discusses all significant areas of our business and summarizes for the board of directors all areas of risk and the appropriate mitigating factors. In addition, our board of directors receives periodic detailed operating performance reviews from management.
Controlled company exception
The Principal Shareholder beneficially owns more than 50% of our ordinary shares and voting power. As a result, (a) under certain provisions of our articles of association, the Principal Shareholder has the voting power to elect any member of our board of directors standing for election and (b) we are a “controlled company” under the corporate governance standards of Nasdaq. Under the
87
Nasdaq corporate governance standards, a company of which more than 50% of the voting power is held by an individual, group or another company is a “controlled company” and may elect not to comply with certain corporate governance standards, including (1) the requirement that a majority of the board of directors consist of independent directors, (2) the requirement that we have a compensation committee that is composed entirely of independent directors and (3) the requirement that our director nominations be made, or recommended to our full board of directors, by our independent directors or by a nominations committee that consists entirely of independent directors. We utilize certain of these exemptions and may continue to do so until such time that we no longer qualify as a “controlled company.” As a result, we may not have a majority of independent directors, our nominations committee and compensation committee may not consist entirely of independent directors and such committees will not be subject to annual performance evaluations. Accordingly, you may not have the same protections afforded to shareholders of companies that are subject to all of the corporate governance requirements of Nasdaq. In the event that we cease to be a “controlled company,” we will be required to comply with these provisions within the transition periods specified in the Nasdaq corporate governance rules.
Committees of the board of directors
The standing committees of our board of directors consist of the Audit Committee, a Compensation Committee (the “Compensation Committee”), a Nominating and Corporate Governance Committee (the “Nominating and Corporate Governance Committee”) and an Executive Committee (the “Executive Committee”).
Our chief executive officer and other executive officers regularly report to the non-executive directors and the Audit, the Compensation and the Nominating and Corporate Governance Committees to ensure effective and efficient oversight of our activities and to assist in proper risk management and the ongoing evaluation of management controls. The internal audit function reports functionally and administratively to our chief financial officer and directly to the Audit Committee. We believe that the leadership structure of our board of directors provides appropriate risk oversight of our activities given the controlling interests held by the Principal Shareholder.
Audit Committee
The current members of our Audit Committee are Ms. Dilsaver as chair, and Messrs. Schmidt, Mac Mahon and Perez. Ms. Dilsaver and Messrs. Mac Mahon and Perez qualify as independent directors under the Nasdaq corporate governance standards and independence requirements of Rule 10A-3 of the Exchange Act. Our board of directors has determined that Ms. Dilsaver, who the board determined is an independent director, qualifies as an “audit committee financial expert” as such term is defined in Item 407(d)(5) of Regulation S-K.
The purpose of the Audit Committee is to prepare the audit committee report required by the SEC to be included in our proxy statement and to assist our board of directors in overseeing and monitoring (1) the quality and integrity of our financial statements, including oversight of our accounting and financial reporting processes, internal controls and financial statement audits, (2) our compliance with legal and regulatory requirements, (3) our independent registered public accounting firm’s qualifications, performance and independence, (4) our corporate compliance program, including our code of conduct and anti-corruption compliance policy, and investigating possible violations thereunder, (5) our risk management policies and procedures and (6) the performance of our internal audit function.
The Audit Committee charter, which has been adopted by our board of directors, is available on our website.
Compensation Committee Interlocks and Insider Participation
Compensation decisions are made by our Compensation Committee. None of our current or former executive officers or employees currently serves, or has served during our last completed fiscal year, as a member of our Compensation Committee and, during that period, none of our executive officers served as a member of the compensation committee (or other committee serving an equivalent function) of any other entity whose executive officers served as a member of our board of directors.
We have entered into certain indemnification agreements with our directors and are party to certain transactions with the Principal Shareholder described in “Certain relationships and related party transactions, and director independence—Indemnification of directors and officers” and “—Shareholders agreements,” respectively.
Compensation Committee
The current members of our Compensation Committee are Messrs. Wise, as chair, Hull, Labrum and Schmidt.
The purpose of the Compensation Committee is to assist our board of directors in discharging its responsibilities relating to, among other things, (1) setting our compensation program and compensation of our executive officers and directors, (2) administering our incentive and equity-based compensation plans and (3) preparing the compensation committee report required to be included in our proxy statement under the rules and regulations of the SEC.
88
The Compensation Committee charter, which has been adopted by our board of directors, is available on our website.
Nominating and Corporate Governance Committee
The current members of our Nominating and Corporate Governance Committee are Messrs. Yates, as chair, Perez and Wise. The purpose of our Nominating and Corporate Governance Committee is to assist our board of directors in discharging its responsibilities relating to (1) identifying individuals qualified to become new board members, consistent with criteria approved by the board of directors, (2) reviewing the qualifications of incumbent directors to determine whether to recommend them for reelection and selecting, or recommending that the board of directors select, the director nominees for the next annual meeting of shareholders, (3) identifying board members qualified to fill vacancies on any committee of the board of directors and recommending that the board of directors appoint the identified member or members to the applicable committee, (4) reviewing and recommending to the board of directors corporate governance principles applicable to us, (5) overseeing the evaluation of the board of directors and management and (6) handling such other matters that are specifically delegated to the committee by the board of directors from time to time.
The Nominating and Corporate Governance Committee charter, which has been adopted by our board of directors, is available on our website.
Executive Committee
The current members of our Executive Committee are Messrs. Wise, as chair, Schmidt and Smith. The Executive Committee is responsible for exercising the powers of our board of directors between regularly scheduled meetings. The Executive Committee is authorized with all the powers of our board of directors except for certain specifically enumerated powers that may be exercised solely by the full board of directors, including the power to:
|
|
• |
adopt, amend or repeal our articles of association; |
|
|
• |
approve or adopt, or recommend to our shareholders any action or matter (other than the election or removal of directors) expressly required by applicable law to be submitted to shareholders for approval; |
|
|
• |
approve a plan of merger, share exchange, or conversion of the Company; |
|
|
• |
recommend to our shareholders the sale, lease, or exchange of all or substantially all of the property or assets of the Company otherwise than in the usual and regular course of its business; |
|
|
• |
recommend to our shareholders a voluntary dissolution of the Company or a revocation thereof; |
|
|
• |
amend, alter, repeal, or take any action inconsistent with any resolution or action of our board of directors when the resolution or action of the board of directors provides by its terms that it shall not be amended, altered, or repealed by action of the Executive Committee; |
|
|
• |
exercise any authority that our board of directors has expressly delegated to another committee of the board of directors or has expressly reserved to itself; |
|
|
• |
fill vacancies on our board of directors or any of its committees; |
|
|
• |
fix the compensation of directors for serving on our board of directors or any of its committees; |
|
|
• |
declare or recommend a distribution our shareholders (including subject to shareholder approval at the annual general meeting), except at a rate or in a periodic amount or within a range of amounts determined by our board of directors and provided the requirements of the UK Companies Act 2006 have been satisfied; |
|
|
• |
appoint other committees of our board of directors or the members thereof; and |
|
|
• |
undertake any other action that must be performed by the full board of directors or another committee thereof or which cannot be delegated to a committee of our board of directors pursuant to our articles of association or applicable law, regulation, or listing standard. |
Code of Conduct
We have adopted a new Code of Business Conduct and Ethics (the “Code of Conduct”) applicable to all employees, executive officers and directors that addresses legal and ethical issues that may be encountered in carrying out their duties and responsibilities, including the requirement to report any conduct they believe to be a violation of the Code of Conduct. The Code of Conduct is available on our website, www.orthoclinicaldiagnostics.com. The information available on or through our website is not part of this Annual Report on Form 10-K. If we ever were to amend or waive any provision of our Code of Conduct that applies to our principal executive officer, principal financial officer, principal accounting officer or any person performing similar functions, we intend to satisfy our disclosure
89
obligations with respect to any such waiver or amendment by posting such information on our internet website set forth above rather than by filing a Form 8-K.
Item 11. Executive Compensation.
Compensation discussion and analysis
In this Compensation Discussion and Analysis, we address our philosophy, programs and processes related to the compensation paid or awarded for 2020 to our named executive officers, including the elements of our compensation program for named executive officers, material compensation decisions made under that program during 2020 and the material factors considered in making those decisions.
Our named executive officers are:
|
|
• |
Christopher Smith, Chairman and Chief Executive Officer; |
|
|
• |
Joseph M. Busky, Chief Financial Officer; |
|
|
• |
Michael Iskra, Executive Vice President, Strategy & Commercial Excellence; |
|
|
• |
Chockalingam Palaniappan, Ph.D., Chief Innovation Officer; |
|
|
• |
Michael Schlesinger, Executive Vice President, General Counsel & Secretary; and |
|
|
• |
Todd Davachi, Former Chief Financial Officer. |
These executive officers are referred to collectively in this Compensation Discussion and Analysis as our “named executive officers.”
Compensation philosophy, objectives and rewards
A key objective of our compensation program is to allow us to retain and, as needed, attract qualified executives. We believe that our ability to keep our senior executive team intact is tied to our compensation programs. Additionally, for us to be appropriately positioned to attract new talent as needed, we must be prepared to be, and be perceived as, an employer that offers a competitive total rewards package.
To achieve our compensation objectives, we provide executives with a compensation package consisting primarily of the following fixed and variable elements:
|
Compensation element |
|
Compensation objective |
|
Base Salary |
|
Recognizes performance of job responsibilities and attracts and retains individuals with superior talent |
|
Cash-Based Incentive Compensation |
|
Provides short-term incentives to drive attainment of financial measures |
|
Equity-Based Compensation |
|
Promotes the maximization of stockholder value by aligning the interests of employees and stockholders |
|
Limited Executive Perquisites |
|
Aids executive performance and ensures consistent focus by providing convenient benefits with high perceived values. |
In addition, from time to time we have entered into targeted retention bonus awards with certain of our named executive officers when we have determined it to be appropriate or necessary to ensure the continued retention and dedication of the executive.
Determination of compensation
For 2020, our executive compensation program was administered by the non-employee members of the executive committee of our board of directors (consisting of representatives of Carlyle in its role as our principal stockholder), in consultation with our Chairman and Chief Executive Officer (“CEO”), who has also served on the executive committee. Our CEO provided recommendations to the other members of the executive committee and has discussed with them the compensation and performance of our executive officers, generally other than himself. The executive committee bases its compensation determinations and decisions upon their subjective review of the performance of the executive officers, our overall performance against our applicable corporate goals and their assessment of the officer’s contributions to such performance, internal pay equity considerations and the competitiveness of the market for each officer’s services. We did not retain the services of a third party compensation consultant in connection with making executive compensation decisions in 2020. In connection with this offering and in preparation for becoming a public company, we have engaged
90
an independent compensation consultant to evaluate our executive compensation strategy, including the determination of an appropriate peer group that we expect may be used in connection with making compensation decisions for fiscal years 2021 and beyond.
Elements of our executive compensation program
For 2020, the primary elements of our named executive officers’ compensation were base salary, annual cash incentive bonuses, which we refer to as performance-based pay (“PBP”), long-term incentive awards and limited executive perquisites.
Base salaries
The base salaries of our named executive officers are an important part of their total compensation package and are intended to reflect their respective positions, duties and responsibilities. Base salary is a visible and stable fixed component of our compensation program. Annual base salaries have historically been based on, among other factors, a named executive officer’s knowledge, experience, expertise, perceived abilities and expected contributions, as well as external market benchmarks. The factors considered are not assigned specific weights.
The current annual base salary of each named executive officer and actions taken with respect to base salary in 2020 are listed below.
|
Named Executive Officer |
|
Annual base salary ($) |
|
|
|
Actions taken in 2020 |
|
|
Christopher Smith |
|
$ |
1,250,000 |
|
|
|
|
|
Joseph M. Busky |
|
$ |
500,000 |
|
|
|
Hired in July 2020 |
|
Michael Iskra |
|
$ |
450,000 |
|
(1) |
|
Received a merit increase in March 2020 and a promotional increase in July 2020 |
|
Chockalingam Palaniappan |
|
$ |
450,000 |
|
|
|
Hired in February 2020 |
|
Michael Schlesinger |
|
$ |
548,375 |
|
(2) |
|
Received a merit increase in March 2020 |
|
Todd Davachi |
|
$ |
450,000 |
|
(3) |
|
|
|
|
(1) |
Mr. Iskra’s annualized base salary was increased from $420,240 to $430,746 in March 2020 and increased in July 2020 to $450,000. |
|
|
(2) |
Michael Schlesinger’s annualized base salary was increased from $535,000 to $548,375 in March 2020. |
|
|
(3) |
Represents annualized base salary as in effect prior to Mr. Davachi’s resignation in March 2020. |
Annual incentive compensation
We structure our compensation programs to reward named executive officers based on our overall company performance and the individual executive’s relative contribution to that performance. This allows the named executive officers to receive performance-based pay awards, which we refer to as “PBP” in the event certain specified corporate performance measures are achieved. The annual PBP pool is determined by the executive committee based upon a formula with reference to the extent of achievement of corporate-level performance goals established annually by the executive committee. Our PBP program is designed to reward named executive officers for contributions made to help us meet our annual performance goals. The amount actually received will depend on overall company performance and individual performance during the year. The executive committee may make discretionary adjustments to the formulaic PBP awards to reflect its subjective determination of an individual’s impact and contribution to overall corporate performance.
Under the terms of the PBP program, the named executive officers’ formulaic PBP awards are based on a percentage of their base salaries and currently range from 50% to 100% for target-level performance achievement. Maximum formulaic PBP awards vary according to each executive and are set at levels that we determine are necessary to maintain competitive compensation practices and properly motivate our named executive officers by rewarding them for our short-term performance and their contributions to that performance. For 2020, none of our named executive officers were entitled to receive a guaranteed PBP award.
Once the extent of achievement of corporate PBP performance targets and the formulaic PBP calculations have been determined, the executive committee may adjust the amount of PBP awards paid upward or downward based upon its overall subjective assessment of each named executive officer’s performance, business impact, contributions, leadership, attainment of individual objectives established periodically throughout the year, as well as other related factors. In addition, PBP funding amounts may be adjusted by the executive committee to account for unusual events such as significant global or market dynamics, extraordinary transactions, asset dispositions and purchases, and mergers and acquisitions if, and to the extent, the compensation committee does not consider the effect of such events indicative of our performance.
91
The following table sets forth the formulaic PBP award levels for 2020 for threshold and target-level performance and the maximum PBP award opportunities for our named executive officers:
|
|
|
|
|
|
|
PBP min |
|
|
PBP target |
|
|
PBP maximum |
|
|||||||||||||||
|
Name(1) |
|
Annual salary ($) |
|
|
% of salary |
|
|
Amount ($) |
|
|
% of salary |
|
|
Amount ($) |
|
|
% of salary |
|
|
Amount ($) |
|
|||||||
|
Christopher Smith |
|
$ |
1,250,000 |
|
|
|
6.4 |
% |
|
$ |
80,030 |
|
|
|
100 |
% |
|
$ |
1,250,000 |
|
|
|
200 |
% |
|
$ |
2,500,000 |
|
|
Joseph M. Busky(2) |
|
$ |
241,803 |
|
|
|
3.8 |
% |
|
$ |
9,289 |
|
|
|
60 |
% |
|
$ |
145,082 |
|
|
|
120 |
% |
|
$ |
290,164 |
|
|
Michael Iskra(2) |
|
$ |
440,110 |
|
|
|
3.4 |
% |
|
$ |
14,788 |
|
|
|
52.5 |
% |
|
$ |
230,979 |
|
|
|
105 |
% |
|
$ |
461,958 |
|
|
Chockalingam Palaniappan(2) |
|
$ |
383,607 |
|
|
|
3.8 |
% |
|
$ |
14,736 |
|
|
|
60 |
% |
|
$ |
230,164 |
|
|
|
120 |
% |
|
$ |
460,328 |
|
|
Michael Schlesinger |
|
$ |
548,375 |
|
|
|
3.2 |
% |
|
$ |
17,555 |
|
|
|
50 |
% |
|
$ |
274,188 |
|
|
|
100 |
% |
|
$ |
548,375 |
|
|
|
(1) |
Mr. Davachi terminated employment with us in early 2020 and will not be eligible for a bonus for 2020 plan year. |
|
|
(2) |
Reflected percentages and amounts for Messrs. Busky, Palaniappan and Iskra are pro-rated based on hire dates or promotional dates, respectively. |
The “Performance Based Pay” award for all named executive officers is based on the sum of a payout percentage for each of Management EBITDA, revenue and individual performance. In general, for each named executive officer, 50% of PBP payout is based on Management EBITDA performance, 30% is based on Company revenue performance and 20% is based on individual performance. A description of how we calculate Management EBITDA is included above under the heading —Use of Non-GAAP Financial Measures—Reconciliation of Net Loss to Adjusted EBITDA. Individual performance is generally a subjective determination of the named executive officer’s achievements and contributions to our organization.
For 2020, aside from the individual performance component of each NEO, the EBITDA and revenue performance goals were as follows:
|
Metric |
|
Target |
|
|
|
Management EBITDA |
|
$ |
508.61 |
|
|
Revenue |
|
$ |
1,834.65 |
|
For determination of the PBP award for each named executive officer, achievement between 99-101% of our annual EBITDA target or revenue target yields a 100% payout percentage for that component. The company also set threshold and maximum percentages of achievement against our annual EBITDA and revenue targets. The minimum performance achievement threshold to receive a payment under the PBP plan for the EBITDA component is 90% and for the revenue component is 95%. Performance achievement of 110.5% for EBITDA and 105.5% for revenue yields the maximum payout of 200% of the target award for each component. The individual performance component can fluctuate from 0% to 200% based on the qualitative assessment of each named executive officer by our CEO and executive committee.
For EBITDA or revenue performance in between the threshold and 99% of target or performance in between 101% of target and maximum levels, we apply “Leverage Ratio” to determine the payout level for that component, whereby the payout level increases or decreases proportionately (on a linear basis) for every one percentage point that achievement exceeds or falls below target range level. The maximum Payout Percentage for each component is 200% and can decrease to a minimum Payout Percentage of 5.3% for the EBITDA component and 11.1% for the Revenue component. The executive committee retains discretion to adjust PBP awards up or down based on overall company performance, market conditions or other factors as it may consider in its discretion.
For 2020, we reported Management EBITDA of $526.7 million and revenue of $1,766.2 million, which were 103.6% and 96.3% of the respective target amounts, resulting in payouts at a level of 126.3% and 55.6% for these PBP components respectively. Individual performance achievement for our named executive officers ranged from 100% to 150% based on a subjective determination of each executive’s performance and contributions to our organization in 2020. PBP payments for 2020 are summarized in the chart below.
92
|
|
|
|
|
|
EBITDA (50%) |
|
|
Revenue (30%) |
|
|
Individual (20%) |
|
|
Total Bonus Amount ($)(3) |
|
|||||||||||||||||
|
Name (1) |
|
Target Bonus Amount ($) |
|
|
% of Target Payout |
|
|
Amount ($) |
|
|
% of Target Payout |
|
|
Amount ($) |
|
|
Achievement |
|
|
Amount ($)(2) |
|
|
Amount ($) |
|
||||||||
|
Christopher Smith |
|
$ |
1,250,000 |
|
|
|
126.3 |
% |
|
$ |
789,375 |
|
|
|
55.6 |
% |
|
$ |
208,500 |
|
|
|
125 |
% |
|
$ |
328,438 |
|
|
$ |
1,326,313 |
|
|
Joseph Busky (1) |
|
|
145,082 |
|
|
|
126.3 |
% |
|
|
91,619 |
|
|
|
55.6 |
% |
|
|
24,200 |
|
|
|
110 |
% |
|
|
33,546 |
|
|
|
149,365 |
|
|
Michael Iskra (1) |
|
|
230,979 |
|
|
|
126.3 |
% |
|
|
124,899 |
|
|
|
55.6 |
% |
|
|
101,409 |
|
|
|
150 |
% |
|
|
72,828 |
|
|
|
299,136 |
|
|
Chockalingam Palaniappan (1) |
|
|
230,164 |
|
|
|
126.3 |
% |
|
|
145,348 |
|
|
|
55.6 |
% |
|
|
38,391 |
|
|
|
110 |
% |
|
|
53,219 |
|
|
|
236,958 |
|
|
Michael Schlesinger |
|
|
274,188 |
|
|
|
126.3 |
% |
|
|
173,149 |
|
|
|
55.6 |
% |
|
|
45,734 |
|
|
|
105 |
% |
|
|
57,635 |
|
|
|
276,518 |
|
|
|
(1) |
Amounts for Messrs. Busky and Palaniappan are pro-rated to reflect partial years of service. Amount for Mr. Iskra is pro-rated to reflect his mid-year promotion and adjustment of base salary and target bonus percentage. |
|
|
(2) |
Amounts shown reflect an additional company modifier of 105.1% to all named executive officers. |
|
|
(3) |
Amounts shown do not include additional initial public offering bonus payments. Although these payments for some of our named executive officers were approved and paid at the same time as the 2020 PBP payments, the amounts were earned as a result of the completion of our initial public offering in January 2021 and are not reportable as compensation for our 2020 fiscal year. |
Long-term incentive compensation
We believe that employees in a position to make a substantial contribution to the long-term success of our company should have a significant and ongoing stake in our success. Long-term equity incentive compensation creates a pay-for-performance culture among our employees that provides an incentive to contribute to the continued growth and development of our business and aligns interest of executives with those of our stockholders. As a result, in connection with Carlyle’s initial acquisition of our business, we adopted our 2014 Equity Incentive Plan (the “2014 Plan”), which governs the terms of our outstanding equity incentive awards, which are described in this compensation discussion and analysis below. In connection with this offering, we intend to adopt a 2021 Incentive Award Plan, which will govern equity compensation awards that we may make to our named executive officers and other employees in the future, and which is described in more detail under the heading “equity incentive plans” below.
Outstanding equity incentive awards
Our long-term equity incentive compensation program presently consists primarily of share option awards that were granted under the 2014 Plan with an exercise price equal to the fair market value of our shares on the date of grant. Historically, we have not granted equity incentive awards on an annual basis to our named executive officers and instead have granted larger “one-time” awards on an infrequent basis as an incentive for participants to drive long-term equity value growth in our business.
Named Executive Officers have historically received an award of share options upon their commencement of service with us or upon promotion, with a portion of the award being considered “time-based” and eligible to vest based on continued employment only, and a portion being eligible to vest based on performance conditions or in the event Carlyle achieves a liquidity event with respect to its investment in us. For option awards granted prior to December 2019, the time-based portion of the award accounted generally for 60% of the award and was eligible to vest in five equal annual installments. The remaining 40% of the award is subject to attaining certain performance metrics tied to our annual earnings before interest, taxes, depreciation and amortization (“EBITDA”) and the portion of these awards that presently remains unvested will generally vest at such time as Carlyle has sold shares representing 70 % or more of its investment in us following the consummation of this offering, provided that it attains certain prescribed return hurdles in connection with its investment in us. The time-based awards are also subject to earlier vesting at such time as Carlyle has sold shares representing 70% or more of its investment in us.
In December 2019 and after, several of our named executive officers who were then employed with us, were a newly hired executive or was promoted, received an additional award of share options. For each participant, 50% of this award is considered “time-based” and is eligible to vest in annual installments over three years and 50% of the award is considered “performance-based.” The performance based portion of the award generally will vest at such time as the average closing price of our ordinary shares over a 10 day period equals or exceeds $20.40, subject to Carlyle having attained certain cash returns on its investment in us. The performance based portion of the award will also vest at such time as Carlyle has sold shares representing 50% or more of its investment in us following the consummation of this offering, provided that it attains certain prescribed return hurdles in connection with such sales. The time-based awards are also subject to earlier vesting at such time as Carlyle has sold shares representing 50% or more of its investment in us.
In addition to the share option awards described above, from time to time we have made limited awards of restricted shares to certain named executive officers in order to deliver an additional form of equity incentive compensation. The restricted stock awards are intended to deliver additional compensation opportunities tied to the increase in the equity value of our business over time while also providing a baseline amount of value to the executive in the event our equity value does not meaningfully increase. These restricted
93
stock awards have been used only in select instances, primarily in connection with an executive’s initial commencement of employment with us, as an employment inducement and/or replacement of forfeited compensation from a prior employer.
Equity incentive awards granted in 2020
In 2020, we granted an award of 318,680 shares of restricted stock to Mr. Smith (the “Smith RSA Grant”) to fulfill compensation commitments made to Mr. Smith upon his commencement of employment with us in 2019. The Smith RSA Grant will be eligible to vest following the consummation of this offering as follows, subject to Mr. Smith’s continuous employment as the Chief Executive Officer of the Company through such vesting event:
|
|
• |
159,340 shares subject to the Smith RSA Grant are designated as “Limited Shares” and will be eligible to vest as follows following the consummation of this offering: (a) 25% of the Limited Shares vest upon this six-month anniversary of the closing date of the offering if as of such date the volume weighted average closing price of the Company’s ordinary shares over the preceding 30 trading days (“VWAP”) equals or exceeds $17.26, (b) 25% of the Limited Shares vest upon the one-year anniversary of the closing date of the offering if, as of such date, the VWAP equals or exceeds $18.83, (c) 25% of the Limited Shares vest upon the eighteen month anniversary of the closing date of the offering if, as of such date the VWAP equals or exceeds $20.40 and (d) 25% of the Limited Shares vest upon the two-year anniversary of the closing date of the offering if, as of such date, the VWAP equals or exceeds $20.40; provided, that in each case, if the VWAP does not equal or exceed the threshold price on the respective vesting date, the Limited Shares remain eligible to vest if the VWAP achieves the applicable price per share threshold prior to December 31, 2023; and |
|
|
• |
The other 159,340 shares subject to the Smith RSA Grant are designated as “Unlimited Shares” and will be eligible to vest following the consummation of this offering as follows: (a) 25% of the Unlimited Shares vest upon the time that the VWAP equals or exceeds $15.69, (b) 25% of the Unlimited Shares vest upon the time that the VWAP equals or exceeds $18.83, (c) 25% of the Unlimited Shares vest upon the time that the VWAP equals or exceeds $21.97 and (d) 25% of the Unlimited Shares vest upon the time that the VWAP equals or exceeds $25.11; provided, that in each case, that no portion of the Unlimited Shares will vest prior to the six month anniversary of the closing date of the offering. |
In 2020, we granted an award of 398,350 share options to Mr. Busky, and 318,680 share options to Dr. Palaniappan in connection with their commencement of employment with us. We also granted an award of 79,670 share options to Mr. Iskra in connection with his promotion to his current position in 2020. The amount of the awards were determined by the executive committee taking into account the named executive officer’s experience level, expected contributions to our organization, internal pay equity considerations and the other factors described above under the heading “—Determination of compensation.”
These awards will vest generally on the same terms as the stock option awards granted to our other named executive officers in December 2019 and after, as described above.
Executive perquisites
We provide limited executive perquisites in order to provide convenient benefits with high perceived values that assist the executive in providing services to us efficiently and consistently.
To increase the efficiency of our executives and maximize the use of their time, we maintain a lease agreement for a corporate airplane. Under his employment agreement, our Chairman and Chief Executive Officer is entitled to use the corporate airplane for business use, and for purposes of his and his immediate family members’ commuting needs to and from New Jersey, mindful of the best interests of the Company and his duties and position, up to 150 hours per year. Under a previously established agreement, we also lease and provide corporate apartments for our Chairman and Chief Executive Officer and General Counsel, and provide a company-leased vehicle for our Chairman and Chief Executive Officer in the Raritan, New Jersey area. The aggregate incremental cost associated with these items in 2020 is included in the Summary Compensation Table below and detailed in the footnotes to that table. In addition, Mr. Busky and Dr. Palaniappan are eligible for relocation benefits or a relocation stipend in conjunction with their possible and anticipated relocations to the Raritan, New Jersey area in the future.
Other elements of compensation
Retirement plans and other employee benefits
Our named executive officers are eligible to participate in our employee benefit plans and programs, including medical and dental benefits and life insurance, to the same extent as our other full-time employees, subject to the terms and eligibility requirements of those plans. We also sponsor a 401(k) defined contribution plan (the “401(k) Plan”) in which our named executive officers may participate, subject to limits imposed by the Code, to the same extent as our other full-time employees. Under this plan, we match 75%
94
of the participants’ first 6% of contributions, following one year of continuous service, up to a specified amount and subject to IRS limitations.
In addition, we maintain a non-qualified defined contribution retirement benefit plan in which our named executive officers are eligible to participate. The non-qualified plan provides supplemental retirement benefits in accordance with the contribution amounts described above for participants whose participation in the 401(k) Plan is limited by IRS rules. The excess benefit plan is described in more detail in the narrative that follows the Nonqualified Deferred Compensation Table.
We believe that providing a vehicle for tax-deferred retirement savings though our 401(k) and non-qualified plans adds to the overall desirability of our executive compensation package and further incentivizes our employees, including our named executive officers, in accordance with our compensation policies.
Retention and sign-on bonuses
From time to time we have entered into targeted sign-on and retention bonus awards with certain of our named executive officers when we have determined it to be appropriate or necessary to secure the services of and ensure the continued retention and dedication of our executive team. In 2020, we paid sign on bonuses of $56,627 to Dr. Palaniappan to make him whole for certain compensation repayment obligations to his former employer, which amount was grossed up for taxes, and $136,000 in respect of an annual bonus that was not paid by his former employer.
Employment and severance agreements
We consider maintenance of a strong management team essential to our success. To that end, we recognize that the uncertainty which may exist among management with respect to their “at-will” employment with us could result in the departure or distraction of management personnel to our detriment. Accordingly, we have determined that severance arrangements are appropriate to encourage the continued attention and dedication of certain members of our management team and to allow them to focus on the value to stockholders of strategic alternatives without concern for the impact on their continued employment. Certain of our named executive officers has entered into an employment agreement or letter agreement that entitles the named executive officer to severance payments and benefits in the event of certain terminations of employment, along with certain other benefits, the key terms of which are summarized as follows:
Christopher Smith
We have entered into an employment agreement with Mr. Smith, pursuant to which we employ Mr. Smith as our Chairman and Chief Executive Officer. The employment agreement has an initial term ending on September 9, 2022, which renews for an additional one year period unless Mr. Smith or the Company delivers written notice of non-renewal at least 90 days prior to the expiration of the then current term. Mr. Smith’s employment agreement provides for base salary, annual performance bonus eligibility and participation in our equity incentive plans. In addition, the agreement provides that Mr. Smith will be entitled to a one-time cash bonus equal to $2,000,000, payable within 10 days after the consummation of this offering.
If we terminate Mr. Smith’s employment without “cause” or he resigns for “good reason,” subject to his execution and non-revocation of a release in favor of the Company, he is entitled to receive (i) an amount equal to 1.0 times the sum of his then current base salary and target annual bonus, payable in installments for 12 months following Mr. Smith’s termination of employment and (ii) payments lasting for up to 12 months’ equal to the amounts Mr. Smith would be required to pay for continued coverage under the Company’s group medical and dental benefit plans.
The employment agreement also includes restrictive covenants pursuant to which Mr. Smith has agreed to refrain from competing with us or soliciting our customers or employees during his employment and for 12 months following termination of his employment and from disclosing our proprietary information during or at any time following his employment.
For purposes of Mr. Smith’s employment agreement:
95
|
|
an act of fraud, embezzlement, misappropriation, or breach of fiduciary duty against the Company or any of its affiliates; and |
|
|
• |
“good reason” means, subject to notice and cure rights, Mr. Smith’s resignation following any of the following without his prior written approval: (i) a decrease in his annual base salary or target bonus, other than a reduction in annual base salary of less than 10% that is implemented in connection with a contemporaneous and proportional reduction in annual base salaries affecting all other senior executives of the Company, (ii) a material decrease in his authority or areas of responsibility as are commensurate with his title or position (other than in connection with a corporate transaction where he continues to hold his position with respect to the Company’s business, substantially as such business exists prior to the date of consummation of such corporate transaction, but does not hold such position with respect to the successor corporation), (iii) the Company’s material breach of any material agreement with him. |
Joseph M. Busky
We entered into an employment offer letter and severance letter with Mr. Busky, pursuant to which we employ him as our Chief Financial Officer. Mr. Busky’s offer letter provides for annual base salary, performance bonus eligibility, an initial equity award grant and benefits. Pursuant to the severance letter, if we terminate Mr. Busky’s employment without cause, he will be entitled to severance payments equal to six months of his annual base salary.
Michael Iskra
Mr. Iskra is party to an employment offer letter with us, pursuant to which we employ him as Executive Vice President, Strategy & Commercial Excellence. Generally, if we terminate Mr. Iskra without cause, he will be eligible to receive severance benefits under our Severance Pay Plan, which provides two weeks’ severance pay for each completed year of service, with a minimum benefit of 12 weeks’ base salary and a maximum benefit of 26 weeks’ base salary.
Chockalingam Palaniappan
We entered into an employment offer letter and severance letter with Dr. Palaniappan, pursuant to which we employ him as our Chief Innovation Officer. Dr. Palaniappan’s offer letter provides for annual base salary, performance bonus eligibility, an initial equity award grant and benefits. In addition, Dr. Palaniappan received an (i) initial signing bonus equal to $56,627, grossed up for taxes, which was reduced from $150,000 as a result of his former employer not requiring full repayment of a forgivable loan (“Initial Bonus”) and (ii) an additional payment of $136,000 (the “Additional Bonus”). In the event Dr. Palaniappan voluntarily resigns or we terminate his employment for cause, in each case prior to February 24, 2022, he is required to repay a pro rata portion of the Initial Bonus and the Additional Bonus. Dr. Palaniappan’s offer letter also includes an agreement by the Company to provide a relocation package, which Dr. Palaniappan will be required to repay in the event he resigns voluntarily or the Company terminates his employment for cause, in each case, within 24 months from when the relocation benefits are provided. Pursuant to the severance letter, if we terminate Dr. Palaniappan’s employment without cause, he will be entitled to severance payments equal to 12 months of his annual base salary.
Michael Schlesinger
We entered into an employment agreement with Mr. Schlesinger, pursuant to which we employ Mr. Schlesinger as our Executive Vice President, General Counsel & Secretary. The employment agreement has a term that renews on January 1 each year for an additional one year period unless Mr. Schlesinger or the Company delivers written notice of non-renewal at least 60 days prior to the expiration of the then current term.
If we terminate Mr. Schlesinger’s employment without “cause” or he resigns for “good reason,” subject to his execution and non-revocation of a release in favor of the Company, he is entitled to receive (i) an amount equal to 1.25 times the sum of his then current annual base salary and target annual bonus, payable in installments for 15 months following Mr. Schlesinger’s termination of employment and (ii) payments lasting for up to 15 months equal to the amounts Mr. Schlesinger would be required to pay for continued coverage under the Company’s group medical and dental benefit plans.
The employment agreement also includes restrictive covenants pursuant to which Mr. Schlesinger has agreed to refrain from competing with us or soliciting our customers or employees during his employment and for 12 months following termination of his employment and from disclosing our proprietary information during or at any time following his employment.
For purposes of Mr. Schlesinger’s employment agreement, “cause” and “good reason” have substantially the same meaning as in Mr. Smith’s employment agreement.
96
2020 Summary Compensation Table
|
Name and Principal Position |
|
Year |
|
|
Salary ($) |
|
|
Bonus ($)(1) |
|
|
Stock awards ($)(2) |
|
|
Option awards ($)(2) |
|
|
Non-equity incentive plan compensation ($)(3) |
|
|
All other compensation ($)(4) |
|
|
Total |
|
||||||||
|
Christopher Smith |
|
|
2020 |
|
|
|
1,250,000 |
|
|
|
— |
|
|
|
4,500,000 |
|
|
|
— |
|
|
|
1,326,313 |
|
|
|
273,129 |
|
|
|
7,349,442 |
|
|
Chairman and Chief Executive Officer |
|
|
|
|
|
|
|
|
|
|
|
|
|
|
|
|
|
|
|
|
|
|
|
|
|
|
|
|
|
|
|
|
|
Joseph Busky |
|
|
2020 |
|
|
|
228,846 |
|
|
|
— |
|
|
|
— |
|
|
|
2,300,000 |
|
|
|
149,365 |
|
|
|
— |
|
|
|
2,678,211 |
|
|
Chief Financial Officer |
|
|
|
|
|
|
|
|
|
|
|
|
|
|
|
|
|
|
|
|
|
|
|
|
|
|
|
|
|
|
|
|
|
Michael Iskra |
|
|
2020 |
|
|
|
437,612 |
|
|
|
— |
|
|
|
— |
|
|
|
460,000 |
|
|
|
299,136 |
|
|
|
23,482 |
|
|
|
1,220,230 |
|
|
Executive Vice President, Strategy & Commercial Excellence |
|
|
|
|
|
|
|
|
|
|
|
|
|
|
|
|
|
|
|
|
|
|
|
|
|
|
|
|
|
|
|
|
|
Chockalingam Palaniappan, Ph.D. |
|
|
2020 |
|
|
|
372,116 |
|
|
|
192,627 |
|
|
|
— |
|
|
|
1,100,000 |
|
|
|
236,958 |
|
|
|
24,927 |
|
|
|
1,926,628 |
|
|
Chief Innovation Officer |
|
|
|
|
|
|
|
|
|
|
|
|
|
|
|
|
|
|
|
|
|
|
|
|
|
|
|
|
|
|
|
|
|
Michael Schlesinger |
|
|
2020 |
|
|
|
545,803 |
|
|
|
— |
|
|
|
— |
|
|
|
— |
|
|
|
276,518 |
|
|
|
56,812 |
|
|
|
879,133 |
|
|
Executive Vice President, General Counsel & Secretary |
|
|
|
|
|
|
|
|
|
|
|
|
|
|
|
|
|
|
|
|
|
|
|
|
|
|
|
|
|
|
|
|
|
Todd Davachi |
|
|
2020 |
|
|
|
103,132 |
|
|
|
— |
|
|
|
— |
|
|
|
— |
|
|
|
— |
|
|
|
16,254 |
|
|
|
119,386 |
|
|
Former Chief Financial Officer |
|
|
|
|
|
|
|
|
|
|
|
|
|
|
|
|
|
|
|
|
|
|
|
|
|
|
|
|
|
|
|
|
|
|
(1) |
Amounts reflect the signing bonuses of $136,000 and $56,627 paid to Dr. Palaniappan following his commencement of employment with us. |
|
|
(2) |
Amounts reflect the full grant-date fair value of restricted stock awards and share options granted during 2020 computed in accordance with ASC Topic 718, rather than the amounts paid to or realized by the named individual. We provide information regarding the assumptions used to calculate the value of all stock awards made to named executive officers in Note 17 to the consolidated financial statements included in this Annual Report on Form 10-K. |
|
|
(3) |
Reflects amounts payable under our PBP program for 2020. For more information, refer to the discussion above under “—Annual incentive compensation.” |
|
|
(4) |
The amounts shown in this column consist of the components set forth in the table below, which include the contributions we made with respect to each named executive officer’s 401(k) plan and non-qualified deferred compensation plan account and perquisites provided to each named executive officer. The amounts set forth below reflect the cost to the company of providing the various benefits. For Mr. Smith, the company aircraft amount reflects Mr. Smith’s use of the company’s leased aircraft for commuting purposes to and from Colorado where he presently resides and is calculated based upon our actual incremental cost to operate the aircraft, including the cost of fuel, trip-related maintenance, crew, travel expenses, on-board catering, landing fees, trip-related hangar and parking costs and other variable costs. Mr. Palaniappan and other company employees occasionally accompanied Mr. Smith on flights using the company aircraft to and from Colorado where Mr. Palaniappan also resides. The Company incurred no incremental cost related to Mr. Palaniappan’s travel on the company aircraft. |
|
Name |
|
Year |
|
401(k) and non-qualified plan contributions |
|
|
Travel benefits ($) |
|
|
Apartment Rental ($) |
|
|
Tax gross ups ($) |
|
||||
|
Christopher Smith |
|
2020 |
|
|
|
|
|
|
224,460 |
|
|
|
34,747 |
|
|
|
1,619 |
|
|
Joseph M. Busky |
|
2020 |
|
|
— |
|
|
|
— |
|
|
|
— |
|
|
|
— |
|
|
Michael Iskra |
|
2020 |
|
|
22,192 |
|
|
|
— |
|
|
|
— |
|
|
|
376 |
|
|
Chockalingam Palaniappan |
|
2020 |
|
|
— |
|
|
|
— |
|
|
|
— |
|
|
|
23,466 |
|
|
Michael Schlesinger |
|
2020 |
|
|
28,128 |
|
|
|
— |
|
|
|
28,684 |
|
|
|
— |
|
|
Todd Davachi |
|
2020 |
|
|
16,254 |
|
|
|
— |
|
|
|
— |
|
|
|
— |
|
97
The following table provides supplemental information relating to grants of plan-based awards made during fiscal 2020 to help explain information provided above in our 2020 Summary Compensation Table. This table presents information regarding all grants of plan-based awards occurring during fiscal 2020.
|
|
|
|
|
|
|
Estimated future payouts under non-equity incentive plan awards(1) |
|
|
Estimated future payouts under equity incentive plan awards |
|
All other option awards: number of shares of stock |
|
|
Exercise price of option |
|
|
Grant date fair value of stock and option |
|
||||||||||||
|
Name |
|
Grant date |
|
|
Threshold ($) |
|
|
Target ($) |
|
|
Maximum ($) |
|
|
Target (#) |
|
or units (#)(3) |
|
|
awards ($/sh) |
|
|
awards ($) |
|
|||||||
|
Christopher Smith |
|
|
— |
|
|
|
80,030 |
|
|
|
1,250,000 |
|
|
|
2,500,000 |
|
|
|
|
|
|
|
|
|
|
|
|
|
|
|
|
Limited Shares(2) |
|
10/26/2020 |
|
|
|
|
|
|
|
|
|
|
|
|
|
|
159,340(2) |
|
|
|
|
|
|
|
|
|
|
2,250,000 |
|
|
|
Unlimited Shares(2) |
|
10/26/2020 |
|
|
|
|
|
|
|
|
|
|
|
|
|
|
159,340(2) |
|
|
|
|
|
|
|
|
|
|
2,250,000 |
|
|
|
Joseph M. Busky |
|
|
|
|
|
|
9,289 |
|
|
|
145,082 |
|
|
|
290,164 |
|
|
|
|
|
|
|
|
|
|
|
|
|
|
|
|
Time Options(3) |
|
7/7/2020 |
|
|
|
|
|
|
|
|
|
|
|
|
|
|
|
|
|
199,175 |
|
|
|
12.56 |
|
|
|
1,237,500 |
|
|
|
Performance Options(4) |
|
7/7/2020 |
|
|
|
|
|
|
|
|
|
|
|
|
|
|
|
|
|
199,175 |
|
|
|
12.56 |
|
|
|
1,062,500 |
|
|
|
Michael Iskra |
|
|
|
|
|
|
14,788 |
|
|
|
230,979 |
|
|
|
461,958 |
|
|
|
|
|
|
|
|
|
|
|
|
|
|
|
|
Time Options(3) |
|
7/27/2020 |
|
|
|
|
|
|
|
|
|
|
|
|
|
|
|
|
|
39,835 |
|
|
|
12.56 |
|
|
|
247,500 |
|
|
|
Performance Options(4) |
|
7/27/2020 |
|
|
|
|
|
|
|
|
|
|
|
|
|
|
39,385(4) |
|
|
|
|
|
|
12.56 |
|
|
|
212,500 |
|
|
|
Palani Palaniappan |
|
|
|
|
|
|
14,736 |
|
|
|
230,164 |
|
|
|
460,328 |
|
|
|
|
|
|
|
|
|
|
|
|
|
|
|
|
Time Options(3) |
|
3/24/2020 |
|
|
|
|
|
|
|
|
|
|
|
|
|
|
|
|
|
159,340 |
|
|
|
12.56 |
|
|
|
645,000 |
|
|
|
Performance Options(4) |
|
3/24/2020 |
|
|
|
|
|
|
|
|
|
|
|
|
|
|
159,340(4) |
|
|
|
|
|
|
12.56 |
|
|
|
455,000 |
|
|
|
Michael Schlesinger |
|
|
|
|
|
|
17,555 |
|
|
|
274,188 |
|
|
|
548,375 |
|
|
|
|
|
|
|
|
|
|
|
|
|
|
|
|
|
(1) |
The amounts reported in these columns reflect the cash PBP award opportunity range for each of our named executive officers. For more information, refer to the discussion above under “—Annual incentive compensation.” |
|
|
(2) |
The amount shown represents a performance-based restricted stock grant made to Mr. Smith in 2020 and will vest as described above under “—Long-term incentive compensation.” |
|
|
(3) |
The amount shown represents time-based option grants made to our named executive officers in 2020 and will vest in three annual installments, subject to acceleration as described above under “—Long-term incentive compensation.” |
|
|
(4) |
The amount shown represents performance-based option grants made to our named executive officers in 2020 and will vest as described above under “—Long-term incentive compensation.” |
98
Outstanding equity awards at 2020 fiscal year-end
The following table includes certain information with respect to stock options held by the Named Executive Officers as of December 31, 2020.
|
|
|
|
|
Option Awards |
|
|
|
|
|
|
|
|
|
|
|
|
Stock Awards |
|
||||||||||||||||||
|
Name |
|
Grant date |
|
Number of securities underlying unexercised options (#) exercisable |
|
|
Number of securities underlying unexercised options (#) unexercisable |
|
|
Equity incentive plan awards: number of securities underlying unexercised unearned options (#) |
|
|
Option exercise price ($) |
|
|
Option expiration date |
|
Number of shares or units of stock that have not vested (#) |
|
|
Market value of shares or units of stock that have not vested ($) |
|
|
Equity incentive plan awards: number of unearned shares, units or other rights that have not vested (#) |
|
|
Equity incentive plan awards: market or payout value of unearned shares, units or other rights that have not vested ($) |
|
||||||||
|
Christopher Smith |
|
|
|
|
|
|
|
|
|
|
|
|
|
|
|
|
|
|
|
|
|
|
|
|
|
|
|
|
|
|
|
|
|
|
|
|
|
Time Options(1) |
|
12/20/2019 |
|
|
345,237 |
|
|
|
690,473 |
|
|
|
|
|
|
|
12.56 |
|
|
12/20/2029 |
|
|
|
|
|
|
|
|
|
|
|
|
|
|
|
|
|
Performance Options(1) |
|
12/20/2019 |
|
|
|
|
|
|
|
|
|
|
1,035,710 |
|
|
|
12.56 |
|
|
12/20/2029 |
|
|
|
|
|
|
|
|
|
|
|
|
|
|
|
|
|
Restricted Stock(1) |
|
12/12/2019 |
|
|
|
|
|
|
|
|
|
|
|
|
|
|
|
|
|
|
|
|
318,680 |
|
|
|
4,500,000 |
|
|
|
|
|
|
|
|
|
|
Restricted Stock(1) |
|
10/26/2020 |
|
|
|
|
|
|
|
|
|
|
|
|
|
|
|
|
|
|
|
|
|
|
|
|
|
|
|
|
318,680 |
|
|
|
4,500,000 |
|
|
Joseph M. Busky |
|
|
|
|
|
|
|
|
|
|
|
|
|
|
|
|
|
|
|
|
|
|
|
|
|
|
|
|
|
|
|
|
|
|
|
|
|
Time Options(2) |
|
7/7/2020 |
|
|
|
|
|
|
199,175 |
|
|
|
|
|
|
|
12.56 |
|
|
7/7/2030 |
|
|
|
|
|
|
|
|
|
|
|
|
|
|
|
|
|
Performance Options(2) |
|
7/7/2020 |
|
|
|
|
|
|
|
|
|
|
199,175 |
|
|
|
12.56 |
|
|
7/7/2030 |
|
|
|
|
|
|
|
|
|
|
|
|
|
|
|
|
|
Michael Iskra |
|
|
|
|
|
|
|
|
|
|
|
|
|
|
|
|
|
|
|
|
|
|
|
|
|
|
|
|
|
|
|
|
|
|
|
|
|
Time Options(3) |
|
7/27/2020 |
|
|
|
|
|
|
39,835 |
|
|
|
|
|
|
|
12.56 |
|
|
7/27/2030 |
|
|
|
|
|
|
|
|
|
|
|
|
|
|
|
|
|
Performance Options(3) |
|
7/27/2020 |
|
|
|
|
|
|
|
|
|
|
39,835 |
|
|
|
12.56 |
|
|
7/27/2030 |
|
|
|
|
|
|
|
|
|
|
|
|
|
|
|
|
|
Time Options(4) |
|
12/20/2019 |
|
|
39,835 |
|
|
|
79,670 |
|
|
|
|
|
|
|
12.56 |
|
|
12/20/2029 |
|
|
|
|
|
|
|
|
|
|
|
|
|
|
|
|
|
Performance Options(4) |
|
12/20/2019 |
|
|
|
|
|
|
|
|
|
|
119,505 |
|
|
|
12.56 |
|
|
12/20/2029 |
|
|
|
|
|
|
|
|
|
|
|
|
|
|
|
|
|
Time Options(5) |
|
12/21/2015 |
|
|
125,241 |
|
|
|
|
|
|
|
|
|
|
|
6.28 |
|
|
12/21/2025 |
|
|
|
|
|
|
|
|
|
|
|
|
|
|
|
|
|
Performance Options(5) |
|
12/21/2015 |
|
|
83,494 |
|
|
|
|
|
|
|
|
|
|
|
6.28 |
|
|
12/21/2025 |
|
|
|
|
|
|
|
|
|
|
|
|
|
|
|
|
|
Palani Palaniappan |
|
|
|
|
|
|
|
|
|
|
|
|
|
|
|
|
|
|
|
|
|
|
|
|
|
|
|
|
|
|
|
|
|
|
|
|
|
Time Options(6) |
|
3/24/2020 |
|
|
|
|
|
|
159,340 |
|
|
|
|
|
|
|
12.56 |
|
|
3/24/2030 |
|
|
|
|
|
|
|
|
|
|
|
|
|
|
|
|
|
Performance Options(6) |
|
3/24/2020 |
|
|
|
|
|
|
|
|
|
|
159,340 |
|
|
|
12.56 |
|
|
3/24/2030 |
|
|
|
|
|
|
|
|
|
|
|
|
|
|
|
|
|
Michael Schlesinger |
|
|
|
|
|
|
|
|
|
|
|
|
|
|
|
|
|
|
|
|
|
|
|
|
|
|
|
|
|
|
|
|
|
|
|
|
|
Time Options(7) |
|
12/20/2019 |
|
|
45,145 |
|
|
|
106,227 |
|
|
|
|
|
|
|
12.56 |
|
|
12/20/2029 |
|
|
|
|
|
|
|
|
|
|
|
|
|
|
|
|
|
Performance Options(7) |
|
12/20/2019 |
|
|
|
|
|
|
|
|
|
|
159,340 |
|
|
|
12.56 |
|
|
12/20/2029 |
|
|
|
|
|
|
|
|
|
|
|
|
|
|
|
|
|
Time Options(8) |
|
10/22/2014 |
|
|
222,237 |
|
|
|
|
|
|
|
|
|
|
|
6.28 |
|
|
10/22/2024 |
|
|
|
|
|
|
|
|
|
|
|
|
|
|
|
|
|
Performance Options(8) |
|
10/22/2014 |
|
|
201,270 |
|
|
|
|
|
|
|
|
|
|
|
6.28 |
|
|
10/22/2024 |
|
|
|
|
|
|
|
|
|
|
|
|
|
|
|
|
|
|
(1) |
Represents options granted to Mr. Smith in connection with his commencement of employment in September 2019. The three annual installments of time-vesting options were and are scheduled to vest equally on September 9, 2021 and 2022, subject to his continued employment on each vesting date. The performance-vesting options vest on such date as the Company’s stock price equals or exceeds $20.40 (the “Stock Price Hurdle”), provided that as of such date or prior thereto, Carlyle has attained certain cash returns on its investment in us (the “Return Metric”). The restricted stock awarded in 2019 will vest as to 100% of the total number of then-unvested shares underlying the award on September 9, 2022. Details regarding the vesting terms of the restricted stock award made in 2020 are described above under "— Long-term incentive compensation." |
|
|
(2) |
Represents options granted to Mr. Busky in connection with the commencement of his employment in July 2020. The three annual installments of time-vesting options vest equally on July 7, 2021, 2022 and 2023, subject to his continued employment on each vesting date. The performance-vesting options vest on such date as the Company’s stock price equals or exceeds the Stock Price Hurdle, provided that as of such date or prior thereto, the Return Metric has been achieved. |
|
|
(3) |
Represents options granted to Mr. Iskra in connection with promotion to Executive Vice President of Commercial Excellence and Strategy effective August 1, 2020. The three annual installments of time-vesting options vest equally on July 27, 2021, 2022 and 2023, subject to his continued employment on each vesting date. The performance-vesting options vest on such date as the Company’s stock price equals or exceeds the Stock Price Hurdle, provided that as of such date or prior thereto, the Return Metric has been achieved. |
|
|
(4) |
Represents options granted to Mr. Iskra in December 2019. The three annual installments of time-vesting options were and are scheduled to vest equally on December 20, 2021 and 2022, subject to his continued employment on each vesting date. The performance-vesting options vest on such date as the Company’s stock price equals or exceeds the Stock Price Hurdle, provided that as of such date or prior thereto, the Return Metric has been achieved. |
|
|
(5) |
Represents options granted to Mr. Iskra in December 2015. The unvested performance-vesting options are eligible to vest as described above under “—Long-term incentive compensation.” |
|
|
(6) |
Represents options granted to Dr. Palaniappan in connection with the commencement of his employment in March 2020. The three annual installments of time-vesting options vest equally on July 27, 2021, 2022 and 2023, subject to his continued employment on each vesting date. The performance-vesting options vest on such date as the Company’s stock price equals or exceeds the Stock Price Hurdle, provided that as of such date or prior thereto, the Return Metric has been achieved. |
99
|
|
stock price equals or exceeds $20.40 (the “Stock Price Hurdle”), provided that as of such date or prior thereto, the Principal Stockholders have received aggregate Cash Proceeds equal to or in excess of two (2) times the Investment. |
|
|
(8) |
Represents options granted to Mr. Schlesinger in October 2014. The unvested performance-vesting options are eligible to vest as described above under “—Long-term incentive compensation.” |
Option exercises and stock vested in 2020
The below table depicts options that were exercised by our named executive officers during the year ended December 31, 2020. None of our named executive officers vested in any stock awards during 2020.
|
Name |
|
Option awards || number of shares acquired on exercise |
|
|
Option awards || value realized on exercise |
|
|
Stock awards || number of shares acquired on vesting |
|
|
Stock awards || value realized on vesting |
|
||||
|
Christopher Smith |
|
|
— |
|
|
|
— |
|
|
|
— |
|
|
|
— |
|
|
Joseph M. Busky |
|
|
— |
|
|
|
— |
|
|
|
— |
|
|
|
— |
|
|
Michael Iskra |
|
|
— |
|
|
|
— |
|
|
|
— |
|
|
|
— |
|
|
Chockalingam Palaniappan |
|
|
— |
|
|
|
— |
|
|
|
— |
|
|
|
— |
|
|
Michael Schlesinger |
|
|
23,901 |
|
|
|
137,500 |
|
|
|
— |
|
|
|
— |
|
Pension benefits table
None of our named executive officers participated in any defined benefit pension plans in 2020.
Nonqualified deferred compensation table
We maintain the Ortho Clinical Diagnostics Excess Plan, or Excess Plan, for a select group of our highly compensated employees, in which our named executive officers are eligible to participate. Under the terms of the Excess Plan, we make contributions to participant accounts equal to amounts which would have been received in the tax-qualified 401(k) Plan had the participant’s participation in the 401(k) Plan not been limited by rules imposed under the Code and ERISA.
The following table contains information regarding nonqualified deferred compensation plans for 2020.
|
Name |
|
Registrant contributions in last FY ($)(1) |
|
|
Aggregate earnings in last FY ($) |
|
|
Aggregate withdrawals/ distributions ($) |
|
|
Aggregate balance at last FYE ($) |
|
||||
|
Christopher Smith |
|
|
— |
|
|
|
— |
|
|
|
— |
|
|
|
— |
|
|
Joseph M. Busky |
|
|
— |
|
|
|
— |
|
|
|
— |
|
|
|
— |
|
|
Michael Iskra |
|
|
9,367 |
|
|
|
2,492 |
|
|
|
— |
|
|
|
49,637 |
|
|
Chockalingam Palaniappan |
|
|
— |
|
|
|
— |
|
|
|
— |
|
|
|
— |
|
|
Michael Schlesinger |
|
|
18,406 |
|
|
|
5,563 |
|
|
|
— |
|
|
|
110,574 |
|
|
Todd Davachi(2) |
|
|
11,970 |
|
|
|
307 |
|
|
|
34,609 |
|
|
|
— |
|
|
|
(1) |
Reflects contributions made to the plan in March 2020 in respect to Excess Plan amounts for 2019. |
|
|
(2) |
Reflects Mr. Davachi’s payout of deferred compensation in 2020 in connection with his termination of employment. |
Potential payments upon termination or a change in control
Our named executive officers would be entitled to severance payments and benefits in the event their employment with us is terminated following an involuntary termination, which would include a termination of the officer’s employment by us without cause or, for Mr. Smith and Mr. Schlesinger, a resignation for good reason. For more information, refer to the discussion above under the heading “—Employment and severance arrangements.” In addition, our named executive officers’ outstanding stock option and restricted share awards would vest upon the occurrence of a “liquidity event” for Carlyle, which could include a change in control of us and generally would occur if Carlyle sold shares representing at least 50% of its investment in us (70% for option awards granted before December 2019), subject to attainment of certain share price and return thresholds for certain of the performance-based option awards. For more information, refer to the discussion above under the heading “—Long-term incentive compensation.”
The following table shows potential payments to our named executive officers under the employment and severance arrangements and with respect to their outstanding equity incentive awards for various scenarios involving a termination of employment
100
or Carlyle liquidity event assuming such event occurred on December 31, 2020 and, where applicable, using a price of our ordinary shares of $14.12, which was the most recent board determined value of our ordinary shares as of such date:
|
|
|
Form of payment |
|
|||||||||||||||||
|
Name/Triggering Event |
|
Cash severance ($) |
|
|
Prorated bonus ($) |
|
|
Benefit continuation ($) |
|
|
Equity awards ($) |
|
|
Total($) |
|
|||||
|
Christopher Smith |
|
|
|
|
|
|
|
|
|
|
|
|
|
|
|
|
|
|
|
|
|
Liquidity Event |
|
|
0 |
|
|
2,000,000(1) |
|
|
|
0 |
|
|
|
5,583,333 |
|
|
|
7,583,333 |
|
|
|
Death/Disability |
|
|
0 |
|
|
|
1,250,000 |
|
|
|
0 |
|
|
|
0 |
|
|
|
1,250,000 |
|
|
Involuntary Termination |
|
|
1,250,000 |
|
|
|
1,250,000 |
|
|
|
27,987 |
|
|
|
0 |
|
|
|
2,527,987 |
|
|
Joseph M. Busky |
|
|
|
|
|
|
|
|
|
|
|
|
|
|
|
|
|
|
|
|
|
Liquidity Event |
|
|
0 |
|
|
|
0 |
|
|
|
0 |
|
|
|
312,500 |
|
|
|
312,500 |
|
|
Death/Disability |
|
|
0 |
|
|
|
145,082 |
|
|
|
0 |
|
|
|
0 |
|
|
|
145,082 |
|
|
Involuntary Termination |
|
|
250,000 |
|
|
|
145,082 |
|
|
|
9,932 |
|
|
|
0 |
|
|
|
405,014 |
|
|
Michael Iskra |
|
|
|
|
|
|
|
|
|
|
|
|
|
|
|
|
|
|
|
|
|
Liquidity Event |
|
|
0 |
|
|
|
0 |
|
|
|
0 |
|
|
|
187,500 |
|
|
|
187,500 |
|
|
Death/Disability |
|
|
0 |
|
|
|
230,979 |
|
|
|
0 |
|
|
|
0 |
|
|
|
230,979 |
|
|
Involuntary Termination |
|
|
103,846 |
|
|
|
230,979 |
|
|
|
4,803 |
|
|
|
0 |
|
|
|
339,628 |
|
|
Chockalingam Palaniappan |
|
|
|
|
|
|
|
|
|
|
|
|
|
|
|
|
|
|
|
|
|
Liquidity Event |
|
|
0 |
|
|
|
0 |
|
|
|
0 |
|
|
|
250,000 |
|
|
|
250,000 |
|
|
Death/Disability |
|
|
0 |
|
|
|
230,164 |
|
|
|
0 |
|
|
|
0 |
|
|
|
230,164 |
|
|
Involuntary Termination |
|
|
450,000 |
|
|
|
230,164 |
|
|
|
7,037 |
|
|
|
0 |
|
|
|
687,201 |
|
|
Michael Schlesinger |
|
|
|
|
|
|
|
|
|
|
|
|
|
|
|
|
|
|
|
|
|
Liquidity Event |
|
|
0 |
|
|
|
0 |
|
|
|
0 |
|
|
|
166,667 |
|
|
|
166,667 |
|
|
Death/Disability |
|
|
0 |
|
|
|
274,188 |
|
|
|
0 |
|
|
|
0 |
|
|
|
274,188 |
|
|
Involuntary Termination |
|
|
685,469 |
|
|
|
274,188 |
|
|
|
24,806 |
|
|
|
0 |
|
|
|
984,463 |
|
|
|
(1) |
Amount includes a special one-time cash bonus of $2,000,000 payable upon the occurrence of an IPO or Liquidity Event. |
Compensation of our directors
Directors who are representatives of Carlyle or who are also executive officers, receive no additional compensation for serving on our board of directors or its committees. Pursuant to our director compensation program as in effect prior to the consummation of this offering, we pay each of our other directors (other than Mr. Yates), which we refer to as our non-employee directors, $100,000 per year in cash for service on our Board of Directors, payable quarterly in arrears. Our non-employee directors have also historically received an annual award of restricted stock under our 2014 Equity Incentive Plan having an annual value of $75,000. For 2020 the restricted stock award granted to each of our non-employee directors covered 5,975 shares and was eligible to vest in equal quarterly installments over a period of two years.
Mr. Yates previously served as our Chief Operating Officer and Chief Executive Officer and continues to serve in a more extensive role than our non-employee directors, as both a member of our Board of Directors and as a non-officer level advisory employee of the Company. For his services as both a director and employee of us, for 2020, Mr. Yates received salary payments of $175,000 in cash and was eligible to participate in our benefit programs as if he was a regular employee.
In December 2020, we granted Mr. Yates an award of 318,680 restricted stock units (the “Yates RSU Award”). The Yates RSU Award was granted to fulfill compensation commitments made to Mr. Yates in respect of his service as our chief executive officer prior to Mr. Smith assuming that role in 2019; however, the Yates RSU Award is subject to vesting based on Mr. Yates’ continued service as a member of our board of directors through the date that is six months after the consummation of this offering. Notwithstanding the foregoing, in the event of Mr. Yates death or disability or removal from the board other than for cause, in each case, prior to a vesting date, the Yates RSU Award will vest in full.
101
The following table sets forth the compensation we paid to our non-employee directors for services performed in fiscal 2020:
|
Name |
|
Fees earned or paid in cash ($) |
|
|
Stock awards ($)(1) |
|
|
All other compensation(2) |
|
|
Total |
|
||||
|
Robert Yates |
|
|
175,000 |
|
|
|
4,500,000 |
|
|
|
78,041 |
|
|
|
4,753,041 |
|
|
Thomas Mac Mahon |
|
|
100,000 |
|
|
|
84,375 |
|
|
|
— |
|
|
|
184,375 |
|
|
Ronald Labrum |
|
|
100,000 |
|
|
|
84,375 |
|
|
|
— |
|
|
|
184,375 |
|
|
David Perez |
|
|
50,000 |
|
|
|
75,000 |
|
|
|
— |
|
|
|
125,000 |
|
|
Carl Hull |
|
|
100,000 |
|
|
|
84,375 |
|
|
|
— |
|
|
|
184,375 |
|
|
|
(1) |
Amounts reflect the full grant-date fair value of restricted shares granted during 2020 computed in accordance with ASC Topic 718. As of December 31, 2020, our non-employee directors (other than Mr. Yates) held the following number of unvested restricted shares: Mr. Mac Mahon: 7,467; Mr. Labrum: 7,467; Mr. Perez: 5,227; and Mr. Hull: 7,467. As of December 31, 2020, Mr. Yates held 1,048,287 outstanding share options and 318,680 unvested restricted shares. |
|
|
(2) |
Amounts reflect contributions we made for Mr. Yates pursuant to the Company’s 401(k) plan and in March 2020 in respect to Excess Plan amounts for 2019. |
Following the consummation of this offering, we anticipate adopting a director compensation policy, pursuant to which our employee and non-employee directors will be compensated and which we anticipate may differ materially from our past director compensation practices. We will formally propose a director remuneration policy for approval by shareholders at the first annual general meeting of the Company following the consummation of this Offering, in accordance with the UK Companies Act 2006 and the regulations set out in the UK Large and Medium-sized Companies and Groups (Accounts and Report) Regulations 2008 (as amended).
Compensation risk assessment
Management conducted a risk assessment of our compensation plans and practices and concluded that our compensation programs do not create risks that are reasonably likely to have a material adverse effect on the Company. The objective of the assessment was to identify any compensation plans or practices that may encourage employees to take unnecessary risk that could threaten the Company. No such plans or practices were identified. The board of directors has reviewed and agrees with management’s conclusion.
Item 12. Security Ownership of Certain Beneficial Owners and Management and Related Stockholder Matters.
The following table and accompanying footnotes set forth information with respect to the beneficial ownership of the ordinary shares of Ortho Clinical Diagnostics Holdings plc as of March 3, 2021 by:
Beneficial ownership for the purposes of the following table is determined in accordance with the rules and regulations of the SEC. A person is a “beneficial owner” of a security if that person has or shares “voting power,” which includes the power to vote or to direct the voting of the security, or “investment power,” which includes the power to dispose of or to direct the disposition of the security or has the right to acquire such powers within 60 days.
Unless otherwise noted in the footnotes to the following table, and subject to applicable community property laws, the persons named in the table have sole voting and investment power with respect to their beneficially owned ordinary shares.
102
Except as otherwise indicated in the footnotes below, the address of each beneficial owner is c/o Ortho Clinical Diagnostics Holdings plc, 1001 Route 202, Raritan, New Jersey 08869.
|
|
|
Shares beneficially owned |
|
|||||
|
|
Shares |
|
|
Percentage |
|
|||
|
5% Shareholders: |
|
|
|
|
|
|
|
|
|
Carlyle Investor (1) |
|
|
143,406,000 |
|
|
|
61.1 |
% |
|
|
|
|
|
|
|
|
|
|
|
Directors and Named Executive Officers: |
|
|
|
|
|
|
|
|
|
Chris Smith (2) |
|
|
982,597 |
|
|
* |
|
|
|
Joseph M. Busky |
|
|
- |
|
|
|
- |
|
|
Chad Dale (3) |
|
|
238,456 |
|
|
* |
|
|
|
Michael S. Iskra (4) |
|
|
248,570 |
|
|
* |
|
|
|
Chockalingam Palaniappan (5) |
|
|
53,113 |
|
|
* |
|
|
|
Michael A. Schlesinger (6) |
|
|
556,290 |
|
|
* |
|
|
|
Karen H. Bechtel |
|
|
- |
|
|
|
- |
|
|
Evelyn Dilsaver |
|
|
- |
|
|
|
- |
|
|
Allan Holt |
|
|
- |
|
|
|
- |
|
|
Carl Hull (7) |
|
|
59,583 |
|
|
* |
|
|
|
Ron Labrum |
|
|
107,385 |
|
|
* |
|
|
|
Thomas Mac Mahon |
|
|
139,253 |
|
|
* |
|
|
|
David Perez |
|
|
5,976 |
|
|
* |
|
|
|
Robert R. Schmidt |
|
|
- |
|
|
|
- |
|
|
Stephen H. Wise |
|
|
- |
|
|
|
- |
|
|
Robert Yates (8) |
|
|
1,157,310 |
|
|
* |
|
|
|
All directors and executive officers as a group (16 Persons) (9) |
|
|
3,548,533 |
|
|
|
1.5 |
% |
|
* |
Indicates beneficial ownership of less than 1%. |
|
(1) |
Reflects ordinary shares held of record by Carlyle Partners VI Cayman Holdings, L.P. (the “Carlyle Investor”). Carlyle Group Management L.L.C. holds an irrevocable proxy to vote a majority of the shares of The Carlyle Group Inc. (“Carlyle”), a publicly traded company listed on Nasdaq. Carlyle is the sole member of Carlyle Holdings II GP L.L.C., which is the managing member of Carlyle Holdings II L.L.C., which, with respect to the securities reported herein, is the managing member of CG Subsidiary Holdings L.L.C., which is the general partner of TC Group Cayman Investment Holdings, L.P., which is the general partner of TC Group Cayman Investment Holdings Sub L.P., which is the sole member of TC Group VI Cayman, L.L.C., which is the general partner of TC Group VI Cayman, L.P., which is the general partner of the Carlyle Investor. Voting and investment determinations with respect to the ordinary shares held of record by the Carlyle Investor are made by an investment committee of TC Group VI Cayman, L.P. Accordingly, each of the foregoing entities may be deemed to share beneficial ownership of the securities held of record by the Carlyle Investor. Each of them disclaims beneficial ownership of such securities. The address for each of TC Group Cayman Investment Holdings, L.P., TC Group Cayman Investment Holdings Sub L.P., TC Group VI Cayman, L.P. and the Carlyle Investor is c/o Walkers, Cayman Corporate Center, 27 Hospital Road, George Town, Grand Cayman KY1-9008, Cayman Islands. The address of each of the other entities named in this footnote is c/o The Carlyle Group, 1001 Pennsylvania Avenue, NW, Suite 220 South, Washington, D.C. 20004. |
|
(2) |
Includes 345,237 ordinary shares issuable upon the exercise of options exercisable within 60 days following March 3, 2021. |
|
(3) |
Includes 238,456 ordinary shares issuable upon the exercise of options exercisable within 60 days following March 3, 2021. |
|
(4) |
Includes 248,570 ordinary shares issuable upon the exercise of options exercisable within 60 days following March 3, 2021. |
|
(5) |
Includes 53,113 ordinary shares issuable upon the exercise of options exercisable within 60 days following March 3, 2021. |
|
(6) |
Includes 468,653 ordinary shares issuable upon the exercise of options exercisable within 60 days following March 3, 2021. |
|
(7) |
Includes 41,172 ordinary shares held by Mr. Hull in his capacity as a Trustee of the Hull Living Trust. |
|
(8) |
Includes 1,157,310 ordinary shares issuable upon the exercise of options exercisable within 60 days following March 3, 2021. |
|
(9) |
Includes 2,511,339 ordinary shares issuable upon the exercise of options exercisable within 60 days following March 3, 2021. |
Item 13. Certain Relationships and Related Transactions, and Director Independence.
Consulting services agreement
In connection with the Acquisition, we entered into consulting services agreements with Carlyle Investment Management, L.L.C. (“CIM”), pursuant to which we pay CIM a fee for advisory, consulting and other services to be provided to us. The consulting services agreement was amended and restated effective as of October 15, 2020. Pursuant to the consulting services agreement, we pay an annual management fee to CIM of $3.0 million (the “Management Fee”). The Management Fee is payable on a quarterly basis. We will also reimburse CIM’s reasonable out-of-pocket expenses incurred in connection with services provided pursuant to the consulting services agreement, and we may pay CIM additional fees associated with other future transactions or in consideration of any additional services provided under the consulting services agreement. The consulting services agreement will terminate on the earlier of (a) the second anniversary of the consummation of our IPO and (b) the date on which CIM and its affiliates collectively own less than 10% of our outstanding ordinary shares. During the fiscal year ended January 3, 2021, we recorded approximately $3.0 million of Management Fee expense and other out-of-pocket expenses.
103
Transactions with portfolio companies of funds affiliated with Carlyle
We have entered into agreements to sell products and provide services to Global Health Private Limited, Rede D’Or São Luiz S.A. and Pharmaceutical Product Development, Inc., health care diagnostic companies that are portfolio companies of funds affiliated with Carlyle. During the fiscal year ended January 3, 2021, we recognized revenues of approximately $1.1 million from Global Health Private Limited and approximately $2.7 million from Rede D’Or São Luiz S.A. For the fiscal year ended January 3, 2021, revenues recognized from Pharmaceutical Product Development, Inc were immaterial.
ProKarma Holdings Inc., Reval Holdings Inc. and Work & Co., portfolio companies of funds affiliated with Carlyle, have provided IT services to us. During the fiscal year ended January 3, 2021, we incurred IT service fees of approximately $0.4 million to ProKarma Holdings Inc. For the fiscal year ended January 3, 2021, we incurred IT service fees of approximately $0.4 million to Work & Co. For the fiscal year ended January 3, 2021, we incurred IT service fees of approximately $0.3 million to Reval Holdings Inc.
CFGI, a portfolio company of a fund that became affiliated with Carlyle in the fourth quarter of fiscal year 2017, provides consulting services to us. During the fiscal year ended January 3, 2021, we incurred consulting fees to CFGI of approximately $1.1 million.
WellDyneRx, LLC, a pharmacy benefit management organization affiliated with Carlyle, started to provide pharmacy services to us during the fiscal year ended January 3, 2021. During the fiscal year ended January 3, 2021, we incurred fees related to pharmacy services of approximately $5.7 million.
Shareholders agreements
Principal Shareholders Agreement
In connection with the Reorganization Transactions, we entered into a shareholders agreement with the Principal Shareholder (the “Principal Shareholders Agreement”).
The Principal Shareholders Agreement includes provisions pursuant to which we have granted Carlyle (or such permitted transferee or affiliate) the right to cause us, in certain instances, at our expense, to file registration statements under the Securities Act covering resales of our ordinary shares held by Carlyle (or such permitted transferee or affiliate) or to piggyback on other registration statements in certain circumstances. These shares represent approximately 61.1% of our ordinary shares as of March 3, 2021. These ordinary shares also may be sold under Rule 144 under the Securities Act, depending on their holding period and subject to restrictions in the case of ordinary shares held by persons deemed to be our affiliates. The Principal Shareholders Agreement also requires us to indemnify Carlyle (or such permitted transferee or affiliate) and its affiliates in connection with any registrations of our securities.
Amended and Restated Shareholders Agreement
In connection with the Reorganization Transactions, we amended and restated our existing shareholders agreement with the Principal Shareholder and certain members of management (the “Amended and Restated Shareholders Agreement”). Such members of management who are party to the Amended and Restated Shareholders Agreement (the “Management Shareholders”) are those who previously held ordinary shares of Bermuda Holdco or who held options, warrants or other rights to subscribe for or purchase ordinary shares Bermuda Holdco (collectively, the “Management Shares”), which Management Shares were exchanged for a like amount of our ordinary shares or options, warrants or other rights to subscribe for or purchase our ordinary shares upon consummation of the Reorganization Transaction.
The Amended and Restated Shareholders Agreement provides for, among other things, provisions restricting the transfer of Management Shares. Pursuant to the Amended and Restated Shareholders Agreement, and subject to any permitted transfers described therein, there are certain restrictions on the ability of Management Shareholders to transfer any Management Shares. Such agreement will terminate upon the earlier of a sale of our Company and a written election to terminate by the Principal Shareholder.
Indemnification of directors and officers
In connection with our IPO, UK Holdco and one of our U.S. subsidiaries entered into deeds of indemnity and indemnification agreements, respectively, with each of our directors and certain of our officers that indemnify such persons to the maximum extent permitted by applicable law against all losses suffered or incurred by them including, among other things, those that arise out of or in connection with his or her appointment as a director or officer, an act done, concurred in or omitted to be done by such person in connection with such person’s performance of his or her functions as a director or officer, or an official investigation, examination or other proceedings ordered or commissioned in connection with the affairs of the company of which he or she is serving as a director or officer at the request of the indemnifying company. These deeds of indemnity and indemnification agreements provide the directors and officers with contractual rights to indemnification and expense advancement.
104
Related persons transaction policy
Our board of directors has adopted a written policy on transactions with related persons, which we refer to as our “related person policy.” Our related person policy requires that all “related persons” (as defined in paragraph (a) of Item 404 of Regulation S-K) must promptly disclose to our general counsel any “related person transaction” (defined as any transaction that is anticipated would be reportable by us under Item 404(a) of Regulation S-K in which we were or are to be a participant and the amount involved exceeds $120,000 and in which any related person had or will have a direct or indirect material interest) and all material facts with respect thereto. Our general counsel will communicate that information to our board of directors or to a duly authorized committee thereof. Our related person policy provides that no related person transaction entered into will be executed without the approval or ratification of our board of directors or a duly authorized committee thereof. It is our policy that any directors interested in a related person transaction must recuse themselves from any vote on a related person transaction in which they have an interest.
Other
From time to time, we may also enter into other employment or compensation arrangements with senior management or other key employees. See Part III, Item 11, “Executive compensation—Compensation discussion and analysis—Employment and severance agreements.”
Express Scripts Holding Company (“Express Scripts”), a pharmacy benefit management organization affiliated with a member of our board of directors, previously provided pharmacy services to us. During the fiscal years ended December 30, 2018 and December 31, 2017, we incurred fees related to pharmacy services provided by Express Scripts of approximately $6.3 million and $6.6 million, respectively. During the fiscal year ended December 29, 2019, Express Scripts was no longer affiliated with us.
During the fiscal year ended January 3, 2021, we recognized approximately $0.3 million in sales to Quotient Ltd., another organization which is an investee of ours (“Quotient”). We also purchased inventories from Quotient amounting to approximately $21.1 million for the fiscal year ended January 3, 2021.
Pursuant to the corporate governance listing standards of Nasdaq, a director who is, or at any time during the past three years was, employed by us cannot be deemed to be an “independent director.” Each other director will qualify as “independent” only if our board of directors affirmatively determines that such director has no material relationship with us, either directly or as a partner, shareholder or officer of an organization that has a relationship with us. Ownership of a significant amount of our ordinary shares, by itself, does not constitute a material relationship.
Our board of directors has affirmatively determined that each of our directors, other than Messrs. Smith and Yates, qualifies as “independent” in accordance with the Nasdaq rules. In making its independence determinations, our board of directors considered and reviewed all information known to it (including information identified through directors’ questionnaires). Mr. Smith is not independent because he is the current chairman and chief executive officer of the Company, and Mr. Yates is not independent because he previously served as chairman and chief executive officer of the Company.
Under the Nasdaq corporate governance standards, a company of which more than 50% of the voting power is held by an individual, group or another company is a “controlled company” and may elect not to comply with certain corporate governance standards, including (1) the requirement that a majority of the board of directors consist of independent directors, (2) the requirement that we have a compensation committee that is composed entirely of independent directors and (3) the requirement that our director nominations be made, or recommended to our full board of directors, by our independent directors or by a nominations committee that consists entirely of independent directors. We intend to utilize certain of these exemptions. As a result, we may not have a majority of independent directors, our nominations committee and compensation committee may not consist entirely of independent directors and such committees will not be subject to annual performance evaluations. Accordingly, you may not have the same protections afforded to shareholders of companies that are subject to all of the corporate governance requirements of Nasdaq. In the event that we cease to be a “controlled company,” we will be required to comply with these provisions within the transition periods specified in the Nasdaq corporate governance rules.
Item 14. Principal Accountant Fees and Services.
Audit and Non-Audit Fees
The accounting firm of PwC served as independent auditors of the Company for the years ended January 3, 2021 and December 29, 2019. In addition to rendering audit services during those two years, PwC performed various non-audit services for the Company worldwide. The following table presents fees for professional services rendered by PwC for the audit of our financial statements for the fiscal years ended January 3, 2021 and December 29, 2019 and fees billed for other services rendered by PwC during those periods:
105
The aggregate fees, including expenses, of PwC for the fiscal years ended January 3, 2021 and December 29, 2019 are as follows:
|
|
|
January 3, 2021 |
|
|
December 29, 2019 |
|
||
|
Fee category: |
|
|
|
|
|
|
|
|
|
Audit fees(1) |
|
$ |
8,694,900 |
|
|
$ |
4,537,400 |
|
|
Audit-related fees(2) |
|
|
325,000 |
|
|
|
130,000 |
|
|
Tax fees(3) |
|
|
2,306,700 |
|
|
|
1,035,000 |
|
|
All other fees(4) |
|
|
50,000 |
|
|
|
12,000 |
|
|
Total fees |
|
$ |
11,376,600 |
|
|
$ |
5,714,400 |
|
|
|
(1) |
Audit fees includes the aggregate fees recognized in each of the last two fiscal years for professional services rendered by PwC for (1) the reviews and audits of our quarterly and annual financial statements, respectively, (2) statutory audit services, (3) consultation on accounting and reporting matters related to the audits. During the fiscal year ended January 3, 2021, audit fees also includes fees associated with our IPO. |
|
|
(2) |
Audit-related fees includes the aggregate fees recognized in each of the last two fiscal years for professional services rendered by PwC related to the audit and review of our quarterly and annual financial statements not included in “Audit fees” above. These fees primarily consist of fees related to adopting new accounting standards and other financial reporting matters. |
|
|
(3) |
Tax fees includes the aggregate fees recognized in each of the last two fiscal years for professional services rendered by PwC for tax compliance, tax advice and/or planning. |
|
|
(4) |
All other fees consist of fees billed for all other services provided by PwC other than those reported above. |
Audit Committee Pre-Approval Policies and Procedures
The Audit Committee has adopted policies and procedures that require the pre-approval of audit, audit-related and permissible non-audit services provided by PwC. During fiscal years 2020 and 2019, all audit, audit-related and permissible non-audit services provided by PwC were pre-approved by the Audit Committee. The Audit Committee has considered the provision of these services by PwC and has determined that the services are compatible with PwC maintaining its independence.
106
Item 15. Exhibits and Financial Statement Schedules.
|
(1) |
For a list of the financial statements included herein, see Index to the Consolidated Financial Statements on page F-1 of this Annual Report on Form 10-K, incorporated into this Item by reference. |
|
(2) |
Financial statement schedules have been omitted because they are either not required or not applicable or the information is included in the consolidated financial statements or the notes thereto. |
|
(3) |
Exhibits required by Item 601 of Regulation S-K. The exhibits listed in the accompanying Exhibit Index are filed or furnished as a part of this Annual Report on Form 10-K and are incorporated herein by reference. |
|
|
|
|
|
Exhibit Number |
|
Description |
Form |
File No. |
Exhibit |
Filing Date |
||
|
|
|
|
|
|
|
|
||
|
3.1 |
|
Articles of Association of Ortho Clinical Diagnostics Holdings plc |
8-K |
001-39956 |
3.1 |
February 4, 2021 |
||
|
|
|
|
|
|
|
|
||
|
4.1 |
|
S-1 |
333-251875 |
4.1 |
January 4, 2021 |
|||
|
|
|
|
|
|
|
|
||
|
4.2 |
|
S-1 |
333-251875 |
4.2 |
January 4, 2021 |
|||
|
|
|
|
|
|
|
|
||
|
4.3 |
|
S-1/A |
333-251875 |
4.3 |
January 19, 2021 |
|||
|
|
|
|
|
|
|
|
||
|
4.4 |
|
Description of Ortho Clinical Diagnostics Holdings plc’s Securities |
|
|
|
Filed Herewith |
||
|
|
|
|
|
|
|
|
||
|
10.1 |
|
Amended and Restated Consulting Services Agreement, dated as of October 15, 2020 |
S-1 |
333-251875 |
10.1 |
January 4, 2021 |
||
|
|
|
|
|
|
|
|
||
|
10.2 |
|
— |
— |
— |
Filed Herewith |
|||
|
|
|
|
|
|
|
|
||
|
10.3^ |
|
— |
— |
— |
Filed Herewith |
|||
|
|
|
|
|
|
|
|
||
|
10.4 |
|
S-1 |
333-251875 |
10.4 |
January 4, 2021 |
|||
|
|
|
|
|
|
|
|
||
|
10.5 |
|
S-1 |
333-251875 |
10.5 |
January 4, 2021 |
|||
|
|
|
|
|
|
|
|
||
|
10.6 |
|
S-1 |
333-251875 |
10.6 |
January 4, 2021 |
|||
|
|
|
|
|
|
|
|
||
107
|
|
S-1 |
333-251875 |
10.7 |
January 4, 2021 |
||||
|
|
|
|
|
|
|
|
||
|
10.8 |
|
S-1 |
333-251875 |
10.8 |
January 4, 2021 |
|||
|
|
|
|
|
|
|
|
||
|
10.9 |
|
8-K |
333-39956 |
10.1 |
February 9, 2021 |
|||
|
|
|
|
|
|
|
|
||
|
10.9* |
|
Ortho-Clinical Diagnostics Bermuda Co. Ltd. 2014 Equity Incentive Plan |
S-1 |
333-251875 |
10.9 |
January 4, 2021 |
||
|
|
|
|
|
|
|
|
||
|
10.10* |
|
S-1 |
333-251875 |
10.10 |
January 4, 2021 |
|||
|
|
|
|
|
|
|
|
||
|
10.11* |
|
S-1 |
333-251875 |
10.11 |
January 4, 2021 |
|||
|
|
|
|
|
|
|
|
||
|
10.12* |
|
S-1 |
333-251875 |
10.12 |
January 4, 2021 |
|||
|
|
|
|
|
|
|
|
||
|
10.13* |
|
S-1 |
333-251875 |
10.13 |
January 4, 2021 |
|||
|
|
|
|
|
|
|
|
||
|
10.14* |
|
S-1 |
333-251875 |
10.14 |
January 4, 2021 |
|||
|
|
|
|
|
|
|
|
||
|
10.15* |
|
S-1 |
333-251875 |
10.15 |
January 4, 2021 |
|||
|
|
|
|
|
|
|
|
||
|
10.16* |
|
Ortho Clinical Diagnostics Holdings plc 2021 Incentive Award Plan |
S-8 |
333-252749 |
10.1 |
February 9, 2021 |
||
|
|
|
|
|
|
|
|
||
|
10.17* |
|
S-1 |
333-251875 |
10.17 |
January 19, 2021 |
|||
|
|
|
|
|
|
|
|
||
|
10.18* |
|
S-1 |
333-251875 |
10.18 |
January 4, 2021 |
|||
|
|
|
|
|
|
|
|
||
|
10.19* |
|
S-1 |
333-251875 |
10.19 |
January 4, 2021 |
|||
|
|
|
|
|
|
|
|
||
|
10.20* |
|
S-1 |
333-251875 |
10.20 |
January 4, 2021 |
|||
108
|
|
|
|
|
|
|
|
||
|
10.21* |
|
S-1 |
333-251875 |
10.21 |
January 4, 2021 |
|||
|
|
|
|
|
|
|
|
||
|
10.22* |
|
Enhanced Minimum Severance Letter from Ortho-Clinical Diagnostics, Inc. to Chockalingam Palaniappan |
S-1 |
333-251875 |
10.22 |
January 4, 2021 |
||
|
|
|
|
|
|
|
|
||
|
10.23* |
|
S-1 |
333-251875 |
10.23 |
January 4, 2021 |
|||
|
|
|
|
|
|
|
|
||
|
10.24* |
|
S-1 |
333-251875 |
10.24 |
January 4, 2021 |
|||
|
|
|
|
|
|
|
|
||
|
10.25* |
|
S-1 |
333-251875 |
10.25 |
January 4, 2021 |
|||
|
|
|
|
|
|
|
|
||
|
10.26* |
|
Form of Director and Officer Deed of Indemnity of Ortho Clinical Diagnostics Holdings plc |
S-1 |
333-251875 |
10.26 |
January 4, 2021 |
||
|
|
|
|
|
|
|
|
||
|
10.27* |
|
Form of Director and Officer Indemnification Agreement of U.S. Crimson Acquisition Inc. |
S-1 |
333-251875 |
10.27 |
January 4, 2021 |
||
|
|
|
|
|
|
|
|
||
|
21.1 |
|
S-1 |
333-251875 |
21.1 |
January 19, 2021 |
|||
|
|
|
|
|
|
|
|
||
|
23.1 |
|
— |
— |
— |
Filed Herewith |
|||
|
|
|
|
|
|
|
|
||
|
31.1 |
|
— |
— |
— |
Filed Herewith |
|||
|
|
|
|
|
|
|
|
||
|
31.2 |
|
— |
— |
— |
Filed Herewith |
|||
|
|
|
|
|
|
|
|
||
|
32.1† |
|
— |
— |
— |
Furnished Herewith |
|||
|
|
|
|
|
|
|
|
||
|
32.2† |
|
— |
— |
— |
Furnished Herewith |
|||
|
|
|
|
|
|
|
|
||
|
* |
Denotes management contract or compensatory plan or arrangement. |
†Furnished herewith. The certifications attached as Exhibit 32.1 and 32.2 that accompany this Annual Report on Form 10-K are deemed furnished and not filed with the Securities and Exchange Commission and are not to be incorporated by reference into any filing of Ortho Clinical Diagnostics Holdings plc under the Securities Act of 1933, as amended, or the Securities Exchange Act of 1934, as amended, whether made before or after the date of this Annual Report on Form 10-K, irrespective of any general incorporation language contained in such filing.
^Certain portions of this exhibit (indicated by “[***]”) have been omitted pursuant to Item 601(a)(6) of Regulation S-K.
None.
109
Pursuant to the requirements of Section 13 or 15(d) of the Securities Exchange Act of 1934, as amended, the Registrant has duly caused this Report to be signed on its behalf by the undersigned, thereunto duly authorized.
|
|
|
Company Name |
|
|
|
|
|
|
|
Date: March 18, 2021 |
|
By: |
/s/ Chris Smith |
|
|
|
|
Chris Smith |
|
|
|
|
Chairman and Chief Executive Officer |
Pursuant to the requirements of the Securities Exchange Act of 1934, as amended, this Report has been signed below by the following persons on behalf of the Registrant in the capacities indicated on March 18, 2021.
110
Index to consolidated financial statements
|
Ortho Clinical Diagnostics Holdings plc (formerly known as Ortho-Clinical Diagnostics Bermuda Co. Ltd.).—Audited Consolidated Financial Statements: |
|
|
|
|
|
F-2 |
|
|
|
|
|
F-4 |
|
|
|
|
|
F-5 |
|
|
|
|
|
Consolidated balance sheets as of January 3, 2021 and December 29, 2019 |
F-6 |
|
|
|
|
F-7 |
|
|
|
|
|
F-8 |
|
|
|
|
|
F-9 |
F-1
Report of Independent Registered Public Accounting Firm
To the Board of Directors and Stockholders of Ortho Clinical Diagnostics Holdings plc
Opinion on the Financial Statements
We have audited the accompanying consolidated balance sheets of Ortho Clinical Diagnostics Holdings plc (formerly known as Ortho-Clinical Diagnostics Bermuda Co. Ltd.) and its subsidiaries (the “Company”) as of January 3, 2021 and December 29, 2019, and the related consolidated statements of operations, comprehensive loss, changes in stockholders’ deficit and cash flows for each of the three years in the period ended January 3, 2021, including the related notes (collectively referred to as the “consolidated financial statements”). In our opinion, the consolidated financial statements present fairly, in all material respects, the financial position of the Company as of January 3, 2021 and December 29, 2019, and the results of its operations and its cash flows for each of the three years in the period ended January 3, 2021 in conformity with accounting principles generally accepted in the United States of America.
Changes in accounting principles
As discussed in Note 3 to the consolidated financial statements, the Company changed the manner in which it accounts for leases in 2019 and the manner in which it accounts for revenues from contracts with customers in 2018.
Basis for Opinion
These consolidated financial statements are the responsibility of the Company’s management. Our responsibility is to express an opinion on the Company’s consolidated financial statements based on our audits. We are a public accounting firm registered with the Public Company Accounting Oversight Board (United States) (PCAOB) and are required to be independent with respect to the Company in accordance with the U.S. federal securities laws and the applicable rules and regulations of the Securities and Exchange Commission and the PCAOB.
We conducted our audits of these consolidated financial statements in accordance with the standards of the PCAOB. Those standards require that we plan and perform the audit to obtain reasonable assurance about whether the consolidated financial statements are free of material misstatement, whether due to error or fraud.
Our audits included performing procedures to assess the risks of material misstatement of the consolidated financial statements, whether due to error or fraud, and performing procedures that respond to those risks. Such procedures included examining, on a test basis, evidence regarding the amounts and disclosures in the consolidated financial statements. Our audits also included evaluating the accounting principles used and significant estimates made by management, as well as evaluating the overall presentation of the consolidated financial statements. We believe that our audits provide a reasonable basis for our opinion.
Critical Audit Matters
The critical audit matter communicated below is a matter arising from the current period audit of the consolidated financial statements that was communicated or required to be communicated to the audit committee and that (i) relates to accounts or disclosures that are material to the consolidated financial statements and (ii) involved our especially challenging, subjective, or complex judgments. The communication of critical audit matters does not alter in any way our opinion on the consolidated financial statements, taken as a whole, and we are not, by communicating the critical audit matter below, providing a separate opinion on the critical audit matter or on the accounts or disclosures to which it relates.
Interim Goodwill Impairment Assessment
As described in Notes 3 and 7 to the consolidated financial statements, the Company’s goodwill balance was $580.1 million as of January 3, 2021. Management assesses goodwill for impairment at the reporting unit level on an annual basis in the Company’s fiscal fourth quarter and whenever events or changes in circumstances occur that indicate that the fair value of a reporting unit is below its carrying amount. As of December 30, 2019, the beginning of fiscal year 2020, management changed the financial information that was regularly reviewed by the Chief Operating Decision Maker (“CODM”) to measure performance and allocate resources. This resulted in a change to the Company’s operating segments and reporting units. Goodwill was allocated to the newly identified reporting units and management performed impairment assessments on the new reporting units following the change. Management estimates the fair value of its reporting units by using forecasts of discounted future cash flows and peer market multiples. Estimates of discounted future cash flows for each reporting unit require assumptions related to assumed revenue growth rates, long term growth rates and discount rates. Management also considers revenue and earnings trading multiples of the peer companies that have similar financial characteristics to the reporting units.
F-2
The principal considerations for our determination that performing procedures relating to the interim goodwill impairment assessment is a critical audit matter are (i) the significant judgment by management when developing the fair value measurement of the reporting units, (ii) a high degree of auditor judgment, subjectivity, and effort in performing procedures and evaluating management’s significant assumptions related to the assumed revenue growth rates, long term growth rates, and discount rates, and the revenue and earnings trading multiples of the peer companies; and (iii) the audit effort involved the use of professionals with specialized skill and knowledge.
Addressing the matter involved performing procedures and evaluating audit evidence in connection with forming our overall opinion on the consolidated financial statements. These procedures included, among others: (i) testing management’s process for developing the fair value measurement of the reporting units; (ii) evaluating the appropriateness of the discounted future cash flows and peer market multiples approaches; (iii) testing the completeness and accuracy of underlying data used in the approaches; (iv) evaluating the significant assumptions used by management related to the assumed revenue growth rates, long term growth rates, and the discount rates and the revenue and earnings trading multiples of the peer companies. Evaluating management’s assumptions related to the assumed revenue growth rates involved evaluating whether the assumptions used by management were reasonable considering: (i) the current and past performance of the reporting units; (ii) the consistency with external market and industry data; and (iii) whether the assumptions were consistent with evidence obtained in other areas of the audit. Professionals with specialized skill and knowledge were used to assist in the evaluation of the Company’s discounted future cash flows and peer market multiples approaches, and the long term growth rates and discount rates.
/s/PricewaterhouseCoopers LLP
Boston, Massachusetts
March 18, 2021
We have served as the Company's auditor since 2013.
F-3
Ortho Clinical Diagnostics Holdings plc (formerly known as Ortho-Clinical Diagnostics Bermuda Co. Ltd.)
Consolidated statements of operations
(In millions, except per share data)
|
|
|
Fiscal year ended |
|
|||||||||
|
|
|
January 3, 2021 |
|
|
December 29, 2019 |
|
|
December 30, 2018 |
|
|||
|
Net revenue |
|
$ |
1,766.2 |
|
|
$ |
1,801.5 |
|
|
$ |
1,787.3 |
|
|
Cost of revenue, excluding amortization of intangible assets |
|
|
908.2 |
|
|
|
922.4 |
|
|
|
930.5 |
|
|
Gross profit |
|
|
858.0 |
|
|
|
879.1 |
|
|
|
856.8 |
|
|
Selling, marketing and administrative expenses |
|
|
489.6 |
|
|
|
515.1 |
|
|
|
491.6 |
|
|
Research and development expense |
|
|
112.9 |
|
|
|
98.0 |
|
|
|
98.7 |
|
|
Amortization of intangible assets |
|
|
131.9 |
|
|
|
131.7 |
|
|
|
128.8 |
|
|
Other operating expense, net |
|
|
35.3 |
|
|
|
48.8 |
|
|
|
71.2 |
|
|
Income from operations |
|
|
88.3 |
|
|
|
85.5 |
|
|
|
66.5 |
|
|
Interest expense, net |
|
|
198.2 |
|
|
|
231.4 |
|
|
|
235.6 |
|
|
Tax indemnification expense (income) |
|
|
31.2 |
|
|
|
29.2 |
|
|
|
(13.1 |
) |
|
Other expense, net |
|
|
84.2 |
|
|
|
5.7 |
|
|
|
61.6 |
|
|
Loss before (benefit from) provision for income taxes |
|
|
(225.3 |
) |
|
|
(180.8 |
) |
|
|
(217.6 |
) |
|
(Benefit from) provision for income taxes |
|
|
(13.4 |
) |
|
|
(23.9 |
) |
|
|
31.2 |
|
|
Net loss |
|
$ |
(211.9 |
) |
|
$ |
(156.9 |
) |
|
$ |
(248.8 |
) |
|
Basic and diluted net loss per common share |
|
$ |
(1.45 |
) |
|
$ |
(1.08 |
) |
|
$ |
(1.72 |
) |
|
Basic and diluted weighted-average common shares outstanding |
|
|
146.3 |
|
|
|
145.5 |
|
|
|
145.1 |
|
The accompanying notes are an integral part of these consolidated financial statements.
F-4
Ortho Clinical Diagnostics Holdings plc (formerly known as Ortho-Clinical Diagnostics Bermuda Co. Ltd.)
Consolidated statements of comprehensive loss
(In millions)
|
|
|
Fiscal year ended |
|
|||||||||
|
|
|
January 3, 2021 |
|
|
December 29, 2019 |
|
|
December 30, 2018 |
|
|||
|
Net loss |
|
$ |
(211.9 |
) |
|
$ |
(156.9 |
) |
|
$ |
(248.8 |
) |
|
Other comprehensive income (loss), before tax: |
|
|
|
|
|
|
|
|
|
|
|
|
|
Foreign currency translation adjustments |
|
|
59.4 |
|
|
|
(0.9 |
) |
|
|
(21.2 |
) |
|
Foreign currency derivatives |
|
|
(7.6 |
) |
|
|
2.1 |
|
|
|
2.6 |
|
|
Interest rate derivatives |
|
|
(48.1 |
) |
|
|
(17.6 |
) |
|
|
4.1 |
|
|
Pension and other postemployment benefits |
|
|
(0.2 |
) |
|
|
(3.3 |
) |
|
|
7.7 |
|
|
Other comprehensive income (loss), before tax |
|
|
3.5 |
|
|
|
(19.7 |
) |
|
|
(6.8 |
) |
|
Income tax benefit related to items of other comprehensive income (loss) |
|
|
— |
|
|
|
— |
|
|
|
0.1 |
|
|
Other comprehensive income (loss), net of tax |
|
|
3.5 |
|
|
|
(19.7 |
) |
|
|
(6.7 |
) |
|
Comprehensive loss |
|
$ |
(208.4 |
) |
|
$ |
(176.6 |
) |
|
$ |
(255.5 |
) |
The accompanying notes are an integral part of these consolidated financial statements.
F-5
Ortho Clinical Diagnostics Holdings plc (formerly known as Ortho-Clinical Diagnostics Bermuda Co. Ltd.)
(In millions, except share and per share data)
|
|
|
January 3, 2021 |
|
|
December 29, 2019 |
|
||
|
Assets |
|
|
|
|
|
|
|
|
|
Current assets: |
|
|
|
|
|
|
|
|
|
Cash and cash equivalents |
|
$ |
132.8 |
|
|
$ |
72.0 |
|
|
Accounts receivable (net of allowance for doubtful accounts of $9.8 and $7.5, respectively) |
|
|
318.7 |
|
|
|
348.5 |
|
|
Inventories |
|
|
278.7 |
|
|
|
253.9 |
|
|
Other current assets |
|
|
127.0 |
|
|
|
147.0 |
|
|
Total current assets |
|
|
857.2 |
|
|
|
821.4 |
|
|
Property, plant and equipment, net |
|
|
832.0 |
|
|
|
848.2 |
|
|
Goodwill |
|
|
580.1 |
|
|
|
567.3 |
|
|
Intangible assets, net |
|
|
1,016.7 |
|
|
|
1,134.5 |
|
|
Deferred income taxes |
|
|
8.0 |
|
|
|
6.1 |
|
|
Other assets |
|
|
107.5 |
|
|
|
211.7 |
|
|
Total assets |
|
$ |
3,401.5 |
|
|
$ |
3,589.2 |
|
|
Liabilities and Stockholders’ Deficit |
|
|
|
|
|
|
|
|
|
Current liabilities: |
|
|
|
|
|
|
|
|
|
Accounts payable |
|
$ |
146.2 |
|
|
$ |
198.4 |
|
|
Accrued liabilities |
|
|
284.7 |
|
|
|
291.3 |
|
|
Deferred revenue |
|
|
35.5 |
|
|
|
36.3 |
|
|
Current portion of borrowings |
|
|
160.0 |
|
|
|
156.7 |
|
|
Total current liabilities |
|
|
626.4 |
|
|
|
682.7 |
|
|
Long-term borrowings |
|
|
3,558.5 |
|
|
|
3,442.4 |
|
|
Employee-related obligations |
|
|
39.3 |
|
|
|
36.9 |
|
|
Other liabilities |
|
|
120.8 |
|
|
|
175.0 |
|
|
Deferred income taxes |
|
|
67.3 |
|
|
|
65.0 |
|
|
Total liabilities |
|
|
4,412.3 |
|
|
|
4,402.0 |
|
|
Commitments and contingencies (Note 21) |
|
|
|
|
|
|
|
|
|
Stockholders’ Deficit: |
|
|
|
|
|
|
|
|
|
Common stock, $0.00001 par, 1,000,000,000 shares authorized, 147,295,511 and 146,437,574 shares issued and outstanding as of January 3, 2021 and December 29, 2019, respectively |
|
|
— |
|
|
|
— |
|
|
Additional paid-in capital |
|
|
975.1 |
|
|
|
964.7 |
|
|
Accumulated deficit |
|
|
(1,917.5 |
) |
|
|
(1,705.6 |
) |
|
Accumulated other comprehensive loss |
|
|
(68.4 |
) |
|
|
(71.9 |
) |
|
Total stockholders’ deficit |
|
|
(1,010.8 |
) |
|
|
(812.8 |
) |
|
Total liabilities and stockholders’ deficit |
|
$ |
3,401.5 |
|
|
$ |
3,589.2 |
|
The accompanying notes are an integral part of the consolidated financial statements.
F-6
Ortho Clinical Diagnostics Holdings plc (formerly known as Ortho-Clinical Diagnostics Bermuda Co. Ltd.)
Consolidated statements of changes in stockholders’ deficit
(In millions)
|
|
|
Common stock shares issued |
|
|
Common stock par value |
|
|
Additional paid-in capital |
|
|
Accumulated deficit |
|
|
Accumulated other comprehensive loss |
|
|
Total |
|
||||||
|
Balance as of December 31, 2017 |
|
|
145,045,203 |
|
|
$ |
— |
|
|
$ |
940.8 |
|
|
$ |
(1,312.0 |
) |
|
$ |
(45.5 |
) |
|
$ |
(416.7 |
) |
|
Net loss |
|
|
— |
|
|
|
— |
|
|
|
— |
|
|
|
(248.8 |
) |
|
|
— |
|
|
|
(248.8 |
) |
|
Exercise of stock options, net of shares retained for taxes |
|
|
148,886 |
|
|
|
— |
|
|
|
0.2 |
|
|
|
— |
|
|
|
— |
|
|
|
0.2 |
|
|
Restricted stock grant, net of shares retained for taxes |
|
|
21,740 |
|
|
|
— |
|
|
|
— |
|
|
|
— |
|
|
|
— |
|
|
|
— |
|
|
Share repurchases |
|
|
(42,340 |
) |
|
|
— |
|
|
|
(0.5 |
) |
|
|
— |
|
|
|
— |
|
|
|
(0.5 |
) |
|
Recognition of stock-based compensation |
|
|
— |
|
|
|
— |
|
|
|
5.9 |
|
|
|
— |
|
|
|
— |
|
|
|
5.9 |
|
|
Impact from adoption of ASC 606 |
|
|
— |
|
|
|
— |
|
|
|
— |
|
|
|
11.9 |
|
|
|
— |
|
|
|
11.9 |
|
|
Pension and other postemployment benefits, net of tax of $0.1 |
|
|
— |
|
|
|
— |
|
|
|
— |
|
|
|
— |
|
|
|
7.8 |
|
|
|
7.8 |
|
|
Foreign currency derivatives, net of tax of $0.0 |
|
|
— |
|
|
|
— |
|
|
|
— |
|
|
|
— |
|
|
|
2.6 |
|
|
|
2.6 |
|
|
Interest rate derivatives, net of tax of $0.0 |
|
|
— |
|
|
|
— |
|
|
|
— |
|
|
|
— |
|
|
|
4.1 |
|
|
|
4.1 |
|
|
Foreign currency translation adjustments |
|
|
— |
|
|
|
— |
|
|
|
— |
|
|
|
— |
|
|
|
(21.2 |
) |
|
|
(21.2 |
) |
|
Balance as of December 30, 2018 |
|
|
145,173,489 |
|
|
$ |
— |
|
|
$ |
946.4 |
|
|
$ |
(1,548.9 |
) |
|
$ |
(52.2 |
) |
|
$ |
(654.7 |
) |
|
Net loss |
|
|
— |
|
|
|
— |
|
|
|
— |
|
|
|
(156.9 |
) |
|
|
— |
|
|
|
(156.9 |
) |
|
Exercise of stock options, net of shares retained for taxes |
|
|
952,161 |
|
|
|
— |
|
|
|
— |
|
|
|
— |
|
|
|
— |
|
|
|
— |
|
|
Restricted stock grant, net of shares retained for taxes |
|
|
342,895 |
|
|
|
— |
|
|
|
— |
|
|
|
— |
|
|
|
— |
|
|
|
— |
|
|
Share repurchases |
|
|
(30,971 |
) |
|
|
— |
|
|
|
(0.3 |
) |
|
|
— |
|
|
|
— |
|
|
|
(0.3 |
) |
|
Recognition of stock-based compensation |
|
|
— |
|
|
|
— |
|
|
|
18.6 |
|
|
|
— |
|
|
|
— |
|
|
|
18.6 |
|
|
Impact from adoption of ASU 2017-12 |
|
|
— |
|
|
|
— |
|
|
|
— |
|
|
|
0.2 |
|
|
|
(0.2 |
) |
|
|
— |
|
|
Pension and other postemployment benefits, net of tax of $0.0 |
|
|
— |
|
|
|
— |
|
|
|
— |
|
|
|
— |
|
|
|
(3.3 |
) |
|
|
(3.3 |
) |
|
Foreign currency derivatives, net of tax of $0.0 |
|
|
— |
|
|
|
— |
|
|
|
— |
|
|
|
— |
|
|
|
2.1 |
|
|
|
2.1 |
|
|
Interest rate derivatives, net of tax of $0.0 |
|
|
— |
|
|
|
— |
|
|
|
— |
|
|
|
— |
|
|
|
(17.4 |
) |
|
|
(17.4 |
) |
|
Foreign currency translation adjustments |
|
|
— |
|
|
|
— |
|
|
|
— |
|
|
|
— |
|
|
|
(0.9 |
) |
|
|
(0.9 |
) |
|
Balance as of December 29, 2019 |
|
|
146,437,574 |
|
|
$ |
— |
|
|
$ |
964.7 |
|
|
$ |
(1,705.6 |
) |
|
$ |
(71.9 |
) |
|
$ |
(812.8 |
) |
|
Net loss |
|
|
— |
|
|
|
— |
|
|
|
— |
|
|
|
(211.9 |
) |
|
|
— |
|
|
|
(211.9 |
) |
|
Exercise of stock options, net of shares retained for taxes |
|
|
486,629 |
|
|
|
— |
|
|
|
1.8 |
|
|
|
— |
|
|
|
— |
|
|
|
1.8 |
|
|
Restricted stock grant, net of shares retained for taxes |
|
|
371,308 |
|
|
|
— |
|
|
|
— |
|
|
|
— |
|
|
|
— |
|
|
|
— |
|
|
Recognition of stock-based compensation |
|
|
— |
|
|
|
— |
|
|
|
8.6 |
|
|
|
— |
|
|
|
— |
|
|
|
8.6 |
|
|
Pension and other postemployment benefits, net of tax of $0.0 |
|
|
— |
|
|
|
— |
|
|
|
— |
|
|
|
— |
|
|
|
(0.2 |
) |
|
|
(0.2 |
) |
|
Foreign currency derivatives, net of tax of $0.0 |
|
|
— |
|
|
|
— |
|
|
|
— |
|
|
|
— |
|
|
|
(7.6 |
) |
|
|
(7.6 |
) |
|
Interest rate derivatives, net of tax of $0.0 |
|
|
— |
|
|
|
— |
|
|
|
— |
|
|
|
— |
|
|
|
(48.1 |
) |
|
|
(48.1 |
) |
|
Foreign currency translation adjustments |
|
|
— |
|
|
|
— |
|
|
|
— |
|
|
|
— |
|
|
|
59.4 |
|
|
|
59.4 |
|
|
Balance as of January 3, 2021 |
|
|
147,295,511 |
|
|
$ |
— |
|
|
$ |
975.1 |
|
|
$ |
(1,917.5 |
) |
|
$ |
(68.4 |
) |
|
$ |
(1,010.8 |
) |
The accompanying notes are an integral part of these consolidated financial statements.
F-7
Ortho Clinical Diagnostics Holdings plc (formerly known as Ortho-Clinical Diagnostics Bermuda Co. Ltd.)
Consolidated statements of cash flows
(In millions)
|
|
|
Fiscal year ended |
|
|||||||||
|
|
|
January 3, 2021 |
|
|
December 29, 2019 |
|
|
December 30, 2018 |
|
|||
|
Cash Flows from Operating activities: |
|
|
|
|
|
|
|
|
|
|
|
|
|
Net loss |
|
$ |
(211.9 |
) |
|
$ |
(156.9 |
) |
|
$ |
(248.8 |
) |
|
Adjustments to reconcile net loss to cash provided by operating activities: |
|
|
|
|
|
|
|
|
|
|
|
|
|
Depreciation and amortization |
|
|
325.9 |
|
|
|
327.5 |
|
|
|
332.2 |
|
|
Unrealized and non-cash foreign exchange losses (gains), net |
|
|
68.2 |
|
|
|
(18.1 |
) |
|
|
43.3 |
|
|
Amortization of deferred financing costs and original issue discount |
|
|
10.9 |
|
|
|
12.4 |
|
|
|
14.9 |
|
|
Deferred tax benefit |
|
|
(2.5 |
) |
|
|
(4.4 |
) |
|
|
(4.7 |
) |
|
Stock based compensation |
|
|
8.6 |
|
|
|
18.6 |
|
|
|
5.9 |
|
|
Provision for doubtful accounts |
|
|
3.6 |
|
|
|
4.5 |
|
|
|
2.2 |
|
|
Loss on extinguishment of debt |
|
|
12.6 |
|
|
|
— |
|
|
|
2.1 |
|
|
Other non-cash, net |
|
|
(0.5 |
) |
|
|
15.9 |
|
|
|
7.3 |
|
|
Changes in operating assets and liabilities, net of effects of acquisitions: |
|
|
|
|
|
|
|
|
|
|
|
|
|
Accounts receivable |
|
|
33.3 |
|
|
|
(21.4 |
) |
|
|
18.0 |
|
|
Inventories |
|
|
(152.0 |
) |
|
|
(108.6 |
) |
|
|
(83.3 |
) |
|
Other current and non-current assets |
|
|
(19.5 |
) |
|
|
(27.2 |
) |
|
|
(18.7 |
) |
|
Accounts payable and accrued liabilities |
|
|
(36.0 |
) |
|
|
83.6 |
|
|
|
(22.4 |
) |
|
Deferred revenue |
|
|
(1.9 |
) |
|
|
7.3 |
|
|
|
1.8 |
|
|
Other current and non-current liabilities |
|
|
7.3 |
|
|
|
9.8 |
|
|
|
19.8 |
|
|
Cash provided by operating activities |
|
|
46.1 |
|
|
|
143.0 |
|
|
|
69.6 |
|
|
Cash Flows from Investing activities: |
|
|
|
|
|
|
|
|
|
|
|
|
|
Purchase of property, plant and equipment |
|
|
(44.1 |
) |
|
|
(66.2 |
) |
|
|
(79.2 |
) |
|
Acquisition of Ortho-Clinical Diagnostics (purchase price adjustment) |
|
|
— |
|
|
|
— |
|
|
|
(8.1 |
) |
|
Milestone payments and other |
|
|
(1.3 |
) |
|
|
(2.3 |
) |
|
|
0.2 |
|
|
Cash used in investing activities |
|
|
(45.4 |
) |
|
|
(68.5 |
) |
|
|
(87.1 |
) |
|
Cash Flows from Financing activities: |
|
|
|
|
|
|
|
|
|
|
|
|
|
Proceeds from long-term debt |
|
|
1,421.0 |
|
|
|
2.8 |
|
|
|
102.4 |
|
|
Payments on long-term debt |
|
|
(1,363.5 |
) |
|
|
(49.7 |
) |
|
|
(125.5 |
) |
|
(Payments) borrowings on short-term borrowings, net |
|
|
(3.5 |
) |
|
|
(17.2 |
) |
|
|
15.2 |
|
|
Proceeds from exercise of stock options |
|
|
1.8 |
|
|
|
— |
|
|
|
0.2 |
|
|
Repurchase of common stock |
|
|
— |
|
|
|
(0.3 |
) |
|
|
(0.5 |
) |
|
Cash provided by (used in) financing activities |
|
|
55.8 |
|
|
|
(64.4 |
) |
|
|
(8.2 |
) |
|
Effect of exchange rate changes on cash |
|
|
3.7 |
|
|
|
(0.7 |
) |
|
|
(4.3 |
) |
|
Increase (decrease) in cash, cash equivalents and restricted cash |
|
|
60.2 |
|
|
|
9.4 |
|
|
|
(30.0 |
) |
|
Cash, cash equivalents and restricted cash at beginning of year |
|
|
84.0 |
|
|
|
74.6 |
|
|
|
104.6 |
|
|
Cash, cash equivalents and restricted cash at end of year |
|
$ |
144.2 |
|
|
$ |
84.0 |
|
|
$ |
74.6 |
|
|
|
|
Fiscal year ended |
|
|||||||||
|
|
|
January 3, 2021 |
|
|
December 29, 2019 |
|
|
December 30, 2018 |
|
|||
|
Reconciliation to amounts within the consolidated balance sheets: |
|
|
|
|
|
|
|
|
|
|
|
|
|
Cash and cash equivalents |
|
$ |
132.8 |
|
|
$ |
72.0 |
|
|
$ |
56.4 |
|
|
Restricted cash included in Other assets |
|
|
11.4 |
|
|
|
12.0 |
|
|
|
18.2 |
|
|
Cash, cash equivalents and restricted cash |
|
$ |
144.2 |
|
|
$ |
84.0 |
|
|
$ |
74.6 |
|
The accompanying notes are an integral part of these consolidated financial statements
F-8
Ortho Clinical Diagnostics Holdings plc (formerly known as Ortho-Clinical Diagnostics Bermuda Co. Ltd.)
Notes to Consolidated Financial Statements
January 3, 2021
(Dollars in millions, unless otherwise stated)
Ortho Clinical Diagnostics Holdings plc. (“UK Holdco” or the “Company” and formerly known as Ortho-Clinical Diagnostics Bermuda Co. Ltd. Or “Bermuda Holdco”), is a public limited company incorporated under the laws of England and Wales and became the new holding company of Bermuda Holdco and its subsidiaries and upon incorporation, it had an initial share capital of one ordinary share and 50,000 preferred redeemable shares (“Incorporation Shares”) and it had no subsidiaries or operations. On January 25, 2021, Carlyle and all other shareholders of Bermuda Holdco contributed all of their outstanding equity interests in Bermuda Holdco to UK Holdco in exchange for ordinary shares of UK Holdco on a 1-for-1 basis (the “Reorganization Transactions”).
UK Holdco is a holding company with no business operations or assets other than cash, intercompany receivables, guarantees of certain obligations of Ortho-Clinical Diagnostics, Inc. (“Ortho U.S.”) and 100% of its ownership interest of Ortho-Clinical Diagnostics Holdings Luxembourg S.à r.l., which itself is a holding company with no operations or assets other than cash, intercompany receivables, miscellaneous administrative costs and its ownership of 100% of the capital stock of Ortho-Clinical Diagnostics S.A. (“LuxCo”). LuxCo, together with its indirect wholly owned subsidiary, Ortho U.S., are co-borrowers under the Senior Secured Credit Facilities and co-issuers of the Notes (each as defined below). The Company’s global operations are conducted by indirect wholly owned subsidiaries.
The Company is a leading global provider of in-vitro diagnostics solutions to the clinical laboratory and transfusion medicine communities. The Company maintains a commercial presence in more than 130 countries and territories. The Company’s instruments, assays, reagents and other consumables are used in hospitals, laboratories, clinics, blood banks and donor centers worldwide. The Company is globally operated with manufacturing facilities in the United States and the United Kingdom and sales centers, administrative offices and warehouses located throughout the world.
During the fiscal year ended January 3, 2021, the Company’s domestic and international operations were affected by the ongoing global pandemic of a novel strain of coronavirus (“COVID-19”) and the resulting volatility and uncertainty it has caused in the U.S. and international markets. In March 2020, the World Health Organization declared COVID-19 a pandemic and recommended containment and mitigation measures worldwide. On March 13, 2020, former President Trump announced a National Emergency relating to the disease. The COVID-19 pandemic has caused significant volatility and uncertainty in the U.S. and international markets, which could result in a prolonged economic downturn that has disrupted and is expected to continue to disrupt the Company’s business. The Company has a direct commercial presence in more than 30 countries, including many of the regions most impacted by the COVID-19 pandemic.
As a result of the COVID-19 pandemic, the Company experienced decreased demand from customers for certain of its products during the fiscal year ended January 3, 2021, with the most prominent effect during the fiscal second quarter of 2020. During the fiscal third quarter and fiscal fourth quarter of the fiscal year ended January 3, 2021, the Company experienced an increase in volumes compared to the fiscal second quarter, however the Company’s net revenue was negatively impacted by the COVID-19 pandemic for the full fiscal year, as net revenue decreased from $1,805.1 million for the fiscal year ended December 29, 2019 to $1,766.2 for the fiscal year ended January 3, 2021. The extent of the negative impact on revenues is uncertain and will depend on the length and extent of the pandemic, its consequences, and containment measures. Any prolonged material disruption of the Company’s employees, suppliers, manufacturing, or customers could materially impact its consolidated financial position, results of operations or cash flows.
The accompanying consolidated financial statements have been prepared on a basis which assumes that the Company will continue as a going concern and contemplates the realization of assets and satisfaction of liabilities and commitments in the normal course of business. As shown in the consolidated financial statements, at January 3, 2021, the Company has total cash and cash equivalents balance of $132.8 million and an accumulated deficit of $1,917.5 million. The Company has incurred losses since the acquisition from Johnson & Johnson and reported a net loss of $211.9 million, while generating $46.1 million of cash from operations during the fiscal year ended January 3, 2021. The Company’s primary cash needs will be to meet debt service requirements, working capital needs and capital expenditures. Management is required to evaluate whether there are conditions and events that raise substantial doubt about the entity’s ability to continue as a going concern for at least one year from the date the financial statements are issued and, if so, disclose that fact.
F-9
Ortho Clinical Diagnostics Holdings plc (formerly known as Ortho-Clinical Diagnostics Bermuda Co. Ltd.)
Notes to Consolidated Financial Statements
January 3, 2021
(Dollars in millions, unless otherwise stated)
The Company’s debt agreements contain various covenants that may restrict the Company’s ability to borrow on available credit facilities and future financing arrangements and require the Company to remain below a specific credit coverage threshold. The Company’s credit agreement has a financial covenant (First Lien Net Leverage Ratio (as defined in the credit agreement) not to exceed 6-to-1, subject to two 50 basis point step-downs on June 30, 2021 and September 30, 2022) that is tested when borrowings under the Revolving Credit Facility exceed 30% of the committed amount at any period end reporting date. As of January 3, 2021, the Company had no outstanding borrowings under its Revolving Credit Facility. The Company believes that it has complied and will continue to comply with the financial covenant for the next 12 months. In the event the Company does not comply with the financial covenant of the Revolving Credit Facility, the lenders will have the right to call on all of the borrowings under the revolving facility. If the lenders on the revolving facility terminate their commitments and accelerate the loans, this would become a cross default to other material indebtedness.
Subsequent to the end of the fiscal year ended January 3, 2021, the Company completed its initial public offering (“IPO”) of ordinary shares at a price of $17.00 per share. The Company issued and sold 87,400,000 ordinary shares in the IPO, including 11,400,000 ordinary shares issued pursuant to the full exercise of the underwriters option to purchase additional shares. The ordinary shares sold in the IPO were registered under the Securities Act pursuant to a Registration Statement on Form S-1 (the “IPO Registration Statement”), which was declared effective by the SEC on January 29, 2021. The offering generated net proceeds of $1,426.4 million after deducting underwriting discounts and commissions and estimated offering expenses.
The Company used a portion of the net proceeds from the IPO (i) to redeem $160 million of its 2025 Notes, plus accrued interest thereon and $11.8 million of redemption premium, (ii) to redeem $270 million of its 2028 Notes, plus accrued interest thereon and $19.6 million of redemption premium, (iii) to repay $892.7 million in aggregate principal amount of borrowings under its Dollar Term Loan Facility and (iv) for working capital and general corporate purposes.
Given the expected impact of the COVID-19 pandemic and economic slowdown on its business the Company evaluated its liquidity position and ability to comply with financial covenants in its Revolving Credit Facility as of the date of the issuance of these consolidated financial statements. Based on this evaluation, management believes, despite the expected impact of COVID-19 on the Company’s business, that the Company’s financial position, net cash provided by operations combined with cash and cash equivalents, and borrowing availability under its Revolving Credit Facility, will be sufficient to fund its current obligations, capital spending, debt service requirements and working capital requirements over at least the next twelve months from the issuance of these consolidated financial statements. Should it become necessary, the Company may seek to raise additional capital within the next 12 months through borrowings on credit facilities, other financing activities and/or the sale of equity securities. The Company may also need to control discretionary spending, which could impact its planned general and administrative, research and development, or capital spend in an effort to provide sufficient funds to continue its operations or maintain compliance with the financial covenants, and the Company may be subject to adverse business conditions due to the global COVID-19 pandemic, all of which could adversely affect the Company’s business.
|
(2) |
Basis of presentation of the consolidated financial statements |
Annual closing date
The Company follows the concept of a fiscal year which ends on the Sunday nearest to the end of the month of December. Normally each fiscal year consists of 52 weeks, but every five or six years the fiscal year consists of 53 weeks as was the case for fiscal year 2020.
Stock Split
On January 18, 2021, the Company approved an issuance of 54,860,691 shares (an additional 0.5934 share for each existing share), which effected a 1.5934-for-1 stock split of its common stock. All references to share and per share amounts in the Company’s consolidated financial statements have been retrospectively revised to reflect the stock split.
|
(3) |
Summary of significant accounting policies |
The consolidated financial statements of UK Holdco and its subsidiaries have been prepared in conformity with U.S. GAAP. In the opinion of management, all adjustments (consisting only of normal recurring adjustments) considered necessary for a fair statement of the results for periods have been included. The consolidated financial statements include the accounts of the Company and its wholly owned subsidiaries, after the elimination of intercompany transactions.
F-10
Ortho Clinical Diagnostics Holdings plc (formerly known as Ortho-Clinical Diagnostics Bermuda Co. Ltd.)
Notes to Consolidated Financial Statements
January 3, 2021
(Dollars in millions, unless otherwise stated)
The preparation of financial statements in conformity with U.S. GAAP requires management to make estimates and assumptions that affect the reported amounts of assets and liabilities at the date of the financial statements, the reported amounts of revenues and expenses during the periods and disclosures. The estimates and underlying assumptions can impact all elements of the financial statements, including, but are not limited to, accounting for deductions from revenues (e.g. rebates, sales allowances, and discounts), receivable and inventory valuations, fixed asset valuations, useful lives, impairment of goodwill and tangible and intangible assets, the fair value of assets acquired and liabilities assumed in a business combination and related purchase price allocation, long-term employee benefit obligations, income taxes, environmental matters, litigation and allocations of costs. Estimates are based on historical experience, complex judgments, facts and circumstances available at the time and various other assumptions that are believed to be reasonable under the circumstances but are inherently uncertain and unpredictable. Actual results could differ materially from those estimates.
|
(b) |
Accounting for business combinations |
Business combinations are accounted for under the acquisition method of accounting, which requires the acquired assets, including separately identifiable intangible assets, and assumed liabilities to be recorded as of the acquisition date at their respective fair values. Any excess of the purchase price over the fair value of the assets acquired, including separately identifiable intangible assets, and liabilities assumed is recorded as goodwill. Fair value determination is subject to a significant degree of estimates.
The determination of the fair value of assets acquired and liabilities assumed involves assessments of factors such as the expected future cash flows associated with individual assets and liabilities and appropriate discount rates at the date of the acquisition. Where appropriate, external advisors are consulted to assist in the determination of fair value. For non-observable market values, fair value has been determined using acceptable valuation principles (e.g., multiple excess earnings and relief from royalty methods).
|
(c) |
Revenue recognition |
Revenue is recognized when obligations under the terms of a contract with a customer are satisfied; this occurs with the transfer of control of the Company’s goods or services. The Company considers revenue to be earned when all of the following criteria are met: the Company has a contract with a customer that creates enforceable rights and obligations; promised products or services are identified; the transaction price, or consideration the Company expects to receive for transferring the goods or providing services, is determinable; and the Company has transferred control of the promised items to the customer. A promise in a contract to transfer a distinct good or service to the customer is identified as a performance obligation. A contract’s transaction price is allocated to each performance obligation and recognized as revenue when, or as, the performance obligation is satisfied. Provisions for rebates and discounts are provided for in the period in which related sales are recorded based on historical experience and updated for changes in facts and circumstances, as appropriate. Such provisions are recorded as a reduction of revenue.
Product revenue includes sales of consumable supplies and test kits for equipment, sales and leases of instruments, as well as services related thereto. Revenue from sales of consumable supplies and test kits is generally recognized upon shipment or delivery based on the contractual shipping terms of the respective customer contract. Revenue from instrument sales is generally recognized upon installation and customer acceptance. Service revenue on equipment and instrument maintenance contracts is recognized over the life of the service arrangement or as services are performed. Revenue earned from operating leases is recognized over the lease term, normally five to seven years. Revenue earned under sales-type leases is recognized at the beginning of the lease, as well as a lease receivable and unearned interest associated with the lease.
The Company may also enter into transactions that involve multiple performance obligations, such as the sale of products and related services. In accounting for these transactions, the Company allocates arrangement consideration to the deliverables by use of the standalone selling price method.
A portion of the Company’s product revenue includes revenue earned under reagent rental programs which provide customers the right to use instruments at no separate cost to the customer in consideration for a multi-year agreement to purchase annual minimum amounts of consumables. For these arrangements, the contract consideration is allocated between the lease component related to the instruments and the non-lease component related to the reagents, assays and consumables based on the relative standalone prices for each component. The cost of the instrument is capitalized within property and equipment, and is charged to cost of product revenue on a straight-line basis over the term of the minimum purchase agreement. All revenue related to the non-lease component is recognized when control of the diagnostics kits have passed to the customer.
F-11
Ortho Clinical Diagnostics Holdings plc (formerly known as Ortho-Clinical Diagnostics Bermuda Co. Ltd.)
Notes to Consolidated Financial Statements
January 3, 2021
(Dollars in millions, unless otherwise stated)
The Company enters into collaboration arrangements that generate collaboration revenue and royalty revenue from license agreements. Revenue from collaborations is presented “gross” where the Company is deemed the principal in the arrangement and “net” where the Company is deemed the agent in the arrangement. For more information related to the Company’s collaboration arrangements, see Note 13—Collaborations and Other Relationships.
|
(d) |
Shipping and handling |
The revenue received for shipping and handling is included in “Net revenue” on the consolidated statements of operations and is less than 1% of total net revenue for each period presented. Shipping and handling costs were $61.2 million, $62.1 million and $56.2 million for the fiscal years ended January 3, 2021, December 29, 2019 and December 30, 2018, respectively, and are included in “Selling, marketing and administrative expenses” on the consolidated statements of operations.
|
(e) |
Research and development |
Research and development expense incurred in the normal course of business is expensed as incurred, including in asset acquisitions that are not considered to be business combinations.
In-process research and development projects acquired in a business combination are recorded as intangible assets at their fair value as of the acquisition date. Subsequent costs related to acquired in-process research and development projects are expensed as incurred. Research and development intangible assets are considered indefinite-lived until the abandonment or completion of the associated research and development efforts. Upon completion of the research and development process, the carrying value of acquired in-process research and development projects is reclassified as a finite-lived asset and is amortized over its useful life. In-process research and development indefinite-lived intangible assets are tested for impairment on an annual basis in the Company’s fiscal fourth quarter, unless conditions arise that would require a more frequent evaluation.
Upfront and milestone payments made to third parties in connection with research and development collaborations are expensed as incurred up to the point of regulatory approval. Payments made to third parties at or subsequent to regulatory approval are capitalized and amortized over the remaining useful life of the related product. Amounts capitalized for such payments are included in other intangibles, net of accumulated amortization.
The Company enters into collaborative arrangements to develop and commercialize intellectual property. These arrangements typically involve two (or more) parties who are active participants in the collaboration and are exposed to significant risks and rewards dependent on the commercial success of the activities. These collaborations usually involve various activities by one or more parties, including research and development, marketing and selling and distribution. Often, these collaborations require upfront, milestone and royalty or profit share payments, contingent upon the occurrence of certain future events linked to the success of the asset in development. Amounts due from collaborative partners related to development activities are generally reflected as a reduction of research and development expense because the performance of contract development services is not central to the Company’s operations.
In general, the income statement presentation for these collaborations is as follows:
|
Nature / type of collaboration |
|
Statement of operations presentation |
|
Third party sale of product |
|
Net revenue |
|
Royalties received from collaborative partner |
|
Net revenue |
|
Royalties/milestones paid to collaborative partner (post- regulatory approval)* |
|
Amortization of intangible assets |
|
Upfront payments and milestones paid to collaborative partner (pre-regulatory approval) |
|
Research and development expense |
|
Research and development payments to collaborative partner |
|
Research and development expense |
|
Research and development payments received from collaborative partner |
|
Reduction to research and development expense |
|
|
* |
Milestone payments are capitalized as intangible assets and amortized as component of amortization of intangible assets over their useful life. |
|
(f) |
Advertising |
Advertising costs, which are not material to the Company, are expensed as incurred and included in “Selling, marketing and administrative expenses” on the consolidated statements of operations.
F-12
Ortho Clinical Diagnostics Holdings plc (formerly known as Ortho-Clinical Diagnostics Bermuda Co. Ltd.)
Notes to Consolidated Financial Statements
January 3, 2021
(Dollars in millions, unless otherwise stated)
In connection with the Acquisition, the Company assumed certain defined benefit plan obligations and acquired certain related plan assets for current employees of our subsidiaries. In addition to the defined benefit plan obligations assumed in connection with the Acquisition, the Company implemented a replacement retiree health care reimbursement plan for certain U.S. employees.
Defined benefit plans specify an amount of pension benefit that an employee will receive on retirement, usually dependent on factors such as age, years of service and compensation. The net obligation in respect of defined benefit plans is calculated separately for each plan by estimating the amount of the future benefits that employees have earned in return for their service in the current and prior periods. These benefits are then discounted to determine the present value of the obligations and are then adjusted for the impact of any unamortized prior service costs. All unamortized prior service costs and actuarial gains (losses) existing at the closing date of the Acquisition were eliminated in the determination of the fair value of the pension funded status at acquisition. The net obligation is then determined with reference to the fair value of the plan assets (if any). The discount rate used is the yield on bonds that are denominated in the currency in which the benefits will be paid and that have maturity dates approximating the terms of the obligations. The calculations are performed by qualified actuaries using the projected unit credit method.
The implementation of the replacement retiree health care reimbursement plan for certain U.S. employees in 2014 was considered the initiation of a new plan. The accumulated benefit obligation was calculated by estimating the amount of the future benefits that employees have earned in return for their service in the current and prior periods. These benefits were then discounted to determine the present value of the obligations. The discount rate used was the yield on bonds that are denominated in the currency in which the benefits will be paid and that have maturity dates approximating the terms of the obligations. The amount of the accumulated benefit obligation on the initiation date is accounted for as prior service cost and is deferred as a component of accumulated other comprehensive income and amortized over the period benefited.
|
(h) |
Stock-based compensation |
Stock-based compensation, comprised of UK Holdco stock options and restricted stock awards to employees and directors, is measured at fair value on the grant date or date of modification, as applicable. Compensation expense is recognized over the requisite service period and includes an estimate of the awards that will be forfeited, and an estimate of what level of performance the company will achieve for performance-based awards.
Deferred tax assets and liabilities are recognized for the future tax consequences attributable to differences between the financial statement carrying amounts of assets and liabilities and their respective tax basis. Deferred tax assets are also recognized for operating losses and tax credit carryforwards. Valuation allowances are recorded to reduce deferred tax assets when it is more likely than not that a tax benefit will not be realized. Deferred tax assets and liabilities are measured using enacted tax rates applicable in the years in which they are expected to be recovered or settled. The effect on deferred tax assets and liabilities of a change in tax law is recognized in income in the period that includes the enactment date.
The Company does not intend to permanently reinvest earnings of foreign subsidiaries at this time. As such, the Company provides for income taxes and foreign withholding taxes, where applicable, on undistributed earnings. Any repatriation of undistributed earnings would be done at little or no tax cost.
The Company recognizes the benefit of an income tax position only if it is “more likely than not” that the tax position will be sustained. The tax benefits recognized are measured based on the largest benefit that has a greater than 50% likelihood of being realized. Additionally, the Company recognizes interest and penalties accrued related to unrecognized tax benefits as a component of provision for taxes on income. The Acquisition Agreement includes indemnification provisions with respect to tax liabilities, including reserves for unrecognized tax benefits, as of the date of the Acquisition.
|
(j) |
Net loss per common share |
Basic net loss per share attributable to the Company’s common shareholders is based upon the weighted-average number of common shares outstanding during the period, excluding restricted stock that have been issued but are not yet vested. Diluted net loss per share attributable to the Company’s common shareholders is based upon the weighted-average number of common shares outstanding during the period plus additional weighted-average common equivalent shares outstanding during the period when the effect is dilutive. Common equivalent shares result from the assumed exercise of outstanding stock options (the proceeds of which are then
F-13
Ortho Clinical Diagnostics Holdings plc (formerly known as Ortho-Clinical Diagnostics Bermuda Co. Ltd.)
Notes to Consolidated Financial Statements
January 3, 2021
(Dollars in millions, unless otherwise stated)
assumed to have been used to repurchase outstanding stock using the treasury stock method) and the vesting of unvested restricted shares and unvested restricted stock units of common stock. The following common stock equivalents outstanding were excluded from the calculation of diluted net loss per share for the periods presented because including them would have been anti-dilutive:
|
|
|
January 3, 2021 |
|
|
December 29, 2019 |
|
|
December 30, 2018 |
|
|||
|
Stock options |
|
|
16,080,124 |
|
|
|
15,218,726 |
|
|
|
12,419,379 |
|
|
Unvested restricted shares and restricted stock units |
|
|
1,015,543 |
|
|
|
347,015 |
|
|
|
32,946 |
|
|
|
|
|
17,095,667 |
|
|
|
15,565,741 |
|
|
|
12,452,325 |
|
|
(k) |
Fair value measurements |
Fair value is the exit price that would be received to sell an asset or paid to transfer a liability. U.S. GAAP defines a fair value hierarchy that prioritizes the inputs to valuation techniques used to measure fair value. The hierarchy gives the highest priority to unadjusted quoted prices in active markets for identical assets or liabilities (Level 1 measurements) and the lowest priority to unobservable inputs (Level 3 measurements). A financial instrument’s level within the fair value hierarchy is based on the lowest level of any input that is significant to the fair value measurement.
The following valuation techniques are used to measure fair value for assets and liabilities:
Level 1—Quoted market prices in active markets for identical assets or liabilities;
Level 2—Significant other observable inputs (e.g. quoted prices for similar items in active markets, quoted prices for identical or similar items in markets that are not active, inputs other than quoted prices that are observable such as interest rate and yield curves, and market-corroborated inputs); and
Level 3—Unobservable inputs for the asset or liability, which are valued based on management’s estimates of assumptions that market participants would use in pricing the asset or liability.
|
(l) |
Derivatives and hedging |
The Company utilizes derivatives to manage exposures to risk and not for speculative or trading purposes. The fair values of all derivatives are recognized as assets or liabilities at the balance sheet date. Changes in the fair value of these instruments are reported in current earnings or other comprehensive income (“OCI”), depending on the use of the derivative and whether it qualifies for hedge accounting treatment. Cash flows from derivatives are recognized in the consolidated statement of cash flows in a manner consistent with the underlying transactions.
Unrealized gains and losses on derivatives that are designated and qualify as cash flow hedging instruments are recorded in OCI, to the extent the hedges are effective, until the underlying transactions settle, and the remaining gain or loss is recognized to the corresponding account in income (loss) from operations. The ineffective portions of cash flow hedging instruments, if any, are recognized immediately to the corresponding account in income (loss) from operations.
Derivatives not designated as hedging instruments are marked-to-market at the end of each accounting period with the results recorded in Other income (loss).
|
(m) |
Other comprehensive income (loss) |
Other comprehensive income (loss) is recorded directly to a separate section of stockholder’s equity in accumulated other comprehensive income (loss) and primarily includes unrealized gains and losses excluded from the Consolidated statement of operations. These unrealized gains and losses consist of changes in foreign currency translation, changes in unamortized pension, postretirement and postemployment actuarial gains and losses and prior service cost, changes in the fair value of interest derivatives and foreign currency derivatives that are designated and qualify as cash flow hedging instruments and changes in available for sale securities.
|
(n) |
Cash and cash equivalents |
Cash equivalents represent investments with original maturities of three months or less from time of purchase. They are carried at cost plus accrued interest, which approximates fair value because of the short-term maturity of these instruments. As of January 3,
F-14
Ortho Clinical Diagnostics Holdings plc (formerly known as Ortho-Clinical Diagnostics Bermuda Co. Ltd.)
Notes to Consolidated Financial Statements
January 3, 2021
(Dollars in millions, unless otherwise stated)
2021 and December 29, 2019, the Company did not hold any cash equivalents. Cash balances may exceed government insured limits in certain jurisdictions.
|
(o) |
Accounts receivable and allowance for doubtful accounts and concentration of credit risk |
Accounts receivable are recognized net of an allowance for doubtful accounts. The Company maintains an allowance for doubtful accounts for expected credit losses resulting from the collectability of customer accounts. The Company establishes a reserve based on historical losses, the age of receivables, customer mix and credit policies, current economic conditions in customers’ country or industry, and expectations associated with reasonable and supportable forecasts, and specific allowances for large or risky accounts. Receivables from federal and state government customers as well as large corporate customers have historically been less susceptible to collectability risk. Amounts later determined to be uncollectible are charged or written off against this allowance. No single customer accounted for 10% or more of total revenue or accounts receivable for all periods presented.
|
(p) |
Inventories |
Inventories are stated at the lower of cost and net realizable value on a first-in, first-out method. Elements of cost include raw materials, direct labor and manufacturing overhead.
Equipment inventory can either be sold or leased to customers. When leased, the equipment is transferred to “Property, plant and equipment” and depreciation commences.
|
(q) |
Customer leased instruments |
Determining the economic life of leased instruments requires significant judgment based on our historical experience. The Company estimates the economic life for leased equipment to be ten years. The Company believes these lives represent the periods during which the instruments are expected to be economically usable, with normal repairs and maintenance, for the purposes for which they are intended. The Company regularly evaluates the economic life of existing and new products for purposes of this determination.
|
(r) |
Property, plant and equipment and depreciation |
Property, plant and equipment is recorded at cost and are depreciated using the straight-line method over the estimated useful lives of the assets as follows:
|
Asset type |
|
Useful life |
|
Leasehold improvements |
|
Up to 30 years |
|
Building and building improvements |
|
7-55 years |
|
Machinery and equipment |
|
3-30 years |
|
Customer leased Instruments |
|
5-8 years |
|
Computer software |
|
3-8 years |
The Company depreciates customer leased instruments over the shorter of the contract length or useful economic life.
The Company capitalizes certain computer software and development costs when incurred in connection with developing or obtaining computer software for internal use.
Software developed for use in the Company’s products is expensed as incurred to research and development expense until technological feasibility is achieved. Costs incurred subsequent to the achievement of technological feasibility are capitalized. As of January 3, 2021 and December 29, 2019, capitalized costs related to software for use in the Company’s products amounted to $13.2 million and $13.2 million, respectively.
When assets are surrendered, retired, sold or otherwise disposed of, their gross carrying values and related accumulated depreciation are removed from the accounts and included in determining gain or loss on such disposals. Maintenance and repairs are expensed as incurred; major replacements and improvements that extend the useful life are capitalized.
F-15
Ortho Clinical Diagnostics Holdings plc (formerly known as Ortho-Clinical Diagnostics Bermuda Co. Ltd.)
Notes to Consolidated Financial Statements
January 3, 2021
(Dollars in millions, unless otherwise stated)
Goodwill represents the excess of purchase price over the fair values of underlying net assets acquired in an acquisition. The Company assesses goodwill for impairment at the reporting unit level on an annual basis in the Company’s fiscal fourth quarter and whenever events or changes in circumstances occur that indicate that the fair value of a reporting unit is below its carrying amount.
When testing goodwill for impairment, the Company first has an option to assess qualitative factors to determine whether the existence of events or circumstances leads to a determination that it is more likely than not (more than 50%) that impairment exists. The Company is also required to perform a qualitative assessment if the carrying value of the reporting unit is zero or negative. Such qualitative factors may include the following: macroeconomic conditions, industry and market considerations, cost factors, overall financial performance, and other relevant entity-specific events. In the event the qualitative assessment indicates that an impairment is more likely than not, the Company would be required to perform a quantitative impairment test, otherwise no further analysis is required. Under the quantitative goodwill impairment test, the evaluation of impairment involves comparing the current fair value of each reporting unit to its carrying value, including goodwill. The company estimates the fair value of its reporting units by using forecasts of discounted future cash flows and peer market multiples. Estimates of discounted future cash flows for each reporting unit require assumptions related to assumed revenue growth rates, long term growth rates and discount rates. The Company also considers revenue and earnings trading multiples of the peer companies that have similar financial characteristics to the reporting units. If the fair value of a reporting unit is less than its carrying value, impairment will be recognized in the amount by which the carrying value exceeds the fair value.
As of December 30, 2019, the beginning of fiscal year 2020, the Company changed the financial information that was regularly reviewed by the Chief Operating Decision Maker (“CODM”) to measure performance and allocate resources. This resulted in a change to the Company’s operating segments and reporting units. Goodwill was allocated to the newly identified reporting units and management performed impairment assessments on the new reporting units following the change. The Company performed a quantitative goodwill impairment assessment as of December 30, 2019 to assess for potential impairment in each of its reporting units and concluded that the fair value of each of its reporting unit is in excess of its carrying value.
In the fiscal fourth quarter ended January 3, 2021, the Company further changed the manner in which the CODM measured performance and allocated resources. This resulted in five geographically-based operating segments, however the Company’s reporting units remained the same. The Company performed a quantitative goodwill impairment assessment as of the beginning of the fourth quarter to assess for potential impairment. Based upon the Company’s quantitative impairment tests for the fiscal year ended January 3, 2021, the fair value of each of its reporting unit is in excess of its carrying value.
|
(t) |
Impairment of long-lived assets |
The process of evaluating the potential impairment of other long-lived assets, such as property, plant and equipment, technology, tradenames, customer relationships and capitalized milestone payments, is subjective and requires judgment. The Company reviews long-lived assets for impairment when events or changes in circumstances indicate the carrying value of an asset may not be recoverable. This impairment test may be triggered by a decrease in the market price of a long-lived asset, an adverse change in the extent or manner in which the asset is being used, or a forecast of continuing losses associated with the use of the asset. If the fair value is less than the asset’s carrying amount, a loss is recognized for the difference. The fair value methodology used is an estimate of fair value and is based on the discounted future cash flows of the asset or quoted market prices of similar assets. Based on these assumptions and estimates, the Company determines whether a need for an impairment charge exists to reduce the value of the asset stated on the balance sheet to reflect its estimated fair value.
|
(u) |
Equity investments |
The Company’s equity investments in publicly-traded equity securities are recorded using either the equity method of accounting or as available-for-sale securities, depending on our ownership percentage and other factors that suggest we have significant influence. For equity investments accounted for under the equity method, the Company records its share of the equity affiliates results of operations based on its percentage of ownership. Dividends declared are recorded as a reduction to the equity investment value. Equity investments with readily determinable fair values that are accounted for as available-for-sale securities are measured at their fair value with the changes in their fair value reported as a component of other comprehensive income (loss). The Company monitors these investments to determine whether any decline in their fair value is considered other-than-temporary.
F-16
Ortho Clinical Diagnostics Holdings plc (formerly known as Ortho-Clinical Diagnostics Bermuda Co. Ltd.)
Notes to Consolidated Financial Statements
January 3, 2021
(Dollars in millions, unless otherwise stated)
Equity investments that the Company does not have the ability to exercise significant influence and do not have readily determinable fair values are accounted for under the cost method. The Company periodically reviews its cost method investments for impairment and adjusts these investments to their fair value when a decline in market value is deemed to be other than temporary. If losses on these securities are considered to be other than temporary, the loss is recognized in earnings. Dividends are reported in current earnings as a component of Other operating expense, net in the consolidated statements of operations.
|
(v) |
Litigation |
The Company accrues for liabilities related to litigation matters when available information indicates that the liability is probable and the amount can be reasonably estimated. Legal costs, such as outside counsel fees and expenses, are charged to expense in the period incurred.
|
(w) |
Foreign currency translation |
The Company’s reporting currency is the U.S. dollar. In most cases, non-U.S. based subsidiaries use their local currency as the functional currency for their respective business operations. Assets and liabilities of these operations are translated into U.S. dollars at end-of-period exchange rates; income and expenses are translated using the average exchange rates for the reporting period. Resulting cumulative translation adjustments are recorded in “Foreign currency translation” in the consolidated statement of comprehensive income (loss).
Gains and losses from transactions denominated in foreign currencies other than the functional currency of the respective entity are included in the consolidated statements of operations in Other (income) expense, net.
(x)Government grants
From time to time the Company may receive grants from government institutions for various matters. The Company evaluates the terms and conditions of each grant to determine the proper accounting treatment. The Company recognizes revenue under these arrangements when milestone conditions in the contract have been substantially met. During 2020, the Company received grants from the U.S. government’s Biomedical Advanced Research and Development Authority (“BARDA”). Grant revenue is presented in Collaboration and other revenue. For more information related to the BARDA grants, see Note 4—Revenue.
|
(y) |
New accounting guidance |
Accounting pronouncements adopted during the fiscal year ended December 30, 2018
Revenue from contracts with customers
In May 2014, the FASB issued ASU No. 2014-09, Revenue from Contracts with Customers. The core principle of the new guidance is that an entity should recognize revenue to depict the transfer of promised goods or services to customers in an amount that reflects the consideration to which the entity expects to be entitled in exchange for those goods or services. To achieve that core principle, an entity is to apply the following steps:
Step 1: Identify the contract(s) with a customer.
Step 2: Identify the performance obligations in the contract.
Step 3: Determine the transaction price.
Step 4: Allocate the transaction price to the performance obligations in the contract.
Step 5: Recognize revenue when (or as) the entity satisfies a performance obligation.
The Company adopted this new guidance on January 1, 2018 using the modified retrospective method and applying the practical expedient for all contracts not completed as of the date of adoption. The adoption of this guidance resulted in a cumulative net decrease of $11.9 million to opening accumulated deficit. Results for reporting periods beginning after December 31, 2017 are presented in accordance with the new guidance. Prior period amounts were not adjusted and are reported in accordance with legacy GAAP requirements under FASB ASC Topic 605, Revenue Recognition. See Note 4 – Revenue for additional details.
F-17
Ortho Clinical Diagnostics Holdings plc (formerly known as Ortho-Clinical Diagnostics Bermuda Co. Ltd.)
Notes to Consolidated Financial Statements
January 3, 2021
(Dollars in millions, unless otherwise stated)
Accounting pronouncements adopted during the fiscal year ended December 29, 2019
Accounting for leases
In February 2016, the FASB issued ASU 2016-02, Leases, which supersedes the previous leasing standard Topic 840. The main difference between previous U.S. GAAP and ASC 842 is the recognition of lease assets and liabilities by lessees for those leases classified as operating leases under previous U.S. GAAP. A lessee is required to recognize in the statement of financial position a liability to make lease payments and a Right-of-use asset representing its right to use the underlying asset during the lease term. The classification criteria for distinguishing between finance leases and operating leases are substantially similar to the classification criteria in the previous U.S. GAAP. The result of retaining a distinction between finance leases and operating leases is that the effect of leases on the income statement and the statement of cash flows is largely unchanged from previous U.S. GAAP. The accounting applied by a lessor is largely unchanged from that applied under previous U.S. GAAP.
The Company adopted ASU 2016-02 on December 31, 2018 using a modified retrospective approach, which does not require prior periods to be restated. The Company elected the “package” of practical expedients related to the identification and classification of leases that commenced before the effective date, not to apply the recognition requirements for short term leases, and to not separate lease and non-lease components. The adoption of this guidance resulted in the recognition of right-of-use asset $46.9 million and lease liabilities of $47.3 million. The lease liabilities included $14.5 million of current lease liabilities and $32.8 million in long-term lease liabilities. For more information, see Note 10—Leases.
Accounting pronouncements adopted during the fiscal year ended January 3, 2021
Financial instruments—credit losses (Topic 326)
In June 2016, the FASB issued ASC Update No. 2016-13, Financial Instruments—Credit Losses (Topic 326): Measurement of Credit Losses on Financial Instruments, which amends the impairment model by requiring entities to use a forward-looking approach based on expected losses rather than incurred losses to estimate credit losses on certain types of financial instruments, including trade receivables. The Company adopted this guidance on December 30, 2019 using the modified retrospective approach and the adoption did not have a material effect on the consolidated financial statements.
Cloud computing
In August 2018, the FASB issued Accounting Standards Update No. 2018-15, Intangibles-Goodwill and Other- Internal-Use Software (Subtopic 350- 40): Customer’s Accounting for Implementation Costs Incurred in a Cloud Computing Arrangement That is a Service Contract (“ASU 2018-15”). ASU 2018-15 aligns the accounting for implementation costs incurred in a hosting arrangement that is a service contract with the guidance on capitalizing costs associated with developing or obtaining internal-use software (and hosting arrangements that include an internal-use software license). The Company adopted the standards on a prospective basis on December 30, 2019.The adoption did not have a material impact on the Company’s consolidated financial statements.
Recent accounting pronouncements not yet adopted
Income taxes (Topic 740), simplifying the accounting for income taxes
In December 2019, the FASB issued ASU 2019-12, Income Taxes (Topic 740): Simplifying the Accounting for Income Taxes, which enhances and simplifies various aspects of the income tax accounting guidance related to intra-period tax allocations, interim-period accounting for enacted changes in tax law, and the year-to-date loss limitation in interim period tax accounting. The guidance is effective for fiscal years beginning after December 15, 2020. Early adoption is permitted. The Company does not expect that the adoption of this standard will have a material impact on the Company’s consolidated financial statements.
Reference rate reform (Topic 848)
In January 2021, the FASB issued ASU 2021-01, Reference rate reform (topic 848), which clarifies that certain optional expedients and exceptions in Topic 848 apply to derivative instruments that use and interest rate for margining, discounting, or contract price alignment that is modified as a result of reference rate reform. The optional amendments can be applied on a full retrospective basis as of any date from the beginning of an interim period that includes or is subsequent to March 12, 2020, or on a prospective basis to new modifications from any date within an interim period that includes or is subsequent to the date of the issuance of a final Update, up to the date that financial statements are available to be issued. The Company does not expect that the adoption of this standard will have a material impact on the Company’s consolidated financial statements.
F-18
Ortho Clinical Diagnostics Holdings plc (formerly known as Ortho-Clinical Diagnostics Bermuda Co. Ltd.)
Notes to Consolidated Financial Statements
January 3, 2021
(Dollars in millions, unless otherwise stated)
Intangibles – Goodwill and Other (Topic 350)
In January 2017, the FASB issued ASC Update No. 2017-04, Intangibles—Goodwill and Other – Simplifying the Test for Goodwill Impairment (Topic 350). The amendment eliminates Step 2 of the goodwill impairment test and no longer requires an entity to calculate implied fair value of goodwill by measuring the fair value of assets and liabilities consistent with the procedures required in a business combination. The amendment now requires that an entity should recognize an impairment charge for the amount by which the carrying amount exceeds the reporting unit’s fair value. An entity still has the option to perform the qualitative assessment under this amendment. The Company adopted this guidance on December 30, 2019 on a prospective basis and the adoption did not have a material effect on the consolidated financial statements.
|
(4) |
Revenue |
The Company recognizes revenue when obligations under the terms of a contract with a customer are satisfied; this occurs with the transfer of control of the Company’s goods or services. The Company considers revenue to be earned when all of the following criteria are met: the Company has a contract with a customer that creates enforceable rights and obligations; promised products or services are identified; the transaction price, or consideration the Company expects to receive for transferring the goods or providing services, is determinable; and the Company has transferred control of the promised items to the customer. A promise in a contract to transfer a distinct good or service to the customer is identified as a performance obligation. A contract’s transaction price is allocated to each performance obligation and recognized as revenue when, or as, the performance obligation is satisfied.
The Company generates revenue primarily from the sale of in-vitro diagnostics instruments, assays, reagents and other consumables, accessories and service contracts. The Company generally recognizes revenue when the customer obtains control of the products, which occurs at a point in time. For instruments, the Company generally recognizes revenue upon installation and customer acceptance. The Company has determined that the installation services do not constitute a separate performance obligation. For assays, reagents and other consumables, the Company recognizes revenue upon shipment or delivery based on the contractual shipping terms of a contract. Service revenue is generally recognized over time using a time-based model, which is consistent with the pattern in which the Company provides the services.
The Company also generates revenues from a limited number of contract manufacturing arrangements. The Company recognizes revenues related to certain of these arrangements over time as the products are manufactured and the Company’s performance obligations have been satisfied under the terms of the contract because the Company has an enforceable right to payment and the products have no alternative use. This change resulted in revenue for certain of these arrangements being recognized earlier than under the previous guidance. The Company generally uses the cost-to-cost approach to measure the extent of progress towards completion of the performance obligation for these arrangements because it believes it best depicts the transfer of assets to the customer. Under the cost-to-cost approach, the extent of progress towards completion is measured based on the ratio of costs incurred to date to the total estimated costs at completion of the performance obligation. Revenues are recorded proportionally as costs are incurred. Historically, adjustments made as a result of changes in the estimate of total costs to complete the performance obligation have been immaterial to the financial statements.
If the contract contains a single performance obligation, the entire transaction price is allocated to the single performance obligation. The Company may also enter into transactions that involve multiple performance obligations, such as the sale of products and related services. In accounting for these transactions, the Company allocates the consideration to the deliverables by use of the relative standalone selling price method.
A portion of the Company’s product revenue includes revenue earned under reagent rental programs which provide customers the right to use instruments at no separate cost to the customer in consideration for a multi-year agreement to purchase reagents, assays and consumables. For these arrangements, the contract consideration is allocated between the lease component related to the instruments and the non-lease component related to the reagents, assays and consumables on based on the relative standalone prices for each component. The cost of the instrument is capitalized within property and equipment, and is charged to cost of product revenue on a straight-line basis over the term of the minimum purchase agreement. Revenue related to the lease component is recognized over the lease term, normally five to seven years. Revenue earned under sales-type leases is recognized at the beginning of the lease, as well as a lease receivable and unearned interest associated with the lease. Revenue related to the non-lease component is recognized when control has transferred for the reagents, assays and consumables. Costs related to product sales are recognized at time of delivery. There was no impact to the Company’s consolidated financial statements upon transition to ASC 606 as a result of the Company’s reagent rental programs.
F-19
Ortho Clinical Diagnostics Holdings plc (formerly known as Ortho-Clinical Diagnostics Bermuda Co. Ltd.)
Notes to Consolidated Financial Statements
January 3, 2021
(Dollars in millions, unless otherwise stated)
The Company recognizes product revenues at the net sales price, which includes estimates of variable consideration related to rebates and volume discounts. Rights of return are generally not included in the Company’s arrangements with customers. Management’s estimates of rebates and discounts are determined using the expected value method and take into consideration historical experience, contractual and statutory requirements, and other relevant information such as forecasted activity. These reserves reflect the Company’s best estimate of the amount of consideration to which it is entitled. The amount of variable consideration included in the net sales price is limited to the amount that is probable not to result in a significant future reversal of cumulative revenue under the contract.
Contract balances
Timing of revenue recognition may differ from timing of invoicing to customers. The Company records an asset when revenue is recognized prior to invoicing a customer (“contract asset”). Contract assets are included within other current assets or other assets in the Company’s consolidated balance sheet and are transferred to accounts receivable when the right to payment becomes unconditional. The balance of contract assets in the consolidated balance sheets were as follows:
|
|
|
January 3, 2021 |
|
|
December 29, 2019 |
|
||
|
Other current assets |
|
$ |
40.4 |
|
|
$ |
31.5 |
|
|
Other assets |
|
|
2.4 |
|
|
|
2.0 |
|
|
Total Contract assets |
|
$ |
42.8 |
|
|
$ |
33.5 |
|
The contract asset balance consists of the following components:
|
|
• |
A customer supply agreement under which the difference between the timing of invoicing and revenue recognition resulted in a contract asset of $15.1 million as of January 3, 2021, of which $12.7 million was recorded within other current assets and $2.4 million was recorded within other assets. The balance of this contract asset was $13.8 million as of December 29, 2019, of which $11.8 million was recorded within other current assets and $2.0 million was recorded within other assets. |
|
|
• |
Contractual arrangements with certain customers under which the Company invoices the customers based on reportable results generated by its reagents, however, control of the goods transfers to the customers upon shipment or delivery of the products, as determined under the terms of the contract, which allows the Company to record the related revenue. Using the expected value method, the Company estimates the number of reagents that will generate a reportable result. The Company records the revenue and an associated contract asset, and relieves the contract asset upon completion of the invoicing. The balance of the contract asset related to these arrangements was $24.3 million and $14.1 million as of January 3, 2021 and December 29, 2019, respectively. |
|
|
• |
One of the Company’s contract manufacturing agreements where revenue is recognized as the products are manufactured. The balance of the contract asset related to this arrangement was $3.4 million and $5.6 million as of January 3, 2021 and December 29, 2019, respectively. |
The Company reviews contract assets for expected credit losses resulting from the collectability of customer accounts. Expected losses are established based on historical losses, customer mix and credit policies, current economic conditions in customers’ country or industry, and expectations associated with reasonable and supportable forecasts. No credit losses related to contract assets were recognized during the fiscal year ended January 3, 2021 and December 29, 2019, respectively.
The Company recognizes a contract liability when a customer pays an invoice prior to the Company transferring control of the goods or services (“contract liabilities”). The Company’s contract liabilities consist of deferred revenue primarily related to customer service contracts. The Company classifies deferred revenue as current or noncurrent based on the timing of the transfer of control or performance of the service. The balance of the Company’s current deferred revenue was $35.5 million and $36.3 million as of January 3, 2021 and December 29, 2019, respectively. The Company has one arrangement with a customer that is expected to be recognized beyond one year. The balance of the deferred revenue included in long term liabilities was $6.6 million and $6.9 million as of January 3, 2021 and December 29, 2019, respectively, and was included in other liabilities in the consolidated balance sheet. The amount of deferred revenue as of December 29, 2019 that was recorded in revenue during the fiscal year ended January 3, 2021 was $35.1 million. The amount of deferred revenue as of December 30, 2018 that was recorded in revenue during the fiscal year ended December 29, 2019 was $25.8 million.
F-20
Ortho Clinical Diagnostics Holdings plc (formerly known as Ortho-Clinical Diagnostics Bermuda Co. Ltd.)
Notes to Consolidated Financial Statements
January 3, 2021
(Dollars in millions, unless otherwise stated)
The Company generates revenue in the following lines of business:
|
|
• |
Clinical Laboratories—Focused on clinical chemistry and immunoassay instruments and tests to detect and monitor disease progression across a broad spectrum of therapeutic areas. |
|
|
• |
Transfusion Medicine—Focused on immunohematology instruments and tests used for blood typing to ensure patient-donor compatibility in blood transfusions and donor screening instruments and tests used for blood and plasma screening for infectious diseases for customers primarily in the United States. |
|
|
• |
Other Product—Other product revenue includes revenues primarily from contract manufacturing. |
|
|
• |
Collaborations and Other—The Company has entered into collaboration and license agreements pursuant to which the Company derives collaboration and royalty revenues. During the fiscal year ended January 3, 2021, the Company entered into two agreements with the Biomedical Advanced research and Development Authority (BARDA), a division of the U.S. Department of Health and Human Services (HHS), for two awards of up to $13.6 million to develop and submit Emergency Use Authorizations and 510k applications to the FDA for our COVID-19 antigen and antibody tests. During the year ended January 3, 2021, the Company recognized $5.8 million of grant revenue related to these grants based upon project milestones completed to date. |
The following table summarizes net revenue by line of business for the fiscal years ended January 3, 2021, December 29, 2019 and December 30, 2018:
|
|
|
Fiscal year ended |
|
|||||||||
|
|
|
January 3, 2021 |
|
|
December 29, 2019 |
|
|
December 30, 2018 |
|
|||
|
Clinical Laboratories |
|
$ |
1,148.3 |
|
|
$ |
1,142.3 |
|
|
$ |
1,102.5 |
|
|
Transfusion Medicine |
|
|
580.6 |
|
|
|
598.0 |
|
|
|
616.1 |
|
|
Other Product |
|
|
8.5 |
|
|
|
37.3 |
|
|
|
36.0 |
|
|
Collaborations and other revenue |
|
|
28.8 |
|
|
|
23.9 |
|
|
|
32.7 |
|
|
Net Revenue |
|
$ |
1,766.2 |
|
|
$ |
1,801.5 |
|
|
$ |
1,787.3 |
|
The following table summarizes changes to the rebate reserves balances, which reduce accounts receivable, for the fiscal years ended January 3, 2021, December 29, 2019 and December 30, 2018:
|
|
|
Balance at beginning of fiscal year |
|
|
Additions |
|
|
Deductions(a) |
|
|
Balance at end of fiscal year |
|
||||
|
Rebate reserves |
|
|
|
|
|
|
|
|
|
|
|
|
|
|
|
|
|
Fiscal year ended January 3, 2021 |
|
|
32.1 |
|
|
|
222.4 |
|
|
|
(212.1 |
) |
|
|
42.4 |
|
|
Fiscal year ended December 29, 2019 |
|
|
30.6 |
|
|
|
207.0 |
|
|
|
(205.5 |
) |
|
|
32.1 |
|
|
Fiscal year ended December 30, 2018 |
|
|
40.1 |
|
|
|
183.9 |
|
|
|
(193.4 |
) |
|
|
30.6 |
|
|
(a) |
Primarily reflects payments of customer rebates. |
|
(5) |
Inventories |
The Company’s inventories were as follows:
|
|
|
January 3, 2021 |
|
|
December 29, 2019 |
|
||
|
Raw materials and supplies |
|
$ |
77.2 |
|
|
$ |
70.9 |
|
|
Goods in process |
|
|
35.2 |
|
|
|
36.7 |
|
|
Finished goods |
|
|
166.3 |
|
|
|
146.3 |
|
|
Total Inventories |
|
$ |
278.7 |
|
|
$ |
253.9 |
|
F-21
Ortho Clinical Diagnostics Holdings plc (formerly known as Ortho-Clinical Diagnostics Bermuda Co. Ltd.)
Notes to Consolidated Financial Statements
January 3, 2021
(Dollars in millions, unless otherwise stated)
Customer leased instruments of $132.3 million and $118.6 million were transferred from “Inventories” to “Property, plant and equipment, net” during the fiscal years ended January 3, 2021 and December 29, 2019, respectively.
|
(6) |
Property, plant and equipment, net |
The Company’s property, plant and equipment and accumulated depreciation balances were as follows:
|
|
|
January 3, 2021 |
|
|
December 29, 2019 |
|
||
|
Land and leasehold improvements |
|
$ |
23.3 |
|
|
$ |
23.0 |
|
|
Buildings and building improvements |
|
|
246.8 |
|
|
|
237.3 |
|
|
Machinery and equipment |
|
|
458.3 |
|
|
|
400.3 |
|
|
Computer software and development costs |
|
|
273.6 |
|
|
|
262.4 |
|
|
Customer leased instruments |
|
|
727.3 |
|
|
|
616.1 |
|
|
Construction in progress |
|
|
71.1 |
|
|
|
100.4 |
|
|
Total property, plant and equipment |
|
|
1,800.4 |
|
|
|
1,639.5 |
|
|
Less: Accumulated depreciation |
|
|
(968.4 |
) |
|
|
(791.3 |
) |
|
Net property, plant and equipment |
|
$ |
832.0 |
|
|
$ |
848.2 |
|
Depreciation expense was $194.0 million, $195.6 million and $203.4 million for the fiscal years ended January 3, 2021, December 29, 2019 and December 30, 2018, respectively. Depreciation expense for computer software and development costs was $33.4 million, $38.4 million and $40.4 million for the fiscal years ended January 3, 2021, December 29, 2019 and December 30, 2018, respectively. The Company recognized a loss on disposal of fixed assets of $1.4 million, $5.5 million and $4.5 million during the fiscal years ended January 3, 2021, December 29, 2019 and December 30, 2018, respectively. Loss on disposals of fixed assets is either included within Costs of revenue or Other operating expense.
|
(7) |
Goodwill and other intangible assets |
Goodwill
Changes in goodwill were as follows:
|
|
|
Fiscal year ended January 3, 2021 |
|
|||||||||||||||||
|
|
|
Americas |
|
|
EMEA |
|
|
Greater China |
|
|
Other |
|
|
Total |
|
|||||
|
Balance at beginning of fiscal year |
|
$ |
357.6 |
|
|
$ |
36.7 |
|
|
$ |
116.6 |
|
|
$ |
56.4 |
|
|
$ |
567.3 |
|
|
Foreign currency translation |
|
|
(2.3 |
) |
|
|
2.2 |
|
|
|
9.9 |
|
|
|
3.0 |
|
|
$ |
12.8 |
|
|
Balance at end of fiscal year |
|
$ |
355.3 |
|
|
$ |
38.9 |
|
|
$ |
126.5 |
|
|
$ |
59.4 |
|
|
$ |
580.1 |
|
On December 30, 2019, the Company established new reporting units aligned to our geographically-based reportable segments (see Note 19,"Segments and geographic information”). The balance at the beginning of the year in the table above shows how goodwill was allocated to the reporting unit on a relative fair value basis.
Intangible assets, net
The following table summarizes the gross carrying amounts and accumulated amortization of identifiable intangible assets by major class:
|
January 3, 2021 |
|
Gross carrying amount |
|
|
Accumulated amortization |
|
|
Net book value |
|
|
Estimated useful lives |
|||
|
Technology |
|
$ |
970.3 |
|
|
$ |
(395.1 |
) |
|
$ |
575.2 |
|
|
10-15 years |
|
Customer relationships |
|
|
618.3 |
|
|
|
(333.8 |
) |
|
|
284.5 |
|
|
5-12 years |
|
Corporate tradename |
|
|
164.8 |
|
|
|
(53.5 |
) |
|
|
111.3 |
|
|
20 years |
|
Other (including milestone payments) |
|
|
210.3 |
|
|
|
(164.6 |
) |
|
|
45.7 |
|
|
4-14 years |
|
|
|
$ |
1,963.7 |
|
|
$ |
(947.0 |
) |
|
$ |
1,016.7 |
|
|
|
F-22
Ortho Clinical Diagnostics Holdings plc (formerly known as Ortho-Clinical Diagnostics Bermuda Co. Ltd.)
Notes to Consolidated Financial Statements
January 3, 2021
(Dollars in millions, unless otherwise stated)
|
December 29, 2019 |
|
Gross carrying amount |
|
|
Accumulated amortization |
|
|
Net book value |
|
|
Estimated useful lives |
|||
|
Technology |
|
$ |
962.1 |
|
|
$ |
(326.3 |
) |
|
$ |
635.8 |
|
|
10-15 years |
|
Customer relationships |
|
|
606.9 |
|
|
|
(275.2 |
) |
|
|
331.7 |
|
|
5-12 years |
|
Corporate tradename |
|
|
163.3 |
|
|
|
(44.9 |
) |
|
|
118.4 |
|
|
20 years |
|
Other (including milestone payments) |
|
|
205.5 |
|
|
|
(156.9 |
) |
|
|
48.6 |
|
|
4-14 years |
|
|
|
$ |
1,937.8 |
|
|
$ |
(803.3 |
) |
|
$ |
1,134.5 |
|
|
|
During the fiscal years ended January 3, 2021, December 29, 2019 and December 30, 2018, amortization expense of intangible assets was $131.9 million, $131.7 million and $128.8 million, respectively. The estimated amortization expense related to the fair value of acquired intangible assets for each of the succeeding five years is:
|
2021 |
|
$ |
130.3 |
|
|
2022 |
|
|
130.4 |
|
|
2023 |
|
|
130.1 |
|
|
2024 |
|
|
127.6 |
|
|
2025 |
|
|
124.1 |
|
|
(8) |
Other assets |
The components of other assets were as follows:
|
|
|
January 3, 2021 |
|
|
December 29, 2019 |
|
||
|
Equity investments |
|
$ |
21.0 |
|
|
$ |
20.1 |
|
|
Indirect tax benefit |
|
|
6.0 |
|
|
|
16.8 |
|
|
Right-of-use asset |
|
|
26.7 |
|
|
|
40.3 |
|
|
Indemnity receivables |
|
|
17.0 |
|
|
|
101.3 |
|
|
Restricted cash |
|
|
11.4 |
|
|
|
12.0 |
|
|
Lease receivable |
|
|
2.8 |
|
|
|
6.3 |
|
|
Deposits and advances |
|
|
6.2 |
|
|
|
5.2 |
|
|
Other |
|
|
16.4 |
|
|
|
9.7 |
|
|
Total Other Assets |
|
$ |
107.5 |
|
|
$ |
211.7 |
|
Equity investments
In January 2015, the Company entered into an exclusive agreement with commercial-stage diagnostics company Quotient Limited (“Quotient”) to distribute and sell Quotient’s transfusion diagnostics platform MosaiQ™. See further discussion of the Quotient relationship in Note 13—Collaborations and Other Relationships. Simultaneous with the establishment of the Distribution and Supply Agreement, the Company invested $25.0 million in Quotient consisting of (i) 444,445 common shares with a fair value of $5.8 million and (ii) 666,665 cumulative redeemable preferred shares carrying a 7% annual dividend with a fair value of $11.7 million and a redemption value of $15.0 million. As of January 3, 2021, the investment in common shares represented approximately 0.4% of outstanding Quotient shares.
Indemnity receivables
The Acquisition Agreement included indemnification provisions with respect to certain tax liabilities. The Acquisition Agreement generally provided that Johnson & Johnson retained all income tax liabilities accrued as of the date of the Acquisition, including reserves for unrecognized tax benefits.
F-23
Ortho Clinical Diagnostics Holdings plc (formerly known as Ortho-Clinical Diagnostics Bermuda Co. Ltd.)
Notes to Consolidated Financial Statements
January 3, 2021
(Dollars in millions, unless otherwise stated)
As of January 3, 2021 and December 29, 2019, the components of borrowings were:
|
|
|
January 3, 2021 |
|
|
December 29, 2019 |
|
||
|
Senior Secured Credit Facilities |
|
|
|
|
|
|
|
|
|
Dollar Term Loan Facility |
|
$ |
2,185.5 |
|
|
$ |
2,243.6 |
|
|
Euro Term Loan Facility |
|
|
408.9 |
|
|
$ |
— |
|
|
Revolving Credit Facility |
|
|
— |
|
|
|
— |
|
|
2028 Notes |
|
|
675.0 |
|
|
|
— |
|
|
2025 Notes |
|
|
400.0 |
|
|
|
— |
|
|
2022 Notes |
|
|
— |
|
|
|
1,300.0 |
|
|
Accounts Receivable Financing |
|
|
75.0 |
|
|
|
75.0 |
|
|
Sale and Leaseback Financing |
|
|
20.5 |
|
|
|
20.5 |
|
|
Capital lease obligation |
|
|
1.0 |
|
|
|
2.6 |
|
|
Other short-term borrowings |
|
|
0.9 |
|
|
|
1.0 |
|
|
Other long-term borrowings |
|
|
3.9 |
|
|
|
4.6 |
|
|
Unamortized deferred financing costs |
|
|
(40.9 |
) |
|
|
(34.6 |
) |
|
Unamortized original issue discount |
|
|
(11.3 |
) |
|
|
(13.6 |
) |
|
Total borrowings |
|
|
3,718.5 |
|
|
|
3,599.1 |
|
|
Less: Current portion |
|
|
(160.0 |
) |
|
|
(156.7 |
) |
|
Long-term borrowings |
|
$ |
3,558.5 |
|
|
$ |
3,442.4 |
|
Senior secured credit facilities
On June 30, 2014, LuxCo, as “Lux Borrower”, and its indirect wholly owned subsidiary, Ortho U.S., as “U.S. Borrower,” entered into the Senior Secured Credit Facilities comprising a $2,175.0 million senior secured U.S. dollar denominated term loan (the “Term Loan”) and a $350.0 million senior secured multi-currency revolving facility (the “Revolving Credit Facility”).
On June 6, 2017, the Company amended the credit agreement governing its Senior Secured Credit Facilities to, among other amendments, provide for an additional loan of $200.0 million (the “Incremental Term Loan”). This was accounted for as a modification of the Company’s existing indebtedness. The net proceeds of approximately $197.6 million were used primarily to reduce the outstanding borrowings on the Company’s existing Revolving Credit Facility and for general corporate purposes.
On June 8, 2018, the Company entered into a second amendment of its Senior Secured Credit Facilities (“the Second Amendment”). The amended Senior Secured Credit Facilities refinanced the existing Term Loan, increased the Term Loan balance to $2,325.0 million and extended the maturity date from June 30, 2021 to June 30, 2025. The amendment also extended the maturity of the Revolving Credit Facility from June 30, 2021 to June 30, 2023. Certain terms of the financial covenant were also amended. In addition, the amendment also lowered the applicable interest rates on the Term Loan and Revolving Credit Facility.
The Company accounted for the portion of lenders whose participation in the Senior Secured Credit Facilities terminated on June 8, 2018 as an extinguishment of debt. The remaining lenders that continued their participation in the Term Loan and the extension of the Revolving Credit Facility was accounted for as a modification of the Company’s existing indebtedness. During the fiscal year ended December 30, 2018, the Company recorded a $2.1 million loss on extinguishment of debt included as a component of “Other expense (income), net”, primarily related to unamortized debt issuance costs and investor discount costs. During the fiscal year ended December 30, 2018, the Company expensed $18.5 million of debt refinancing costs, included in “Other operating expense, net” in the Consolidated statements of operations.
On January 7, 2020, the Company entered into a third amendment of its Senior Secured Credit Facilities, which amended the financial covenant contained in the credit agreement governing such Senior Secured Credit Facilities. After giving effect to the amendment, the financial covenant is tested when borrowings under the Revolving Credit Facility exceed $105 million at any period end reporting date and provides that Holdings will not permit the First Lien Net Leverage Ratio as of the end of such fiscal quarter of the Lux Borrower and its Restricted Subsidiaries to be greater than (i) 6.00:1.00 for each fiscal quarter ending after the Third Amendment
F-24
Ortho Clinical Diagnostics Holdings plc (formerly known as Ortho-Clinical Diagnostics Bermuda Co. Ltd.)
Notes to Consolidated Financial Statements
January 3, 2021
(Dollars in millions, unless otherwise stated)
Effective Date and on or prior to June 30, 2021, (ii) 5.50:1.00 for each fiscal quarter ending after June 30, 2021 and on or prior to September 30, 2022 and (iii) 5.00:1:00 for each fiscal quarter ending thereafter.
On January 27, 2020, the Company entered into a fourth amendment of its Senior Secured Credit Facilities, where the Company entered into a Euro-denominated senior secured term loan facility in an amount equal to the Euro-equivalent of $375 million, which bears interest at a rate of Euribor + 350 basis points per annum. The Euro Term Loan Facility will mature on June 30, 2025. The Euro Term Loan Facility is being amortized in equal quarterly installments in an amount equal to 1.00% per annum of the original aggregate principal amount thereof, with the remaining balance due at final maturity. The Company incurred deferred financing costs of $5.4 million related to the Euro Term Loan Facility, which were capitalized as deferred financing costs and are being amortized using the effective interest method as a component of interest expense over the life of the Euro Term Loan Facility. As of January 3, 2021, the remaining balance of deferred financing costs related to the Euro Term Loan Facility was $4.6 million.
Costs of $57.5 million related to the issuance of the Term Loan are recorded as a reduction of the principal amount of the borrowings and are being amortized using the effective interest method as a component of interest expense over the life of the Senior Secured Credit Facilities. As of January 3, 2021 and December 29, 2019, the remaining balance of deferred financing costs related to the Term Loan was $17.3 million and $20.9 million, respectively.
Costs of $9.2 million related to the establishment of the Revolving Credit Facility are recorded as “Other assets” and are being amortized on a straight-line basis over the term of the Revolving Credit Facility. Costs of $0.5 million related to the First Amendment of the Revolving Credit Facility were recorded as “Other assets” and are being amortized on a straight-line basis over the term of the amended Revolving Credit Facility. The Company also incurred lender fees and third-party fees of $5.0 million related to the Second Amendment of the Revolving Credit Facility, which was included in “Other assets” and are being amortized on a straight-line basis over the term of the amended Revolving Credit Facility. As of January 3, 2021 and December 29, 2019, the remaining unamortized balance related to the Revolving Credit Facility was $3.4 million and $4.8 million, respectively. The effective interest rate of the Term Loan as of January 3, 2021 is 5.65%.
Original issue discount of $21.8 million related to the Senior Secured Credit Facilities is recorded as a reduction of the principal amount of the borrowings and is amortized using the effective interest method as a component of interest expense over the life of the Senior Secured Credit Facilities. Costs of $1.9 million related to the Incremental Term Loan reduced the principal amount of the borrowings, and are being amortized using the effective interest method as a component of interest expense over the life of the Senior Secured Credit Facilities. The Company incurred original issue discount costs of $5.8 million related to the Second Amendment of the Term Loan, which were capitalized are being amortized using the effective interest method as a component of interest expense over the life of the Term Loan. As of January 3, 2021 and December 29, 2019, the remaining unamortized balance was $11.3 million and $13.4, respectively.
As of January 3, 2021, there was no outstanding balance under the Revolving Credit Facility and letters of credit issued under the Revolving Credit Facility totaled $37.5 million, which reduced the availability under the Revolving Credit Facility to $312.5 million. The Senior Secured Credit Facilities are subject to various covenants that may restrict the Company’s ability to borrow on available credit facilities and future financing arrangements or require the Company to remain below a specific credit coverage threshold as indicated in our debt agreements.
On February 5, 2021 and February 9, 2021, the Company used a portion of the proceeds from its IPO to repay $706.6 million and $186.1 million, respectively, of borrowings under the Dollar Term Loan Facility. In aggregate, the Company repaid $892.7 million of borrowings under the Dollar Term Loan Facility.
On February 5, 2021, the Company entered into a fifth amendment of its Senior Secured Credit Facilities, which increased the Revolving Credit Facility contained in the credit agreement by $150 million to an aggregate amount of $500 million and extended the maturity date to February 5, 2026, provided that such date may be accelerated subject to certain circumstances as set forth in the fifth amendment. To the extent that the aggregate principal amount of the Dollar Term Loan Facility and Euro Term Loan Facility (and any Refinancing Indebtedness with respect thereto that matures on or prior to June 30, 2025) outstanding as of March 31, 2025 exceeds $500,000,000 then the Maturity Date with respect to the Revolving Credit Facility shall be March 31, 2025. All other terms of the Senior Secured Credit Facilities will remain substantially the same except as otherwise amended by the fifth amendment.
F-25
Ortho Clinical Diagnostics Holdings plc (formerly known as Ortho-Clinical Diagnostics Bermuda Co. Ltd.)
Notes to Consolidated Financial Statements
January 3, 2021
(Dollars in millions, unless otherwise stated)
Significant terms of the senior secured credit facilities
The following table provides an overview of the significant terms of the Senior Secured Credit Facilities as of January 3, 2021:
|
Borrowers: |
Ortho-Clinical Diagnostics S.A., as “Lux Borrower”, and Ortho-Clinical Diagnostics, Inc., as “U.S. Borrower” |
|
Facilities: |
Term Loan Facility: $2,325.0 million
Revolving Credit Facility: $350.0 million (multi-currency sublimit of $150.0 million and letter of credit sublimit of $100.0 million) |
|
Incremental Facility Amount: |
An aggregate of (i) $375.0 million of incremental term or revolving facilities plus (ii) an unlimited amount so long as on a pro-forma basis First Lien Leverage Ratio (as defined in the Senior Secured Credit Facilities) does not exceed 4.00:1.00 |
|
Guarantors: |
Ortho-Clinical Diagnostics Holdings Luxembourg S.à r.l. (“Holdings”), the direct subsidiary of the Company, and each of Holdings’ current and future Restricted Subsidiaries (as defined in the Senior
Secured Credit Facilities) (subject to local law and certain other exceptions) |
|
Security: |
First priority lien on substantially all tangible and intangible assets of Holdings and each subsidiary guarantor (subject to certain exceptions) |
|
Term (Maturity Date): |
Term Loan : June 30, 2025 Revolving Credit Facility: February 5, 2026 |
|
Interest on Euro- currency Rate Loans |
In the case of Eurocurrency Rate Loans (as defined in the Senior Secured Credit Facilities), the Adjusted Eurocurrency Rate (as defined in the Senior Secured Credit Facilities) applicable to the currency in which the Eurocurrency Rate Loan is incurred which is subject to a floor of 1.00%, plus an applicable rate as follows:
• 3.25% per annum—Term Loan (with step down to 3.00% when First Lien Leverage Ratio is less than or equal to 3.75:1.00)
• 3.00% per annum—Revolver Loans (and Letters of Credit issued thereunder) (with steps down to 2.75% and 2.50% when First Lien Leverage Ratio is less than 3.50:1.00 and 3.00:1.00, respectively)
• Rates with respect to Term Loans shall decrease by 25 basis points after the consummation of a Qualified IPO |
|
Interest on Base Rate Loans |
In the case of Base Rate Loans (as defined in the Senior Secured Credit Facilities), the greater of (i) the Federal Funds Rate effective from time to time plus 1/2 of 1%, (ii) the agent’s Prime Lending Rate (as defined in the Senior Secured Credit Facilities) in effect from time to time, (iii) the Adjusted Eurocurrency Rate (as defined in the Senior Secured Credit Facilities) for Eurocurrency Rate Loans denominated in US dollars plus 1% and (iv) 2.00%; plus an applicable rate as follows:
• 2.25% per annum—Term Loan (with step down to 2.00% when First Lien Leverage Ratio is less than or equal to 3.75:1.00)
• 2.00% per annum—Revolver Loans (and Letters of Credit issued thereunder) (with step downs to 1.75% and 1.50% when First Lien Leverage Ratio is less than 3.50:1.00 and 3.00:1.00, respectively)
• Rates with respect to Term Loans shall decrease by 25 basis points after the consummation of a Qualified IPO |
|
Fees: |
Unused Revolving Credit Facility Commitment Fee: 0.50% per annum (with a step down to 0.375% when the First Lien Net Leverage Ratio is less than 2.50:1.00) |
F-26
Ortho Clinical Diagnostics Holdings plc (formerly known as Ortho-Clinical Diagnostics Bermuda Co. Ltd.)
Notes to Consolidated Financial Statements
January 3, 2021
(Dollars in millions, unless otherwise stated)
|
Term Loan: 1.00% of initial principal amount on the last business day of fiscal quarter ending September 30, 2018 0.50% of initial principal amount on the last business day of each fiscal quarter through December 31, 2019 0.625% of initial principal amount on the last business day of each fiscal quarter through June 30, 2025 |
|
|
Optional Prepayments: |
Indebtedness under the Senior Secured Credit Facilities may be voluntarily prepaid in whole or in part, in minimum amounts, subject to make whole provisions set forth in the Senior Secured Credit Facilities |
|
Mandatory Prepayments: |
• 100% of net cash proceeds of asset sales in excess of $10.0 million or $25.0 million in any fiscal year, subject to reinvestment rights
• 100% of debt issuances (not otherwise permitted by the Senior Secured Credit Facilities)
• 50% of Excess Cash Flow (as defined in the Senior Secured Credit Facilities) with step downs to 25% and 0% when First Lien Leverage Ratio is less than 3.00:1.00 and 2.50:1.00, respectively |
|
Financial Covenants: |
The Company must maintain a Maximum First Lien Leverage Ratio of 5.00:1.00 for each fiscal quarter, if more than 30% of the Revolving Credit Facility (including letters of credit) is outstanding at the end of a fiscal quarter. On January 7, 2020, the Maximum First Lien Leverage Ratio was amended to (i) 6.00:1.00 for each fiscal quarter ending after the Third Amendment Effective Date and on or prior to June 30, 2021, (ii) 5.50:1.00 for each fiscal quarter ending after June 30, 2021 and on or prior to September 30, 2022 and (iii) 5.00:1:00 for each fiscal quarter ending thereafter.
Maximum First Lien leverage Ratio is calculated using consolidated funded first lien indebtedness (as defined in the Senior Secured Credit Facilities) of the Borrower Parties for such period divided by consolidated EBITDA (as defined in the Senior Secured Credit Facilities) of the Borrower Parties for the four fiscal quarter period most recently then ended for which financial statements have been delivered. |
|
Negative Covenants: |
The Senior Secured Credit Facilities include certain negative covenants restricting or limiting the ability of the borrowers and their material subsidiaries to, among other things: declare dividends; repurchase equity interests of the parent or other restricted payments; prepay subordinated debt; make loans, acquisitions, capital contributions and other investments; engage in mergers, consolidations, liquidations and dissolutions; sell assets; incur additional debt; incur liens on property; dispose of assets; and enter into transactions with affiliates. |
2025 Notes
On June 11, 2020, the Lux Borrower, as “Lux Issuer,” and Ortho U.S., as “U.S. Issuer” (collectively, the “Issuers”), issued $400 million aggregate principal amount of the 2025 Notes, which bear interest at a rate of 7.375% per annum, payable semi-annually in arrears on June 1 and December 1 of each year, commencing December 1, 2020. The 2025 Notes will mature on June 1, 2025. The 2025 Notes are the Issuers’ senior unsecured obligations and the 2025 Notes and the guarantees thereof rank equally in right of payment with all of the Issuers’ and guarantors’ existing and future senior debt, including the 2028 Notes. The 2025 Notes and the guarantees thereof are effectively subordinated to any of the Issuers’ and guarantors’ existing and future secured debt, including the Senior Secured Credit Facilities and the Financing Program, to the extent of the value of the assets securing such debt. In addition, the 2025 Notes and the guarantees thereof rank senior in right of payment to all of the Issuers’ and guarantors’ future subordinated debt and will be structurally subordinated to the liabilities of the Issuers’ non-guarantor subsidiaries. The Company incurred deferred financing costs of $7.5 million related to the 2025 Notes, which were capitalized as deferred financing costs and are being amortized using the effective interest method as a component of interest expense over the life of the 2025 Notes. As of January 3, 2021, the remaining unamortized balance was $7.0 million. The effective interest rate on the Notes is 8.03%.
F-27
Ortho Clinical Diagnostics Holdings plc (formerly known as Ortho-Clinical Diagnostics Bermuda Co. Ltd.)
Notes to Consolidated Financial Statements
January 3, 2021
(Dollars in millions, unless otherwise stated)
On or after June 1, 2022, the Issuers have the option to redeem all or part of the 2025 Notes at the following redemption prices (expressed as percentages of principal amount):
|
Year |
Price |
|
|
|
2022 |
|
103.688 |
% |
|
2023 |
|
101.844 |
% |
|
2024 and thereafter |
|
100.000 |
% |
Notwithstanding the foregoing, at any time and from time to time prior to June 1, 2022, the Issuers may at their option redeem in the aggregate up to 100% of the original aggregate principal amount of the 2025 Notes plus accrued and unpaid interest, if any to, but not including, the date of redemption, plus a “make-whole premium”. The Issuers may also, at their option, redeem up to 40% of the principal amount of the 2025 Notes with the net cash proceeds of certain equity offerings at a redemption price of 107.375% of the principal amount of the 2025 Notes redeemed, plus accrued and unpaid interest, if any, to, but not including, the date of redemption.
On February 5, 2021, the Company used a portion of the proceeds from its IPO to redeem $160 million aggregate principal amount of the 2025 Notes, plus accrued interest thereon and $11.8 million of redemption premium.
2028 Notes
On January 27, 2020, the Issuers, issued $675 million aggregate principal amount of the 2028 Notes, which bear interest at a rate of 7.250% per annum, payable semi-annually in arrears on February 1 and August 1 of each year, commencing August 1, 2020. The 2028 Notes will mature on February 1, 2028. The 2028 Notes are the Issuers’ senior unsecured obligations and the 2028 Notes and the guarantees thereof rank equally in right of payment with all of the Issuers’ and guarantors’ existing and future senior debt, including the 2025 Notes. The 2028 Notes and the guarantees thereof are effectively subordinated to any of the Issuers’ and guarantors’ existing and future secured debt, including the Senior Secured Credit Facilities and the Financing Program, to the extent of the value of the assets securing such debt. In addition, the 2028 Notes and the guarantees thereof rank senior in right of payment to all of the Issuers’ and guarantors’ future subordinated debt and will be structurally subordinated to the liabilities of the Issuers’ non-guarantor subsidiaries. The Company incurred deferred financing costs of $12.9 million related to the 2028 Notes, which were capitalized as deferred financing costs and are being amortized using the effective interest method as a component of interest expense over the life of the 2028 Notes. As of January 3, 2021, the remaining unamortized balance was $11.8 million. The effective interest rate on the Notes is 7.76%.
On or after February 1, 2023, the Issuers have the option to redeem all or part of the 2028 Notes at the following redemption prices (expressed as percentages of principal amount):
|
Year |
Price |
|
|
|
2023 |
|
103.625 |
% |
|
2024 |
|
101.813 |
% |
|
2025 and thereafter |
|
100.000 |
% |
Notwithstanding the foregoing, at any time and from time to time prior to February 1, 2023, the Issuers may at their option redeem in the aggregate up to 100% of the original aggregate principal amount of the 2028 Notes plus accrued and unpaid interest, if any to, but not including, the date of redemption, plus a “make-whole premium”. The Issuers may also, at their option, redeem up to 40% of the principal amount of the 2028 Notes with the net cash proceeds of certain equity offerings at a redemption price of 107.25% of the principal amount of the 2028 Notes redeemed, plus accrued and unpaid interest, if any, to, but not including, the date of redemption.
Concurrent with the issuance of the $675 million aggregate principal amount of 2028 Notes, the Company entered into U.S. Dollar to Japanese Yen cross currency swaps for a total notional amount of $350 million at a weighted average interest rate of 5.56%, with a five-year term in order to lower interest expense on the 2028 Notes.
On February 5, 2021, the Company used a portion of the proceeds from its IPO to redeem $270 million aggregate principal amount of the 2028 Notes, plus accrued interest thereon and $19.6 million of redemption premium.
F-28
Ortho Clinical Diagnostics Holdings plc (formerly known as Ortho-Clinical Diagnostics Bermuda Co. Ltd.)
Notes to Consolidated Financial Statements
January 3, 2021
(Dollars in millions, unless otherwise stated)
2022 Notes
On May 16, 2014, Lux Borrower, as “Lux Issuer”, and Ortho U.S, as “US Issuer” (collectively the “Issuers”), issued the Notes and related guarantees thereof and the proceeds were placed into escrow. On the Day 1 Closing Date, the proceeds of the Notes were released from escrow and, together with the Equity Contribution and the proceeds from borrowings under the Term Loan Facility, were used to fund the Acquisition. The Notes were sold at par and are due May 15, 2022. The Notes bear interest at 6.625% and interest is payable semi-annually on May 15 and November 15. Costs related to the issuance of the Notes of $36.8 million are recorded as a reduction of the principal amount of the borrowings and are amortized using the effective interest rate method as a component of interest expense over the life of the Notes.
On January 28, 2020, the Company used the net proceeds from the issuance of the Euro Term Loan Facility and 2028 Notes, after payment of fees and expenses, to fund the redemption and discharge of $1.0 billion of the 2022 Notes. On June 12, 2020 the Company used the net proceeds from the issuance of the 2025 Notes, after payments of fees and expenses, to fund the redemption and discharge of the remaining $300 million of 2022 Notes. The redemption of the 2022 Notes was accounted for as an extinguishment of debt. During the fiscal year ended January 3, 2021, the Company recorded a $12.6 million loss on extinguishment of debt, primarily related to the unamortized deferred financings costs on the redeemed 2022 Notes, included as a component of other expense, net. As of December 29, 2019, the remaining unamortized balance of the deferred financing cost was $13.4 million.
Sale and leaseback financing
In June 2016, the Company entered into a sale-leaseback financing arrangement with a third-party financing company (Buyer-lessor) related to specific property and equipment of the Company. The property and equipment were sold for $36.3 million and leased back over an initial term of two years. The monthly lease payments are $1.5 million until the equipment is repurchased or the lease is terminated. At the end of the initial term, the Company can repurchase the property and equipment at a price to be negotiated with the Buyer-lessor or terminate the lease arrangement, return the property and (possibly) enter into a new lease agreement. During the fiscal second quarter ended July 1, 2018, Ortho gave notice to the Buyer-lessor that it intends to negotiate with the Buyer-lessor the purchase of the property and equipment at the end of the initial term and have had discussions on negotiating the repurchase price for the property and equipment. According to the wording of the agreement and subject to certain legal interpretations, if the parties do not reach an agreement to purchase the property and equipment at the end of the initial term, the lease will automatically renew for another year, afterwards the lease will automatically be renewed for successive 6-month periods, provided that each of the Company and the Buyer-lessor have a right to terminate the lease 30 days prior to the end of each 6-month renewal period. A security deposit for the leaseback was retained by the third-party financing company and will be refunded to the Company at the end of the lease term. The balance of the security deposit was $9.1 million and $9.1 million as of January 3, 2021 and December 29, 2019, respectively, and was included in other current assets in the consolidated balance sheet. The transaction did not meet the criteria for sale-leaseback accounting as the security deposit constitutes a continuing involvement. Therefore, the Company is accounting for this arrangement as a financing over 42 months and recorded a financing obligation amounting to $36.3 million at inception. As a result of the Company’s adoption of ASC Topic 842 on December 31, 2018, the Company reassessed its accounting treatment of this arrangement and concluded that this arrangement continues to be recorded as a financing obligation.
On February 9, 2021, the Company and the Buyer-lessor agreed on a negotiated price of $21.0 million for the property and equipment, net of the security deposit.
Accounts receivable financing
In September 2016, the Company entered into a three-year accounts receivable financing program (the “Financing Program”) with a financial institution. The Financing Program is secured by receivables from the Ortho U.S. business that are sold or contributed to a wholly-owned, consolidated, bankruptcy remote subsidiary. The bankruptcy remote subsidiary’s sole business consists of the purchase or receipt of the receivables and subsequent granting of a security interest to the financial institution under the program, and its assets are available first to satisfy obligations and are not available to pay creditors of the Company’s other legal entities. Under the Financing Program, the Company may borrow up to the lower of $75 million or 85% of the accounts receivable borrowing base.
At January 3, 2021, the accounts receivable borrowing base was $81.4 million. Interest on outstanding borrowing under the Financing Program is charged based on a per annum rate equal to LIBOR Rate (with a floor of zero percent and as defined in the
F-29
Ortho Clinical Diagnostics Holdings plc (formerly known as Ortho-Clinical Diagnostics Bermuda Co. Ltd.)
Notes to Consolidated Financial Statements
January 3, 2021
(Dollars in millions, unless otherwise stated)
agreement) plus the LIBOR Rate Margin (2.25 percentage points) if the related loan is a LIBOR Rate Loan. Otherwise, the per annum rate is equal to a Base Rate (as defined in the agreement) plus the Base Rate Margin (1.25 percentage points). Interest is due and payable, in arrears, on the first day of each month. The Financing Program is also subject to termination under standard events of default as defined. Costs related to the Financing Program of $1.0 million are recorded as a reduction of the principal amount of the borrowings and are amortized using the effective interest method as a component of interest expense over the life of the Financing Program. The remaining unamortized balance was $0.2 million and $0.3 million as of January 3, 2021 and December 29, 2019, respectively. Outstanding borrowings under the Financing program bore interest at 2.77% and 2.77% per annum as of January 3, 2021 and December 29, 2019, respectively.
In addition to customary representations, warranties and affirmative and negative covenants, the program is subject to interest coverage and minimum liquidity covenants. As of January 3, 2021, the Company was in full compliance with all debt covenant requirements.
On January 24, 2019, the Company extended the maturity of the Financing Program from September 23, 2019 to January 24, 2022. In addition, the Company amended its Financing Program terms to increase availability under the terms of the program within the existing $75 million limit of the agreement.
Capital lease obligation
During the fiscal year ended January 3, 2016, the Company relocated its U.S. distribution operations from a Johnson & Johnson facility to a new location. In connection with the new distribution facility, the Company entered into a capital lease with an initial obligation of $9.7 million. The capital lease is payable in monthly payments of $0.2 million over 60 months.
Interest expense, net
The following table provides the detail of interest expense, net for the fiscal years ended January 3, 2021, December 29, 2019 and December 30, 2018.
|
|
|
Fiscal year ended |
|
|||||||||
|
|
|
January 3, 2021 |
|
|
December 29, 2019 |
|
|
December 30, 2018 |
|
|||
|
Interest expense: |
|
|
|
|
|
|
|
|
|
|
|
|
|
Dollar Term Loan Facility |
|
$ |
89.0 |
|
|
$ |
128.6 |
|
|
$ |
127.6 |
|
|
Euro Term Loan Facility |
|
|
12.7 |
|
|
|
— |
|
|
|
— |
|
|
Revolving Credit Facility |
|
|
3.7 |
|
|
|
4.2 |
|
|
|
6.6 |
|
|
2028 Notes |
|
|
45.8 |
|
|
|
— |
|
|
|
— |
|
|
2025 Notes |
|
|
16.6 |
|
|
|
— |
|
|
|
— |
|
|
2022 Notes |
|
|
14.1 |
|
|
|
85.9 |
|
|
|
86.1 |
|
|
Accounts receivable financing |
|
|
5.0 |
|
|
|
5.5 |
|
|
|
3.1 |
|
|
Amortization of: |
|
|
|
|
|
|
|
|
|
|
|
|
|
Deferred financing costs |
|
|
8.4 |
|
|
|
10.1 |
|
|
|
12.0 |
|
|
Original issue discount |
|
|
2.3 |
|
|
|
2.3 |
|
|
|
2.8 |
|
|
Capital lease obligation and other |
|
|
1.9 |
|
|
|
2.9 |
|
|
|
6.6 |
|
|
Derivative instruments |
|
|
(1.3 |
) |
|
|
(8.0 |
) |
|
|
(8.9 |
) |
|
Less: Capitalized interest |
|
|
— |
|
|
|
(0.1 |
) |
|
|
(0.3 |
) |
|
Interest expense, net |
|
$ |
198.2 |
|
|
$ |
231.4 |
|
|
$ |
235.6 |
|
F-30
Ortho Clinical Diagnostics Holdings plc (formerly known as Ortho-Clinical Diagnostics Bermuda Co. Ltd.)
Notes to Consolidated Financial Statements
January 3, 2021
(Dollars in millions, unless otherwise stated)
The following table provides a schedule of required future repayments of all borrowings outstanding on January 3, 2021.
|
2021 |
|
$ |
160.1 |
|
|
2022 |
|
|
63.2 |
|
|
2023 |
|
|
62.8 |
|
|
2024 |
|
|
62.5 |
|
|
2025 |
|
|
2,347.0 |
|
|
Thereafter(1) |
|
|
1,075.0 |
|
|
|
|
$ |
3,770.6 |
|
|
|
(1) |
Does not include subsequent use of IPO proceeds for repayment of $892.7 million for the Dollar Term Loan Facility, $160.0 million for the 2025 Notes and $270 million for the 2028 Notes. |
Interest paid during the fiscal years ended January 3, 2021, December 29, 2019 and December 30, 2018 was $191.8 million, $189.7 million and $218.8 million, respectively.
|
(10) |
Leases |
Lessee
The Company has operating leases for office space, warehouse and manufacturing space, vehicles and certain equipment. Leases with an initial term of 12 months or less are generally not recorded on the balance sheet and expense for these leases is recognized on a straight-line basis over the lease term. For leases executed in fiscal 2019 and later, the Company accounts for the lease components and the non-lease components as a single lease component with the exception for the third-party logistics arrangements. The Company’s leases have remaining lease terms of one year to approximately 18 years, some of which may include options to extend the leases for up to 5 years and some include options to terminate early. These options have been included in the determination of the lease liability when it is reasonably certain that the option will be exercised. The Company does not have any leases that include residual value guarantees.
The Company evaluates contracts at inception to determine whether they contain a lease, where the Company obtains the right to control an identified asset. The right-of-use assets and related liabilities for operating leases are included in other assets, accrued expenses, and other long-term liabilities in the consolidated balance sheets.
Right-of-use assets represent the Company’s right to use an underlying asset for the lease term and lease liabilities represent the Company’s obligation to make lease payments arising from the lease contract. Operating lease liabilities and their corresponding right-of-use assets are recorded based on the present value of fixed lease payments over the expected lease term. The interest rate implicit in lease contracts is typically not readily determinable. As such, the Company utilizes the appropriate incremental borrowing rate, which is the rate incurred to borrow on a collateralized basis over a similar term at an amount equal to the lease payments in a similar economic environment. The weighted average discount rate utilized on the Company’s operating and finance lease liabilities as of January 3, 2021 was 9.0%. The following table presents supplemental balance sheet information related to the Company’s operating and finance leases.
The components of lease cost for the year ended January 3, 2021 and December 29, 2019 were:
|
(in millions) |
|
January 3, 2021 |
|
December 29, 2019 |
|
||
|
Operating lease cost |
|
$ |
20.3 |
|
$ |
22.2 |
|
|
Finance lease cost: |
|
|
|
|
|
|
|
|
Amortization of right-of-use assets |
|
|
1.1 |
|
|
2.1 |
|
|
Interest on lease liabilities |
|
|
0.2 |
|
|
0.4 |
|
|
Variable lease cost |
|
|
0.5 |
|
|
2.0 |
|
|
Lease cost |
|
$ |
22.1 |
|
$ |
26.7 |
|
F-31
Ortho Clinical Diagnostics Holdings plc (formerly known as Ortho-Clinical Diagnostics Bermuda Co. Ltd.)
Notes to Consolidated Financial Statements
January 3, 2021
(Dollars in millions, unless otherwise stated)
The following table contains supplemental cash flow information related to leases for the year ended January 3, 2021 and December 29, 2019:
|
(in millions) |
|
January 3, 2021 |
|
December 29, 2019 |
|
||
|
Cash paid for amounts included in the measurement of lease liabilities: |
|
|
|
|
|
|
|
|
Net operating cash flows from operating leases |
|
$ |
20.8 |
|
$ |
24.2 |
|
|
Net operating cash flows from finance leases |
|
|
0.2 |
|
|
0.4 |
|
|
Net financing cash flows from finance leases |
|
|
1.4 |
|
|
2.3 |
|
|
Right-of-use operating lease assets obtained in exchange for lease obligations |
|
|
6.6 |
|
|
12.8 |
|
There were no material lease transactions that we entered into but have not yet commenced as of January 3, 2021.
Supplemental balance sheet information related to leases as of January 3, 2021 and December 29, 2019 includes:
|
(in millions) |
|
January 3, 2021 |
|
December 29, 2019 |
|
||
|
Operating leases ROU assets |
|
|
|
|
|
|
|
|
Other assets |
|
$ |
26.7 |
|
$ |
40.3 |
|
|
Operating lease liabilities |
|
|
|
|
|
|
|
|
Accrued liabilities |
|
$ |
15.1 |
|
$ |
16.3 |
|
|
Other liabilities |
|
|
12.2 |
|
|
24.6 |
|
|
Total operating lease liabilities |
|
$ |
27.3 |
|
$ |
40.9 |
|
|
Finance leases ROU assets |
|
|
|
|
|
|
|
|
Property, plant and equipment, at cost |
|
$ |
11.2 |
|
$ |
11.0 |
|
|
Accumulated depreciation |
|
|
(10.2 |
) |
|
(8.8 |
) |
|
Property, plant and equipment, net |
|
$ |
1.0 |
|
$ |
2.2 |
|
|
Finance lease liabilities |
|
|
|
|
|
|
|
|
Current portion of borrowings |
|
$ |
0.3 |
|
$ |
1.3 |
|
|
Long-term borrowings |
|
|
0.7 |
|
|
1.3 |
|
|
Total finance lease liabilities |
|
$ |
1.0 |
|
$ |
2.6 |
|
Lease term and discount rates as of January 3, 2021 and December 29, 2019 were:
|
|
|
January 3, 2021 |
|
December 29, 2019 |
|
||
|
Weighted-average remaining lease term (years) |
|
|
|
|
|
|
|
|
Operating leases |
|
|
2.9 |
|
|
3.1 |
|
|
Finance leases |
|
|
3.5 |
|
|
2.9 |
|
|
Weighted-average discount rate |
|
|
|
|
|
|
|
|
Operating leases |
|
|
8.7 |
% |
|
9.2 |
% |
|
Finance leases |
|
|
16.8 |
% |
|
13.0 |
% |
F-32
Ortho Clinical Diagnostics Holdings plc (formerly known as Ortho-Clinical Diagnostics Bermuda Co. Ltd.)
Notes to Consolidated Financial Statements
January 3, 2021
(Dollars in millions, unless otherwise stated)
Maturities of operating and finance lease liabilities as of January 3, 2021 were:
|
|
|
Finance leases |
|
|
Operating leases |
|
||
|
2021 |
|
$ |
0.4 |
|
|
$ |
16.3 |
|
|
2022 |
|
|
0.3 |
|
|
|
6.9 |
|
|
2023 |
|
|
0.3 |
|
|
|
3.1 |
|
|
2024 |
|
|
0.2 |
|
|
|
1.2 |
|
|
2025 |
|
|
— |
|
|
|
0.4 |
|
|
Thereafter |
|
|
— |
|
|
|
2.0 |
|
|
Total minimum lease payments |
|
$ |
1.2 |
|
|
$ |
29.9 |
|
|
Less: imputed interest |
|
|
0.2 |
|
|
|
2.6 |
|
|
Present value of lease liabilities |
|
$ |
1.0 |
|
|
$ |
27.3 |
|
For the years ended December 29, 2019 and December 30, 2018, rent expense was $22.2 million and $20.8 million, respectively.
Lessor
Certain assets, primarily diagnostics instruments, are leased to customers under contractual arrangements that typically include an operating or sales-type lease as well as performance obligations for reagents and other consumables. These contractual arrangements are subject to termination provisions which are evaluated in determining the lease term for lease accounting purposes. Sales-type leases are not significant. Contract terms vary by customer and may include options to terminate the contract or options to extend the contract. Where instruments are provided under operating lease arrangements, some portion or the entire lease revenue may be variable and subject to subsequent non-lease component (e.g., reagent) sales. The allocation of revenue between the lease and non-lease components is based on stand-alone selling prices. Variable lease revenue and fixed lease revenue represented approximately 4% and 1%, respectively, of the Company’s consolidated revenue for the fiscal years ended January 3, 2021 and December 29, 2019.
The Company’s reagent rental agreements may require the customers to commit to making minimum reagent purchases over the lease term, which is typically 5 years. In certain jurisdictions, the Company has concluded that these minimum purchase commitments represent legally enforceable rights pursuant to the lease. If a contract contains a legally enforceable minimum purchase commitment, the minimums are considered in-substance fixed lease payments and the Company will evaluate the probability of collecting the lease payments. If collection is probable, for operating leases, the lease payments will be recognized on a straight-line basis over the lease term. If collection is not probable, for reagent rental agreements classified as operating leases, the lease income recognized by the Company is limited to the lesser of the income that would be recognized on a straight-line basis over the lease term or the lease payments, including variable lease payments, that have been collected from the lessee. In certain other jurisdictions, the Company has concluded that the minimum purchase commitments within the Company’s reagent rental agreements are not legally enforceable and, therefore, the entire contract consideration is concluded to be variable. The Company recognizes the variable payments that relate to the lease component as rental income when the variability is resolved, and the underlying reagent sale occurs.
As of January 3, 2021 and December 29, 2019, the Company’s equipment leased to customers under operating-type leases was:
|
|
|
January 3, 2021 |
|
|
December 29, 2019 |
|
||
|
Customer leased instruments |
|
$ |
727.3 |
|
|
$ |
616.1 |
|
|
Less: Accumulated depreciation |
|
|
(432.8 |
) |
|
|
(342.9 |
) |
|
Total Customer leased instruments, net |
|
$ |
294.5 |
|
|
$ |
273.2 |
|
Depreciation expense related to customer leased instruments was $107.2 million, $103.1 million and $102.0 million for the fiscal years ended January 3, 2021, December 29, 2019 and December 30, 2018, respectively. The depreciation expense related to customer leased instruments is recorded in “Cost of revenue” in the consolidated statements of operations. The depreciation expense related to customer leased instruments is a component of total depreciation expense presented in Note 6 – Property, Plant and Equipment, Net.
F-33
Ortho Clinical Diagnostics Holdings plc (formerly known as Ortho-Clinical Diagnostics Bermuda Co. Ltd.)
Notes to Consolidated Financial Statements
January 3, 2021
(Dollars in millions, unless otherwise stated)
Accrued liabilities included in current liabilities consist of the following:
|
|
|
January 3, 2021 |
|
|
December 29, 2019 |
|
||
|
Accrued compensation and employee-related obligations |
|
$ |
110.5 |
|
|
$ |
96.7 |
|
|
Accrued interest |
|
|
42.2 |
|
|
|
46.1 |
|
|
Income taxes payable |
|
|
4.1 |
|
|
|
37.9 |
|
|
Accrued commissions and rebates |
|
|
24.9 |
|
|
|
18.8 |
|
|
Current portion of operating lease liabilities |
|
|
15.1 |
|
|
|
16.3 |
|
|
Accrued taxes other than income |
|
|
14.3 |
|
|
|
14.2 |
|
|
Derivatives |
|
|
10.3 |
|
|
|
7.6 |
|
|
Other accrued liabilities |
|
|
63.3 |
|
|
|
53.7 |
|
|
Total Accrued Liabilities |
|
$ |
284.7 |
|
|
$ |
291.3 |
|
(12)Restructuring costs
Restructuring costs (credits) for the fiscal years ended January 3, 2021, December 29, 2019 and December 30, 2018, are presented in the consolidated statements of operations in the following captions:
|
|
|
Fiscal year ended |
|
|||||||||
|
|
|
January 3, 2021 |
|
|
December 29, 2019 |
|
|
December 30, 2018 |
|
|||
|
Cost of revenue, excluding amortization of intangible assets |
|
$ |
0.7 |
|
|
$ |
11.7 |
|
|
$ |
32.5 |
|
|
Other operating expense, net |
|
|
(0.6 |
) |
|
|
0.2 |
|
|
|
3.6 |
|
|
Total restructuring costs |
|
$ |
0.1 |
|
|
$ |
11.9 |
|
|
$ |
36.1 |
|
The following table summarizes the activities related to restructuring and related reserves for the fiscal years ended January 3, 2021 and December 29, 2019:
|
|
|
Severance and employee benefits |
|
|
Other |
|
|
Total |
|
|||
|
Balance at December 30, 2018 |
|
$ |
8.1 |
|
|
$ |
1.0 |
|
|
$ |
9.1 |
|
|
Restructuring costs |
|
|
— |
|
|
|
11.9 |
|
|
|
11.9 |
|
|
Payments made |
|
|
(5.7 |
) |
|
|
(3.3 |
) |
|
|
(9.0 |
) |
|
Costs charged against assets |
|
|
— |
|
|
|
(3.6 |
) |
|
|
(3.6 |
) |
|
Balance at December 29, 2019 |
|
$ |
2.4 |
|
|
$ |
6.0 |
|
|
$ |
8.4 |
|
|
Restructuring costs |
|
|
(0.6 |
) |
|
|
0.7 |
|
|
|
0.1 |
|
|
Payments made |
|
|
(1.7 |
) |
|
|
(6.6 |
) |
|
|
(8.3 |
) |
|
Costs charged against assets |
|
|
— |
|
|
|
— |
|
|
|
— |
|
|
Balance at January 3, 2021 |
|
$ |
0.1 |
|
|
$ |
0.1 |
|
|
$ |
0.2 |
|
As of January 3, 2021, the Company has several initiatives intended to strengthen operational performance and to support building capabilities to enable us to win in the marketplace. These restructuring activities to improve operational performance are primarily cost reduction and productivity improvement initiatives in procurement, manufacturing, supply chain and logistics.
During the fiscal year ended January 3, 2016, the Company announced that it will outsource its equipment manufacturing operations in Rochester, New York and refurbishment operations in Neckargemund, Germany to a third-party contract manufacturing company. These initiatives were substantially completed during the fiscal year ended December 29, 2019, with total charges incurred of $75.4 million. The Company made cash payments of $6.5 million during the fiscal year ended January 3, 2021 and has made
F-34
Ortho Clinical Diagnostics Holdings plc (formerly known as Ortho-Clinical Diagnostics Bermuda Co. Ltd.)
Notes to Consolidated Financial Statements
January 3, 2021
(Dollars in millions, unless otherwise stated)
cumulative cash payments of $71.0 million to date, respectively, related to these initiatives. The remaining cash payments, related to severances, of approximately $0.1 million are expected to be made during the fiscal first quarter of 2021.
During the fiscal year ended December 30, 2018, the Company announced that it will transfer certain production lines among facilities in order to achieve operational and cost efficiencies. The Company estimates that the implementation of these initiatives will result in pre-tax charges of approximately $22 million, comprised of approximately $12 million in accelerated depreciation, $5 million in severance charges and $5 million in other facility-related costs. These initiatives are expected to be substantially completed during fiscal 2021, with the majority of cash payments being made by the end of fiscal 2021. The Company incurred $0.1 million and $19.1 million of charges during the fiscal year ended January 3, 2021 and cumulative to date, respectively, related to these initiatives. The Company made cash payments of $1.8 million during the fiscal year ended January 3, 2021 and has made cumulative cash payments of $5.8 million to date, respectively, related to these initiatives.
For the remaining balance as of January 3, 2021, the Company currently estimates payments of $0.1 million will be made over the following twelve months and are included in “Accrued liabilities” in the consolidated balance sheet as of January 3, 2021. The remaining balance of $0.1 million is included in “Other liabilities” in the consolidate balance sheet as of January 3, 2021. The Company has incurred restructuring costs of $0.1 million and $94.6 million during the fiscal year ended January 3, 2021 and cumulative to date, respectively.
|
(13) |
Collaborations and other relationships |
In the normal course of business, the Company has entered into various collaboration arrangements which provide the Company with rights to develop, produce and market products using certain know-how, technology and patent rights maintained by the Company’s collaborative partners. The arrangements are often entered into in order to share risks and rewards related to a specific program or product. The Company’s collaborative arrangements include agreements with respect to transition services and a number of on-going relationships.
Grifols / Novartis Vaccines and Diagnostics, Inc.
In 1989, Ortho Diagnostics Systems Inc. (now Ortho U.S.) and Chiron Corporation (a predecessor in interest to Novartis Vaccines and Diagnostics, Inc. (“Novartis”) entered into a 50-year collaboration arrangement (the “Joint Business”) to pursue income generating opportunities through the development of certain intellectual properties (“IP”). In January 2014, Novartis transferred its interest in the Joint Business to Grifols Diagnostic Solutions, Inc. (“Grifols”). The transfer to Grifols has not altered the existing structure or operations of the Joint Business. The Company’s portion of the pre-tax net profit shared under the Joint Business was $55.6 million, $70.7 million and $68.7 million during the fiscal years ended January 3, 2021, December 29, 2019 and December 30, 2018, respectively.
Quotient limited
In January 2015, the Company entered into an exclusive agreement with Quotient, a commercial-stage diagnostics company, to distribute and sell Quotient’s transfusion diagnostics platform MosaiQ™. Under the terms of a Distribution and Supply Agreement, Quotient is responsible for the development and launch of MosaiQ™, while the Company will leverage its worldwide commercial capabilities to sell the product to customers. The Company has exclusive rights to distribute MosaiQ™ for the global patient testing market (for blood grouping) and the donor testing market in the developing world and Japan (for blood grouping and serological disease screening). Quotient retains all rights to commercialize MosaiQ™ in the developed world (excluding Japan) for the donor testing market. On November 27, 2019, Quotient sent the Company a notice purporting to terminate the Agreement effective December 27, 2019. Under the Agreement, the Company is obligated to make payments to Quotient as certain milestones are achieved in the amount of $59 million.
On December 23, 2019, Ortho and Quotient entered into an agreement under which both parties agreed, while the arbitration was pending, not to enter into any agreement under which Quotient would grant rights to commercialize products that overlap with Ortho’s rights under the agreement without thirty days’ prior written notice to Ortho. Such thirty-day notice gave Ortho the ability to file for injunctive relief had Quotient intended to enter into an agreement with a third party that would have limited Ortho’s bargained for rights under the agreement.
On September 4, 2020, Ortho and Quotient entered into a binding letter agreement (the “Letter Agreement”) pursuant to which the Company and Quotient agreed:
|
|
• |
to confirm the termination of the parties’ prior Distribution and Supply Agreement and various related contracts (the “Prior Quotient Agreement”); |
F-35
Ortho Clinical Diagnostics Holdings plc (formerly known as Ortho-Clinical Diagnostics Bermuda Co. Ltd.)
Notes to Consolidated Financial Statements
January 3, 2021
(Dollars in millions, unless otherwise stated)
|
|
• |
to end the parties’ disputes regarding the Prior Quotient Agreement by executing mutual releases and terminating their pending arbitration proceeding related to the Prior Quotient Agreement; and |
|
|
• |
to negotiate in good faith, and use their respective reasonable best efforts to execute, a new distribution agreement (the “New Distribution Agreement”) based on the terms set forth in the Letter Agreement, but if for any reason no such definitive agreement is reached, the Letter Agreement will govern the parties’ respective rights and obligations as a binding contract. |
Pursuant to the Letter Agreement, the Company made an initial, non-refundable upfront payment of $7.5 million to Quotient on the date of the Letter Agreement, and recorded a corresponding $7.5 million charge to research and development expense for the fiscal year ended January 3, 2021. In addition to the initial $7.5 million upfront payment, Ortho may be required to make up to an additional $60 million of payments upon achievement of certain regulatory milestones and commercial sales benchmarks, which include up to $25 million of payments upon the achievement by Ortho of certain cumulative revenue milestones. The Company does not anticipate making any such payments in fiscal year 2021.
In the Letter Agreement, the Company and Quotient have agreed that the Company will have the right to exclusively distribute in the United States, the European Economic Area, the UK and Switzerland a transfusion diagnostic patient immunohematology microarray (“PIM”), intended for use with Quotient’s MosaiQ Instruments, on which multiple compounds are placed which, when exposed to human blood samples, generate reactions that indicate the presence or absence of certain blood characteristics and antigens and is intended for immuno-hematological testing of the blood of medical patients during the course of their care or treatment.
During the fiscal years ended January 3, 2021, December 29, 2019 and December 30, 2018 the Company recognized $0.3 million, $0.3 million and $0.2 million in sales to Quotient. The Company also purchased inventories from Quotient amounting to $21.1 million, $20.3 million and $11.9 million for the fiscal years ended January 3, 2021, December 29, 2019 and December 30, 2018, respectively.
|
(14) |
Long-term employee benefits |
Defined benefit plans
In connection with the Acquisition, the Company assumed certain defined benefit plan obligations related to employees of non-U.S. subsidiaries and acquired certain related plan assets for current employees of the Company’s subsidiaries.
Other postemployment benefits
In addition to the defined benefit obligations assumed in connection with the Acquisition, on June 30, 2014, the Company implemented a replacement retiree health care reimbursement plan for certain U.S. employees. The plan is funded on a pay-as-you-go basis and not accepting new participants. In accordance with ASC 715, Compensation – Retirement Benefits, the amount of the accumulated benefit obligation on the initiation date was accounted for as prior service cost and was deferred as a component of accumulated other comprehensive income (“AOCI”) and amortized over 5 years. The Company also maintains one non-U.S. post-employment benefit plan.
During the fiscal year ended December 30, 2018, the Company reduced the benefits provided to certain U.S. employees related to its replacement retiree health care reimbursement plan, resulting in a curtailment to the plan. As a result of the curtailment, the Company recorded a pre-tax charge of $2.5 million, which was included in selling, marketing and administrative expenses in the consolidated statement of operations for the fiscal year ended December 30, 2018. This pre-tax charge consisted of $7.5 million released from AOCI, offset by a $5.0 million reduction of the pension liability.
F-36
Ortho Clinical Diagnostics Holdings plc (formerly known as Ortho-Clinical Diagnostics Bermuda Co. Ltd.)
Notes to Consolidated Financial Statements
January 3, 2021
(Dollars in millions, unless otherwise stated)
The measurement date used to determine the defined benefit and other postemployment benefits obligations was January 3, 2021. The following tables set forth the changes to the projected benefit obligations (“PBO”) and plan assets:
|
|
|
Fiscal year ended |
|
|||||
|
|
|
January 3, 2021 |
|
|
December 29, 2019 |
|
||
|
Defined Benefit Plans |
|
|
|
|
|
|
|
|
|
Change in benefit obligation: |
|
|
|
|
|
|
|
|
|
Projected benefit obligation at beginning of year |
|
$ |
41.3 |
|
|
$ |
39.7 |
|
|
Service cost |
|
|
2.4 |
|
|
|
2.2 |
|
|
Interest cost |
|
|
0.3 |
|
|
|
0.5 |
|
|
Contributions by plan participants |
|
|
— |
|
|
|
— |
|
|
Benefits paid |
|
|
(0.2 |
) |
|
|
(0.4 |
) |
|
Actuarial (gain) loss |
|
|
(1.5 |
) |
|
|
2.9 |
|
|
Settlements and amendments |
|
|
(2.1 |
) |
|
|
(3.2 |
) |
|
Foreign currency exchange rate changes |
|
|
2.9 |
|
|
|
(0.4 |
) |
|
Projected benefit obligation at end of year |
|
$ |
43.1 |
|
|
$ |
41.3 |
|
|
Change in plan assets: |
|
|
|
|
|
|
|
|
|
Fair value of plan assets at beginning of year |
|
$ |
23.1 |
|
|
$ |
22.2 |
|
|
Actual return on plan assets |
|
|
0.5 |
|
|
|
2.0 |
|
|
Employer contributions |
|
|
2.0 |
|
|
|
2.2 |
|
|
Contributions by plan participants |
|
|
— |
|
|
|
— |
|
|
Benefits paid |
|
|
(0.2 |
) |
|
|
(0.4 |
) |
|
Settlements |
|
|
(2.1 |
) |
|
|
(3.2 |
) |
|
Foreign currency exchange rate changes |
|
|
1.4 |
|
|
|
0.3 |
|
|
Fair value of plan assets at end of year |
|
$ |
24.7 |
|
|
$ |
23.1 |
|
|
Funded status at end of year |
|
$ |
(18.4 |
) |
|
$ |
(18.2 |
) |
|
Amounts recognized on the consolidated balance sheets: |
|
|
|
|
|
|
|
|
|
Other assets |
|
$ |
0.7 |
|
|
$ |
— |
|
|
Accrued compensation and employee related obligations |
|
|
(0.2 |
) |
|
|
(0.3 |
) |
|
Employee related obligations |
|
|
(18.9 |
) |
|
|
(17.9 |
) |
|
Net amount recognized |
|
$ |
(18.4 |
) |
|
$ |
(18.2 |
) |
|
|
|
Fiscal year ended |
|
|||||
|
|
|
January 3, 2021 |
|
|
December 29, 2019 |
|
||
|
Other Postemployment Benefits |
|
|
|
|
|
|
|
|
|
Change in benefit obligation: |
|
|
|
|
|
|
|
|
|
Projected benefit obligation at beginning of year |
|
$ |
20.3 |
|
|
$ |
18.6 |
|
|
Service cost |
|
|
0.8 |
|
|
|
0.8 |
|
|
Interest cost |
|
|
0.4 |
|
|
|
0.6 |
|
|
Curtailment |
|
|
— |
|
|
|
— |
|
|
Benefits paid |
|
|
(0.6 |
) |
|
|
(0.4 |
) |
|
Actuarial loss (gain) |
|
|
1.1 |
|
|
|
0.7 |
|
|
Projected benefit obligation at end of year |
|
$ |
22.0 |
|
|
$ |
20.3 |
|
|
Amounts recognized on the consolidated balance sheets: |
|
|
|
|
|
|
|
|
|
Accrued compensation and employee related obligations |
|
$ |
(2.2 |
) |
|
$ |
(1.5 |
) |
|
Employee related obligations |
|
|
(19.8 |
) |
|
|
(18.8 |
) |
|
Net amount recognized |
|
$ |
(22.0 |
) |
|
$ |
(20.3 |
) |
F-37
Ortho Clinical Diagnostics Holdings plc (formerly known as Ortho-Clinical Diagnostics Bermuda Co. Ltd.)
Notes to Consolidated Financial Statements
January 3, 2021
(Dollars in millions, unless otherwise stated)
PBO is the actuarial present value of benefits attributable to employee service rendered to date and reflects the effects of estimated future pay increases. The accumulated benefit obligation (“ABO”) is the actuarial present value of benefits attributable to employee service to date, but does not include the effects of estimated future pay increases.
The following table reflects the ABO for all defined benefit plans as of January 3, 2021 and December 29, 2019. Further, the table reflects the aggregate PBO, ABO and fair value of plan assets for pension plans with PBO in excess of plan assets and for pension plans with ABO in excess of plan assets.
|
|
|
January 3, 2021 |
|
|
December 29, 2019 |
|
||
|
ABO |
|
$ |
36.0 |
|
|
$ |
34.2 |
|
|
Plans with PBO in excess of plan assets |
|
|
|
|
|
|
|
|
|
PBO |
|
$ |
24.4 |
|
|
$ |
41.3 |
|
|
Fair value of plan assets |
|
|
5.3 |
|
|
|
23.1 |
|
|
Plans with ABO in excess of plan assets |
|
|
|
|
|
|
|
|
|
PBO |
|
$ |
21.7 |
|
|
$ |
19.9 |
|
|
ABO |
|
|
18.8 |
|
|
|
16.6 |
|
|
Fair value of plan assets |
|
|
3.2 |
|
|
|
2.3 |
|
The pretax amounts that are not yet reflected in the net periodic benefit cost and are included in AOCI as of January 3, 2021, December 29, 2019 and December 30, 2018 include the following:
|
|
|
January 3, 2021 |
|
|
December 29, 2019 |
|
|
December 30, 2018 |
|
|||
|
Defined Benefit Plans |
|
|
|
|
|
|
|
|
|
|
|
|
|
Accumulated net actuarial losses |
|
$ |
(2.6 |
) |
|
$ |
(4.0 |
) |
|
$ |
(1.4 |
) |
|
Other Postemployment Benefits |
|
|
|
|
|
|
|
|
|
|
|
|
|
Accumulated net actuarial gains (losses) |
|
$ |
(1.2 |
) |
|
$ |
— |
|
|
$ |
0.7 |
|
|
Accumulated prior service cost |
|
|
(0.2 |
) |
|
|
(0.2 |
) |
|
|
(0.2 |
) |
|
Net amount recognized |
|
$ |
(1.4 |
) |
|
$ |
(0.2 |
) |
|
$ |
0.5 |
|
These accumulated net actuarial losses for defined benefit plans and other postemployment benefits primarily relate to differences between the actual net periodic expense and the expected net periodic expense from differences in significant assumptions, including primarily return on plan assets and discount rates used in these estimates. The accumulated prior service cost for the other postemployment benefit plans relates to the remaining unamortized amount of the ABO on the initiation date of the plans.
The estimated pretax amount of net actuarial gain related to the Company’s defined benefit plans that is expected to be amortized from AOCI into net periodic benefit cost during fiscal year 2021 is $0.2 million. The amount of net actuarial gain related to the Company’s other postemployment benefit plans that is expected to be amortized from AOCI into net periodic benefit cost during fiscal year 2021 is not material. The amount of prior service cost expected to be amortized from AOCI into net periodic benefit cost during fiscal year 2021 related to the Company’s defined benefit and other postemployment benefit plans is not material.
F-38
Ortho Clinical Diagnostics Holdings plc (formerly known as Ortho-Clinical Diagnostics Bermuda Co. Ltd.)
Notes to Consolidated Financial Statements
January 3, 2021
(Dollars in millions, unless otherwise stated)
Components of net periodic benefit cost
The following table sets forth the components of net periodic benefit cost:
|
|
|
Fiscal year ended |
|
|||||||||
|
|
|
January 3, 2021 |
|
|
December 29, 2019 |
|
|
December 30, 2018 |
|
|||
|
Defined Benefit Plans |
|
|
|
|
|
|
|
|
|
|
|
|
|
Net periodic benefit cost: |
|
|
|
|
|
|
|
|
|
|
|
|
|
Service cost |
|
$ |
2.4 |
|
|
$ |
2.2 |
|
|
$ |
2.3 |
|
|
Interest cost |
|
|
0.3 |
|
|
|
0.5 |
|
|
|
0.4 |
|
|
Expected return on plan assets |
|
|
(0.7 |
) |
|
|
(0.6 |
) |
|
|
(0.6 |
) |
|
Amortization of net loss |
|
|
(0.1 |
) |
|
|
(0.4 |
) |
|
|
(0.2 |
) |
|
Settlement loss (gain) |
|
|
0.2 |
|
|
|
(0.7 |
) |
|
|
(0.1 |
) |
|
Net periodic benefit cost |
|
$ |
2.1 |
|
|
$ |
1.0 |
|
|
$ |
1.8 |
|
|
Changes in plan assets and benefit obligations recognized in other comprehensive loss: |
|
|
|
|
|
|
|
|
|
|
|
|
|
Net actuarial loss (gain) |
|
$ |
(1.4 |
) |
|
$ |
1.5 |
|
|
$ |
1.1 |
|
|
Net translation adjustment |
|
|
0.2 |
|
|
|
— |
|
|
|
— |
|
|
Amortization of gain (loss) |
|
|
(0.1 |
) |
|
|
1.0 |
|
|
|
0.3 |
|
|
Total loss (income) recognized in other comprehensive loss |
|
$ |
(1.3 |
) |
|
$ |
2.5 |
|
|
$ |
1.4 |
|
|
Total recognized in net periodic benefit cost and other comprehensive loss |
|
$ |
0.8 |
|
|
$ |
3.5 |
|
|
$ |
3.2 |
|
|
|
|
Fiscal year ended |
|
|||||||||
|
|
|
January 3, 2021 |
|
|
December 29, 2019 |
|
|
December 30, 2018 |
|
|||
|
Other Postemployment Benefit Plans |
|
|
|
|
|
|
|
|
|
|
|
|
|
Net periodic benefit cost: |
|
|
|
|
|
|
|
|
|
|
|
|
|
Service cost |
|
$ |
0.7 |
|
|
$ |
0.8 |
|
|
$ |
0.9 |
|
|
Interest cost |
|
|
0.4 |
|
|
|
0.6 |
|
|
|
0.5 |
|
|
Amortization of prior service cost |
|
|
— |
|
|
|
— |
|
|
|
0.8 |
|
|
Curtailment |
|
|
— |
|
|
|
— |
|
|
|
2.5 |
|
|
Net periodic benefit cost |
|
$ |
1.1 |
|
|
$ |
1.4 |
|
|
$ |
4.7 |
|
|
Changes in benefit obligations recognized in other comprehensive loss: |
|
|
|
|
|
|
|
|
|
|
|
|
|
Net actuarial loss (gain) |
|
$ |
1.1 |
|
|
$ |
0.7 |
|
|
$ |
(2.1 |
) |
|
Amortization of prior service cost |
|
|
— |
|
|
|
— |
|
|
|
(7.0 |
) |
|
Total income recognized in other comprehensive loss |
|
$ |
1.1 |
|
|
$ |
0.7 |
|
|
$ |
(9.1 |
) |
|
Total recognized in net periodic benefit cost and other comprehensive loss |
|
$ |
2.2 |
|
|
$ |
2.1 |
|
|
$ |
(4.4 |
) |
The components of net periodic benefit cost other than the service cost component are recorded in “Other expense (income), net” in the consolidated statements of operations.
F-39
Ortho Clinical Diagnostics Holdings plc (formerly known as Ortho-Clinical Diagnostics Bermuda Co. Ltd.)
Notes to Consolidated Financial Statements
January 3, 2021
(Dollars in millions, unless otherwise stated)
In determining the defined benefit obligations and net periodic benefit cost for the fiscal years ended January 3, 2021 and December 29, 2019, the Company used the following weighted-average assumptions:
|
|
|
Fiscal year ended |
|
|||||
|
|
|
January 3, 2021 |
|
|
December 29, 2019 |
|
||
|
Defined Benefit Plans |
|
|
|
|
|
|
|
|
|
Discount rate to determine benefit obligations |
|
|
1.2 |
% |
|
|
1.0 |
% |
|
Discount rate to determine net cost |
|
|
1.0 |
% |
|
|
1.5 |
% |
|
Rate of compensation increases to determine benefit obligations |
|
|
2.5 |
% |
|
|
2.5 |
% |
|
Rate of compensation increases to determine net costs |
|
|
2.5 |
% |
|
|
2.7 |
% |
|
Return on plan assets to determine cost |
|
|
2.8 |
% |
|
|
2.8 |
% |
|
Other Postemployment Benefit Plans |
|
|
|
|
|
|
|
|
|
Discount rate to determine benefit obligations |
|
|
1.7 |
% |
|
|
2.5 |
% |
|
Discount rate to determine net cost |
|
|
2.4 |
% |
|
|
3.8 |
% |
The discount rates used reflect the expected future cash flow based on plan provisions, participant data and the currencies in which the expected future cash flows will occur. For the majority of defined benefit obligations, the Company utilizes prevailing long-term high quality corporate bond indices applicable to the respective country at the measurement date. In countries where established corporate bond markets do not exist, the Company utilizes other index movement and duration analysis to determine discount rates. The long-term rate of return on plan assets assumptions reflect economic assumptions applicable to each country and assumptions related to the preliminary assessments regarding the type of investments to be held by the respective plans.
The discount rate is determined as of each measurement date, based upon a review of yield rates associated with long-term, high-quality corporate bonds. The calculation separately discounts benefit payments using the spot rates from a long-term, high-quality corporate bond yield curve.
The long-term rate of return on plan assets assumption represents the expected average rate of earnings on the funds invested to provide for the benefits included in the benefit obligations and is determined based on a number of factors, including historical market index returns, the anticipated long-term allocation of the plans, historical plan return data, plan expenses and the potential to outperform market index returns. The weighted-average expected long-term rate of return on plan assets was 2.8% for both fiscal years ended January 3, 2021 and December 29, 2019.
A significant factor in estimating future per capita cost of covered healthcare benefits for retirees is the healthcare cost trend rate assumption. The rate used as of January 3, 2021 was 6.3% trending down to 4.5% in 2036. Increasing or decreasing the healthcare cost trend rates by one percentage point would not result in a material increase or decrease in annual costs or benefit obligations. The healthcare cost trend rate assumption for the upcoming year is 6.0%.
Anticipated contributions to defined benefit plans
For funded plans, our policy is to fund amounts for defined benefit plans sufficient to meet minimum requirements set forth in applicable benefit and local tax laws. Based upon the same assumptions used to measure the defined benefit obligations at January 3, 2021, the Company expects to contribute $2.0 million to defined benefit plans in fiscal year 2021. No plan assets are expected to be returned to the Company in fiscal year 2021.
F-40
Ortho Clinical Diagnostics Holdings plc (formerly known as Ortho-Clinical Diagnostics Bermuda Co. Ltd.)
Notes to Consolidated Financial Statements
January 3, 2021
(Dollars in millions, unless otherwise stated)
Estimated future benefit payments
The following table reflects the total benefit payments expected to be made for defined benefit plans and other long-term postemployment benefits:
|
|
|
Defined benefits |
|
|
Other postemployment benefits |
|
||
|
Fiscal 2021 |
|
$ |
1.3 |
|
|
$ |
2.2 |
|
|
Fiscal 2022 |
|
|
1.9 |
|
|
|
2.7 |
|
|
Fiscal 2023 |
|
|
2.4 |
|
|
|
3.1 |
|
|
Fiscal 2024 |
|
|
3.5 |
|
|
|
2.9 |
|
|
Fiscal 2025 |
|
|
2.4 |
|
|
|
2.3 |
|
|
Fiscal 2026-2030 |
|
|
12.8 |
|
|
|
7.6 |
|
Plan assets
The tables below present the fair value of the defined benefit pension plans by level within the fair value hierarchy, as described in Note 3—Summary of Significant Accounting Policies, at January 3, 2021 and December 29, 2019.
|
|
|
Fair value measurements at January 3, 2021 |
|
|||||||||||||
|
|
|
Total |
|
|
Level 1 |
|
|
Level 2 |
|
|
Level 3 |
|
||||
|
US equity securities |
|
$ |
3.1 |
|
|
$ |
3.1 |
|
|
$ |
— |
|
|
$ |
— |
|
|
Japan equity securities |
|
|
4.9 |
|
|
|
4.9 |
|
|
|
— |
|
|
|
— |
|
|
Other international equity securities |
|
|
1.7 |
|
|
|
1.7 |
|
|
|
— |
|
|
|
— |
|
|
US government bonds |
|
|
0.3 |
|
|
|
0.3 |
|
|
|
— |
|
|
|
— |
|
|
Japan government bonds |
|
|
0.7 |
|
|
|
0.7 |
|
|
|
— |
|
|
|
— |
|
|
Other international government bonds |
|
|
1.9 |
|
|
|
1.9 |
|
|
|
— |
|
|
|
— |
|
|
Cash and cash equivalents |
|
|
7.3 |
|
|
|
7.3 |
|
|
|
— |
|
|
|
— |
|
|
Insurance contracts |
|
|
4.8 |
|
|
|
— |
|
|
|
— |
|
|
|
4.8 |
|
|
Total |
|
$ |
24.7 |
|
|
$ |
19.9 |
|
|
$ |
— |
|
|
$ |
4.8 |
|
|
|
|
Fair value measurements at December 29, 2019 |
|
|||||||||||||
|
|
|
Total |
|
|
Level 1 |
|
|
Level 2 |
|
|
Level 3 |
|
||||
|
US equity securities |
|
$ |
3.0 |
|
|
$ |
3.0 |
|
|
$ |
— |
|
|
$ |
— |
|
|
Japan equity securities |
|
|
4.9 |
|
|
|
4.9 |
|
|
|
— |
|
|
|
— |
|
|
Other international equity securities |
|
|
2.0 |
|
|
|
2.0 |
|
|
|
— |
|
|
|
— |
|
|
US government bonds |
|
|
0.0 |
|
|
|
— |
|
|
|
— |
|
|
|
— |
|
|
Japan government bonds |
|
|
0.6 |
|
|
|
0.6 |
|
|
|
— |
|
|
|
— |
|
|
Other international government bonds |
|
|
1.1 |
|
|
|
1.1 |
|
|
|
— |
|
|
|
— |
|
|
Cash and cash equivalents |
|
|
7.9 |
|
|
|
7.9 |
|
|
|
— |
|
|
|
— |
|
|
Insurance contracts |
|
|
3.6 |
|
|
|
— |
|
|
|
— |
|
|
|
3.6 |
|
|
Total |
|
$ |
23.1 |
|
|
$ |
19.5 |
|
|
$ |
— |
|
|
$ |
3.6 |
|
The Company has funded defined benefit plans in Japan, Belgium and Switzerland. The Japanese plan asset consists primarily of Japan equity and government bond securities, U.S. equity and government bond securities, other international equity and debt securities and cash and cash equivalents. The plan assets are invested in assets with quoted prices in active markets and therefore are classified as Level 1 assets. The Belgium and Switzerland plan assets consist solely of insurance contracts that are pledged on behalf of employees with benefits in certain countries and are classified as Level 3 assets. The target allocation rates of the Japanese plan is 53% for debt securities, 45% for equity securities and 2%% for other assets.
F-41
Ortho Clinical Diagnostics Holdings plc (formerly known as Ortho-Clinical Diagnostics Bermuda Co. Ltd.)
Notes to Consolidated Financial Statements
January 3, 2021
(Dollars in millions, unless otherwise stated)
The table below presents a rollforward of activity for these assets for the fiscal years ended January 3, 2021 and December 29, 2019.
|
Balance at December 30, 2018 |
|
$ |
3.1 |
|
|
Net purchases and settlements |
|
|
0.4 |
|
|
Currency translation adjustment |
|
|
0.1 |
|
|
Balance at December 29, 2019 |
|
|
3.6 |
|
|
Net purchases and settlements |
|
|
1.0 |
|
|
Currency translation adjustment |
|
|
0.2 |
|
|
Balance at January 3, 2021 |
|
$ |
4.8 |
|
Defined contribution plans
The Company offers defined contribution plans to eligible employees primarily in the U.S., whereby employees contribute a portion of their compensation. Company matching and other Company contributions are also provided to the plans. Once Company matching contributions have been paid, the Company has no further payment obligations. The Company’s contributions for its employees totaled approximately $15 million, $16 million and $20 million for the fiscal years ended January 3, 2021, December 29, 2019 and December 30, 2018, respectively, which are recognized as expense as incurred in the consolidated statements of operations.
|
(15) |
Other financial information |
The following provides components of certain captions in the consolidated statements of operations.
Other operating expense, net
|
|
|
Fiscal year ended |
|
|||||||||
|
|
|
January 3, 2021 |
|
|
December 29, 2019 |
|
|
December 30, 2018 |
|
|||
|
Joint Business operating expense |
|
$ |
30.1 |
|
|
$ |
39.5 |
|
|
$ |
39.0 |
|
|
Refinancing costs |
|
|
— |
|
|
|
— |
|
|
|
18.5 |
|
|
Restructuring costs (credits) |
|
|
(0.6 |
) |
|
|
0.2 |
|
|
|
3.6 |
|
|
Other(1) |
|
|
5.8 |
|
|
|
9.1 |
|
|
|
10.1 |
|
|
Total other operating expense, net |
|
$ |
35.3 |
|
|
$ |
48.8 |
|
|
$ |
71.2 |
|
|
(1) |
This line item includes Carlyle management fees, bad debt expense, settlement proceeds on disputed matters and other operating income and expenses. See Note 20 - Related Party Transactions for additional detail on Carlyle management fees. |
Other expense, net
Other expense, net was $84.2 million for the fiscal year ended January 3, 2021 and primarily related to $69.5 million of net foreign currency losses, of which $68.2 million was unrealized and loss on early extinguishment of the 2022 Notes of $12.6 million. The unrealized foreign currency losses are mainly related to intercompany loans denominated in currencies other than the functional currency of the affected subsidiaries.
Other expense, net was $5.7 million for the fiscal year ended December 29, 2019 and primarily related to $16.0 million of fair value losses on interest rate caps that did not qualify for hedge accounting, partially offset by $10.5 million of net foreign currency gains, of which $18.1 million was unrealized. The unrealized foreign currency gains are mainly related to intercompany loans denominated in currencies other than the functional currency of the affected subsidiaries.
Other expense, net was $61.6 million for the fiscal year ended December 30, 2018 and primarily related to $53.0 million of net foreign currency losses, of which $43.3 million was unrealized and fair value losses of $2.7 million on interest rate caps that did not qualify for hedge accounting. The unrealized foreign currency losses are mainly related to intercompany loans denominated in currencies other than the functional currency of the affected subsidiaries.
F-42
Ortho Clinical Diagnostics Holdings plc (formerly known as Ortho-Clinical Diagnostics Bermuda Co. Ltd.)
Notes to Consolidated Financial Statements
January 3, 2021
(Dollars in millions, unless otherwise stated)
The applicable tax rate for United Kingdom is 19 percent; however, the U.S. statutory rate has been used as management believes it is more meaningful to the Company.
U.S. and foreign components of earnings (loss) before provision for income taxes
|
|
|
Fiscal year ended |
|
|||||||||
|
|
|
January 3, 2021 |
|
|
December 29, 2019 |
|
|
December 30, 2018 |
|
|||
|
U.S. |
|
$ |
(215.3 |
) |
|
$ |
(179.7 |
) |
|
$ |
(138.2 |
) |
|
Foreign |
|
|
(10.0 |
) |
|
|
(1.1 |
) |
|
|
(79.4 |
) |
|
Total |
|
$ |
(225.3 |
) |
|
$ |
(180.8 |
) |
|
$ |
(217.6 |
) |
(Benefit from) provision for income taxes
|
|
|
Fiscal year ended |
|
|||||||||
|
|
|
January 3, 2021 |
|
|
December 29, 2019 |
|
|
December 30, 2018 |
|
|||
|
Current |
|
|
|
|
|
|
|
|
|
|
|
|
|
U.S. |
|
$ |
(42.3 |
) |
|
$ |
(27.2 |
) |
|
$ |
11.7 |
|
|
Foreign |
|
|
29.8 |
|
|
|
10.2 |
|
|
|
24.8 |
|
|
Total Current |
|
$ |
(12.5 |
) |
|
$ |
(17.0 |
) |
|
$ |
36.5 |
|
|
Deferred |
|
|
|
|
|
|
|
|
|
|
|
|
|
U.S. |
|
$ |
0.4 |
|
|
$ |
0.3 |
|
|
$ |
1.0 |
|
|
Foreign |
|
|
(1.3 |
) |
|
|
(7.2 |
) |
|
|
(6.3 |
) |
|
Total Deferred |
|
$ |
(0.9 |
) |
|
$ |
(6.9 |
) |
|
$ |
(5.3 |
) |
|
(Benefit from) provision for income taxes |
|
$ |
(13.4 |
) |
|
$ |
(23.9 |
) |
|
$ |
31.2 |
|
On December 22, 2017, the Tax Cuts and Jobs Act of 2017 (the “TCJA”) was signed into law which made significant changes to the Internal Revenue Code. Changes include, but are not limited to: (1) a corporate tax rate decrease from 35% to 21% for tax years beginning after December 31, 2017; (2) the transition of U.S. international taxation from a worldwide to a territorial system; and (3) revision of the rules governing net operating losses and interest expense dis-allowance. These changes became effective in 2018. The Company finalized its assessment of the TCJA and all amounts have been recorded as of December 30, 2018. However, the Company’s amounts recorded as a result of the TCJA remain subject to developing interpretations of the provisions of the TCJA including U.S. Treasury regulations and state government adoption.
F-43
Ortho Clinical Diagnostics Holdings plc (formerly known as Ortho-Clinical Diagnostics Bermuda Co. Ltd.)
Notes to Consolidated Financial Statements
January 3, 2021
(Dollars in millions, unless otherwise stated)
Reconciliation to U.S. statutory rate
The applicable tax rate for United Kingdom is 19%; however, the U.S. statutory rate has been used as management believes it is more meaningful to the Company. A comparison of the provision for taxes on income at the U.S. statutory rate of 21% to the effective tax rate is as follows:
|
|
|
Fiscal year ended |
|
|||||||||
|
|
|
January 3, 2021 |
|
|
December 29, 2019 |
|
|
December 30, 2018 |
|
|||
|
U.S. Statutory rate |
|
|
21.0 |
% |
|
|
21.0 |
% |
|
|
21.0 |
% |
|
U.S. state and local |
|
|
(0.1 |
)% |
|
|
(0.2 |
)% |
|
|
(0.4 |
)% |
|
Foreign income taxed at rates other than the applicable U.S. rate |
|
|
10.3 |
% |
|
|
17.9 |
% |
|
|
8.6 |
% |
|
Tax credits |
|
|
0.8 |
% |
|
|
1.1 |
% |
|
|
0.7 |
% |
|
Change in valuation allowance |
|
|
(28.3 |
)% |
|
|
(33.0 |
)% |
|
|
(30.5 |
)% |
|
Foreign tax rate change |
|
|
(2.1 |
)% |
|
|
(2.9 |
)% |
|
|
(0.0 |
)% |
|
Change in uncertain tax positions |
|
|
11.7 |
% |
|
|
17.3 |
% |
|
|
(7.8 |
)% |
|
Foreign exchange gain/loss |
|
|
(1.0 |
)% |
|
|
(1.5 |
)% |
|
|
(1.0 |
)% |
|
Indemnification income |
|
|
(3.0 |
)% |
|
|
(3.4 |
)% |
|
|
1.1 |
% |
|
Withholding Tax |
|
|
(0.7 |
)% |
|
|
(1.5 |
)% |
|
|
(1.3 |
)% |
|
Nondeductible/nontaxable items |
|
|
(1.5 |
)% |
|
|
(2.3 |
)% |
|
|
(0.9 |
)% |
|
Other—net |
|
|
(1.2 |
)% |
|
|
0.8 |
% |
|
|
(3.8 |
)% |
|
Effective tax rate |
|
|
5.9 |
% |
|
|
13.3 |
% |
|
|
(14.3 |
)% |
The effective tax rate for the fiscal year ended January 3, 2021 differs from the U.S. federal statutory rate primarily due to (1) the impact of operating losses in certain subsidiaries not being benefited due to the establishment of a valuation allowance, (2) a decrease in the Company’s pre-Acquisition reserves for uncertain tax positions due to the settlement of certain tax matters, (3) partially offset by an increase in certain post-Acquisition non-U.S. reserves for uncertain tax positions, and (4) non-U.S. earnings being taxed at rates that are different than the U.S statutory rate. Deferred tax assets are reduced by valuation allowances when, based on available evidence, it is more likely than not that the tax benefit of loss carryforwards (or other deferred tax assets) will not be realized in the future. In periods when entities subject to a valuation allowance generate pre-tax earnings or losses, the corresponding increase or decrease in the valuation allowance has an overall impact on the effective tax rate.
The effective tax rate for the fiscal year ended December 29, 2019 differs from the U.S. federal statutory rate primarily due to (1) the impact of operating losses in certain subsidiaries not being benefited due to the establishment of a valuation allowance, (2) a decrease in the Company’s pre-Acquisition state and non-U.S. reserves for uncertain tax positions due to the settlement of certain tax matters, (3) an increase in the Company’s interest expense on prior year reserves for uncertain tax positions and (4) non-U.S. earnings being taxed at rates that are different than the U.S statutory rate.
The effective tax rate for the fiscal year ended December 30, 2018 differs from the U.S. federal statutory rate primarily due to (1) the impact of operating losses in certain subsidiaries not being benefited due to the establishment of a valuation allowance, (2) an increase in the Company’s reserves for uncertain tax positions, (3) an increase in the Company’s interest expense on prior year reserves for uncertain tax positions and (4) non-U.S. earnings being taxed at rates that are different than the U.S statutory rate.
F-44
Ortho Clinical Diagnostics Holdings plc (formerly known as Ortho-Clinical Diagnostics Bermuda Co. Ltd.)
Notes to Consolidated Financial Statements
January 3, 2021
(Dollars in millions, unless otherwise stated)
|
|
|
January 3, 2021 |
|
|
December 29, 2019 |
|
||
|
Deferred tax assets |
|
|
|
|
|
|
|
|
|
Tax loss and credit carry forwards |
|
$ |
535.8 |
|
|
$ |
480.1 |
|
|
Allowances and reserves |
|
|
26.7 |
|
|
|
21.6 |
|
|
Accrued liabilities |
|
|
5.1 |
|
|
|
4.6 |
|
|
Deferred lease liability |
|
|
7.9 |
|
|
|
11.2 |
|
|
Employee related obligations |
|
|
20.9 |
|
|
|
20.2 |
|
|
Capitalized transaction costs |
|
|
7.1 |
|
|
|
8.0 |
|
|
Other |
|
|
19.4 |
|
|
|
15.1 |
|
|
Total deferred tax assets |
|
$ |
622.9 |
|
|
$ |
560.8 |
|
|
Less: Valuation Allowance |
|
|
(554.8 |
) |
|
|
(484.1 |
) |
|
Net, Deferred tax assets |
|
$ |
68.1 |
|
|
$ |
76.7 |
|
|
Deferred tax liabilities |
|
|
|
|
|
|
|
|
|
Goodwill and intangibles |
|
|
(76.8 |
) |
|
|
(73.4 |
) |
|
Depreciation |
|
|
(31.4 |
) |
|
|
(31.1 |
) |
|
Right-of-use asset |
|
|
(7.8 |
) |
|
|
(11.1 |
) |
|
Unrealized (gain)/loss |
|
|
(7.7 |
) |
|
|
(17.9 |
) |
|
Other |
|
|
(3.7 |
) |
|
|
(2.1 |
) |
|
Total deferred tax liabilities |
|
$ |
(127.4 |
) |
|
$ |
(135.6 |
) |
|
Net, Deferred tax liability |
|
$ |
(59.3 |
) |
|
$ |
(58.9 |
) |
|
|
|
January 3, 2021 |
|
|
December 29, 2019 |
|
||
|
Non-current deferred tax asset |
|
$ |
8.0 |
|
|
$ |
6.1 |
|
|
Non-current deferred tax liability |
|
|
(67.3 |
) |
|
|
(65.0 |
) |
|
Net, Deferred tax liability |
|
$ |
(59.3 |
) |
|
$ |
(58.9 |
) |
As of January 3, 2021, the Company had a deferred tax asset for tax losses and credit carryforwards of $535.8 million. This amount consists of $349.7 million of net operating loss carryforwards, $30.3 million of credit carryforwards and $155.8 million of interest deduction limitation carryforwards, net of uncertain tax positions.
As of January 3, 2021, the Company had $829.5 million of U.S. federal net operating loss carryforwards; of which $473.0 million are subject to expiration through 2037 and $356.5 million are not subject to expiration. In addition, the Company has $477.5 million of state net operating loss, which will expire in years 2021 through 2040. As of January 3, 2021, Company had $10.1 million of U.S. general business credit carryforwards which will begin to expire in 2034 and $25.6 million state business credit carryforwards which will begin to expire in 2029. As of January 3, 2021, the Company had $504.9 million of net operating loss carryforwards in certain non-U.S. jurisdictions, net of uncertain tax positions. Of these, $291.6 million have no expiration and the remaining $213.3 million will expire in years through 2040.
The Company had valuation allowances that primarily related to the realization of recorded tax benefits on tax loss carryforwards from operations in the United States and Luxembourg of $554.8 million as of January 3, 2021 and $484.1 million as of December 29, 2019.
F-45
Ortho Clinical Diagnostics Holdings plc (formerly known as Ortho-Clinical Diagnostics Bermuda Co. Ltd.)
Notes to Consolidated Financial Statements
January 3, 2021
(Dollars in millions, unless otherwise stated)
Total gross unrecognized tax benefits
The following table summarizes the activity related to gross unrecognized tax benefits:
|
|
|
Fiscal year ended |
|
|||||||||
|
|
|
January 3, 2021 |
|
|
December 29, 2019 |
|
|
December 30, 2018 |
|
|||
|
Balance at beginning of fiscal year |
|
$ |
110.4 |
|
|
$ |
143.4 |
|
|
$ |
137.3 |
|
|
Increase related to positions taken on items from prior years |
|
|
19.8 |
|
|
|
— |
|
|
|
6.2 |
|
|
Decrease related to positions taken on items from prior years |
|
|
(22.1 |
) |
|
|
(29.9 |
) |
|
|
— |
|
|
Increase related to positions taken on items in current years |
|
|
1.7 |
|
|
|
0.2 |
|
|
|
— |
|
|
Decrease due to settlements |
|
|
(81.9 |
) |
|
|
(3.1 |
) |
|
|
|
|
|
Decrease due to expiration of statutes of limitations |
|
|
(0.4 |
) |
|
|
(0.2 |
) |
|
|
(0.1 |
) |
|
Balance at end of fiscal year |
|
$ |
27.5 |
|
|
$ |
110.4 |
|
|
$ |
143.4 |
|
As of January 3, 2021, the total amount of unrecognized tax benefits was $27.5 million ($110.4 million as of December 29, 2019), of which $23.1 million would impact the effective tax rate, if recognized ($106.9 million as of December 29, 2019). As of January 3, 2021, the amount of tax indemnification that would impact earnings (loss) before provisions for taxes on income if recognized would be $11.6 million ($90.8 million as of December 29, 2019). The net decrease in the balance from the beginning of the year relates to the resolution of certain pre-Acquisition U.S. federal and state tax positions taken in prior years for which the Company was indemnified by Johnson & Johnson. The Company estimates that within the next twelve months, its uncertain tax positions, excluding interest will not significantly decrease.
The Company is subject to income tax in approximately 34 jurisdictions outside the U.S. The Company’s most significant operations outside the U.S. are located in China, France, Japan, and the United Kingdom. For these jurisdictions for which the Company has significant operations, the statute of limitations varies by jurisdiction, with 2013 being the oldest tax year still open. The Company is currently under audit in certain jurisdictions for tax years under the responsibility of Johnson & Johnson. Pursuant to the Acquisition Agreement, all tax liabilities related to these tax years will be indemnified by Johnson & Johnson.
The Company includes interest expense and penalties related to unrecognized tax benefits as part of the provision for taxes on income. The Company recognized a benefit related to interest and penalties associated with unrecognized tax benefits of $35.2 million and $1.5 million for the fiscal years ended January 3, 2021 and December 29, 2019, respectively, and tax expense for interest and penalties associated with unrecognized tax benefits of $12.0 million for the fiscal year ended December 30, 2018. The Company’s accrual for interest and penalties was $6.1 million and $41.3 million as of January 3, 2021 and December 29, 2019, respectively. The Company classifies liabilities for unrecognized tax benefits and related accrued interest and penalties as either “Accrued Liabilities” or “Other liabilities” depending upon expected payment date. The Company includes the offset for interest and penalties related to unrecognized tax benefits to be reimbursed by Johnson & Johnson pursuant to the indemnification provisions in the Acquisition Agreement in Other operating expense, net.
As of January 3, 2021, the Company had $33.5 million of unrecognized tax benefits, including interest and penalties. Due to the high degree of uncertainty regarding future timing of cash flows associated with these liabilities, the Company is unable to estimate the years in which settlement will occur with the respective taxing authorities. The Acquisition Agreement includes indemnification provisions with respect to tax liabilities, including reserves for unrecognized tax benefits existing at the Day 1 Closing Date. The Acquisition Agreement generally provided that Johnson & Johnson retained all income tax liabilities accrued as of the date of the Acquisition, including reserves for unrecognized tax benefits. As of January 3, 2021, the indemnification receivable from Johnson & Johnson totaled $17.0 million, of which all $17.0 million was included in “Other assets”. As of December 29, 2019, the indemnification receivable from Johnson & Johnson totaled $130.6 million, of which $29.3 million was included in “Other current assets” and $101.3 million was included in “Other assets.”
Income taxes paid during the fiscal year ended January 3, 2021, December 29, 2019, and December 30, 2018 were $16.8 million, $8.4 million and $13.4 million, respectively.
F-46
Ortho Clinical Diagnostics Holdings plc (formerly known as Ortho-Clinical Diagnostics Bermuda Co. Ltd.)
Notes to Consolidated Financial Statements
January 3, 2021
(Dollars in millions, unless otherwise stated)
The following table summarizes the changes to the valuation allowance for the fiscal year ended January 3, 2021, December 29, 2019, and December 30, 2018:
|
|
|
Beginning Balance |
|
|
Additions (deductions) charged to provision for income taxes |
|
|
Currency translation/ other |
|
|
Ending Balance |
|
||||
|
Deferred tax valuation allowance |
|
|
|
|
|
|
|
|
|
|
|
|
|
|
|
|
|
Fiscal year ended January 3, 2021 |
|
$ |
484.1 |
|
|
$ |
63.0 |
|
|
$ |
7.7 |
|
|
$ |
554.8 |
|
|
Fiscal year ended December 29, 2019 |
|
$ |
419.7 |
|
|
$ |
64.7 |
|
|
$ |
(0.3 |
) |
|
$ |
484.1 |
|
|
Fiscal year ended December 30 2018 |
|
$ |
349.1 |
|
|
$ |
76.4 |
|
|
$ |
(5.8 |
) |
|
$ |
419.7 |
|
|
(17) |
Stock-based compensation |
During the fiscal years ended January 3, 2021, December 29, 2019 and December 30, 2018, the Company recognized $8.6 million, $18.6 million and $5.9 million, respectively, in stock-based compensation which was recorded as components of Cost of revenue, Selling, marketing and administrative expenses and Research and development expense.
Description of equity incentive plan
On October 22, 2014, UK Holdco’s Board of Directors approved the Ortho Clinical Diagnostics Holding plc (formerly known as Ortho-Clinical Diagnostics Bermuda Co. Ltd.) 2014 Equity Incentive Plan (the “2014 Plan”) which reserved an aggregate of 15,190,387 shares of common stock of the Company for issuance to employees, directors and consultants (“Options”). The 2014 Plan provides for the issuance of stock options, restricted stock and other stock-based awards. Options and restricted shares granted must be authorized by the Board of Directors of UK Holdco or a designated committee thereof (the “Plan Administrator”). The terms of the options may vary with each grant and are determined by the Plan Administrator within the guidelines of the 2014 Plan. In December 2019, the Company increased the number of shares reserved under the 2014 Plan to 20,356,346.
Stock options
Options granted under the 2014 Plan provide for time-based vesting for a portion of the Options, performance-based vesting for a portion of the Options and liquidity event vesting for a portion of the Options. The time-based Options generally vest ratably over three to five years and upon the occurrence of a Liquidity Event (as defined in the 2014 Plan), the liquidity-based Options vest immediately prior to the Liquidity Event. The performance-based Options vest and become exercisable based upon achievement of either minimum earnings targets or share price.
On January 11, 2019, the Board of Directors approved the Amendment to the Stock Option Agreement, whereby performance-based options that did not vest based on applicable minimum earnings targets will vest over a specified period of time. The Company accounted for this as a modification and recognized additional compensation expense of approximately $14.7 million during fiscal year 2019.
F-47
Ortho Clinical Diagnostics Holdings plc (formerly known as Ortho-Clinical Diagnostics Bermuda Co. Ltd.)
Notes to Consolidated Financial Statements
January 3, 2021
(Dollars in millions, unless otherwise stated)
A summary of stock option activity for the fiscal year ended January 3, 2021 is presented below:
|
|
|
Number of shares |
|
|
Weighted average exercise price |
|
|
Weighted average grant date fair value |
|
|
Weighted average remaining contractual life (years) |
|
||||
|
Number of shares under option: |
|
|
|
|
|
|
|
|
|
|
|
|
|
|
|
|
|
Outstanding as of December 29, 2019 |
|
|
15,218,726 |
|
|
$ |
9.02 |
|
|
$ |
3.61 |
|
|
|
3.82 |
|
|
Granted |
|
|
2,552,093 |
|
|
|
12.57 |
|
|
|
5.58 |
|
|
|
|
|
|
Canceled |
|
|
(1,042,797 |
) |
|
|
9.44 |
|
|
|
3.71 |
|
|
|
|
|
|
Exercised |
|
|
(647,898 |
) |
|
|
6.56 |
|
|
|
3.36 |
|
|
|
|
|
|
Outstanding as of January 3, 2021 |
|
|
16,080,124 |
|
|
$ |
9.66 |
|
|
$ |
3.93 |
|
|
|
3.56 |
|
|
Exercisable as of January 3, 2021 |
|
|
8,356,050 |
|
|
|
7.27 |
|
|
|
5.85 |
|
|
|
2.74 |
|
|
Expected to vest as of January 3, 2021 |
|
|
3,438,030 |
|
|
|
12.19 |
|
|
|
4.72 |
|
|
|
4.43 |
|
|
Total vested and expected to vest as of January 3, 2021 |
|
|
11,794,080 |
|
|
$ |
8.71 |
|
|
$ |
5.52 |
|
|
|
3.23 |
|
During the fiscal year ended January 3, 2021, the Company granted under the 2014 Plan, 1,171,919 time-based stock options at a weighted average exercise price of $12.84 per share and a weighted average grant date fair value of $5.97 per option and 1,380,174 performance-based stock options at a weighted average exercise price of $12.35 per share and a weighted average grant date fair value of $5.23 per option.
The Black-Scholes option price model and Monte Carlo Simulation were used to estimate the fair value of the time-based and performance-based options, respectively, as of the date of the grant. Expected volatility is determined based on a number of factors, including management’s estimates and comparable companies. The expected term of the options is calculated as the mid-point between the expected time to vest and the maturity of the options. The yield interpolated from U.S. Constant Maturity Treasury rates for a period commensurate with the expected term assumption is used as the risk-free interest rate.
Information related to the assumptions used to estimate the grant fair value of shares using the Black-Scholes option price model follows:
|
|
|
Fiscal year ended |
|
|||||||||
|
|
|
January 3, 2021 |
|
|
December 29, 2019 |
|
|
December 30, 2018 |
|
|||
|
Grant date fair value of common stock, per share |
|
$ 12.56 - $14.13 |
|
|
$ |
11.92 – 12.55 |
|
|
$ |
11.61 |
|
|
|
Range of expected term |
|
0.3 - 4.80 |
|
|
1.00 – 6.14 |
|
|
6.10 – 6.50 |
|
|||
|
Range of expected volatility |
|
55% - 80% |
|
|
45% – 55% |
|
|
|
40 |
% |
||
|
Weighted-average dividend rate |
|
|
0 |
% |
|
|
0 |
% |
|
|
0 |
% |
|
Range of risk-free rates |
|
0.11% - 0.30% |
|
|
1.50% – 2.56% |
|
|
2.16% – 2.20% |
|
|||
The weighted-average volatility used in the Black-Scholes option price model for options granted in 2020 was 66.9%.
During 2020, certain performance-based awards at the date of grant were estimated using the Monte-Carlo simulation model with the following assumptions:
|
|
|
Fiscal year ended January 3, 2021 |
|
|
|
Grant date fair value of common stock, per share |
|
12.56 - 14.13 |
|
|
|
Range of expected volatility |
|
40.0% - 80.0% |
|
|
|
Expected annual dividend yield |
|
|
0 |
% |
|
Range of risk-free interest rates |
|
0.11% - 0.81% |
|
|
F-48
Ortho Clinical Diagnostics Holdings plc (formerly known as Ortho-Clinical Diagnostics Bermuda Co. Ltd.)
Notes to Consolidated Financial Statements
January 3, 2021
(Dollars in millions, unless otherwise stated)
The weighted-average volatility used in the Monte-Carlo simulation model for options granted in 2020 was 60.0%.
The Company estimated the per share fair value of its common stock using a contemporaneous valuation. In conducting this valuation, the Company considered all objective and subjective factors believed to be relevant, including its best estimate of the Company’s business condition, prospects and operating performance. Within this contemporaneous valuation, a range of factors, assumptions and methodologies were used. The significant factors included:
|
|
• |
the fact that at the time of the grant, the Company was a private company with illiquid securities; |
|
|
• |
historical operating results; |
|
|
• |
discounted future cash flows, based on projected operating results; |
|
|
• |
financial information of comparable public companies; and |
|
|
• |
the risk involved in the investment, as related to earnings stability, capital structure, competition and market potential. |
For the contemporaneous valuation of the common stock, management estimated, as of the issuance date, the Company’s enterprise value on a continuing operations basis, using both the income approach and the market approach, with equal weights assigned to each. The income approach utilized the discounted cash flow (“DCF”) methodology based on our financial forecasts and projections, as detailed below. For the DCF methodology, we prepared annual projections of future cash flows. These projected cash flows were projected at long-term sustainable growth rates consistent with long-term inflationary and industry expectations. Our projections of future cash flows were based on our estimated net debt-free cash flows and were discounted to the valuation date using a weighted-average cost of capital estimated based on market participant assumptions. When selecting comparable companies, consideration was given to industry similarity, their specific products offered, financial data availability and capital structure. Under the market approach, the Company’s enterprise value is based on trading multiples of these comparable companies.
As of January 3, 2021, the Company had $13.4 million of unrecognized compensation expense relating to outstanding unvested stock options. Compensation expense is recognized for the fair value of the stock options over the requisite service period of the awards using the straight-line method. This expense is expected to be recognized over a weighted-average period of 2.2 years.
Restricted stock
A summary of all restricted stock activity during the fiscal year ended January 3, 2021 is as follows:
|
|
|
Number of shares |
|
|
Weighted average grant date fair value |
|
||
|
Restricted stock outstanding as of December 29, 2019 |
|
|
347,015 |
|
|
$ |
12.53 |
|
|
Granted |
|
|
374,449 |
|
|
|
14.10 |
|
|
Vested |
|
|
(24,601 |
) |
|
|
12.34 |
|
|
Outstanding as of January 3, 2021 |
|
|
696,863 |
|
|
$ |
13.62 |
|
The recipients of the restricted stock have all the rights of a stockholder with respect to the restricted shares of stock, including the right to receive any cash or stock dividend or other distribution paid to be made with respect to the restricted share of stock. These shares of restricted stock vest based on the terms as determined by the Executive Committee of the Board of Directors. Any unvested restricted shares are forfeited in the event of termination. As of January 3, 2021, the Company had $12.3 million of unrecognized compensation expense relating to outstanding unvested restricted stock awards.
On December 15, 2020, the Company granted 318,680 of restricted stock units with a grant date fair value of $14.13. The award will vest in a single installment six months following the closing date of an IPO. As of January 3, 2021, the Company had $4.5 million of unrecognized compensation expense relating to the outstanding restricted stock units award.
F-49
Ortho Clinical Diagnostics Holdings plc (formerly known as Ortho-Clinical Diagnostics Bermuda Co. Ltd.)
Notes to Consolidated Financial Statements
January 3, 2021
(Dollars in millions, unless otherwise stated)
During the fiscal years ended January 3, 2021, December 29, 2019 and December 30, 2018, the Company made noncash transfers of instrument inventories from “Inventories” to “Property, Plant and Equipment” of $132.3 million, $118.6 million and $93.0 million, respectively.
As of January 3, 2021, December 29, 2019 and December 30, 2018, accounts payable and accrued liabilities included amounts related to purchases of property, plant and equipment and capitalized computer software and development costs of $11.4 million, $14.1 million and $17.2 million, respectively. The changes in these balances are excluded from changes in accounts payable and accrued liabilities.
|
(19) |
Segments and geographic information |
The Company is engaged in the design, development, manufacturing, marketing, distribution and sale of diagnostic instruments and assays for hospitals, laboratories and blood and plasma centers worldwide. The Company manages its business by geographic location. In the fiscal first quarter ended March 29, 2020, the Company changed the financial information that was regularly reviewed by the CODM to measure performance and allocate resources. This resulted in six geographically based operating segments: North America, EMEA, Greater China, Japan, Asia- Pacific (ASPAC) and Latin America (LATAM).
In the fiscal fourth quarter ended January 3, 2021, the Company further changed the manner in which the CODM measured performance and allocated resources. This resulted in five geographically based operating segments: Americas, EMEA, Greater China, Japan and ASPAC. The Company’s reportable segments consist of Americas, EMEA, and Greater China. Although the reportable segments provide similar products and services, each one is managed separately to better align with the market dynamics of each geographic region. Japan and ASPAC are immaterial operating segments not considered as reportable segments and are included in “Other.”
Our CEO is the CODM. The CODM evaluates segment profitability using Net revenue and Management EBITDA. Net revenue for geographic segments are generally based on the location of customers and sales through the Company’s operations located in those geographic locations. Management EBITDA for each segment is defined as segment net loss, plus interest expense, income taxes, depreciation and amortization and management adjustments.
Net revenue by segment is as follows:
|
|
|
Fiscal Year Ended |
|
|||||||||
|
|
|
January 3, 2021 |
|
|
December 29, 2019 |
|
|
December 30, 2018 |
|
|||
|
Americas |
|
$ |
1,067.3 |
|
|
$ |
1,042.5 |
|
|
$ |
1,041.6 |
|
|
EMEA |
|
|
240.6 |
|
|
|
251.5 |
|
|
|
263.6 |
|
|
Greater China |
|
|
229.6 |
|
|
|
242.5 |
|
|
|
224.3 |
|
|
Other |
|
|
228.7 |
|
|
|
265.0 |
|
|
|
257.8 |
|
|
Net revenue |
|
$ |
1,766.2 |
|
|
$ |
1,801.5 |
|
|
$ |
1,787.3 |
|
F-50
Ortho Clinical Diagnostics Holdings plc (formerly known as Ortho-Clinical Diagnostics Bermuda Co. Ltd.)
Notes to Consolidated Financial Statements
January 3, 2021
(Dollars in millions, unless otherwise stated)
Management EBITDA by segment is as follows:
|
|
|
Fiscal Year Ended |
|
|||||||||
|
|
|
January 3, 2021 |
|
|
December 29, 2019 |
|
|
December 30, 2018 |
|
|||
|
Americas |
|
$ |
486.8 |
|
|
$ |
418.4 |
|
|
$ |
420.4 |
|
|
EMEA |
|
|
50.9 |
|
|
|
54.9 |
|
|
|
48.4 |
|
|
Greater China |
|
|
107.3 |
|
|
|
118.4 |
|
|
|
102.5 |
|
|
Other |
|
|
73.5 |
|
|
|
88.8 |
|
|
|
83.3 |
|
|
Corporate (1) |
|
|
(191.8 |
) |
|
|
(177.9 |
) |
|
|
(169.1 |
) |
|
Management EBITDA |
|
$ |
526.7 |
|
|
$ |
502.6 |
|
|
$ |
485.5 |
|
|
|
(1) |
Corporate primarily consists of costs related to executive and staff functions, including certain finance, human resources, manufacturing, and information technology, which benefit the enterprise as a whole. These costs are primarily related to the general management of these functions on a corporate level and the design and development of programs, policies, and procedures that are then implemented in the individual segments, with each segment bearing its own cost of implementation. Our Corporate function also includes debt and stock-based employee compensation expense associated with all employee stock-based awards. In the fiscal year ended January 3, 2021 the Company changed the methodology in which certain manufacturing expenses were allocated between Corporate and the reportable segments. As a result of the change in methodology, the Company has revised the Management EBITDA results by segment for the fiscal years ended December 29, 2019 and December 30, 2018 in order to provide comparable information for all periods presented. |
The reconciliation of Management EBITDA is as follows:
|
|
|
Fiscal Year Ended |
|
|||||||||
|
|
|
January 3, 2021 |
|
|
December 29, 2019 |
|
|
December 30, 2018 |
|
|||
|
Net loss |
|
$ |
(211.9 |
) |
|
$ |
(156.9 |
) |
|
$ |
(248.8 |
) |
|
Interest expense, net |
|
|
198.2 |
|
|
|
231.4 |
|
|
|
235.6 |
|
|
Depreciation and amortization |
|
|
325.9 |
|
|
|
327.5 |
|
|
|
332.2 |
|
|
(Benefit from) provision for income taxes |
|
|
(13.4 |
) |
|
|
(23.9 |
) |
|
|
31.2 |
|
|
Unrealized foreign currency exchange losses (gains) |
|
|
63.0 |
|
|
|
(19.6 |
) |
|
|
46.5 |
|
|
Stock-based compensation |
|
|
8.6 |
|
|
|
18.6 |
|
|
|
5.9 |
|
|
Restructuring and severance related costs |
|
|
11.7 |
|
|
|
36.0 |
|
|
|
38.3 |
|
|
Tax indemnification expense (income) |
|
|
31.2 |
|
|
|
29.2 |
|
|
|
(13.1 |
) |
|
Debt refinancing costs and loss on extinguishment of debt |
|
|
12.6 |
|
|
|
— |
|
|
|
20.6 |
|
|
Quotient upfront payment |
|
|
7.5 |
|
|
|
— |
|
|
|
— |
|
|
Other adjustments |
|
|
22.6 |
|
|
|
35.2 |
|
|
|
19.4 |
|
|
Management adjustments and realized foreign exchange losses |
|
|
70.7 |
|
|
|
25.1 |
|
|
|
17.7 |
|
|
Management EBITDA |
|
$ |
526.7 |
|
|
$ |
502.6 |
|
|
$ |
485.5 |
|
F-51
Ortho Clinical Diagnostics Holdings plc (formerly known as Ortho-Clinical Diagnostics Bermuda Co. Ltd.)
Notes to Consolidated Financial Statements
January 3, 2021
(Dollars in millions, unless otherwise stated)
The CODM does not review capital expenditures, total depreciation and amortization or total assets by segment, and therefore this information has been excluded as it does not comprise part of management’s key performance metrics.
Net revenues by geographic location were as follows:
|
|
|
Fiscal year ended |
|
|||||||||
|
|
|
January 3, 2021 |
|
|
December 29, 2019 |
|
|
December 30, 2018 |
|
|||
|
Net revenue |
|
|
|
|
|
|
|
|
|
|
|
|
|
United States |
|
$ |
901.2 |
|
|
$ |
855.1 |
|
|
$ |
859.2 |
|
|
Greater China |
|
|
229.6 |
|
|
|
242.5 |
|
|
|
224.3 |
|
|
Other countries |
|
|
635.4 |
|
|
|
703.9 |
|
|
|
703.8 |
|
|
Total net revenue |
|
$ |
1,766.2 |
|
|
$ |
1,801.5 |
|
|
$ |
1,787.3 |
|
Property, plant and equipment, net and Right-of-use assets by geographic location were as follows:
|
|
|
January 3, 2021 |
|
|
December 29, 2019 |
|
||
|
Long-lived assets |
|
|
|
|
|
|
|
|
|
United States |
|
$ |
507.5 |
|
|
$ |
550.8 |
|
|
United Kingdom |
|
|
105.6 |
|
|
|
101.1 |
|
|
Other countries |
|
|
245.6 |
|
|
|
236.6 |
|
|
Total long-lived assets |
|
$ |
858.7 |
|
|
$ |
888.5 |
|
|
(20) |
Related party transactions |
Carlyle
The Company entered into consulting services agreements with Carlyle Investment Management, L.L.C. (“CIM”), pursuant to which the Company pays CIM a fee for advisory, consulting and other services to be provided to the Company. Pursuant to the consulting services agreement, which has an initial term of ten years, the Company pays an annual management fee to CIM of $3.0 million (the “Management Fee”). The Management Fee is payable on a quarterly basis. The Company will also reimburse CIM’s reasonable out-of-pocket expenses incurred in connection with services provided pursuant to the consulting services agreement, and the Company may pay CIM additional fees associated with other future transactions or in consideration of any additional services provided to the Company under the consulting services agreement. During the fiscal years ended January 3, 2021, December 29, 2019 and December 30, 2018, the Company recorded $3.0 million, $3.1 million and $3.0 million of Management Fee expense and other out-of-pocket expenses, respectively.
During fiscal year 2017, the Company entered into agreements to sell products and provide services to health care diagnostic companies that are portfolio companies of funds affiliated with Carlyle. During the fiscal years ended January 3, 2021, December 29, 2019 and December 30, 2018 the Company recognized revenues of $3.8 million, $3.5 million and $1.2 million from these affiliates, respectively.
The Company, as part of normal course of business, purchased inventories from health care companies that are affiliated with our officers. During the fiscal years ended January 3, 2021, the Company purchased inventories of $2.4 million.
Portfolio companies of funds affiliated with Carlyle provide IT services to the Company. During the fiscal years ended January 3, 2021, December 29, 2019 and December 30, 2018 the Company incurred IT service fees of $1.1 million, $0.6 million and $2.6 million, respectively.
Portfolio companies of funds affiliated with Carlyle provide consulting services to the Company. During the fiscal years ended January 3, 2021, December 29, 2019 and December 30, 2018 the Company incurred consulting fees of $1.1 million, $0.8 million and $0.6 million, respectively.
F-52
Ortho Clinical Diagnostics Holdings plc (formerly known as Ortho-Clinical Diagnostics Bermuda Co. Ltd.)
Notes to Consolidated Financial Statements
January 3, 2021
(Dollars in millions, unless otherwise stated)
A pharmacy benefit management organization affiliated with a member of our Board of Directors provides pharmacy services to the Company. During the fiscal year ended December 30, 2018 the Company incurred fees related to pharmacy services provided of $6.3 million. During the fiscal year ended December 29, 2019 the pharmacy benefit management organization was no longer affiliated with the Company.
A pharmacy benefit management organization affiliated with Carlyle started to provide pharmacy services to the Company in fiscal year 2020. During the fiscal year ended January 3, 2021 the Company incurred fees related to pharmacy services of $5.7 million.
|
(21) |
Commitments and contingencies |
At times, the entities that carry out the Company’s business are the subject of governmental investigations and various legal actions and claims from governmental agencies and other parties. The outcomes of these matters are not within the Company’s complete control and may not be known for prolonged periods of time. The Company records a liability in the consolidated financial statements for loss contingencies when a loss is known or considered probable and the amount can be reasonably estimated. If the reasonable estimate of a known or probable loss is a range, and no amount within the range is a better estimate than any other, the minimum amount of the range is accrued. When determining the estimated loss or range of loss, significant judgment is required to estimate the amount and timing of a loss to be recorded. Estimates of probable losses resulting from these matters are inherently difficult to predict.
|
(22) |
Fair value accounting |
Fair value of financial instruments
Cash and cash equivalents—The carrying amount of cash equivalents approximates fair value because the original maturity is less than 90 days.
Accounts receivable—The carrying amount of current accounts receivable approximates fair value because of their short outstanding terms. For payments expected from customers over periods longer than one year, receivables have been discounted to reflect the estimated period of time for collection and are presented as a component of “Other assets” in the consolidated balance sheets.
Accounts payable—The carrying amount of accounts payable approximates fair value because of their short outstanding terms.
Short-term borrowings—The carrying amount of short-term borrowings approximates fair value because of their short outstanding terms.
Long-term borrowings—The estimated fair values of long-term borrowings were based on trades as reported by a third party bond pricing service. Due to the infrequency of trades of the Notes and Term Loans, these inputs are considered to be Level 2 inputs. The following table presents the fair value of long-term borrowings:
|
|
|
January 3, 2021 |
|
|
December 29, 2019 |
|
||
|
Long-term borrowings: |
|
|
|
|
|
|
|
|
|
Dollar Term Loan Facility |
|
$ |
2,627.7 |
|
|
$ |
2,214.2 |
|
|
Euro Term Loan Facility |
|
|
401.1 |
|
|
|
- |
|
|
2028 Notes |
|
|
710.4 |
|
|
|
- |
|
|
2025 Notes |
|
|
424.0 |
|
|
|
- |
|
|
2022 Notes |
|
|
- |
|
|
|
1,293.5 |
|
|
(23) |
Derivative and other hedging instruments |
The Company selectively uses derivative instruments to reduce market risk associated with changes in interest rates and foreign currency. The use of derivatives is intended for hedging purposes only and the Company does not enter into derivative instruments for speculative purposes.
F-53
Ortho Clinical Diagnostics Holdings plc (formerly known as Ortho-Clinical Diagnostics Bermuda Co. Ltd.)
Notes to Consolidated Financial Statements
January 3, 2021
(Dollars in millions, unless otherwise stated)
For derivative instruments that are designated and qualify as cash flow hedges, the gain or loss on the derivative is reported as a component of other comprehensive income (OCI) and reclassified into earnings in the same period or periods during which the hedged transaction affects earnings.
Interest rate hedging
The Company entered into a series of interest rate cap agreements to hedge our interest rate exposures related to our variable rate borrowings under the Senior Secured Credit Facilities. On July 19, 2019, the Company entered into an interest rate swap agreement, which fixed a portion of the variable interest due on the Company’s variable rate debt on September 27, 2019.
The following table summarizes the interest rate derivative agreements as of January 3, 2021:
|
Effective date |
|
Expiration date |
|
Interest rate cap amount |
|
|
Notional amount |
|
|
Hedge designation |
|
|
December 31, 2020 |
|
December 31, 2023 |
|
3.5% |
|
|
$ |
1,500,000,000 |
|
|
Not designated |
|
June 30, 2017 |
|
December 31, 2020 |
|
1.8% |
|
|
$ |
1,500,000,000 |
|
|
Not designated |
|
Effective date |
|
Expiration date |
|
Description |
|
Fixed rate |
|
|
Floating rate |
|
Notional amount(a) |
|
|
Hedge description |
|
|
September 27, 2019 |
|
December 31, 2023 |
|
Pay fixed, receive float |
|
1.635% |
|
|
1-month LIBOR rate |
|
$ |
700,000,000 |
|
|
Cash Flow hedge |
|
Effective Date |
|
Expiration Date |
|
Interest Rate Received |
|
Interest Rate Paid |
|
Notional Amount |
|
Hedge Designation |
|
January 27, 2020 |
|
February 1, 2025 |
|
7.25% |
|
5.548% - 5.556% |
|
$350 million USD swapped to 5.5 billion JPY |
|
Not designated |
|
|
(a) |
The Notional value of this instrument is expected to be $1,500 million in fiscal 2021, $1,000 million in fiscal 2022 and $500 million in fiscal 2023. |
During the quarter ended September 29, 2019, the Company de-designated its 3.5% interest rate cap upon entering into the interest rate swap agreement that hedges a portion of the Company’s borrowings under the Senior Secured Credit Facilities. Accordingly, the Company recorded the activity related to the hedge through the date of the de-designation as a cash flow hedge, and subsequently recorded the activity related to the interest rate cap as mark to market, with the impact recorded to other income, net. The impact of the de-designation was not material to the consolidated statement of operations for the fiscal year ended December 29, 2019. As of December 29, 2019, the remaining loss of $9.3 million was included in OCI related to this de-designated hedge and will be amortized to interest expense over the remaining term of the interest rate swap when the hedged transaction affects earnings, of which an immaterial amount was reclassified to earnings in the fiscal year ended January 3, 2021 due to the fact that the underlying instrument was not effective until December 31, 2020.
During the quarter ended April 1, 2018, the Company changed from a 3-month LIBOR index to a 1-month LIBOR index for its Senior Secured Credit Facilities, in accordance with the terms of the agreement. The interest rate caps are based on a 3-month LIBOR index. As the critical terms of the interest rate cap no longer match the hedged transactions, they do not qualify for hedge accounting, which resulted in their de-designation. Accordingly, the Company recorded the activity related to the hedges through the date of the de-designation as cash flow hedges, as well as a $5.3 million gain related to ineffectiveness, which was recorded in interest expense, net, in the consolidated statement of operations for the fiscal year ended December 30, 2018. Subsequent to the de-designation, the Company recorded the activity related to the hedges as mark to market, with the impact recorded to “Other expense (income), net”. As of January 3, 2021 the remaining gain of $8.5 million included in OCI related to the de-designated hedges was reclassified to earnings.
Foreign currency hedging
The Company has currency risk exposures relating primarily to foreign currency denominated monetary assets and liabilities and forecasted foreign currency denominated intercompany and third-party transactions. The Company uses foreign currency forward
F-54
Ortho Clinical Diagnostics Holdings plc (formerly known as Ortho-Clinical Diagnostics Bermuda Co. Ltd.)
Notes to Consolidated Financial Statements
January 3, 2021
(Dollars in millions, unless otherwise stated)
and option contracts to manage its currency risk exposures. The following table provides details of the foreign currency forward and option contracts outstanding as of January 3, 2021:
|
Description (a) |
|
Notional amount |
|
|
Hedge designation |
|
|
Forward foreign currency contracts |
|
$ |
234.3 |
|
|
Cash Flow Hedge |
|
Forward foreign currency contracts |
|
$ |
46.9 |
|
|
Not designated |
|
Option foreign currency contracts |
|
$ |
— |
|
|
Not designated |
|
|
(a) |
The Company’s forward currency foreign exchange contracts are denominated primarily in Australian Dollar, Brazilian Real, British Pound, Canadian Dollar, Chilean Peso, Chinese Yuan/Renminbi, Colombian Peso, Euro, Indian Rupee, Japanese Yen, Mexican Peso, Philippine Peso, Swiss Franc and the Thai Baht. The Company’s foreign currency option contracts are denominated in Chinese Yuan/Renminbi (offshore). |
The foreign currency forward contracts that qualified and were designated as cash flow hedges are recorded at their fair value as of January 3, 2021 and the unrealized loss of $4.8 million is reported as a component of OCI, all of which is expected to be reclassified to earnings in the next 12 months. Actual gains (losses) upon settlement will be recognized in earnings, within the line item impacted, during the estimated time in which the transactions occur.
Fair value gains and losses of derivative contracts and interest rate derivatives, as determined using Level 2 inputs, that are designated and qualify as cash flow hedges during the fiscal years ended January 3, 2021 and December 29, 2019, are recorded as follows:
|
Derivatives in cash flow hedging relationships |
|
Amount of loss (gain) recognized in OCI on derivatives |
|
|
Location of loss reclassified from accumulated OCI into income |
|
Amount of loss (gain) reclassified from accumulated OCI into income |
|
||
|
Fiscal year ended January 3, 2021 |
|
|
|
|
|
|
|
|
|
|
|
Foreign currency forward contracts |
|
$ |
2.3 |
|
|
Cost of Revenue |
|
$ |
(5.3 |
) |
|
Interest rate derivatives |
|
|
47.1 |
|
|
Interest expense |
|
|
(1.0 |
) |
|
Fiscal year ended December 29, 2019 |
|
|
|
|
|
|
|
|
|
|
|
Foreign currency forward contracts |
|
$ |
(3.1 |
) |
|
Cost of Revenue |
|
$ |
(1.0 |
) |
|
Interest rate derivatives |
|
|
9.8 |
|
|
Interest expense |
|
|
(7.8 |
) |
F-55
Ortho Clinical Diagnostics Holdings plc (formerly known as Ortho-Clinical Diagnostics Bermuda Co. Ltd.)
Notes to Consolidated Financial Statements
January 3, 2021
(Dollars in millions, unless otherwise stated)
The following table presents the effect of the Company’s derivative instruments on the statements of operations and comprehensive loss:
|
|
|
Fiscal year ended January 3, 2021 |
|
|
Fiscal year ended December 29, 2019 |
|
||||||||||
|
|
|
Interest expense |
|
|
Cost of revenue |
|
|
Interest expense |
|
|
Cost of revenue |
|
||||
|
Total amounts of financial statement line item presented in the statements of operations and comprehensive loss in which the effects of cash flow hedges are recorded |
|
$ |
198.2 |
|
|
$ |
908.2 |
|
|
$ |
231.4 |
|
|
$ |
922.4 |
|
|
The effects of cash flow hedging |
|
|
|
|
|
|
|
|
|
|
|
|
|
|
|
|
|
Loss (Gain) on cash flow hedging relationships: |
|
|
|
|
|
|
|
|
|
|
|
|
|
|
|
|
|
Foreign currency forward contracts |
|
|
|
|
|
|
|
|
|
|
|
|
|
|
|
|
|
Amount of loss (gain) reclassified from accumulated OCI into income |
|
N/A |
|
|
$ |
(5.3 |
) |
|
N/A |
|
|
$ |
(1.0 |
) |
||
|
Amount reclassified from accumulated OCI into income due to a forecast transaction that is no longer probable of occurring |
|
N/A |
|
|
$ |
— |
|
|
N/A |
|
|
$ |
— |
|
||
|
Interest Rate Derivatives |
|
|
|
|
|
|
|
|
|
|
|
|
|
|
|
|
|
Amount of loss (gain) reclassified from accumulated OCI into income |
|
$ |
(1.0 |
) |
|
N/A |
|
|
$ |
(7.8 |
) |
|
N/A |
|
||
|
Amount excluded from the assessment of effectiveness recognized in earnings based on changes in fair value |
|
$ |
— |
|
|
N/A |
|
|
$ |
— |
|
|
N/A |
|
||
Fair value gains and losses of derivative contracts, as determined using Level 2 inputs, that do not qualify for hedge accounting treatment are recorded in earnings as follows:
|
|
|
|
|
Fiscal year ended |
|
|||||||||
|
Derivatives not designated as hedging instruments under ASC 815 |
|
Location of (gain) loss recognized in earnings on derivatives |
|
January 3, 2021 |
|
|
December 29, 2019 |
|
|
December 30, 2018 |
|
|||
|
Interest rate cap derivatives |
|
Other expense, net |
|
$ |
1.5 |
|
|
$ |
16.0 |
|
|
$ |
2.7 |
|
|
Foreign currency derivatives |
|
Other expense, net |
|
|
(2.1 |
) |
|
|
(1.8 |
) |
|
|
0.1 |
|
|
Cross currency swaps |
|
Other expense, net |
|
|
6.0 |
|
|
|
— |
|
|
|
— |
|
The following table presents the location and fair values using Level 2 inputs of derivative instruments that qualify and have been designated as cash flow hedges included in the consolidated balance sheet:
|
|
|
January 3, 2021 |
|
|
December 29, 2019 |
|
||
|
Interest rate derivatives: |
|
|
|
|
|
|
|
|
|
Accrued liabilities |
|
$ |
0.1 |
|
|
$ |
— |
|
|
Other long-term liabilities |
|
|
44.1 |
|
|
|
4.4 |
|
|
Foreign currency forward contracts: |
|
|
|
|
|
|
|
|
|
Other current assets |
|
|
4.2 |
|
|
|
6.8 |
|
|
Accrued liabilities |
|
|
10.0 |
|
|
|
4.0 |
|
F-56
Ortho Clinical Diagnostics Holdings plc (formerly known as Ortho-Clinical Diagnostics Bermuda Co. Ltd.)
Notes to Consolidated Financial Statements
January 3, 2021
(Dollars in millions, unless otherwise stated)
The following table presents the location and fair values using Level 2 inputs of derivative instruments that have not been designated as hedges included in the consolidated balance sheet:
|
|
|
January 3, 2021 |
|
|
December 29, 2019 |
|
||
|
|
|
|
|
|
|
|
|
|
|
Interest rate cap derivatives: |
|
|
|
|
|
|
|
|
|
Accrued liabilities |
|
$ |
0.1 |
|
|
$ |
2.3 |
|
|
Other long-term liabilities |
|
|
11.1 |
|
|
|
10.4 |
|
|
Foreign currency derivative contracts: |
|
|
|
|
|
|
|
|
|
Other current assets |
|
|
0.3 |
|
|
|
1.5 |
|
|
Accrued liabilities |
|
|
0.1 |
|
|
|
0.5 |
|
|
Cross currency swaps |
|
|
|
|
|
|
|
|
|
Other current assets |
|
|
2.0 |
|
|
|
— |
|
|
Other long-term liabilities |
|
|
10.8 |
|
|
|
— |
|
|
(24) |
Accumulated other comprehensive loss |
The following table summarizes the changes in accumulated other comprehensive income (loss) (“AOCI”), net of tax:
|
|
|
Pension and other postemployment benefits |
|
|
Foreign currency derivatives |
|
|
Interest rate cap derivatives |
|
|
Unrealized foreign currency translation adjustments |
|
|
Accumulated other comprehensive loss |
|
|||||
|
Balance at December 31, 2017 |
|
$ |
(8.8 |
) |
|
$ |
(2.0 |
) |
|
$ |
7.7 |
|
|
$ |
(42.4 |
) |
|
$ |
(45.5 |
) |
|
Current period deferrals |
|
|
1.1 |
|
|
|
2.0 |
|
|
|
6.9 |
|
|
|
(21.2 |
) |
|
|
(11.2 |
) |
|
Amounts reclassified to net loss |
|
|
6.7 |
|
|
|
0.6 |
|
|
|
(2.8 |
) |
|
|
— |
|
|
|
4.5 |
|
|
Net change |
|
|
7.8 |
|
|
|
2.6 |
|
|
|
4.1 |
|
|
|
(21.2 |
) |
|
|
(6.7 |
) |
|
Balance at December 30, 2018 |
|
|
(1.0 |
) |
|
|
0.6 |
|
|
|
11.8 |
|
|
|
(63.6 |
) |
|
|
(52.2 |
) |
|
Current period deferrals |
|
|
(2.3 |
) |
|
|
3.1 |
|
|
|
(9.6 |
) |
|
|
(0.9 |
) |
|
|
(9.7 |
) |
|
Amounts reclassified to net loss |
|
|
(1.0 |
) |
|
|
(1.0 |
) |
|
|
(7.8 |
) |
|
|
— |
|
|
|
(9.8 |
) |
|
Cumulative effect of change in accounting standard |
|
|
— |
|
|
|
— |
|
|
|
(0.2 |
) |
|
|
— |
|
|
|
(0.2 |
) |
|
Net change |
|
|
(3.3 |
) |
|
|
2.1 |
|
|
|
(17.6 |
) |
|
|
(0.9 |
) |
|
|
(19.7 |
) |
|
Balance at December 29, 2019 |
|
|
(4.3 |
) |
|
|
2.7 |
|
|
|
(5.8 |
) |
|
|
(64.5 |
) |
|
|
(71.9 |
) |
|
Current period deferrals |
|
|
(0.1 |
) |
|
|
(2.3 |
) |
|
|
(47.1 |
) |
|
|
59.4 |
|
|
|
9.9 |
|
|
Amounts reclassified to net loss |
|
|
(0.1 |
) |
|
|
(5.3 |
) |
|
|
(1.0 |
) |
|
|
— |
|
|
|
(6.4 |
) |
|
Net change |
|
|
(0.2 |
) |
|
|
(7.6 |
) |
|
|
(48.1 |
) |
|
|
59.4 |
|
|
|
3.5 |
|
|
Balance at January 3, 2021 |
|
$ |
(4.5 |
) |
|
$ |
(4.9 |
) |
|
$ |
(53.9 |
) |
|
$ |
(5.1 |
) |
|
$ |
(68.4 |
) |
Amounts reclassified to net loss for the fiscal year ended December 30, 2018 included the release of AOCI related to the U.S. retiree health care reimbursement plan curtailment of $7.5 million. See further discussion of the AOCI related to pension and other postemployment benefits and the U.S. retiree health care reimbursement plan curtailment in Note 14—Long-Term Employee Benefits.
The income tax related to the change in pension and other postemployment benefits for the fiscal year ended January 3, 2021, December 29, 2019 and December 30, 2018 was immaterial. Foreign currency translation is not adjusted for income taxes relating to permanent investments in foreign subsidiaries.
F-57
Ortho Clinical Diagnostics Holdings plc (formerly known as Ortho-Clinical Diagnostics Bermuda Co. Ltd.)
Notes to Consolidated Financial Statements
January 3, 2021
(Dollars in millions, unless otherwise stated)
Ortho Clinical Diagnostics Holdings plc (formerly known as Ortho-Clinical Diagnostics Bermuda Co. Ltd.)
(Parent Company Only)
Statements of operations and comprehensive loss
(In millions)
|
|
|
Fiscal year ended |
|
|||||||||
|
|
|
January 3, 2021 |
|
|
December 29, 2019 |
|
|
December 30, 2018 |
|
|||
|
Equity in loss of subsidiaries |
|
$ |
(211.9 |
) |
|
$ |
(156.9 |
) |
|
$ |
(248.8 |
) |
|
Net loss |
|
|
(211.9 |
) |
|
|
(156.9 |
) |
|
|
(248.8 |
) |
|
Equity in other comprehensive (loss) income of subsidiaries |
|
|
4.2 |
|
|
|
(19.7 |
) |
|
|
(6.7 |
) |
|
Total comprehensive loss |
|
$ |
(207.7 |
) |
|
$ |
(176.6 |
) |
|
$ |
(255.5 |
) |
F-58
Ortho Clinical Diagnostics Holdings plc (formerly known as Ortho-Clinical Diagnostics Bermuda Co. Ltd.)
Notes to Consolidated Financial Statements
January 3, 2021
(Dollars in millions, unless otherwise stated)
Ortho Clinical Diagnostics Holdings plc (formerly known as Ortho-Clinical Diagnostics Bermuda Co. Ltd.)
(Parent Company Only)
Balance sheets
(In millions, except share and per share data)
|
|
|
January 3, 2021 |
|
|
December 29, 2019 |
|
||
|
Assets |
|
|
|
|
|
|
|
|
|
Current assets: |
|
|
|
|
|
|
|
|
|
Cash and cash equivalents |
|
$ |
1.8 |
|
|
$ |
— |
|
|
Receivables from subsidiaries |
|
|
0.2 |
|
|
|
0.2 |
|
|
Loans receivable from subsidiaries |
|
|
3.2 |
|
|
|
3.2 |
|
|
Total assets |
|
$ |
5.2 |
|
|
$ |
3.4 |
|
|
Liabilities and Stockholders’ Equity (Deficit) |
|
|
|
|
|
|
|
|
|
Payables to subsidiaries |
|
|
0.8 |
|
|
|
0.8 |
|
|
Investments in subsidiaries |
|
|
1,015.2 |
|
|
|
815.4 |
|
|
Total liabilities |
|
|
1,016.0 |
|
|
|
816.2 |
|
|
Common stock, $0.00001 par, 1,000,000,000 shares authorized, 146,437,574 and 146,437,574 shares issued and outstanding as of January 3, 2021 and December 29, 2019, respectively |
|
|
— |
|
|
|
— |
|
|
Additional paid-in capital |
|
|
975.1 |
|
|
|
964.7 |
|
|
Accumulated deficit |
|
|
(1,985.9 |
) |
|
|
(1,777.5 |
) |
|
Total stockholders’ deficit |
|
|
(1,010.8 |
) |
|
|
(812.8 |
) |
|
Total liabilities and stockholders’ deficit |
|
$ |
5.2 |
|
|
$ |
3.4 |
|
F-59
Ortho Clinical Diagnostics Holdings plc (formerly known as Ortho-Clinical Diagnostics Bermuda Co. Ltd.)
Notes to Consolidated Financial Statements
January 3, 2021
(Dollars in millions, unless otherwise stated)
Ortho Clinical Diagnostics Holdings plc (formerly known as Ortho-Clinical Diagnostics Bermuda Co. Ltd.)
(Parent Company Only)
Statements of cash flows
(In million)
|
|
|
Fiscal year ended |
|
|||||||||
|
|
|
January 3, 2021 |
|
|
December 29, 2019 |
|
|
December 30, 2018 |
|
|||
|
Cash Flows from Operating activities: |
|
|
|
|
|
|
|
|
|
|
|
|
|
Net loss |
|
$ |
(211.9 |
) |
|
$ |
(156.9 |
) |
|
$ |
(248.8 |
) |
|
Adjustments to reconcile net loss to cash provided by (used in) operating activities: |
|
|
|
|
|
|
|
|
|
|
|
|
|
Equity loss in subsidiaries |
|
|
211.9 |
|
|
|
156.9 |
|
|
|
248.8 |
|
|
Changes in operating assets and liabilities: |
|
|
— |
|
|
|
— |
|
|
|
— |
|
|
Cash used in operating activities |
|
|
— |
|
|
|
— |
|
|
|
— |
|
|
Cash Flows from Investing activities: |
|
|
|
|
|
|
|
|
|
|
|
|
|
Loans to subsidiaries |
|
|
— |
|
|
|
(3.3 |
) |
|
|
— |
|
|
Cash used in investing activities |
|
|
— |
|
|
|
(3.3 |
) |
|
|
— |
|
|
Cash Flows from Financing activities: |
|
|
|
|
|
|
|
|
|
|
|
|
|
Proceeds from exercise of stock options |
|
|
1.8 |
|
|
|
— |
|
|
|
0.2 |
|
|
Repurchase of common stock |
|
|
— |
|
|
|
(0.3 |
) |
|
|
(0.5 |
) |
|
Cash provided (used in) by financing activities |
|
|
1.8 |
|
|
|
(0.3 |
) |
|
|
(0.3 |
) |
|
Effect of exchange rate changes on cash |
|
|
— |
|
|
|
— |
|
|
|
— |
|
|
Increase (decrease) in cash, cash equivalents and restricted cash |
|
|
1.8 |
|
|
|
(3.6 |
) |
|
|
(0.3 |
) |
|
Cash, cash equivalents and restricted cash at beginning of year |
|
|
— |
|
|
|
3.6 |
|
|
|
3.9 |
|
|
Cash, cash equivalents and restricted cash at end of year |
|
$ |
1.8 |
|
|
$ |
— |
|
|
$ |
3.6 |
|
F-60
Ortho Clinical Diagnostics Holdings plc (formerly known as Ortho-Clinical Diagnostics Bermuda Co. Ltd.)
Notes to Consolidated Financial Statements
January 3, 2021
(Dollars in millions, unless otherwise stated)
Note to Registrant’s Condensed Financial Statements (Parent Company Only)
Basis of Presentation
These condensed Ortho Clinical Diagnostics Holdings plc (“Ortho” or “Parent Company”) only financial statements have been prepared in accordance with Rule 12-04 of Regulation S-X, as the restricted net assets of the subsidiaries of the Parent Company exceed 25% of the consolidated net assets of the Parent Company as stipulated by Rule 5-04, Section I from Regulation S-X. The ability of the Parent Company’s operating subsidiaries to pay dividends is restricted due to the terms of the subsidiaries’ Credit Agreement and indentures as defined in Note 9, “Borrowings,” to the consolidated financial statements.
UK Holdco is a holding company that conducts substantially all of its business operations through its subsidiaries. These condensed Parent Company only financial statements have been prepared using the same accounting principles and policies described in the notes to the consolidated financial statements, with the only exception being that the Parent Company accounts for investments in its subsidiaries using the equity method. These condensed financial statements should be read in conjunction with the consolidated financial statements and related notes thereto.
|
(26) |
Unaudited quarterly financial information |
Unaudited financial results by quarter for the fiscal year ended January 3, 2021 and for the fiscal year ended December 29, 2019 are summarized below:
|
|
|
Fiscal quarter ended |
|
|||||||||||||
|
($ in millions, except per share data) |
|
March 29, 2020 |
|
|
June 28, 2020 |
|
|
September 27, 2020 |
|
|
January 3, 2021 |
|
||||
|
Net revenue |
|
$ |
408.0 |
|
|
$ |
390.5 |
|
|
$ |
451.1 |
|
|
$ |
516.6 |
|
|
Gross profit |
|
|
194.8 |
|
|
|
187.6 |
|
|
|
217.0 |
|
|
|
258.6 |
|
|
Income from operations |
|
|
11.9 |
|
|
|
15.3 |
|
|
|
20.7 |
|
|
|
40.4 |
|
|
Net loss |
|
|
(101.2 |
) |
|
|
(41.3 |
) |
|
|
(28.5 |
) |
|
|
(40.9 |
) |
|
Basic and diluted net loss per common share |
|
$ |
(0.69 |
) |
|
$ |
(0.28 |
) |
|
$ |
(0.20 |
) |
|
$ |
(0.28 |
) |
|
|
|
Fiscal quarter ended |
|
|||||||||||||
|
($ in millions, except per share data) |
|
March 31, 2019 |
|
|
June 30, 2019 |
|
|
September 29, 2019 |
|
|
December 29, 2019 |
|
||||
|
Net revenue |
|
$ |
420.9 |
|
|
$ |
453.7 |
|
|
$ |
453.2 |
|
|
$ |
473.7 |
|
|
Gross profit |
|
|
204.5 |
|
|
|
218.2 |
|
|
|
221.1 |
|
|
|
235.3 |
|
|
Income from operations |
|
|
0.0 |
|
|
|
27.7 |
|
|
|
27.5 |
|
|
|
30.3 |
|
|
Net income (loss) |
|
|
(55.0 |
) |
|
|
(51.4 |
) |
|
|
(52.1 |
) |
|
|
1.6 |
|
|
Basic and diluted net income (loss) per common share |
|
$ |
(0.38 |
) |
|
$ |
(0.35 |
) |
|
$ |
(0.36 |
) |
|
$ |
0.01 |
|
F-61