Attached files
| file | filename |
|---|---|
| EX-32.2 - EX-32.2 - MetroCity Bankshares, Inc. | mcbs-20201231ex322d6faaf.htm |
| EX-32.1 - EX-32.1 - MetroCity Bankshares, Inc. | mcbs-20201231ex321c2d327.htm |
| EX-31.2 - EX-31.2 - MetroCity Bankshares, Inc. | mcbs-20201231ex3126ca2c8.htm |
| EX-31.1 - EX-31.1 - MetroCity Bankshares, Inc. | mcbs-20201231ex311f21963.htm |
| EX-23.1 - EX-23.1 - MetroCity Bankshares, Inc. | mcbs-20201231ex2313b369d.htm |
| EX-21.1 - EX-21.1 - MetroCity Bankshares, Inc. | mcbs-20201231ex21193c906.htm |
| EX-4.1 - EX-4.1 - MetroCity Bankshares, Inc. | mcbs-20201231ex41531e2e8.htm |
UNITED STATES
SECURITIES AND EXCHANGE COMMISSION
WASHINGTON, D.C. 20549
FORM 10-K
(Mark One)
☒ ANNUAL REPORT PURSUANT TO SECTION 13 OR 15(d) OF THE SECURITIES EXCHANGE ACT OF 1934
For the fiscal year ended December 31, 2020
OR
◻ TRANSITION REPORT PURSUANT TO SECTION 13 OR 15(d) OF THE SECURITIES EXCHANGE ACT OF 1934
Commission File Number 001-39068
METROCITY BANKSHARES, INC.
(Exact name of registrant as specified in its charter)
Georgia | 47-2528408 |
5114 Buford Highway | 30340 |
(770) 455-4989
(Registrant’s telephone number, including area code)
Securities registered pursuant to Section 12(b) of the Act:
Title of each class | Trading Symbol(s) | Name of each Exchange on which registered |
Common Stock, par value $0.01 per share | MCBS | Nasdaq Global Select Market |
Securities registered pursuant to Section 12(g) of the Act: None
Indicate by check mark if the registrant is a well-known seasoned issuer, as defined in Rule 405 of the Securities Act. Yes ☐ No ☒
Indicate by check mark if the registrant is not required to file reports pursuant to Section 13 or Section 15(d) of the Act. Yes ☐ No ☒
Indicate by check mark whether the registrant (1) has filed all reports required to be filed by Section 13 or 15(d) of the Securities Exchange Act of 1934 during the preceding 12 months (or for such shorter period that the registrant was required to file such reports), and (2) has been subject to such filing requirements for the past 90 days. Yes ☒ No ☐
Indicate by check mark whether the registrant has submitted electronically every Interactive Data File required to be submitted pursuant to Rule 405 of Regulation S-T (§232.405 of this chapter) during the preceding 12 months (or for such shorter period that the registrant was required to submit such files). Yes ☒ No ☐
Indicate by check mark whether the registrant is a large accelerated filer, an accelerated filer, a non-accelerated filer, a smaller reporting company, or an emerging growth company. See the definitions of “large accelerated filer,” “accelerated filer,” “smaller reporting company,” and “emerging growth company” in Rule 12b-2 of the Exchange Act.
Large accelerated filer | ☐ | Accelerated filer | ☒ | Non-accelerated filer | ☐ | Smaller reporting company | ☒ |
| | | | | | | |
Emerging growth company | ☒ | | | | | | |
If an emerging growth company, indicate by check mark if the registrant has elected not to use the extended transition period for complying with any new or revised financial accounting standards provided pursuant to Section 13(a) of the Exchange Act. ☒
Indicate by check mark whether the registrant has filed a report on and attestation to its management’s assessment of the effectiveness of its internal control over financial reporting under Section 404(b) of the Sarbanes Oxley Act (15 U.S.C. 762(b)) by the registered public accounting firm that prepared or issued its audit report. ☐
Indicate by check mark whether the registrant is a shell company (as defined in Rule 12b-2 of the Exchange Act). Yes ☐ No ☒
As of June 30, 2020 (the last business day of the registrant’s most recently completed second fiscal quarter), the aggregate market value of the common stock held by non-affiliates was $256.3 million based upon the closing price of $14.33 as reported on Nasdaq on June 30, 2020.
As of March 10, 2021, the registrant had 25,674,573 shares of common stock issued and outstanding.
DOCUMENTS INCORPORATED BY REFERENCE
Portions of the registrant’s Proxy Statement for the 2021 Annual Meeting of Shareholders are incorporated by reference into Part III of this Annual Report on Form 10-K to the extent stated herein. Such Proxy Statement will be filed with the Securities and Exchange Commission within 120 days after the end of the registrant’s fiscal year ended December 31, 2020.
METROCITY BANKSHARES, INC.
2020 ANNUAL REPORT ON FORM 10-K
|
| |
| Page |
| | | | |
| | | | |
| | 6 | ||
| | 22 | ||
| | 39 | ||
| | 39 | ||
| | 39 | ||
| | 39 | ||
| | | | |
| | | | |
| | 40 | ||
| | 42 | ||
| Management’s Discussion and Analysis of Financial Condition and Results of Operations | | 43 | |
| | 67 | ||
| | 70 | ||
| Changes in Disagreements With Accountants on Accounting and Financial Disclosure | | 113 | |
| | 113 | ||
| | 114 | ||
| | | | |
| | | | |
| | 114 | ||
| | 114 | ||
| Security Ownership of Certain Beneficial Owners and Management and Related Shareholder Matters | | 114 | |
| Certain Relationships and Related Transactions, and Director Independence | | 114 | |
| | 115 | ||
| | | | |
| | | | |
| | 115 | ||
| | 116 | ||
| | | ||
| 117 | |||
2
CAUTIONARY NOTE REGARDING FORWARD-LOOKING STATEMENTS
This Annual Report on Form 10-K contains forward-looking statements within the meaning of Section 27A of the Securities Act of 1933, as amended (the “Securities Act”) and Section 21E of the Securities Exchange Act of 1934, as amended (the “Exchange Act”). These forward-looking statements reflect our current views with respect to, among other things, future events and our financial performance. These statements are often, but not always, made through the use of words or phrases such as “may,” “might,” “should,” “could,” “predict,” “potential,” “believe,” “expect,” “continue,” “will,” “anticipate,” “seek,” “estimate,” “intend,” “plan,” “strive,” “projection,” “goal,” “target,” “outlook,” “aim,” “would,” “annualized” and “outlook,” or the negative version of those words or other comparable words or phrases of a future or forward-looking nature. These forward-looking statements are not historical facts, and are based on current expectations, estimates and projections about our industry, management’s beliefs and certain assumptions made by management, many of which, by their nature, are inherently uncertain and beyond our control, particularly with regard to developments related to the COVID-19 pandemic. Accordingly, we caution you that any such forward-looking statements are not guarantees of future performance and are subject to risks, assumptions, estimates and uncertainties that are difficult to predict. Although we believe that the expectations reflected in these forward-looking statements are reasonable as of the date made, actual results may prove to be materially different from the results expressed or implied by the forward-looking statements.
A number of important factors could cause our actual results to differ materially from those indicated in these forward-looking statements, including those factors discussed elsewhere in this annual report and the following:
| ● | business and economic conditions, particularly those affecting the financial services industry and our primary market areas; |
| ● | the impact of the COVID-19 pandemic on our business, including the impact of the actions taken by governmental authorities to try and contain the virus or address the impact of the virus on the United States economy (including, without limitations, the Coronavirus Aid, Relief and Economic Security (“CARES”) Act), and the resulting effect of all of such items on our operations, liquidity and capital position, and on the financial condition of our borrowers and other customers; |
| ● | adverse results from current or future litigation, regulatory examinations or other legal and/or regulatory actions related to the COVID-19 pandemic, including as a result of participation in and execution of government programs related to the COVID-19 pandemic, including, but not limited to, the Paycheck Protection Program (“PPP”); |
| ● | factors that can impact the performance of our loan portfolio, including real estate values and liquidity in our primary market areas, the financial health of our borrowers and the success of various projects that we finance; |
| ● | concentration of our loan portfolio in real estate loans changes in the prices, values and sales volumes of commercial and residential real estate; |
| ● | credit and lending risks associated with our construction and development, commercial real estate, commercial and industrial, residential real estate and SBA loan portfolios; |
| ● | negative impact in our mortgage banking services, including declines in our mortgage originations or profitability due to rising interest rates and increased competition and regulation, the Bank’s or third party’s failure to satisfy mortgage servicing obligations, and the possibility of the Bank being required to repurchase mortgage loans or indemnify buyers; |
| ● | our ability to attract sufficient loans that meet prudent credit standards, including in our construction and development, commercial and industrial and owner-occupied commercial real estate loan categories; |
3
| ● | our ability to attract and maintain business banking relationships with well-qualified businesses, real estate developers and investors with proven track records in our market areas; |
| ● | changes in interest rate environment, including changes to the federal funds rate, and competition in our markets may result in increased funding costs or reduced earning assets yields, thus reducing our margins and net interest income; |
| ● | our ability to successfully manage our credit risk and the sufficiency of our allowance for loan losses (“ALL”); |
| ● | the adequacy of our reserves (including ALL) and the appropriateness of our methodology for calculating such reserves; |
| ● | our ability to successfully execute our business strategy to achieve profitable growth; |
| ● | the concentration of our business within our geographic areas of operation and to the general Asian-American population within our primary market areas; |
| ● | our focus on small and mid-sized businesses; |
| ● | our ability to manage our growth; |
| ● | our ability to increase our operating efficiency; |
| ● | liquidity issues, including fluctuations in the fair value and liquidity of the securities we hold for sale and our ability to raise additional capital, if necessary; |
| ● | failure to maintain adequate liquidity and regulatory capital and comply with evolving federal and state banking regulations; |
| ● | risks that our cost of funding could increase, in the event we are unable to continue to attract stable, low-cost deposits and reduce our cost of deposits; |
| ● | a large percentage of our deposits are attributable to a relatively small number of customers; |
| ● | inability of our risk management framework to effectively mitigate credit risk, interest rate risk, liquidity risk, price risk, compliance risk, operational risk, strategic risk and reputational risk; |
| ● | the makeup of our asset mix and investments; |
| ● | external economic, political and/or market factors, such as changes in monetary and fiscal policies and laws, including the interest rate policies of the Federal Reserve, inflation or deflation, changes in the demand for loans, and fluctuations in consumer spending, borrowing and savings habits, which may have an adverse impact on our financial condition; |
| ● | continued or increasing competition from other financial institutions, credit unions, and non-bank financial services companies, many of which are subject to different regulations than we are; |
| ● | challenges arising from unsuccessful attempts to expand into new geographic markets, products, or services; |
| ● | restraints on the ability of the Bank to pay dividends to us, which could limit our liquidity; |
4
| ● | increased capital requirements imposed by banking regulators, which may require us to raise capital at a time when capital is not available on favorable terms or at all; |
| ● | a failure in the internal controls we have implemented to address the risks inherent to the business of banking; |
| ● | inaccuracies in our assumptions about future events, which could result in material differences between our financial projections and actual financial performance; |
| ● | changes in our management personnel or our inability to retain motivate and hire qualified management personnel; |
| ● | the dependence of our operating model on our ability to attract and retain experienced and talented bankers in each of our markets; |
| ● | our ability to identify and address cyber-security risks, fraud and systems errors; |
| ● | disruptions, security breaches, or other adverse events, failures or interruptions in, or attacks on, our information technology systems; |
| ● | disruptions, security breaches, or other adverse events affecting the third-party vendors who perform several of our critical processing functions; |
| ● | an inability to keep pace with the rate of technological advances due to a lack of resources to invest in new technologies; |
| ● | fraudulent and negligent acts by our clients, employees or vendors and our ability to identify and address such acts; |
| ● | risks related to potential acquisitions; |
| ● | the expenses that we will incur to operate as a public company and our inexperience complying with the requirements of being a public company; |
| ● | the impact of any claims or legal actions to which we may be subject, including any effect on our reputation; |
| ● | compliance with governmental and regulatory requirements, including the Dodd-Frank Act and others relating to banking, consumer protection, securities and tax matters, and our ability to maintain licenses required in connection with commercial mortgage origination, sale and servicing operations; |
| ● | changes in the scope and cost of FDIC insurance and other coverage; |
| ● | changes in our accounting standards; |
| ● | changes in tariffs and trade barriers; |
| ● | changes in federal tax law or policy; and |
| ● | other risks and factors identified in this Form 10-K under the heading “Risk Factors”. |
The foregoing factors should not be construed as exhaustive and should be read together with the other cautionary statements included in this Annual Report on Form 10-K. Because of these risks and other uncertainties, our actual future results, performance or achievement, or industry results, may be materially different from the results indicated by the
5
forward looking statements in this Annual Report on Form 10-K. In addition, our past results of operations are not necessarily indicative of our future results. You should not rely on any forward looking statements, which represent our beliefs, assumptions and estimates only as of the dates on which they were made, as predictions of future events. Any forward-looking statement speaks only as of the date on which it is made, and we do not undertake any obligation to update or review any forward-looking statement, whether as a result of new information, future developments or otherwise.
Our Company
We are MetroCity Bankshares, Inc. (the “Company”), a bank holding company incorporated in 2014 and headquartered in the Atlanta metropolitan area. We operate through our wholly-owned banking subsidiary, Metro City Bank, a Georgia state-chartered commercial bank that was founded in 2006 (the “Bank”). We currently operate 19 full-service branch locations in multi-ethnic communities in Alabama, Florida, Georgia, New York, New Jersey, Texas and Virginia. As of December 31, 2020, we had total assets of $1.90 billion, total loans of $1.63 billion, total deposits of $1.48 billion and total shareholders’ equity of $244.8 million.
We are a full-service commercial bank focused on delivering personalized service in an efficient and reliable manner to the small- to medium-sized businesses and individuals in our markets, predominantly Asian-American communities in growing metropolitan markets in the Eastern U.S. and Texas. We offer a suite of loan and deposit products tailored to meet the needs of the businesses and individuals already established in our communities, as well as first generation immigrants who desire to establish and grow their own businesses, purchase a home, or educate their children in the United States. Through our diverse and experienced management team and talented employees, we are able to speak the language of our customers and provide them with services and products in a culturally competent manner.
We have successfully grown our franchise since our founding primarily through de novo branch openings in vibrant, diverse markets where we feel our banking products and services will be well-received. We have a proven track record of opening these new branches in a disciplined, cost efficient manner, without compromising the quality of our customer service or our profitability. Our consistent expansion efforts have given us the know-how and expertise to lower the cost of opening and operating de novo branches, allowing each of these branches to quickly become profitable.
We believe that our culturally familiar approach to banking, our tailored lending products, our branch network located in attractive Asian-American communities, and our highly replicable growth model have laid the foundation for achieving sustainable, profitable growth.
On August 30, 2019, we effected a two-for-one split of our common stock in the form of a stock dividend, whereby each holder of our common stock received one additional share of common stock for each share owned as of the record date of August 15, 2019. The effect of the stock dividend on outstanding shares and per share figures has been retroactively applied to all periods presented in this Annual Report on Form 10-K.
We completed an initial public offering of our common stock in October 2019 as an emerging growth company under the Jumpstart Our Business Startups Act of 2012 (the “JOBS Act”). Our common stock is listed on the Nasdaq Global Select Market under the symbol “MCBS”.
Our Markets
We are located primarily in the Atlanta metropolitan area with our headquarters in Doraville, Georgia. Our 19 full-service branch locations in Alabama, Florida, Georgia, New York, New Jersey, Texas and Virginia are located in growing multi-ethnic communities. Additionally, we continue to monitor attractive markets where we would like to expand our presence.
6
Lending Activities
We maintain a diversified loan portfolio based on the type of customer (i.e., businesses compared to individuals), type of loan product (e.g., construction and development loans, commercial real estate loans (both owner occupied and non-owner occupied), commercial and industrial loans, residential mortgage loans, SBA loans, etc.), geographic location and industries in which our business customers are engaged (e.g., retail, hospitality, etc.). We principally focus our lending activities on loans that we originate from borrowers located in our market areas. We seek to be the premier provider of lending products to the small to medium-sized businesses and individual borrowers in the communities that we serve. Lending activities primarily originate from the relationships and efforts of our bankers, with an emphasis on providing banking solutions tailored to meet our customers’ needs while maintaining our underwriting standards.
The sections below discuss our general loan categories. As of December 31, 2020 and 2019, our loan portfolio consisted of the following:
| | December 31, 2020 | | December 31, 2019 |
| ||||||
(Dollars in thousands) |
| Amount |
| % of Total |
| Amount |
| % of Total |
| ||
Construction and Development | | $ | 45,653 |
| 2.8 | % | $ | 31,739 |
| 2.7 | % |
Commercial Real Estate | |
| 477,419 |
| 29.2 | |
| 424,950 |
| 36.5 | |
Commercial and Industrial | |
| 137,239 |
| 8.4 | |
| 53,105 |
| 4.6 | |
Residential Real Estate | |
| 974,445 |
| 59.6 | |
| 651,645 |
| 56.0 | |
Consumer and other | |
| 183 |
| — | |
| 1,768 |
| 0.2 | |
Gross loans | | $ | 1,634,939 |
| 100.0 | | $ | 1,163,207 |
| 100.0 | |
Less unearned income | |
| (4,595) |
|
| |
| (2,045) |
|
| |
Total loans held for investment | | $ | 1,630,344 |
|
| | $ | 1,161,162 |
|
| |
Construction and Development Loans. Our construction and development loans are comprised of commercial construction and land acquisition and development construction. As of December 31, 2020, the outstanding balance of our construction and development loans was $45.7 million, or 2.8%, of our total loan portfolio, compared to $31.7 million, or 2.7%, of our total loan portfolio at December 31, 2019. As of December 31, 2020, $31.4 million, or 68.7%, of construction and development loans were for the construction of hotels and restaurants; $12.1 million, or 26.6%, were for the construction of office buildings and commercial rental properties; and the remaining $2.2 million, or 4.7%, were loans distributed amongst various industries and sectors.
Interest reserves are generally established on real estate construction loans. These loans carry a fixed interest rate and have maturities of less than 18 months. Our loan-to-value, or LTV, policy limit for our construction and development loans is 65%. The risks inherent in construction lending may affect adversely our results of operations. Such risks include, among other things, the possibility that contractors may fail to complete, or complete on a timely basis, construction of the relevant properties; substantial cost overruns in excess of original estimates and financing; market deterioration during construction; and lack of permanent take-out financing. Loans secured by such properties also involve additional risk because they have no operating history. Advances on construction loans are made relative to the overall percentage of completion on the project in an effort to remain adequately secured.
We had no construction and development loans that were classified as nonaccrual as of December 31, 2020. As of December 31, 2019, we had $1.4 million of construction and development loans on nonaccrual status.
Commercial Real Estate Loans. We offer commercial real estate loans collateralized by real estate, which may be owner occupied or non-owner occupied real estate. Commercial real estate loans made up $477.4 million, or 29.2%, of our total portfolio at December 31, 2020, compared to $425.0 million, or 36.5%, of our total loan portfolio as of December 31, 2019. As of December 31, 2020, $413.7 million, or 86.7%, of our commercial real estate loans were secured by owner occupied properties and the remaining $63.7 million, or 13.3%, of loans in this category were secured by non-owner occupied properties. Within our commercial real estate loans, $151.4 million, or 31.7%, were to hotels and restaurants; $116.2 million, or 24.3%, were made to wholesalers or retailers; $69.2 million, or 14.5%, were to general service business; $93.6 million, or 19.6%, were to commercial rental properties; and the remaining $47.0 million, or 9.9%, were distributed amongst various sectors and industries.
7
Commercial real estate lending typically involves higher loan principal amounts relative to our other lending products, and the repayment is dependent, in large part, on sufficient cash flow from the properties securing the loans. We believe our management team and board of directors has put in place comprehensive and robust underwriting guidelines, and takes a conservative approach to commercial real estate lending, focusing on what we believe to be high quality credits with low LTV ratios and income-producing properties with strong cash flow characteristics, and strong collateral profiles.
We require our commercial real estate loans to be secured by what we believe to be well-managed property with adequate margins and we generally obtain a personal guarantee from responsible parties. Our commercial real estate loans are secured by a wide variety of property types, such as retail operations, hospitality, specialty service operations and warehouses for wholesale distribution. We originate both fixed-rate and adjustable-rate loans with terms up to 25 years. Fixed-rate loans have provisions which allow us to call the loan after three to five years. Adjustable-rate loans are generally based on the WSJPR or LIBOR, and as of December 31, 2020, most of our loans were based on WSJPR. At December 31, 2020, approximately 31.7% of the commercial real estate loan portfolio consisted of fixed rate loans. Our conventional commercial real estate loans, or non-SBA guaranteed commercial real estate loans, carried a weighted average maturity of 6.20 years as of December 31, 2020. Non-SBA commercial real estate loan amounts generally do not exceed 65% of the lesser of the appraised value or the purchase price depending on the property appraisals we utilize. Our LTV policy limits are 85% for commercial real estate loans. In addition, we limit our lending on non-owner occupied commercial real estate to 100% of total bank capital.
The total balance of commercial real estate loans on nonaccrual status was $2.9 million as of December 31, 2020 and 2019.
Commercial and Industrial Loans. We provide a mix of variable and fixed rate commercial and industrial loans. Commercial and industrial loans represented $137.2 million, or 8.4%, of our total loan portfolio as of December 31, 2020, compared to $53.1 million, or 4.6%, of our total loan portfolio at December 31, 2019. Included in commercial and industrial loans as of December 31, 2020 were PPP loans totaling $92.4 million. Excluding PPP loans, as of December 31, 2020, $19.5 million, or 43.4%, of our commercial and industrial loans were extended to businesses in warehousing, wholesale and retail trade; $9.4 million, or 21.0%, were loans made to hotels and restaurants; and the remaining $16.0 million, or 35.6%, of loans were distributed across various industries and sector. We had approximately $34,000 and $19,000 of commercial and industrial loans on nonaccrual status as of December 31, 2020 and 2019, respectively.
Our commercial and industrial loans are typically made to small and medium-sized businesses for working capital needs, business expansions and for trade financing. We extend commercial business loans on an unsecured and secured basis advanced for working capital, accounts receivable and inventory financing, machinery and equipment purchases, and other business purposes. Generally, short-term loans have maturities ranging from six months to one year, and “term loans” have maturities ranging from five to ten years. Loans are generally intended to finance current transactions and typically provide for periodic principal payments, with interest payable monthly. Term loans generally provide for floating interest rates, with monthly payments of both principal and interest. Repayment of secured and unsecured commercial loans depends substantially on the borrower’s underlying business, financial condition and cash flows, as well as the sufficiency of the collateral. Compared to real estate, the collateral may be more difficult to monitor, evaluate and sell. When the borrower is a corporation, partnership or other entity, we typically require personal guarantees from significant equity holders. Our LTV policy limits on commercial and industrial loans range from a maximum LTV of 75% when secured by new machinery and equipment down to 5% when only secured by leasehold improvements.
We also provide trade finance related services to our customers such as domestic and international letters of credit, international collection (documents against acceptance and documents against payment) and export advice. We issue standby letters of credit on behalf of our customers to facilitate trade and other financial guarantees. The Bank has a correspondent relationship with banks in Korea, China and India. All trade finance related services are denominated in U.S. currency and all facilities are fully collateralized with no foreign exchange or credit exposure.
In general, commercial and industrial loans may involve increased credit risk and, therefore, typically yield a higher return. The increased risk in commercial and industrial loans derives from the expectation that such loans generally are serviced principally from the operations of the business, and those operations may not be successful. Any interruption or discontinuance of operating cash flows from the business, which may be influenced by events not under the control of the
8
borrower such as economic events and changes in governmental regulations, including tariffs, could materially affect the ability of the borrower to repay the loan. In addition, the collateral securing commercial and industrial loans generally includes moveable property such as equipment and inventory, which may decline in value more rapidly than we anticipate exposing us to increased credit risk. As a result of these additional complexities, variables and risks, commercial and industrial loans require extensive monitoring and servicing.
SBA Loans. A significant portion of our commercial real estate portfolio consists of SBA loans. Our SBA loans are typically made to retail businesses including, car wash stations, grocery stores, poultry farms, warehouses, convenience stores, hospitality and service businesses, car dealers, beauty supplies, restaurants, and beer, wine, and liquor stores for acquisition of business properties, working capital needs and business expansions. Our SBA loans are typically secured by commercial real estate and can have any maturity up to 25 years. Depending on the loan amount, each loan is typically guaranteed 75% to 85% by the SBA, with a maximum gross loan amount to any one small business borrower of $5 million and a maximum SBA guaranteed amount of $3.75 million.
As of December 31, 2020, our commercial real estate SBA portfolio, net of any sold portions, totaled $170.0 million. This represents an increase of $18.8 million when compared to the December 31, 2019 balance of $151.2 million. Of the balance outstanding at December 31, 2020, $21.5 million, or 12.6%, of the loans in this portfolio carried an SBA guarantee while the remaining $148.5 million, or 87.4%, of the portfolio was unguaranteed.
In addition, as part of our commercial and industrial loan product offering, we originate SBA loans to provide working capital and to finance inventory, equipment and machinery purchases and acquisitions. As of December 31, 2020 and 2019, the outstanding balance of our commercial and industrial SBA loans was $115.1 million (includes PPP loans of $92.4 million) and $22.4 million, respectively. Of the balance outstanding as of December 31, 2020, $94.8 million, or 82.4%, of our commercial and industrial SBA portfolio carried a guarantee from the SBA while the remaining $20.3 million, or 17.6%, of the portfolio was unguaranteed. We are willing to maintain higher LTVs on our SBA portfolio than the remainder of our commercial loans because the effect of the SBA guarantee is to lower overall risk.
As a preferred SBA lender, we are participating in the Paycheck Protection Program created under the CARES Act and implemented by the SBA to help provide loans to our business customers in need. As of December 31, 2020, the Company approved and funded over 1,800 PPP loans totaling $96.9 million. These PPP loans were funded with our current cash balances and all PPP loans are fully guaranteed by the SBA. As of March 9, 2021, the SBA had granted forgiveness for PPP loans totaling $11.5 million.
The Economic Aid Act, signed into law on December 27, 2020, authorized an additional $284.5 billion in new PPP funding and extends the authority of lenders to make PPP loans through March 31, 2021. We are participating in this new round of PPP loan funding by offering first and second draw loans. As of March 9, 2021, the Company had approved and funded 635 PPP loans totaling $41.7 million under this new round of PPP loan funding.
We retain the servicing rights on the sold portions of the SBA loans we originate. As of December 31, 2020, we serviced $507.4 million in SBA loans for others, an increase of $65.8 million, or 14.9%, when compared to December 31, 2019. We recognized servicing income on SBA loans of $6.1 million, $3.7 million, and $3.1 million for the years ended December 31, 2020, 2019 and 2018, respectively.
Residential Real Estate Loans. We originate mainly non-conforming residential mortgage loans through our branch network. During 2020, one of our primary loan products was a five-year hybrid adjustable rate mortgage which reprices annually after the initial term based on the weekly average of the one year constant maturity treasury (CMT) plus a fixed spread. We also offer a 15-year fixed rate product and a 30-year fixed rate product. Loans collateralized by single-family residential real estate generally are originated in amounts of no more than 65% of appraised value. In connection with such loans, we retain a valid first lien on real estate, obtain a title insurance policy that insures that the property is free from material encumbrances and require hazard insurance. Loan fees, interest rates and other provisions of mortgage loans are determined by us on the basis of our own pricing criteria and competitive market conditions.
We take a comprehensive and conservative approach to our mortgage underwriting, allowing a maximum LTV ratio of 65%. As of December 31, 2020, we had $974.4 million of residential real estate loans, representing 59.6% of our total
9
loan portfolio compared to $651.6 million, or 56.0%, of our total loan portfolio at December 31, 2019. We had no residential mortgage loans held for sale as of December 31, 2020 compared to $85.8 million as of December 31, 2019. Nonaccrual residential mortgage loans were $7.3 million and $7.9 million at December 31, 2020 and 2019, respectively.
We sell a portion of our non-conforming residential mortgage loans to third party investors. The loans are sold with no representation or warranties if the loan pays off early. During 2020, we originated $484.2 million of non-conforming residential mortgage loans and recorded sales to our investors of $92.7 million during this period. During 2019, we originated $644.5 million of non-conforming residential mortgage loans and sold $520.1 million to our investors. Residential mortgage loans held for sale are sold with the servicing rights retained by the Bank. As of December 31, 2020, the amount of residential mortgage loans serviced for others fell to $961.7 million representing a decrease of $206.9 million, or 17.7%, when compared to December 31, 2019. We recognized servicing income on residential mortgage loans of $1.3 million, $9.3 million, and $12.0 million for the years ended December 31, 2020, 2019 and 2018, respectively.
Consumer and Other Loans. These loans represent a very small portion of our overall portfolio and primarily consists of purchased auto loan pools, overdrafts, and consumer lines of credit. Consumer loans carry a greater amount of risk and collections are dependent on the borrower’s continuing financial stability and thus are more likely to be adversely affected by job loss, divorce, illness or personal bankruptcy. Furthermore, the application of various federal and state laws may limit the amount which can be recovered on such loans.
As of December 31, 2020, our consumer and other loans comprised of $183,000 compared to $1.8 million of total loans as of December 31, 2019. This compares to $3.0 million as of December 31, 2018. Our consumer loans have steadily decreased since December 31, 2017 due to our decision to discontinue the purchase of auto loan pools in 2016.
Other Products and Services
We offer banking products and services that are competitively priced with a focus on convenience and accessibility. We offer a full suite of online banking solutions including access to account balances, online transfers, online bill payment and electronic delivery of customer statements, mobile banking solutions for iPhone and Android phones, including remote check deposit with mobile bill pay. We offer ATMs and banking by telephone, mail and personal appointment. We offer debit cards with no ATM surcharges or foreign ATM fees for checking customers, direct deposit, cashier’s checks, as well as treasury management services, wire transfer services and automated clearing house (“ACH”) services.
We offer a full array of commercial treasury management services designed to be competitive with banks of all sizes. Treasury management services include balance reporting (including current day and previous day activity), transfers between accounts, wire transfer initiation, ACH origination and stop payments. Cash management deposit products consist of remote deposit capture, positive pay, zero balance accounts and sweep accounts.
We evaluate our services on an ongoing basis, and will add or remove services based upon the perceived needs and financial requirements of our customers, competitive factors and our financial and other capabilities. Future services may also be significantly influenced by improvements and developments in technology and evolving state and federal laws and regulations.
Securities
We manage our securities portfolio to balance the market and credit risks of our other assets and the Bank’s liability structure, with a secondary focus of profitably deploying funds which are not needed to fulfill current loan demand, deposit redemptions or other liquidity purposes. Our investment portfolio is comprised primarily of U.S. government agency securities, mortgage-backed securities backed by government-sponsored entities, and taxable and tax exempt municipal securities.
Our investment policy is reviewed annually by our board of directors. Overall investment goals are established by our board of directors and members of our Asset-Liability Committee (“ALCO”). Day-to-day activities pertaining to the securities portfolio are conducted under the supervision of our Chief Executive Officer. During its quarterly ALCO meetings, the committee reviews the Bank’s investment portfolio for any significant changes or risks. We actively monitor
10
our investments on an ongoing basis to identify any material changes in the securities. We also review our securities for potential other-than-temporary impairment at least quarterly.
Deposits
We offer traditional depository products, including checking, savings, money market and certificates of deposits, to individuals, businesses, municipalities and other entities through our branch network throughout our market areas. Deposits at the Bank are insured by the FDIC up to statutory limits. Our ability to gather deposits, particularly core deposits, is an important aspect of our business and we believe core deposits are a significant driver of value as a cost efficient and stable source of funding to support our growth. As of December 31, 2020, we had $1.48 billion of total deposits with a total deposit cost of 0.83%. Of our total deposits as of December 31, 2020, $523.3 million, or 35.4%, of total deposits were held in demand deposit accounts.
As a bank focusing on successful businesses and their owners, many of our depositors choose to leave large deposits with us. We consider a deposit relationship to be core by considering the following factors: (i) relationships with us (as a director or shareholder); (ii) deposits within our market area; (iii) additional non-deposit services with us; (iv) electronic banking services with us; (v) active demand deposit account with us; (vi) loans and (vii) longevity of the relationship with us. We calculate core deposits by adding demand and savings deposits plus time deposits less than $250,000 plus deposits that are over $250,000 if such depositors meet the relationship criteria listed above. As many of our customers have more than $250,000 on deposit with us, we believe that using this method reflects a more accurate assessment of our deposit base. As of December 31, 2020, 82.2%, or $1.22 billion, of our deposits were considered core deposits.
While we are focused on growing our low-cost deposits, we also utilize brokered deposits, subject to certain limitations and requirements, as a source of funding to support our asset growth and augment the deposits generated from our branch network. Our level of brokered deposits varies from time to time depending on competitive interest rate conditions and other factors and tends to increase as a percentage of total deposits when the brokered deposits are less costly than issuing internet certificates of deposit or borrowing from the Federal Home Loan Bank. As of December 31, 2020, we had brokered deposits of $164.3 million compared to no brokered deposits at December 31, 2019.
As of December 31, 2020, our fifteen largest depositor relationships, excluding brokered deposits, totaled $80.3 million, or 5.4%, of total deposits. Our deposits with directors and affiliated entities totaled $4.8 million for the same period.
Competition
We operate in a highly competitive market. Competitors include other banks, credit unions, mortgage companies, personal and commercial financing companies, investment brokerage and advisory firms, mutual fund companies and insurance companies. Competitors range in both size and geographic footprint. We operate throughout Georgia and the Southeast, as well as New York, New Jersey, Texas, and Virginia. The Bank's competition includes not only other banks of comparable or larger size in the same markets, but also various other nonbank financial institutions, including savings and loan associations, credit unions, mortgage companies, personal and commercial financial companies, peer to peer lending businesses, investment brokerage and financial advisory firms and mutual fund companies. The Bank competes for deposits, commercial, fiduciary and investment services and various types of loans and other financial services. The Bank also competes for interest-bearing funds with a number of other financial intermediaries, including brokerage and insurance firms, as well as investment alternatives, including mutual funds, governmental and corporate bonds, and other securities. Continued consolidation and rapid technological changes within the financial services industry will likely change the nature and intensity of competition, but also will create opportunities for the Company to demonstrate and leverage its competitive advantages.
Competitors include not only financial institutions based in Georgia, but also a number of large out-of-state and foreign banks, bank holding companies and other financial institutions that have an established market presence in Georgia or that offer internet-based products. Many of the Company's competitors are engaged in local, regional, national and international operations and have greater assets, personnel and other resources. Some of these competitors are subject to less regulation and/or more favorable tax treatment. Many of these institutions have greater resources, broader geographic
11
markets and higher lending limits, and may offer services that the Company does not offer. In addition, these institutions may be able to better afford and make broader use of media advertising, support services, and electronic and other technology. To offset these potential competitive disadvantages, the Company depends on its reputation for superior service, ability to make credit and other business decisions quickly, and the delivery of an integrated distribution of traditional branches and bankers, with digital technology.
Liquidity
Our deposit base consists primarily of business accounts and deposits from the principals of such businesses. As a result, we have many depositors with balances over $250,000. We manage liquidity based upon factors that include the amount of core deposit relationships as a percentage of total deposits, net loans to total deposits, the level of diversification of our funding sources, the allocation and amount of our deposits among deposit types, the short-term funding sources used to fund assets, the amount of non-deposit funding used to fund assets such as fed funds and account receivables, the availability of unused funding sources, off-balance sheet obligations, the availability of assets to be readily converted into cash without undue loss, the amount of cash and liquid securities we hold, and the re-pricing characteristics and maturities of our assets when compared to the re-pricing characteristics of our liabilities and other factors.
We evaluate our net loans to total assets and net loans (excluding loans held for sale) to total deposit ratios as a method to monitor our liquidity position. Our board of directors has limited our net loans to a maximum of 85% of total assets and our net loans to a maximum of 110% of total deposits. As of December 31, 2020, our net loans were 85.4% of total assets and net loans were 109.5% of total deposits. As of December 31, 2019, our net loans were 70.7% of total assets and net loans were 88.3% of total deposits. We were in compliance with both limits for each period presented.
Human Capital Resources
As of December 31, 2020, we had approximately 211 full-time equivalent employees. None of our employees are represented by any collective bargaining unit or is a party to a collective bargaining agreement. We consider our relationship with our employees to be good and have not experienced interruptions of operations due to labor disagreements.
The safety, health and wellness of our employees is a top priority. The COVID-19 pandemic presented a unique challenge with regard to maintaining associate safety while continuing successful operations. Through teamwork and the adaptability of our management and staff, we were able to transition, over a short period of time, a large portion of our employees to effectively working from remote locations and ensure a safely-distanced working environment for employees performing customer facing activities, at branches and operations centers. All employees are asked not to come to work when they experience signs or symptoms of a possible COVID-19 illness and have been provided additional paid time off to cover compensation during such absences.
Our culture emphasizes our longstanding dedication to being respectful to others and having a workforce that is representative of the communities we serve. Diversity and inclusion are fundamental to our culture. We believe in attracting, retaining and promoting quality talent and recognize that diversity makes us stronger as a company. We believe employees to be our greatest asset and that our future success depends on our ability to attract, retain and develop employees. Professional development is a key priority, which is facilitated through our many corporate development initiatives including training programs, corporate mentoring, and educational reimbursement.
Corporate Information
Our principal executive offices are located at 5114 Buford Highway, Doraville, Georgia 30340, and our telephone number at that address is (770) 455-4989. Our website address is www.metrocitybank.bank. The information contained on or accessible from our website does not constitute a part of this Annual Report on Form 10-K and is not incorporated by reference herein.
12
Regulation and Supervision
General
We are extensively regulated under federal and state law. The following is a brief summary that does not purport to be a complete description of all regulations that affect us or all aspects of those regulations. This discussion is qualified in its entirety by reference to the particular statutory and regulatory provisions described below and is not intended to be an exhaustive description of the statutes or regulations applicable to the Company’s and the Bank’s business. In addition, proposals to change the laws and regulations governing the banking industry are frequently raised at both the state and federal levels. The likelihood and timing of any changes in these laws and regulations, and the impact such changes may have on us and the Bank, are difficult to predict. In addition, bank regulatory agencies may issue enforcement actions, policy statements, interpretive letters and similar written guidance applicable to us or the Bank. Changes in applicable laws, regulations or regulatory guidance, or their interpretation by regulatory agencies or courts may have a material adverse effect on our and the Bank’s business, operations, and earnings. Supervision and regulation of banks, their holding companies and affiliates is intended primarily for the protection of depositors and customers, the Deposit Insurance Fund (“DIF”) of the Federal Deposit Insurance Corporation (“FDIC”), and the U.S. banking and financial system rather than holders of our capital stock.
Regulation of the Company
We are registered as a bank holding company with the Federal Reserve under the Bank Holding Company Act of 1956, as amended (the “BHC Act”). As such, we are subject to comprehensive supervision and regulation by the Federal Reserve and are subject to its regulatory reporting requirements. Federal law subjects bank holding companies, such as the Company, to particular restrictions on the types of activities in which they may engage, and to a range of supervisory requirements and activities, including regulatory enforcement actions for violations of laws and regulations. Violations of laws and regulations, or other unsafe and unsound practices, may result in regulatory agencies imposing fines or penalties, cease and desist orders, or taking other enforcement actions. Under certain circumstances, these agencies may enforce these remedies directly against officers, directors, employees and other parties participating in the affairs of a bank or bank holding company.
Activity Limitations. Bank holding companies are generally restricted to engaging in the business of banking, managing or controlling banks and certain other activities determined by the Federal Reserve to be closely related to banking. In addition, the Federal Reserve has the power to order a bank holding company or its subsidiaries to terminate any nonbanking activity or terminate its ownership or control of any nonbank subsidiary, when it has reasonable cause to believe that continuation of such activity or such ownership or control constitutes a serious risk to the financial safety, soundness, or stability of any bank subsidiary of that bank holding company.
Source of Strength Obligations. A bank holding company is required to act as a source of financial and managerial strength to its subsidiary bank and to maintain resources adequate to support its bank. The term “source of financial strength” means the ability of a company, such as us, that directly or indirectly owns or controls an insured depository institution, such as the Bank, to provide financial assistance to such insured depository institution in the event of financial distress. The appropriate federal banking agency for the depository institution (in the case of the Bank, this agency is the FDIC) may require reports from us to assess our ability to serve as a source of strength and to enforce compliance with the source of strength requirements by requiring us to provide financial assistance to the Bank in the event of financial distress. If we were to enter bankruptcy or become subject to the orderly liquidation process established by the Dodd-Frank Act, any commitment by us to a federal bank regulatory agency to maintain the capital of the Bank would be assumed by the bankruptcy trustee or the FDIC, as appropriate, and entitled to a priority of payment.
Acquisitions. The BHC Act permits acquisitions of banks by bank holding companies, such that we and any other bank holding company, whether located in Georgia or elsewhere, may acquire a bank located in any other state, subject to certain deposit-percentage, age of bank charter requirements, and other restrictions. The BHC Act requires that a bank holding company obtain the prior approval of the Federal Reserve before (i) acquiring direct or indirect ownership or control of more than 5% of the voting shares of any additional bank or bank holding company, (ii) taking any action that causes an additional bank or bank holding company to become a subsidiary of the bank holding company, or (iii) merging
13
or consolidating with any other bank holding company. The Federal Reserve may not approve any such transaction that would result in a monopoly or would be in furtherance of any combination or conspiracy to monopolize or attempt to monopolize the business of banking in any section of the United States, or the effect of which may be substantially to lessen competition or to tend to create a monopoly in any section of the country, or that in any other manner would be in restraint of trade, unless the anticompetitive effects of the proposed transaction are clearly outweighed by the public interest in meeting the convenience and needs of the community to be served. The Federal Reserve is also required to consider: (1) the financial and managerial resources of the companies involved, including pro forma capital ratios; (2) the risk to the stability of the United States banking or financial system; (3) the convenience and needs of the communities to be served, including performance under the Community Reinvestment Act, further described below; and (4) the effectiveness of the companies in combatting money laundering.
Change in Control. Federal law restricts the amount of voting stock of a bank holding company or a bank that a person may acquire without the prior approval of banking regulators. Under the Change in Bank Control Act and the regulations thereunder, a person or group must give advance notice to the Federal Reserve before acquiring control of any bank holding company, such as the Company, and the FDIC before acquiring control of the Bank. Upon receipt of such notice, the bank regulatory agencies may approve or disapprove the acquisition. The Change in Bank Control Act creates a rebuttable presumption of control if a person or group acquires the power to vote 10% or more of our outstanding common stock. The overall effect of such laws is to make it more difficult to acquire a bank holding company and a bank by tender offer or similar means than it might be to acquire control of another type of corporation. Consequently, shareholders of the Company may be less likely to benefit from the rapid increases in stock prices that may result from tender offers or similar efforts to acquire control of other companies. Investors should be aware of these requirements when acquiring shares of our stock.
Sarbanes-Oxley Act of 2002. As a public company that files periodic reports with the SEC, under the Exchange Act, the Company is subject to the Sarbanes-Oxley Act of 2002 (“Sarbanes-Oxley Act”), which addresses, among other issues, corporate governance, auditing and accounting, executive compensation and enhanced and timely disclosure of corporate information. The Sarbanes-Oxley Act represents significant federal involvement in matters traditionally left to state regulatory systems, such as the regulation of the accounting profession, and to state corporate law, such as the relationship between a board of directors and management and between a board of directors and its committees. Our policies and procedures are designed to comply with the requirements of the Sarbanes-Oxley Act.
Corporate Governance. The Dodd-Frank Act addresses many investor protections, corporate governance, and executive compensation matters that will affect most U.S. publicly traded companies. The Dodd-Frank Act (1) grants shareholders of U.S. publicly traded companies an advisory vote on executive compensation; (2) enhances independence requirements for Compensation Committee members; and (3) requires companies listed on national securities exchanges to adopt incentive-based compensation claw-back policies for executive officers.
Incentive Compensation. The Dodd-Frank Act required the banking agencies and the SEC to establish joint rules or guidelines for financial institutions with more than $1 billion in assets, such as us and the Bank, which prohibit incentive compensation arrangements that the agencies determine to encourage inappropriate risks by the institution. The federal banking agencies issued proposed rules in 2011 and previously issued guidance on sound incentive compensation policies. In 2016, the federal banking agencies also proposed rules that would, depending upon the assets of the institution, directly regulate incentive compensation arrangements and would require enhanced oversight and recordkeeping. As of December 31, 2020, these rules have not been implemented. We and the Bank have undertaken efforts to ensure that our incentive compensation plans do not encourage inappropriate risks, consistent with three key principles - that incentive compensation arrangements should appropriately balance risk and financial rewards, be compatible with effective controls and risk management, and be supported by strong corporate governance.
Shareholder Say-On-Pay Votes. The Dodd-Frank Act requires public companies to take shareholders’ votes on proposals addressing compensation (known as say-on-pay), the frequency of a say-on-pay vote, and the golden parachutes available to executives in connection with change-in-control transactions. Public companies must give shareholders the opportunity to vote on the compensation at least every three years and the opportunity to vote on frequency at least every six years, indicating whether the say-on-pay vote should be held annually, biennially, or triennially. The say-on-pay, the
14
say-on-parachute and the say-on-frequency votes are explicitly nonbinding and cannot override a decision of our board of directors.
Other Regulatory Matters. We and our subsidiaries are subject to oversight by the SEC, the Financial Industry Regulatory Authority, (“FINRA”), the PCAOB, the Nasdaq Stock Market and various state securities regulators. We and our subsidiaries have from time to time received requests for information from regulatory authorities in various states, including state attorneys general, securities regulators and other regulatory authorities, concerning our business practices. Such requests are considered incidental to the normal conduct of business.
Capital Requirements
The Bank is required under federal law to maintain certain minimum capital levels based on ratios of capital to total assets and capital to risk-weighted assets. The required capital ratios are minimums, and the federal banking agencies may determine that a banking organization, based on its size, complexity or risk profile, must maintain a higher level of capital in order to operate in a safe and sound manner. Risks such as concentration of credit risks and the risk arising from non-traditional activities, as well as the institution’s exposure to a decline in the economic value of its capital due to changes in interest rates, and an institution’s ability to manage those risks are important factors that are to be taken into account in assessing an institution’s overall capital adequacy. The following is a brief description of the relevant provisions of these capital rules and their potential impact on our capital levels.
The Bank is subject to the following risk-based capital ratios: a common equity Tier 1 (“CET1”) risk-based capital ratio, a Tier 1 risk-based capital ratio, which includes CET1 and additional Tier 1 capital, and a total risk-based capital ratio, which includes Tier 1 and Tier 2 capital. CET1 is primarily comprised of the sum of common stock instruments and related surplus net of treasury stock, plus retained earnings, and certain qualifying minority interests, less certain adjustments and deductions, including with respect to goodwill, intangible assets, mortgage servicing assets and deferred tax assets subject to temporary timing differences. Additional Tier 1 capital is primarily comprised of noncumulative perpetual preferred stock, tier 1 minority interests and grandfathered trust preferred securities. Tier 2 capital consists of instruments disqualified from Tier 1 capital, including qualifying subordinated debt, other preferred stock and certain hybrid capital instruments, and a limited amount of loan loss reserves up to a maximum of 1.25% of risk-weighted assets, subject to certain eligibility criteria. The capital rules also define the risk-weights assigned to assets and off-balance sheet items to determine the risk-weighted asset components of the risk-based capital rules, including, for example, certain “high volatility” commercial real estate, past due assets, structured securities and equity holdings.
The leverage capital ratio, which serves as a minimum capital standard, is the ratio of Tier 1 capital to quarterly average total consolidated assets net of goodwill, certain other intangible assets, and certain required deduction items. The required minimum leverage ratio for all banks is 4%.
In addition, as of January 1, 2019, the capital rules require a capital conservation buffer of 2.5%, constituted of CET1, above each of the minimum capital ratio requirements (CET1, Tier 1, and total risk-based capital), which is designed to absorb losses during periods of economic stress. These buffer requirements must be met for a bank to be able to pay dividends, engage in share buybacks or make discretionary bonus payments to executive management without restriction.
The Federal Deposit Insurance Corporation Improvement Act of 1991 (“FDICIA”), among other things, requires the federal bank regulatory agencies to take “prompt corrective action” regarding depository institutions that do not meet minimum capital requirements. FDICIA establishes five regulatory capital tiers: “well capitalized,” “adequately capitalized,” “undercapitalized,” “significantly undercapitalized,” and “critically undercapitalized.” A depository institution’s capital tier will depend upon how its capital levels compare to various relevant capital measures and certain other factors, as established by regulation. FDICIA generally prohibits a depository institution from making any capital distribution (including payment of a dividend) or paying any management fee to its holding company if the depository institution would thereafter be undercapitalized. The FDICIA imposes progressively more restrictive restraints on operations, management and capital distributions, depending on the category in which an institution is classified. Undercapitalized depository institutions are subject to restrictions on borrowing from the Federal Reserve System. In addition, undercapitalized depository institutions may not accept brokered deposits absent a waiver from the FDIC, are subject to growth limitations and are required to submit capital restoration plans for regulatory approval. A depository
15
institution’s holding company must guarantee any required capital restoration plan, up to an amount equal to the lesser of 5 percent of the depository institution’s assets at the time it becomes undercapitalized or the amount of the capital deficiency when the institution fails to comply with the plan. Federal banking agencies may not accept a capital plan without determining, among other things, that the plan is based on realistic assumptions and is likely to succeed in restoring the depository institution’s capital. If a depository institution fails to submit an acceptable plan, it is treated as if it is significantly undercapitalized. All of the federal bank regulatory agencies have adopted regulations establishing relevant capital measures and relevant capital levels for federally insured depository institutions. The Bank was well capitalized at December 31, 2020, and brokered deposits are not restricted.
To be well-capitalized, the Bank must maintain at least the following capital ratios:
| ● | 6.5% CET1 to risk-weighted assets; |
| ● | 8.0% Tier 1 capital to risk-weighted assets; |
| ● | 10.0% Total capital to risk-weighted assets; and |
| ● | 5.0% leverage ratio. |
Failure to be well-capitalized or to meet minimum capital requirements could result in certain mandatory and possible additional discretionary actions by regulators that, if undertaken, could have an adverse material effect on our operations or financial condition. For example, only a well-capitalized depository institution may accept brokered deposits without prior regulatory approval. Failure to be well-capitalized or to meet minimum capital requirements could also result in restrictions on the Bank’s ability to pay dividends or otherwise distribute capital or to receive regulatory approval of applications or other restrictions on its growth.
As of December 31, 2020 and 2019, the Bank’s regulatory capital ratios were above the applicable well-capitalized standards and met the then-applicable capital conservation buffer.
The Economic Growth, Regulatory Relief, and Consumer Protection Act (the “Economic Growth Act”) signed into law in May 2018 scaled back certain requirements of the Dodd-Frank Act and provided other regulatory relief. Among the provisions of the Economic Growth Act was a requirement that the Federal Reserve raise the asset threshold for those bank holding companies subject to the Federal Reserve’s Small Bank Holding Company Policy Statement (“Policy Statement”) to $3 billion. As a result, as of the effective date of that change in 2018, the Company was no longer required to comply with the risk-based capital rules applicable to the Bank as described above. The Federal Reserve may however, require smaller bank holding companies subject to the Policy Statement to maintain certain minimum capital levels, depending upon general economic conditions and a bank holding company’s particular condition, risk profile and growth plans.
As a result of the Economic Growth Act, the federal banking agencies were also required to develop a “Community Bank Leverage Ratio” (the ratio of a bank’s Tier 1 capital to average total consolidated assets) for financial institutions with assets of less than $10 billion. A “qualifying community bank” that exceeds this ratio will be deemed to be in compliance with all other capital and leverage requirements, including the capital requirements to be considered “well capitalized” under prompt corrective action statutes. The federal banking agencies may consider a financial institutions risk profile when evaluation whether it qualifies as a community bank for purposes of the capital ratio requirement. The federal banking agencies set the minimum capital for the new Community Bank Leverage Ratio at 9%. The Bank has not opted into the Community Bank Leverage Ratio Framework.
On December 21, 2018, federal banking agencies issued a joint final rule to revise their regulatory capital rules to (i) address the upcoming implementation of the “current expected credit losses” (“CECL”) accounting standard under GAAP; (ii) provide an optional three-year phase-in period for the day-one adverse regulatory capital effects that banking organizations are expected to experience upon adopting CECL; and (iii) require the use of CECL in stress tests beginning with the 2020 capital planning and stress testing cycle for certain banking organizations. In June 2016, the Financial Accounting Standards Board issued Accounting Standards Update No. 2016-13, which introduced CECL as the methodology to replace the current “incurred loss” methodology for financial assets measured at amortized cost, and
16
changed the approaches for recognizing and recording credit losses on available-for-sale debt securities and purchased credit impaired financial assets. Under the incurred loss methodology, credit losses are recognized only when the losses are probable or have been incurred; under CECL, companies are required to recognize the full amount of expected credit losses for the lifetime of the financial assets, based on historical experience, current conditions and reasonable and supportable forecasts. This change will result in earlier recognition of credit losses that the Company deems expected but not yet probable. For SEC reporting companies with emerging growth company designation and December 31 fiscal-year ends, such as the Company, CECL will become effective beginning with the first quarter of 2023.
Payment of Dividends
We are a legal entity separate and distinct from the Bank and our other subsidiaries. Our primary source of cash, other than securities offerings, is dividends from the Bank. We are a legal entity separate and distinct from the Bank and our other subsidiaries. Our primary source of cash, other than securities offerings, is dividends from the Bank. Under the laws of the State of Georgia, we, as a business corporation, may declare and pay dividends in cash or property unless the payment or declaration would be contrary to restrictions contained in our Articles of Incorporation, or unless, after payment of the dividend, we would not be able to pay our debts when they become due in the usual course of our business or our total assets would be less than the sum of our total liabilities. In addition, we are also subject to federal regulatory capital requirements that effectively limit the amount of cash dividends that we may pay.
The primary sources of funds for our payment of dividends to our shareholders are cash on hand and dividends from the Bank and our non-bank subsidiaries. Various federal and state statutory provisions and regulations limit the amount of dividends that the Bank and our non-bank subsidiaries may pay. The Bank is a Georgia bank. Under the regulations of the GA DBF, a Georgia bank must have approval of the GA DBF to pay cash dividends if, at the time of such payment:
| ● | the ratio of Tier 1 capital to adjusted total assets is less than 6 percent; |
| ● | the aggregate amount of dividends to be declared or anticipated to be declared during the current calendar year exceeds 50 percent of its net after-tax profits before dividends for the previous calendar year; or |
| ● | its total classified assets in its most recent regulatory examination exceeded 80 percent of its Tier 1 capital plus its allowance for loan and lease losses. |
The Georgia Financial Institutions Code contains restrictions on the ability of a Georgia bank to pay dividends other than from retained earnings without the approval of the GA DBF. As a result of the foregoing restrictions, the Bank may be required to seek approval from the GA DBF to pay dividends.
In addition, we and the Bank are subject to various general regulatory policies and requirements relating to the payment of dividends, including requirements to maintain adequate capital above regulatory minimums. The appropriate federal bank regulatory authority may prohibit the payment of dividends where it has determined that the payment of dividends would be an unsafe or unsound practice and to prohibit payment thereof. The FDIC and the Federal Reserve have indicated that paying dividends that deplete a bank’s capital base to an inadequate level would be an unsound and unsafe banking practice. The FDIC and the Federal Reserve have each indicated that depository institutions and their holding companies should generally pay dividends only out of current operating earnings. Prior approval by the FDIC is required if the total of all dividends declared by a bank in any calendar year exceeds the bank’s profits for that year combined with its retained net profits for the preceding two calendar years.
17
Under a Federal Reserve policy adopted in 2009, the board of directors of a bank holding company must consider different factors to ensure that its dividend level is prudent relative to maintaining a strong financial position, and is not based on overly optimistic earnings scenarios, such as potential events that could affect its ability to pay, while still maintaining a strong financial position. As a general matter, the Federal Reserve has indicated that the board of directors of a bank holding company should consult with the Federal Reserve and eliminate, defer or significantly reduce the bank holding company’s dividends if:
| ● | its net income available to shareholders for the past four quarters, net of dividends previously paid during that period, is not sufficient to fully fund the dividends; |
| ● | its prospective rate of earnings retention is not consistent with its capital needs and overall current and prospective financial condition; or |
| ● | it will not meet, or is in danger of not meeting, its minimum regulatory capital adequacy ratios. |
Regulation of the Bank
The Bank is subject to comprehensive supervision and regulation by the FDIC and is subject to its regulatory reporting requirements. The Bank also is subject to certain Federal Reserve regulations. In addition, as discussed in more detail below, the Bank and any other of our subsidiaries that offer consumer financial products and services are subject to regulation and potential supervision by the CFPB. Authority to supervise and examine the Company and the Bank for compliance with federal consumer laws remains largely with the Federal Reserve and the FDIC, respectively. However, the CFPB may participate in examinations on a “sampling basis” and may refer potential enforcement actions against such institutions to their primary regulators. The CFPB also may participate in examinations of our other direct or indirect subsidiaries that offer consumer financial products or services. In addition, the Dodd-Frank Act permits states to adopt consumer protection laws and regulations that are stricter than those regulations promulgated by the CFPB, and state attorneys general are permitted to enforce certain federal consumer financial protection rules adopted by the CFPB.
Broadly, regulations applicable to the Bank include limitations on loans to a single borrower and to its directors, officers and employees; restrictions on the opening and closing of branch offices; the maintenance of required capital and liquidity ratios; the granting of credit under equal and fair conditions; the disclosure of the costs and terms of such credit; requirements to maintain reserves against deposits and loans; limitations on the types of investment that may be made by the Bank; and requirements governing risk management practices. The Bank is permitted under federal law to branch on a de novo basis across state lines where the laws of that state would permit a bank chartered by that state to open a de novo branch.
Transactions with Affiliates and Insiders. The Bank is subject to restrictions on extensions of credit and certain other transactions between the Bank and the Company or any nonbank affiliate. Generally, these covered transactions with either the Company or any affiliate are limited to 10% of the Bank’s capital and surplus, and all such transactions between the Bank and the Company and all of its nonbank affiliates combined are limited to 20% of the Bank’s capital and surplus. Loans and other extensions of credit from the Bank to the Company or any affiliate generally are required to be secured by eligible collateral in specified amounts. In addition, any transaction between the Bank and the Company or any affiliate are required to be on an arm’s length basis. Federal banking laws also place similar restrictions on certain extensions of credit by insured banks, such as the Bank, to their directors, executive officers and principal shareholders.
Reserves. Federal Reserve rules require depository institutions, such as the Bank, to maintain reserves against their transaction accounts, primarily interest bearing and non-interest bearing checking accounts. Effective March 26, 2020, reserve requirement ratios were reduced to zero percent. These reserve requirements are subject to annual adjustment by the Federal Reserve.
FDIC Insurance Assessments and Depositor Preference. The Bank’s deposits are insured by the FDIC’s DIF up to the limits under applicable law, which currently are set at $250,000 per depositor, per insured bank, for each account ownership category. The Bank is subject to FDIC assessments for its deposit insurance. The FDIC calculates quarterly deposit insurance assessments based on an institution’s average total consolidated assets less its average tangible equity,
18
and applies one of four risk categories determined by reference to its capital levels, supervisory ratings, and certain other factors. The assessment rate schedule can change from time to time, at the discretion of the FDIC, subject to certain limits.
Insurance of deposits may be terminated by the FDIC upon a finding that the institution has engaged in unsafe and unsound practices, is in an unsafe or unsound condition to continue operations, or has violated any applicable law, regulation, rule, order or condition imposed by a bank’s federal regulatory agency. In addition, the Federal Deposit Insurance Act provides that, in the event of the liquidation or other resolution of an insured depository institution, the claims of depositors of the institution, including the claims of the FDIC as subrogee of insured depositors, and certain claims for administrative expenses of the FDIC as a receiver, will have priority over other general unsecured claims against the institution, including those of the parent bank holding company.
Standards for Safety and Soundness. The Federal Deposit Insurance Act requires the federal bank regulatory agencies to prescribe, by regulation or guideline, operational and managerial standards for all insured depository institutions relating to: (1) internal controls; (2) information systems and audit systems; (3) loan documentation; (4) credit underwriting; (5) interest rate risk exposure; and (6) asset quality. The federal banking agencies have adopted regulations and Interagency Guidelines Establishing Standards for Safety and Soundness to implement these required standards. These guidelines set forth the safety and soundness standards used to identify and address problems at insured depository institutions before capital becomes impaired. Under the regulations, if a regulator determines that a bank fails to meet any standards prescribed by the guidelines, the regulator may require the bank to submit an acceptable plan to achieve compliance, consistent with deadlines for the submission and review of such safety and soundness compliance plans.
Anti-Money Laundering. A continued focus of governmental policy relating to financial institutions in recent years has been combating money laundering and terrorist financing. The USA PATRIOT Act broadened the application of anti-money laundering regulations to apply to additional types of financial institutions such as broker-dealers, investment advisors and insurance companies, and strengthened the ability of the U.S. Government to help prevent, detect and prosecute international money laundering and the financing of terrorism. The principal provisions of Title III of the USA PATRIOT Act require that regulated financial institutions, including state member banks: (i) establish an anti-money laundering program that includes training and audit components; (ii) comply with regulations regarding the verification of the identity of any person seeking to open an account; (iii) take additional required precautions with non-U.S. owned accounts; and (iv) perform certain verification and certification of money laundering risk for their foreign correspondent banking relationships. Failure of a financial institution to comply with the USA PATRIOT Act’s requirements could have serious legal and reputational consequences for the institution. The Bank has augmented its systems and procedures to meet the requirements of these regulations and will continue to revise and update its policies, procedures and controls to reflect changes required by law.
FinCEN has adopted rules that require financial institutions to obtain beneficial ownership information with respect to legal entities with which such institutions conduct business, subject to certain exclusions and exemptions. Bank regulators are focusing their examinations on anti-money laundering compliance, and we continue to monitor and augment, where necessary, our anti-money laundering compliance programs.
Banking regulators will consider compliance with the Act’s money laundering provisions in acting upon acquisition and merger proposals. Bank regulators routinely examine institutions for compliance with these obligations and have been active in imposing cease and desist and other regulatory orders and money penalty sanctions against institutions found to be violating these obligations. Sanctions for violations of the Act can be imposed in an amount equal to twice the sum involved in the violating transaction, up to $1 million. On January 1, 2021, Congress passed federal legislation that made sweeping changes to federal anti-money laundering laws, including changes that will be implemented in 2021 and subsequent years.
Economic Sanctions. The Office of Foreign Assets Control (“OFAC”) is responsible for helping to ensure that U.S. entities do not engage in transactions with certain prohibited parties, as defined by various Executive Orders and acts of Congress. OFAC publishes, and routinely updates, lists of names of persons and organizations suspected of aiding, harboring or engaging in terrorist acts, including the Specially Designated Nationals and Blocked Persons List. If we find a name on any transaction, account or wire transfer that is on an OFAC list, we must undertake certain specified activities,
19
which could include blocking or freezing the account or transaction requested, and we must notify the appropriate authorities.
Concentrations in Lending. During 2006, the federal bank regulatory agencies released guidance on “Concentrations in Commercial Real Estate Lending” (the “Guidance”) and advised financial institutions of the risks posed by commercial real estate (“CRE”) lending concentrations. The Guidance requires that appropriate processes be in place to identify, monitor and control risks associated with real estate lending concentrations. Higher allowances for loan losses and capital levels may also be required. The Guidance is triggered when CRE loan concentrations exceed either:
| ● | Total reported loans for construction, land development, and other land of 100% or more of a bank’s total risk based capital; or |
| ● | Total reported loans secured by multifamily and nonfarm nonresidential properties and loans for construction, land development, and other land of 300% or more of a bank’s total risk based capital. |
The Guidance also applies when a bank has a sharp increase in CRE loans or has significant concentrations of CRE secured by a particular property type. We have always had exposures to loans secured by commercial real estate due to the nature of our markets and the loan needs of both retail and commercial customers. We believe our long term experience in CRE lending, underwriting policies, internal controls, and other policies currently in place, as well as our loan and credit monitoring and administration procedures, are generally appropriate to managing our concentrations as required under the Guidance.
Community Reinvestment Act. The Bank is subject to the provisions of the Community Reinvestment Act (“CRA”), which imposes a continuing and affirmative obligation, consistent with their safe and sound operation, to help meet the credit needs of entire communities where the bank accepts deposits, including low- and moderate-income neighborhoods. The FDIC’s assessment of the Bank’s CRA record is made available to the public. Further, a less than satisfactory CRA rating will slow, if not preclude, expansion of banking activities. Following the enactment of the Gramm-Leach-Bliley Act (“GLB”), CRA agreements with private parties must be disclosed and annual CRA reports must be made to a bank’s primary federal regulator. Federal CRA regulations require, among other things, that evidence of discrimination against applicants on a prohibited basis, and illegal or abusive lending practices be considered in the CRA evaluation. The Bank has a rating of “Satisfactory” in its most recent CRA evaluation.
Privacy and Data Security. The GLB generally prohibits disclosure of consumer information to non-affiliated third parties unless the consumer has been given the opportunity to object and has not objected to such disclosure. Financial institutions are further required to disclose their privacy policies to customers annually. Financial institutions, however, will be required to comply with state law if it is more protective of consumer privacy than the GLB. The GLB also directed federal regulators, including the FDIC, to prescribe standards for the security of consumer information. The Bank is subject to such standards, as well as standards for notifying customers in the event of a security breach. Under federal law, the Bank must disclose its privacy policy to consumers, permit customers to opt out of having nonpublic customer information disclosed to third parties in certain circumstances, and allow customers to opt out of receiving marketing solicitations based on information about the customer received from another subsidiary. States may adopt more extensive privacy protections. We are similarly required to have an information security program to safeguard the confidentiality and security of customer information and to ensure proper disposal. Customers must be notified when unauthorized disclosure involves sensitive customer information that may be misused.
Consumer Regulation. Activities of the Bank are subject to a variety of statutes and regulations designed to protect consumers. These laws and regulations include, among numerous other things, provisions that:
| ● | limit the interest and other charges collected or contracted for by the Bank, including new rules respecting the terms of credit cards and of debit card overdrafts; |
| ● | govern the Bank’s disclosures of credit terms to consumer borrowers; |
20
| ● | require the Bank to provide information to enable the public and public officials to determine whether it is fulfilling its obligation to help meet the housing needs of the community it serves; |
| ● | prohibit the Bank from discriminating on the basis of race, creed or other prohibited factors when it makes decisions to extend credit; |
| ● | govern the manner in which the Bank may collect consumer debts; and |
| ● | prohibit unfair, deceptive or abusive acts or practices in the provision of consumer financial products and services. |
Mortgage Regulation. The CFPB has issued rules to implement requirements of the Dodd-Frank Act pertaining to mortgage loan origination (including with respect to loan originator compensation and loan originator qualifications) as well as integrated mortgage disclosure rules. In addition, the CFPB has issued rules that require servicers to comply with new standards and practices with regard to: error correction; information disclosure; force-placement of insurance; information management policies and procedures; requiring information about mortgage loss mitigation options be provided to delinquent borrowers; providing delinquent borrowers access to servicer personnel with continuity of contact about the borrower’s mortgage loan account; and evaluating borrowers’ applications for available loss mitigation options. These rules also address initial rate adjustment notices for adjustable-rate mortgages (ARMs), periodic statements for residential mortgage loans, and prompt crediting of mortgage payments and response to requests for payoff amounts.
In 2020, the CARES Act granted certain forbearance rights and protection against foreclosure to borrowers with a “federally backed mortgage loan,” including certain first or subordinate lien loans designed principally for the occupancy of one to four families. These consumer protections continue during the COVID 19 pandemic emergency.
Non-Discrimination Policies. The Bank is also subject to, among other things, the provisions of the Equal Credit Opportunity Act (the “ECOA”) and the Fair Housing Act (the “FHA”), both of which prohibit discrimination based on race or color, religion, national origin, sex, and familial status in any aspect of a consumer or commercial credit or residential real estate transaction. The Department of Justice (the “DOJ”), and the federal bank regulatory agencies have issued an Interagency Policy Statement on Discrimination in Lending that provides guidance to financial institutions in determining whether discrimination exists, how the agencies will respond to lending discrimination, and what steps lenders might take to prevent discriminatory lending practices. The DOJ has increased its efforts to prosecute what it regards as violations of the ECOA and FHA.
21
In addition to the other information contained in this Form 10-K, you should carefully consider the risks described below, as well as the risk factors and uncertainties discussed in our other public filings with the SEC under the caption “Risk Factors” in evaluating us and our business and making or continuing an investment in our stock. Our operations and financial results are subject to various risks and uncertainties, including, but not limited to, the material risks described below. Many of these risks are beyond our control although efforts are made to manage those risks while simultaneously optimizing operational and financial results. The occurrence of any of the following risks, as well as risks of which we are currently unaware or currently deem immaterial, could materially and adversely affect our assets, business, cash flows, condition (financial or otherwise), liquidity, prospects, results of operations and the trading price of our common stock. It is impossible to predict or identify all such factors and, as a result, you should not consider the following factors to be a complete discussion of the risks, uncertainties and assumptions that could materially and adversely affect our assets, business, cash flows, condition (financial or otherwise), liquidity, prospects, results of operations and the trading price of our common stock. These risks may also be heightened by the disruption and uncertainty resulting from COVID-19.
In addition, certain statements in the following risk factors constitute forward-looking statements. Please refer to the section entitled “Cautionary Note Regarding Forward-Looking Statements” beginning on page 3 of this Annual Report.
Risks Related to Our Business
The novel coronavirus, COVID-19, may adversely affect our business, financial condition, results of operations and our liquidity in the short term and for the foreseeable future.
In March 2020, the outbreak of COVID-19 caused by a novel strain of the coronavirus was recognized as a pandemic by the World Health Organization. Shortly thereafter, the President of the United States declared a National Emergency throughout the United States attributable to such outbreak. The outbreak has become increasingly widespread in the United States, including in the markets in which we operate. The Company has taken a number of steps to assess the effects, and mitigate the adverse consequences to its businesses, of the outbreak; though the magnitude of the impact remains to be seen, the Company’s business will likely be adversely impacted by the outbreak of COVID-19.
The Company’s operations and profitability are impacted by business and economic conditions generally, as well as those in the primary banking markets in which it operates. The COVID-19 pandemic has resulted in historic job losses and decreases in economic activity. While the duration and full extent of job losses and magnitude of economic dislocation are not yet known, it is clear that they will continue to impact the ability of individuals and businesses to make payments, adversely affect the value of underlying collateral and the ability of guarantors to make payments in the case of default, which may decrease demand for the Company’s products and services and otherwise adversely impact the Company’s financial condition, results of operations and business.
The United States and various state and local governments have implemented various programs designed to aid individuals and businesses, but the impact of, and extent to which, these efforts will be successful cannot be determined at this time. We have participated in some of these programs, including PPP, and likely will continue to participate in and facilitate such programs. Such programs have been developed and implemented rapidly, often with little immediate guidance from regulatory authorities, creating uncertainty regarding the rules for participating in and facilitating these programs in a compliant manner. Since the opening of the PPP, many banks have been subject to litigation regarding the process and procedures that such banks used in processing applications for the PPP and claims related to agent fees. We may experience losses as a result of our participation in and facilitation of PPP and similar government stimulus and relief programs, including losses arising from fraud, litigation or regulatory action.
Federal, state and local governments have mandated or encouraged financial services companies to make accommodations to borrowers and other customers affected by the COVID-19 pandemic. Legal and regulatory responses to concerns about the COVID-19 pandemic could result in additional regulation or restrictions affecting the conduct of our business in the future. In addition to the potential affects from negative economic conditions noted above, the Company instituted a program to help COVID-19 impacted customers. This program includes waiving non-sufficient fund fees,
22
offering payment deferment and other loan relief, as appropriate, for customers impacted by COVID-19. The Company’s liquidity could be negatively impacted if a significant number of customers apply and are approved for the deferral of payments. In addition, if these deferrals are not effective in mitigating the effect of COVID-19 on the Company’s customers, it may adversely affect its business and results of operations more substantially over a longer period of time.
COVID-19 presents a significant risk to our loan portfolio. Timely loan repayment and the value of collateral supporting the loans are affected by the strength of our borrower’s business. Concern about the spread of COVID-19 has caused and is likely to continue to cause business shutdowns, limitations on commercial activity and financial transactions, labor shortages, supply chain interruptions, increased unemployment and commercial property vacancy rates, reduced profitability and ability for property owners to make mortgage payments, and overall economic and financial market instability, all of which may cause our customers to be unable to make scheduled loan payments. If the effects of COVID-19 result in widespread and sustained repayment shortfalls on loans in our portfolio, we could incur significant delinquencies, foreclosures and credit losses, particularly if the available collateral is insufficient to cover our exposure. The future effects of COVID-19 on economic activity could negatively affect the collateral values associated with our existing loans, the ability to liquidate the real estate collateral securing our residential and commercial real estate loans, our ability to maintain loan origination volume and to obtain additional financing, the future demand for or profitability of our lending and services, and the financial condition and credit risk of our customers. Further, in the event of delinquencies, regulatory changes and policies designed to protect borrowers may slow or prevent us from making our business decisions or may result in a delay in our taking certain remediation and collection actions, such as foreclosure. Approximately 15.8% of our loan portfolio also includes exposure to sectors that are expected to be subject to increased risk from COVID-19, including hotels, restaurants and retail.
As a result of the adverse impact of COVID-19 on our customers, we have faced and may continue to face a decrease in demand for certain products, reduced access to our branches by our customers, and disruptions in the operations of its vendors. The pandemic could also result in recognition of additional credit losses in the Company’s loan portfolios and increase its allowance for credit losses as both businesses and consumers are negatively impacted by the economic downturn. In addition, in future periods the Company will be required to evaluate the impact of COVID-19 on the carrying value of certain of its assets, including goodwill, and to conduct impairments tests on those assets, which may result in impairment charges on these assets in future periods that could be material.
Effective March 2020, the Federal Reserve lowered the primary credit rate by 150 basis points to 0.25 percent to mitigate the effects of the COVID-19 pandemic and to support the liquidity and stability of banking institutions as they serve the increased demand for credit. We expect a long duration of reduced interest rates to negatively impact our net interest income, margin, cost of borrowing and future profitability and to have a material adverse effect on our financial results.
In order to protect the health of our customers and employees, and to comply with applicable government restrictions, we have modified our business practices, including restricting employee travel, directing many employees to work remotely, cancelling in-person meetings and implementing our business continuity plans and protocols to the extent necessary. We may take further such actions that we determine are in the best interest of our employees, customers and communities or as may be required by government order. These precautions could impact demand for the Company’s products and services.
As many of our employees are required to work from home, our internal controls over financial reporting could also be negatively affected as the remote working environment could necessitate new processes, procedures, and controls. The increased reliance on remote access to information systems also increases the Company’s exposure to potential cybersecurity breaches and could impact the Company’s productivity. Additionally, the Company’s business customers are increasingly required to work remotely as well and may not have appropriately secured remote networks may be more vulnerable to cyber-attacks or phishing schemes that could also affect us. Furthermore, if a large proportion of the Company’s key employees were to contract COVID-19 or be quarantined as a result of the virus, then the Company’s operations could be adversely impacted and its business continuity plans may not prove effective.
23
Any of these occurrences could have a material adverse effect on the Company’s financial condition, results of operations and business. The extent to which the pandemic impacts the Company’s results will depend on future developments, which are highly uncertain and cannot be predicted, including the duration of the pandemic, government and regulatory responses to the pandemic, new information which may emerge concerning its severity and the actions necessary to contain it or address its impact, among others. Behavioral changes are not fully known and may not be temporary. See the section captioned “Overview” in Part II. Financial Information, Item 7. Management’s discussion and Analysis of Financial Condition and Results of Operations elsewhere in this report for further discussion.
A decline in general business and economic conditions and any regulatory responses to such conditions could have a material adverse effect on our business, financial position, results of operations and growth prospects.
Our business and operations are sensitive to general business and economic conditions in the United States, generally, and particularly in the states of Alabama, Florida, Georgia, New Jersey, New York, Texas and Virginia. Unfavorable or uncertain economic and market conditions could lead to credit quality concerns related to borrower repayment ability and collateral protection as well as reduced demand for the products and services we offer. In recent years, there has been a gradual improvement in the U.S. economy as evidenced by a rebound in the housing market, lower unemployment and higher valuations in the equities markets. However, economic growth has been greatly impacted by the effects of the COVID-19 pandemic, and opinions vary on the strength and direction of the economy. If the national, regional and local economies experience worsening economic conditions, including deflation, elevated levels of unemployment, fluctuations in debt and equity capital markets, increased delinquencies on mortgage, commercial and consumer loans, residential and commercial real estate price declines, and lower home sales and commercial activity, our growth and profitability could be constrained.
We face strong competition from financial services companies and other companies that offer commercial and retail banking services, which could harm our business.
Many of our competitors offer the same, or a wider variety of, the banking and related financial services we offer within our market areas. These competitors include national banks, regional banks and other community banks, including banks similar to us that primarily serve distinct or multi-ethnic communities. In many instances these national and regional banks have greater resources than we do, and the smaller community banks may have stronger ties in local markets than we do, which may put us at a competitive disadvantage. We also face competition from many other types of financial institutions, including savings associations, finance companies, brokerage firms, insurance companies, credit unions, mortgage banks and other financial intermediaries. In addition, a number of out-of-state financial intermediaries have opened production offices or otherwise solicit deposits in our market areas.
Increased competition in our markets may result in reduced loans, deposits and commissions and brokers’ fees, gains on sales, servicing fees, as well as reduced net interest margin and profitability. If we are unable to attract and retain banking and mortgage loan customers and expand our sales market for such loans, we may be unable to continue to grow our business, and our financial condition and results of operations may be adversely affected.
Fluctuations in interest rates may impact net interest income and otherwise negatively impact our financial condition and results of operations.
Shifts in short-term interest rates may impact net interest income, which is the principal component of our earnings. Changes in interest rates could influence our ability to originate loans and deposits. Historically, there has been an inverse correlation between the demand for loans and interest rates. Loan origination volume usually declines during periods of rising or high interest rates and increases during periods of declining or low interest rates. Interest rate increases often result in larger payment requirements for our borrowers, which increases the potential for default. At the same time, the marketability of any underlying property that serves as collateral for such loans may be adversely affected by any reduced demand resulting from higher interest rates. In addition, an increase in interest rates that adversely affects the ability of borrowers to pay the principal or interest on loans may lead to an increase in nonperforming assets and a reduction of income recognized, which could have a material adverse effect on our results of operations and cash flows. Further, when we place a loan on nonaccrual status, we reverse any accrued but unpaid interest receivable, which decreases interest income. Subsequently, we continue to have a cost to fund the loan, which is reflected as interest expense, without any
24
interest income to offset the associated funding expense. Thus, an increase in the amount of nonperforming assets would have an adverse impact on net interest income.
Changes in interest rates also can affect the value of loans, securities and other assets. Rising interest rates will result in a decline in value of the fixed-rate debt securities we hold in our investment securities portfolio. The unrealized losses resulting from holding these securities would be recognized in accumulated other comprehensive income and reduce total shareholders’ equity. Unrealized losses do not negatively impact our regulatory capital ratios. However, tangible common equity and the associated ratios would be reduced. If debt securities in an unrealized loss position are sold, such losses become realized and will reduce our regulatory capital ratios.
Interest rates on our outstanding financial instruments might be subject to change based on regulatory developments, which could adversely affect our revenue, expenses, and the value of those financial instruments.
On July 27, 2017, the United Kingdom’s Financial Conduct Authority, which regulates LIBOR, publicly announced that it intends to stop persuading or compelling banks to submit LIBOR rates after 2021. The ICE Benchmark Administration (IBA), the administrator of LIBOR, announced on November 30, 2020, that it would cease publishing the one-week and two-month LIBOR rates on December 31, 2021, but would continue publishing the one-, three-, six-, and twelve-month LIBOR rates until June 30, 2023. Regardless, the federal banking agencies also issued guidance on November 30, 2020, encouraging banks to (i) stop using LIBOR in new financial contracts no later than December 31, 2021; and (ii) either use a rate other than LIBOR or include clear language defining the alternative rate that will be applicable after LIBOR’s discontinuation. At this time, it is impossible to predict whether and to what extent banks will continue to provide LIBOR submissions for the calculation of LIBOR. Similarly, it is not possible to predict whether LIBOR will continue to be viewed as an acceptable market benchmark prior to its 2023 retirement, what rate or rates may become accepted alternatives to LIBOR, or the effect of any such changes in views or alternatives may be on the markets for LIBOR-indexed financial instruments.
In particular, regulators, industry groups and certain committees (e.g., the Alternative Reference Rates Committee) have, among other things, published recommended fallback language for LIBOR-linked financial instruments, identified recommended alternatives for certain LIBOR rates (e.g., the Secured Overnight Financing Rate as the recommended alternative to U.S. Dollar LIBOR), and proposed implementations of the recommended alternatives in floating rate instruments. At this time, it is not possible to predict whether these specific recommendations and proposals will be broadly accepted, whether they will continue to evolve, and what the effect of their implementation may be on the markets for floating-rate financial instruments.
Our adjustable-rate commercial real estate loans are generally based on the Wall Street Journal Prime Rate (WSJPR) or London Interbank Offered Rate (LIBOR), and as of December 31, 2020, most of our loans were based on WSJPR. However, we may not be able to successfully eliminate all loans tied to LIBOR prior to 2022. Even with “fallback” provisions contained within remaining LIBOR tied loans, changes to or the discontinuance of LIBOR could result in customer uncertainty and disputes around how variable rates should be calculated. All of this could result in damage to our reputation, loss of customers and additional costs to us, all of which could be material.
Liquidity risks could affect operations and jeopardize our business, financial condition, and results of operations.
Liquidity is essential to our business. An inability to raise funds through deposits, borrowings, the sale of loans and/or investment securities and through other sources could have a substantial negative effect on our liquidity. Our most important source of funds consists of our customer deposits. Such deposit balances can decrease when customers perceive alternative investments, such as the stock market, as providing a better risk/return tradeoff. If customers move money out of bank deposits and into other investments, we could lose a relatively low cost source of funds, which would require us to seek wholesale funding alternatives in order to continue to grow, thereby increasing our funding costs and reducing our net interest income and net income.
Other primary sources of funds consist of cash from operations, investment maturities and sales, sale of loans and proceeds from the issuance and sale of our equity securities to investors. Additional liquidity is provided by our ability to borrow from the Federal Reserve Bank of Atlanta and the Federal Home Loan Bank of Atlanta. We also may borrow from
25
third-party lenders from time to time. Our access to funding sources in amounts adequate to finance or capitalize our activities or on terms that are acceptable to us could be impaired by factors that affect us directly or the financial services industry or economy in general, such as disruptions in the financial markets or negative views and expectations about the prospects for the financial services industry.
Any decline in available funding could adversely impact our ability to continue to implement our strategic plan, including our ability to originate loans, invest in securities, meet our expenses, or to fulfill obligations such as repaying our borrowings or meeting deposit withdrawal demands, any of which could have a material adverse impact on our liquidity, business, financial condition and results of operations.
Our business depends on our ability to successfully manage credit risk.
We are subject to the risk of losses resulting from the failure of borrowers, guarantors and related parties to pay us the interest and principal amounts due on their loans. Although we maintain well-defined credit policies and credit underwriting and monitoring and collection procedures, these policies and procedures may not prevent losses, particularly during periods in which the local, regional or national economy suffers a general decline. The future effects of COVID-19 on economic activity could negatively affect the collateral values associated with our existing loans, the ability to liquidate the real estate collateral securing our residential and commercial real estate loans, our ability to maintain loan origination volume and to obtain additional financing, the future demand for or profitability of our lending and services, and the financial condition and credit risk of our customers. Further, in the event of delinquencies, regulatory changes and policies designed to protect borrowers may slow or prevent us from making our business decisions or may result in a delay in our taking certain remediation actions, such as foreclosure. If borrowers fail to repay their loans, our financial condition and results of operations would be adversely affected.
Because a significant portion of our loan portfolio is comprised of real estate loans, negative changes in the economy affecting real estate values and liquidity could impair the value of collateral securing our real estate loans and result in loan and other losses.
At December 31, 2020, approximately 91.6% of our loan portfolio was comprised of loans with real estate as a primary or secondary component of collateral. As a result, adverse developments affecting real estate values in our market areas could increase the credit risk associated with our real estate loan portfolio. The market value of real estate can fluctuate significantly in a short period of time as a result of market conditions in the geographic area in which the real estate is located. Adverse changes affecting real estate values and the liquidity of real estate in one or more of our markets could increase the credit risk associated with our loan portfolio, significantly impair the value of property pledged as collateral on loans and affect our ability to sell the collateral upon foreclosure without a loss or additional losses, which could result in losses that would adversely affect profitability. Such declines and losses would have a material adverse impact on our business, results of operations and growth prospects. In addition, if hazardous or toxic substances are found on properties pledged as collateral, the value of the real estate could be impaired. If we foreclose on and take title to such properties, we may be liable for remediation costs, as well as for personal injury and property damage. Environmental laws may also require us to incur substantial expenses to address unknown liabilities and may materially reduce the affected property’s value or limit our ability to use or sell the affected property.
Many of our loans are to commercial borrowers, which have a higher degree of risk than other types of loans.
Commercial loans represented approximately 40.4% of our total loan portfolio at December 31, 2020. Commercial loans are often larger and involve greater risks than other types of lending. Because payments on such loans are often dependent on the successful operation or development of the property or business involved, repayment of such loans is often more sensitive than other types of loans to adverse conditions in the real estate market or the general business climate and economy. Accordingly, a downturn in the real estate market and a challenging business and economic environment may increase our risk related to commercial loans, particularly commercial real estate loans. Unlike residential mortgage loans, which generally are made on the basis of the borrowers’ ability to make repayment from their employment and other income and which are secured by real property whose value tends to be more easily ascertainable, commercial loans typically are made on the basis of the borrowers’ ability to make repayment from the cash flow of the commercial venture. Our commercial and industrial loans are primarily made based on the identified cash flow of the borrower and secondarily
26
on the collateral underlying the loans. Most often, collateral consists of accounts receivable, inventory and equipment. Inventory and equipment may depreciate over time, may be difficult to appraise and may fluctuate in value based on the success of the business. Accounts receivable may be uncollectable. If the cash flow from business operations is reduced, the borrower’s ability to repay the loan may be impaired. Due to the larger average size of each commercial loan as compared with other loans such as residential mortgage loans, as well as collateral that is generally less readily-marketable, losses incurred on a small number of commercial loans could have a material adverse impact on our financial condition and results of operations.
The residential mortgage loans that we originate consist primarily of non-conforming residential mortgage loans which may be considered less liquid and more risky.
The residential mortgage loans that we originate consist primarily of non-conforming residential mortgage loans, which are typically considered to have a higher degree of risk and are less liquid than conforming residential mortgage loans. We attempt to address this enhanced risk through our underwriting process, including requiring larger down payments and, in some cases, six months principal, interest, taxes and insurance reserves for individuals with no credit score.
We also have significant concentration in our residential mortgage loan secondary sale market, as a substantial portion of our non-conforming residential mortgage loans over the past three years have been sold to a small number of financial institutions. Although we are taking steps to reduce our dependence on those financial institutions and are attempting to expand the number of financial institutions to which we sell our non-conforming residential mortgage loans, we may not be successful expanding our sales market for our non-conforming residential mortgage loans. Additionally, if we lose any of these financial institutions, our resale market may decline and we may not be able to sell our non-conforming residential mortgage loans at our current volume, which will significantly decrease our non-interest income as well as limit the number of non-conforming residential mortgage loans we can put on our books without excess interest rate risk. These loans also present pricing risk as rates change, and our sale premiums cannot be guaranteed. Further, the criteria for our loans to be purchased by other financial institutions may change from time to time, which could result in a lower volume of corresponding loan originations. In addition, when we sell the non-conforming residential mortgage loans, we are required to make certain representations and warranties to the purchaser regarding such loans. Under those agreements, we may be required to repurchase the non-conforming residential mortgage loans if we have breached any of these representations or warranties, in which case we may record a loss. Additionally, if repurchase and indemnity demands increase on loans that we sell from our portfolio, our liquidity, results of operations and financial condition could be adversely affected.
Small Business Administration lending is an important part of our business. Our SBA lending program is dependent upon the U.S. federal government, and we face specific risks associated with originating SBA loans.
Our SBA lending program is dependent upon the U.S. federal government. As an approved participant in the SBA Preferred Lender’s Program (an “SBA Preferred Lender”), we enable our clients to obtain SBA loans more efficiently. The SBA periodically reviews the lending operations of participating lenders to assess, among other things, whether the lender exhibits prudent risk management. When weaknesses are identified, the SBA may request corrective actions or impose enforcement actions, including revocation of the lender’s SBA Preferred Lender status. If we lose our status as an SBA Preferred Lender, we may lose some or all of our customers to lenders who are SBA Preferred Lenders, and as a result we could experience a material adverse effect to our financial results. Any changes to the SBA program, including but not limited to changes to the level of guarantee provided by the federal government on SBA loans, changes to program specific rules impacting volume eligibility under the guaranty program, as well as changes to the program amounts authorized by Congress or funding for the SBA program may also have a material adverse effect on our business. In addition, any default by the U.S. government on its obligations or any prolonged government shutdown could, among other things, impede our ability to originate SBA loans or sell such loans in the secondary market, which could materially and adversely affect our business, results of operations and financial condition.
The SBA’s 7(a) Loan Program is the SBA’s primary program for helping start-up and existing small businesses, with financing guaranteed for a variety of general business purposes. Typically, we sell the guaranteed portion of our SBA 7(a) loans in the secondary market. These sales result in premium income for us at the time of sale and create a stream of future servicing income, as we retain the servicing rights to these loans. For the reasons described above, we may not be able to
27
continue originating these loans or selling them in the secondary market. Furthermore, even if we are able to continue to originate and sell SBA 7(a) loans in the secondary market, we might not continue to realize premiums upon the sale of the guaranteed portion of these loans or the premiums may decline due to economic and competitive factors. When we originate SBA loans, we incur credit risk on the non-guaranteed portion of the loans, and if a customer defaults on a loan, we share any loss and recovery related to the loan pro-rata with the SBA. If the SBA establishes that a loss on an SBA guaranteed loan is attributable to significant technical deficiencies in the manner in which the loan was originated, funded or serviced by us, the SBA may seek recovery of the principal loss related to the deficiency from us. Generally, we do not maintain reserves or loss allowances for such potential claims and any such claims could materially and adversely affect our business, financial condition or results of operations.
The laws, regulations and standard operating procedures that are applicable to SBA loan products may change in the future. We cannot predict the effects of these changes on our business and profitability. Because government regulation greatly affects the business and financial results of all commercial banks and bank holding companies and especially our organization, changes in the laws, regulations and procedures applicable to SBA loans could adversely affect our ability to operate profitably.
The non-guaranteed portion of SBA loans that we retain on our balance sheet as well as the guaranteed portion of SBA loans that we sell could expose us to various credit and default risks.
We generally retain the non-guaranteed portions of the SBA loans that we originate. The non-guaranteed portion of SBA loans have a higher degree of credit risk and risk of loss as compared to the guaranteed portion of such loans. When we sell the guaranteed portion of SBA loans in the ordinary course of business, we are required to make certain representations and warranties to the purchaser about the SBA loans and the manner in which they were originated. Under these agreements, we may be required to repurchase the guaranteed portion of the SBA loan if we have breached any of these representations or warranties, in which case we may record a loss. In addition, if repurchase and indemnity demands increase on loans that we sell from our portfolio, our liquidity, results of operations and financial condition could be adversely affected.
The recognition of gains on the sale of loans and servicing asset valuations reflect certain assumptions.
We expect that gains on the sale of U.S. government guaranteed loans will comprise a meaningful component of our revenue. The gains on such sales recognized for the year ended December 31, 2020 and 2019 were $6.5 million and $5.4 million, respectively. The determination of these gains is based on assumptions regarding the value of unguaranteed loans retained, servicing rights retained and deferred fees and costs, and net premiums paid by purchasers of the guaranteed portions of U.S. government guaranteed loans. The value of retained unguaranteed portion of the loans and servicing rights are determined based on market derived factors such as prepayment rates, current market conditions and recent loan sales. Deferred fees and costs are determined using internal analysis of the cost to originate loans. Significant errors in assumptions used to compute gains on sale of loans or servicing asset valuations could result in material revenue misstatements, which may have a material adverse effect on our business, results of operations and profitability. In addition, while we believe these valuations reflect fair value and such valuations are subject to validation by an independent third party, if such valuations are not reflective of fair market value then our business, results of operations and financial condition may be materially and adversely affected.
We may not be able to continue growing our business, particularly if we cannot increase loans and deposits through organic growth.
We have grown our consolidated assets from $1.10 billion as of December 31, 2016 to $1.90 billion as of December 31, 2020, and our deposits from $870.9 million as of December 31, 2016 to $1.48 billion as of December 31, 2020. Our ability to continue to grow successfully will depend to a significant extent on our capital resources. It also will depend, in part, upon our ability to attract deposits and grow our loan portfolio and investment opportunities and on whether we can continue to fund growth while maintaining cost controls and asset quality, as well as on other factors beyond our control, such as national, regional and local economic conditions and interest rate trends.
28
Construction and development loans are based upon estimates of costs and values associated with the complete project. These estimates may be inaccurate, and we may be exposed to significant losses on loans for these projects.
Construction and development loan involve additional risks because funds are advanced upon the security of the project, which is of uncertain value prior to its completion, and costs may exceed realizable values in declining real estate markets. Because of the uncertainties inherent in estimating construction costs and the realizable market value of the completed project and the effects of governmental regulation of real property, it is relatively difficult to evaluate accurately the total funds required to complete a project and the related LTV ratio. As a result, construction loans often involve the disbursement of substantial funds with repayment dependent, in part, on the success of the ultimate project and the ability of the borrower to sell or lease the property, rather than the ability of the borrower or guarantor to repay principal and interest. If our appraisal of the value of the completed project proves to be overstated or market values or occupancy or rental rates decline, we may have inadequate security for the repayment of the loan upon completion of construction of the project. If we are forced to foreclose on a project prior to or at completion due to a default, we may not be able to recover all of the unpaid balance of, and accrued interest on, the loan as well as related foreclosure and holding costs. In addition, we may be required to fund additional amounts to complete the project and may have to hold the property for an unspecified period of time while we attempt to dispose of it.
We use brokered deposits which may be an unstable and/or expensive deposit source to fund earning asset growth.
We use brokered deposits, as a source of funding to support our asset growth and augment deposits generated from our branch network, which are our principal source of funding. We have established policies and procedures with respect to the use of brokered deposits, which require, among other things, that (i) we limit the amount of brokered deposits as a percentage of total assets and (ii) our asset liability committee monitors our use of brokered deposits on a regular basis, including interest rates and the total volume of such deposits in relation to our total assets. In the event that our funding strategies call for the use of brokered deposits, there can be no assurance that such sources will be available, or will remain available, or that the cost of such funding sources will be reasonable. Additionally, if the Bank is no longer considered well-capitalized, our ability to access new brokered deposits or retain existing brokered deposits could be affected by market conditions, regulatory requirements or a combination thereof, which could result in most, if not all, brokered deposit sources being unavailable. The inability to utilize brokered deposits as a source of funding could have an adverse effect on our financial position, results of operations and liquidity.
We are highly dependent on our management team, and the loss of our senior executive officers or other key employees could harm our ability to implement our strategic plan, impair our relationships with customers and adversely affect our business, results of operations and growth prospects.
Our success depends, in large part, on our ability to attract and retain key personnel. Competition for the best personnel in most activities we engage in can be intense, and we may not be able to hire personnel or to retain them. The unexpected loss of services of one or more of our key personnel could have a material adverse impact on our business because of their skills, knowledge of our market, relationships in the communities we serve, years of industry experience and the difficulty of promptly finding qualified replacement personnel. Although we have employment agreements with certain of our executive officers, there is no guarantee that these officers and other key personnel will remain employed with the Company.
Nonperforming assets take significant time to resolve and adversely affect our results of operations and financial condition, and could result in further losses in the future.
Our nonperforming assets adversely affect our net income in various ways. We do not record interest income on nonaccrual loans or OREO, thereby adversely affecting our net interest income, net income and returns on assets and equity, and our loan administration costs increase, which together with reduced interest income adversely affects our efficiency ratio. When we take collateral in foreclosure and similar proceedings, we are required to mark the collateral to its then-fair market value, which may result in a loss. These nonperforming loans and OREO also increase our risk profile and the level of capital our regulators believe is appropriate for us to maintain in light of such risks. The resolution of nonperforming assets requires significant time commitments from management and can be detrimental to the performance of their other responsibilities. If we experience increases in nonperforming loans and nonperforming assets, our net interest
29
income may be negatively impacted and our loan administration costs could increase, each of which would have an adverse effect on our net income and related ratios, such as return on assets and equity.
Our allowance for loan losses may prove to be insufficient to absorb potential losses in our loan portfolio.
We make various assumptions and judgments about the collectability of our loan and lease portfolio and utilize these assumptions and judgments when determining the provision and allowance for credit losses. The determination of the appropriate level of the provision for credit losses inherently involves a high degree of subjectivity and requires us to make significant estimates of current credit risks and future trends, all of which may undergo material changes, as we have experienced and expect to continue to experience as a result of the COVID-19 pandemic. Deterioration in economic conditions affecting borrowers, new information regarding existing loans, identification of additional problem loans and other factors, including the impact of COVID-19 and the recent election, both within and outside of our control, may require an increase in the amount reserved in the allowance for credit losses. In addition, bank regulatory agencies periodically review our provision and the total allowance for credit losses and may require an increase in the allowance for credit losses or future provisions for credit losses, based on judgments different than those of management. Any increases in the provision or allowance for credit losses will result in a decrease in our net income and, potentially, capital, and may have a material adverse effect on our financial condition or results of operations.
Real estate market volatility and future changes in our disposition strategies could result in net proceeds that differ significantly from our OREO fair value appraisals.
As of December 31, 2020, we held an OREO balance of $3.8 million. Our OREO portfolio historically has been insignificant, and generally consisted of properties that we obtained through foreclosure or through a deed in lieu of foreclosure. Properties in our OREO portfolio are recorded at the lower of the recorded investment in the loans for which the properties previously served as collateral or the “fair value”, which represents the estimated sales price of the properties on the date acquired less estimated selling costs. Generally, in determining “fair value,” an orderly disposition of the property is assumed, except when a different disposition strategy is expected. Judgment is required in estimating the fair value of OREO, and the period of time within which such estimates can be considered current is shortened during periods of market volatility. As a result of the significant judgments required in estimating fair value and the variables involved in different methods of disposition, the net proceeds realized from such sales transactions could differ significantly from appraisals, comparable sales and other estimates used to determine the fair value of our OREO properties.
We could recognize losses on securities held in our securities portfolio, particularly if interest rates increase or economic and market conditions deteriorate.
Changes in interest rates may negatively affect both the returns on and market value of our investment securities. Interest rate volatility can reduce unrealized gains or increase unrealized losses in our portfolio. Interest rates are highly sensitive to many factors including monetary policies, domestic and international economic and political issues, and other factors beyond our control. Additionally, actual investment income and cash flows from investment securities that carry prepayment risk, such as mortgage-backed securities and callable securities, may materially differ from those anticipated at the time of investment or subsequently as a result of changes in interest rates and market conditions. These occurrences could have a material adverse effect on our net interest income or our results of operations.
The current expected credit loss standard established by the Financial Accounting Standards Board will require significant data requirements and changes to methodologies.
In the aftermath of the 2007-2008 financial crisis, the Financial Accounting Standards Board, or FASB, decided to review how banks estimate losses in the ALL calculation, and it issued the final Current Expected Credit Loss, or CECL, standard on June 16, 2016. Currently, the impairment model used by financial institutions is based on incurred losses, and loans are recognized as impaired when there is no longer an assumption that future cash flows will be collected in full under the originally contracted terms. This model will be replaced by the CECL model that will become effective for us for the fiscal year beginning after December 15, 2022 in which financial institutions will be required to use historical information, current conditions and reasonable forecasts to estimate the expected loss over the life of the loan. Management established a task force to begin the implementation process. We are currently collecting the historical data required by
30
the new model and have engaged a third-party software solution to develop a new expected credit loss model compliant with the new standard. The transition to the CECL model will require significantly greater data requirements and changes to methodologies to accurately account for expected loss. There can be no assurance that we will not be required to increase our reserves and ALL as a result of the implementation of CECL.
There is risk related to potential acquisitions.
We plan to continue to grow our business organically. However, from time to time, we may consider opportunistic strategic acquisitions that we believe support our long-term business strategy. We face significant competition from numerous other financial services institutions, many of which will have greater financial resources than we do, when considering acquisition opportunities. Accordingly, attractive acquisition opportunities may not be available to us. Futhermore, we may not be able to complete future acquisitions and, if we do complete such acquisitions, we may not be able to successfully integrate the operations, management, products and services of the entities that we acquire and eliminate redundancies.
New lines of business or new products and services may subject us to additional risks.
From time to time, we may implement or may acquire new lines of business or offer new products and services within existing lines of business. In developing and marketing new lines of business and new products and services we may invest significant time and resources. We may not achieve target timetables for the introduction and development of new lines of business and new products or services and price and profitability goals may not prove feasible. External factors, such as regulatory compliance obligations, competitive alternatives, and shifting market preferences, may also impact the successful implementation of a new line of business or a new product or service. Furthermore, any new line of business and/or new product or service could have a significant impact on the effectiveness of our system of internal controls. Failure to successfully manage these risks in the development and implementation of new lines of business or new products or services could have a material adverse effect on our business, results of operations and financial condition.
We focus on marketing our services to a limited segment of the population and any adverse change impacting such segment is likely to have an adverse impact on us.
Our marketing focuses primarily on the banking needs of small- and medium-sized businesses, professionals and residents in the markets that we serve, primarily communities with large Asian-American populations. This demographic concentration makes us more prone to circumstances that particularly affect this segment of the population. As a result, our financial condition and results of operations are subject to changes in the economic conditions affecting these communities. Our success depends upon the business activity, population, income levels, deposits and real estate activity in these communities. Although our customers’ business and financial interests may extend well beyond these communities, adverse economic conditions that affect these communities could reduce our growth rate, affect the ability of our customers to repay their loans to us and generally affect our financial condition and results of operations. Because of our geographic concentration, we are less able than regional or national financial institutions to diversify our credit risks across multiple markets. In addition, larger institutions with similar focuses are targeting our market areas. As we grow, we face entrenched multi-ethnic-oriented banks with larger resources in our new markets.
The costs and effects of litigation, investigations or similar matters, or adverse facts and developments related thereto, could materially affect our business, operating results and financial condition.
We may be involved from time to time in a variety of litigation, investigations or similar matters arising out of our business, including litigation related to our participation in stimulus programs associated with the government’s response to the COVID-19 pandemic. It is inherently difficult to assess the outcome of these matters, and we may not prevail in any proceedings or litigation. Our insurance may not cover all claims that may be asserted against us and indemnification rights to which we are entitled may not be honored, and any claims asserted against us, regardless of merit or eventual outcome, may harm our reputation. Should the ultimate judgments or settlements in any litigation or investigation significantly exceed our insurance coverage or to the extent that we incur civil money penalties that are not covered by insurance, they could have a material adverse effect on our business, financial condition and results of operations. In addition, premiums for insurance covering the financial and banking sectors are rising. We may not be able to obtain
31
appropriate types or levels of insurance in the future, nor may we be able to obtain adequate replacement policies with acceptable terms or at historic rates, if at all.
Our ability to maintain our reputation is critical to the success of our business, and the failure to do so may materially adversely affect our business and the value of our common stock.
We are a community bank, and our reputation is one of the most valuable components of our business. Threats to our reputation can come from many sources, including adverse sentiment about financial institutions generally, unethical practices, employee misconduct, failure to deliver minimum standards of service or quality, compliance deficiencies, and questionable or fraudulent activities of our customers. Negative publicity regarding our business, employees, or customers, with or without merit, may result in the loss of customers, investors and employees, costly litigation, a decline in revenues and increased governmental regulation. If our reputation is negatively affected, by the actions of our employees or otherwise, our business and, therefore, our operating results and the value of our common stock may be materially adversely affected.
Our risk management framework may not be effective in mitigating risks and/or losses to us.
Our risk management framework is comprised of various processes, systems and strategies, and is designed to manage the types of risk to which we are subject, including, among others, credit, market, liquidity, interest rate and compliance. Our framework also includes financial or other modeling methodologies that involve management assumptions and judgment. Our risk management framework may not be effective under all circumstances and may not adequately mitigate any risk or loss to us. If our risk management framework is not effective, we could suffer unexpected losses and our business, financial condition, results of operations or growth prospects could be materially and adversely affected. We may also be subject to potentially adverse regulatory consequences.
We have a continuing need for technological change, and we may not have the resources to effectively implement new technology or we may experience operational challenges when implementing new technology.
The financial services industry is continually undergoing rapid technological changes with frequent introductions of new technology-driven products and services. In addition to better serving customers, the effective use of technology increases efficiency and enables financial institutions to reduce costs. Our future success will depend in part upon our ability to address the needs of our customers by using technology to provide products and services that will satisfy customer demands for convenience as well as to create additional efficiencies in our operations as we continue to grow and expand our market area.
Many of our larger competitors have substantially greater resources to invest in technological improvements. We may not be able to effectively implement new technology-driven products and services or be successful in marketing these products and services to our customers, and even if we implement such products and services, we may incur substantial costs in doing so. Failure to successfully keep pace with technological change affecting the financial services industry could have a material adverse impact on our business, financial condition and results of operations.
System failure or breaches of our network security could subject us to increased operating costs as well as litigation and other liabilities.
The computer systems and network infrastructure we use could be vulnerable to hardware and cyber security issues. Our operations are dependent upon our ability to protect our computer equipment against damage from fire, power loss, telecommunications failure, natural disasters such as earthquakes, tornadoes and hurricanes, or a similar catastrophic event. We could also experience a breach by intentional or negligent conduct on the part of employees or other internal or external sources, including our third-party vendors and cyber criminals. Any damage or failure that causes an interruption in our operations could have an adverse effect on our financial condition and results of operations. In addition, our operations are dependent upon our ability to protect the computer systems and network infrastructure utilized by us, including our internet banking activities, against damage from physical break-ins, cyber security breaches and other disruptive problems caused by the internet or other users. Such computer break-ins, breaches and other disruptions would jeopardize the security of information stored in and transmitted through our computer systems and network infrastructure, which may result in
32
significant liability, damage our reputation and inhibit the use of our internet banking services by current and potential customers, any of which may result in a material adverse impact on our financial condition, results of operations or the market price of our common stock. As cyber threats continue to evolve, we may be required to expend significant additional resources to continue to modify or enhance our protective measures or to investigate and remediate any information security vulnerabilities. In addition, as the regulatory environment related to information security, data collection and use, and privacy becomes increasingly rigorous, with new and constantly changing requirements applicable to our business, compliance with those requirements could also result in additional costs.
We are under continuous threat of loss due to hacking and cyberattacks especially as we continue to expand client capabilities to utilize internet and other remote channels to transact business. In addition, in response to COVID-19, we have modified our business practices with a portion of our employees working remotely from their homes to have our operations uninterrupted as much as possible. Further, technology in employees’ homes may not be as robust as in our offices and could cause the networks, information systems, applications, and other tools available to employees to be more limited or less reliable than in our offices. The continuation of these work-from-home measures also introduces additional operational risk, including increased cybersecurity risk. These cyber risks include greater phishing, malware, and other cybersecurity attacks, vulnerability to disruptions of our information technology infrastructure and telecommunications systems for remote operations, increased risk of unauthorized dissemination of confidential information, limited ability to restore the systems in the event of a systems failure or interruption, greater risk of a security breach resulting in destruction or misuse of valuable information, and potential impairment of our ability to perform critical functions, including wiring funds, all of which could expose us to risks of data or financial loss, litigation and liability and could seriously disrupt our operations and the operations of any impacted customers.
To date, none of foregoing types of attacks have had a material effect on our business or operations and we maintain a system of internal controls and insurance coverage to mitigate against operational risks, including data processing system failures and errors and customer or employee fraud. However, no assurances can be provided that we may not suffer from such an attack in the future that may cause us material harm, especially in light of the risks being posed by changing technologies as well as criminal intent on committing cyber-crime.
Our operations could be interrupted if our third-party service providers experience difficulty, terminate their services or fail to comply with banking regulations.
We depend to a significant extent on a number of relationships with third-party service providers. Specifically, we receive core systems processing, essential web hosting, deposit processing and other processing services from third-party service providers. If these third-party service providers experience financial, operational, or technological difficulties or terminate their services and we are unable to replace them with other suitable service providers, our operations could be interrupted. If an interruption were to continue for a significant period of time, our business, financial condition and results of operations could be adversely affected, perhaps materially. Even if we are able to replace our service providers, it may be at a higher cost to us, which could adversely affect our business, financial condition and results of operations.
We depend on the accuracy and completeness of information provided by customers and counterparties and any misrepresented information could adversely affect our business, financial condition and results of operations.
In deciding whether to extend credit or to enter into other transactions with customers and counterparties, we rely on information furnished to us by or on behalf of such customers and counterparties, including financial statements and other financial information. We also rely on representations of customers and counterparties as to the accuracy and completeness of that information and, with respect to financial statements, on reports of independent auditors. Such information could turn out to be inaccurate, including as a result of fraud on behalf of our customers, counterparties or other third parties. In times of increased economic stress, we are at an increased risk of fraud losses. We cannot assure you that our underwriting and operational controls will prevent or detect such fraud or that we will not experience fraud losses or incur costs or other damages related to such fraud. Our customers may also experience fraud in their businesses which could adversely affect their ability to repay their loans or make use of our services. Our exposure and the exposure of our customers to fraud may increase our financial risk and reputation risk as it may result in unexpected loan losses that exceed those that have been provided for in our allowance for loan losses. Reliance on inaccurate or misleading information from our customers,
33
counterparties and other third parties, including as a result of fraud, could have a material adverse impact on our business, financial condition and results of operations.
Our accounting estimates and risk management processes rely on analytical and forecasting models.
Processes that management uses to estimate our probable incurred credit losses and to measure the fair value of financial instruments, as well as the processes used to estimate the effects of changing interest rates and other market measures on our financial condition and results of operations, depend upon the use of analytical and forecasting models. These models reflect assumptions that may not be accurate, particularly in times of market stress or other unforeseen circumstances, as we have experienced and expect to continue to experience as a result of the COVID-19 pandemic. Even if these assumptions are accurate, the models may prove to be inadequate or inaccurate because of other flaws in their design or their implementation.
If the models that management uses for interest rate risk and asset liability management are inadequate, we may incur increased or unexpected losses upon changes in market interest rates or other market measures. If the models that management uses for determining our probable credit losses are inadequate, the ALL may not be sufficient to support future charge offs. If the models that management uses to measure the fair value of financial instruments are inadequate, the fair value of such financial instruments may fluctuate unexpectedly or may not accurately reflect what we could realize upon sale or settlement of such financial instruments. Any such failure in management’s analytical or forecasting models could have a material adverse effect on our business, financial condition and results of operations.
Changes in accounting standards could materially impact our financial statements.
From time to time, the FASB or the Securities and Exchange Commission, or SEC, may change the financial accounting and reporting standards that govern the preparation of our financial statements. Such changes may result in us being subject to new or changing accounting and reporting standards. In addition, the bodies that interpret the accounting standards (such as banking regulators or outside auditors) may change their interpretations or positions on how these standards should be applied. These changes may be beyond our control, can be hard to predict and can materially impact how we record and report our financial condition and results of operations. In some cases, we could be required to apply a new or revised standard retrospectively, or apply an existing standard differently, also retrospectively, in each case resulting in our needing to revise or restate prior period financial statements. Restating or revising our financial statements may result in reputational harm or may have other adverse effects on us.
Failure to maintain effective internal controls over financial reporting could have a material adverse effect on our business and stock price.
Management regularly monitors, reviews and updates our disclosure controls and procedures, including our internal control over financial reporting. Any system of controls, however well designed and operated, is based in part on certain assumptions and can provide only reasonable assurances that the controls will be effective. Any failure or circumvention of our controls and procedures or failure to comply with regulations related to controls and procedures could have a material adverse effect on our business, results of operations and financial condition. Failure to achieve and maintain an effective internal control environment could prevent us from accurately reporting our financial results, preventing or detecting fraud or providing timely and reliable financial information pursuant to our reporting obligations, which could result in a material weakness in our internal controls over financial reporting and the restatement of previously filed financial statements and could have a material adverse effect on our business, financial condition and results of operations. Further, ineffective internal controls could cause our investors to lose confidence in our financial information, which could affect the trading price of our common stock.
We may be adversely affected by the soundness of other financial institutions.
Financial services institutions are interrelated as a result of trading, clearing, counterparty or other relationships. We have exposure to many different industries and counterparties, and we routinely execute transactions with counterparties in the financial services industry, including brokers and dealers, commercial banks, investment banks, mutual and hedge funds and other institutional customers. Many of these transactions expose us to credit risk in the event of default of our
34
counterparty or customer. In addition, our credit risk may be exacerbated when the collateral held by us cannot be realized or is liquidated at prices insufficient to recover the full amount of the loan or derivative exposure due to us. There is no assurance that any such losses would not materially and adversely affect our results of operations or earnings.
Risks Related to Legislative and Regulatory Events
We are subject to extensive government regulation that could limit or restrict our activities, which in turn may adversely impact our ability to increase our assets and earnings.
We operate in a highly regulated environment and are subject to supervision and regulation by a number of governmental regulatory agencies, including the Federal Reserve, the DBF and the FDIC. Regulations adopted by these agencies, which are generally intended to provide protection for depositors and customers rather than for the benefit of shareholders, govern a comprehensive range of matters relating to ownership and control of our shares, our acquisition of other companies and businesses, permissible activities for us to engage in, maintenance of adequate capital levels, and other aspects of our operations. These bank regulators possess broad authority to prevent or remedy unsafe or unsound practices or violations of law. The laws and regulations applicable to the banking industry could change at any time and we cannot predict the effects of these changes on our business, profitability or growth strategy. Increased regulation could increase our cost of compliance and adversely affect profitability. Moreover, certain of these regulations contain significant punitive sanctions for violations, including monetary penalties and limitations on a bank’s ability to implement components of its business plan, such as expansion through mergers and acquisitions or the opening of new branch offices. In addition, changes in regulatory requirements may add costs associated with compliance efforts. Furthermore, government policy and regulation, particularly as implemented through the Federal Reserve System, significantly affect credit conditions. Negative developments in the financial industry and the impact of new legislation and regulation in response to those developments could negatively impact our business operations and adversely impact our financial performance.
Federal and state regulators periodically examine our business, and we may be required to remediate adverse examination findings.
The Federal Reserve, the FDIC, and the DBF periodically examine our business, including our compliance with laws and regulations. If, as a result of an examination, a banking agency were to determine that our financial condition, capital resources, asset quality, earnings prospects, management, liquidity, interest rate sensitivity or other aspects of any of our operations had become unsatisfactory, or that we were in violation of any law or regulation, they may take a number of different remedial actions as they deem appropriate. These actions include the power to enjoin “unsafe or unsound” practices, to require affirmative action to correct any conditions resulting from any violation or practice, to issue an administrative order that can be judicially enforced, to direct an increase in our capital, to restrict our growth, to assess civil money penalties, to fine or remove officers and directors and, if it is concluded that such conditions cannot be corrected or there is an imminent risk of loss to depositors, to terminate our deposit insurance and place us into receivership or conservatorship. Any regulatory action against us could have an adverse effect on our business, financial condition and results of operations.
Regulatory agencies and consumer advocacy groups are becoming more aggressive in asserting claims that the practices of lenders and loan servicers result in a disparate impact on protected classes.
Antidiscrimination statutes, such as the Fair Housing Act and the ECOA, prohibit creditors from discriminating against loan applicants and borrowers based on certain characteristics, such as race, religion and national origin. Various federal regulatory agencies and departments, including the U.S. Department of Justice and the Consumer Financial Protection Bureau (“CFPB”), take the position that these laws apply not only to intentional discrimination, but also to neutral practices that have a disparate impact on a group that shares a characteristic that a creditor may not consider in making credit decisions protected classes (i.e., creditor, servicing or marketing practices that have a disproportionate negative affect on a protected class of individuals).
These regulatory agencies, as well as consumer advocacy groups and plaintiffs’ attorneys, are focusing greater attention on “disparate impact” claims. The U.S. Supreme Court confirmed that the “disparate impact” theory applies to
35
cases brought under the Fair Housing Act, while emphasizing that a causal relationship must be shown between a specific policy of the defendant and a discriminatory result that is not justified by a legitimate objective of the defendant. Although it is still unclear whether the theory applies under ECOA, regulatory agencies and private plaintiffs can be expected to continue to apply it to both the Fair Housing Act in the context of mortgage marketing, lending and servicing and ECOA in the context of our consumer and certain business loans. To extent that the “disparate impact” theory continues to apply, we will be faced with significant administrative burdens in attempting to comply, and potential liability for failures to comply.
In addition to reputational harm, violations of the ECOA and the Fair Housing Act can result in actual damages, punitive damages, injunctive or equitable relief, attorneys’ fees and civil money penalties.
We face a risk of noncompliance and enforcement action with the Bank Secrecy Act and other anti-money laundering statutes and regulations.
The Bank Secrecy Act, the USA Patriot Act and other laws and regulations require financial institutions, among other duties, to institute and maintain an effective anti-money laundering program and to file reports such as suspicious activity reports and currency transaction reports. We are required to comply with these and other anti-money laundering requirements. The federal banking agencies and Financial Crimes Enforcement Network are authorized to impose significant civil money penalties for violations of those requirements and have recently engaged in coordinated enforcement efforts against banks and other financial services providers with the U.S. Department of Justice, Drug Enforcement Administration and Internal Revenue Service. We are also subject to increased scrutiny of compliance with the rules enforced by the Office of Foreign Assets Control. If our policies, procedures and systems are deemed deficient, we would be subject to liability, including fines and regulatory actions, which may include restrictions on our ability to pay dividends and the necessity to obtain regulatory approvals to proceed with certain aspects of our business plan, including our acquisition plans.
Failure to maintain and implement adequate programs to combat money laundering and terrorist financing could also have serious reputational consequences for us. Any of these results could have a material adverse effect on our business, financial condition, results of operations and growth prospects.
The Federal Reserve may require us to commit capital resources to support the Bank.
The Federal Reserve requires a bank holding company to act as a source of financial and managerial strength to a subsidiary bank and to commit resources to support such subsidiary bank. Under the “source of strength” doctrine, the Federal Reserve may require a bank holding company to make capital injections into a troubled subsidiary bank and may charge the bank holding company with engaging in unsafe and unsound practices for failure to commit resources to a subsidiary bank. A capital injection may be required at times when the bank holding company may not have the resources to provide it and therefore may be required to borrow the funds or raise capital. As a result, we may not be able to serve existing indebtedness, and such default may require us to declare bankruptcy. Any capital contributions by a bank holding company to its subsidiary banks are subordinate in right of payment to deposits and to other indebtedness of such subsidiary bank. In the event of a bank holding company’s bankruptcy, the bankruptcy trustee will assume any commitment by the bank holding company to a federal bank regulatory agency to maintain the capital of a subsidiary bank. Moreover, bankruptcy law provides that claims based on any such commitment will be entitled to a priority of payment over the claims of the institution’s general unsecured creditors, including the holders of its note obligations. Thus, any borrowing that must be incurred by us to make a required capital injection to the Bank becomes more difficult and expensive and could have an adverse effect on our business, financial condition and results of operations.
Liabilities from environmental regulations could materially and adversely affect our business and financial condition.
In the course of our business, we may foreclose and take title to real estate, and could be subject to environmental liabilities with respect to these properties. We may be held liable to a governmental entity or to third parties for property damage, personal injury, investigation and clean-up costs incurred by these parties in connection with environmental contamination, or may be required to investigate or clear up hazardous or toxic substances, or chemical releases at a property. The costs associated with investigation or remediation activities could be substantial. In addition, as the owner
36
or former owner of any contaminated site, we may be subject to common law claims by third parties based on damages, and costs resulting from environmental contamination emanating from the property. If we ever become subject to significant environmental liabilities, our business, financial condition, liquidity, and results of operations could be materially and adversely affected.
Risks Related to Our Common Stock
The market price of our common stock may be subject to substantial fluctuations, which may make it difficult for you to sell your shares at the volume, prices and time desired.
The market price of our common stock may be volatile and could be subject to wide fluctuations in price in response to various factors, some of which are beyond our control. These factors include, among other things: actual or anticipated variations in our quarterly results of operations; recommendations by securities analysts; operating and stock price performance of other companies that investors deem comparable to us; news reports relating to trends, concerns and other issues in the financial services industry generally; perceptions in the marketplace regarding us and/or our competitors; fluctuations in the stock price and operating results of our competitors; domestic and international economic factors unrelated to our performance; general market conditions and, in particular, developments related to market conditions for the financial services industry; new technology used, or services offered, by competitors; and changes in government regulations.
In addition, if the market for stocks in our industry, or the stock market in general, experiences a loss of investor confidence, the trading price of our common stock could decline for reasons unrelated to our business, financial condition or results of operations. If any of the foregoing occurs, it could cause our stock price to fall and may expose us to lawsuits that, even if unsuccessful, could be costly to defend and a distraction to management.
The Company’s directors may have interests that differ from other shareholders, and such directors have ownership interests in the Company that, when aggregated with holdings of their extended families and their affiliated entities, may allow such individuals and entities to take certain corporate actions without the consent of other shareholders.
As of December 31, 2020, our directors and their families and affiliated entities collectively had a 32.4% ownership interest in the Company. As a result, our directors initially may be able to elect the majority of our entire board of directors, control the management and policies of the Company and, in general, determine, without the consent of the other shareholders, the outcome of any corporate transaction or other matter submitted to the shareholders for approval, including mergers, consolidations and the sale of all or substantially all of the assets of the Company, and will be able to prevent or cause a change in control of the Company.
An investment in our common stock is not an insured deposit.
An investment in our common stock is not a bank deposit and, therefore, is not insured against loss by the FDIC, any other deposit insurance fund or by any other public or private entity. Investment in our common stock is inherently risky for the reasons described herein, and is subject to the same market forces that affect the price of common stock in any company. As a result, if you acquire our common stock, you could lose some or all of your investment.
If equity research analysts do not publish research or reports about our business, or if they do publish such reports but issue unfavorable commentary or downgrade our common stock the price and trading volume of our common stock could decline.
The trading market for our common stock could be affected by whether equity research analysts publish research or reports about us and our business. We cannot predict at this time whether any research analysts will publish research and reports on us and our common stock. If one or more equity analysts do cover us and our common stock and publish research reports about us, the price of our stock could decline if one or more securities analysts downgrade our stock or if those analysts issue other unfavorable commentary or cease publishing reports about us or our business.
37
If any of the analysts who elect to cover us downgrades our stock, our stock price could decline rapidly. If any of these analysts ceases coverage of us, we could lose visibility in the market, which in turn could cause our common stock price or trading volume to decline and our common stock to be less liquid.
Our dividend policy may change, and consequently, your only opportunity to achieve a return on your investment may be if the price of our common stock appreciates.
We have paid quarterly dividends to our shareholders for the past eight years. We have no obligation to pay dividends and we may change our dividend policy at any time without notice to our shareholders. Holders of our common stock are only entitled to receive such cash dividends as our board of directors, in its discretion, may declare out of funds legally available for such payments. Furthermore, consistent with our strategic plans, growth initiatives, capital availability and requirements, projected liquidity needs, financial condition, and other factors, we have made, and will continue to make, capital management decisions and policies that could adversely impact the amount of dividends paid to our shareholders.
We are a separate and distinct legal entity from our subsidiary, the Bank. We receive substantially all of our revenue from dividends from the Bank, which we use as the principal source of funds to pay our expenses. Various federal and/or state laws and regulations limit the amount of dividends that the Bank may pay us. Such limits are also tied to the earnings of our subsidiary. If the Bank does not receive regulatory approval or if the Bank’s earnings are not sufficient to make dividend payments to us while maintaining adequate capital levels, our ability to pay our expenses and our business, financial condition or results of operations could be materially and adversely impacted. Notably, in 2020, in direct response to potential adverse financial impacts caused by COVID-19, the Federal Reserve capped dividend payments and suspended share repurchases by several large banks (i.e., those with more than $50 billion in total assets). Though temporary (and not applicable to the Company or the Bank), these measures highlight the sensitivity of the bank regulators to the potential financial impacts of COVID-19.
Future equity issuances could result in dilution, which could cause our common stock price to decline.
We are generally not restricted from issuing additional shares of our common stock, up to the 40 million shares of voting common stock and 10 million shares of preferred stock authorized in our articles of incorporation (subject to Nasdaq shareholder approval rules), which in each case could be increased by a vote of a majority of our shares. We may issue additional shares of our common stock in the future pursuant to current or future equity compensation plans, upon conversions of preferred stock or debt, upon exercise of warrants or in connection with future acquisitions or financings. If we choose to raise capital by selling shares of our common stock for any reason, the issuance could have a dilutive effect on the holders of our common stock and could have a material negative effect on the market price of our common stock.
We have the ability to incur debt and pledge our assets, including our stock in the Bank, to secure that debt.
We have the ability to incur debt and pledge our assets to secure that debt. Absent special and unusual circumstances, a holder of indebtedness for borrowed money has rights that are superior to those of holders of common stock. For example, interest must be paid to the lender before dividends can be paid to the shareholders, and loans must be paid off before any assets can be distributed to shareholders if we were to liquidate. Furthermore, we would have to make principal and interest payments on our indebtedness, which could reduce our profitability or result in net losses on a consolidated basis even if the Bank were profitable.
There are substantial regulatory limitations on changes of control of bank holding companies.
Federal law restricts the amount of voting stock of a bank holding company or a bank that a person may acquire without the prior approval of banking regulators. Under the federal Change in Bank Control Act and the regulations thereunder, a person or group must give advance notice to the Federal Reserve before acquiring control of any bank holding company, such as the Company, and the FDIC before acquiring control of any national bank, such as the Bank. Upon receipt of such notice, the bank regulatory agencies may approve or disapprove the acquisition. The Change in Bank Control Act creates a rebuttable presumption of control if a person or group acquires a certain percentage or more of a bank holding company’s or bank’s voting stock, or if one or more other control factors are present. As a result, a person or entity generally must provide prior notice to the Federal Reserve before acquiring the power to vote 10% or more of
38
our outstanding common stock. Further, existing bank holding companies must obtain prior approval to obtain 5% or more of our outstanding common stock. The overall effect of such laws is to make it more difficult to acquire a bank holding company and a bank by tender offer or similar means than it might be to acquire control of another type of corporation. Consequently, shareholders of the Company may be less likely to benefit from the rapid increases in stock prices that may result from tender offers or similar efforts to acquire control of other companies. Investors should be aware of these requirements when acquiring shares of our stock.
We are an “emerging growth company,” and the reduced regulatory and reporting requirements applicable to emerging growth companies may make our common stock less attractive to investors.
We are an “emerging growth company,” as described in the JOBS Act. For as long as we continue to be an emerging growth company, we may take advantage of reduced regulatory and reporting requirements that are otherwise generally applicable to public companies. These include, without limitation, not being required to comply with the auditor attestation requirements of Section 404(b) of the Sarbanes-Oxley Act, reduced financial reporting requirements, reduced disclosure obligations regarding executive compensation, and exemptions from the requirements of holding non-binding advisory votes on executive compensation and golden parachute payments. In addition, even if we comply with the greater obligations of public companies that are not emerging growth companies, we may avail ourselves of the reduced requirements applicable to emerging growth companies from time to time in the future, so long as we are an emerging growth company. We will remain an emerging growth company for up to five years, though we will cease to be an emerging growth company earlier if we have more than $1 billion in annual gross revenues, have more than $700 million in market value of our common stock held by non-affiliates, or issue more than $1 billion of non-convertible debt in a three-year period. Investors and securities analysts may find it more difficult to evaluate our common stock because we will rely on one or more of these exemptions and, as a result, investor confidence or the market price of our common stock may be materially and adversely affected.
Item 1B. Unresolved Staff Comments
None.
The Company’s corporate headquarters and Metro City Bank’s main office is located at 5114 Buford Highway NE, Atlanta, GA 30340. Metro City Bank owns this property. We also currently operate 18 additional full service-branches, which are all leased, located in multi-ethnic communities in Alabama, Florida, Georgia, New York, New Jersey, Texas and Virginia. We believe that our banking offices are in good condition and are suitable and adequate to our needs.
We are subject to various legal actions that arise from time to time in the ordinary course of business. While the ultimate outcome of pending procedures cannot be predicted with certainty, at this time management does not expect that any such proceedings, either individually or in the aggregate, would have a material adverse effect on our consolidated financial position or results of operations. However, one or more unfavorable outcomes in any legal action against us could have a material adverse effect for the period in which they are resolved. In addition, regardless of their merits or their ultimate outcomes, such matters are costly, divert management’s attention and may materially adversely affect our reputation, even if resolved in our favor.
Item 4. Mine Safety Disclosures
Not applicable.
39
Item 5. Market for Registrant’s Common Equity, Related Shareholder Matters and Issuer Purchases of Equity Securities
Market Information and Holders of Record
Our common stock is listed on the Nasdaq Global Select Market under the symbol “MCBS”. Our common stock began trading on Nasdaq Global Select Market on October 3, 2019. Prior to that date, our common stock was traded on the OTCQX Market under the same symbol.
As of March 9, 2021, there were 25,674,573 shares of common stock outstanding held by approximately 184 shareholders of record of our common stock as reported by our transfer agent.
Dividends
It has been our policy to pay quarterly dividends to holders of our common stock. We have paid quarterly dividends to our shareholders in amounts up to 30% of our net income over the past eight years. We have no obligation to pay dividends and we may change our dividend policy at any time without notice to our shareholders. Any future determination to pay dividends to holders of our common stock will depend on our results of operations, financial condition, capital requirements, banking regulations, contractual restrictions and any other factors that our board of directors may deem relevant.
As a Georgia corporation, the Company is subject to certain restrictions on dividends under the Georgia Business Corporation Code. We are also subject to certain restrictions on the payment of cash dividends as a result of banking laws, regulations and policies. See “Item 1. Business - Regulation and Supervision - Regulation of the Company - Payment of Dividends.”
Equity Compensation Plan Information
Please see Item 12 of this Annual Report for information with respect to shares of common stock that are authorized for issuance under the Company’s equity compensation plans as of December 31, 2020.
40
Stock Performance Graph
The following graph compares the cumulative total return on our common stock with the cumulative total return of the Nasdaq Composite Index and the SNL Index for U.S. Banks ($1B to $5B) for the period beginning on October 3, 2019, the first day of trading of our common stock on the Nasdaq Global Select Market under the symbol "MCBS", through December 31, 2020. The following reflects index values as of close of trading, assumes $100.00 invested on October 3, 2019, in our common stock, the Nasdaq Composite Index and the SNL Index for U.S. Banks ($1B to $5B), and assumes the reinvestment of dividends, if any. The historical price of our common stock represented in this graph represents past performance and is not necessarily indicative of future performance.
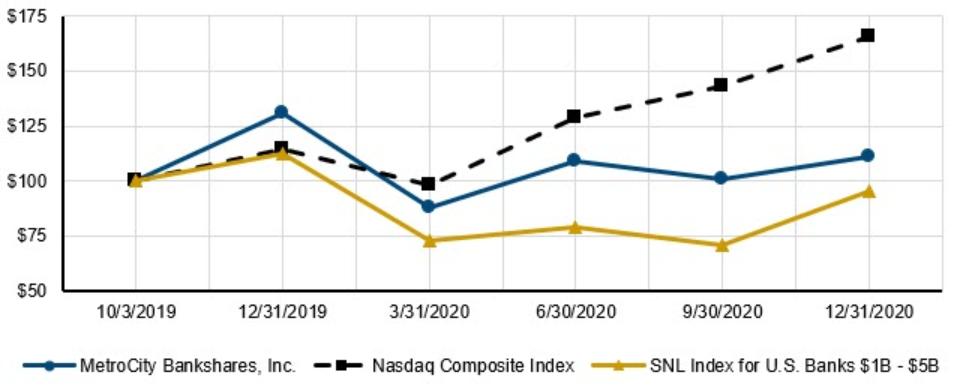
Index |
| October 3, 2019 |
| December 31, 2019 |
| March 31, 2020 |
| June 30, 2020 |
| September 30, 2020 |
| December 31, 2020 | ||||||
MetroCity Bankshares, Inc. | | $ | 100.00 | | $ | 130.78 | | $ | 88.25 |
| $ | 108.84 | | $ | 100.68 | | $ | 110.93 |
Nasdaq Composite Index | |
| 100.00 | |
| 114.28 | |
| 98.39 |
|
| 128.83 | |
| 143.31 | |
| 165.77 |
SNL Index for U.S. Banks $1B - $5B | |
| 100.00 | |
| 112.58 | |
| 73.16 |
|
| 78.76 | |
| 71.23 | |
| 95.67 |
Issuer Purchases of Equity Securities
The Company did not repurchase any shares of common stock in the fourth quarter of 2020.
41
Item 6. Selected Financial Data
The following table sets forth selected historical consolidated financial data of the Company as of and for each of the years ended December 31, 2020, 2019, 2018, 2017 and 2016, and is derived from our audited consolidated financial statements. This information should be read in conjunction with “Item 7 - Management’s Discussion and Analysis of Financial Condition and Results of Operations” and “Item 8 - Financial Statements and Supplementary Data” of this report. Our historical results for any prior period are not necessarily indicative of results to be expected in any future period.
| | Year Ended December 31, | | |||||||||||||
(Dollars in thousands, except per share data) |
| 2020 |
| 2019 |
| 2018 |
| 2017 |
| 2016 | | |||||
Selected income statement data: | | |
|
| |
|
| |
|
| |
|
| |
|
|
Interest income | | $ | 77,609 | | $ | 83,213 | | $ | 72,879 | | $ | 60,514 | | $ | 43,566 | |
Interest expense | |
| 11,489 | |
| 22,238 | |
| 14,675 | |
| 8,619 | |
| 5,238 | |
Net interest income | |
| 66,120 | |
| 60,975 | |
| 58,204 | |
| 51,895 | |
| 38,328 | |
Provision for loan losses | |
| 3,467 | |
| — | |
| 1,237 | |
| 3,058 | |
| — | |
Noninterest income | |
| 27,211 | |
| 39,896 | |
| 37,646 | |
| 32,405 | |
| 20,247 | |
Noninterest expense | |
| 41,100 | |
| 40,003 | |
| 38,612 | |
| 31,192 | |
| 26,159 | |
Income tax expense | |
| 12,370 | |
| 16,150 | |
| 14,667 | |
| 18,153 | |
| 12,200 | |
Net income | |
| 36,394 | |
| 44,718 | |
| 41,334 | |
| 31,897 | |
| 20,216 | |
Per share data: | |
| | |
|
| |
|
| |
|
| |
|
| |
Basic income per share | | $ | 1.42 | | $ | 1.82 | | $ | 1.71 | | $ | 1.34 | | $ | 0.87 | |
Diluted income per share | | $ | 1.41 | | $ | 1.81 | | $ | 1.69 | | $ | 1.32 | | $ | 0.85 | |
Dividends per share | | $ | 0.40 | | $ | 0.42 | | $ | 0.38 | | $ | 0.23 | | $ | 0.16 | |
Book value per share (at period end) | | $ | 9.54 | | $ | 8.49 | | $ | 6.95 | | $ | 5.61 | | $ | 4.54 | |
Shares of common stock outstanding | |
| 25,674,573 | |
| 25,529,891 | |
| 24,258,062 | |
| 24,074,882 | |
| 23,642,510 | |
Weighted average diluted shares | |
| 25,798,549 | |
| 24,729,535 | |
| 24,475,698 | |
| 24,139,006 | |
| 23,704,334 | |
Performance ratios: | |
| | |
|
| |
|
| |
|
| |
|
| |
Return on average assets | |
| 2.17 | % |
| 2.87 | % |
| 3.01 | % |
| 2.77 | % |
| 2.42 | % |
Return on average equity | |
| 16.02 | |
| 24.23 | |
| 27.95 | |
| 27.24 | |
| 21.19 | |
Dividend payout ratio | |
| 28.32 | |
| 23.26 | |
| 22.48 | |
| 17.05 | |
| 18.65 | |
Yield on total loans | |
| 5.47 | |
| 6.14 | |
| 5.92 | |
| 5.91 | |
| 5.94 | |
Yield on average earning assets | |
| 4.91 | |
| 5.66 | |
| 5.60 | |
| 5.55 | |
| 5.54 | |
Cost of average interest bearing liabilities | |
| 1.15 | |
| 2.15 | |
| 1.60 | |
| 1.11 | |
| 0.97 | |
Cost of deposits | |
| 1.20 | |
| 2.19 | |
| 1.60 | |
| 1.09 | |
| 0.96 | |
Net interest margin | |
| 4.18 | |
| 4.15 | |
| 4.48 | |
| 4.76 | |
| 4.87 | |
Efficiency ratio(1) | |
| 44.04 | |
| 39.66 | |
| 40.26 | |
| 37.00 | |
| 44.66 | |
Asset quality data (at period end): | |
| | |
|
| |
|
| |
|
| |
|
| |
Net charge-offs/(recoveries) to average loans held for investment | |
| 0.01 | % |
| (0.02) | % |
| 0.14 | % |
| 0.17 | % |
| 0.01 | % |
Nonperforming assets to gross loans and OREO | |
| 1.03 | |
| 1.30 | |
| 0.78 | |
| 1.00 | |
| 0.49 | |
ALL to nonperforming loans | |
| 77.40 | |
| 46.54 | |
| 74.12 | |
| 69.06 | |
| 153.94 | |
ALL to loans held for investment | |
| 0.62 | |
| 0.59 | |
| 0.58 | |
| 0.65 | |
| 0.68 | |
Balance sheet and capital ratios: | |
| | |
|
| |
|
| |
|
| |
|
| |
Gross loans held for investment to deposits | |
| 110.48 | % |
| 88.97 | % |
| 92.08 | % |
| 104.77 | % |
| 92.36 | % |
Noninterest bearing deposits to deposits | |
| 31.28 | |
| 22.34 | |
| 24.05 | |
| 25.52 | |
| 24.74 | |
Common equity to assets | |
| 12.90 | |
| 13.28 | |
| 11.77 | |
| 10.48 | |
| 9.75 | |
Leverage ratio | |
| 13.44 | |
| 12.70 | |
| 11.14 | |
| 10.76 | |
| 10.19 | |
Common equity tier 1 ratio | |
| 20.00 | |
| 21.31 | |
| 17.44 | |
| 16.24 | |
| 14.16 | |
Tier 1 risk-based capital ratio | |
| 20.00 | |
| 21.31 | |
| 17.44 | |
| 16.24 | |
| 14.16 | |
Total risk-based capital ratio | |
| 20.86 | |
| 22.01 | |
| 18.16 | |
| 17.08 | |
| 14.89 | |
Mortgage and SBA loan data: | |
| | |
|
| |
|
| |
|
| |
|
| |
Mortgage loans serviced for others | | $ | 961,670 | | $ | 1,168,601 | | $ | 804,188 | | $ | 341,786 | | $ | — | |
Mortgage loan production | |
| 484,214 | |
| 644,465 | |
| 716,140 | |
| 581,745 | |
| 390,159 | |
Mortgage loan sales | |
| 92,737 | |
| 520,067 | |
| 536,011 | |
| 362,009 | |
| — | |
SBA loans serviced for others | |
| 507,442 | |
| 441,593 | |
| 431,201 | |
| 411,600 | |
| 362,643 | |
SBA loan production | |
| 245,719 | |
| 155,035 | |
| 121,009 | |
| 121,559 | |
| 167,092 | |
SBA loan sales | |
| 128,633 | |
| 118,405 | |
| 93,297 | |
| 85,932 | |
| 110,555 | |
42
Item 7. Management’s Discussion and Analysis of Financial Condition and Results of Operations
The following discussion and analysis of our financial condition and results of operations should be read in conjunction with the “Selected Financial Data” and our consolidated financial statements and related notes included elsewhere in this Annual Report on Form 10-K. This discussion and analysis contains forward-looking statements that involve risk, uncertainties and, assumptions. Certain risks, uncertainties and other factors, including but not limited to those set forth under “Cautionary Note Regarding Forward-Looking Statements,” “Risk Factors,” and elsewhere in this Annual Report on Form 10-K, may cause actual results to differ materially from those projected in the forward looking statements. We assume no obligation to update any of these forward-looking statements.
COVID-19 Pandemic
During March 2020, the World Health Organization declared the novel strain of coronavirus (“COVID-19”) a global pandemic in response to the rapidly growing outbreak of the virus. COVID-19 has significantly impacted local, national and global economies due to stay-at-home orders and social distancing guidelines, and has caused economic and social disruption on an unprecedented scale. While some industries have been impacted more severely than others, all businesses have been impacted to some degree. This disruption has resulted in the shuttering of businesses across the country, significant job loss, and aggressive measures by the federal government.
Congress, the President, and the FRB have taken several actions designed to cushion the economic fallout. Most notably, the CARES Act was signed into law on March 27, 2020 as a $2 trillion legislative package. The goal of the CARES Act was to prevent a severe economic downturn through various measures, including direct financial aid to American families and economic stimulus to significantly impacted industry sectors. The package also included extensive emergency funding for hospitals and providers. In addition to the general impact of COVID-19, certain provisions of the CARES Act as well as other recent legislative and regulatory relief efforts have had and continue to have a material impact on our operations.
In response to the COVID-19 pandemic, the Company has prioritized the health and safety of its employees and customers, and continues to take protective measures during the ongoing COVID-19 pandemic, such as implementing remote work arrangements to the full extent possible and by adjusting banking center hours and operational measures to promote social distancing, and it will continue to do so throughout the duration of the pandemic. At the same time, the Company is closely monitoring the effects of the COVID-19 pandemic on our loan and deposit customers, and is assessing the risks in our loan portfolio and working with our customers to reduce the pandemic’s impact on them while minimizing losses for the Company. Meanwhile, the Company remains focused on improving shareholder value, managing credit exposure, challenging expenses, enhancing the customer experience and supporting the communities it serves.
We have implemented loan programs to allow customers who are experiencing hardships from the COVID-19 pandemic to defer loan principal and interest payments for up to nine months. The Small Business Administration (the “SBA”) made debt relief payments for the principal, interest and fee payments of all our SBA loan customers for six months through the end of September 2020. As of December 31, 2020, we had 14 non-SBA commercial customers with outstanding loan balances totaling $42.0 million who were approved for a third round of payment deferrals. This is a decline from the second round of payment deferrals that were granted to 24 non-SBA commercial customers with outstanding balances totaling $82.5 million as of September 30, 2020. During our first round of payment deferrals, we granted payment deferrals to 89 non-SBA loans with outstanding balances of $157.5 million as of June 30, 2020. Included in the third round of non-SBA payment deferrals were eight loans totaling $24.2 million with a weighted average loan-to-value (“LTV”) of 44.2% in the hotel industry and no loans in the restaurant industry, which are two industries heavily impacted by the COVID-19 pandemic. As of December 31, 2020 and following the expiration of the SBA debt relief payments mentioned above, we had approved three month payment deferrals for 18 SBA loans with outstanding gross loan balances totaling $25.5 million ($6.4 million unguaranteed book balance). Of these SBA payment deferrals, four loans totaling $6.0 million ($1.5 million unguaranteed book balance) were in the restaurant industry and no loans were in the hotel industry. As of December 31, 2020, the Company had 51 loans totaling $141.2 million in the hotel industry and 116 loans totaling $36.1 million in the restaurant industry, which make up 8.6% and 2.2% of our total loan portfolio, respectively.
43
As of December 31, 2020, our residential real estate loan portfolio made up 59.6% of our total loan portfolio and had a weighted average amortized LTV of approximately 55.6%. As of December 31, 2020, 1.0% of our residential mortgages remain on hardship payment deferral covering principal and interest payments for three to six months. This is a significant decrease from the first round of payment deferrals granted during the second quarter of 2020, which made up 19.2% of our residential mortgage balances as of June 30, 2020, and a slight decrease from the second round of payment deferrals granted during the third quarter of 2020, which made up 1.7% of our residential mortgage balances as of September 30, 2020.
In addition, as a preferred SBA lender, we are participating in the Paycheck Protection Program created under the CARES Act and implemented by the SBA to help provide loans to our business customers in need. As of December 31, 2020, the Company approved and funded over 1,800 PPP loans totaling $96.9 million. These PPP loans were funded with our current cash balances and all PPP loans are fully guaranteed by the SBA. As of March 9, 2021, the SBA had granted forgiveness for PPP loans totaling $11.5 million.
The Economic Aid Act, signed into law on December 27, 2020, authorized an additional $284.5 billion in new PPP funding and extends the authority of lenders to make PPP loans through March 31, 2021. We are participating in this new round of PPP loan funding by offering first and second draw loans. As of March 9, 2021, the Company had approved and funded 635 PPP loans totaling $41.7 million under this new round of PPP loan funding.
Despite improvements in certain economic indicators, significant constraints to commerce remain in place, and significant uncertainty remains over the timing of an effective and widely available coronavirus vaccine and the timing and scope of additional government stimulus packages. The duration and extent of the downturn and speed of the related recovery on our business, customers, and the economy as a whole remains uncertain.
Overview
We are MetroCity Bankshares, Inc., a bank holding company headquartered in the Atlanta metropolitan area. We operate through our wholly-owned banking subsidiary, Metro City Bank, a Georgia state-chartered commercial bank that was founded in 2006. We currently operate 19 full-service branch locations in multi-ethnic communities in Alabama, Florida, Georgia, New York, New Jersey, Texas and Virginia. We are focused on delivering full-service banking services in markets, predominantly Asian-American communities in growing metropolitan markets in the Eastern U.S. and Texas.
Prior to December 2014, we operated without a holding company, and in December 2014, the Bank formed MetroCity Bankshares, Inc. as its holding company. On December 31, 2014, MetroCity Bankshares, Inc. acquired all of the outstanding common stock of Metro City Bank as a part of the holding company formation transaction.
We are a bank holding company and we conduct all of our material business operations through the Bank. As a result, the discussion and analysis relates to activities primarily conducted at the Bank level.
Critical Accounting Policies and Estimates
Our accounting and reporting policies conform to accounting principles generally accepted in the United States of America (“GAAP”) and conform to general practices within the industry in which we operate. To prepare financial statements in conformity with GAAP, management makes estimates, assumptions and judgments based on available information. These estimates, assumptions and judgments affect the amounts reported in the financial statements and accompanying notes. These estimates, assumptions, and judgments are based on information available as of the date of the financial statements and, as this information changes, actual results could differ from the estimates, assumptions and judgments reflected in the financial statement. In particular, management has identified several accounting policies that, due to the estimates, assumptions and judgments inherent in those policies, are critical in understanding our financial statements.
The following is a discussion of the critical accounting policies and significant estimates that require us to make complex and subjective judgments. Additional information about these policies can be found in Note 1 of our consolidated financial statements as of December 31, 2020, included elsewhere in this Annual Report on Form 10-K.
44
Allowance for Loan Losses
The ALL is a valuation allowance for probable incurred credit losses. Loan losses are charged against the allowance when management believes the uncollectibility of a loan balance is confirmed. Subsequent recoveries, if any, are credited to the allowance. Management estimates the allowance balance required using past loan loss experience, the nature and volume of the portfolio, information about specific borrower situations and estimated collateral values, economic conditions, and other factors. Allocations of the allowance may be made for specific loans, but the entire allowance is available for any loan that, in management’s judgment, should be charged off.
The ALL is maintained at a level that management believes is appropriate to provide for known and inherent incurred loan losses as of the date of the consolidated balance sheet and we have established methodologies for the determination of its adequacy. The methodologies are set forth in a formal policy and take into consideration the need for an overall general valuation allowance as well as specific allowances that are determined on an individual loan basis.
This evaluation is inherently subjective as it requires material estimates that are susceptible to significant change including the amounts and timing of future cash flows expected to be received on impaired loans.
Servicing Assets
Servicing assets are recognized separately when loans are sold and the rights to service loans are retained. When loans are sold, servicing assets are recorded at fair value in accordance with ASC Topic 860, Transfers and Servicing (“ASC 860”). Fair value is based on market prices for comparable servicing contracts, when available, or alternatively, is based on a valuation model that calculates the present value of estimated future net servicing income. The fair value of servicing rights is highly sensitive to changes in underlying assumptions. Changes in the prepayment speed and discount rate assumptions have the most significant impact on the fair value of servicing assets.
Servicing fee income, which is reported on the income statement as mortgage servicing income and SBA servicing income, is recorded for fees earned for servicing loans. The fees are based on a contractual percentage of the outstanding principal and are recorded as income when earned. The amortization of servicing assets is netted against loan servicing fee income. Late fees and ancillary fees related to loan servicing are not material.
Stock-Based Compensation
We periodically grant stock options to purchase our common stock and issue restricted stock to our employees and directors. The benefits provided under all of these plans are subject to ASC Topic 718, Compensation – Stock Compensation (“ASC 718”). Our results of operations for the years ended December 31, 2020, 2019 and 2018 were impacted by the recognition of non-cash expense related to the fair value of our share based compensation awards.
The determination of fair value of stock-based payment awards on the date of grant using the Black Scholes model is affected by our stock price, as well as the input of other subjective assumptions. These assumptions include, but are not limited to, the expected term of stock options and our stock price volatility. Our stock options have characteristics significantly different from those of traded options, and changes in the assumptions can materially affect the fair value estimates.
Current accounting guidance requires forfeitures to be estimated at the time of grant and revised, if necessary, in subsequent periods if actual forfeitures differ from those estimates. If actual forfeitures vary from our estimates, we will recognize the difference in compensation expense in the period the actual forfeitures occur.
Fair Value of Financial Instruments
ASC Topic 820, Fair Value Measurement (“ASC 820”), defines fair value as the price that would be received to sell a financial asset, or paid to transfer a financial liability in an orderly transaction between market participants at the measurement date. The degree of management judgment involved in determining the fair value of assets and liabilities is dependent upon the availability of quoted market prices or observable market parameters. For financial instruments that
45
trade actively and have quoted market prices or observable market parameters, there is minimal subjectivity involved in measuring fair value. When observable market prices and parameters are not available, management judgment is necessary to estimate fair value. In addition, changes in market conditions may reduce the availability of quoted prices or observable date. See Note 15 of our consolidated financial statements as of December 31, 2020, included elsewhere in this Annual Report on Form 10-K, for a complete discussion of fair value of financial assets and liabilities and their related measurement practices.
Income Taxes
We use the asset and liability method of accounting for income taxes. Under this method, deferred tax assets and liabilities are recognized for the future tax consequences attributable to differences between the financial statement carrying amounts of existing assets and liabilities and their respective tax bases. Deferred tax assets and liabilities are measured using enacted tax rates expected to apply to taxable income in the years in which those temporary differences are expected to be recovered or settled. If current available information raises doubt as to the realization of the deferred tax assets, a valuation allowance may be established. We consider the determination of this valuation allowance to be a critical accounting policy because of the need to exercise significant judgment in evaluating the amount and timing of recognition of deferred tax liabilities and assets, including projections of future taxable income. These judgments and estimates are reviewed on a continual basis as regulatory and business factors change. See Note 10 of our consolidated financial statements as of December 31, 2020, included elsewhere in this Annual Report on Form 10-K, for additional information.
The JOBS Act contains provisions that, among other things, reduce certain reporting and other regulatory requirements for qualifying public companies. As an “emerging growth company” we have elected under the JOBS Act to retain the ability to delay the adoption of new or revised accounting pronouncements applicable to public companies until such pronouncements are made applicable to private companies. However, at December 31, 2020, 2019 and 2018, we have adopted all new accounting standards that could affect the comparability of our financial statements to those of other public entities. In the event we choose in the future to delay adoption of future accounting pronouncements applicable to public companies, our consolidated financial statements as of a particular date and for a particular period in the future may not be comparable to the financial statements as of such date and for such period of a public company situated similarly to us that is neither an emerging growth company nor an emerging growth company that has opted out of the extended transition period. Such financial statements of the other company may be prepared in conformity with new or revised accounting standards then applicable to public companies, but not to private companies, while, if we are then in the extended transition period, our consolidated financial standards would not be prepared in conformity with such new or revised accounting standards. Additionally, we are in the process of evaluating the benefits of relying on the other reduced reporting requirements provided by the JOBS Act.
Subject to certain conditions set forth in the JOBS Act, if, as an “emerging growth company,” we choose to rely on such exemptions we may not be required to, among other things, (i) provide an auditor’s attestation report of our internal control over financial reporting pursuant to the Sarbanes-Oxley Act, (ii) comply with any requirement that may be adopted by the PCAOB regarding mandatory audit firm rotation or a supplement to the auditor’s report providing additional information about the audit and the financial statements (auditor discussion and analysis), (iii) provide more extensive disclosures regarding our executive compensation arrangements, including a “compensation discussion and analysis” section and all of the disclosures required under the Dodd-Frank Act, (iv) hold nonbinding advisory votes on executive compensation or golden parachute arrangements. These exemptions will apply for a period of five years from our initial public offering date on October 7, 2019 or until we are no longer an “emerging growth company,” whichever is earlier.
Stock Split
On August 30, 2019, we effected a two-for-one split of our common stock in the form of a stock dividend, whereby each holder of our common stock received one additional share of common stock for each share owned as of the record date of August 15, 2019. The effect of the stock dividend on outstanding shares and per share figures has been retroactively applied to all periods presented in this Annual Report.
46
Public Company Costs
We completed our initial public offering in October 2019. There are additional costs associated with operating as a public company, hiring additional personnel, enhancing technology and expanding our capabilities. We expect that these costs will include legal, regulatory, accounting, investor relations and other expenses that we did not incur as a private company. Sarbanes-Oxley, as well as rules adopted by the U.S. Securities and Exchange Commission, or SEC, the FDIC and national securities exchanges also requires public companies to implement specified corporate governance practices. In addition, due to regulatory changes in the banking industry and the implementation of new laws, rules and regulations, we are now subject to higher regulatory compliance costs. These additional rules and regulations also increase our legal, regulatory, accounting and financial compliance costs and make some activities more time-consuming.
Results of Operations
Net Income
Year ended December 31, 2020 compared to year ended December 31, 2019
We recorded net income of $36.4 million for the year ended December 31, 2020 compared to $44.7 million for the same period in 2019, a decrease of $8.3 million, or 18.6%. The decrease was due to a $12.7 million decrease in noninterest income, a $1.1 million increase in noninterest expense, and a $3.5 million increase in provision for loan losses, partially offset by a $5.1 million increase in net interest income.
Basic and diluted earnings per common share for the year ended December 31, 2020 was $1.42 and $1.41, respectively, compared to $1.82 and $1.81 for the basic and diluted earnings per common share for the same period in 2019.
Year ended December 31, 2019 compared to year ended December 31, 2018
We recorded net income of $44.7 million for the year ended December 31, 2019 compared to $41.3 million for the same period in 2018, an increase of $3.4 million, or 8.2%. The increase was due to a $2.8 million increase in net interest income, a $2.3 million increase in noninterest income, and a $1.2 million decrease in provision for loan losses, partially offset by a $1.4 million increase in noninterest expense.
Basic and diluted earnings per common share for the year ended December 31, 2019 was $1.82 and $1.81, respectively, compared to $1.71 and $1.69 for the basic and diluted earnings per common share for the same period in 2018.
Net Interest Income
The management of interest income and expense is fundamental to our financial performance. Net interest income, the difference between interest income and interest expense, is the largest component of the Company’s total revenue. Management closely monitors both total net interest income and the net interest margin (net interest income divided by average earning assets). We seek to maximize net interest income without exposing the Company to an excessive level of interest rate risk through our asset and liability policies. Interest rate risk is managed by monitoring the pricing, maturity and repricing options of all classes of interest-bearing assets and liabilities. Our net interest margin is also adversely impacted by the reversal of interest on nonaccrual loans and the reinvestment of loan payoffs into lower yielding investment securities and other short-term investments.
Year ended December 31, 2020 compared to year ended December 31, 2019
Net interest income for the year ended December 31, 2020 was $66.1 million compared to $61.0 million for the year ended December 31, 2019, an increase of $5.1 million, or 8.4%. Interest income totaled $77.6 million for the year ended December 31, 2020, a decrease of $5.6 million, or 6.7%, from the year ended December 31, 2019, primarily due to a 67 basis points decrease in the yield on average loans and a 129 basis points decrease in the yield on total investments. We
47
also recognized PPP loan fee income of $1.7 million during 2020. Average earning assets increased by $111.9 million, primarily due to an increase of $94.2 million in average loans and $14.9 million in securities purchased under agreements to resell. The increase in average loans included increases of $20.2 million in average commercial real estate loans, $69.3 million in average commercial and industrial loans, which includes $61.0 million in average PPP loans, and $7.9 million in average residential real estate loans.
Interest expense for the year ended December 31, 2020 decreased $10.7 million to $11.5 million compared to interest expense of $22.2 million for the year ended December 31, 2019. This decrease is primarily attributable to a 99 basis points decrease in deposit costs, which includes a 135 basis points decrease in the average yield on money market deposits and an 82 basis points decrease in the average yield on time deposits. Average borrowings outstanding for the year ended December 31, 2020 increased by $51.1 million with a decrease in rate of 21 basis points compared to the year ended December 31, 2019.
The net interest margin for the year ended December 31, 2020 was 4.18% compared to 4.15% for the year ended December 31, 2019, an increase of three basis points. The cost of interest-bearing liabilities decreased by 100 basis points to 1.15% from 2.15%, while the yield on interest-earning assets decreased by 75 basis points to 4.91% from 5.66% for the previous year. Average earning assets increased by $111.9 million, primarily due to an increase of $94.2 million in average loans and an increase of $17.7 million in average total investments. Average interest-bearing liabilities decreased by $36.8 million as average interest-bearing deposits decreased by $87.9 million and average borrowings increased by $51.1 million. The inclusion of PPP loan average balances, interest and fees had an eight basis points impact on the yield on average loans and only a one basis point impact on the net interest margin for 2020.
Year ended December 31, 2019 compared to year ended December 31, 2018
Net interest income for the year ended December 31, 2019 was $61.0 million compared to $58.2 million for the year ended December 31, 2018, an increase of $2.8 million, or 4.8%. Interest income totaled $83.2 million for the year ended December 31, 2019, an increase of $10.3 million, or 14.2%, from the year ended December 31, 2018, partially due to a 22 basis points increase in the yield on average loans, including loans held for sale. Average earning assets increased by $169.3 million, primarily due to an increase of $106.6 million in average loans and $65.4 million in federal funds sold and interest-earning cash accounts. The increase in average loans included increases of $63.5 million and $52.5 million in average commercial real estate loans and residential real estate loans.
Interest expense for the year ended December 31, 2019 increased $7.6 million to $22.2 million compared to interest expense of $14.7 million for the year ended December 31, 2018. This increase is primarily attributable to a 59 basis points increase in deposit costs, which includes a 96 basis increase in the average yield on money market deposits and a 58 basis points increase in the average yield on time deposits. Average borrowings outstanding for the year ended December 31, 2019 decreased by $13.3 million with a decrease in rate of 57 basis points compared to the year ended December 31, 2018. During 2019, we began offering CD and money market account specials with higher rates to attract deposits which is noted in the higher rate paid on our CDs and money market accounts during the year.
The net interest margin for the year ended December 31, 2019 was 4.15% compared to 4.48% for the year ended December 31, 2018, a decrease of 33 basis points. The cost of interest-bearing liabilities increased by 55 basis points to 2.15% from 1.60%, while the yield on interest-earning assets increased by 6 basis points to 5.66% from 5.60% for the previous year. Average earning assets increased by $169.3 million, primarily due to an increase of $106.6 million in average loans and an increase of $65.4 million in lower yielding federal funds sold and interest-earning cash accounts. Average interest-bearing liabilities increased by $113.5 million as average interest-bearing deposits increased by $126.8 million and average borrowings decreased by $13.3 million.
48
Average Balances, Interest and Yields
The following tables present, for the years ended December 31, 2020, 2019 and 2018, information about: (i) weighted average balances, the total dollar amount of interest income from interest-earning assets and the resultant average yields; (ii) average balances, the total dollar amount of interest expense on interest-bearing liabilities and the resultant average rates; (iii) net interest income; (iv) the interest rate spread; and (v) the net interest margin.
| | Year Ended December 31, |
| ||||||||||||||||||||||
| | 2020 | | 2019 |
| 2018 |
| ||||||||||||||||||
| | Average | | Interest and | | Yield / | | Average | | Interest and | | Yield / |
| Average | | Interest and | | Yield / |
| ||||||
(Dollars in thousands) |
| Balance |
| Fees |
| Rate |
| Balance |
| Fees |
| Rate |
| Balance |
| Fees |
| Rate |
| ||||||
Earning Assets: |
| |
|
| |
|
|
|
| |
|
| |
|
|
| | |
|
| |
|
|
| |
Federal funds sold and other investments(1) | | $ | 147,431 | | $ | 1,056 |
| 0.72 | % | $ | 145,096 | | $ | 3,010 |
| 2.07 | % | $ | 79,699 | | $ | 1,758 |
| 2.21 | % |
Securities purchased under agreements to resell | |
| 29,932 | |
| 271 |
| 0.91 | |
| 15,000 | |
| 421 |
| 2.81 | |
| 15,000 | |
| 372 |
| 2.48 | |
Securities available for sale | |
| 17,806 | |
| 410 |
| 2.30 | |
| 17,413 | |
| 444 |
| 2.55 | |
| 20,174 | |
| 503 |
| 2.49 | |
Total investments | |
| 195,169 | |
| 1,737 |
| 0.89 | |
| 177,509 | |
| 3,875 |
| 2.18 | |
| 114,873 | |
| 2,633 |
| 2.29 | |
Construction and development | |
| 31,658 | |
| 1,685 |
| 5.32 | |
| 33,567 | |
| 2,193 |
| 6.53 | |
| 46,050 | |
| 2,763 |
| 6.00 | |
Commercial real estate | |
| 478,481 | |
| 27,316 |
| 5.71 | |
| 458,259 | |
| 31,927 |
| 6.97 | |
| 394,770 | |
| 25,521 |
| 6.46 | |
Commercial and industrial | |
| 112,313 | |
| 5,301 |
| 4.72 | |
| 43,003 | |
| 3,049 |
| 7.09 | |
| 36,208 | |
| 2,507 |
| 6.92 | |
Residential real estate | |
| 763,136 | |
| 41,391 |
| 5.42 | |
| 755,244 | |
| 41,962 |
| 5.56 | |
| 702,753 | |
| 39,058 |
| 5.56 | |
Consumer and Other | |
| 989 | |
| 179 |
| 18.10 | |
| 2,310 | |
| 207 |
| 8.96 | |
| 5,961 | |
| 397 |
| 6.66 | |
Gross loans(2) | |
| 1,386,577 | |
| 75,872 |
| 5.47 | |
| 1,292,383 | |
| 79,338 |
| 6.14 | |
| 1,185,742 | |
| 70,246 |
| 5.92 | |
Total earning assets | |
| 1,581,746 | |
| 77,609 |
| 4.91 | |
| 1,469,892 | |
| 83,213 |
| 5.66 | |
| 1,300,615 | |
| 72,879 |
| 5.60 | |
Noninterest-earning assets | |
| 98,504 | |
|
|
|
| |
| 86,106 | |
|
|
|
| |
| 73,585 | |
|
|
|
| |
Total assets | |
| 1,680,250 | |
|
|
|
| |
| 1,555,998 | |
|
|
|
| |
| 1,374,200 | |
|
|
|
| |
Interest-bearing liabilities: | |
|
| |
|
|
|
| |
|
| |
|
|
|
| |
|
| |
|
|
|
| |
NOW and savings deposits | |
| 68,610 | |
| 166 |
| 0.24 | |
| 51,818 | |
| 172 |
| 0.33 | |
| 69,741 | |
| 272 |
| 0.39 | |
Money market deposits | |
| 248,633 | |
| 1,731 |
| 0.70 | |
| 133,363 | |
| 2,730 |
| 2.05 | |
| 50,690 | |
| 553 |
| 1.09 | |
Time deposits | |
| 596,325 | |
| 9,021 |
| 1.51 | |
| 816,298 | |
| 19,049 |
| 2.33 | |
| 754,256 | |
| 13,186 |
| 1.75 | |
Total interest-bearing deposits | |
| 913,568 | |
| 10,918 |
| 1.20 | |
| 1,001,479 | |
| 21,951 |
| 2.19 | |
| 874,687 | |
| 14,011 |
| 1.60 | |
Borrowings | |
| 82,955 | |
| 571 |
| 0.69 | |
| 31,884 | |
| 287 |
| 0.90 | |
| 45,223 | |
| 664 |
| 1.47 | |
Total interest-bearing liabilities | |
| 996,523 | |
| 11,489 |
| 1.15 | |
| 1,033,363 | |
| 22,238 |
| 2.15 | |
| 919,910 | |
| 14,675 |
| 1.60 | |
Noninterest-bearing liabilities: | |
|
| |
|
|
|
| |
|
| |
|
|
|
| |
|
| |
|
|
|
| |
Noninterest-bearing deposits | |
| 394,338 | |
|
|
|
| |
| 297,174 | |
|
|
|
| |
| 284,702 | |
|
|
|
| |
Other noninterest-bearing liabilities | |
| 62,153 | |
|
|
|
| |
| 40,924 | |
|
|
|
| |
| 21,683 | |
|
|
|
| |
Total noninterest-bearing liabilities | |
| 456,491 | |
|
|
|
| |
| 338,098 | |
|
|
|
| |
| 306,385 | |
|
|
|
| |
Shareholders' equity | |
| 227,236 | |
|
|
|
| |
| 184,537 | |
|
|
|
| |
| 147,905 | |
|
|
|
| |
Total liabilities and shareholders' equity | | $ | 1,680,250 | |
|
|
|
| | $ | 1,555,998 | |
|
|
|
| | $ | 1,374,200 | |
|
|
|
| |
Net interest income | |
|
| | $ | 66,120 |
|
| |
|
| | $ | 60,975 |
|
| |
|
| | $ | 58,204 |
|
| |
Net interest spread | |
|
| |
|
|
| 3.76 | |
|
| |
|
|
| 3.51 | |
|
| |
|
|
| 4.00 | |
Net interest margin | |
|
| |
|
|
| 4.18 | |
|
| |
|
|
| 4.15 | |
|
| |
|
|
| 4.48 | |
| (1) | Includes income and average balances for term federal funds, interest-earning cash accounts, and other miscellaneous earning assets. |
| (2) | Average loan balances include nonaccrual loans and loans held for sale. |
49
Rate/Volume Analysis
Increases and decreases in interest income and interest expense result from changes in average balances (volume) of interest-earning assets and interest-bearing liabilities, as well as changes in average interest rates. The following table sets forth the effects of changing rates and volumes on our net interest income during the period shown. Information is provided with respect to (i) effects on interest income attributable to changes in volume (change in volume multiplied by prior rate) and (ii) effects on interest income attributable to changes in rate (changes in rate multiplied by prior volume). Change applicable to both volumes and rate have been allocated to volume.
| | Year Ended December 31, | ||||||||||||||||
| | 2020 Compared to 2019 | | 2019 Compared to 2018 | ||||||||||||||
| | Increase (Decrease) Due to Change in: | | Increase (Decrease) Due to Change in: | ||||||||||||||
(Dollars in thousands) |
| Volume |
| Yield/Rate |
| Total Change |
| Volume |
| Yield/Rate |
| Total Change | ||||||
Earning assets: |
| |
|
| |
|
| |
|
| |
|
| |
|
| |
|
Federal funds sold and other investments(1) | | $ | 161 | | $ | (2,115) |
| $ | (1,954) | | $ | 1,200 | | $ | 52 |
| $ | 1,252 |
Securities purchased under agreements to resell | |
| 252 | |
| (402) |
|
| (150) | |
| — | |
| 49 |
|
| 49 |
Securities available for sale | |
| 17 | |
| (51) |
|
| (34) | |
| (70) | |
| 11 |
|
| (59) |
Total investments | |
| 430 | |
| (2,568) |
|
| (2,138) | |
| 1,130 | |
| 112 |
|
| 1,242 |
Construction and development | |
| (71) | |
| (437) |
|
| (508) | |
| (773) | |
| 98 |
|
| (675) |
Commercial real estate | |
| 970 | |
| (5,581) |
|
| (4,611) | |
| 3,912 | |
| 1,431 |
|
| 5,343 |
Commercial and industrial | |
| 3,602 | |
| (1,350) |
|
| 2,252 | |
| 479 | |
| 63 |
|
| 542 |
Residential real estate | |
| 340 | |
| (911) |
|
| (571) | |
| 3,211 | |
| 861 |
|
| 4,072 |
Consumer and Other | |
| (72) | |
| 44 |
|
| (28) | |
| (150) | |
| (40) |
|
| (190) |
Gross loans(2) | |
| 4,769 | |
| (8,235) |
|
| (3,466) | |
| 6,679 | |
| 2,413 |
|
| 9,092 |
Total earning assets | |
| 5,199 | |
| (10,803) |
|
| (5,604) | |
| 7,809 | |
| 2,525 |
|
| 10,334 |
Interest-bearing liabilities: | |
|
| |
|
|
|
|
| |
|
| |
|
|
|
|
|
NOW and savings deposits | |
| 41 | |
| (47) |
|
| (6) | |
| (84) | |
| (16) |
|
| (100) |
Money market deposits | |
| 1,399 | |
| (2,398) |
|
| (999) | |
| 1,420 | |
| 757 |
|
| 2,177 |
Time deposits | |
| (3,979) | |
| (6,049) |
|
| (10,028) | |
| 1,116 | |
| 4,747 |
|
| 5,863 |
Total interest-bearing deposits | |
| (2,539) | |
| (8,494) |
|
| (11,033) | |
| 2,452 | |
| 5,488 |
|
| 7,940 |
Borrowings | |
| 387 | |
| (103) |
|
| 284 | |
| (164) | |
| (213) |
|
| (377) |
Total interest-bearing liabilities | |
| (2,152) | |
| (8,597) |
|
| (10,749) | |
| 2,288 | |
| 5,275 |
|
| 7,563 |
Net interest income | | $ | 7,351 | | $ | (2,206) |
| $ | 5,145 | | $ | 5,521 | | $ | (2,750) |
| $ | 2,771 |
| (1) | Includes income and average balances for term federal funds, interest-earning cash accounts, and other miscellaneous earning assets. |
| (2) | Loan balances include nonaccrual loans and loans held for sale. |
Provision for Loan Losses
Credit risk is inherent in the business of making loans. We establish an ALL through charges to earnings, which are shown in the statements of operations as the provision for loan losses. Specifically identifiable and quantifiable known losses are promptly charged off against the allowance for loan losses. The provision for loan losses is determined by conducting a quarterly evaluation of the adequacy of our ALL and charging the shortfall or excess, if any, to the current quarter’s expense. This has the effect of creating variability in the amount and frequency of charges to earnings. The provision for loan losses and level of ALL for each period are dependent upon many factors, including loan growth, net charge-offs, changes in the composition of the loan portfolio, delinquencies, management’s assessment of the quality of the loan portfolio, the valuation of problem loans and the general economic conditions in our market areas. The determination of the amount is complex and involves a high degree of judgment and subjectivity.
50
Year ended December 31, 2020 compared to year ended December 31, 2019
We recorded provision for loan losses of $3.5 million during the year ended December 31, 2020 compared to no provision for loan losses recorded during the year ended December 31, 2019. The increase in our provision for loan losses during the year ended December 31, 2020 was largely due to the unprecedented economic disruptions and uncertainty surrounding the COVID-19 pandemic, as well as the growth in our loan portfolio. Our allowance for loan losses as a percentage of gross loans for the periods ended December 31, 2020 and 2019 was 0.62% and 0.59%, respectively. Excluding outstanding PPP loans of $92.4 million as of December 31, 2020, the ALL as a percentage of total loans was 0.66%. None of the ALL balance was allocated to our PPP loan portfolio at December 31, 2020. Our ALL as a percent of gross loans is relatively lower than our peers due to our high percentage of residential mortgage loans, which tend to have lower allowance for loan loss ratios compared to other commercial or consumer loans.
Year ended December 31, 2019 compared to year ended December 31, 2018
We recorded no provision for loan losses for the year ended December 31, 2019 compared to $1.2 million for the year ended December 31, 2018. The decrease in provision expense was partially due to lower net charge-offs of consumer loans, as well as a large recovery received on a commercial real estate loan. The consumer loans charged off represent auto pool loans which had poor performance. During 2016, management elected to discontinue purchasing this product and is letting this portfolio paydown and provisioning for any calculated losses when necessary. Our allowance for loan losses as a percentage of gross loans for the periods ended December 31, 2019 and 2018 was 0.59% and 0.58%, respectively.
Noninterest Income
Noninterest income is an important component of our total revenues. A significant portion of our noninterest income is associated with SBA and residential mortgage lending activity, consisting of gains on the sale of loans sold in the secondary market and servicing income from loans sold with servicing rights retained. Other sources of noninterest income include service charges on deposit accounts and other service charges, commissions and fees.
The following table sets forth the major components of our noninterest income for the years ended December 31, 2020, 2019 and 2018:
| | Years Ended December 31, | | 2020 vs.2019 | | 2019 vs.2018 | | |||||||||||||
(Dollars in thousands) |
| 2020 |
| 2019 |
| 2018 |
| $ Change |
| % Change |
| $ Change |
| % Change | | |||||
Noninterest Income: |
| |
|
| |
|
| |
|
| |
|
|
| | |
|
|
| |
Service charges on deposit accounts | | $ | 1,312 | | $ | 1,462 | | $ | 1,386 |
| $ | (150) |
| (10.3) | % | $ | 76 |
| 5.5 | % |
Other service charges, commissions and fees | |
| 8,545 | |
| 10,121 | |
| 10,107 |
|
| (1,576) |
| (15.6) | |
| 14 |
| 0.1 | |
Gain on sale of residential mortgage loans | |
| 2,529 | |
| 9,141 | |
| 5,679 |
|
| (6,612) |
| (72.3) | |
| 3,462 |
| 61.0 | |
Mortgage servicing income, net | |
| 1,308 | |
| 9,294 | |
| 11,994 |
|
| (7,986) |
| (85.9) | |
| (2,700) |
| (22.5) | |
Gain on sale of SBA loans | | | 6,467 | | | 5,444 | | | 4,616 | | | 1,023 | | 18.8 | | | 828 | | 17.9 | |
SBA servicing income, net | | | 6,130 | | | 3,745 | | | 3,119 | | | 2,385 | | 63.7 | | | 626 | | 20.1 | |
Other income | | | 920 | | | 689 | | | 745 | | | 231 | | 33.5 | | | (56) | | (7.5) | |
Total noninterest income | | $ | 27,211 | | $ | 39,896 | | $ | 37,646 |
| $ | (12,685) |
| (31.8) | % | $ | 2,250 |
| 6.0 | % |
Year ended December 31, 2020 compared to year ended December 31, 2019
Service charges on deposit accounts were $1.3 million for the year ended December 31, 2020 compared to $1.5 million for the year ended December 31, 2019, a decrease of $150,000, or 10.3%. The slight decrease was partially attributable to lower insufficient funds and overdraft fee due to a general decline in customer spending activity driven by offset by increased analysis fees.
Other service charges, commissions and fees decreased $1.6 million, or 15.6%, to $8.5 million for year ended December 31, 2020 compared to $10.1 million for the year ended December 31, 2019. The decrease is mainly attributable to lower underwriting, processing and origination fees earned from our origination of residential mortgage loans as mortgage volume significantly declined during the year ended December 31, 2020 compared to the year ended December
51
31, 2019. Mortgage loan originations totaled $484.2 million during the year ended December 31, 2020 compared to $644.5 million during the year ended December 31, 2019.
Total gain on sale of loans was $9.0 million for the year ended December 31, 2020 compared to $14.6 million for the year ended December 31, 2019, a decrease of $5.6 million, or 38.3%.
Gain on sale of residential mortgage loans totaled $2.5 million for the year ended December 31, 2020 compared to $9.1 million for the year ended December 31, 2019. We sold $92.7 million in residential mortgage loans with an average premium of 2.78% during the year ended December 31, 2020 compared to the sale of $520.1 million in residential mortgages with an average premium of 1.79% during the year ended December 31, 2019. We originated $484.2 million of residential mortgage in 2020 compared to $644.5 million in 2019.
Gain on sale of SBA loans totaled $6.5 million for the year ended December 31, 2020 compared to $5.4 million for the year ended December 31, 2019. We sold $128.6 million in SBA loans during the year ended December 31, 2020 with average premiums of 7.58% compared to the sale of $118.4 million in SBA loans with an average premium of 7.08% in the same period in 2019.
Mortgage loan servicing income was $1.3 million for the year ended December 31, 2020 compared to $9.3 million for the year ended December 31, 2019, a decrease of $8.0 million, or 85.9%. The decrease in mortgage loan servicing income was due to the decrease in capitalized mortgage servicing assets and increased servicing asset amortization. Included in mortgage loan servicing income for the year ended December 31, 2020 was $6.4 million in mortgage servicing fees compared to $6.2 million for 2019, and capitalized mortgage servicing assets of $1.0 million for the year ended December 31, 2020 compared to $6.9 million for 2019. These amounts were offset by mortgage loan servicing asset amortization of $5.4 million for the year ended December 31, 2020 compared to $3.8 million for the year ended December 31, 2019. During the year ended December 31, 2020, we recorded fair value impairment of $641,000 on our mortgage servicing assets. No fair value impairment charges were recorded during the year ended December 31, 2019. Our total residential mortgage loan servicing portfolio was $961.7 million at December 31, 2020 compared to $1.17 billion at December 31, 2019.
SBA servicing income was $6.1 million for the year ended December 31, 2020 compared to $3.7 million for the year ended December 31, 2019, an increase of $2.4 million, or 63.7%. Our total SBA loan servicing portfolio was $507.4 million as of December 31, 2020 compared to $441.6 million as of December 31, 2019. Our SBA servicing rights are carried at fair value. While our servicing portfolio grew, the inputs used to calculate fair value also changed, which resulted in a $1.5 million increase to our SBA servicing rights during the year ended December 31, 2020. During the year ended December 31, 2019, we recorded a charge of $238,000 to our SBA servicing rights.
Other noninterest income was $920,000 for the year ended December 31, 2020 compared to $689,000 for the year ended December 31, 2019, an increase of $231,000, or 33.5%. The largest component of other noninterest income is the income on bank owned life insurance which totaled $587,000 and $470,000, respectively, for the years ended December 31, 2020 and 2019.
Year ended December 31, 2019 compared to year ended December 31, 2018
Service charges on deposit accounts were $1.5 million for the year ended December 31, 2019 compared to $1.4 million for the year ended December 31, 2018, an increase of $76,000, or 5.5%. The slight increase was partially attributable to increased analysis fees.
Other service charges, commissions and fees were relatively steady at $10.1 million for the years ended December 31, 2019 and December 31, 2018, with a slight increase of $14,000 in 2019. This small increase was attributable to a $614,000 increase in application income from residential mortgage loans offset by a $745,000 decrease in residential mortgage loan originations fees, as well as increases in various other service charge, commissions and fee accounts.
Total gain on sale of loans was $14.6 million for the year ended December 31, 2019 compared to $10.3 million for the year ended December 31, 2018, an increase of $4.3 million, or 41.7%.
52
Gain on sale of residential mortgage loans totaled $9.1 million for the year ended December 31, 2019 compared to $5.7 million for the year ended December 31, 2018. We sold $520.1 million in residential mortgage loans with an average premium of 1.79% during the year ended December 31, 2019 compared to the sale of $536.0 million in residential mortgages with an average premium of 1.06% during the year ended December 31, 2018. We originated $644.5 million of residential mortgage in 2019 compared to $716.1 million in 2018.
Gain on sale of SBA loans totaled $5.4 million for the year ended December 31, 2019 compared to $4.6 million for the year ended December 31, 2018. We sold $118.4 million in SBA loans during the year ended December 31, 2019 with average premiums of 7.08% compared to the sale of $93.3 million in SBA loans with an average premium of 7.31% in the same period in 2018.
Mortgage loan servicing income was $9.3 million for the year ended December 31, 2019 compared to $12.0 million for the year ended December 31, 2018, a decrease of $2.7 million, or 22.5%. The decrease in mortgage loan servicing income was due to the declining value of capitalized mortgage servicing assets and increased servicing asset amortization. Included in mortgage loan servicing income for the year ended December 31, 2019 was $6.2 million in mortgage servicing fees compared to $3.9 million for 2018, and capitalized mortgage servicing assets of $6.9 million for the year ended December 31, 2019 compared to $10.3 million for 2018. These amounts were offset by mortgage loan servicing asset amortization of $3.8 million for the year ended December 31, 2019 compared to $2.2 million for the year ended December 31, 2018. Our total residential mortgage loan servicing portfolio was $1.17 billion at December 31, 2019 compared to $804.2 million at December 31, 2018.
SBA servicing income was $3.7 million for the year ended December 31, 2019 compared to $3.1 million for the year ended December 31, 2018, an increase of $0.6 million, or 20.1%. Our total SBA loan servicing portfolio was $441.6 million as of December 31, 2019 compared to $431.2 million as of December 31, 2018. Our SBA servicing rights are carried at fair value. While our servicing portfolio grew, the inputs used to calculate fair value also changed, which resulted in a $238,000 charge to our SBA servicing rights during the year ended December 31, 2019. During the year ended December 31, 2018, we recorded a charge of $888,000 to our SBA servicing rights.
Other noninterest income was $689,000 for the year ended December 31, 2019 compared to $745,000 for the year ended December 31, 2018, a decrease of $56,000, or 7.5%. The largest component of other noninterest income is the income on bank owned life insurance which totaled $470,000 and $478,000, respectively, for the years ended December 31, 2019 and 2018.
Noninterest Expense
The following table sets forth the major components of our noninterest expense for the years ended December 31, 2020, 2019 and 2018:
| | Years Ended December 31, | | 2020 vs.2019 | | 2019 vs.2018 | | |||||||||||||
(Dollars in thousands ) |
| 2020 |
| 2019 |
| 2018 |
| $ Change |
| % Change |
| $ Change |
| % Change | | |||||
Noninterest Expense: |
| |
|
| |
|
| |
|
| |
|
|
| | |
|
|
| |
Salaries and employee benefits | | $ | 25,500 | | $ | 24,923 | | $ | 23,569 |
| $ | 577 |
| 2.3 | % | $ | 1,354 |
| 5.7 | % |
Occupancy and equipment | |
| 5,083 | |
| 4,749 | |
| 4,086 |
|
| 334 |
| 7.0 | |
| 663 |
| 16.2 | |
Data processing | |
| 1,078 | |
| 1,029 | |
| 842 |
|
| 49 |
| 4.8 | |
| 187 |
| 22.2 | |
Advertising | |
| 566 | |
| 649 | |
| 613 |
|
| (83) |
| (12.8) | |
| 36 |
| 5.9 | |
Other expenses | |
| 8,873 | |
| 8,653 | |
| 9,502 |
|
| 220 |
| 2.5 | |
| (849) |
| (8.9) | |
Total noninterest expense | | $ | 41,100 | | $ | 40,003 | | $ | 38,612 |
| $ | 1,097 |
| 2.7 | % | $ | 1,391 |
| 3.6 | % |
Year ended December 31, 2020 compared to year ended December 31, 2019
Salaries and employee benefits expense for the year ended December 31, 2020 was $25.5 million compared to $24.9 million for the year ended December 31, 2019, an increase of $577,000, or 2.3%. This increase was attributable to an increase in the overall number of employees necessary to support our continued growth and annual salary adjustments, offset by lower benefit costs and lower commission paid to our loan officers as loan volume declined in 2020. The average
53
number of full-time equivalent employees was 209 for the year ended December 31, 2020 compared to 203 for the year ended December 31, 2019.
Occupancy expense for the year ended December 31, 2020 was $5.1 million compared to $4.7 million for the same period during 2019, an increase of $334,000, or 7.0%. This increase was partially due to increased property taxes, maintenance and depreciation on our existing branch locations.
Data processing expense for the year ended December 31, 2020 was $1.1 million compared to $1.0 million for the year ended December 31, 2019, an increase of $49,000, or 4.8%. This increase was primarily due to continued growth in our loans and deposits.
Advertising expense for the year ended December 31, 2020 was $566,000 compared to $649,000 for 2019, a decrease of $83,000, or 12.8%. The decrease was due to management’s ongoing efforts to reduce costs.
Other expenses for the year ended December 31, 2020 were $8.9 million compared to $8.7 million for the year ended December 31, 2019, an increase of $220,000, or 2.5%. The increase was partially due to higher accounting and SEC related expenses due to 2020 being the Company’s first full year as a public company, offset by lower mortgage related expenses. Included in other expenses were directors’ fees of $383,000 and $366,000 for the years ended December 31, 2020 and 2019, respectively.
Year ended December 31, 2019 compared to year ended December 31, 2018
Salaries and employee benefits expense for the year ended December 31, 2019 was $24.9 million compared to $23.6 million for the year ended December 31, 2018, an increase of $1.4 million, or 5.7%. This increase was attributable to an increase in the overall number of employees necessary to support our continued growth, annual salary adjustments, and increased benefit costs. The average number of full-time equivalent employees was 203 for the year ended December 31, 2019 compared to 181 for the year ended December 31, 2018.
Occupancy expense for the year ended December 31, 2019 was $4.7 million compared to $4.1 million for the same period during 2018, an increase of $663,000, or 16.2%. This increase was partially due to the opening of a new branch in April 2019 and the property taxes, depreciation and upkeep related to the this property.
Data processing expense for the year ended December 31, 2019 was $1.0 million compared to $842,000 for the year ended December 31, 2018, an increase of $187,000, or 22.2%. This increase was primarily due to continued growth in our loans, deposits and an additional branch.
Advertising expense for the year ended December 31, 2019 was $649,000 compared to $613,000 for 2018, an increase of $36,000, or 5.9%. The increase was consistent with the continued growth of our loans and deposits.
Other expenses for the year ended December 31, 2019 were $8.7 million compared to $9.5 million for the year ended December 31, 2018, a decrease of $815,000, or 8.6%. The decrease was primarily due to lower mortgage related expenses, as well as decreased operating and customer service expenses. Included in other expenses were directors’ fees of $366,000 and $333,000 for the years ended December 31, 2019 and 2018, respectively.
Income Tax Expense
Income tax expense for the years ended December 31, 2020, 2019 and 2018 was $12.4 million, $16.2 million and $14.7 million, respectively. The Company’s effective tax rates for the years ended December 31, 2020, 2019 and 2018 were 25.4%, 26.5% and 26.2%, respectively.
We had net deferred tax liabilities of $1.0 million, $2.9 million and $1.9 million at December 31, 2020, 2019 and 2018, respectively.
54
Return on Equity and Assets
The following table sets forth our return on average assets, return on average equity, dividend payout ratio and average shareholders’ equity to average assets ratio for the periods indicated:
| | Years Ended December 31, | |||||||
|
| 2020 | | 2019 | | 2018 | |||
Return on average assets | | 2.17 | % | | 2.87 | % | | 3.01 | % |
Return on average equity | | 16.02 | % | | 24.23 | % | | 27.95 | % |
Dividend payout ratio | | 28.32 | % | | 23.26 | % | | 22.48 | % |
Average shareholders' equity to average assets | | 13.52 | % | | 11.86 | % | | 10.76 | % |
Financial Condition
Total assets increased $265.6 million, or 16.3%, to $1.90 billion at December 31, 2020 as compared to $1.63 billion at December 31, 2019. The increase in total assets was primarily attributable to increases in loans held for investment of $469.2 million and bank owned life insurance of $15.6 million, partially offset by decreases in cash and due from banks of $129.8 million, securities purchased under agreements to resell of $15.0 million, and loans held for sale of $85.8 million.
Loans
Our loans represent the largest portion of our earning assets, substantially greater than the securities portfolio or any other asset category, and the quality and diversification of the loan portfolio is an important consideration when reviewing our financial condition.
Our gross loans increased $471.7 million, or 40.6%, to $1.63 billion as of December 31, 2020 compared to $1.16 billion as of December 31, 2019. Our loan growth during the year ended December 31, 2020 was comprised of an increase of $13.9 million, or 43.8%, in construction and development loans, an increase of $52.5 million, or 12.3%, in commercial real estate loans, an increase of $84.1 million, or 158.4%, in commercial and industrial loans, an increase of $322.8 million, or 49.5%, in residential real estate loans and a decrease of $1.6 million, or 89.6%, in consumer and other loans. Included in commercial and industrial loans were PPP loans with outstanding balances totaling $92.4 million as of December 31, 2020.
The following table presents the ending balance of each major category in our loan portfolio at the dates indicated.
| | December 31, | | |||||||||||||||||||||||
| | 2020 | | 2019 | | 2018 | | 2017 | | 2016 | | |||||||||||||||
(Dollars in thousands) |
| Amount |
| % of Total |
| Amount |
| % of Total |
| Amount |
| % of Total |
| Amount |
| % of Total |
| Amount |
| % of Total | | |||||
Construction and Development | | $ | 45,653 |
| 2.8 | % | $ | 31,739 |
| 2.7 | % | $ | 42,718 |
| 3.7 | % | $ | 45,132 |
| 4.2 | % | $ | 43,164 |
| 5.4 | % |
Commercial Real Estate | |
| 477,419 |
| 29.2 | |
| 424,950 |
| 36.5 | |
| 396,598 |
| 34.6 | |
| 369,346 |
| 34.6 | |
| 370,239 |
| 46.0 | |
Commercial and Industrial | |
| 137,239 |
| 8.4 | |
| 53,105 |
| 4.6 | |
| 33,100 |
| 2.9 | |
| 33,671 |
| 3.2 | |
| 39,938 |
| 5.0 | |
Residential Real Estate | |
| 974,445 |
| 59.6 | |
| 651,645 |
| 56.0 | |
| 670,341 |
| 58.5 | |
| 611,258 |
| 57.2 | |
| 331,412 |
| 41.2 | |
Consumer and other | |
| 183 |
| 0.0 | |
| 1,768 |
| 0.2 | |
| 2,957 |
| 0.3 | |
| 9,186 |
| 0.8 | |
| 19,565 |
| 2.4 | |
Total gross loans | | | 1,634,939 |
| 100.0 | % | | 1,163,207 |
| 100.0 | % | | 1,145,714 |
| 100.0 | % | | 1,068,593 |
| 100.0 | % | | 804,318 |
| 100.0 | % |
Unearned income | |
| (4,595) |
|
| |
| (2,045) |
|
| |
| (2,139) |
|
| |
| (1,620) |
|
| |
| (1,678) |
|
| |
Allowance for loan losses | | | (10,135) | | | | | (6,839) | | | | | (6,645) | | | | | (6,925) | | | | | (5,471) | | | |
Total loans, net | | $ | 1,620,209 |
|
| | $ | 1,154,323 |
|
| | $ | 1,136,930 |
|
| | $ | 1,060,048 |
|
| | $ | 797,169 |
|
| |
55
The following table presents the maturity distribution of our loans as of December 31, 2020. The table also shows the distribution of such loans between those loans with predetermined (fixed) interest rates and those with variable (floating) interest rates.
| | December 31, 2020 | ||||||||||
(Dollars in thousands) |
| One Year or Less |
| One to Five Years |
| Over Five Years |
| Total | ||||
Construction and Development | | $ | 35,366 |
| $ | 10,287 | | $ | — | | $ | 45,653 |
Commercial Real Estate | |
| 31,257 |
|
| 160,934 | |
| 285,228 | |
| 477,419 |
Commercial and Industrial | |
| 7,399 |
|
| 104,198 | |
| 25,642 | |
| 137,239 |
Residential Real Estate | |
| 133 |
|
| — | |
| 974,312 | |
| 974,445 |
Consumer and other | |
| 183 |
|
| — | |
| — | |
| 183 |
Total gross loans | | $ | 74,338 |
| $ | 275,419 | | $ | 1,285,182 | | $ | 1,634,939 |
| | | | | | | | | | | | |
| | | | | | | | | | | | |
Amounts with fixed rates | | $ | 26,815 | | $ | 206,918 | | $ | 289,784 | | $ | 523,517 |
Amounts with floating or adjustable rates | | | 47,523 | | | 68,501 | | | 995,398 | | | 1,111,422 |
Total gross loans | | $ | 74,338 | | $ | 275,419 | | $ | 1,285,182 | | $ | 1,634,939 |
Our loan portfolio is concentrated in commercial real estate (primarily the unguaranteed portion of SBA loans) and residential mortgage loans with the remaining balance in construction and development, commercial and industrial, and consumer loans. 91.6% of our gross loans was secured by real property as of December 31, 2020, compared to 95.3% as of December 31, 2019 and 96.9% as of December 31, 2018.
We have established concentration limits in the loan portfolio for commercial real estate loans, commercial and industrial loans, and unsecured lending, among others. All loan types are within established limits. We use underwriting guidelines to assess the borrowers’ historical cash flow to determine debt service, and we further stress test the debt service under higher interest rate scenarios. Financial and performance covenants are used in commercial lending agreements to allow us to react to a borrower’s deteriorating financial condition, should that occur. For more information, see “Item 1 – Business – Lending Activities.”
The principal categories of our loan portfolios are discussed below:
Construction and development loans. Our construction and development loans are comprised of commercial construction and land acquisition and development construction. Interest reserves are generally established on real estate construction loans. These loans carry a fixed interest rate and have maturities of less than 18 months. Our LTV policy limits are 65% for construction and development loans. Additionally, we impose limits on the total dollar amount of this category of our portfolio. The risks inherent in construction lending may affect adversely our results of operations. Such risks include, among other things, the possibility that contractors may fail to complete, or complete on a timely basis, construction of the relevant properties; substantial cost overruns in excess of original estimates and financing; market deterioration during construction; and lack of permanent take-out financing. Loans secured by such properties also involve additional risk because they have no operating history. Advances on construction loans are made relative to the overall percentage of completion on the project in an effort to remain adequately secured. Such properties may not be sold or leased so as to generate the cash flow anticipated by the borrower.
As of December 31, 2020, our construction and development loans comprised $45.7 million, or 2.8%, of total loans, compared to $31.7 million, or 2.7%, of total loans as of December 31, 2019. This compares to $42.7 million, or 3.7%, of total loans as of December 31, 2018.
Commercial real estate loans. Commercial real estate loans include owner-occupied and non-owner occupied commercial real estate. We require our commercial real estate loans to be secured by what we believe to be well-managed property with adequate margins and we generally obtain a personal guarantee from responsible parties. We originate both fixed-rate and adjustable-rate loans with terms up to 25 years. At December 31, 2020, approximately 86.4% of our commercial real estate loans were owner-occupied.
56
As of December 31, 2020, our loans secured by commercial real estate were $477.4 million, or 29.2%, of total loans compared to $425.0 million, or 36.5%, as of December 31, 2019. This increase was due to consistent loan production and market demand for these types of loans. Commercial real estate loans were $396.6 million, or 34.6%, of our portfolio as of December 31, 2018. Our non-owner occupied commercial real estate loans make up a small percentage of our overall commercial real estate loan portfolio. Non-owner occupied commercial real estate loans were 13.6%, 17.9%, and 19.2%, as a percentage of commercial real estate loans for the years ending December 31, 2020, 2019, and 2018, respectively.
We originate both fixed and adjustable rate loans. Adjustable rate loans are based on LIBOR, prime rate or constant maturity treasury (“CMT”). At December 31, 2020 and 2019, approximately 31.7% and 27.6% of the commercial real estate portfolio consisted of fixed-rate loans, respectively. Our policy maximum LTV is 85% for commercial real estate loans. However, our weighted average LTV is well below this policy maximum. Newly originated and renewed non-SBA commercial real estate loans for the years ending December 31, 2020 and 2019 carried a weighted average LTV of 59.5% and 67.3%, respectively.
Commercial and industrial loans. We provide a mix of variable and fixed rate commercial and industrial loans. The loans are typically made to small and medium-sized businesses for working capital needs, business expansions and for trade financing. We extend commercial business loans on an unsecured and secured basis for working capital, accounts receivable and inventory financing, machinery and equipment purchases, and other business purposes. Generally, short-term loans have maturities ranging from six months to one year, and “term loans” have maturities ranging from five to ten years. Loans are generally intended to finance current transactions and typically provide for periodic principal payments, with interest payable monthly. Term loans generally provide for floating interest rates, with monthly payments of both principal and interest.
As of December 31, 2020, our commercial and industrial loans comprised $137.2 million, or 8.4%, of total loans, compared to $53.1 million, or 4.6% of total loans as of December 31, 2019. This compares to $33.1 million, or 2.9%, of total loans as of December 31, 2018. This increase is mainly due to the PPP loans that were originated in 2020, which is $92.4 million as of December 31, 2020.
A significant portion of both our commercial real estate and commercial and industrial loans are SBA loans. We are designated an SBA Preferred Lender under the SBA Preferred Lender Program. We offer mostly SBA 7(a) variable-rate loans. We generally sell the 75% guaranteed portion of the SBA loans that we originate. Our SBA loans are typically made to small-sized retail, hotel/motel, service and distribution businesses for working capital needs or business expansions. SBA loans have maturities up to 25 years. Typically, non-real estate secured loans mature in less than 10 years. Collateral may also include inventory, accounts receivable and equipment, and may include personal guarantees. Our unguaranteed SBA loans collateralized by real estate are monitored by collateral type and included in our CRE Concentration Guidance. As of December 31, 2020, our SBA portfolio totaled $285.1 million compared to $173.6 million as of December 31, 2019. This increase was primarily a result of more originations, specifically PPP loans, offset by the amortization of our SBA portfolio. We originated and sold $245.7 million and $128.6 million during the year ended December 31, 2020 compared to originations and sales of $155.0 million and $118.4 million for the year ended December 31, 2019. We originated and sold $121.0 million and $93.3 million of SBA loans during the year ended December 31, 2018.
From our total SBA loan portfolio of $285.1 million at December 31, 2020, $170.0 million is secured by real estate and $115.1 million (including PPP loans of $92.4 million) is unsecured or secured by business assets, which we classify as commercial and industrial loans.
As a preferred SBA lender, we are participating in the Paycheck Protection Program created under the CARES Act and implemented by the SBA to help provide loans to our business customers in need. As of December 31, 2020, the Company approved and funded over 1,800 PPP loans totaling $96.9 million. These PPP loans were funded with our current cash balances and all PPP loans are fully guaranteed by the SBA. As of March 9, 2021, the SBA had granted forgiveness for PPP loans totaling $11.5 million.
The Economic Aid Act, signed into law on December 27, 2020, authorized an additional $284.5 billion in new PPP funding and extends the authority of lenders to make PPP loans through March 31, 2021. We are participating in this new
57
round of PPP loan funding by offering first and second draw loans. As of March 9, 2021, the Company had approved and funded 635 PPP loans totaling $41.7 million under this new round of PPP loan funding.
Residential real estate loans. We originate mainly non-conforming single-family residential mortgage loans through our branch network, without the use of any third party originator. During 2020, our primary loan products were a five-year hybrid adjustable rate mortgage which reprices after five years to the one-year CMT plus certain spreads and a 15-year fixed rate product. We originate the residential mortgage loans to hold for investment and also sell on the secondary market.
As of December 31, 2020, our residential real estate loans comprised $974.4 million, or 59.6%, of total loans, compared to $651.6 million, or 56.0%, of total loans as of December 31, 2019. This compares to $670.3 million, or 58.5%, of total loans as of December 31, 2018. The increase in 2020 was due to management’s decision to hold for investment the majority of our production rather than sell our residential loans on the secondary market. During the years ended December 31, 2020 and 2019, we originated $484.2 million and $644.5 million and sold $92.7 million and $520.1 million, respectively, in residential mortgage loans. During the year ended December 31, 2018, we originated $716.1 million and sold $536.0 million in residential mortgage loans.
Consumer and other loans. These loans represent a small portion of our overall portfolio and primarily consists of purchased auto loan pools, overdrafts, and consumer lines of credit. Consumer loans carry a greater amount of risk and collections are dependent on the borrower’s continuing financial stability and thus are more likely to be adversely affected by job loss, divorce, illness or personal bankruptcy. Furthermore, the application of various federal and state laws may limit the amount which can be recovered on such loans.
As of December 31, 2020, our consumer and other loans comprised $183,000 compared to $1.8 million as of December 31, 2019. This compares to $3.0 million as of December 31, 2018. Our consumer loans have steadily decreased since December 31, 2017 due to our decision to discontinue the purchase of auto loan pools in 2016.
Nonperforming Assets
Loans are considered delinquent when principal or interest payments are past due 30 days or more. Delinquent loans may remain on accrual status between 30 days and 90 days past due. Loans on which the accrual of interest has been discontinued are designated as nonaccrual loans. Typically, the accrual of interest on loans is discontinued when principal and interest payments are past due 90 days or more or when, in the opinion of management, there is a reasonable doubt as to collectability in the normal course of business. When loans are placed on nonaccrual status, all interest previously accrued but not collected is reversed against current period interest income. Income on nonaccrual loans is subsequently recognized only to the extent that cash is received and the loan’s principal balance is deemed collectible. Loans are restored to accrual status when loans become well-secured and management believes full collectability of principal and interest is probable.
Real estate acquired as a result of foreclosure or by deed-in-lieu of foreclosure is classified as OREO until sold, and is carried at the balance of the loan at the time of foreclosure or at estimated fair value less estimated costs to sell, whichever is less.
Nonperforming loans include loans 90 days or more past due and still accruing, loans accounted for on a nonaccrual basis and accruing restructured loans. Nonperforming assets consist of nonperforming loans plus OREO.
Nonperforming loans were $13.1 million at December 31, 2020 compared to $14.7 million at December 31, 2019 and $9.0 million at December 31, 2018. The decrease from December 31, 2019 to December 31, 2020 was primarily attributable to a $1.4 million decrease in nonaccrual construction and development loans and $627,000 decrease in nonaccrual residential real estate loans. The increase from December 31, 2018 to December 31, 2019 was primarily attributable to a $1.4 million increase in nonaccrual construction and development loans and a $6.2 million increase in nonaccrual residential real estate loans. The decrease in the year ended December 31, 2018 was primarily due to a $2.5 million decrease in nonaccrual construction and development loans, offset by a $1.4 million increase in nonaccrual
58
commercial real estate loans. We did not recognize any interest income on nonaccrual loans during the years ended December 31, 2020, 2019 and 2018.
We recognized interest income on loans modified under troubled debt restructurings of $143,000, $301,000 and $156,000 for the years ended December 31, 2020, 2019 and 2018, respectively.
The following table sets forth the allocation of our nonperforming assets among our different asset categories as of the dates indicated. Nonperforming loans include nonaccrual loans, loans past due 90 days or more and still accruing interest, and loans modified under troubled debt restructurings. At December 31, 2020, included in nonaccrual loans were $2.9 million of commercial real estate loans, $34,000 in commercial and industrial loans and $7.3 million in residential real estate loans. Nonaccrual loans at December 31, 2019 comprised of $1.4 million of construction and development loans, $2.9 million of commercial real estate loans, $19,000 in commercial and industrial loans and $7.9 million in residential real estate loans. The weighted average LTV of nonaccrual residential real estate loans was below 56% at December 31, 2020.
| | December 31, | | |||||||||||||
(Dollars in thousands) |
| 2020 |
| 2019 |
| 2018 |
| 2017 |
| 2016 |
| |||||
Nonaccrual loans | | $ | 10,203 | | $ | 12,236 | | $ | 5,667 | | $ | 7,083 | | $ | 30 | |
Past due loans 90 days or more and still accruing | |
| — | |
| — | |
| — | |
| — | |
| 92 | |
Accruing troubled debt restructured loans | |
| 2,891 | |
| 2,459 | |
| 3,298 | |
| 2,945 | |
| 3,432 | |
Total nonperforming loans | |
| 13,094 | |
| 14,695 | |
| 8,965 | |
| 10,028 | |
| 3,554 | |
Other real estate owned | |
| 3,844 | |
| 423 | |
| — | |
| 610 | |
| 365 | |
Total nonperforming assets | | $ | 16,938 | | $ | 15,118 | | $ | 8,965 | | $ | 10,638 | | $ | 3,919 | |
Nonperforming loans to gross loans | |
| 0.80 | % |
| 1.26 | % |
| 0.78 | % |
| 0.94 | % |
| 0.44 | % |
Nonperforming assets to total assets | |
| 0.89 | % |
| 0.93 | % |
| 0.63 | % |
| 0.83 | % |
| 0.36 | % |
Allowance for loan losses to nonperforming loans | |
| 77.40 | % |
| 46.54 | % |
| 74.12 | % |
| 69.06 | % |
| 153.94 | % |
| (1) | For purposes of the table above, nonperforming and past due loans exclude COVID-19 loan modifications. |
At December 31, 2020, 15.8% of the Company’s loan portfolio, or $259.1 million, is in sectors that have been the most sensitive to the COVID-19 pandemic. Within this group, the hotel industry and the restaurant industry, which are two industries heavily impacted by the COVID-19 pandemic, represented $141.2 million and $36.1 million, respectively. While our entire loan portfolio is being continuously assessed, enhanced monitoring for these sectors is ongoing. We are continuously working with these customers to evaluate how the current economic conditions are impacting, and will continue to impact, their business operations.
In March 2020, regulatory agencies issued an interagency statement on loan modifications and reporting for financial institutions working with customers affected by COVID–19. The agencies confirmed with the staff of the FASB that short–term modifications made on a good faith basis in response to the COVID–19 pandemic to borrowers who were current prior to any relief, are not to be considered troubled debt restructurings. As of December 31, 2020, we had non-SBA commercial loans and residential mortgages with outstanding balances of $42.0 million and $9.8 million, respectively, who were approved for a third round of payment deferrals. As of September 30, 2020, we had non-SBA commercial loans and residential mortgages with outstanding balances of $82.5 million and $14.5 million, respectively, who were approved for a second round of payment deferrals. This is a significant decline from the first round of payment deferrals that were granted to our non-SBA commercial and residential mortgage customers during the second quarter of 2020, which represented outstanding balances of $157.5 million and $145.3 million, respectively, as of June 30, 2020. The SBA made debt relief payments for the principal, interest and fee payments of all our SBA loan customers for six months through the end of September 2020. As of December 31, 2020 and following the expiration of the SBA debt relief payments, we had approved three month payment deferrals for 18 SBA loans with outstanding gross loan balances totaling $25.5 million ($6.4 million unguaranteed book balance). See Notes 1 and 3 of our consolidated financial statements as of December 31, 2020, included elsewhere in this Annual Report on Form 10-K, for more information regarding accounting treatment of loan modifications as a response to COVID-19.
59
Allowance for loan losses
The allowance for loan losses is an estimate of probable incurred losses in the loan portfolio. Loans are charged-off against the allowance when management believes a loan balance is uncollectible. Subsequent recoveries, if any, are credited to the allowance for loan losses. Management’s methodology for estimating the allowance balance consists of several key elements, which include specific allowances on individual impaired loans and the formula driven allowances on pools of loans with similar risk characteristics. Allocations of the allowance may be made for specific loans, but the entire allowance is available for any loan that, in management’s judgment, should be charged-off.
The ALL is determined on a quarterly basis and reflects management’s estimate of probable incurred credit losses inherent in the loan portfolio. We also rely on internal and external loan review procedures to further assess individual loans and loan pools, and economic data for overall industry and geographic trends. The computation includes element of judgment and high levels of subjectivity.
A loan is considered impaired when it is probable that we will be unable to collect all amounts due according to the contractual terms of the loan agreement. Impaired loans include loans on nonaccrual status and performing restructured loans. Income from loans on nonaccrual status is recognized to the extent cash is received and when the loan’s principal balance is deemed collectible. Depending on a particular loan’s circumstances, we measure impairment of a loan based upon either the present value of expected future cash flows discounted at the loan’s effective interest rate, the loan’s observable market price, or the fair value of the collateral less estimated costs to sell if the loan is collateral dependent. A loan is considered collateral dependent when repayment of the loan is based solely on the liquidation of the collateral. Fair value, where possible, is determined by independent appraisals, typically on an annual basis. Between appraisal periods, the fair value may be adjusted based on specific events, such as if deterioration of quality of the collateral comes to our attention as part of our problem loan monitoring process, or if discussions with the borrower lead us to believe the last appraised value no longer reflects the actual market value for the collateral. The impairment amount on a collateral-dependent loan is charged-off to the allowance if deemed not collectible and the impairment amount on a loan that is not collateral-dependent is set up as a specific reserve.
In cases where a borrower experiences financial difficulties and we make certain concessionary modifications to contractual terms, the loan is classified as a troubled debt restructuring. These concessions may include a reduction of the interest rate, principal or accrued interest, extension of the maturity date or other actions intended to minimize potential losses. Loans restructured at a rate equal to or greater than that of a new loan with comparable risk at the time the loan is modified may be excluded from restructured loan disclosures in years subsequent to the restructuring if the loans are in compliance with their modified terms. A restructured loan is considered impaired despite its accrual status and a specific reserve is calculated based on the present value of expected cash flows discounted at the loan’s effective interest rate or the fair value of the collateral less estimated costs to sell if the loan is collateral dependent. Interest income on impaired loans is accrued as earned, unless the loan is placed on non-accrual status.
The allowance for loan losses was $10.1 million at December 31, 2020 compared to $6.8 million at December 31, 2019, an increase of $3.3 million or 48.2%. We increased the qualitative factors in our allowance for loan losses calculation as of June 30, 2020, September 30, 2020 and December 31, 2020 for the economic uncertainties caused by the COVID-19 pandemic resulting in the provision expense of $3.5 million recorded during the year ended December 31, 2020. The Company is not required to implement the provisions of the CECL accounting standard issued by the FASB in the ASU No. 2016-13 until January 1, 2023, and is continuing to account for the allowance for loan losses under the incurred loss model.
In determining the allowance and the related provision for loan losses, we consider three principal elements: (i) valuation allowances based upon probable losses identified during the review of impaired commercial and industrial, commercial real estate, construction and land development loans, (ii) allocations, by loan classes, on loan portfolios based on historical loan loss experience and qualitative factors and (iii) review of the credit discounts in relationship to the valuation allowance calculated for purchased loans. Provisions for loan losses are charged to operations to record changes to the total allowance to a level deemed appropriate by us.
60
It is the policy of management to maintain the allowance for loan losses at a level adequate for risks inherent in the loan portfolio. The FDIC and DBF also review the allowance for loan losses as an integral part of their examination process. Based on information currently available, management believes that our allowance for loan losses is adequate. However, the loan portfolio can be adversely affected if economic conditions and the real estate market in our market areas were to weaken. The effect of such events, although uncertain at this time, could result in an increase in the level of nonperforming loans and increased loan losses, which could adversely affect our future growth and profitability. No assurance of the ultimate level of credit losses can be given with any certainty.
Analysis of the Allowance for Loan Losses. The following table provides an analysis of the allowance for loan losses, provision for loan losses and net charge-offs for the periods presented below:
| | December 31, |
| |||||||||||||
(Dollars in thousands) |
| 2020 |
| 2019 |
| 2018 |
| 2017 |
| 2016 | | |||||
Balance, beginning of period | | $ | 6,839 | | $ | 6,645 | | $ | 6,925 | | $ | 5,470 | | $ | 5,527 | |
Charge-offs: | |
|
| |
|
| |
|
| |
|
| |
|
| |
Construction and development | |
| — | |
| — | |
| — | |
| — | |
| — | |
Commercial real estate | |
| 109 | |
| 237 | |
| 88 | |
| 131 | |
| 42 | |
Commercial and industrial | |
| 51 | |
| 14 | |
| 39 | |
| — | |
| 95 | |
Residential real estate | |
| — | |
| — | |
| — | |
| — | |
| — | |
Consumer and other | |
| 97 | |
| 525 | |
| 1,939 | |
| 1,513 | |
| — | |
Total charge-offs | |
| 257 | |
| 776 | |
| 2,066 | |
| 1,644 | |
| 137 | |
Recoveries: | |
|
| |
|
| |
|
| |
|
| |
|
| |
Construction and development | |
| — | |
| — | |
| — | |
| — | |
| — | |
Commercial real estate | |
| 10 | |
| 752 | |
| 22 | |
| 41 | |
| 63 | |
Commercial and industrial | |
| 25 | |
| — | |
| — | |
| — | |
| 17 | |
Residential real estate | |
| — | |
| — | |
| — | |
| — | |
| — | |
Consumer and other | |
| 51 | |
| 218 | |
| 527 | |
| — | |
| — | |
Total recoveries | |
| 86 | |
| 970 | |
| 549 | |
| 41 | |
| 80 | |
Net charge-offs/(recoveries) | |
| 171 | |
| (194) | |
| 1,517 | |
| 1,603 | |
| 57 | |
Provision for loan losses | |
| 3,467 | |
| — | |
| 1,237 | |
| 3,058 | |
| — | |
Balance, end of period | | $ | 10,135 | | $ | 6,839 | | $ | 6,645 | | $ | 6,925 | | $ | 5,470 | |
Total loans at end of period | | $ | 1,634,939 | | $ | 1,163,207 | | $ | 1,145,714 | | $ | 1,068,593 | | $ | 804,318 | |
Average loans(1) | |
| 1,365,129 | |
| 1,218,219 | |
| 1,110,451 | |
| 966,707 | |
| 679,733 | |
Net charge-offs to average loans | |
| 0.01 | % |
| (0.02) | % |
| 0.14 | % |
| 0.17 | % |
| 0.01 | % |
Allowance for loan losses to total loans(2) | |
| 0.62 | % |
| 0.59 | % |
| 0.58 | % |
| 0.65 | % |
| 0.68 | % |
| (1) | Excludes loans held for sale |
| (2) | As of December 31, 2020, the ALL to total loans, excluding PPP loans of $92.4 million, was 0.66%. |
Management believes the allowance for loan losses is adequate to provide for losses inherent in the loan portfolio as of December 31, 2020. The continuing impact of the COVID-19 pandemic during 2020 leading to significant market changes, high levels of unemployment and increasing degrees of uncertainty in the U.S. economy, the impact on collectability is not currently known, and it is possible that additional provisions for credit losses could be needed in future periods.
61
The following table presents a summary of the allocation of the allowance for loan losses by loan portfolio segment for the periods indicated:
| | December 31, | | |||||||||||||||||||||||
| | 2020 | | 2019 | | 2018 | | 2017 | | 2016 | | |||||||||||||||
| | Allowance for | | % of Loans to | | Allowance for | | % of Loans to | | Allowance for | | % of Loans to | | Allowance for | | % of Loans to | | Allowance for | | % of Loans to | | |||||
(Dollars in thousands) |
| Loan Losses |
| Total Loans |
| Loan Losses |
| Total Loans |
| Loan Losses |
| Total Loans |
| Loan Losses |
| Total Loans |
| Loan Losses |
| Total Loans | | |||||
Construction and Development | | $ | 178 |
| 2.8 | % | $ | 131 |
| 2.7 | % | $ | 235 |
| 3.7 | % | $ | 127 |
| 4.2 | % | $ | 116 |
| 5.4 | % |
Commercial Real Estate | |
| 5,161 |
| 29.2 | |
| 2,320 |
| 36.5 | |
| 2,601 |
| 34.6 | |
| 2,135 |
| 34.6 | |
| 2,854 |
| 46.0 | |
Commercial and Industrial | |
| 438 |
| 8.4 | |
| 448 |
| 4.6 | |
| 380 |
| 2.9 | |
| 261 |
| 3.2 | |
| 257 |
| 5.0 | |
Residential Real Estate | |
| 4,350 |
| 59.6 | |
| 3,457 |
| 56.0 | |
| 3,042 |
| 58.5 | |
| 3,048 |
| 57.2 | |
| 5 |
| 41.2 | |
Consumer and other | | | 8 | | — | | | 91 | | 0.2 | | | 387 | | 0.3 | | | 1,170 | | 0.8 | | | 1,656 | | 2.4 | |
Unallocated | |
| — |
| — | |
| 392 |
| — | |
| — |
| — | |
| 184 |
| — | |
| 582 |
| — | |
Total allowance for loan losses | | $ | 10,135 |
| 100.0 | % | $ | 6,839 |
| 100.0 | % | $ | 6,645 |
| 100.0 | % | $ | 6,925 |
| 100.0 | % | $ | 5,470 |
| 100.0 | % |
Investment Securities
Our securities portfolio is the third largest component of our interest earning assets. The portfolio serves the following purposes: (i) to optimize the Bank’s income consistent with the investment portfolio’s liquidity and risk objectives; (ii) to balance market and credit risks of other assets and the Bank’s liability structure; (iii) to profitably deploy funds which are not needed to fulfill loan demand, deposit redemptions or other liquidity purposes; (iv) provide collateral which the Bank is required to pledge against public funds.
We classify our securities as either available-for-sale or held-to-maturity at the time of purchase. Accounting guidance requires available-for-sale securities to be marked to fair value with an offset to accumulated other comprehensive income (loss), a component of shareholders’ equity. Monthly adjustments are made to reflect changes in the fair value of our available-for-sale securities.
All of the securities in our investment portfolio were classified as available-for-sale as of December 31, 2020. All available-for-sale securities are carried at fair value. Securities available-for-sale consist primarily of U.S. government-sponsored agency securities, home mortgage-backed securities and state and municipal bonds. No issuer of the available-for-sale securities, other than the Small Business Administration, comprised more than ten percent of our shareholders’ equity as of December 31, 2020, 2019 or 2018.
The following table presents the amortized cost and fair value of our available-for-sale securities portfolio as of the dates presented.
| | Year Ended December 31, | ||||||||||||||||
| | 2020 | | 2019 | | 2018 | ||||||||||||
(Dollars in thousands) |
| Amortized Cost |
| Fair Value |
| Amortized Cost |
| Fair Value |
| Amortized Cost |
| Fair Value | ||||||
Obligations of U.S. Government entities and agencies | | $ | 9,306 | | $ | 9,306 | | $ | 12,436 | | $ | 12,436 | | $ | 15,183 | | $ | 15,183 |
States and political subdivisions | | | 7,182 |
| | 7,429 | | | 1,246 |
| | 1,279 | | | 1,248 |
| | 1,213 |
Mortgage-backed GSE residential | |
| 1,368 |
|
| 1,382 | |
| 2,015 |
|
| 1,980 | |
| 2,607 |
|
| 2,492 |
Total securities available for sale | | $ | 17,856 |
| $ | 18,117 | | $ | 15,697 |
| $ | 15,695 | | $ | 19,038 |
| $ | 18,888 |
62
Certain securities have fair values less than amortized cost and, therefore, contain unrealized losses. At December 31, 2020, we evaluated the securities which had an unrealized loss for other than temporary impairment (OTTI) and determined all declines in value to be temporary. We anticipate full recovery of amortized cost with respect to these securities by maturity, or sooner in the event of a more favorable market interest rate environment. We do not intend to sell these securities and it is not more likely than not that we will be required to sell them before recovery of the amortized cost basis, which may be at maturity.
The following table sets forth certain information regarding contractual maturities and the weighted average yields of our investment securities as of the dates presented. Expected maturities may differ from contractual maturities if borrowers have the right to call or prepay obligations with or without call or prepayment penalties. We had no securities with contractual maturities due in one year or less as of December 31, 2020.
| | As of December 31, 2020 | | |||||||||||||||||||||||
| | One Year or Less | | More Than One Year | | More Than Five Years | | More Than Ten Years | | Total | | |||||||||||||||
| | | | | Weighted | | | | | Weighted | | | | | Weighted | | | | | Weighted | | | | | Weighted | |
(Dollars in thousands) |
| Fair Value |
| Average Yield |
| Fair Value |
| Average Yield |
| Fair Value |
| Average Yield |
| Fair Value |
| Average Yield |
| Fair Value |
| Average Yield | | |||||
Obligations of U.S. Government entities and agencies | | $ | — | | — | % | $ | 9,306 | | 2.29 | % | $ | — | | — | % | $ | — | | — | % | $ | 9,306 | | 2.29 | % |
States and political subdivisions | |
| 265 | | 2.00 | |
| 1,014 | | 2.37 | |
| 6,150 | | 2.27 | |
| — | | — | |
| 7,429 | | 2.28 | |
Mortgage-backed GSE residential | |
| 583 | | 0.59 | |
| 765 | | 0.78 | |
| 34 | | 0.96 | |
| — | | — | |
| 1,382 | | 0.71 | |
Total securities available for sale | | $ | 848 | | 1.03 | % | $ | 11,085 | | 2.19 | % | $ | 6,184 | | 2.27 | % | $ | — | | — | % | $ | 18,117 | | 2.16 | % |
We have not used interest rate swaps or other derivative instruments to hedge fixed rate loans or securities to otherwise mitigate our interest rate risk.
Deposits
Deposits represent the Bank’s primary source of funds, and we gather deposits primarily through our branch locations. We offer a variety of deposit products including demand deposit accounts, interest-bearing products, savings accounts and certificate of deposits. We put continued effort into gathering noninterest-bearing demand deposits accounts through marketing to our existing and new loan customers, customer referrals, and expansion into new markets.
Total deposits increased $172.5 million, or 13.2%, to $1.48 billion at December 31, 2020 compared to $1.31 billion at December 31, 2019. As of December 31, 2020, 31.3% of total deposits were comprised of noninterest-bearing demand accounts and 68.7% of interest-bearing deposit accounts compared to 22.3% and 77.7% as of December 31, 2019, respectively. Total deposits increased $63.1 million, or 5.1%, at December 31, 2019 from $1.24 billion as of December 31, 2018. Our noninterest-bearing demand accounts were 24.0% of total deposits and our interest-bearing deposits accounted for the remaining 76.0% of our deposits as of December 31, 2018.
We had brokered deposits of $164.3 million, or 11.1% of total deposits, at December 31, 2020 compared to no brokered deposits at December 31, 2019 and $53.5 million, or 4.3% of total deposits, at December 31, 2018. We use brokered deposits, subject to certain limitations and requirements, as a source of funding to support our asset growth and
63
augment the deposits generated from our branch network, which are our principal source of funding. Our level of brokered deposits varies from time to time depending on competitive interest rate conditions and other factors and tends to increase as a percentage of total deposits when the brokered deposits are less costly than issuing internet certificates of deposit or borrowing from the Federal Home Loan Bank.
The following table summarizes our average deposit balances and weighted average rates for the years ended December 31, 2020, 2019 and 2018:
| | Year Ended December 31, | | |||||||||||||
| | 2020 | | 2019 | | 2018 | | |||||||||
| | | | | Weighted | | | | | Weighted | | | | | Weighted | |
| | Average | | Average | | Average | | Average | | Average | | Average | | |||
(Dollars in thousands) |
| Balance |
| Rate |
| Balance |
| Rate |
| Balance |
| Rate | | |||
Noninterest-bearing demand deposits | | $ | 394,338 | | — | % | $ | 297,174 | | — | % | $ | 284,702 | | — | % |
Interest-bearing demand deposits | | | 48,702 |
| 0.20 | | | 33,873 |
| 0.20 | | | 40,133 |
| 0.19 | |
Savings and money market deposits | |
| 250,605 | | 0.71 | |
| 151,308 |
| 1.87 | |
| 80,298 |
| 0.93 | |
Brokered money market deposits | | | 17,936 | | 0.12 | | | — | | — | | | — | | — | |
Time deposits | |
| 596,325 | | 1.51 | |
| 782,169 |
| 2.33 | |
| 663,654 |
| 1.76 | |
Brokered time deposits | | | — | | — | | | 34,129 | | 2.39 | | | 90,602 | | 1.68 | |
Total interest-bearing deposits | | | 913,568 | | 1.20 | | | 1,001,479 | | 2.19 | | | 874,687 | | 1.60 | |
Total deposits | | $ | 1,307,906 |
| 0.83 | % | $ | 1,298,653 |
| 1.69 | % | $ | 1,159,389 |
| 1.21 | % |
The following table sets forth the scheduled maturities of time deposits of $250,000 or greater as of December 31, 2020:
(Dollars in thousands) |
| December 31, 2020 | |
Remaining maturity: |
| |
|
Three months or less | | $ | 29,629 |
Over three through six months | |
| 46,553 |
Over six through twelve months | |
| 31,195 |
Over twelve months | |
| 3,748 |
Total time deposits $250,000 or greater | | $ | 111,125 |
Borrowed Funds
Other than deposits, the Company utilizes FHLB advances as a supplementary funding source to finance our operations. The advances from the FHLB are collateralized by residential and commercial real estate loans. At December 31, 2020 and 2019, we had $110.0 and $60.0 million, respectively, of outstanding advances from the FHLB.
The following table provides information related to our FHLB Advances for the periods indicated:
| | As of or for the Year Ended December 31, | | |||||||
(Dollars in thousands) |
| 2020 |
| 2019 |
| 2018 | | |||
Maximum amount outstanding at any month-end during the period | | $ | 110,000 | | $ | 60,000 | | $ | 135,000 | |
Balance outstanding at end of period | | | 110,000 | | | 60,000 | | | — | |
Average outstanding balance during the period | | | 82,500 | | | 28,333 | | | 32,500 | |
Weighted average interest rate during the period | | | 0.69 | % | | 0.95 | % | | 1.64 | % |
Weighted average interest rate at end of period | |
| 0.58 | |
| 0.75 | |
| — | |
In addition to our advances with the FHLB, we maintain federal funds agreements with our correspondent banks. Our available borrowings under these agreements were $47.5 million at December 31, 2020 and 2019. We did not have any advances outstanding under these agreements for any of the periods presented. We also have access to the Federal Reserve’s discount window in the amount of $10.0 million with no borrowings outstanding as of December 31, 2020 and
64
2019. We also maintain relationships in the capital markets with brokers to issue certificates of deposit and money market accounts.
Liquidity
Liquidity refers to the measure of our ability to meet the cash flow requirements of depositors and borrowers, while at the same time meeting our operating, capital and strategic cash flow needs, all at a reasonable cost. We continuously monitor our liquidity position to ensure that assets and liabilities are managed in a manner that will meet all short-term and long-term cash requirements. We manage our liquidity position to meet the daily cash flow needs of customers, while maintaining an appropriate balance between assets and liabilities to meet the return on investment objectives of our shareholders.
Our liquidity position is supported by management of liquid assets and access to alternative sources of funds. Our liquid assets include cash, interest-bearing deposits in correspondent banks, federal funds sold, and fair value of unpledged investment securities. Other available sources of liquidity include wholesale deposits, and additional borrowings from correspondent banks, FHLB advances, and the Federal Reserve discount window.
Our short-term and long-term liquidity requirements are primarily met through cash flow from operations, redeployment of prepaying and maturing balances in our loan and investment portfolios, and increases in customer deposits. Other alternative sources of funds will supplement these primary sources to the extent necessary to meet additional liquidity requirements on either a short-term or long-term basis.
As part of our liquidity management strategy, we open federal funds lines with our correspondent banks. As of December 31, 2020 and 2019, we had $47.5 million of unsecured federal funds lines with no amounts advanced. In addition, we have access to the Federal Reserve’s discount window in the amount of $10.0 million with no borrowings outstanding as of December 31, 2020 and 2019. The Federal Reserve discount window line is collateralized by a pool of commercial real estate loans and commercial and industrial loans.
At December 31, 2020 and 2019, we had $110.0 million and $60.0 million, respectively, of outstanding advances from the FHLB. Based on the values of commercial real estate and residential mortgage loans pledged as collateral, we had $412.8 million and $434.4 million of additional borrowing availability with the FHLB as of December 31, 2020 and 2019, respectively. We also maintain relationships in the capital markets with brokers to issue certificates of deposit and money market accounts.
Capital Requirements
The Bank is required under federal law to maintain certain minimum capital levels based on ratios of capital to total assets and capital to risk-weighted assets. The required capital ratios are minimums, and the federal banking agencies may determine that a banking organization, based on its size, complexity or risk profile, must maintain a higher level of capital in order to operate in a safe and sound manner. Risks such as concentration of credit risks and the risk arising from non-traditional activities, as well as the institution’s exposure to a decline in the economic value of its capital due to changes in interest rates, and an institution’s ability to manage those risks are important factors that are to be taken into account by the federal banking agencies in assessing an institution’s overall capital adequacy. For more information, see “Item 1. Business – Regulation and Supervision – Regulation of the Company – Capital Requirements.”
65
The table below summarizes the capital requirements applicable to the Bank in order to be considered “well-capitalized” from a regulatory perspective, as well as the Bank’s capital ratios as of December 31, 2020 and 2019. The Bank exceeded all regulatory capital requirements and was considered to be “well-capitalized” as of December 31, 2020 and 2019. As of December 31, 2020, the FDIC categorized the Bank as well-capitalized under the prompt corrective action framework. There have been no conditions or events since December 31, 2020 that management believes would change this classification. While the Company believes that it has sufficient capital to withstand an extended economic recession brought about by COVID-19, its reported and regulatory capital ratios could be adversely impacted in future periods.
| | | | | | | | | To Be Well Capitalized |
| ||||
| | | | | | | Minimum Capital Required | | Under Prompt Corrective |
| ||||
(Dollars in thousands) | | Actual | | Basel III | | Action Provisions: |
| |||||||
|
| Amount |
| Ratio |
| Amount ≥ |
| Ratio ≥ |
| Amount ≥ |
| Ratio ≥ |
| |
As of December 31, 2020 | | | | | | | | | | | | | | |
Total Capital (to Risk Weighted Assets) | | | | | | | | | | | | | | |
Consolidated | | $ | 245,128 |
| 20.86 | % | N/A | | N/A | | N/A |
| N/A | |
Bank | |
| 229,493 |
| 19.54 | % | 123,314 |
| 10.50 | % | 117,442 |
| 10.00 | % |
Tier I Capital (to Risk Weighted Assets) | | | | | | | | | | | | | | |
Consolidated | |
| 234,993 |
| 20.00 | % | N/A | | N/A | | N/A |
| N/A | |
Bank | |
| 219,357 |
| 18.68 | % | 99,826 |
| 8.50 | % | 93,954 |
| 8.00 | % |
Common Tier 1 (CET1) | | | | | | | | | | | | | | |
Consolidated | |
| 234,993 |
| 20.00 | % | N/A | | N/A | | N/A |
| N/A | |
Bank | |
| 219,357 |
| 18.68 | % | 82,209 |
| 7.00 | % | 76,337 |
| 6.50 | % |
Tier 1 Capital (to Average Assets) | | | | | | | | | | | | | | |
Consolidated | |
| 234,993 |
| 13.44 | % | N/A | | N/A | | N/A |
| N/A | |
Bank | |
| 219,357 |
| 12.55 | % | 69,937 |
| 4.00 | % | 87,421 |
| 5.00 | % |
As of December 31, 2019 | | | | | | | | | | | | | | |
Total Capital (to Risk Weighted Assets) | | | | | | | | | | | | | | |
Consolidated | | $ | 215,377 |
| 22.01 | % | N/A | | N/A | | N/A |
| N/A | |
Bank | |
| 199,539 |
| 20.40 | % | 102,705 |
| 10.50 | % | 97,814 |
| 10.00 | % |
Tier I Capital (to Risk Weighted Assets) | | | | | | | | | | | | | | |
Consolidated | |
| 208,538 |
| 21.31 | % | N/A | | N/A | | N/A |
| N/A | |
Bank | |
| 192,700 |
| 19.70 | % | 83,142 |
| 8.50 | % | 78,251 |
| 8.00 | % |
Common Tier 1 (CET1) | | | | | | | | | | | | | | |
Consolidated | |
| 208,538 |
| 21.31 | % | N/A | | N/A | | N/A |
| N/A | |
Bank | |
| 192,700 |
| 19.70 | % | 68,470 |
| 7.00 | % | 63,579 |
| 6.50 | % |
Tier 1 Capital (to Average Assets) | | | | | | | | | | | | | | |
Consolidated | |
| 208,538 |
| 12.70 | % | N/A | | N/A | | N/A |
| N/A | |
Bank | |
| 192,700 |
| 11.74 | % | 65,655 |
| 4.00 | % | 82,069 |
| 5.00 | % |
66
Contractual Obligations
The following table presents supplemental information regarding total contractual obligations as of December 31, 2020:
| | Payments Due by Period at December 31, 2020 | |||||||||||||
(Dollars in thousands) |
| Less than 1 Year |
| 1-3 Years |
| 3-5 Years |
| More than 5 Years |
| Total | |||||
Deposits without a stated maturity | | $ | 1,002,288 | | $ | — | | $ | — | | $ | — | | $ | 1,002,288 |
Time deposits | |
| 462,883 | |
| 12,740 | |
| 1,978 | |
| — | |
| 477,601 |
FHLB advances | | | 30,000 | | | — | | | — | | | 80,000 | | | 110,000 |
Operating lease liabilities | |
| 1,587 | | | 3,377 | |
| 3,139 | |
| 2,807 | |
| 10,910 |
Total contractual obligations | | $ | 1,496,758 | | $ | 16,117 | | $ | 5,117 | | $ | 82,807 | | $ | 1,600,799 |
We believe that we will be able to meet our contractual obligations as they come due through the maintenance of adequate cash levels. We expect to maintain adequate cash levels through profitability, loan and securities repayment and maturity activity and continued deposit gathering activities. We have in place various borrowing mechanisms for both short-term and long-term liquidity needs.
Off-Balance Sheet Arrangements
We are a party to financial instruments with off-balance sheet risk in the normal course of business to meet the financing needs of our customers. These financial instruments include commitments to extend credit and standby letters of credit. Those instruments involve, to varying degrees, elements of credit and interest rate risk in excess of the amount recognized in our consolidated balance sheet. The contractual or notional amounts of those instruments reflect the extent of involvement we have in particular classes of financial instruments.
Commitments to extend credit are agreements to lend to a customer as long as there is no violation of any condition established in the contract. Commitments generally have fixed expiration dates or other termination clauses and may require payment of a fee. Since many of the commitments are expected to expire without being drawn upon, the total commitment amount does not necessarily represent future cash requirements. We evaluate each customer’s creditworthiness on a case-by-case basis. The amount of collateral obtained, if we deem collateral is necessary upon extension of credit, is based on management’s credit evaluation of the counterparty.
Standby letters of credit are conditional commitments issued by us to guarantee the performance of a customer to a third party. They are intended to be disbursed, subject to certain condition, upon request of the borrower.
The following table presents outstanding financial commitments whose contractual amount represents credit risks as of the dates indicated:
|
| December 31, | ||||
(Dollars in thousands) |
| 2020 |
| 2019 | ||
Commitments to extend credit |
| $ | 51,457 | | $ | 64,243 |
Standby letters of credit | | | 5,050 | | | 5,213 |
Total off-balance sheet commitments | | $ | 56,507 | | $ | 69,456 |
Item 7A. Quantitative and Qualitative Disclosures About Market Risk
Market Risk
Market risk represents the risk of loss due to changes in market values of assets and liabilities. We incur market risk in the normal course of business through exposures to market interest rates, equity prices, and credit spreads. We have identified interest rate risk as our primary source of market risk.
67
Interest Rate Risk
Interest rate risk is the risk to earnings and value arising from changes in market interest rates. Interest rate risk arises from timing differences in the repricings and maturities of interest-earning assets and interest-bearing liabilities (repricing risk), changes in the expected maturities of assets and liabilities arising from embedded options, such as borrowers’ ability to prepay home mortgage loans at any time and depositors’ ability to redeem certificates of deposit before maturity (option risk), changes in the shape of the yield curve where interest rates increase or decrease in a nonparallel fashion (yield curve risk), and changes in spread relationships between different yield curves, such as U.S. Treasuries and LIBOR (basis risk).
Our board of directors establishes broad policy limits with respect to interest rate risk. As part of this policy the asset liability committee, or ALCO, establishes specific operating guidelines within the parameters of the board of directors’ policies. In general, the ALCO focuses on ensuring a stable and steadily increasing flow of net interest income through managing the size and mix of the balance sheet. The management of interest rate risk is an active process which encompasses monitoring loan and deposit flows complemented by investment and funding activities. Effective management of interest rate risk begins with understanding the dynamic characteristics of assets and liabilities and determining the appropriate interest rate risk posture given business forecasts, management objectives, market expectations, and policy constraints.
An asset sensitive position refers to a balance sheet position in which an increase in short-term interest rates is expected to generate higher net interest income, as rates earned on our interest-earning assets would reprice upward more quickly than rates paid on our interest-bearing liabilities, thus expanding our net interest margin. Conversely, a liability sensitive position refers to a balance sheet position in which an increase in short-term interest rates is expected to generate lower net interest income, as rates paid on our interest-bearing liabilities would reprice upward more quickly than rates earned on our interest-earning assets, thus compressing our net interest margin.
Interest rate risk measurement is calculated and reported to the ALCO at least quarterly. The information reported includes period-end results and identifies any policy limits exceeded, along with an assessment of the policy limit breach and the action plan and timeline for resolution, mitigation, or assumption of the risk.
Evaluation of Interest Rate Risk
We use income simulations, an analysis of core funding utilization, and economic value of equity (EVE) simulations as our primary tools in measuring and managing IRR. These tools are utilized to quantify the potential earnings impact of changing interest rates over a two year simulation horizon (income simulations) as well as identify expected earnings trends given longer term rate cycles (long term simulations, core funding utilizations, and EVE simulation). A standard gap report and funding matrix will also be utilized to provide supporting detailed information on the expected timing of cashflow and repricing opportunities.
There are an infinite number of potential interest rate scenarios, each of which can be accompanied by differing economic/political/regulatory climates; can generate multiple differing behavior patterns by markets, borrowers, depositors, etc.; and, can last for varying degrees of time. Therefore, by definition, interest rate risk sensitivity cannot be predicted with certainty. Accordingly, the Bank’s interest rate risk measurement philosophy focuses on maintaining an appropriate balance between theoretical and practical scenarios; especially given the primary objective of the Bank’s overall asset/liability management process is to facilitate meaningful strategy development and implementation.
Therefore, we model a set of interest rate scenarios capturing the financial effects of a range of plausible rate scenarios, the collective impact of which will enable the Bank to clearly understand the nature and extent of its sensitivity to interest rate changes. Doing so necessitates an assessment of rate changes over varying time horizons and of varying/sufficient degrees such that the impact of embedded options within the balance sheet are sufficiently examined.
We use a net interest income simulation model to measure and evaluate potential changes in our net interest income. We run three standard and plausible comparing current or flat rates with a +/- 200 basis point ramp in rates over 12 months. These rate scenarios are considered appropriate as they are neither too modest (e.g. +/- 100 basis points) or too
68
extreme (e.g. +/- 400 basis points) given the economic and rate cycles which have unfolded in the last 25 years. This analysis also provides the foundation for historical tracking of interest rate risk.
Potential changes to our net interest income in hypothetical rising and declining rate scenarios calculated as of December 31, 2020, 2019 and 2018 are presented in the following table:
| | Net Interest Income Sensitivity |
| ||||||
| | 12 Month Projection | | 24 Month Projection | | ||||
(Shock in basis points) |
| +200 |
| -100 |
| +200 |
| -100 |
|
December 31, 2020 |
| 1.90 | % | 0.50 | % | (2.00) | % | (7.10) | % |
December 31, 2019 |
| 5.00 | % | (1.30) | % | 6.10 | % | (1.30) | % |
December 31, 2018 |
| 4.53 | % | (3.12) | % | 2.07 | % | (5.68) | % |
We also model the impact of rate changes on our Economic Value of Equity, or EVE. We base the modeling of EVE based on interest rate shocks as shocks are considered more appropriate for EVE, which accelerates future interest rate risk into current capital via a present value calculation of all future cashflows from the bank’s existing inventory of assets and liabilities. Our simulation model incorporates interest rate shocks of +/- 100, 200, and 300 basis points. The results of the model are presented in the table below:
| | Economic Value of Equity Sensitivity |
| ||||||
(Shock in basis points) |
| +300 |
| +200 |
| +100 |
| -100 |
|
December 31, 2020 | | 3.90 | % | 4.20 | % | 2.60 | % | (10.30) | % |
December 31, 2019 |
| 3.40 | % | 4.20 | % | 3.50 | % | (3.10) | % |
December 31, 2018 | | (2.70) | % | (0.10) | % | 1.20 | % | (3.00) | % |
Our simulation model incorporates various assumptions, which we believe are reasonable but which may have a significant impact on results such as: (i) the timing of changes in interest rates; (ii) shifts or rotations in the yield curve; (iii) re-pricing characteristics for market-rate-sensitive instruments; (iv) varying loan prepayment speeds for different interest rate scenarios; and (v) the overall growth and mix of assets and liabilities. Because of limitations inherent in any approach used to measure interest rate risk, simulation results are not intended as a forecast of the actual effect of a change in market interest rates on our results but rather as a means to better plan and execute appropriate asset-liability management strategies and manage our interest rate risk.
In addition to interest rate risk, the recent COVID-19 pandemic and the related stay-at-home and self-distancing mandates will likely expose us to additional market value risk. Protracted closures, furloughs and lay-offs have curtailed economic activity, and will likely continue to curtail economic activity and could result in lower fair values for collateral in our loan portfolio.
69
Item 8. Financial Statements and Supplementary Data
70
Report of Independent Registered Public Accounting Firm
Shareholders and the Board of Directors of MetroCity Bankshares, Inc.
Doraville, Georgia
Opinion on the Financial Statements
We have audited the accompanying consolidated balance sheets of MetroCity Bankshares, Inc. and subsidiary (the "Company") as of December 31, 2020 and 2019, the related consolidated statements of income, comprehensive income, changes in shareholders’ equity, and cash flows for each of the three years in the period ended December 31, 2020, and the related notes (collectively referred to as the “financial statements”). In our opinion, the financial statements present fairly, in all material respects, the financial position of the Company as of December 31, 2020 and 2019, and the results of its operations and its cash flows for each of the three years in the period ended December 31, 2020, in conformity with accounting principles generally accepted in the United States of America.
Basis for Opinion
These financial statements are the responsibility of the Company’s management. Our responsibility is to express an opinion on the Company’s financial statements based on our audits. We are a public accounting firm registered with the Public Company Accounting Oversight Board (United States) (“PCAOB”) and are required to be independent with respect to the Company in accordance with the U.S. federal securities laws and the applicable rules and regulations of the Securities and Exchange Commission and the PCAOB.
We conducted our audits in accordance with the standards of the PCAOB. Those standards require that we plan and perform the audit to obtain reasonable assurance about whether the financial statements are free of material misstatement, whether due to error or fraud. Our audits included performing procedures to assess the risks of material misstatement of the financial statements, whether due to error or fraud, and performing procedures that respond to those risks. Such procedures included examining, on a test basis, evidence regarding the amounts and disclosures in the financial statements. Our audits also included evaluating the accounting principles used and significant estimates made by management, as well as evaluating the overall presentation of the financial statements. We believe that our audits provide a reasonable basis for our opinion.
/s/ Crowe LLP
We have served as the Company’s auditor since 2014.
Atlanta, Georgia
March 15, 2021
71
CONSOLIDATED BALANCE SHEETS
(Dollars in thousands, except per share data)
| | December 31, | | December 31, | ||
|
| 2020 |
| 2019 | ||
| | | | | | |
Assets: |
| | |
| |
|
Cash and due from banks | | $ | 140,744 | | $ | 270,496 |
Federal funds sold | |
| 9,944 | |
| 5,917 |
Cash and cash equivalents | |
| 150,688 | |
| 276,413 |
Securities purchased under agreements to resell | |
| — | |
| 15,000 |
Securities available for sale (at fair value) | |
| 18,117 | |
| 15,695 |
Loans held for sale | |
| — | |
| 85,793 |
Loans, less allowance for loan losses of $10,135 and $6,839, respectively | |
| 1,620,209 | |
| 1,154,323 |
Accrued interest receivable | |
| 10,671 | |
| 5,101 |
Federal Home Loan Bank stock | |
| 6,147 | |
| 3,842 |
Premises and equipment, net | |
| 13,854 | |
| 14,460 |
Operating lease right-of-use asset | |
| 10,348 | |
| 11,957 |
Foreclosed real estate, net | | | 3,844 | | | 423 |
SBA and USDA servicing asset, net | |
| 9,643 | |
| 8,188 |
Mortgage servicing asset, net | |
| 12,991 | |
| 18,068 |
Bank owned life insurance | |
| 35,806 | |
| 20,219 |
Other assets | |
| 5,171 | |
| 2,376 |
Total assets | | $ | 1,897,489 | | $ | 1,631,858 |
| | | | | | |
| | | | | | |
Liabilities: | |
|
| |
|
|
Deposits: | |
|
| |
|
|
Non interest-bearing demand | | $ | 462,909 | | $ | 292,008 |
Interest-bearing | |
| 1,016,980 | |
| 1,015,369 |
Total deposits | |
| 1,479,889 | |
| 1,307,377 |
| | | | | | |
Federal Home Loan Bank advances | | | 110,000 | | | 60,000 |
Other borrowings | |
| 483 | |
| 3,129 |
Operating lease liability | |
| 10,910 | |
| 12,476 |
Accrued interest payable | |
| 222 | |
| 890 |
Other liabilities | |
| 51,154 | |
| 31,262 |
Total liabilities | |
| 1,652,658 | |
| 1,415,134 |
| | | | | | |
Shareholders' Equity: | |
|
| |
|
|
Preferred stock, $0.01 par value, 10,000,000 shares authorized, no shares issued or outstanding | | | — | | | — |
Common stock, $0.01 par value, 40,000,000 shares authorized, 25,674,573 and 25,529,891 shares issued and outstanding | | | 257 | | | 255 |
Additional paid-in capital | |
| 55,674 | |
| 53,854 |
Retained earnings | |
| 188,705 | |
| 162,616 |
Accumulated other comprehensive income (loss) | |
| 195 | |
| (1) |
Total shareholders' equity | |
| 244,831 | |
| 216,724 |
Total liabilities and shareholders' equity | | $ | 1,897,489 | | $ | 1,631,858 |
See accompanying notes to audited consolidated financial statements.
72
CONSOLIDATED STATEMENTS OF INCOME
(Dollars in thousands, except per share data)
| | Years Ended December 31, | |||||||
|
| 2020 |
| 2019 |
| 2018 | |||
Interest and dividend income: | | | | |
| | |
| |
Loans, including fees | | $ | 75,872 | | $ | 79,338 | | $ | 70,246 |
Other investment income | |
| 1,429 | |
| 3,294 | |
| 2,169 |
Federal funds sold | |
| 308 | |
| 581 | |
| 464 |
Total interest income | |
| 77,609 | |
| 83,213 | |
| 72,879 |
| | | | | | | | | |
Interest expense: | | | | | | | | | |
Deposits | |
| 10,918 | |
| 21,951 | |
| 14,011 |
FHLB advances and other borrowings | |
| 571 | |
| 287 | |
| 664 |
Total interest expense | |
| 11,489 | |
| 22,238 | |
| 14,675 |
| | | | | | | | | |
Net interest income | |
| 66,120 | |
| 60,975 | |
| 58,204 |
| | | | | | | | | |
Provision for loan losses | |
| 3,467 | |
| — | |
| 1,237 |
| | | | | | | | | |
Net interest income after provision for loan losses | |
| 62,653 | |
| 60,975 | |
| 56,967 |
| | | | | | | | | |
Noninterest income: | | | | | | | | | |
Service charges on deposit accounts | |
| 1,312 | |
| 1,462 | |
| 1,386 |
Other service charges, commissions and fees | |
| 8,545 | |
| 10,121 | |
| 10,107 |
Gain on sale of residential mortgage loans | |
| 2,529 | |
| 9,141 | |
| 5,679 |
Mortgage servicing income, net | |
| 1,308 | |
| 9,294 | |
| 11,994 |
Gain on sale of SBA loans | |
| 6,467 | |
| 5,444 | |
| 4,616 |
SBA servicing income, net | |
| 6,130 | |
| 3,745 | |
| 3,119 |
Other income | |
| 920 | |
| 689 | |
| 745 |
Total noninterest income | |
| 27,211 | |
| 39,896 | |
| 37,646 |
| | | | | | | | | |
Noninterest expense: | | | | | | | | | |
Salaries and employee benefits | |
| 25,500 | |
| 24,923 | |
| 23,569 |
Occupancy and equipment | |
| 5,083 | |
| 4,749 | |
| 4,086 |
Data processing | |
| 1,078 | |
| 1,029 | |
| 842 |
Advertising | |
| 566 | |
| 649 | |
| 613 |
Other expenses | |
| 8,873 | |
| 8,653 | |
| 9,502 |
Total noninterest expense | |
| 41,100 | |
| 40,003 | |
| 38,612 |
| | | | | | | | | |
Income before provision for income taxes | |
| 48,764 | |
| 60,868 | |
| 56,001 |
Provision for income taxes | |
| 12,370 | |
| 16,150 | |
| 14,667 |
Net income | | $ | 36,394 | | $ | 44,718 | | $ | 41,334 |
| | | | | | | | | |
Earnings per share: | | | | | | | | | |
Basic | | $ | 1.42 | | $ | 1.82 | | $ | 1.71 |
Diluted | | $ | 1.41 | | $ | 1.81 | | $ | 1.69 |
See accompanying notes to audited consolidated financial statements.
73
CONSOLIDATED STATEMENTS OF COMPREHENSIVE INCOME
(Dollars in thousands)
| | Years Ended December 31, | |||||||
|
| 2020 |
| 2019 |
| 2018 | |||
| | | | | | | | | |
Net income | | $ | 36,394 | | $ | 44,718 | | $ | 41,334 |
| | | | | | | | | |
Other comprehensive income (loss): | |
|
| |
|
| |
|
|
| | | | | | | | | |
Unrealized holding gains (losses) on securities available for sale arising during the period | |
| 263 | |
| 148 | |
| (46) |
Tax effect | |
| (67) | |
| (45) | |
| (3) |
| | | | | | | | | |
Other comprehensive income (loss) | |
| 196 | |
| 103 | |
| (49) |
| | | | | | | | | |
Comprehensive income | | $ | 36,590 | | $ | 44,821 | | $ | 41,285 |
See accompanying notes to audited consolidated financial statements.
74
CONSOLIDATED STATEMENTS OF SHAREHOLDERS’ EQUITY
(Dollars in thousands, except per share data)
| | | | | | | | | | | | | Accumulated | | | | |
| | Common Stock | | Additional | | | | | Other | | | | |||||
| | Number of | | | | | Paid-in | | Retained | | Comprehensive | | | | |||
|
| Shares |
| Amount |
| Capital |
| Earnings |
| Income (Loss) |
| Total | |||||
Balance, January 1, 2018 |
| 24,074,882 | | $ | 240 | | $ | 38,418 | | $ | 96,525 | | $ | (68) | | $ | 135,115 |
Net income | | — | |
| — | | | — | |
| 41,334 | |
| — | |
| 41,334 |
Stock based compensation expense |
| — | |
| — | |
| 1,499 | |
| — | |
| — | |
| 1,499 |
Vesting of restricted stock |
| 183,180 | |
| 2 | | | (2) | | | — | |
| — | |
| — |
Impact of adoption of new accounting standard(1) | | — | |
| — | | | — | |
| (13) | |
| 13 | |
| — |
Other comprehensive loss | | — | |
| — | | | — | |
| — | |
| (49) | |
| (49) |
Dividends declared on common stock ($0.38 per share) | | — | |
| — | | | — | |
| (9,291) | |
| — | |
| (9,291) |
Balance, December 31, 2018 |
| 24,258,062 | | $ | 242 | | $ | 39,915 | | $ | 128,555 | | $ | (104) | | $ | 168,608 |
Net income | | — | |
| — | | | — | |
| 44,718 | |
| — | |
| 44,718 |
Stock based compensation expense |
| — | |
| — | |
| 1,526 | |
| — | |
| — | |
| 1,526 |
Vesting of restricted stock | | 157,316 | |
| 2 | |
| (2) | |
| — | |
| — | |
| — |
Repurchase and retirement of common stock | | (110,000) | |
| (1) | |
| (1,484) | |
| — | |
| — | |
| (1,485) |
Issuance of common stock through IPO, net of exepnses of $1.6 million |
| 1,224,513 | | | 12 | | | 13,899 | | | — | | | — | | | 13,911 |
Impact of adoption of new accounting standard(2) | | — | |
| — | | | — | |
| (255) | |
| — | |
| (255) |
Other comprehensive income | | — | |
| — | | | — | |
| — | |
| 103 | |
| 103 |
Dividends declared on common stock ($0.42 per share) | | — | |
| — | | | — | |
| (10,402) | |
| — | |
| (10,402) |
Balance, December 31, 2019 |
| 25,529,891 | | $ | 255 | | $ | 53,854 | | $ | 162,616 | | $ | (1) | | $ | 216,724 |
Net income |
| — | |
| — | | | — | |
| 36,394 | |
| — | |
| 36,394 |
Stock based compensation expense |
| — | |
| — | |
| 1,822 | |
| — | |
| — | |
| 1,822 |
Vesting of restricted stock |
| 144,682 | |
| 2 | |
| (2) | |
| — | |
| — | |
| — |
Other comprehensive income |
| — | |
| — | | | — | |
| — | |
| 196 | |
| 196 |
Dividends declared on common stock ($0.40 per share) |
| — | |
| — | | | — | |
| (10,305) | |
| — | |
| (10,305) |
Balance, December 31, 2020 |
| 25,674,573 | | $ | 257 | | $ | 55,674 | | $ | 188,705 | | $ | 195 | | $ | 244,831 |
| (1) | Represents the impact of the adoption of Accounting Standards Update ("ASU") No. 2018-02: Income Statement - Reporting Comprehensive Income (Topic 220) |
| (2) | Represents the impact of the adoption of Accounting Standards Update ("ASU") No. 2016-02: Leases |
See accompanying notes to audited consolidated financial statements.
75
CONSOLIDATED STATEMENTS OF CASH FLOWS
(Dollars in thousands)
| | Years Ended December 31, | |||||||
|
| 2020 |
| 2019 |
| 2018 | |||
Cash flow from operating activities: |
| |
|
| |
|
| |
|
Net income | | $ | 36,394 | | $ | 44,718 | | $ | 41,334 |
Adjustments to reconcile net income to net cash provided (used) by operating activities: | | | | | | | | | |
Depreciation, amortization and accretion | |
| 2,929 | |
| 2,718 | |
| 899 |
Provision for loan losses | |
| 3,467 | |
| — | |
| 1,237 |
Stock based compensation expense | |
| 1,822 | |
| 1,526 | |
| 1,499 |
Gain on sale of foreclosed real estate | |
| (99) | |
| — | |
| (36) |
Writedown of foreclosed real estate | | | 141 | | | — | | | — |
Deferred income tax (benefit) expense | | | (1,950) | | | 1,088 | | | 355 |
Origination of residential real estate loans held for sale | |
| (6,992) | |
| (549,185) | |
| (716,140) |
Proceeds from sales of residential real estate loans | |
| 95,314 | |
| 529,398 | |
| 541,690 |
Gain on sale of residential mortgages | |
| (2,529) | |
| (9,141) | |
| (5,679) |
Origination of SBA loans held for sale | |
| (137,374) | |
| (121,347) | |
| (121,009) |
Proceeds from sales of SBA loans held for sale | |
| 143,841 | |
| 126,791 | |
| 97,957 |
Gain on sale of SBA loans | |
| (6,467) | |
| (5,444) | |
| (4,616) |
Increase in cash value of bank owned life insurance | |
| (587) | |
| (470) | |
| (478) |
Increase in accrued interest receivable | |
| (5,570) | |
| (144) | |
| (201) |
(Increase) decrease in SBA servicing rights | |
| (1,455) | |
| 258 | |
| 920 |
Decrease (increase) in mortgage servicing rights | |
| 5,077 | |
| (3,134) | |
| (8,091) |
(Increase) decrease in other assets | |
| (2,861) | |
| 480 | |
| 2,644 |
(Decrease) increase in accrued interest payable | |
| (668) | |
| (361) | |
| 850 |
Increase in other liabilities | |
| 20,125 | |
| 14,448 | |
| 5,874 |
Net cash flow provided (used) by operating activities | |
| 142,558 | |
| 32,199 | |
| (160,991) |
| | | | | | | | | |
Cash flow from investing activities: | |
|
| |
|
| |
|
|
Redemption of securities under resell agreements | | | 15,000 | | | — | | | — |
Purchases of securities available for sale | | | (5,952) | | | — | | | — |
Proceeds from maturities, calls or paydowns of securities available for sale | |
| 3,746 | |
| 3,304 | |
| 2,075 |
(Purchase) redemption of Federal Home Loan Bank stock | |
| (2,305) | |
| (2,679) | |
| 4,929 |
(Increase) decrease in loans, net | | | (474,275) | |
| (17,816) | |
| 104,354 |
Purchases of premises and equipment | |
| (537) | |
| (1,098) | |
| (2,855) |
Proceeds from sales of foreclosed real estate owned | | | 1,459 | | | — | | | 907 |
Purchase of bank owned life insurance | |
| (15,000) | |
| — | |
| — |
Net cash flow (used) provided by investing activities | |
| (477,864) | |
| (18,289) | |
| 109,410 |
| | | | | | | | | |
Cash flow from financing activities: | |
|
| |
|
| |
|
|
Increase in deposits, net | |
| 172,512 | |
| 63,145 | |
| 224,248 |
Proceeds (repayments) from Federal Home Loan Bank advances | |
| 50,000 | |
| 60,000 | |
| (120,000) |
Decrease in other borrowings, net | |
| (2,646) | |
| (1,128) | |
| (782) |
Issuance of common stock, net of expenses | | | — | | | 13,911 | | | — |
Repurchase of common stock | |
| — | |
| (1,485) | |
| — |
Dividends paid on common stock | |
| (10,285) | |
| (10,367) | |
| (9,291) |
Net cash flow provided by financing activities | |
| 209,581 | |
| 124,076 | |
| 94,175 |
See accompanying notes to audited consolidated financial statements.
76
METROCITY BANKSHARES, INC.
CONSOLIDATED STATEMENTS OF CASH FLOWS
(Dollars in thousands)
| | Years Ended December 31, | |||||||
|
| 2020 |
| 2019 |
| 2018 | |||
| | | | | | | | | |
Net change in cash and cash equivalents |
| | (125,725) |
| | 137,986 |
| | 42,594 |
Cash and cash equivalents at beginning of period |
| | 276,413 |
| | 138,427 |
| | 95,833 |
| | | | | | | | | |
Cash and cash equivalents at end of period | | $ | 150,688 | | $ | 276,413 | | $ | 138,427 |
| | | | | | | | | |
Supplemental schedule of noncash investing and financing activities: | | | | | | | | | |
| | | | | | | | | |
Transfer of loan principal to foreclosed real estate, net of write-downs | | $ | 4,922 | | $ | 423 | | $ | 261 |
| | | | | | | | | |
Initial recognition of operating lease right-of-use assets | | $ | 131 | | $ | 13,610 | | $ | — |
| | | | | | | | | |
Initial recognition of operating lease liabilities | | $ | 131 | | $ | 14,011 | | $ | — |
| | | | | | | | | |
Supplemental disclosures of cash flow information - Cash paid during the year for: | | | | | | | | | |
| | | | | | | | | |
Interest | | $ | 12,157 | | $ | 22,599 | | $ | 13,825 |
| | | | | | | | | |
Income taxes | | $ | 14,771 | | $ | 12,490 | | $ | 10,400 |
See accompanying notes to audited consolidated financial statements.
77
NOTES TO CONSOLIDATED FINANCIAL STATEMENTS
DECEMBER 31, 2020
NOTE 1 – SIGNIFICANT ACCOUNTING POLICIES
Nature of Operations
MetroCity Bankshares, Inc. (the “Company”) was formed for the sole purpose of owning and operating its wholly owned subsidiary, Metro City Bank (the “Bank”). The Company acquired all of the outstanding common stock of the Bank in a holding company formation transaction on December 31, 2014. The Bank is a Georgia state chartered bank and commenced operations in 2006. The Bank’s main office is located in Doraville, Georgia, and it operates branches in Alabama, Florida, Georgia, New York, New Jersey, Texas and Virginia. The main emphasis of the Bank is on commercial banking and it offers such customary banking services as consumer and commercial checking accounts, savings accounts, certificates of deposit, commercial and consumer loans, including single family residential loans, money transfers and a variety of other banking services. The Company is subject to the regulations of Federal and State banking agencies and is periodically examined by them.
In October 2019, the Company completed the initial public offering of its common stock pursuant to a registration statement on Form S-1 (File No. 333-233625), which was declared effective by the SEC on October 2, 2019. The Company sold 1,224,513 shares of its common stock at a public offering price of $13.50 per share in the offering, including 224,513 shares sold pursuant to the exercise of the underwriters’ option to purchase additional shares on October 30, 2019, for an aggregate price of approximately $16.5 million and certain selling stockholders sold 939,000 shares in the offering. The Company received net proceeds of approximately $13.9 million, after deducting underwriting discounts and commissions of approximately $1.1 million and expenses of approximately $1.6 million.
Basis of Presentation
The consolidated financial statements include the accounts of the Company and its wholly-owned subsidiary. All intercompany accounts and transactions have been eliminated in consolidation. The Company’s accounting and reporting policies conform to accounting principles generally accepted in the United States of America (“GAAP”) and with general practices within the financial services industry. Certain prior period amounts have been reclassified to conform to the current year presentation. The Company has evaluated subsequent events for recognition and disclosure through the date these consolidated financial statements were issued.
On August 30, 2019, the Company effected a 2-for-1 common stock split, as approved by the Company’s Board of Directors. Common stock and per share data included in these financial statements have been restated to reflect this stock split.
Use of Estimates
The preparation of financial statements in conformity with GAAP requires management to make estimates and assumptions that affect the reported amounts of assets and liabilities and disclosure of contingent assets and liabilities at the date of the financial statements and the reported amounts of revenues and expenses during the reporting period. Actual results could differ significantly from those estimates.
Significant Group Concentrations of Credit Risk
A substantial portion of the Company’s loan portfolio is to customers in the Atlanta, Georgia and New York, New York metropolitan areas. The ultimate collectability of a substantial portion of the portfolio is therefore susceptible to changes in the economic and market condition in and around this area.
The nature of the Company’s business requires that it maintain amounts due from banks, which at times may exceed federally insured limits. The Company has not experienced any losses in such accounts.
78
Cash and Cash Equivalents
For purposes of presentation in the statement of cash flows, cash and cash equivalents are defined as those amounts included in the balance sheet caption “cash and due from banks,” which includes cash on hand, cash items in process of collection, and amounts due from banks. Cash flows from loans, federal funds sold, other borrowings, and deposits are reported net.
Cash on hand or on deposit with the Federal Reserve Bank was required to meet regulatory reserve and clearing requirements. These amounts were $0 and $16.4 million as of December 31, 2020 and 2019, respectively and are included in Cash and Due from Banks.
Securities Purchased Under Agreements to Resell
The Company enters into purchases of securities under agreements to resell substantially identical securities. Securities purchased under agreements to resell consist of U.S. Treasury securities. The amounts advanced under these agreements are reflected as assets. It is the Company’s policy to take possession of securities purchased under agreements to resell. Agreements with third parties specify the Company’s rights to request additional collateral, based on its monitoring of the fair value of the underlying securities on a daily basis. The securities are delivered by appropriate entry into the Company’s account maintained at the Federal Reserve Bank or into a third-party custodian’s account designated under a written custodial agreement that explicitly recognizes the Company’s interest in the securities. These agreements renew monthly until cancelled.
Investment Securities
Debt securities that management has the intent and ability to hold to maturity are classified as securities held to maturity and are recorded at amortized cost. Securities not classified as securities held to maturity, including equity securities with readily, determinable fair values, are securities available for sale and recorded at fair value, with unrealized gains and losses excluded from earnings and reported in other comprehensive income (loss), net of the related tax effect. There were no held to maturity or trading securities at December 31, 2020 and 2019.
Purchase premiums and discounts are recognized in interest income using methods approximating the interest method over the terms of the securities. A decline in the market value of any available for sale or held to maturity security below cost that is deemed other than temporary results in a charge to earnings and the establishment of a new cost basis for the security. The general standards of accounting for other than temporary impairment (OTTI) losses requires the recognition of an OTTI loss in earnings only when an entity (1) intends to sell the debt security; (2) more likely than not will be required to sell the security before recovery of its amortized cost basis or (3) does not expect to recover the entire amortized cost basis of the security. Realized gains and losses for securities classified as available for sale and held to maturity are included in earnings and are derived using the specific identification method for determining the amortized cost of securities sold.
Federal Home Loan Bank Stock
Federal Home Loan Bank (FHLB) stock represents an equity interest in a FHLB. It does not have a readily determinable fair value because its ownership is restricted and it lacks a market. The amount of FHLB stock held by the Company is required by the FHLB to be maintained and is based on membership requirements and terms of advance agreements. Such restricted equity securities without a readily determinable fair value are recorded at cost.
Loans Held for Sale
Mortgage loans originated and intended for sale in the secondary market are carried at the lower of aggregate cost or fair value, as determined by outstanding commitments from investors. Net unrealized losses, if any, are recorded as a valuation allowance and charged to earnings. Loans transferred to the held-for-sale category are transferred at the lower of cost or fair value, with charges made recognized as a realized loss on sale of loans. Increases in fair value are not recognized until the loans are sold.
79
Realized gains and losses on sales of loans are based upon specific identification of the loan sold and included in noninterest income. Loans held for sale are generally sold with servicing rights retained and recorded at fair value at sale as servicing assets.
The Company typically sells the guaranteed portion of SBA loans and retains the unguaranteed portion (“retained interest”). A portion of the premium on sale of SBA loans is recognized as gain on sale of loans at the time of the sale by allocating the carrying amount between the asset sold and the retained interest, including these servicing assets, based on their relative fair values. The remaining portion of the premium is recorded as a discount on the retained interest and is amortized over the remaining life of the loan as an adjustment to yield. The retained interest, net of any discount, are included in loans, less allowance for loan losses in the accompanying consolidated balance sheets.
Loans
Loans receivable that management has the intent and ability to hold for the foreseeable future or until maturity or pay-off are reported at their outstanding principal, adjusted for any charge-offs, the allowance for loan losses, any deferred fees or costs on originated loans and unamortized premiums or discounts on purchased loans.
Interest on commercial, real estate loans and installment loans is credited to income on a daily basis based upon the principal amount outstanding. Loan origination fees and certain direct origination costs, less the costs associated with closing the loan, are capitalized and recognized as an adjustment of the yield of the related loan.
Interest income on mortgage and commercial loans is discontinued and placed on non-accrual status at the time the loan is 90 days delinquent unless the loan is well-secured and in process of collection. Mortgage loans are charged off at 180 days past due, and commercial loans are charged off to the extent principal or interest is deemed uncollectible. Consumer loans continue to accrue interest until they are charged off no later than 120 days past due unless the loan is in the process of collection. Past-due status is based on the contractual terms of the loan. In all cases, loans are placed on non-accrual or charged-off at an earlier date if collection of principal or interest is considered doubtful. Non-accrual loans and loans past due 90 days still on accrual include both smaller balance homogeneous loans that are collectively evaluated for impairment and individually classified impaired loans.
When interest accrual is discontinued, all unpaid accrued interest is reversed against current interest income. Interest income is subsequently recognized only to the extent cash payments are received. Loans are returned to accrual status when all the principal and interest amounts contractually due are reasonably assured of repayment within a reasonable time frame.
A loan is considered impaired when, based on current information and events, it is probable the Company will be unable to collect the scheduled payments of principal and interest when due according to the contractual terms of the loan agreement. Factors considered by management in determining impairment include payment status, collateral value, and the probability of collecting scheduled principal and interest payments when due. Loans that experience insignificant payment delays and payment shortfalls generally are not classified as impaired. Management determines the significance of payment delays and payment shortfalls on a case-by-case basis, taking into consideration all of the circumstances surrounding the loan and the borrower, including the length of the delay, the reasons for the delay, the borrower’s prior payment record, and the amount of the shortfall in relation to the principal and interest owed.
Impaired loans are measured by either the present value of expected future cash flows discounted at the loan’s effective interest rate, the loan’s obtainable market price, or the estimated fair value of the collateral if the loan is collateral dependent. The amount of impairment, if any, and any subsequent changes are included in the allowance for loan losses.
The Company has sold guaranteed portions of Small Business Administration (SBA) loans in the SBA secondary market and continues to service these loans. Gains or losses on guaranteed portions of SBA loans which are sold are recorded in other income, based on the net proceeds received and the basis in the portion of the loan sold. The basis in the portion of the loan sold is determined by allocating a portion of the loan carrying value to the portion sold based on its fair value, relative to the fair value of the portion of the loan retained and the estimated servicing asset.
80
Purchased Loans
Purchased loans having evidence of credit deterioration since origination and it is probable at the date of acquisition that the Company will not collect all contractually required principal and interest payments, are accounted for under ASC 310-30, Loans and Debt Securities Acquired with Deteriorated Credit Quality. ASC 310-30 requires that acquired credit-impaired loans to be recorded at fair value and prohibits carryover of the related allowance for loan losses.
The difference between contractually required payments at acquisition and the cash flows expected to be collected at acquisition is referred to as the non-accretable discount. The Company must estimate expected cash flows at each reporting date. Subsequent increases in cash flows result in a reversal of the provision for loan losses to the extent of prior provisions and adjust accretable discount if no prior provisions have been made. This increase in accretable discount will have a positive impact on interest income. In addition, purchased loans without evidence of credit deterioration are also handled under this method. Loans acquired that do not have evidence of credit deterioration since origination are accounted for under ASC 310-20, Nonrefundable Fees and Other Costs. Interest is recognized using the simple interest method.
Allowance for Loan Losses
The allowance for loan losses is established as losses are estimated to have occurred through a provision for loan losses charged to expense. The allowance for loan losses is increased by provision charges to income and decreased by charge-offs (net of recoveries). Loans are charged against the allowance for loan losses when management believes the collection of the principal is unlikely. The allowance for loan losses is maintained at a level believed adequate by management to absorb estimated probable inherent loan losses and estimated losses relating to specifically identified loans. Management’s periodic evaluation of the adequacy of the allowance is based upon many factors, including loan growth, net charge-offs, changes in the composition of the loan portfolio, delinquencies, management’s assessment of the quality of the loan portfolio, the valuation of problem loans and the general economic conditions in our market areas.
This evaluation is inherently subjective as it requires material estimates that are susceptible to significant change including the amounts and timing of future cash flows expected to be received on impaired loans.
While management uses available information to recognize losses on loans, future additions to the allowance may be necessary based on changes in local economic conditions. In addition, regulatory agencies, as an integral part of their examination process, periodically review the Company’s allowance for losses on loans. Such agencies may require the Company to recognize additions to the allowance based on their judgment about information available to them at the time of their examination. Because of these factors, it is reasonably possible that the allowance for losses on loans may change materially in the near term. However, the amount of the change that is reasonably possible cannot be estimated.
The allowance for loan losses may consist of specific, general, and unallocated components. The specific component relates to loans that are classified as impaired. A loan is considered impaired when, based on current information and events, it is probable the Company will be unable to collect the scheduled payments of principal and interest when due according to the contractual terms of the loan agreement. Factors considered by management in determining impairment include payment status, collateral value, and the probability of collecting scheduled principal and interest payments when due.
Loans that experience insignificant payment delays and payment shortfalls generally are not classified as impaired. Management determines the significance of payment delays and payment shortfalls on a case-by-case basis, taking into consideration all the circumstances surrounding the loan and the borrower, including the length of the delay, the reasons for the delay, the borrower’s prior payment record, and the amount of the shortfall in relation to the principal and interest owed. Loans for which the terms have been modified resulting in a concession, and for which the borrower is experiencing financial difficulties, are considered troubled debt restructurings (TDRs) and classified as impaired.
Impaired loans are measured by either the present value of the expected future cash flows discounted at the loan’s effective interest rate, the loan’s obtainable market price, or the estimated fair value of the collateral if the loan is collateral dependent. The amount of the impairment, if any, and any subsequent changes are included in the allowance for loan losses.
81
General allowances are established for non-impaired loans. These loans are assigned a risk rating, and the allocated allowance for loan losses is determined based upon the loss percentage factors that correspond to each risk rating. Loss percentage factors are based on both historical loss experience and peer data, adjusted for qualitative factors. The qualitative factors consider credit concentrations, recent levels and trends in delinquencies and nonaccrual loans, and growth in the loan portfolio. The occurrence of certain events could result in changes to the loss factors. Accordingly, these loss factors are reviewed periodically and modified by management. General allowances are established for loans that can be pooled into pools based on similar characteristics. Loss percentage factors applied to these pools are based on an analysis of historical charge-off experience and expected losses given default derived from the Company’s internal risk rating process. These factors are developed and applied to the portfolio in terms of loan type and line of business. Adjustments are also made to the allowance for the pools after an assessment of internal and external influences on credit quality that have not yet been reflected in the historical loss or risk rating data.
The general allowances are determined based on consideration of historical loss data, the various risk characteristics of each loan segment, and whether the loans are within or outside the Company’s general market area. Risk characteristics relevant to each portfolio segment are as follows:
Construction and development – Loans in this segment primarily include real estate development loans for which payment is derived from the sale of the property as well as construction projects in which the property will ultimately be used by the borrower. Credit risk is affected by cost overruns, time to sell at an adequate price, and market conditions.
Commercial real estate – Loans in this segment are primarily income-producing properties. The underlying cash flows generated by the properties are adversely impacted by a downturn in the economy as evidenced by increased vacancy rates, which in turn, will have an effect on the credit quality in this segment. Management monitors the cash flows of these loans.
Commercial and industrial – Loans in this segment are made to businesses and are generally secured by assets of the business. Repayment is expected from the cash flows of the business. A weakened economy, and resultant decreased customer spending, will have an effect on the credit quality in this segment.
Single family residential mortgages – Loans in this segment include loans for residential real estate. Loans in this segment are dependent on credit quality of the individual borrower. The overall health of the economy, including unemployment rates will have an effect on the credit quality of this segment.
Consumer and other – Loans in this segment are made to individuals and are secured by personal assets, as well as loans for farmland and other loans. Loans in this segment are dependent on the credit quality of the individual borrower. The overall health of the economy, including unemployment rates will have an effect on the credit quality in this segment.
Foreclosed Real Estate
Real estate properties acquired through, or in lieu of, loan foreclosure are to be sold and are initially recorded at the lesser of the investment in the property or fair value less selling costs at the date of foreclosure establishing a new cost basis. Any write down to fair value at the time of foreclosure is charged to the allowance for loan losses. After foreclosure, valuations are periodically performed by management and the real estate is carried at the lower of carrying amount or fair value less cost to sell. Costs of improvements are capitalized, whereas costs relating to holding foreclosed real estate and subsequent adjustment to the value are expensed.
Premises and Equipment
Premises and equipment are stated at cost less accumulated depreciation, computed principally on the straight-line method over the estimated useful lives of the assets. Leasehold improvements have a useful life equal to the shorter of
82
useful life or lease term. Maintenance and repairs that do not extend the useful life of the premises and equipment are charged to expense. The useful lives of premises and equipment are as follows:
Asset Type |
| Useful Life |
Building | | 40 years |
Leasehold improvements | | 3-20 years |
Furniture, fixtures, and equipment | | 5-7 years |
Computer equipment | | 4-5 years |
Computer software | | 3 years |
Intangible Assets
Intangible assets with definite useful lives are amortized over their estimated useful lives to their estimated residual values.
SBA and USDA Loan Servicing Rights
SBA and USDA Loan servicing rights on originated loans that have been sold are capitalized by allocating the total cost of the loans between the loan servicing rights and the loans based on their relative fair values. Capitalized servicing rights are measured at fair value at each reporting date and changes in fair value are reported in earnings in the period they occur. Fair values are estimated using either an independent valuation or by discounted cash flows based on a current market interest rate.
Residential Mortgage Servicing Rights
When residential mortgage loans are sold with servicing retained, servicing rights are initially recorded at fair value with the income statement effect recorded in gains on sales of loans. Fair value is based on market prices for comparable mortgage servicing contracts, when available or alternatively, is based on a valuation model that calculates the present value of estimated future net servicing income. Residential mortgage servicing assets are subsequently measured using the amortization method which requires servicing rights to be amortized into non-interest income in proportion to, and over the period of, the estimated future net servicing income of the underlying loans.
Residential mortgage servicing rights are evaluated for impairment based upon the fair value of the rights as compared to carrying amount. Impairment is determined by stratifying rights into groupings based on predominant risk characteristics, such as interest rate, loan type and investor type. Impairment is recognized through a valuation allowance for an individual grouping, to the extent that fair value is less than the carrying amount. If the Company later determines that all or a portion of the impairment no longer exists for a particular grouping, a reduction of the allowance may be recorded as an increase to income. The fair values of servicing rights are subject to significant fluctuations as a result of changes in estimated and actual prepayment speeds and default rates and losses.
Residential mortgage servicing fee income is recorded for fees earned for servicing loans. The fees are based on a contractual percentage of the outstanding principal; or a fixed amount per loan and are recorded as income when earned. The amortization of residential mortgage servicing rights is netted against loan servicing fee income.
Bank Owned Life Insurance (BOLI)
The Company has purchased life insurance on the lives of certain key officers of the Company. The Company purchased these life insurance policies to generate income to offset the Company’s cost of providing various employee benefits. BOLI is recorded at its cash surrender value, net of surrender charges and/or early termination charges that are probable at settlement. The increase in cash value is recorded as other income.
83
Stock Based Compensation Plan
The Company follows Financial Accounting Standards Board (FASB) ASC 718, Compensation - Stock Compensation, which requires all share-based payments to employees, including grants of employee stock options and restricted stock, to be recognized as compensation expense in the financial statements based on fair value. FASB ASC 718 requires recognition of expense equal to the fair value of the option or restricted stock share, determined using the calculated value method, over the vesting period of the option. As of December 31, 2020, there was $238,000 of unrecognized compensation cost related to stock options and $1.4 million of unrecognized compensation cost for restricted stock outstanding. The compensation cost for stock options and restricted stock recognized in net income was $1.8 million and $1.5 million for the years ended December 31, 2020 and 2019, respectively.
The fair value of stock options and warrants used to compute the recognized expense is estimated using the Black-Scholes option pricing model. This model requires input of subjective assumptions, including the expected price volatility of the underlying stock. Projected data related to the expected volatility and expected life of the stock option is based upon historical and other information. Changes in these subjective assumptions can materially affect the fair value estimates. Prior to becoming a public company in October 2019, FASB ASC 718 allowed non-public companies to use calculated value to determine the expected price volatility of underlying stock for use in the model. For options granted prior to 2019, the calculated value for the Company was obtained by determining the historical volatility of public companies in the Company’s industry sector.
Income Taxes
The provision for income taxes is based on income and expense reported for financial statement purposes after the adjustment for permanent differences such as tax-exempt income. Deferred income tax assets and liabilities are determined using the balance sheet method, reflecting a net deferred tax asset or liability based on the tax effects of the temporary differences between the book and tax bases of assets and liabilities, giving recognition to changes in tax rates and laws. A net deferred tax asset is evaluated for realization, and reduced by a valuation allowance when determined it is more likely than not that the asset will not be fully realized.
In accordance with ASC 740-10 Income Taxes it is the Company’s policy to recognize interest and penalties associated with uncertain tax positions as components of income taxes and to disclose the recognized interest and penalties, if material. Management has evaluated all tax positions that could have a significant effect on the financial statements and determined the Company had no uncertain tax positions at December 31, 2020 and 2019. Further, all years subsequent to 2017 remain subject to evaluation.
Earnings Per Share
Basic earnings per common share is net income divided by the weighted average number of common shares outstanding during the period. All outstanding unvested share-based payment awards that contain rights to non-forfeitable dividends are considered participating securities for this calculation. Diluted earnings per common share includes the dilutive effect of additional potential common shares issuable under stock options. Earnings and dividends per share are restated for all stock splits and stock dividends through the date of issuance of the financial statements.
Comprehensive Income
Accounting principles generally require that recognized revenue, expenses, gains and losses be included in net income. Although certain changes in assets and liabilities, such as unrealized gains and losses on available-for-sale securities, are reported as a separate component of the equity section of the balance sheet, such items, along with net income, are components of comprehensive income.
Loan Commitments and Related Financial Instruments
In the ordinary course of business, the Company has entered into off balance sheet financial instruments, which are not reflected in the financial statements and consist of commitments to extend credit, commercial letters of credit and
84
standby letters of credit. Such financial instruments are recorded in the financial statements when they become payable. The Company uses the same credit policies for these off-balance-sheet financial instruments as it does for other instruments that are recorded in the financial statements.
The fair value of a financial instrument is the amount at which the instrument could be exchanged in a current transaction between willing parties, other than in a forced or liquidation sale. Quoted market prices, if available, are utilized as estimates of the fair values of financial instruments. Since no quoted market prices exist for a significant part of the Company's financial instruments, the fair values of such instruments have been derived based on management's assumptions, the estimated amount and timing of future cash flows and estimated discount rates.
Loss Contingencies
Loss contingencies, including claims and legal actions arising in the ordinary course of business, are recorded as liabilities when the likelihood of loss is probable and an amount or range of loss can be reasonably estimated. Management does not believe there now are such matters which will have a material effect on the financial statements.
Fair Value of Financial Instruments
Fair values of financial instruments are estimated using relevant market information and other assumptions, as more fully disclosed in Note 15. Fair value estimates involve uncertainties and matters of significant judgement regarding interest rates, credit risk, prepayments, and other factors, especially in the absence of broad markets for particular items. Changes in assumptions or in market conditions could significantly affect these estimates.
Operating Segments
While the chief decision-makers monitor the revenue streams of the various products and services, operations are managed and financial performance is evaluated on a Company-wide basis. Operating segments are aggregated into one as operating results for all segments are similar. Accordingly, all of the financial service operations are considered by management to be aggregated in one reportable operating segment.
Reclassifications
Some items in the prior year financial statements were reclassified to conform to current presentation. Reclassifications had no effect on prior years net income or shareholders’ equity.
Operating, Accounting and Reporting Considerations Related to COVID-19
The COVID-19 pandemic has negatively impacted the global economy, including the Company’s market areas. In response to this crisis, the Coronavirus Aid, Relief, and Economic Security (“CARES”) Act was passed by Congress and signed into law on March 27, 2020. The CARES Act provided an estimated $2.2 trillion to fight the COVID-19 pandemic and stimulate the economy by supporting individuals and businesses through loans, grants, tax changes, and other types of relief. Some of the provisions applicable to the Company include, but are not limited to:
| ● | Accounting for Loan Modifications - The CARES Act provides that financial institutions may elect to suspend (1) the requirements under GAAP for certain loan modifications that would otherwise by categorized as a troubled debt restructure (“TDR”) and (2) any determination that such loan modifications would be considered a TDR, including the related impairment for accounting purposes. |
| ● | Paycheck Protection Program - The CARES Act established the Paycheck Protection Program (“PPP”), an expansion of the Small Business Administration’s 7(a) loan program and the Economic Injury Disaster Loan Program (“EIDL”), administered directly by the SBA. |
Also in response to the COVID-19 pandemic, the Board of Governors of the Federal Reserve System (“FRB”), the Federal Deposit Insurance Corporation (“FDIC”), the National Credit Union Administration (“NCUA”), the Office of the
85
Comptroller of the Currency (“OCC”), and the Consumer Financial Protection Bureau (“CFPB”), in consultation with the state financial regulators (collectively, the “agencies”) issued a joint interagency statement (issued March 22, 2020; revised statement issued April 7, 2020). Some of the provisions applicable to the Company include, but are not limited to:
| ● | Accounting for Loan Modifications - Loan modifications that do not meet the conditions of the CARES Act may still qualify as a modification that does not need to be accounted for as a TDR. The agencies confirmed with the Financial Accounting Standards Board (“FASB”) staff that short-term modifications made on a good faith basis in response to COVID-19 to borrowers who were current prior to any relief are not TDRs. This includes short-term (e.g., three months) modifications such as payment deferrals, fee waivers, extensions of repayment terms, or insignificant delays in payment, as long as such modifications are (1) related to COVID-19; (2) executed on a loan that was not more than 30 days past due at the time of modification; and (3) executed between March 1, 2020 and the earlier of (a) 60 days after the date of termination of the national emergency declaration or (b) December 31, 2020. |
| ● | Past Due Reporting - With regard to loans not otherwise reportable as past due, financial institutions are not expected to designate loans with deferrals granted due to COVID-19 as past due because of the deferral. A loan’s payment date is governed by the due date stipulated in the legal agreement. If a financial institution agrees to a payment deferral, these loans would not be considered past due reporting during the period of the deferral. |
| ● | Nonaccrual Status - During short-term COVID-19 modifications, these loans generally should not be reported as nonaccrual or as classified. |
| ● | Beginning in late March 2020, the Company provided relief programs consisting primarily of 90 to 180 day payment deferral relief of principal and interest to borrowers negatively impacted by COVID-19 and has accounted for these loan modifications in accordance with ASC 310-40. |
Recently Adopted Accounting Pronouncements
In August 2018, the FASB issued ASU No. 2018-13, “Fair Value Measurement (Topic 820): Disclosure Framework - Changes to the Disclosure Requirements for Fair Value Measurement.” The amendments in this update modify the disclosure requirements for fair value measurements by removing, modifying, or adding certain disclosures. Among the changes, entities will no longer be required to disclose the amount of and reasons for transfers between the Level 1 and Level 2 hierarchy, but will be required to disclose the range and weighted average used to develop unobservable inputs for Level 3 fair value measurements. The update was effective for interim and annual periods in fiscal years beginning after December 31, 2019, with early adoption permitted for the removed disclosures and delayed adoption until fiscal year 2020 permitted for new disclosures. As ASU 2018-13 only revises disclosure requirements, it did not have a material impact on the Company’s consolidated financial statements.
Recently Issued Accounting Pronouncements Not Yet Adopted
In June 2016, the FASB issued ASU 2016-13, Financial Instruments - Credit Losses (Topic 326) to replace the incurred loss model with an expected loss model, which is referred to as the current expected credit loss (“CECL”) model. The CECL model is applicable to the measurement of credit losses on financial assets measured at amortized cost, including loan receivables and held-to-maturity debt securities. It also applies to off-balance sheet credit exposures not accounted for as insurance (loan commitments, standby letters of credit, financial guarantees, and similar instruments) and net investments in leases recognized by a lessor. For debt securities with other-than-temporary impairment (“OTTI”), the guidance will be applied prospectively. Existing purchased credit impaired (“PCI”) assets will be grandfathered and classified as purchased credit deteriorated (“PCD”) assets at the date of adoption. The assets will be grossed up for the allowance of expected credit losses for all PCD assets at the date of adoption and will continue to recognize the noncredit discount in interest income based on the yield of such assets as of the adoption date. Subsequent changes in expected credit losses will be recorded through the allowance. Adoption is effective for interim and annual reporting periods beginning after December 15, 2022. Early adoption is permitted; however, we plan to adopt ASU 2016-13 on January 1, 2023. The Company has selected a software solution supported by a third-party vendor to be used in developing an expected credit
86
loss model compliant with ASU 2016-13. We will continue to evaluate the impact of this new accounting standard through its effective date..
The Company has further evaluated other Accounting Standards Updates issued during 2020 but does not expect updates other than those summarized above to have a material impact on the consolidated financial statements.
NOTE 2 – SECURITIES AVAILABLE FOR SALE
The amortized costs, gross unrealized gains and losses, and estimated fair values of securities available for sale as of December 31, 2020 and 2019 are summarized as follows:
| | December 31, 2020 | ||||||||||
|
| Gross |
| Gross |
| Gross |
| Estimated | ||||
| | Amortized | | Unrealized | | Unrealized | | Fair | ||||
(Dollars in thousands) | | Cost | | Gains | | Losses | | Value | ||||
Obligations of U.S. Government entities and agencies | | $ | 9,306 | | $ | — | | $ | — | | $ | 9,306 |
States and political subdivisions | |
| 7,182 | |
| 247 | |
| — | |
| 7,429 |
Mortgage-backed GSE residential | |
| 1,368 | |
| 14 | |
| — | |
| 1,382 |
Total | | $ | 17,856 | | $ | 261 | | $ | — | | $ | 18,117 |
| | December 31, 2019 | ||||||||||
|
| Gross |
| Gross |
| Gross |
| Estimated | ||||
| | Amortized | | Unrealized | | Unrealized | | Fair | ||||
(Dollars in thousands) | | Cost | | Gains | | Losses | | Value | ||||
Obligations of U.S. Government entities and agencies | | $ | 12,436 | | $ | — | | $ | — | | $ | 12,436 |
States and political subdivisions | |
| 1,246 | |
| 33 | |
| — | |
| 1,279 |
Mortgage-backed GSE residential | |
| 2,015 | |
| — | |
| (35) | |
| 1,980 |
Total | | $ | 15,697 | | $ | 33 | | $ | (35) | | $ | 15,695 |
The amortized costs and estimated fair values of investment securities available for sale at December 31, 2020, by contractual maturity are shown below. Expected maturities will differ from contractual maturities because borrowers may have the right to call or prepay obligations with or without call or prepayment penalties.
| | Securities Available for Sale | ||||
|
| Amortized |
| Estimated | ||
(Dollars in thousands) | | Cost | | Fair Value | ||
Due in one year or less | | $ | 265 | | $ | 265 |
Due after one year but less than five years | |
| 10,290 | |
| 10,320 |
Due after five years but less than ten years | |
| 5,933 | |
| 6,150 |
Due in more than ten years | |
| — | |
| — |
Mortgage-backed GSE residential | |
| 1,368 | |
| 1,382 |
Total | | $ | 17,856 | | $ | 18,117 |
There were no securities pledged as of December 31, 2020 and 2019 to secure public deposits and repurchase agreements. There were no securities sold during 2020, 2019 and 2018.
87
There were no securities in a gross unrealized loss position at December 31, 2020. Information pertaining to securities with gross unrealized losses at December 31, 2019 aggregated by investment category and length of time that individual securities have been in a continuous loss position, follows:
| | December 31, 2019 | ||||||||||
| | Twelve Months or Less | | Over Twelve Months | ||||||||
|
| Gross |
| Estimated |
| Gross |
| Estimated | ||||
| | Unrealized | | Fair | | Unrealized | | Fair | ||||
(Dollars in thousands) | | Losses | | Value | | Losses | | Value | ||||
Mortgage-backed GSE residential | | $ | — | | $ | — | | $ | (35) | | $ | 1,975 |
Total | | $ | — | | $ | — | | $ | (35) | | $ | 1,975 |
Management evaluates securities for other-than-temporary impairment at least on a quarterly basis, and more frequently when economic or market concerns warrant such evaluation. Consideration is given to (1) the length of time and the extent to which the fair value has been less than cost, (2) the financial condition and near-term prospects of the issuer, and (3) the intent and ability of the Company to retain its investment in the issuer for a period of time sufficient to allow for any anticipated recovery in fair value.
NOTE 3 – LOANS AND ALLOWANCE FOR LOAN LOSSES
Major classifications of loans at December 31, 2020 and 2019 are summarized as follows:
| | December 31, | ||||
(Dollars in thousands) |
| 2020 |
| 2019 | ||
Construction and development | | $ | 45,653 | | $ | 31,739 |
Commercial real estate | |
| 477,419 | |
| 424,950 |
Commercial and industrial | |
| 137,239 | |
| 53,105 |
Residential real estate | |
| 974,445 | |
| 651,645 |
Consumer and other | |
| 183 | |
| 1,768 |
Total loans receivable | |
| 1,634,939 | |
| 1,163,207 |
Unearned income | |
| (4,595) | |
| (2,045) |
Allowance for loan losses | |
| (10,135) | |
| (6,839) |
Loans, net | | $ | 1,620,209 | | $ | 1,154,323 |
Included in the commercial and industrial loans are PPP loans totaling $92.4 million as of December 31, 2020.
In the normal course of business, the Company may sell and purchase loan participations to and from other financial institutions and related parties. Loan participations are typically sold to comply with the legal lending limits per borrower as imposed by regulatory authorities. The participations are sold without recourse and the Company imposes no transfer or ownership restrictions on the purchaser.
88
A summary of changes in the allowance for loan losses by portfolio segment for years ended December 31, 2020, 2019 and 2018 is as follows:
|
| Year Ended December 31, 2020 | |||||||||||||||||||
| | Construction | | | | | | | | | | | | | | | | | | | |
|
| and |
| Commercial |
| Commercial |
| Residential | | Consumer | | | | | | | |||||
(Dollars in thousands) |
| Development |
| Real Estate |
| and Industrial |
| Real Estate |
| and Other |
| Unallocated |
| Total | |||||||
Allowance for loan losses: | | | | | | | | | | | | | | | | | | | | | |
Beginning balance | | $ | 131 | | $ | 2,320 | | $ | 448 | | $ | 3,457 | | $ | 91 | | $ | 392 | | $ | 6,839 |
Charge-offs | |
| — | | | (109) | | | (51) | |
| — | |
| (97) | |
| — | |
| (257) |
Recoveries | |
| — | | | 10 | | | 25 | |
| — | |
| 51 | |
| — | |
| 86 |
Provision | |
| 47 | | | 2,940 | | | 16 | |
| 893 | |
| (37) | |
| (392) | |
| 3,467 |
Ending balance | | $ | 178 | | $ | 5,161 | | $ | 438 | | $ | 4,350 | | $ | 8 | | $ | — | | $ | 10,135 |
| | Year Ended December 31, 2019 | |||||||||||||||||||
| | Construction | | | | | | | | | | | | | | | | | | | |
| | and | | Commercial | | Commercial | | Residential | | Consumer | | | | | | | |||||
(Dollars in thousands) |
| Development |
| Real Estate |
| and Industrial |
| Real Estate |
| and Other |
| Unallocated |
| Total | |||||||
Allowance for loan losses: | | | | | | | | | | | | | | | | | | | | | |
Beginning balance | | $ | 235 | | $ | 2,601 | | $ | 380 | | $ | 3,042 | | $ | 387 | | $ | — | | $ | 6,645 |
Charge-offs | |
| — | |
| (237) | |
| (14) | |
| — | |
| (525) | |
| — | |
| (776) |
Recoveries | |
| — | |
| 752 | |
| — | |
| — | |
| 218 | |
| — | |
| 970 |
Provision | |
| (104) | |
| (796) | |
| 82 | |
| 415 | |
| 11 | |
| 392 | |
| — |
Ending balance | | $ | 131 | | $ | 2,320 | | $ | 448 | | $ | 3,457 | | $ | 91 | | $ | 392 | | $ | 6,839 |
| | Year Ended December 31, 2018 | |||||||||||||||||||
| | Construction | | | | | | | | | | | | | | | | | | | |
| | and | | Commercial | | Commercial | | Residential | | Consumer | | | | | | | |||||
(Dollars in thousands) |
| Development |
| Real Estate |
| and Industrial |
| Real Estate |
| and Other |
| Unallocated |
| Total | |||||||
Allowance for loan losses: | | | | | | | | | | | | | | | | | | | | | |
Beginning balance | | $ | 127 | | $ | 2,135 | | $ | 261 | | $ | 3,048 | | $ | 1,170 | | $ | 184 | | $ | 6,925 |
Charge-offs | |
| — | |
| (88) | |
| (39) | |
| — | |
| (1,939) | |
| — | |
| (2,066) |
Recoveries | |
| — | |
| 22 | |
| — | |
| — | |
| 527 | |
| — | |
| 549 |
Provision | |
| 108 | |
| 532 | |
| 158 | |
| (6) | |
| 629 | |
| (184) | |
| 1,237 |
Ending balance | | $ | 235 | | $ | 2,601 | | $ | 380 | | $ | 3,042 | | $ | 387 | | $ | — | | $ | 6,645 |
89
The following tables present, by portfolio segment, the balance in the allowance for loan losses disaggregated on the basis of the Company’s impairment measurement method and the related unpaid principal balance in loans as of December 31, 2020 and 2019.
|
| December 31, 2020 | |||||||||||||||||||
| | Construction | | | | | | | | | | | | | | | | | | | |
|
| and |
| Commercial |
| Commercial |
| Residential | | Consumer | | | | | | | |||||
(Dollars in thousands) |
| Development |
| Real Estate |
| and Industrial |
| Real Estate |
| and Other |
| Unallocated |
| Total | |||||||
Allowance for loan losses: | | | | | | | | | | | | | | | | | | | | | |
Individually evaluated for impairment | | $ | — | | $ | 444 | | $ | 56 | | $ | — | | $ | — | | $ | — | | $ | 500 |
Collectively evaluated for impairment | |
| 178 | |
| 4,717 | |
| 382 | |
| 4,350 | |
| — | |
| — | | | 9,627 |
Acquired with deteriorated credit quality | | | — | | | — | | | — | | | — | | | 8 | | | — | | | 8 |
Total ending allowance balance | | $ | 178 | | $ | 5,161 | | $ | 438 | | $ | 4,350 | | $ | 8 | | $ | — | | $ | 10,135 |
Loans: | |
|
| |
|
| |
|
| |
|
| |
|
| |
|
| |
|
|
Individually evaluated for impairment | | $ | — | | $ | 6,245 | | $ | 322 | | $ | 7,309 | | $ | — | | $ | — | | $ | 13,876 |
Collectively evaluated for impairment | |
| 45,497 | |
| 469,322 | |
| 134,330 | |
| 967,136 | |
| 141 | |
| — | |
| 1,616,426 |
Acquired with deteriorated credit quality | |
| — | |
| — | |
| — | |
| — | |
| 42 | |
| — | |
| 42 |
Total ending loans balance | | $ | 45,497 | | $ | 475,567 | | $ | 134,652 | | $ | 974,445 | | $ | 183 | | $ | — | | $ | 1,630,344 |
| | December 31, 2019 | |||||||||||||||||||
| | Construction | | | | | | | | | | | | | | | | | | | |
| | and | | Commercial | | Commercial | | Residential | | Consumer | | | | | | | |||||
(Dollars in thousands) |
| Development |
| Real Estate |
| and Industrial |
| Real Estate |
| and Other |
| Unallocated |
| Total | |||||||
Allowance for loan losses: |
| |
|
| |
|
| |
|
| |
|
| |
|
| |
|
| |
|
Individually evaluated for impairment | | $ | — | | $ | 716 | | $ | 30 | | $ | — | | $ | — | | $ | — | | $ | 746 |
Collectively evaluated for impairment | |
| 131 | |
| 1,604 | |
| 418 | |
| 3,457 | |
| 9 | |
| 392 | |
| 6,011 |
Acquired with deteriorated credit quality | |
| — | |
| — | |
| — | |
| — | |
| 82 | |
| — | |
| 82 |
Total ending allowance balance | | $ | 131 | | $ | 2,320 | | $ | 448 | | $ | 3,457 | | $ | 91 | | $ | 392 | | $ | 6,839 |
Loans: | |
|
| |
|
| |
|
| |
|
| |
|
| |
|
| |
|
|
Individually evaluated for impairment | | $ | 1,360 | | $ | 7,527 | | $ | 957 | | $ | 7,936 | | $ | — | | $ | — | | $ | 17,780 |
Collectively evaluated for impairment | | | 30,076 | |
| 415,773 | |
| 52,056 | |
| 643,709 | |
| 958 | |
| — | |
| 1,142,572 |
Acquired with deteriorated credit quality | |
| — | |
| — | |
| — | |
| — | |
| 810 | |
| — | |
| 810 |
Total ending loans balance | | $ | 31,436 | | $ | 423,300 | | $ | 53,013 | | $ | 651,645 | | $ | 1,768 | | $ | — | | $ | 1,161,162 |
90
Impaired loans as of December 31, 2020 and 2019, by portfolio segment, are as follows:
| | Unpaid | | Recorded | | Recorded | | | | | | | |||
| | Total | | Investment | | Investment | | Total | | | | ||||
(Dollars in thousands) | | Principal | | With No | | With | | Recorded | | Related | |||||
December 31, 2020 |
| Balance |
| Allowance |
| Allowance |
| Investment |
| Allowance | |||||
Construction and development | | $ | — | | $ | — | | $ | — | | $ | — | | $ | — |
Commercial real estate | |
| 6,245 | |
| 3,768 | |
| 2,505 | |
| 6,273 | |
| 444 |
Commercial and industrial | |
| 322 | |
| 232 | |
| 94 | |
| 326 | |
| 56 |
Residential real estate | |
| 7,309 | |
| 7,309 | |
| — | |
| 7,309 | | | — |
Total | | $ | 13,876 | | $ | 11,309 | | $ | 2,599 | | $ | 13,908 | | $ | 500 |
| | Unpaid | | Recorded | | Recorded | | | | | | | |||
| | Total | | Investment | | Investment | | Total | | | | ||||
(Dollars in thousands) | | Principal | | With No | | With | | Recorded | | Related | |||||
December 31, 2019 |
| Balance |
| Allowance |
| Allowance |
| Investment |
| Allowance | |||||
Construction and development | | $ | 1,360 | | $ | 1,360 | | $ | — | | $ | 1,360 | | $ | — |
Commercial real estate | |
| 7,527 | |
| 4,716 | |
| 2,882 | |
| 7,598 | |
| 716 |
Commercial and industrial | |
| 957 | |
| 925 | |
| 39 | |
| 964 | |
| 30 |
Residential real estate | |
| 7,936 | |
| 7,936 | |
| — | |
| 7,936 | |
| — |
Total | | $ | 17,780 | | $ | 14,937 | | $ | 2,921 | | $ | 17,858 | | $ | 746 |
The average recorded investment in impaired loans and interest income recognized on the cash and accrual basis for the years ended December 31, 2020, 2019 and 2018, by portfolio segment, are summarized in the tables below.
| | Years Ended December 31, | ||||||||||||||||
| | 2020 | | 2019 | | 2018 | ||||||||||||
| | Average | | Interest | | Average | | Interest | | Average | | Interest | ||||||
| | Recorded | | Income | | Recorded | | Income | | Recorded | | Income | ||||||
(Dollars in thousands) |
| Investment |
| Recognized |
| Investment |
| Recognized |
| Investment |
| Recognized | ||||||
Construction and development | | $ | 105 | | $ | — | | $ | 1,360 | | $ | 6 | | $ | 1,922 | | $ | 68 |
Commercial real estate | |
| 8,325 | |
| 390 | |
| 8,057 | |
| 629 | |
| 7,474 | |
| 653 |
Commercial and industrial | |
| 427 | |
| 29 | |
| 966 | |
| 33 | |
| 1,165 | |
| 25 |
Residential real estate | |
| 7,272 | |
| 150 | |
| 6,278 | |
| 104 | |
| 1,705 | |
| 99 |
Total | | $ | 16,129 | | $ | 569 | | $ | 16,661 | | $ | 772 | | $ | 12,266 | | $ | 845 |
A primary credit quality indicator for financial institutions is delinquent balances. Delinquencies are updated on a daily basis and are continuously monitored. Loans are placed on nonaccrual status as needed based on repayment status and consideration of accounting and regulatory guidelines. Nonaccrual balances are updated and reported on a daily basis. Following are the delinquent amounts, by portfolio segment, as of December 31, 2020 and 2019:
| | | | | | | | Accruing | | Total | | | | | Total | |||
(Dollars in thousands) | | | | | 30-89 Days | | Greater than | | Accruing | | | | | Financing | ||||
December 31, 2020 |
| Current |
| Past Due |
| 90 Days |
| Past Due |
| Nonaccrual |
| Receivables | ||||||
Construction and development | | $ | 45,497 | | $ | — | | $ | — | | $ | — | | $ | — | | $ | 45,497 |
Commercial real estate | |
| 472,707 | |
| — | |
| — | |
| — | |
| 2,860 | |
| 475,567 |
Commercial and industrial | |
| 134,463 | |
| 155 | |
| — | |
| 155 | |
| 34 | |
| 134,652 |
Residential real estate | |
| 946,144 | |
| 20,992 | |
| — | |
| 20,992 | |
| 7,309 | |
| 974,445 |
Consumer and other | | | 183 | |
| — | |
| — | |
| — | |
| — | | | 183 |
Total | | $ | 1,598,994 | | $ | 21,147 | | $ | — | | $ | 21,147 | | $ | 10,203 | | $ | 1,630,344 |
91
| | | | | | | | Accruing | | Total | | | | | Total | |||
(Dollars in thousands) | | | | | 30-89 Days | | Greater than | | Accruing | | | | | Financing | ||||
December 31, 2019 |
| Current |
| Past Due |
| 90 Days |
| Past Due |
| Nonaccrual |
| Receivables | ||||||
Construction and development | | $ | 30,076 | | $ | — | | $ | — | | $ | — | | $ | 1,360 | | $ | 31,436 |
Commercial real estate | |
| 419,406 | |
| 973 | |
| — | |
| 973 | |
| 2,921 | |
| 423,300 |
Commercial and industrial | |
| 52,936 | |
| 58 | |
| — | |
| 58 | |
| 19 | |
| 53,013 |
Residential real estate | |
| 625,222 | |
| 18,487 | |
| — | |
| 18,487 | |
| 7,936 | |
| 651,645 |
Consumer and other | |
| 1,768 | |
| — | |
| — | |
| — | |
| — | |
| 1,768 |
Total | | $ | 1,129,408 | | $ | 19,518 | | $ | — | | $ | 19,518 | | $ | 12,236 | | $ | 1,161,162 |
The Company utilizes a ten grade loan rating system for its loan portfolio as follows:
| ● | Loans rated Pass – Loans in these categories have low to average risk. |
| ● | Loans rated Special Mention – Loans do not presently expose the Company to a sufficient degree of risk to warrant adverse classification, but does possess deficiencies deserving close attention. |
| ● | Loans rated Substandard – Loans are inadequately protected by the current sound worth and paying capability of the obligor or of the collateral pledged, if any. |
| ● | Loans rated Doubtful – Loans which have all the weaknesses inherent in loans classified Substandard, with the added characteristic that the weaknesses make collections or liquidation in full, or on the basis of currently known facts, conditions and values, highly questionable or improbable. |
| ● | Loans rated Loss – Loans classified Loss are considered uncollectible and such little value that there continuance as bankable assets is not warranted. |
Loan grades are monitored regularly and updated as necessary based upon review of repayment status and consideration of periodic updates regarding the borrower’s financial condition and capacity to meet contractual requirements.
The following presents the Company’s loans, included purchased loans, by risk rating based on the most recent information available:
| | Construction | | | | | | | | | | | | | | | | |
(Dollars in thousands) | | and | | Commercial | | Commercial | | Residential | | Consumer | | | | |||||
December 31, 2020 |
| Development |
| Real Estate |
| and Industrial |
| Real Estate |
| and Other |
| Total | ||||||
Rating: |
| |
|
| |
|
| |
|
| |
|
| |
|
| |
|
Pass | | $ | 45,497 | | $ | 469,968 | | $ | 133,852 | | $ | 967,136 | | $ | 183 | | $ | 1,616,636 |
Special Mention | |
| — | |
| — | |
| — | |
| — | |
| — | |
| — |
Substandard | |
| — | |
| 5,599 | |
| 800 | |
| 7,309 | |
| — | |
| 13,708 |
Doubtful | |
| — | |
| — | |
| — | |
| — | |
| — | |
| — |
Loss | |
| — | |
| — | |
| — | |
| — | |
| — | |
| — |
Total | | $ | 45,497 | | $ | 475,567 | | $ | 134,652 | | $ | 974,445 | | $ | 183 | | $ | 1,630,344 |
92
| | Construction | | | | | | | | | | | | | | | | |
(Dollars in thousands) | | and | | Commercial | | Commercial | | Residential | | Consumer | | | | |||||
December 31, 2019 |
| Development |
| Real Estate |
| and Industrial |
| Real Estate |
| and Other |
| Total | ||||||
Rating: |
| |
|
| |
|
| |
|
| |
|
| |
|
| |
|
Pass | | $ | 30,076 | | $ | 416,183 | | $ | 52,033 | | $ | 641,544 | | $ | 1,768 | | $ | 1,141,604 |
Special Mention | |
| — | |
| 800 | |
| — | |
| — | |
| — | |
| 800 |
Substandard | |
| 1,360 | |
| 6,317 | |
| 980 | |
| 10,101 | |
| — | |
| 18,758 |
Doubtful | |
| — | |
| — | |
| — | |
| — | |
| — | |
| — |
Loss | |
| — | |
| — | |
| — | |
| — | |
| — | |
| — |
Total | | $ | 31,436 | | $ | 423,300 | | $ | 53,013 | | $ | 651,645 | | $ | 1,768 | | $ | 1,161,162 |
Purchased Credit Impaired Loans:
The Company has purchased loans, for which there was, at acquisition, evidence of deterioration of credit quality since origination and it was probable, at acquisition, that all contractually required payments would not be collected. Loans are recorded under the scope of ASC 310-30 when it is deemed probable at acquisition that all contractually required payments will not be collected.
Loans within the scope of ASC 310-30 are initially recorded at fair value and are evaluated for impairment on an ongoing basis. As of December 31, 2020 and 2019, the Company had auto loan pools included within the consumer segment of loans outstanding that are accounted for under ASC 310-30 with a carrying value of $42,000 and $810,000, respectively. At December 31, 2020 and 2019, there was no remaining accretable yield for these loans. At December 31, 2020 and 2019, the allowance for loan losses allocated on these loans was $8,000 and $82,000, respectively, as these loans are collectively evaluated for impairment. Interest income recognized on these loans was $53,000, $118,000 and $509,000 for the year ended December 31, 2020, 2019 and 2018, respectively.
Troubled Debt Restructures:
In this current real estate environment it has become more common to restructure or modify the terms of certain loans under certain conditions (i.e. troubled debt restructures or “TDRs”). In those circumstances it may be beneficial to restructure the terms of a loan and work with the borrower for the benefit of both parties, versus forcing the property into foreclosure and having to dispose of it in an unfavorable real estate market. When we have modified the terms of a loan, we usually either reduce or defer payments for a period of time. We have not forgiven any material principal amounts on any loan modifications to date. Nonperforming TDRs are generally placed on non-accrual under the same criteria as all other loans.
TDRs as of December 31, 2020 and 2019 quantified by loan type classified separately as accrual and nonaccrual are presented in the table below.
(Dollars in thousands) | | | | | | | | | |
December 31, 2020 |
| Accruing |
| Nonaccrual |
| Total | |||
Commercial real estate | | $ | 2,870 | | $ | 479 | | $ | 3,349 |
Commercial and industrial | |
| 21 | |
| 1 | |
| 22 |
Total | | $ | 2,891 | | $ | 480 | | $ | 3,371 |
(Dollars in thousands) | | | | | | | | | |
December 31, 2019 |
| Accruing |
| Nonaccrual |
| Total | |||
Commercial real estate | | $ | 2,437 | | $ | 482 | | $ | 2,919 |
Commercial and industrial | |
| 22 | |
| 5 | |
| 27 |
Total | | $ | 2,459 | | $ | 487 | | $ | 2,946 |
Our policy is to return nonaccrual TDR loans to accrual status when all the principal and interest amounts contractually due, pursuant to its modified terms, are brought current and future payments are reasonably assured. Our policy also considers payment history of the borrower, but is not dependent upon a specific number of payments. The Company
93
recorded a specific reserve of $296,000 and $344,000, as of December 31, 2020 and 2019, respectively, and recognized no partial charge offs on the TDR loans presented above during the years ended December 31, 2020 and 2019. TDR commercial real estate loans totaling $482,000 defaulted during the year ended December 31, 2019. These defaults did not have a material impact on the Company’s allowance for loan loss. There were no TDRs which defaulted during the year ended December 31, 2020.
During year ended December 31, 2020, we modified one commercial real estate loan as a troubled debt restructuring. The total recorded investment in this modified loan was $493,000 as of December 31, 2020. During the year ended December 31, 2019, we modified one commercial and industrial loan as a troubled debt restructuring. The total recorded investment in this modified loan as of December 31, 2019 was $25,000. The modification of these loans did not result in a permanent reduction of the recorded investment in the loan, but did result in a payment deferment period on the loans. At December 31, 2020 and 2019, the Company did not have any commitments to lend additional funds to debtors whose terms have been modified in troubled restructurings.
Loans are modified to minimize loan losses when we believe the modification will improve the borrower’s financial condition and ability to repay the loan. We typically do not forgive principal. We generally either defer, or decrease monthly payments for a temporary period of time. A summary of the types of concessions for loans classified as troubled debt restructurings are presented in the table below:
(Dollars in thousands) |
| December 31, |
| December 31, | ||
Type of Concession | | 2020 | | 2019 | ||
Deferral of payments | | $ | 505 |
| $ | 22 |
Extension of maturity date | |
| 2,866 |
| | 2,924 |
Total TDR loans | | $ | 3,371 |
| $ | 2,946 |
The following table presents loans by portfolio segment modified as TDRs and the corresponding recorded investment, which includes accrued interest and fees, as of December 31, 2020 and 2019:
| | December 31, 2020 | | December 31, 2019 | ||||||
(Dollars in thousands) |
| Number of |
| Recorded |
| Number of |
| Recorded | ||
Type | | Loans | | Investment | | Loans | | Investment | ||
Commercial real estate |
| 5 | | $ | 3,364 |
| 4 | | $ | 2,923 |
Commercial and industrial |
| 2 | |
| 23 | | 2 | |
| 31 |
Total |
| 7 | | $ | 3,387 | | 6 | | $ | 2,954 |
Modifications in Response to COVID-19
Certain borrowers are currently unable to meet their contractual payment obligations because of the adverse effects of COVID-19. To help mitigate these effects, loan customers may apply for a deferral of payments, or portions thereof, for up to three months. In the absence of other intervening factors, such short-term modifications made on a good faith basis are not categorized as troubled debt restructurings, nor are loans granted payment deferrals related to COVID-19 reported as past due or placed on nonaccrual status (provided the loans were not past due or on nonaccrual status prior to the deferral). See Note 1 - Significant Accounting Policies for more information.
As of December 31, 2020, we had non-SBA commercial loans and residential mortgages with outstanding balances of $42.0 million and $9.8 million, respectively, that had been approved for a third round of payment deferrals. The Small Business Administration (“SBA”) made debt relief payments for the principal, interest and fee payments of all our SBA loan customers for six months through the end of September 2020. As of December 31, 2020 and following the expiration of the SBA debt relief payments, we had approved three month payment deferrals for SBA loans with outstanding gross loan balance totaling $25.5 million ($6.4 million unguaranteed book balance).
As of December 31, 2020, there were no deferred loans that were delinquent or on nonaccrual status and none were risk rated “special mention” or worse. The Company evaluates its deferred loans after the initial deferral period and will
94
either return to the original loan terms or the loan will be reassessed at that time to determine if a further deferment should be granted and if a downgrade in risk rating is appropriate.
Related Party Loans:
The Company conducts transactions with its directors and executive officers, including companies in which such officers or directors have beneficial interests. None of the related party loans were classified as nonaccrual, past due, restructured, or potential problem loans at December 31, 2020 or 2019.
The following table summarizes aggregate loan transactions with related parties for the years ended December 31, 2020 and 2019:
|
| December 31, | ||||
(Dollars in thousands) |
| 2020 |
| 2019 | ||
Beginning balance | | $ | 6,382 | | $ | 5,540 |
New loans and principal advances | |
| 2,902 | |
| 1,925 |
Repayments | | | (643) | | | (1,083) |
Transactions due to changes in related parties | |
| — | |
| — |
Ending balance | | $ | 8,641 | | $ | 6,382 |
NOTE 4 – PREMISES AND EQUIPMENT
Premises and equipment are summarized as follows:
| | December 31, | ||||
(Dollars in thousands) |
| 2020 |
| 2019 | ||
Land | | $ | 2,604 | | $ | 2,604 |
Building | |
| 7,703 | |
| 7,698 |
Leasehold improvements | |
| 3,963 | |
| 3,944 |
Furniture, fixtures and equipment | |
| 3,743 | |
| 3,589 |
Computer equipment | | | 1,707 | | | 1,553 |
Computer software | | | 714 | | | 563 |
Construction in process | |
| 102 | |
| 53 |
Premises and equipment, gross | |
| 20,536 | |
| 20,004 |
Accumulated depreciation | |
| (6,682) | |
| (5,544) |
Premises and equipment, net | | $ | 13,854 | | $ | 14,460 |
Depreciation expense for premises and equipment totaled $1.1 million, $1.0 million and $848,000 for the years ended December 31, 2020, 2019 and 2018, respectively.
NOTE 5 – OPERATING LEASES
The Company has entered into various operating leases for certain branch locations with terms extending through July 2028. Generally, these leases have initial lease terms of ten years or less. Many of the leases have one or more renewal options which typically are for five years at the then fair market rental rates. We assessed these renewal options using a threshold of reasonably certain. For leases where we were reasonably certain to renew, those option periods were included within the lease term, and therefore, the measurement of the right-of-use (ROU) asset and lease liability. None of our leases included options to terminate the lease and none had initial terms of 12 months or less (i.e. short-term leases). Operating leases in which the Company is the lessee are recorded as operating lease ROU assets and operating lease liabilities on the Consolidated Balance Sheets. The Company currently does not have any finance leases.
Operating lease ROU assets represent the Company’s right to use an underlying asset during the lease term and operating lease liabilities represent its obligation to make lease payments arising from the lease. ROU assets and operating lease liabilities are recognized at lease commencement based on the present value of the remaining lease payments using
95
a discount rate that represents the Company’s incremental collateralized borrowing rate provided by the FHLB at the lease commencement date. ROU assets are further adjusted for lease incentives, if any. Operating lease expense, which is comprised of amortization of the ROU asset and the implicit interest accreted on the operating lease liability, is recognized on a straight-line basis over the lease term, and is recorded in occupancy expense in the Consolidated Statements of Income.
The components of lease cost for the year ended December 31, 2020 and 2019 were as follows:
| | Year Ended | ||||
(Dollars in thousands) |
| December 31, 2020 |
| December 31, 2019 | ||
Operating lease cost | | $ | 2,197 | | $ | 2,169 |
Variable lease cost | |
| 190 | |
| 190 |
Short-term lease cost | |
| — | |
| — |
Sublease income | |
| — | |
| — |
Total net lease cost | | $ | 2,387 | | $ | 2,359 |
Future maturities of the Company’s operating lease liabilities are summarized as follows:
(Dollars in thousands) | | | |
Year Ended : |
| Lease Liability | |
December 31, 2021 | | $ | 1,902 |
December 31, 2022 | |
| 1,927 |
December 31, 2023 | |
| 1,928 |
December 31, 2024 | |
| 1,817 |
December 31, 2025 | |
| 1,595 |
After December 31, 2025 | |
| 2,912 |
Total lease payments | |
| 12,081 |
Less: interest discount | |
| (1,171) |
Present value of lease liabilities | | $ | 10,910 |
(Dollars in thousands) | | |
|
Supplemental Lease Information |
| December 31, 2020 |
|
Weighted-average remaining lease term (years) |
| 6.5 | |
Weighted-average discount rate |
| 3.14 | % |
| | Year Ended December 31, | ||||
|
| 2020 |
| 2019 | ||
Cash paid for amounts included in the measurement of lease liabilities: |
| |
|
| |
|
Operating cash flows from operating leases (cash payments) | | $ | 2,054 | | $ | 1,964 |
Operating cash flows from operating leases (lease liability reduction) | | $ | 1,689 | | $ | 1,555 |
Operating lease right-of-use assets obtained in exchange for leases entered into during the period | | $ | 131 | | $ | 13,610 |
The Company signed an agreement to lease space in Norcross, Georgia with an entity in which the Chairman of the Company serves as a managing member. The lease is a ten year non-cancellable lease which expires in October 2023. During the years ended December 31, 2020, 2019 and 2018, $148,000, $140,000 and $142,000, respectively, in rents were paid under this lease. Management believes the terms of this lease are no less favorable to the Company than would have been achieved with an unaffiliated third party.
NOTE 6 – SBA AND USDA LOAN SERVICING
The Company sells the guaranteed portion of certain SBA and USDA loans it originates and continues to service the sold portion of the loan. The portion of the loans sold are not included in the financial statements of the Company. As of December 31, 2020 and 2019, the unpaid principal balances of serviced loans totaled $507.4 million and $441.6 million, respectively.
96
Activity for SBA loan servicing rights are as follows:
| | For the Year Ended December 31, | |||||||
(Dollars in thousands) |
| 2020 |
| 2019 |
| 2018 | |||
Beginning of period | | $ | 8,162 | | $ | 8,419 | | $ | 9,329 |
Change in fair value | |
| 1,326 | |
| (257) | |
| (910) |
End of period, fair value | | $ | 9,488 | | $ | 8,162 | | $ | 8,419 |
Fair value at December 31, 2020 and 2019 was determined using discount rates ranging from 4.67% to 10.89% and 5.80% to 12.06%, and prepayment speeds ranging from 14.04% to 17.71% and 10.82% to 16.54%, depending on the stratification of the specific right. Average default rates are based on the industry average for the applicable NAICS/SIC code.
The aggregate fair market value of the interest only strips included in SBA servicing assets was $155,000 and $26,000 at December 31, 2020 and 2019, respectively. Comparable market values and a valuation model that calculates the present value of future cash flows were used to estimate fair value.
NOTE 7 – RESIDENTIAL MORTGAGE LOAN SERVICING
Residential mortgage loans serviced for others are not reported as assets. The outstanding principal of these loans at December 31, 2020 and 2019 was $961.7 million and $1.17 billion, respectively.
Activity for mortgage loan servicing rights and the related valuation allowance are as follows:
(Dollars in thousands) | | Years Ended December 31, | |||||||
Mortgage loan servicing rights: |
| 2020 |
| 2019 |
| 2018 | |||
Beginning of period | | $ | 18,068 | | $ | 14,934 | | $ | 6,843 |
Additions | |
| 984 | |
| 6,921 | |
| 10,253 |
Amortization expense | | | (5,420) | | | (3,787) | | | (2,162) |
Valuation allowance | |
| (641) | |
| — | |
| — |
End of period, carrying value | | $ | 12,991 | | $ | 18,068 | | $ | 14,934 |
(Dollars in thousands) | | Years Ended December 31, | |||||||
Valuation allowance: |
| 2020 |
| 2019 |
| 2018 | |||
Beginning balance | | $ | — | | $ | — | | $ | — |
Additions expensed | |
| 641 | |
| — | |
| — |
Reductions credited to operations | | | — | | | — | | | — |
Direct write-downs | |
| — | |
| — | |
| — |
Ending balance | | $ | 641 | | $ | — | | $ | — |
The fair value of servicing rights was $13.1 million and $19.0 million at December 31, 2020 and 2019, respectively. Fair value at December 31, 2020 was determined by using a discount rate of 14%, prepayment speeds of 20.7%, and a weighted average default rate of 1.16%. Fair value at December 31, 2019 was determined by using a discount rate of 14%, prepayment speeds of 16%, and a weighted average default rate of 0.98%.
97
NOTE 8 – DEPOSITS
Deposit account balances as of December 31, 2020 and 2019 are summarized as follows:
| | December 31, | ||||
(Dollars in thousands) |
| 2020 |
| 2019 | ||
Noninterest-bearing demand deposits | | $ | 462,909 | | $ | 292,008 |
NOW accounts and savings | |
| 84,386 | |
| 54,550 |
Money market | |
| 290,679 | |
| 179,159 |
Brokered money market | |
| 164,314 | |
| — |
Time deposits less than $250,000 | | | 366,476 | | | 582,964 |
Time deposits $250,000 or greater | | | 111,125 | | | 198,696 |
Total deposits | | $ | 1,479,889 | | $ | 1,307,377 |
Maturities of time deposits at December 31, 2020 are summarized as follows:
(Dollars in thousands) |
| | |
Year Ended December 31, |
| | |
2021 | | $ | 462,883 |
2022 | |
| 11,362 |
2023 | |
| 1,378 |
2024 | |
| 1,656 |
2025 | | | 322 |
Total time deposits | | $ | 477,601 |
At December 31, 2020 and 2019, overdraft demand deposits reclassified to loans totaled $111,000 and $355,000, respectively.
The Company held related party deposits of approximately $4.8 million and $5.0 million at December 31, 2020 and 2019, respectively.
NOTE 9 – FEDERAL HOME LOAN BANK ADVANCES & OTHER BORROWINGS
Advances from the Federal Home Loan Bank (FHLB) at December 31, 2020 and 2019 are summarized as follows:
| | December 31, | ||||
(Dollars in thousands) |
| 2020 |
| 2019 | ||
Convertible advance with Bermudan option maturing August 6, 2029; fixed rate of 0.85% | | $ | 20,000 | | $ | 20,000 |
Convertible advances with Bermudan option maturing November 7, 2029; fixed rate of 0.68% | |
| 30,000 | |
| 30,000 |
Convertible advance with Bermudan option maturing December 5, 2029; fixed rate of 0.75% | | | 10,000 | | | 10,000 |
Convertible advance with Bermudan option maturing February 1, 2030; fixed rate of 0.59% | | | 20,000 | | | — |
Fixed rate advance maturing January 22, 2021; fixed rate of 0.22% | |
| 30,000 | |
| — |
Total FHLB advances | | $ | 110,000 | | $ | 60,000 |
At December 31, 2020 and 2019, the Company had a line of credit with the FHLB, set as a percentage of total assets, with maximum borrowing capacity of $522.8 million and $494.3 million at December 31, 2020 and 2019, respectively. The available borrowing amounts are collateralized by the Company’s FHLB stock and pledged commercial and residential real estate loans, which totaled $954.1 million and $716.9 million at December 31, 2020 and 2019, respectively.
98
As of December 31, 2020 and 2019, the Company had unsecured federal funds lines available with various financial institutions of approximately $47.5 million. These lines have various terms, rates and maturities. There were no advances outstanding on these lines at December 31, 2020 or 2019.
As of December 31, 2020 and 2019, the Company had Federal Reserve Discount Window funds available of approximately $10.0 million, with no amounts outstanding at either date. The funds are collateralized by a pool of commercial real estate and commercial and industrial loans totaling $37.8 million and $27.3 million as of December 31, 2020 and 2019, respectively.
The Company sells the guaranteed portion of certain SBA loans it originates and continues to service the sold portion of the loan. The Company sometimes retains an interest only strip or servicing fee that is considered to be more than customary market rates. An interest rate strip can result from a transaction when the market rate of the transaction differs from the stated rate on the portion of the loan sold.
The sold portion of SBA loans that satisfies at least one of the above provisions are considered secured borrowings and are included in other borrowings. Secured borrowings at December 31, 2020 and 2019 were $483,000 and $3.1 million, respectively.
NOTE 10 – INCOME TAXES
The components of income tax expense for the periods indicated were as follows:
| | Years Ended December 31, | |||||||
(Dollars in thousands) |
| 2020 |
| 2019 |
| 2018 | |||
Current tax provision: | | | | | | | | | |
Federal | | $ | 11,684 | | $ | 11,028 | | $ | 12,210 |
State | | | 2,636 | | | 4,034 | | | 2,102 |
Total current tax provision | | | 14,320 | | | 15,062 | | | 14,312 |
Deferred tax provision: | | | | | | | | | |
Federal | | | (1,421) | | | 793 | | | 308 |
State | | | (529) | | | 295 | | | 47 |
Total deferred tax (benefit) provision | | | (1,950) | | | 1,088 | | | 355 |
Total provision for income taxes | | $ | 12,370 | | $ | 16,150 | | $ | 14,667 |
The following table presents a reconciliation of the recorded provision for income taxes to the amount of taxes computed by applying the applicable statutory Federal income tax rate for the periods indicated:
| | Years Ended December 31, | | |||||||||||||
| | 2020 | 2019 | 2018 | | |||||||||||
(Dollars in thousands) |
| Amount |
| % |
| Amount |
| % | | Amount |
| % | | |||
Federal statutory tax rate | | $ | 10,240 | | 21.0 | % | $ | 12,782 | | 21.0 | % | $ | 11,775 | | 21.0 | % |
Differences resulting from: | | | | | | | | | | | | | | | | |
State income taxes, net of federal benefit | | | 1,665 | | 3.4 | | | 3,420 | | 5.6 | | | 1,660 | | 3.0 | |
Permanent book to tax differences | | | 342 | | 0.7 | | | (135) | | (0.2) | | | — | | — | |
Other items, net | | | 123 | | 0.3 | | | 83 | | 0.1 | | | 1,232 | | 2.2 | |
Provision for income taxes | | $ | 12,370 | | 25.4 | % | $ | 16,150 | | 26.5 | % | $ | 14,667 | | 26.2 | % |
99
At December 31, 2020 and 2019, the Company’s deferred tax assets and liabilities consisted of the following:
| | December 31, | ||||
(Dollars in thousands) |
| 2020 |
| 2019 | ||
Deferred tax assets: | | | | | | |
Allowance for loan losses | | $ | 2,849 | | $ | 1,919 |
Nonaccrual interest | |
| 159 | |
| 221 |
Deferred loan fees | | | 578 | | | 119 |
Lease liabilities under operating leases | | | 3,066 | | | 3,501 |
Unrealized losses on securities available for sale | |
| — | |
| 1 |
Other | | | 440 | | | 277 |
Total gross deferred tax assets | | | 7,092 | | | 6,038 |
Deferred tax liabilities: | | | | | | |
Deferred mortgage servicing fees | |
| (1,916) | |
| (2,535) |
Deferred SBA servicing fees | |
| (2,666) | |
| (2,206) |
Premises and equipment | | | (532) | | | (599) |
Right-of-use assets under operating leases | | | (2,908) | | | (3,355) |
Unrealized gains on securities available for sale | | | (75) | | | — |
Other | | | (28) | | | (254) |
Total gross deferred tax liabilities | | | (8,125) | | | (8,949) |
Net deferred tax liabilities | | $ | (1,033) | | $ | (2,911) |
On March 27, 2020, the Coronavirus Aid, Relief, and Economic Security Act (CARES Act) was signed into law. The CARES Act includes several significant business tax provisions that, among other things, temporarily repealed the taxable income limitation for certain net operating losses (NOL) and allows businesses to carry back NOLs arising in 2018, 2019, and 2020 tax years to the five prior tax years, accelerate refunds of previously generated corporate Alternative Minimum Tax (AMT) credits, and adjusts the business interest expense limitation under section 163(j) from 30% to 50% of Adjusted Taxable Income (ATI) for 2019 and 2020 tax years.
For the year ended December 31, 2020, the Company’s income tax provision is impacted by the CARES Act and therefore, the applicable items have been taken into account, including the permitted delay in deposit of payroll taxes. There is no impact to the Company’s income tax provision for the year ended December 31, 2019.
Management assesses the available positive and negative evidence to estimate if sufficient future taxable income will be generated to use the existing deferred tax assets. Management believes no valuation allowance is necessary against deferred tax assets as of December 31, 2020.
For the years ended December 31, 2020 and 2019, management believes there are no material amounts of uncertain tax position. Additionally, there were no amounts of interest and penalties recognized in the consolidated balance sheets as of December 31, 2020 or 2019 or on the consolidated statements of income for the years ended December 31, 2020, 2019 or 2018. The Company and its subsidiary are subject to U.S. federal income tax as well as various other state income taxes. The Company is no longer subject to examination by taxing authorities for years before 2017.
NOTE 11 – STOCK BASED COMPENSATION
The Company adopted the MetroCity Bankshares, Inc. 2018 Stock Option Plan (the “Prior Option Plan”) effective as of April 18, 2018, and the Prior Option Plan was approved by the Company’s shareholders on May 30, 2018. The Prior Option Plan provided for awards of stock options to officers, employees and directors of the Company. The Board of Directors of the Company determined that it was in the best interests of the Company and its shareholders to amend and restate the Prior Option Plan to provide for the grant of additional types of awards. Acting pursuant to its authority under the Prior Option Plan, the Board of Directors approved and adopted the MetroCity Bankshares, Inc. 2018 Omnibus Incentive Plan (the “2018 Incentive Plan”), which constitutes the amended and restated version of the Prior Option Plan. The Board of Directors has reserved 2,400,000 shares of Company common stock for issuance pursuant to awards granted under the 2018 Incentive Plan, any or all of which may be granted as nonqualified stock options, incentive stock options,
100
restricted stock, restricted stock units, performance awards and other stock-based awards. In the event all or a portion of a stock award is forfeited, cancelled, expires, or is terminated before becoming vested, paid, exercised, converted, or otherwise settled in full, any unissued or forfeited shares again become available for issuance pursuant to awards granted under the 2018 Incentive Plan and do not count against the maximum number of reserved shares. In addition, shares of common stock deducted or withheld to satisfy tax withholding obligations will be added back to the share reserve and will again be available for issuance pursuant to awards granted under the plan. The 2018 Incentive Plan is administered by the Compensation Committee of our Board of Directors (the “Committee”). The determination of award recipients under the 2018 Incentive Plan, and the terms of those awards, will be made by the Committee. At December 31, 2020, 240,000 stock options had been granted and 194,183 shares of restricted stock had been issued under the 2018 Incentive Plan.
Stock Options
The fair value of stock options issued during 2018 was determined at their grant date using a Black-Scholes valuation model that utilized the following variables: expected volatility of 21.3%, an expected term of 6.5 years, a 3.0% dividend yield, and risk free rate of 2.9%. The weighted average fair value of each option granted during 2018 was $11.90. The Company did not grant any stock options during the years ended December 31, 2020 and 2019.
A summary of stock option activity for the years ended December 31, 2020, 2019 and 2018 is presented below:
| | | | | | | Weighted | | | |
| | | | | | | Average | | Aggregate | |
| | | | Weighted | | Remaining | | Intrinsic | ||
| | | | Average | | Contractual | | Value | ||
|
| Shares | | Exercise Price |
| Term (in years) |
| (in thousands) | ||
Outstanding at January 1, 2018 |
| — | | $ | — | | | | | |
Granted |
| 240,000 | |
| 12.70 | | | | | |
Exercised |
| — | |
| — | | | | | |
Forfeited |
| — | |
| — | | | | | |
Outstanding at December 31, 2018 |
| 240,000 | | $ | 12.70 | | 2.50 | | $ | 912 |
Granted |
| — | |
| — | | | | | |
Exercised |
| — | |
| — | | | | | |
Forfeited |
| — | |
| — | | | | | |
Outstanding at December 31, 2019 |
| 240,000 | | $ | 12.70 |
| 1.50 | | $ | 1,154 |
Granted |
| — | |
| — |
| | | | |
Exercised |
| — | |
| — |
| | | | |
Forfeited |
| — | |
| — |
| | | | |
Outstanding at December 31, 2020 |
| 240,000 | | $ | 12.70 |
| 0.50 | | $ | 413 |
During the years ended December 31, 2020, 2019 and 2018, the Company recognized compensation expense for stock options of $476,000, $476,000 and $238,000, respectively. As of December 31, 2020 and 2019 there was $238,000 and $714,000 of total unrecognized compensation cost related to options granted under the Plan. As of December 31, 2020, the cost is expected to be recognized over a weighted-average period of 0.5 years.
Restricted Stock
The Company has periodically issued restricted stock to its directors, executive officers and certain employees under the 2018 Incentive Plan. Compensation expense for restricted stock is based upon the grant date fair value of the shares and is recognized over the vesting period of the awards. Shares of restricted stock issued to officers and employees vest in equal annual installments on the first three anniversaries of the grant date. Shares of restricted stock issued to directors vest 25% on the grant date and 25% on each of the first three anniversaries of the grant date.
101
A summary of restricted stock activity for the years ended December 31, 2020, 2019 and 2018 is presented below:
| | Years Ended December 31, | |||||||||||||
| | 2020 | | 2019 | | 2018 | |||||||||
| | | | Weighted | | | | Weighted | | | | Weighted | |||
| | | | Average Grant- |
| | | Average Grant- |
| | | Average Grant- | |||
|
| Shares | | Date Fair Value |
| Shares |
| Date Fair Value |
| Shares |
| Date Fair Value | |||
Nonvested shares at beginning of year |
| 169,204 | | $ | 9.35 | | 278,202 | | $ | 7.07 | | 280,310 | | $ | 4.39 |
Granted |
| 145,459 | |
| 11.56 | | 48,724 | |
| 13.75 | | 181,072 | |
| 9.85 |
Vested |
| (144,682) | |
| 9.03 | | (157,316) | |
| 6.68 | | (183,180) | |
| 5.72 |
Forfeited |
| (202) | |
| 9.85 | | (406) | |
| 9.85 | | — | |
| — |
Nonvested shares at end of year |
| 169,779 | | $ | 11.52 | | 169,204 | | $ | 9.35 | | 278,202 | | $ | 7.07 |
During the years ended December 31, 2020, 2019 and 2018, the Company recognized compensation expense for restricted stock of $1.3 million, $1.0 million and $1.3 million, respectively. As of December 31, 2020 and 2019, there was $1.4 million and $1.1 million of total unrecognized compensation cost related to nonvested shares granted under the Plan. As of December 31, 2020, the unrecognized compensation cost is expected to be recognized over a weighted-average period of 2.1 years. The grant date fair value of shares vested during the years ended December 31, 2020 and 2019 was $1.3 million and $1.1 million, respectively.
NOTE 12 – EARNINGS PER SHARE
The following table presents the calculation of basic and diluted earnings per common share for the periods indicated:
|
| Year Ended December 31, | |||||||
(Dollars in thousands except per share data) |
| 2020 |
| 2019 |
| 2018 | |||
Basic earnings per share | | | | | | | | | |
Net Income | | $ | 36,394 | | $ | 44,718 | | $ | 41,334 |
| | | | | | | | | |
Weighted average common shares outstanding | |
| 25,613,881 | |
| 24,533,180 | |
| 24,184,790 |
| | | | | | | | | |
Basic earnings per common share | | $ | 1.42 | | $ | 1.82 | | $ | 1.71 |
| | | | | | | | | |
Diluted earnings per share | | | | | | | | | |
Net Income | | $ | 36,394 | | $ | 44,718 | | $ | 41,334 |
| | | | | | | | | |
Weighted average common shares outstanding for basic earnings per common share | |
| 25,613,881 | |
| 24,533,180 | |
| 24,184,790 |
Add: Dilutive effects of restricted stock and options | |
| 184,668 | |
| 196,355 | |
| 290,908 |
| | | | | | | | | |
Average shares and dilutive potential common shares | |
| 25,798,549 | |
| 24,729,535 | |
| 24,475,698 |
| | | | | | | | | |
Diluted earnings per common share | | $ | 1.41 | | $ | 1.81 | | $ | 1.69 |
There were no stock options or restricted stock excluded from the computation of diluted earnings per common share since they were antidilutive for 2020, 2019 and 2018.
NOTE 13 – REVENUE RECOGNITION
Accounting Standards Codification ("ASC") 606, Revenue from Contracts with Customers ("ASC 606"), establishes principles for reporting information about the nature, amount, timing and uncertainty of revenue and cash flows arising from the entity’s contracts to provide goods or services to customers. The core principle requires an entity to recognize revenue to depict the transfer of goods or services to customers in an amount that reflects the consideration that it expects to be entitled to receive in exchange for those goods or services recognized as performance obligations are satisfied. The
102
implementation of the new guidance did not have a material impact on the measurement or recognition of revenue. The Company did not record a cumulative effect adjustment to opening retained earnings. Results for reporting periods beginning after January 1, 2018 are presented under Topic 606, while prior period amounts were not adjusted and continue to be reported in accordance with our historic accounting under Topic 605.
The majority of our revenue-generating transactions are not subject to ASC 606, including revenue generated from financial instruments, such as our loans, letters of credit, and investment securities, as well as revenue related to our loan servicing activities and revenue on bank owned life insurance, as these activities are subject to other GAAP discussed elsewhere within our disclosures. Descriptions of our revenue-generating activities that are within the scope of ASC 606, which are presented in our income statements as components of noninterest income are as follows:
Service charges on deposits: Income from service charges on deposits is within the scope of ASC 606. These include general service fees for monthly account maintenance and activity or transaction-based fees and consist of transaction-based revenue, time-based revenue (service period), item-based revenue or some other individual attribute-based revenue. Revenue on these types of fees are recognized when our performance obligation is completed which is generally monthly for account maintenance services or when a transaction has been completed. Payment for such performance obligations are generally received at the time the performance obligations are satisfied. Service charges on deposits also include overdraft and nonsufficient funds fees. Overdraft fees are charged when a depositor has a draw on their account that has inadequate funds. All services charges on deposit accounts represent less than 1.3% of total revenues in the years ended December 31, 2020, 2019 and 2018.
Other Service Charges, Commissions and Fees: Other service charges, commissions and fees are primarily comprised of mortgage origination related income, wire fees, interchange fees, and other service charges and fees. Mortgage origination related income, which makes up the majority of the other service charges, commissions and fees line item amounts reported on the Consolidated Statements of Income, consists of mortgage loan origination fees, underwriting fees, processing fees, and application fees. The Company’s performance obligations for other service charges, commissions and fees are largely satisfied, and related revenue recognized, when the services are rendered or upon completion. Payment is typically received immediately or in the following month.
Gain or loss on sale of OREO: This revenue stream is recorded when control of the property transfers to the buyer, which generally occurs at the time of an executed deed. When the Company finances the sale of OREO to the buyer, the Company assesses whether the buyer is committed to perform their obligations under the contract and whether collectability of the transaction price is probable. Once these criteria are met, the OREO asset is derecognized and the gain or loss on sale is recorded upon the transfer of control of the property to the buyer. In determining the gain or loss on the sale, the Company adjusts the transaction price and related gain or loss on sale if a significant financing component is present. This revenue stream is within the scope of ASC 606 and is included in other income in noninterest income, but no significant revenues were generated from gains and losses on the sale and financing of OREO for the years ended December 31, 2020, 2019 and 2018.
Other revenue streams that are recorded in other income in noninterest income include revenue generated from letters of credit and income on bank owned life insurance. These revenue streams are either not material or out of scope of ASC 606.
NOTE 14 – COMMITMENTS AND CONTINGENCIES
In the normal course of business, the Company makes various commitments and incurs certain contingent liabilities that are not reflected in the Company’s financial statements. These commitments and contingent liabilities include various guarantees, commitments to extend credit and standby letters of credit. The Company does not anticipate any material losses as a result of these commitments and contingent liabilities.
Credit Related Commitments
The Company is a party to financial instruments with off-balance-sheet risk in the normal course of business to meet the financing needs of its customers. These financial instruments include commitments to extend credit and standby letters
103
of credit. Those instruments involve, to varying degrees, elements of credit and interest rate risk in excess of the amount recognized in the balance sheets. The contract amounts of those instruments reflect the extent of involvement the Company has in particular classes of financial instruments.
The Company’s exposure to credit loss in the event of nonperformance by the other party to the financial instrument for commitments to extend credit and standby letters of credit written is represented by the contractual amount of those instruments. The Company uses the same credit policies in making commitments and conditional obligations as it does for on-balance-sheet instruments. Financial instruments where contract amounts represent credit risk as of and December 31, 2020 and 2019 include:
| | December 31, | ||||
(Dollars in thousands) |
| 2020 |
| 2019 | ||
Financial instruments whose contract amounts represent credit risk: |
| |
|
| |
|
Commitments to extend credit | | $ | 51,457 | | $ | 64,243 |
Standby letters of credit | | $ | 5,050 | | $ | 5,213 |
Commitments to extend credit are agreements to lend to a customer as long as there is no violation of any condition established in the contract. Commitments to extend credit includes $51.5 million of unused lines of credit and $5.1 million to make loans as of December 31, 2020. Commitments generally have fixed expiration dates or other termination clauses and may require payment of a fee. Since many of the commitments are expected to expire without being drawn upon, the total commitment amounts do not necessarily represent future cash requirements. The Company evaluates each customer’s creditworthiness on a case-by-case basis. The amount of collateral obtained if deemed necessary by the Company upon extension of credit is based on management’s credit evaluation of the counterparty.
Standby letters of credit written are conditional commitments issued by the Company to guarantee the performance of a customer to a third party. The credit risk involved in issuing letters of credit is essentially the same as that involved in extending loan commitments to customers.
The Company maintains cash deposits with a financial institution that during the year are in excess of the insured limitation of the Federal Deposit Insurance Corporation. If the financial institution were not to honor its contractual liability, the Company could incur losses. Management is of the opinion that there is not material risk because of the financial strength of the institution.
Other Commitments
The Bank has entered into employment agreements with its Executive Chairman, Chief Executive Officer/Chief Financial Officer, and President/Chief Lending Officer/Chief Operations Officer. Each employment agreement provides for a base salary, an incentive bonus based upon the Company’s profitability, stock awards and other benefits commensurate with employment. The Bank may be obligated to make payments to each employee upon termination, with the timing and amount of the payment dependent upon the cause of termination. The agreements contain a contract term of 36 months, which is extended one year annually unless notice is given by the employee or the Board of Directors.
Contingencies
The Company's nature of business is such that it ordinarily results in a certain amount of litigation. In the opinion of management for the Company, there is no litigation in which the outcome will have a material effect on the financial statements.
104
NOTE 15 – FAIR VALUE
Financial Instruments Measured at Fair Value
Fair value is the exchange price that would be received for an asset or paid to transfer a liability (exit price) in the principal or most advantageous market for the asset or liability in an orderly transaction between market participants on the measurement date. There are three levels of inputs that may be used to measure fair values:
Level 1 inputs utilize quoted prices (unadjusted) in active markets for identical assets or liabilities that the Company has the ability to access.
Level 2 inputs are inputs other than quoted prices included in Level 1 that are observable for the asset or liability in active markets, as well as inputs that are observable for the asset or liability (other than quoted prices), such as interest rates, foreign exchange rates and yield curves that are observable at commonly quoted intervals.
Level 3 inputs are unobservable inputs for the asset or liability, which are typically based on an entity’s own assumptions, as there is little, if any, related market activity. In instances where the determination of the fair value measurement is based on inputs from different levels of the fair value hierarchy, the level in the fair value hierarchy within which the entire fair value measurement falls is based on the lowest level input that is significant to the fair value measurement in its entirety.
The Company’s assessment of the significance of a particular input to the fair value measurement in its entirety requires judgment, and considers factors specific to the asset or liability.
The following presents the assets and liabilities as of December 31, 2020 and 2019 which are measured at fair value on a recurring basis, aggregated by the level in the fair value hierarchy within which those measurements fall, and the financial instruments carried on the consolidated balance sheet by caption and by level in the fair value hierarchy, for which a nonrecurring change in fair value has been recorded:
| | December 31, 2020 | |||||||||||||
| | | | | | | | | | | | | | Total Gains | |
(Dollars in thousands) |
| Total |
| Level 1 |
| Level 2 |
| Level 3 |
| (Losses) | |||||
Assets |
| |
|
| |
|
| |
|
| |
|
| |
|
Recurring fair value measurements: |
| | |
| |
|
| |
|
| |
|
| |
|
Securities available for sale: |
| | |
| |
|
| |
|
| |
|
| |
|
Obligations of U.S. Government entities and agencies | | $ | 9,306 | | $ | — | | $ | — | | $ | 9,306 |
| |
|
States and political subdivisions | |
| 7,429 | | | — | |
| 7,429 | | | — |
| |
|
Mortgage-backed GSE residential | |
| 1,382 | | | — | |
| 1,382 | | | — |
| |
|
Total securities available for sale | |
| 18,117 | | | — | |
| 8,811 | |
| 9,306 |
| |
|
| | | | | | | | | | | | | | | |
SBA servicing asset | |
| 9,488 | | | — | | | — | |
| 9,488 |
| |
|
Interest only strip | |
| 155 | | | — | | | — | |
| 155 |
| |
|
| | $ | 27,760 | | $ | — | | $ | 8,811 | | $ | 18,949 | | | |
Nonrecurring fair value measurements: | |
|
| | | | |
|
| |
|
|
| |
|
Impaired loans | | $ | 2,523 | | $ | — | | $ | — | | $ | 2,523 | | $ | 324 |
Foreclosed real estate, net | | | 282 | | | — | | | — | | | 282 | | | (141) |
| | $ | 2,805 | | $ | — | | $ | — | | $ | 2,805 | | $ | 183 |
105
|
| December 31, 2019 | |||||||||||||
| | | | | | | | | | | | | | Total Gains | |
(Dollars in thousands) | | Total |
| Level 1 |
| Level 2 |
| Level 3 |
| (Losses) | |||||
Assets |
| |
|
| |
|
| |
|
| |
|
| |
|
Recurring fair value measurements: |
| |
|
| |
|
| |
|
| |
|
| |
|
Securities available for sale: |
| |
|
| |
|
| |
|
| |
|
| |
|
Obligations of U.S. Government entities and agencies | | $ | 12,436 | | $ | — | | $ | — | | $ | 12,436 |
| |
|
States and political subdivisions | |
| 1,279 | | | — | |
| 1,279 | | | — |
| |
|
Mortgage-backed GSE residential | |
| 1,980 | | | — | |
| 1,980 | | | — |
| |
|
Total securities available for sale | |
| 15,695 | | | — | |
| 3,259 | |
| 12,436 |
| |
|
| | | | | | | | | | | | | | | |
SBA servicing asset | |
| 8,162 | | | — | | | — | |
| 8,162 |
| |
|
Interest only strip | |
| 26 | | | — | | | — | |
| 26 |
| |
|
| | $ | 23,883 | | $ | — | | $ | 3,259 | | $ | 20,624 | | | |
Nonrecurring fair value measurements: | |
|
| | | | |
|
| |
|
|
| |
|
Impaired loans | | $ | 4,523 | | $ | — | | $ | — | | $ | 4,523 | | $ | 338 |
The Company used the following methods and significant assumptions to estimate fair value:
Securities, Available for Sales: The Company carries securities available for sale at fair value. For securities where quoted prices are not available (Level 2), the Company obtains fair value measurements from an independent pricing service. The fair value measurements consider observable data that may include dealer quotes, market spreads, cash flows, the U.S. Treasury yield curve, live trading levels, trade execution data, market consensus prepayment speeds, credit information and the bond’s terms and conditions, among other things. The investments in the Company’s portfolio are generally not quoted on an exchange but are actively traded in the secondary institutional markets.
The Company owns certain SBA investments that for which the fair value is determined using Level 3 hierarchy inputs and assumptions as the trading market for such securities was determined to be “not active.” This determination was based on the limited number of trades or, in certain cases, the existence of no reported trades. Discounted cash flows are calculated by a third party using interest rate curves that are updated to incorporate current market conditions, including prepayment vectors and credit risk. During time when trading is more liquid, broker quotes are used to validate the model.
SBA Servicing Assets and Interest Only Strip: The fair values of the Company’s servicing assets are determined using Level 3 inputs. All separately recognized servicing assets and servicing liabilities are initially measured at fair value initially and at each reporting date and changes in fair value are reported in earnings in the period in which they occur.
The fair values of the Company’s interest-only strips are determined using Level 3 inputs. When the Company sells loans to others, it may hold interest-only strips, which is an interest that continues to be held by the transferor in the securitized receivable. It may also obtain servicing assets or assume servicing liabilities that are initially measured at fair value. Gain or loss on sale of the receivables depends in part on both (a) the previous carrying amount of the financial assets involved in the transfer, allocated between the assets sold and the interests that continue to be held by the transferor based on their relative fair value at the date of transfer, and (b) the proceeds received. To obtain fair values, quoted market prices are used if available. However, quotes are generally not available for interests that continue to be held by the transferor, so the Company generally estimates fair value based on the future expected cash flows estimated using management’s best estimates of the key assumptions — credit losses and discount rates commensurate with the risks involved.
Under certain circumstances we make adjustments to fair value for our assets and liabilities although they are not measured at fair value on an ongoing basis.
Impaired loans: Impaired loans are evaluated and valued at the time the loan is identified as impaired, at the lower of cost or fair value. Fair value is measured based on the value of the collateral securing these loans and is classified at a Level 3 in the fair value hierarchy. Collateral may include real estate, or business assets including equipment, inventory
106
and accounts receivable. The value of real estate collateral is determined based on an appraisal by qualified licensed appraisers hired by the Company. The value of business equipment is based on an appraisal by qualified licensed appraisers hired by the Company if significant, or the equipment’s net book value on the business’ financial statements. Inventory and accounts receivable collateral are valued based on independent field examiner review or aging reports. Appraisals may utilize a single valuation approach or a combination or approaches including comparable sales and the income approach. Adjustments are routinely made in the appraisal process by the independent appraisers to adjust for differences between the comparable sales and income data available for similar loans and collateral underlying such loans. Appraised values are reviewed by management using historical knowledge, market considerations, and knowledge of the client and client’s business.
Foreclosed real estate: Foreclosed real estate is adjusted to fair value upon transfer of the loans to foreclosed real estate. Subsequently, foreclosed real estate is carried at the lower of carrying value or fair value. Fair value is based upon independent market prices or appraised values of the collateral and is classified as nonrecurring Level 3. Adjustments are routinely made in the appraisal process by the independent appraisers engaged by the Company to adjust for differences between the comparable sales. Appraised values are reviewed by management using our market knowledge and historical experience.
Changes in level 3 fair value measurements
The table below presents a reconciliation of assets and liabilities measured at fair value on a recurring basis using significant unobservable inputs (Level 3) for the years ended December 31, 2020, 2019 and 2018:
| | Obligations of | | SBA | | | | | | | ||
| | U.S. Government | | Servicing | | Interest Only | | | | |||
(Dollars in thousands) |
| Entities and Agencies |
| Asset |
| Strip |
| Liabilities | ||||
| | | | | | | | | | | | |
Fair value, January 1, 2020 | | $ | 12,436 | | $ | 8,162 | | $ | 26 | | $ | — |
Total gain included in income | |
| — | |
| 1,326 | |
| 129 | |
| — |
Settlements | |
| — | |
| — | |
| — | |
| — |
Prepayments/paydowns | |
| (3,130) | |
| — | |
| — | |
| — |
Transfers in and/or out of level 3 | |
| — | |
| — | |
| — | |
| — |
Fair value, December 31, 2020 | | $ | 9,306 | | $ | 9,488 | | $ | 155 | | $ | — |
| | | | | | | | | | | | |
Fair value, January 1, 2019 | | $ | 15,183 | | $ | 8,419 | | $ | 27 | | $ | — |
Total loss included in income | |
| — | |
| (257) | |
| (1) | |
| — |
Settlements | |
| — | |
| — | |
| — | |
| — |
Prepayments/paydowns | |
| (2,747) | |
| — | |
| — | |
| — |
Transfers in and/or out of level 3 | |
| — | |
| — | |
| — | |
| — |
Fair value, December 31, 2019 | | $ | 12,436 | | $ | 8,162 | | $ | 26 | | $ | — |
| | | | | | | | | | | | |
Fair value, January 1, 2018 | | $ | 16,661 | | $ | 9,329 | | $ | 36 | | $ | — |
Total loss included in income | |
| — | |
| (910) | |
| (9) | |
| — |
Settlements | |
| — | |
| — | |
| — | |
| — |
Prepayments/paydowns | |
| (1,478) | |
| — | |
| — | |
| — |
Transfers in and/or out of level 3 | |
| — | |
| — | |
| — | |
| — |
Fair value, December 31, 2018 | | $ | 15,183 | | $ | 8,419 | | $ | 27 | | $ | — |
107
There were no gains or losses included in earnings for securities measured at fair value on a recurring basis using significant unobservable inputs (Level 3) during the periods presented above. The only activity for these securities were prepayments. There were no purchases, sales, or transfers into and out of Level 3. The following table presents quantitative information about recurring Level 3 fair value measures at December 31, 2020 and 2019:
|
| Valuation |
| Unobservable |
| General |
| | Technique | | Input | | Range |
December 31, 2020 | | | | | | |
Recurring: | | | | | | |
Obligations of U.S. Government entities and agencies |
| Discounted Cash Flows |
| Discount Rate |
| 0%-3% |
SBA servicing asset and interest only strip |
| Discounted Cash Flows | | Prepayment speed |
| 14.04%-17.71% |
|
| | | Discount rate |
| 4.67%-10.89% |
Nonrecurring: | | | | | | |
Impaired loans | | Appraisal value less estimated selling costs | | Estimated selling costs | | 6% |
Foreclosed real estate | | Appraisal value less estimated selling costs | | Estimated selling costs | | 6% |
| | | | | | |
December 31, 2019 |
|
| |
|
|
|
Recurring: | | | | | | |
Obligations of U.S. Government entities and agencies | | Discounted Cash Flows | | Discount Rate | | 0%-3% |
SBA servicing asset and interest only strip | | Discounted Cash Flows | | Prepayment speed | | 10.82%-16.54% |
| | | | Discount rate | | 5.80%-12.06% |
Nonrecurring: | | | | | | |
Impaired Loans |
| Appraisal value less estimated selling costs | | Estimated selling costs | | 6% |
|
| | | |
| |
The carrying amounts and estimated fair values of the Company’s financial instruments at December 31, 2020 and 2019 are as follows:
| | Carrying | |
| Estimated Fair Value at December 31, 2020 | ||||||||||
(Dollars in thousands) |
| Amount |
| Level 1 |
| Level 2 |
| Level 3 |
| Total | |||||
Financial Assets: |
| |
|
| |
|
| |
|
| |
|
| |
|
Cash, due from banks, and federal funds sold | | $ | 150,688 | | $ | — | | $ | 150,688 | | $ | — | | $ | 150,688 |
Investment securities | |
| 18,117 | |
| — | |
| 8,811 | |
| 9,306 | |
| 18,117 |
FHLB stock | |
| 6,147 | |
| — | |
| — | |
| — | |
| N/A |
Loans, net | |
| 1,620,209 | |
| — | |
| — | |
| 1,665,413 | |
| 1,665,413 |
Accrued interest receivable | |
| 10,671 | |
| — | |
| — | |
| 10,671 | |
| 10,671 |
SBA servicing assets | |
| 9,488 | |
| — | |
| — | |
| 9,488 | |
| 9,488 |
Interest only strips | |
| 155 | |
| — | |
| — | |
| 155 | |
| 155 |
Mortgage servicing assets | |
| 12,991 | |
| — | |
| — | |
| 13,069 | |
| 13,069 |
Financial Liabilities: | |
| | |
|
| |
|
| |
|
| |
| |
Deposits | |
| 1,479,889 | |
| — | |
| 1,480,777 | |
| — | |
| 1,480,777 |
Federal Home Loan Bank advances | | | 110,000 | | | — | | | 110,000 | | | — | | | 110,000 |
Other borrowings | |
| 483 | |
| — | |
| 483 | |
| — | |
| 483 |
Accrued interest payable | |
| 222 | |
| — | |
| 222 | |
| — | |
| 222 |
108
| | Carrying | | Estimated Fair Value at December 31, 2019 | |||||||||||
(Dollars in thousands) |
| Amount |
| Level 1 |
| Level 2 |
| Level 3 |
| Total | |||||
Financial Assets: |
| |
|
| |
|
| |
|
| |
|
| |
|
Cash, due from banks, and federal funds sold | | $ | 276,413 | | $ | — | | $ | 276,413 | | $ | — | | $ | 276,413 |
Securities purchased under agreements to resell | |
| 15,000 | |
| — | |
| 15,000 | |
| — | |
| 15,000 |
Investment securities | |
| 15,695 | |
| — | |
| 3,259 | |
| 12,436 | |
| 15,695 |
FHLB stock | |
| 3,842 | |
| — | |
| — | |
| — | |
| N/A |
Loans, net | |
| 1,154,323 | |
| — | |
| — | |
| 1,169,214 | |
| 1,169,214 |
Loans held for sale | |
| 85,793 | |
| — | |
| 88,178 | |
| — | |
| 88,178 |
Accrued interest receivable | |
| 5,101 | |
| — | |
| — | |
| 5,101 | |
| 5,101 |
SBA servicing asset | |
| 8,162 | |
| — | |
| — | |
| 8,162 | |
| 8,162 |
Interest only strips | |
| 26 | |
| — | |
| — | |
| 26 | |
| 26 |
Mortgage servicing assets | |
| 18,068 | |
| — | |
| — | |
| 19,035 | |
| 19,035 |
Financial Liabilities: | |
| | |
|
| |
|
| |
|
| |
| |
Deposits | |
| 1,307,377 | |
| — | |
| 1,308,946 | |
| — | |
| 1,308,946 |
Federal Home Loan Bank advances | |
| 60,000 | | | — | | | 60,000 | | | — | | | 60,000 |
Other borrowings | | | 3,129 | | | | | | 3,129 | | | — | | | 3,129 |
Accrued interest payable | |
| 890 | |
| — | |
| 890 | |
| — | |
| 890 |
NOTE 16 – REGULATORY MATTERS
Banks and bank holding companies are subject to regulatory capital requirements administered by federal banking agencies. Capital adequacy guidelines and, additionally for banks, prompt corrective action regulations, involve quantitative measures of assets, liabilities, and certain off-balance sheet items calculated under regulatory practices. Capital amounts and classifications are also subject to qualitative judgments by regulators. Failure to meet capital requirements can initiate regulatory action. The final rules implementing Basel Committee on Banking Supervision’s capital guidelines for U.S. banks (“Basel III rules”) became effective for the Bank on January 1, 2015 with full compliance with all of the requirements being phased in over a multi-year schedule, and fully phased in by January 1, 2019. Under the Basel III rules, the Bank must hold a capital conservation buffer of 2.50% above the adequately capitalized risk-based capital ratios. The net unrealized gain or loss on available for sale securities, if any, is not included in computing regulatory capital. Management believes as of December 31, 2020, the Company and Bank meets all capital adequacy requirements to which they are subject.
Prompt corrective action regulations provide five classifications: well capitalized, adequately capitalized, undercapitalized, significantly undercapitalized, and critically undercapitalized, although these terms are not used to represent overall financial condition. If adequately capitalized, regulatory approval is required to accept brokered deposits. If undercapitalized, capital distributions are limited, as is asset growth and expansion, and capital restoration plans are required. At December 31, 2020 and 2019, the most recent regulatory notifications categorized the Bank as well capitalized under the regulatory framework for prompt corrective action. There are no conditions or events since that notification that management believes have changed the institution’s category.
109
The actual capital amounts (in thousands) and ratios of the Company and Bank are presented in the following table:
| | | | | | | | | | | To Be Well Capitalized |
| ||
| | | | | | | Minimum Capital Required - | | Under Prompt Corrective |
| ||||
(Dollars in thousands) | | Actual | | Basel III | | Action Provisions: |
| |||||||
|
| Amount |
| Ratio |
| Amount ≥ |
| Ratio ≥ |
| Amount ≥ |
| Ratio ≥ |
| |
As of December 31, 2020 | | | | | | | | | | | | | | |
Total Capital (to Risk Weighted Assets) | | | | | | | | | | | | | | |
Consolidated | | $ | 245,128 | | 20.86 | % | N/A | | N/A | | N/A |
| N/A | |
Bank | |
| 229,493 | | 19.54 | % | 123,314 |
| 10.5 | % | 117,442 |
| 10.0 | % |
Tier I Capital (to Risk Weighted Assets) | | | | | | | | | | | | | | |
Consolidated | |
| 234,993 | | 20.00 | % | N/A | | N/A | | N/A |
| N/A | |
Bank | |
| 219,357 | | 18.68 | % | 99,826 |
| 8.5 | % | 93,954 |
| 8.0 | % |
Common Tier 1 (CET1) | | | | | | | | | | | | | | |
Consolidated | |
| 234,993 | | 20.00 | % | N/A | | N/A | | N/A |
| N/A | |
Bank | |
| 219,357 | | 18.68 | % | 82,209 |
| 7.0 | % | 76,337 |
| 6.5 | % |
Tier 1 Capital (to Average Assets) | | | | | | | | | | | | | | |
Consolidated | |
| 234,993 | | 13.44 | % | N/A | | N/A | | N/A |
| N/A | |
Bank | |
| 219,357 | | 12.55 | % | 69,937 |
| 4.0 | % | 87,421 |
| 5.0 | % |
As of December 31, 2019 | | | | | | | | | | | | | | |
Total Capital (to Risk Weighted Assets) | | | | | | | | | | | | | | |
Consolidated | | $ | 215,377 |
| 22.01 | % | N/A | | N/A | | N/A |
| N/A | |
Bank | |
| 199,539 |
| 20.40 | % | 102,705 |
| 10.5 | % | 97,814 |
| 10.0 | % |
Tier I Capital (to Risk Weighted Assets) | | | | | | | | | | | | | | |
Consolidated | |
| 208,538 |
| 21.31 | % | N/A | | N/A | | N/A |
| N/A | |
Bank | |
| 192,700 |
| 19.70 | % | 83,142 |
| 8.5 | % | 78,251 |
| 8.0 | % |
Common Tier 1 (CET1) | | | | | | | | | | | | | | |
Consolidated | |
| 208,538 |
| 21.31 | % | N/A | | N/A | | N/A |
| N/A | |
Bank | |
| 192,700 |
| 19.70 | % | 68,470 |
| 7.0 | % | 63,579 |
| 6.5 | % |
Tier 1 Capital (to Average Assets) | | | | | | | | | | | | | | |
Consolidated | |
| 208,538 |
| 12.70 | % | N/A | | N/A | | N/A |
| N/A | |
Bank | |
| 192,700 |
| 11.74 | % | 65,655 |
| 4.0 | % | 82,069 |
| 5.0 | % |
The sole source of funds available to pay stockholder dividends is from the Company’s earnings. Bank regulatory authorities impose restrictions on the amount of dividends that may be declared by the Company. Further restrictions could result from a review by regulatory authorities of the Company’s capital adequacy. For the years ended December 31, 2020, 2019 and 2018, $10.3 million, $10.4 million and $9.3 million in common dividends were declared and paid, respectively. During 2020, the Bank could, without prior approval, declare dividends of approximately $18.2 million.
110
NOTE 17 – OTHER EXPENSES
Significant components of other expenses for the years ended December 31, 2020, 2019, and 2018 are as follows:
| | December 31, | |||||||
(Dollars in thousands) |
| 2020 | | 2019 |
| 2018 | |||
Professional fees | | $ | 1,263 | | | 1,168 | | $ | 1,029 |
Miscellaneous loan related | |
| 1,863 | | | 2,187 | |
| 3,503 |
Bank security | |
| 1,037 | | | 1,283 | |
| 1,003 |
Phone and data service | |
| 787 | | | 678 | |
| 617 |
Director fees | | | 383 | | | 366 | | | 333 |
Other | | | 3,540 | | | 2,971 | | | 3,017 |
Total other expenses | | $ | 8,873 | | | 8,653 | | $ | 9,502 |
NOTE 18 – CONDENSED PARENT COMPANY ONLY FINANCIAL STATEMENTS
Financial statements of MetroCity Bankshares, Inc. (parent company only) are as follows:
Condensed Balance Sheets
| | December 31, | ||||
(Dollars in thousands) |
| 2020 |
| 2019 | ||
Assets: | | | | | | |
Cash and due from banks* | | $ | 15,742 | | $ | 15,991 |
Investment in bank subsidiary* | |
| 229,195 | |
| 200,886 |
Other assets | | | 380 | | | 367 |
Total assets | | $ | 245,317 | | $ | 217,244 |
| | | | | | |
Liabilities: | | | | | | |
Accrued expenses and other liabilities | | $ | 486 | | $ | 520 |
Total liabilities | | | 486 | | | 520 |
Shareholders' equity: | | | | | | |
Preferred stock | | | — | | | — |
Common stock | | | 257 | | | 255 |
Additional paid-in-capital | | | 55,674 | | | 53,854 |
Retained earnings | | | 188,705 | | | 162,616 |
Accumulated other comprehensive income (loss) | | | 195 | | | (1) |
Total shareholders' equity | | | 244,831 | | | 216,724 |
Total liabilities shareholders' equity | | $ | 245,317 | | $ | 217,244 |
* Eliminated in consolidation
111
Condensed Statements of Income
| | Years Ended December 31, | |||||||
(Dollars in thousands) |
| 2020 | | 2019 |
| 2018 | |||
Income: | | | | | | | | | |
Dividends receive from bank subsidiary* | | $ | 10,305 | | $ | 10,402 | | $ | 9,291 |
Interest income* | | | 123 | | | 48 | | | 24 |
Total income | | | 10,428 | | | 10,450 | | | 9,315 |
Expenses: | | | | | | | | | |
Other expense | | | 379 | | | 174 | | | 96 |
Total expenses | | | 379 | | | 174 | | | 96 |
Income before taxes and equity in undistributed income of subsidiary | | | 10,049 | | | 10,276 | | | 9,219 |
Income tax benefit | | | 54 | | | 26 | | | 29 |
Income before equity in undistributed income of subsidiary | | | 10,103 | | | 10,302 | | | 9,248 |
Equity in undistributed income of subsidiary* | | | 26,291 | | | 34,416 | | | 32,086 |
Net Income | | $ | 36,394 | | $ | 44,718 | | $ | 41,334 |
* Eliminated in consolidation
Condensed Statements of Cash Flows
| | Years Ended December 31, | |||||||
(Dollars in thousands) |
| 2020 | | 2019 |
| 2018 | |||
Cash flows from operating activities: | | | | | | | | | |
Net income | | $ | 36,394 | | $ | 44,718 | | $ | 41,334 |
Adjustments to reconcile net income to net cash provided by operating activities: | | | | | | | | | |
Equity in undistributed net income of subsidiary | | | (26,291) | | | (34,416) | | | (32,086) |
(Increase) decrease in other assets | | | (13) | | | 938 | | | (924) |
(Decrease) increase in accrued expenses and other liabilities | | | (54) | | | 92 | | | 42 |
Net cash provided by operating activities | | | 10,036 | | | 11,332 | | | 8,366 |
| | | | | | | | | |
Cash flows from operating activities: | | | | | | | | | |
Net cash (used) provided by investing activities | | | — | | | — | | | — |
| | | | | | | | | |
Cash flows from financing activities: | | | | | | | | | |
Issuance of common stock, net of expenses | | | — | | | 13,911 | | | — |
Exercise of stock options | | | — | | | — | | | — |
Repurchase of common stock | | | — | | | (1,485) | | | — |
Dividends paid on common stock | | | (10,285) | | | (10,367) | | | (9,224) |
Net cash (used) provided by financing activities | | | (10,285) | | | 2,059 | | | (9,224) |
Net (decrease) increase in cash and cash equivalents | | | (249) | | | 13,391 | | | (858) |
Cash and cash equivalents, beginning of year | | | 15,991 | | | 2,600 | | | 3,458 |
Cash and cash equivalents, end of year | | $ | 15,742 | | $ | 15,991 | | $ | 2,600 |
112
Item 9. Changes in and Disagreements With Accountants on Accounting and Financial Disclosure
None.
Item 9A. Controls and Procedures
Evaluation of Disclosure Controls and Procedures
The Company’s management, including the Chief Executive Officer and Chief Financial Officer, conducted an evaluation of the effectiveness of the Company’s disclosure controls and procedures (as defined in Rules 13a-15(e) and 15d-15(e) under the Securities Exchange Act of 1934, as amended (the “Exchange Act”)) as of December 31, 2019. The Company’s disclosure controls and procedures are designed to ensure that information required to be disclosed by the Company in the reports that it files or submits under the Exchange Act is recorded, processed, summarized, and reported within the time periods specified in the U.S. Securities and Exchange Commission’s rules and forms, and that such information is accumulated and communicated to the Company’s management, including the Company’s Chief Executive Officer and Chief Financial Officer, to allow timely decisions regarding required disclosure. Based on this evaluation, the Chief Executive Officer and Chief Financial Officer concluded that the Company’s disclosure controls and procedures were effective as of December 31, 2020.
Management’s Annual Report on Internal Control Over Financial Reporting
The management of the Company is responsible for establishing and maintaining adequate internal control over financial reporting. The Company’s internal control system was designed to provide reasonable assurance to the Company’s management and board of directors regarding the preparation and fair presentation of the financial statements. No matter how well designed, internal control over financial reporting has inherent limitations, including the possibility that a control can be circumvented or overridden, and misstatements due to error or fraud may occur and not be detected. Therefore, even those systems determined to be effective can provide only reasonable assurance with respect to financial statement preparation and presentation.
The Company’s management assessed the effectiveness of the Company’s internal control over financial reporting as of December 31, 2020. In making this assessment, it used the criteria set forth by the Committee of Sponsoring Organizations of the Treadway Commission (COSO) in Internal Control-Integrated Framework (2013).
Based on this assessment management has determined that, as of December 31, 2020, the Company’s internal control over financial reporting is effective based on the specified criteria.
This Annual Report does not include an attestation report from our registered public accounting firm regarding our internal control over financial reporting. Management’s report was not subject to attestation by our registered public accounting firm pursuant to rules of the SEC that permit emerging growth companies, which we are, to provide only Management’s Annual Report on Internal Control over Financial Reporting in this Annual Report.
Changes in Internal Control over Financial Reporting
There were no changes in the Company’s internal control over financial reporting (as such term is defined in Rule 13a-15(e) and 15d-15(f) under the Exchange Act) during the fourth quarter ended December 31, 2020, that have materially affected, or are reasonably likely to materially affect, the Company’s internal control over financial reporting. There has also been no significant impact to internal controls over financial reporting as a result of the COVID-19 pandemic. The Company is continually monitoring and assessing changes in processes and activities to determine any potential impact on the design and operating effectiveness of internal controls over financial reporting.
Limitations on the Effectiveness of Controls
The Company’s management recognizes that a control system, no matter how well conceived and operated, can provide only reasonable, not absolute, assurance that the objectives of the control system are met. Further, the design of a
113
control system must reflect the fact that there are resource constraints, and the benefits of controls must be considered relative to their costs. Because of the inherent limitations in all control systems, no evaluation of controls can provide absolute assurance that all control issues, errors and instances of fraud, if any, within the Company have been detected.
None.
Item 10. Directors, Executive Officers and Corporate Governance
The information required in Part III, Item 10 of this Annual Report will be under the headings “Proposal 1—Election of Directors,” “Current Executive Officers,” “Corporate Governance and the Board of Directors” and “Section 16(a) Beneficial Ownership Reporting Compliance” in the Company’s definitive proxy statement for the 2021 Annual Meeting of Shareholders, incorporated herein by reference.
Item 11. Executive Compensation
The information required in Part III, Item 11 of this Annual Report will be under the headings “Executive Compensation and Other Matters” and “Corporate Governance and the Board of Directors” in the Company’s definitive proxy statement for the 2021 Annual Meeting of Shareholders, incorporated herein by reference.
Item 12. Security Ownership of Certain Beneficial Owners and Management and Related Shareholder Matters
The following table provides information as of December 31, 2020 regarding stock-based compensation awards outstanding and available for future grants under the Company’s equity compensation plans.
| | (A) | | (B) | | (C) |
| | | | | | Number of |
| | | | | | Securities Remaining |
| | Number of | | | | Available for Future |
| | Securities to be | | Weighted Average | | Issuance Under Equity |
| | Issued upon Exercise | | Exercise Price | | Compensation Plans |
| | of Outstanding | | of Outstanding | | (Excluding Securities |
| | Options, Warrants | | Options, Warrants | | Reflected in |
|
| and Rights |
| and Rights |
| Column (A)) |
Equity compensation plans approved by shareholders |
| 240,000 |
| $12.70 |
| 2,038,189 |
Equity compensation plans not approved by shareholders |
| — |
| — |
| — |
Total |
| 240,000 | | 12.70 | | 2,038,189 |
The remaining information required in Part III, Item 12 of this Annual Report will be under the heading “Beneficial Ownership of the Company’s Common Stock by Management and Principal Shareholders of the Company” in the Company’s definitive proxy statement for the 2021 Annual Meeting of Shareholders, incorporated herein by reference.
Item 13. Certain Relationships and Related Transactions, and Director Independence
The information required in Part III, Item 13 of this Annual Report will be under the headings “Certain Relationships and Related Person Transactions” and “Corporate Governance and the Board of Directors” in the Company’s definitive proxy statement for the 2021 Annual Meeting of Shareholders, incorporated herein by reference.
114
Item 14. Principal Accounting Fees and Services
The information required in Part III, Item 14 of this Annual Report will be under the heading “Proposal 2 – Ratification of the Appointment of Independent Registered Public Accounting Firm” in the Company’s definitive proxy statement for the 2021 Annual Meeting of Shareholders, incorporated herein by reference.
Item 15. Exhibits, Financial Statement Schedules
| (a) | The following documents are filed as part of this report: |
| (1) | Financial Statements (Part II - Item 8. Financial Statements and Supplementary Data): |
(i) Report of Independent Registered Public Accounting Firm
(ii) Consolidated Balance Sheets at December 31, 2020 and 2019
(iii) Consolidated Statements of Income for the Years Ended December 31, 2020, 2019 and 2018
(iv) Consolidated Statements of Comprehensive Income for the Years Ended December 31, 2020, 2019 and 2018
(v) Consolidated Statements of Shareholder’s Equity for the Years Ended December 31, 2020, 2019 and 2018
(vi) Consolidated Statements of Cash Flows for the Years Ended December 31, 2020, 2019 and 2018
(vii) Notes to the Consolidated Financial Statements
| (2) | Financial Statement Schedules: All financial statement schedules are omitted because they are not required or applicable, or the required information is shown in the Consolidated Financial Statements or the Notes thereto. |
| (3) | Exhibits: Included in schedule below. |
| (b) | Exhibits: |
Exhibit No. |
| Description of Exhibit |
| | |
3.1 | | |
3.2 | | |
4.1 | | |
10.1 | | |
10.2 | | |
10.3 | | |
115
10.5 | | |
21.1 | | |
23.1 | | |
24.1 | | Power of Attorney contained on the signature pages of this 2020 Annual Report on Form 10-K and incorporated herein by reference |
31.1 | | |
31.2 | | |
32.1 | | |
32.2 | | |
101.INS | | XBRL Instance Document |
101.SCH | | XBRL Taxonomy Extension Schema Document |
101.CAL | | XBRL Taxonomy Extension Calculation Linkbase Document |
101.DEF | | XBRL Taxonomy Extension Definition Linkbase Document |
101.LAB | | XBRL Taxonomy Extension Label Linkbase |
101.PRE | | XBRL Taxonomy Extension Presentation Linkbase Document |
* Management contract or compensatory plan or arrangement
None.
116
Pursuant to the requirements of the section 13 or 15(d) of the Securities Exchange Act of 1934, the registrant has duly caused this report to be signed on its behalf by the undersigned, thereunto duly authorized.
| METROCITY BANKSHARES, INC. | |
| | |
Date: March 15, 2021 | By: | /s/ Nack Y. Paek |
| | Nack Y. Paek |
| | Chairman and Chief Executive Officer (Principal Executive Officer) |
Date: March 15, 2021 | By: | /s/ Farid Tan |
| | Farid Tan |
| | President and Chief Financial Officer (Principal Financial and Accounting Officer) |
117
KNOW ALL PERSONS BY THESE PRESENTS, that each person whose signature appears below hereby constitutes and appoints Nack Y. Paek and Farid Tan, with full power to act without the other, his or her true and lawful attorney-in-fact and agent, with full and several powers of substitution and resubstitution, for him or her and in his or her name, place and stead, in any and all capacities, to sign any and all amendments to this Annual Report on Form 10-K, and to file the same, with all exhibits thereto and other documents in connection therewith, with the Securities and Exchange Commission, and hereby grants to such attorneys-in-fact and agents, and each of them, full power and authority to do and perform each and every act and thing requisite and necessary to be done, as fully as to all intents and purposes as each of the undersigned might or could do in person, hereby ratifying and confirming all that said attorneys-in-fact and agents, or any of them, or their or his substitute or substitutes, may lawfully do or cause to be done by virtue hereof.
Pursuant to the requirements of the Securities Exchange Act of 1934, this report has been signed by the following persons on behalf of the registrant and in their capacities and on the dates indicated.
Signature |
| Title |
| Date |
| | | | |
/s/ Nack Y. Paek | | Chairman; Chief Executive Officer | | March 15, 2021 |
Nack Y. Paek | | (principal executive officer) | | |
| | | | |
/s/ Farid Tan | | President; Chief Financial Officer | | March 15, 2021 |
Farid Tan | | (principal financial and accounting officer) | | |
| | | | |
/s/ William J. Hungeling | | Director | | March 15, 2021 |
William J. Hungeling | | | | |
| | | | |
/s/ Howard Hwasaeng Kim | | Director | | March 15, 2021 |
Howard Hwasaeng Kim | | | | |
| | | | |
/s/ Francis Lai | | Director | | March 15, 2021 |
Francis Lai | | | | |
| | | | |
/s/ Don Leung | | Director | | March 15, 2021 |
Don Leung | | | | |
| | | | |
/s/ Feiying Lu | | Director | | March 15, 2021 |
Feiying Lu | | | | |
| | | | |
/s/ Young Park | | Director | | March 15, 2021 |
Young Park | | | | |
| | | | |
/s/ Ajit Patel | | Director | | March 15, 2021 |
Ajit Patel | | | | |
| | | | |
/s/ Frank S. Rhee | | Director | | March 15, 2021 |
Frank S. Rhee | | | | |
| | | | |
/s/ Sam Sang-Koo Shim | | Director | | March 15, 2021 |
Sam Sang-Koo Shim | | | | |
118