Attached files
| file | filename |
|---|---|
| EX-32.1 - EX-32.1 - MediaAlpha, Inc. | max-ex321_6.htm |
| EX-31.2 - EX-31.2 - MediaAlpha, Inc. | max-ex312_8.htm |
| EX-31.1 - EX-31.1 - MediaAlpha, Inc. | max-ex311_9.htm |
| EX-23.1 - EX-23.1 - MediaAlpha, Inc. | max-ex231_779.htm |
UNITED STATES
SECURITIES AND EXCHANGE COMMISSION
Washington, D.C. 20549
FORM 10-K
(Mark One)
|
☒ |
ANNUAL REPORT PURSUANT TO SECTION 13 OR 15(d) OF THE SECURITIES EXCHANGE ACT OF 1934 |
For the fiscal year ended December 31, 2020
OR
|
☐ |
TRANSITION REPORT PURSUANT TO SECTION 13 OR 15(d) OF THE SECURITIES EXCHANGE ACT OF 1934 FOR THE TRANSITION PERIOD FROM TO |
Commission File Number 001-39671
MediaAlpha, Inc.
(Exact name of Registrant as specified in its Charter)
|
Delaware |
85-1854133 |
|
(State or other jurisdiction of incorporation or organization) |
(I.R.S. Employer Identification No.) |
700 South Flower Street, Suite 640
Los Angeles, California 90017
(Address of principal executive offices, including zip code)
(213) 316-6256
(Registrant's telephone number, including area code)
Securities registered pursuant to Section 12(b) of the Act:
|
Title of each class |
|
Trading Symbol(s) |
|
Name of each exchange on which registered |
|
Class A Common Stock, $0.01 par value per share |
|
MAX |
|
NYSE |
Securities registered pursuant to Section 12(g) of the Act: None
Indicate by check mark if the Registrant is a well-known seasoned issuer, as defined in Rule 405 of the Securities Act. YES ☐ NO ☒
Indicate by check mark if the Registrant is not required to file reports pursuant to Section 13 or 15(d) of the Act. YES ☐ NO ☒
Indicate by check mark whether the Registrant: (1) has filed all reports required to be filed by Section 13 or 15(d) of the Securities Exchange Act of 1934 during the preceding 12 months (or for such shorter period that the Registrant was required to file such reports), and (2) has been subject to such filing requirements for the past 90 days. YES ☒ NO☐
Indicate by check mark whether the Registrant has submitted electronically every Interactive Data File required to be submitted pursuant to Rule 405 of Regulation S-T (§232.405 of this chapter) during the preceding 12 months (or for such shorter period that the Registrant was required to submit such files). YES ☒ NO ☐
Indicate by check mark whether the registrant is a large accelerated filer, an accelerated filer, a non-accelerated filer, smaller reporting company, or an emerging growth company. See the definitions of “large accelerated filer,” “accelerated filer,” “smaller reporting company,” and “emerging growth company” in Rule 12b-2 of the Exchange Act.
|
Large accelerated filer |
|
☐ |
|
Accelerated filer |
|
☐ |
|
|
|
|
|
|
|
|
|
Non-accelerated filer |
|
☒ |
|
Smaller reporting company |
|
☐ |
|
|
|
|
|
|
|
|
|
Emerging growth company |
|
☒ |
|
|
|
|
If an emerging growth company, indicate by check mark if the registrant has elected not to use the extended transition period for complying with any new or revised financial accounting standards provided pursuant to Section 13(a) of the Exchange Act. ☐
Indicate by check mark whether the registrant has filed a report on and attestation to its management’s assessment of the effectiveness of its internal control over financial reporting under Section 404(b) of the Sarbanes-Oxley Act (15 U.S.C. 7262(b)) by the registered public accounting firm that prepared or issued its audit report. ☐
Indicate by check mark whether the Registrant is a shell company (as defined in Rule 12b-2 of the Exchange Act). YES ☐ NO ☒
The aggregate market value of the Registrant’s Class A Common Stock held by non-affiliates of the Registrant was approximately $359.9 million based on the closing market price as of the close of business on October 28, 2020, the first day of trading on the New York Stock Exchange of the Registrant’s Class A Common Stock.
As of February 26, 2021, there were 33,815,086 shares of MediaAlpha, Inc.'s Class A common stock, $0.01 par value per share, and 25,536,043 shares of MediaAlpha, Inc.’s Class B common stock, par value $0.01 per share, outstanding.
DOCUMENTS INCORPORATED BY REFERENCE
None.
|
|
|
Page |
|
PART I |
|
|
|
Item 1. |
6 |
|
|
Item 1A. |
21 |
|
|
Item 1B. |
55 |
|
|
Item 2. |
55 |
|
|
Item 3. |
55 |
|
|
Item 4. |
55 |
|
|
|
|
|
|
PART II |
|
|
|
Item 5. |
56 |
|
|
Item 6. |
57 |
|
|
Item 7. |
Management’s Discussion and Analysis of Financial Condition and Results of Operations |
58 |
|
Item 7A. |
81 |
|
|
Item 8. |
82 |
|
|
Item 9. |
Changes in and Disagreements With Accountants on Accounting and Financial Disclosure |
114 |
|
Item 9A. |
114 |
|
|
Item 9B. |
115 |
|
|
|
|
|
|
PART III |
|
|
|
Item 10. |
116 |
|
|
Item 11. |
122 |
|
|
Item 12. |
Security Ownership of Certain Beneficial Owners and Management and Related Stockholder Matters |
128 |
|
Item 13. |
Certain Relationships and Related Transactions, and Director Independence |
130 |
|
Item 14. |
132 |
|
|
|
|
|
|
PART IV |
|
|
|
Item 15. |
134 |
|
|
Item 16 |
136 |
1
As used in this Annual Report on Form 10-K:
|
|
• |
“Class A-1 units” refers to the Class A-1 units of QL Holdings LLC (“QLH”). |
|
|
• |
“Class B-1 units” refers to the Class B-1 units of QLH. |
|
|
• |
“CAGR” means compound annual growth rate. |
|
|
• |
“Consumer Referral” means any consumer click, call or lead purchased by a buyer on our platform. |
|
|
• |
“Consumers” and “customers” refer interchangeably to end consumers. Examples include individuals shopping for insurance policies. |
|
|
• |
“Digital consumer traffic” refers to visitors to the mobile, tablet, desktop and other digital platforms of our supply partners, as well as to our proprietary websites. |
|
|
• |
“Direct-to-consumer” or “DTC” means the sale of insurance products or services directly to end consumers, without the use of retailers, brokers, agents or other intermediaries. |
|
|
• |
“Distributor” means any company or individual that is involved in the distribution of insurance, such as an insurance agent or broker. |
|
|
• |
“Founders” means, collectively, Steven Yi, Eugene Nonko, and Ambrose Wang. |
|
|
• |
“High-intent” consumer or customer means an in-market consumer that is actively browsing, researching or comparing the types of products or services that our partners sell. |
|
|
• |
“Insignia” means Insignia Capital Group, L.P. and its affiliates. |
|
|
• |
“InsurTech” means insurance technology. |
|
|
• |
“Intermediate Holdco” means Guilford Holdings, Inc., our wholly owned subsidiary and the owner of all Class A-1 units, after giving effect to the IPO. |
|
|
• |
“Inventory,” when referring to our supply partners, means the volume of Consumer Referral opportunities. |
|
|
• |
“IPO” means our initial public offering of our Class A common stock on October 30, 2020. |
|
|
• |
“Legacy Profits Interest Holders” means certain current or former employees of QLH or its subsidiaries (other than the Senior Executives), who indirectly held Class B units in QLH prior to our IPO, and includes any estate planning vehicles or other holding companies through which such persons hold their units in QLH. |
|
|
• |
“Lifetime value” or “LTV” is a type of metric that many of our business partners use to measure the estimated total worth to a business of a customer over the expected period of their relationship. |
|
|
• |
“NAIC” means the National Association of Insurance Commissioners. |
|
|
• |
“Open platform” refers to one of our two business models. In open platform transactions, we have separate agreements with demand partners and suppliers. We earn fees from our demand partners and separately pay a revenue share to suppliers and a fee to Internet search companies to drive consumers to our proprietary websites. |
|
|
• |
“Partner” refers to a buyer or seller on our platform, also referred to as “demand partners” and “supply partners,” respectively. |
|
|
o |
“Demand partner” refers to a buyer on our platform. As discussed under Item 2. Management’s Discussion & Analysis – Management Overview, our demand partners are generally insurance carriers and distributors looking to target high-intent consumers deep in their purchase journey. |
|
|
o |
“Supply partner” or “supplier” refers to a seller to our platform. As discussed under Item 2. Management’s Discussion & Analysis – Management Overview, our supply partners are primarily insurance carriers looking to maximize the value of non-converting or low LTV consumers, and insurance-focused research destinations looking to monetize high-intent consumers. |
2
|
|
• |
“Proprietary” means, when used in reference to our properties, the websites and other digital properties that we own and operate. Our proprietary properties are a source of Consumer Referrals on our platform. |
|
|
• |
“Reorganization Transaction” means the series of reorganization transactions completed on October 27, 2020 in connection with our IPO, as described under Part II, Item 8 “Financial Statements and Supplementary Data - Note 1 to the Consolidated Financial Statements – Organization and Background” of this Annual Report on Form 10-K. |
|
|
• |
“Senior Executives” means the Founders and the following officers at the Company that held Class B units in QLH prior to the IPO: Keith Cramer, Tigran Sinanyan, Lance Martinez, Brian Mikalis, Robert Perine, Jeff Sweetser, Serge Topjian, and Amy Yeh. This term also includes any estate planning vehicles or other holding companies through which such persons hold their units in QLH. |
|
|
• |
“Selling Class B-1 Unit Holders” means Insignia, the Senior Executives, and the Legacy Profits Interests Holders, who sold a portion of their Class B-1 units to Intermediate Holdco in connection with the IPO. |
|
|
• |
“Transaction Value” means the total gross dollars transacted by our partners on our platform. |
|
|
• |
“Vertical” means a market dedicated to a specific set of products or services sold to end consumers. Examples include property & casualty insurance, life insurance, health insurance, and travel. |
|
|
• |
“White Mountains” means White Mountains Insurance Group, Ltd. and its affiliates. |
|
|
• |
“Yield” means the return to our sellers on their inventory of Consumer Referrals sold on our platform. |
3
Cautionary note regarding forward-looking statements
We are including this Cautionary Statement to caution investors and qualify for the safe harbor provisions of the Private Securities Litigation Reform Act of 1995 (the "Act") for forward-looking statements. This Annual Report on Form 10-K contains forward-looking statements. These forward-looking statements reflect our current views with respect to, among other things, future events and our financial performance. These statements are often, but not always, made through the use of words or phrases such as “may,” “should,” “could,” “predict,” “potential,” “believe,” “will likely result,” “expect,” “continue,” “will,” “anticipate,” “seek,” “estimate,” “intend,” “plan,” “projection,” “would,” and “outlook,” or the negative version of those words or other comparable words or phrases of a future or forward-looking nature. These forward-looking statements are not historical facts, and are based on current expectations, estimates and projections about our industry, management’s beliefs and certain assumptions made by management, many of which, by their nature, are inherently uncertain and beyond our control. Accordingly, we caution you that any such forward-looking statements are not guarantees of future performance and are subject to risks, assumptions and uncertainties that are difficult to predict. Although we believe that the expectations reflected in these forward-looking statements are reasonable as of the date made, actual results may prove to be materially different from the results expressed or implied by the forward-looking statements.
Risk Factor Summary
There are or will be important factors that could cause our actual results to differ materially from those indicated in these forward-looking statements, including, but not limited to, the following:
|
|
• |
Our ability to attract and retain insurance carriers to our platform and to make available quality Consumer Referrals at attractive volumes and prices to drive transactions on our platform; |
|
|
• |
Our reliance on a limited number of insurance carriers, many of which have no long-term contractual commitments with us, and any potential termination of those relationships; |
|
|
• |
Existing and future laws and regulations affecting the property & casualty insurance, health insurance and life insurance verticals; |
|
|
• |
Changes and developments in the regulation of the underlying industries in which our partners operate; |
|
|
• |
Competition with other technology companies engaged in digital customer acquisition, as well as buyers that attract consumers through their own customer acquisition strategies, third-party online platforms or other traditional methods of distribution; |
|
|
• |
Our ability to attract, integrate and retain qualified employees; |
|
|
• |
Reductions in DTC digital spend by our buyers; |
|
|
• |
Our dependence on supply partners for the generation of a majority of our Consumer Referrals; |
|
|
• |
Our dependence on internet search companies to direct a significant portion of visitors to our suppliers’ websites and our proprietary websites; |
|
|
• |
The novel strain of the coronavirus and the disease it causes (COVID-19); |
|
|
• |
Our existing and future indebtedness; |
|
|
• |
Disruption to operations as a result of future acquisitions; |
|
|
• |
Failure to obtain, maintain, protect and enforce our intellectual property rights, proprietary systems, technology and brand; |
|
|
• |
Our ability to develop new offerings and penetrate new vertical markets; |
|
|
• |
Our ability to manage future growth effectively; |
|
|
• |
Our reliance on data provided to us by our demand and supply partners and consumers; |
|
|
• |
Natural disasters, public health crises, political crises, economic downturns, or other unexpected events; |
|
|
• |
Significant estimates and assumptions in the preparation of our financial statements; |
4
|
|
• |
Our ability to collect our receivables from our partners; |
|
|
• |
Developments with respect to LIBOR; |
|
|
• |
Fluctuations in our financial results caused by seasonality; |
|
|
• |
The development of the DTC insurance distribution sector and evolving nature of our relatively new business model; |
|
|
• |
Disruptions to or failures of our technological infrastructure and platform; |
|
|
• |
Failure to manage and maintain relationships with third-party service providers; |
|
|
• |
Cybersecurity breaches or other attacks involving our systems or those of our partners or third-party service providers; |
|
|
• |
Our ability to protect consumer information and other data and risks of reputational harm due to an actual or perceived failure by us to protect such information and other data; |
|
|
• |
Risks related to being a public company; |
|
|
• |
Risks related to our common stock; |
|
|
• |
Risks related to our intention to take advantage of certain exemptions as a “controlled company” under the rules of the NYSE, and the fact that the interests of our controlling stockholders (White Mountains, Insignia, and the Founders) may conflict with those of other investors; |
|
|
• |
Risks related to our corporate structure; and |
|
|
• |
The other risk factors described under “Risk factors.” |
The foregoing factors should not be construed as exhaustive and should be read together with the other cautionary statements included in this Annual Report on Form 10-K. If one or more events related to these or other risks or uncertainties materialize, or if our underlying assumptions prove to be incorrect, actual results may differ materially from what we anticipate. Many of the important factors that will determine these results are beyond our ability to control or predict. Accordingly, you should not place undue reliance on any such forward-looking statements. Any forward-looking statement speaks only as of the date on which it is made, and, except as otherwise required by law, we do not undertake any obligation to publicly update or review any forward-looking statement, whether as a result of new information, future developments or otherwise. New factors emerge from time to time, and it is not possible for us to predict which will arise. In addition, we cannot assess the impact of each factor on our business or the extent to which any factor, or combination of factors, may cause actual results to differ materially from those contained in any forward-looking statements.
5
Except as otherwise indicated or required by the context, all references in this Annual Report to the “Company,” “MediaAlpha,” “we,” “us” and “our” refer to (i) QL Holdings, LLC (“QLH”) and its consolidated subsidiaries prior to the completion of our initial public offering and (ii) MediaAlpha, Inc. (“MediaAlpha, Inc.”) and its consolidated subsidiaries following the completion of our initial public offering on October 30, 2020.
Our Company
Our mission is to help insurance carriers and distributors target and acquire customers more efficiently and at greater scale through technology and data science. Our technology platform brings leading insurance carriers and high-intent consumers together through a real-time, transparent, and results-driven ecosystem. We believe we are the largest online customer acquisition channel in our core verticals of property & casualty insurance, health insurance, and life insurance, supporting over $1.4 billion in Transaction Value across our platform over the last two years.
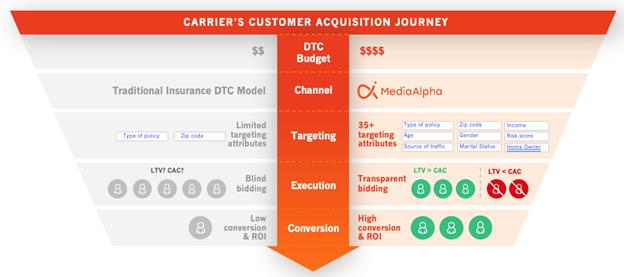
We believe in the disruptive power of transparency. Traditionally, insurance customer acquisition platforms operated in a black box. We recognized that a consumer may be valued differently by one insurer versus another; therefore, insurers should be able to determine pricing granularly based on the value that a particular customer segment is expected to bring to their business. As a result, we developed a technology platform that powers an ecosystem where buyers and sellers can transact with full transparency, control, and confidence.

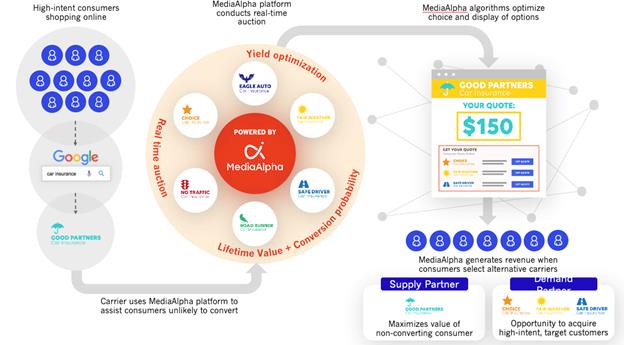
We have multi-faceted relationships with top-tier insurance carriers and distributors. A buyer or a demand partner within our ecosystem is generally an insurance carrier or distributor seeking to reach high-intent insurance consumers. A seller or a supply partner is typically an insurance carrier looking to maximize the value of non-converting or low LTV consumers, or an insurance-focused research destination looking to monetize the high-intent insurance shoppers on their websites. Our model’s versatility allows for the same insurance carrier to be both a demand and supply partner, which deepens the partner’s relationship with us. In fact, it is this supply partnership that presents insurance carriers with a highly differentiated monetization opportunity, enabling them to capture revenue from website visitors who either do not qualify for a policy or otherwise may be more valuable as a potential referral to another carrier.
6

For the year ended December 31, 2020, we had 15 of the top 20 largest auto insurance carriers by customer acquisition spend as demand partners on our platform, accounting for 43% of our revenue. Of these demand partners, 67% were also supply partners in our ecosystem. On a monthly basis, an average of 31.2 million consumers shop for insurance products through the websites of our diversified group of supply partners and our proprietary websites, driving an average of over 6.6 million Consumer Referrals on our platform for the twelve month period ended December 31, 2020.
We believe our technology is a key differentiator and a powerful driver of our performance. We maintain deep, custom integrations with partners representing the majority of our Transaction Value to enable automated, data-driven processes that optimize our partners’ customer acquisition spend and revenue. Through our platform, our insurance carrier partners can target and price across over 35 separate consumer attributes to manage customized acquisition strategies. We enable our insurance partners to target consumers based on a precise calculation of the expected lifetime value to that partner and to make real-time, automated customer acquisition decisions through a combination of granular price management tools and robust predictive analytics capabilities.
We built our business model to align the interests of all parties participating on our platform. We generate revenue by earning a fee for each Consumer Referral sold on our platform. Our revenue is not contingent on the sale of an insurance product to the consumer.
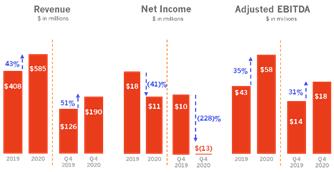
We have a track record of delivering rapid and profitable growth, enabled by our unique business model and technology platform. For the year ended December 31, 2020, we generated $584.8 million of revenue, representing a 43.3% increase over the $408.0 million of revenue that we generated for the year ended December 31, 2019. This translated to net income of $10.6 million for the year ended December 31, 2020, a decrease of 40.7% over the $17.8 million of net income we generated for the year ended December 31, 2019, driven predominantly by an increase in employee equity-based compensation, and professional fees in connection with our initial public offering. We also generated $58.1 million of Adjusted EBITDA(1) for the year ended December 31, 2020, representing a 35.3% increase over the $42.9 million of Adjusted EBITDA(1) generated for the year ended December 31, 2019.
7
For the quarter ended December 31, 2020, we generated $190.2 million of revenue, representing a 50.8% increase over the $126.1 million of revenue that we generated for the quarter ended December 31, 2019. This translated to a net loss of $13.2 million for the quarter ended December 31, 2020, a decrease of 227.6% over the $10.4 million of net income for the quarter ended December 31, 2019. We also generated $18.2 million of Adjusted EBITDA for the quarter ended December 31, 2020, representing a 30.5% increase over the $13.9 million of Adjusted EBITDA generated for the quarter ended December 31, 2019. See “Management’s discussion and analysis of financial condition and results of operations” for more information.
We designed our business model to be capital efficient, with high operating leverage and cash flow conversion. Since inception and prior to our IPO, we have funded our growth through internally generated cash flow with no outside primary capital. Our strong cash flow generation is driven by (i) the nature of our revenue model, which is fee based and generated at the time a Consumer Referral is sold, and (ii) our proprietary technology platform, which is highly scalable and requires minimal capital expenditure requirements ($0.3 million and $0.1 million for the year ended December 31, 2020 and 2019, respectively).
The foundation of our success is our company culture. Personal development is critical to our team’s engagement and retention, and we continually invest to support our core values of open-mindedness, intellectual curiosity, candor, and humility. This has resulted in a growth-minded team, with exceptionally low turnover, committed to building great products and the long-term success of our partners.
We are poised to capitalize on the expected growth in our core insurance verticals and the continued shift in these markets to direct, digital distribution. We aim to drive deeper adoption and integration of our platform within the insurance ecosystem to continue delivering strong results to our partners. While our focus remains on insurance, we plan to continue to grow opportunistically in sectors with similar market dynamics.
|
(1) |
“Adjusted EBITDA” is a non-GAAP financial measure that we present in this Annual Report on Form-10K to supplement the financial information we present on a GAAP basis. For a reconciliation of Adjusted EBITDA to the most directly comparable financial measure calculated and presented in accordance with GAAP, see “Management’s discussion and analysis of financial condition and results of operations—Key business and operating metrics.” |
Our market opportunity
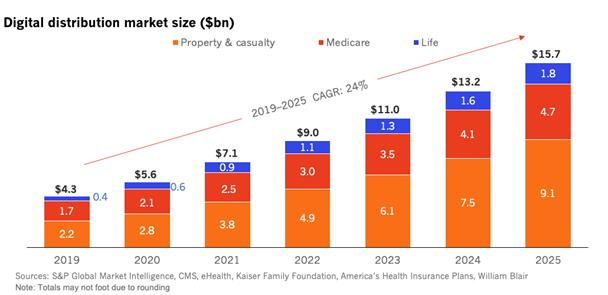
Insurance is one of the largest industries in the United States, with attractive growth characteristics and market fundamentals. Insurance companies wrote over $2 trillion in premiums in 2019, and the industry grew at a 6% CAGR from 2017 through 2019, according to the NAIC. Demand for insurance products is stable, due to, in many instances, coverage being mandatory by law (for example, auto insurance) or federally subsidized (for example, senior health insurance). The industry as a whole is highly competitive and invests heavily in customer acquisition. Total customer acquisition spend in the insurance industry was approximately $144 billion in 2019, representing year over year growth of approximately 6%, according to S&P Global Market Intelligence.
8
Our technology platform was created to serve and grow with our insurance end markets. As such, we believe secular trends in the insurance industry will continue to provide strong tailwinds for our business.
|
|
• |
Direct-to-consumer is the fastest growing insurance distribution channel. In the auto insurance industry, there are direct-to-consumer carriers (such as Progressive and GEICO) and more traditional, agent-based carriers (such as Liberty Mutual and Allstate). DTC carriers accounted for approximately 30% of industry premiums in 2018, up from approximately 23% in 2013, according to S&P Global Market Intelligence. This industry shift to more direct distribution is accelerating. According to J.D. Power, GEICO and Progressive captured nearly 84% of premium growth within the auto insurance industry in 2019. This growth is largely driven by their outsized investments, relative to peers, in direct customer acquisition channels. According to S&P Global Market Intelligence, GEICO’s customer acquisition spend increased from $0.9 billion in 2017 to $1.7 billion in 2019, representing 82% growth, and Progressive’s customer acquisition spend increased from $1.5 billion in 2017 to $1.9 billion in 2019, representing 28% growth. Traditional, agent-based carriers have responded by investing more heavily in direct customer acquisition efforts themselves, as well as launching digital brands (such as Nationwide and Spire), acquiring digital agencies (such as Prudential and AssuranceIQ), or acquiring digital insurers (such as Allstate and Squaretrade). At the same time, a number of personal lines InsurTech companies have entered the space to capitalize on this shift (such as Root, Lemonade, and Hippo). |
Similarly, tech-enabled distribution businesses focused on health and life insurance, such as eHealth, GoHealth, and SelectQuote, have also emerged in recent years, with revenue growth in excess of 40% in 2020. These companies advertise and acquire customers primarily through digital means and rank among the largest distribution platforms for health and life insurance products.
|
|
• |
More insurance consumers are shopping online. Consumers are increasingly using the internet not just for research and price discovery but to purchase insurance as well. The J.D. Power 2020 U.S. Insurance Shopping Study suggests that 90% of consumers are open to purchasing their auto insurance online. A decade ago, 35% of consumers who had not made an online auto insurance policy purchase in the past said they would consider doing so in the future, according to the Comscore 2010 Online Auto Insurance Shopping Report. This shift is not only prevalent among younger insurance shoppers. According to LexisNexis Insurance Demand Meter, consumers 56 and older are the fastest growing online auto insurance shoppers in the first quarter of 2020. This older demographic is also going online for health information. According to BMC Health Services Research, 63% of people age 65 and older had obtained health information from a website in 2013. |
|
|
• |
Insurance customer acquisition spending is growing. Total insurance customer acquisition spending in 2019 totaled $144 billion, up 6% over the previous year, according to S&P Global Market Intelligence. In fact, two of the top three most-advertised brands in the U.S. across traditional and online channels are insurance companies—Progressive and GEICO. Progressive’s customer acquisition spend grew approximately 29% year over year to nearly $1.7 billion in 2019, while GEICO’s customer acquisition spend grew almost 12% to nearly $2 billion in the same period. In the face of such aggressive spending and customer acquisition by DTC insurance carriers such as Progressive and GEICO, agent-based carriers are compelled to spend heavily to remain competitive. |
9

|
|
• |
Carriers and distributors are increasingly focused on optimizing customer acquisition budgets. Mass-market customer acquisition spend is becoming more costly, leading carriers and distributors to increasingly focus on optimizing customer acquisition spend. They are able to do so by adopting the more sophisticated customer acquisition strategies enabled by data science. A significant percentage of marketers believe the inability to measure customer acquisition impact across channels and campaigns is one of their biggest challenges in demonstrating customer acquisition performance. We believe there is growing demand for improved transparency of Consumer Referral quality, for carriers to secure higher quality Consumer Referrals online, and for the ability to manage consumer acquisition spend across multiple vendors. A survey by CMO in February 2020 reported that marketing analytics spending is expected to increase by 56% in the next three years. |
MediaAlpha is poised to capitalize on these trends. We believe we provide one of the leading technology platforms that enables insurance carriers and distributors to efficiently acquire customers online at scale. Our platform allows buyers to target consumers granularly and to determine their pricing based on how they value various consumer segments. Buyers leveraging our predictive analytics and data science capabilities make value-maximizing decisions on how to acquire customers. This results in greater customer acquisition efficiency and better return on investment, allowing us to attract more buyers into the ecosystem. Simultaneously, we provide our supply partners the insights and tools they need to drive competition for their high-intent consumers and maximize yield, which draws more supply partners into the ecosystem, providing our buyers with even more high-quality demand sources. As both demand and supply partners begin to see the benefits of the platform, we deepen our relationships with them through additional integrations that drive more data into the platform. All of this creates the powerful “flywheel” effect that has propelled our business forward as a result of the value created within our ecosystem.
10

Our platform
We have created one of the largest global insurance customer acquisition technology platforms. For the year ended December 31, 2020, we had $815.7 million in Transaction Value and served over 1,000 total insurance partners. For the year ended December 31, 2019, we had $560.1 million in Transaction Value and served over 760 total insurance partners.
Our buyers use our platform to access over 370 million high-intent consumers annually, sourced from over 380 insurance sellers as of December 31, 2020. We serve over 750 buyers across our core insurance verticals, including insurance carriers, InsurTech companies, agencies, and brokers. Our platform was designed for multiple Consumer Referral products and flexible deployment models to best serve the varying needs of our partners.
11
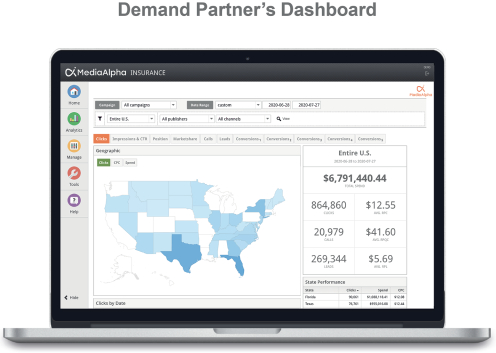
Insurance carriers access our platform through a self-service web interface that enables them to manage customer acquisition strategies across all sources of Consumer Referrals, efficiently and with full transparency. Our platform provides insurance companies sophisticated targeting capabilities for efficient customer acquisition. Further, it offers our partners the ability to offset customer acquisition costs by using predictive analytics to refer non-converting consumers to other carriers, delivering better returns on investment relative to traditional channels.

12
We connect insurance companies with websites where consumers shop for insurance. Insurance carriers and distributors are able to target high-intent consumers when they are actively shopping for insurance. Our end consumers typically access our partners’ websites or our proprietary websites looking for an insurance quote, where they volunteer relevant data in connection with their quote request. Our platform then controls the matching of these consumers with insurance companies, presenting them with multiple brands to choose from. We believe the rich data available with every consumer quote request gives our platform the unparalleled ability to direct each Consumer Referral to the right set of carriers. We maximize value to both demand and supply partners by allowing insurance companies to reach consumers when they are actively shopping and precisely target granular consumer segments using rich data.
We enable insurance companies to reach and acquire new customers in multiple ways. In our platform, end consumers can engage with insurance companies based on their preferences. Our platform enables consumers to (i) proceed to an insurance carrier’s website on a self-directed basis to purchase a policy (click), (ii) engage with an insurance carrier or agent via phone (call), or (iii) submit their data to insurance companies to receive inbound inquiries (lead). Our platform’s flexibility in turn enables insurance carriers to acquire and convert consumers through one or more touchpoints, depending on their strengths and preferences. As of December 31, 2020, clicks, calls, and leads represented 79.9%, 8.1%, and 12.0% of our Transaction Value, respectively. As of December 31, 2019, clicks, calls, and leads represented 75.2%, 8.3%, and 16.5% of our Transaction Value, respectively.
Our platform leverages precise data and data science for maximum efficiency. Insurance carriers use precise data to target and price consumer segments across demographic and geographic attributes on a source transparent basis. This allows insurance carriers to pay the right price for every customer acquisition opportunity based on their business objectives. Insurance carriers integrate with our platform to provide real-time conversion feedback, allowing them to measure returns granularly and execute algorithmic optimization of customer acquisition cost to match expected LTV. We have conversion data integrations with 15 of the top 20 insurance buyers as of December 31, 2020 and 2019 representing 54% and 46% of Transaction Value attributed to our insurance verticals, respectively. Increasing the number and depth of our conversion integrations with our partners remains a key priority.
Insurance carriers are able to extract the maximum value from each consumer opportunity. We have extensive data integrations with our partners to support efficient customer acquisition. These data integrations allow us to more seamlessly transact a Consumer Referral by taking information an end consumer has already provided and pre-populating it into an insurance carrier’s purchase process, potentially increasing policy conversion rates. This enhances the value of the Consumer Referral to our insurance carriers, adding significant value to all parties in our platform. Currently, we have 77 buyers with this type of integration, representing 70% of Transaction Value attributed to our insurance verticals as of December 31, 2020. Increasing the number and depth of our data integrations with our partners remains a key priority, and we believe this number will increase as our platform grows.
Our transaction models. We transact with our demand partners and supply partners through two operating models, open platform and private platform. In our open platform transactions, we have separate agreements with demand partners and suppliers and have control over the Consumer Referrals that are sold to our demand partners. In our private platform transactions, demand partners and suppliers contract with one another directly, and we earn fees from our demand and supply partners based on the Consumer Referrals transacted. For a description of these arrangements, see “Management’s discussion and analysis—Key components of our results of operations—Revenue.”
Our technology
Our product is a technology platform that allows insurance carriers and distributors to acquire customers and optimize customer acquisition costs to align with expected customer LTV, in a single data-rich but user-friendly environment. Our technology is what enables our growth, scale, and operating leverage and differentiates us from our competitors. It is also what enables our partners to scale their customer acquisition and monetization, or both, efficiently and with minimal operating overhead. With over 79 million paid transactions on our platform in 2020, we believe we offer the largest source of Consumer Referrals in the insurance sector.
13
Our product is a robust and real-time customer acquisition and predictive analytics platform. It is fueled by rich, anonymized consumer data through extensive data integrations. At the heart of our platform is a set of proprietary predictive analytics algorithms that incorporate hundreds of variables to generate conversion probabilities for each unique consumer, enabling our partners to align customer acquisition costs with expected customer LTV across the platform.
Our platform architecture is elegant, scalable, and vertical agnostic, which has enabled us to innovate rapidly in our core insurance verticals and grow opportunistically across sectors with similarly attractive attributes. We continuously invest in our technology and believe that our focus on innovation enhances our competitive position.
We believe the following attributes collectively differentiate the MediaAlpha technology platform:
Multiple high-quality Consumer Referrals accessible through a single platform with transparent pricing and control. Most insurance carriers and distributors today have multiple sources for customer acquisition. These sources offer a wide range of Consumer Referral quality and, in most cases, must be managed manually and separately by insurance carriers. Our platform allows users to access multiple sources of Consumer Referrals made available by us transparently through a unified platform with a single sign-on, creating scale and operational efficiencies.
Proprietary user data integrated in a secure environment. Our platform allows buyers to fully integrate first-party consumer data to enhance targeting parameters, bidding granularity, and conversion tracking, resulting in more accurate customer acquisition and lifetime value predictions. We maintain robust data security protections and preserve the confidentiality of each insurance carrier’s customer acquisition strategy. We are able to seamlessly aggregate this data across all of our users to enhance our predictive analytics model while maintaining end-consumer confidentiality. We believe this has allowed us to continue strengthening our rich consumer database and analytics platform and maintain strong relationships with our partners.
Robust data science tools to optimize customer acquisition. Our unique search and conversion datasets enable automated, algorithmic customer acquisition optimizations. As our platform grows and processes more customer acquisition transactions, we gather more conversion data to further refine our predictive analytics algorithms. This further enhances our platform’s capability to predict our partners’ expected return per consumer and support more efficient customer acquisition strategies. We believe this creates a flywheel effect by which the attractiveness and value of our platform will grow as we continue to scale.
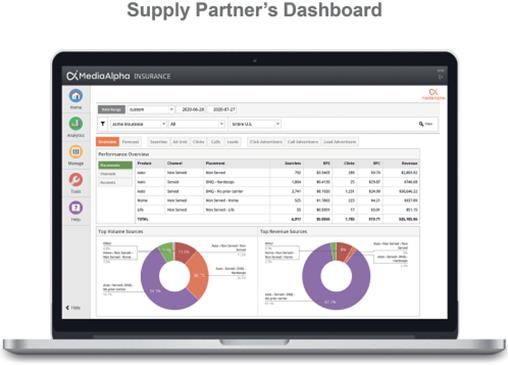
Self-service model. We offer a self-service model that empowers our partners to directly manage the buying and selling process independently. Supply partners can easily manage their digital consumer traffic on our platform, while demand partners can direct their consumer acquisition spend in real time with minimal involvement from our team. We believe this enables us to scale efficiently without requiring significant investments in sales and support functions.
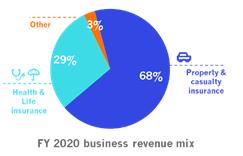
Highly extensible and scalable platform. Our platform and industry-agnostic technology enables us to quickly expand our operations into existing and adjacent verticals with minimal investments. We have organically scaled the property & casualty insurance vertical and the health and life insurance verticals to $550 million and $218 million in Transaction Value for the twelve month period ended December 31, 2020, respectively. While our focus remains on insurance, we will continue to grow opportunistically in sectors with similar, attractive market fundamentals. We believe our proprietary technology will allow us to react nimbly to growing demands and opportunities in emerging verticals.
14
Our buyers: Our demand partners are insurance carriers and distributors looking to target high-intent consumers deep in their purchase journey. Repeat buyers continue to be a strong driver of our growth, with 96.7% of our Transaction Value for 2020 driven by repeat buyers from 2019 (with Transaction Value from such repeat buyers increasing 39.6% in 2020) and 96.8% of our Transaction Value for 2019 driven by repeat buyers from 2018. Annual spend per demand partner on our platform who contribute over $1 million in Transaction Value annually has continued to increase from $5.0 million in 2018 to $6.0 million in 2019 to $9.0 million for 2020.
Our value proposition for buyers
|
|
• |
Efficiency at scale. We believe we operate the insurance industry’s largest customer acquisition platform, delivering the volume insurance companies need to drive meaningful business results, while also providing precise targeting capabilities to ensure they connect with the right prospects. We believe this gives our demand partners the ability to realize greater efficiencies relative to other customer acquisition channels. |
|
|
• |
Granular and transparent control. Our platform allows for real-time, granular control and full-source transparency with every buying and pricing decision. We believe this gives our buyers the flexibility they need to realize favorable lifetime value relative to customer acquisition costs to maximize their revenue opportunities. |
|
|
• |
Unparalleled partnership. With a fully managed service option, custom integrations, and industry-leading technology, we are dedicated to providing long-term value to our buyers’ businesses. We have designed our platform to put the best interests of our partners first, fostering a healthy ecosystem within which buyers can transact with confidence. |
Our Sellers: Our supply partners use our platform to monetize their digital consumer traffic. Our supply partners are primarily insurance carriers looking to maximize the value of non-converting or low LTV consumers, and insurance-focused research destinations looking to monetize high-intent customers. Repeat sellers continue to be a strong driver of our growth, with 97.9% of our Transaction Value for 2020 driven by repeat sellers from 2019 (with Transaction Value from such repeat sellers increasing 73.2% in 2020) and 95.7% of our Transaction Value for 2019 driven by repeat sellers from 2018. Annual spend per supply partner on our platform who contribute over $1 million in Transaction Value annually has continued to increase from $6.5 million in 2018 to $7.8 million in 2019 and further to $11.9 million for 2020.
Our value proposition for sellers
|
|
• |
Yield maximization. Our proprietary technology platform provides sellers with a suite of optimization tools, as well as inventory and buyer management features that maximize competition for, and yield from, their high-intent consumers. |
|
|
• |
Predictive analytics. Through our platform’s advanced predictive analytics features, sellers can assess conversion probabilities and expected customer LTV for every consumer in real time. We believe the integration of these data science models with our sellers’ user experience decision engines is a unique differentiator of our business. |
|
|
• |
Real-time insights. We provide our sellers with unique data as to the type of consumer segments each buyer values. By providing in-depth reporting and real-time, granular insights, our sellers have the ability to continuously optimize their own customer acquisition and monetization decisions. |
15
Our End Consumers: Our end consumers are primarily high-intent, online insurance shoppers. Due to the broad participation of top-tier insurance carriers within our ecosystem, consumers are able to more efficiently navigate a range of options and offers relevant to their policy searches. Through December 31, 2020, an average of 31 million consumers shopped for insurance products monthly through the websites of sellers on our platform and our proprietary websites.
Our value proposition for end consumers
|
|
• |
Search relevancy. By enabling insurance carriers and distributors to apply sophisticated targeting, we facilitate the delivery of hyper-relevant product options to our end consumers based on consumer-provided demographics and other relevant characteristics. We believe this improves the overall research and purchase experience and allows our end consumers to make better real-time decisions. |
|
|
• |
Shopping efficiency. We facilitate access to the most relevant products for each respective end consumer, allowing for minimal research and maximum efficiency, through an omni-channel, seamless consumer platform experience. We enable consumers to comparison shop and interact with insurance carriers and distributors through multiple mediums, including directly online or offline. |
Our strengths
We believe that our competitive advantages are based on the following key strengths:
|
|
• |
Highly scalable, innovative technology platform with rich data. Our proprietary platform is built to be highly extensible and flexible, enabling us to quickly and efficiently develop custom solutions and tools to address the varying and evolving needs of our partners. Supported by our predictive analytics algorithms, our platform is able to provide continuous, real-time feedback and insights that buyers use to maximize the value of every consumer opportunity. Our deep data integrations allow our buyers to utilize millions of anonymized data points to target and acquire their desired customers with a unique level of precision and control. As of December 31, 2020, there were over 380 insurance supply partners on our platform. We also provide our supply partners with sophisticated, data-driven yield management and monetization capabilities. We believe these capabilities are critical to our partners’ monetization strategies, as they enable optimization of business performance and revenue. Our platform is vertical agnostic, allowing us to expand into new markets with attractive attributes. |
The increased participation in our technology-driven platform will continue to generate valuable data, enhance feedback loops, and drive stronger results for all participants in the ecosystem. We believe this creates a flywheel effect as our platform grows.
|
|
• |
Superior operating leverage. We designed our business to be highly scalable, driving sustainable long-term growth that delivers superior value to both demand and supply partners. Our technology enables us to grow in a highly capital efficient manner, with minimal need for working capital or capital expenditure investment. In 2020, we employed 100 individuals on average, who drove $815.7 million of Transaction Value ($8.2 million per employee), $10.6 million of net income ($0.1 million per employee), and $58.1 million of Adjusted EBITDA ($0.6 million per employee) and for 2019, we employed 81 individuals on average who drove $560.1 million of Transaction Value ($6.9 million per employee), $17.8 million of net income ($0.2 million per employee), and $42.9 million of Adjusted EBITDA ($0.5 million per employee) for the year, reflecting the high operating leverage of our platform. |
16
We believe the versatility and breadth of our offerings, coupled with our focus on high-quality products, provide significant value to insurance carriers and distributors, resulting in strong retention rates. As a result, many insurance carriers and distributors use our platform as their central hub for broadly managing digital customer acquisition and monetization.
Our relationships with our partners are deep, long standing, and involve the top-tier insurance carriers in the industry. In terms of buyers, 15 of the top 20 largest auto insurance carriers by customer acquisition spend are on our platform. In 2020, 96.7% of total Transaction Value executed on our platform came from demand partner relationships from 2019. In 2019, 96.8% of total Transaction Value executed on our platform came from demand partner relationships from 2018. Approximately half of our supply partners have been on our platform since 2016.
|
|
• |
Culture of transparency, innovation, and execution. Since inception, our co-founders have led with the vision of bringing unparalleled transparency and efficiency to the online customer acquisition ecosystem, executed through a powerful technology-enabled platform. Transparency is built into our platform and is at the heart of our culture, enabling us to focus on sustainable long-term success over near-term wins. We are relentless about continuous innovation and aim to use our platform to solve big industry-wide problems. We are data-driven and focused on delivering measurable results for our partners. We believe that our long-term vision, dedication to solving systemic problems in the industry, and our relentless drive to improve will continue to empower us to be the platform of choice for our partners. |
Our growth opportunities
We intend to grow our business through the following key areas:
|
|
• |
Increase Transaction Value from our partners. We aim to increase overall Transaction Value from our partners across our insurance verticals by continuously improving the volume and accuracy of customer conversion data, eliminating friction between consumer handoffs, and developing additional tools and features to increase engagement. We believe that providing our platform participants with better value and a larger selection of high-quality Consumer Referrals over time will lead to increased spending on our platform. |
|
|
• |
Improve ecosystem efficiency. We believe that traditional customer acquisition models are highly inefficient, charging platform users inflated prices while lacking the transparency and granularity to allow participants to reach end consumers effectively. We were founded to disrupt and address these systemic inefficiencies and will continue to do so by enhancing automated buying strategies and granular price discovery processes. We will continue to expand our platform and drive value for all participants within the ecosystem by increasing the data integration with our partners into our platform. |
|
|
• |
Bring new partners to our platform. There are potential buyers and sellers who are not yet using our platform. We intend to gain adoption of our platform with new insurance partners through business development, word-of-mouth referrals, and inbound inquiries. |
|
|
• |
Grow our product offerings. We are constantly exploring new ways to deliver value to our partners through development of new tools and services and improvement of our conversion analytics model. We believe that providing further customized solutions and higher touch services for our partners will enhance the stickiness of our offerings and drive more customer acquisition spend and users to our platform. |
17
|
|
• |
Expand into and scale new verticals. While we have primarily focused our efforts on growing our core insurance verticals, we continue to seek expansion opportunities in markets that share similar characteristics. For example, we entered the health insurance and life insurance markets in 2014 and were able to scale to $217.7 million and $157.2 million in Transaction Value for the twelve months ended December 31, 2020 and 2019, respectively, representing 38.5% and 38.2% year over year growth, respectively. We believe our vertical-agnostic platform and established playbook for entering new markets will allow us to capture attractive market opportunities effectively. |
Our competition
We operate in the broadly defined tech-enabled insurance distribution sector. We are part of a sector that is disrupting the conventional agent-based insurance distribution channels. This sector is comprised of companies engaged in varied aspects of customer acquisition. On one end of the spectrum, there are companies that are engaged in simple Consumer Referrals acquisition. These Consumer Referrals are delivered to the insurance carriers or distributors. On the other end of the spectrum, there are companies that acquire the customer through digital channels and take them through the entire needs-based assessment and policy application and submission process.
Within this sector, our closest competitors are technology companies engaged in digital customer acquisition. Traditional digital consumer acquisition models focus on serving buyers of Consumer Referrals by acquiring consumers on behalf of insurance carriers from paid search, proprietary websites or other digital avenues. Our model is different. We operate a transparent, results-driven platform where sophisticated demand and supply partners transact on high-quality Consumer Referrals. We compete on the basis of a number of factors, including return on investment, technology, and client service.
Our platform also offers DTC digital spend optimization capabilities that compete primarily with home grown systems that buyers use to aggregate multiple sources of digital customer acquisition. As the number of digital consumer acquisition sources grows, the complexity and cost of managing those sources continues to increase. As a result, we are seeing significant increases in the frequency and customer acquisition spend of participants on our platform, further enhancing our scale and return on investment to all our partners. We have deep integrations with our partners that cost time and money. We believe our growing scale makes it hard for new entrants to gain direct access to buyers and sellers and replicate what we have built over the years.
18
The protection of our technology, intellectual property and proprietary rights is an important aspect of our business. We rely on a combination of trade secret, trademark and copyright laws, confidentiality agreements, and technical measures to establish, maintain and protect our intellectual property rights and technology. Additionally, we enter into confidentiality and invention assignment agreements with our employees and enter into confidentiality agreements with third parties, including our buyers and sellers. However, our contractual provisions may not always be effective at preventing unauthorized parties from obtaining our intellectual property and proprietary technologies. Intellectual property laws, procedures, and restrictions provide only limited protection and any of our intellectual property or proprietary rights may be challenged, invalidated, circumvented, infringed, misappropriated or otherwise violated. Further, the laws of certain countries do not protect intellectual property or proprietary rights to the same extent as the laws of the U.S., and, therefore, in certain jurisdictions, we may be unable to protect our proprietary technology.
Our in-house know-how is an important element of our intellectual property. The development and management of our platform requires sophisticated coordination among many specialized employees. We believe that duplication of this coordination by competitors or individuals seeking to copy our platform would be difficult. The risk of a competitor effectively replicating the functionality of our platform is further mitigated by the fact that our service offerings are cloud-based such that most of the core technology operating on our systems is never exposed to a user or to our competitors. To protect our technology, we implement multiple layers of security. Access to our platform, other than to obtain basic information, requires system usernames and passwords. We also add additional layers of security such as dual-factor authentication, encryption in transit and intrusion detection. See “Risk factors—Risks related to our intellectual property rights and our technology.”
Seasonality
Our results are subject to significant seasonal fluctuations as a result of vertical level seasonality. Our property & casualty insurance vertical is characterized by seasonal weakness during our fourth quarter due to lower customer acquisition budgets from buyers and lower supply of Consumer Referrals during the holiday period. During our first quarter, our property & casualty insurance vertical exhibits seasonal strength as customer acquisition budgets from our buyers and Consumer Referral volume from our sellers, both increase to start the year. In 2020, we did not experience the typical seasonality curve in our property & causality insurance vertical, generating a record $122.9 million of revenue, a 96.9% increase over $62.4 million of revenue generated for the quarter ended December 31, 2019. The increased revenue was driven by increased year-end budget allocations from our buyers as they continued to shift budget to the direct-to-consumer channel and increased Consumer Referral volume from both new and existing supply partners to meet the demand.
Our health insurance vertical experiences seasonal strength during the fourth quarter due to a material increase in Consumer Referrals and a related increase in customer acquisition budgets in connection with the Medicare annual enrollment period, which typically runs from October 15 to December 7 each year, and the under-65 health insurance open enrollment period, which typically runs from November 1 through December 15 each year. This trend generally reverses for our health insurance vertical for the rest of the year with the end of the annual and open enrollment periods. The seasonal strength results in a corresponding build-up of accounts receivable related to our health insurance vertical as of year-end with cash realized during the subsequent first quarter.
Regulation
Various aspects of our business are, may become, or may be viewed by regulators from time to time as subject, directly or indirectly, to U.S. federal, state and foreign laws and regulations. We are subject to laws and regulations that apply to businesses in general, such as those relating to worker classification, employment, payments, worker confidentiality obligations, consumer protection and taxation. As an online business, we are also subject to laws and regulations governing the internet, such as those relating to intellectual property ownership and infringement, trade secrets, the distribution of electronic communications, search engines and internet tracking technologies, and could be affected by potential changes to laws and regulations that affect the growth, popularity or use of the internet, including with respect to net neutrality and taxation on the use of the internet or e-commerce transactions.
19
Because we collect, process, store, share, disclose, transfer and use consumer information and other data and engage in marketing and advertising activities via the phone, email and text messages, we are also subject to laws and regulations that address privacy, data protection and collection, storing, sharing, use, disclosure, retention, security, protection transfer and other processing of personal information and other data, including the California Online Privacy Protection Act, the CCPA, the Personal Information Protection and Electronic Documents Act, the CAN-SPAM Act, CASL, the TCPA, HIPPA, Section 5(c) of the Federal Trade Commission Act, the GDPR, supplemented by national laws (such as, in the United Kingdom, the Data Protection Act 2018) and further implemented through binding guidance from the European Data Protection Board, the EU’s e-Privacy Directive, which is expected to be replaced by the EU’s e-Privacy Regulation, which is still under development and will replace current national laws that implement the ePrivacy Directive. The burdens imposed by these and other laws and regulations that may be enacted, or new interpretation of existing laws and regulations, may require us to modify our data processing practices and policies and to incur substantial costs in order to comply. We take a variety of technical and organizational security measures and other measures to protect our data, including data pertaining to our end consumers, employees and business partners. Despite measures we put in place, we may be unable to anticipate or prevent unauthorized access to such data.
A substantial majority of the insurance carriers using our platform are property & casualty insurance carriers, health insurance carriers or life insurance carriers. As a result, we are indirectly affected by laws and regulations relating to the insurance and healthcare industries, both of which are heavily regulated. For example, the PPACA and related regulatory reforms have materially changed the regulation of health insurance. While it is difficult to determine the impact of potential reforms on our future business, it is possible that such changes in industry regulation could affect demand for our platform.
Because the laws and regulations governing the internet, privacy, data security, marketing, insurance and healthcare are constantly evolving and striving to keep pace with innovations in technology and media, it is possible that we may need to materially alter the way we conduct some parts of our business activities or be prohibited from conducting such activities altogether at some point in the future. See “Risk factors—Risks related to laws and regulation.”
Human Capital Resources
We are committed to attracting and retaining the brightest and best talent, so investing in human capital is critical to our success. The employee traits we value include hands-on work no matter what the experience level, intellectual curiosity, open-mindedness, growth mindset, and deeply caring about the quality of work. As of December 31, 2020, we had 117 employees. The human capital measures and objectives that we focus on in managing our business include employee safety, talent acquisition and retention, employee engagement, development and training, diversity and inclusion, and compensation and pay equity. None of our employees are represented by a collective bargaining unit or are a party to a collective bargaining agreement.
Employee Engagement and Development
Our employee engagement efforts include our frequent and transparent “all-hands” meetings and executive communications, through which we aim to keep our employees well-informed and to increase transparency. We believe in continual improvement and use employee feedback to drive and improve processes that support our customers and ensure a deep understanding of our employees' needs. We conduct annual confidential employee surveys and believe that ongoing performance feedback encourages greater engagement in our business and improves individual performance. Each quarter, our employees participate in a 360-degree evaluation process to identify critical capabilities for development and establish new stretch goals.
We seek to achieve our business objectives through a deep commitment to talent development. Our talent development efforts include quarterly goals weekly “lunch and learn,” individualized professional development plans, management training, internal workshops, quarterly guest speakers, and quarterly book clubs related to enhancing business skills.
Objectives and Key Results are used to drive MediaAlpha’s business strategy. All our teams participate in an annual strategic planning process to identify objectives for business growth and innovation. Our teams and employees set goals quarterly to achieve the company’s annual objectives.
20
Our employee compensation strategy supports three primary objectives: attract and retain the best team members, reflect and reinforce our most important values, and align team member interests with shareholder interests in building enduring value. We believe people should be paid for what they do and how they do it, regardless of their gender, race, or other personal characteristics. To deliver on that commitment, we benchmark and set pay ranges based on market data and consider factors such as an employee’s role and experience, the location of their job, and their performance. We also regularly review our compensation practices, both in terms of our overall workforce and individual employees, to ensure our pay is fair and equitable.
COVID-19 and Employee Safety
During the COVID-19 pandemic, our primary focus has been on the safety and well-being of our employees and their families. Our pandemic efforts include leveraging the advice and recommendations of infectious disease experts to establish proper safety standards and secure appropriate levels of personal protective equipment. Our offices continue to be closed due to the pandemic. As our employees continue to work remotely, we offer benefits such as internet reimbursement, office supply purchasing, flexible work schedules, and access to other tools and supplies to enhance productivity and ease the stress of working from home.
Available Information
We file with the SEC Annual Reports on Form 10-K, Quarterly Reports on Form 10-Q, Current Reports on Form 8-K, Proxy Statements, and amendments to those reports filed or furnished pursuant to Section 13(a) or 15(d) of the Securities Exchange Act of 1934 (the "Exchange Act") with the SEC. The SEC maintains an Internet website that contains reports, proxy, and other information regarding issuers that file electronically with the SEC at http://www.sec.gov.
Our internet website address is https://mediaalpha.com/. We make available on our internet website, free of charge, our Annual Report on Form 10-K, Quarterly Reports on Form 10-Q, Current Reports on Form 8-K, Proxy Statements, and amendments to those reports filed or furnished pursuant to Section 13(a) or 15(d) of the Exchange Act as soon as reasonably practicable after such materials are electronically filed with, or furnished to, the SEC.
Risks related to our business and industry
Our business is dependent on our relationships with our partners using our platform, many of which have no long-term contractual commitments with us. If demand partners stop purchasing Consumer Referrals on our platform, if supply partners stop making Consumer Referrals available on our platform, or if we are unable to establish and maintain new relationships with demand or supply partners on our platform, our business, financial condition, operating results, cash flows, and prospects could be materially and adversely affected.
A substantial majority of our revenue is derived from sales of Consumer Referrals to demand partners on our platform. Our relationships with such demand partners are dependent on our ability to make available on our platform quality Consumer Referrals at attractive volumes and prices, which in turn depends on our relationship with our supply partners. If demand partners are not able to acquire their preferred Consumer Referrals on our platform, they may stop purchasing on our platform. If demand partners are not able to reach desired consumer segments precisely or do not maximize return on customer acquisition spend, they may stop using our platform.
Supply partners use our platform to optimize consumer conversions while minimizing customer acquisition costs. If supply partners are not able to obtain the best yield on their traffic using our platform, they may stop using our platform to make their Consumer Referrals available.
The majority of our partners can stop using our platform at any time with no notice. Many of our agreements with our partners have no fixed term and are cancellable upon 30 or 60 days’ notice. Furthermore, the agreements with our partners do not require that such partners transact a minimum amount on our platform. As a result, we cannot guarantee that our partners will continue to work with us, or, if they do, the amount of Consumer Referrals demand partners will purchase or the amount of Consumer Referrals supply partners will make available on our platform.
21
If a partner is not satisfied with our platform, it could cause us to lose our relationship with them. In addition to a loss of revenue, this may produce publicity that could hurt our reputation and adversely affect our ability to retain business or secure new business with other partners. The success of our platform depends on both our supply partners making available a robust supply of Consumer Referrals and our demand partners’ willingness to pay to purchase such Consumer Referrals. Accordingly, the loss of a supply partner’s traffic could affect our ability to provide a sufficient supply of Consumer Referrals for demand partners to acquire. In turn, the loss of a demand partner’s purchasing power on our platform could decrease the payouts to supply partners, which could decrease our supply of Consumer Referrals.
We may decide to terminate our relationship with a partner for a number of reasons and at any time. For example, in October 2020, we terminated our relationship with a supply partner that represented approximately 2% of revenue for the year ended December 31, 2020. The termination of our relationship with a partner could reduce the number of demand partners seeking to purchase Consumer Referrals and supply partners seeking to sell their Consumer Referrals to our platform. In connection with such a termination, we would lose a source of Transaction Value and fees for future sales. Our business, financial condition, operating results, cash flows, and prospects could also be harmed if in the future we fail to develop new partner relationships.
We depend on a small group of insurance carriers for a substantial portion of our business. Changes in our relationships with these insurance carriers may adversely affect our business, financial condition, operating results, cash flows, and prospects.
We derive a large portion of our revenue from a limited number of insurance carriers. For example, Progressive, which is both a buyer and seller on our platform, accounted for 23% of revenue for the year ended December 31, 2020. Customer concentration for the year ended December 31, 2020 and 2019 consisted of one customer that accounted for approximately $132.3 million and $78.8 million, or 23% and 19%, of revenue, respectively. Our two largest customers accounted for approximately $23.7 million and $9.8 million, or 24% and 10%, respectively, of the Company’s accounts receivable as of December 31, 2020 compared to one customer for approximately $4.7 million, or 8%, as of December 31, 2019. Many of our agreements with insurance carriers do not require minimum transaction volume commitments on our platform and, accordingly, our demand partners can reduce or eliminate their purchasing on our platform at any time. In addition, many of our agreements with insurance carriers are terminable by the insurance carriers without cause upon 30 or 60 days’ notice. Should we become dependent on fewer insurance partner relationships (whether as a result of the termination of existing relationships, insurance carrier consolidation or otherwise), we may become more vulnerable to adverse changes in our relationships with insurance carriers, which in turn could harm our business, financial condition, operating results, cash flows, and prospects.
Our business is substantially dependent on revenue from property & casualty insurance, health insurance, and life insurance carriers and subject to risks related to such industries in which our partners operate.
A substantial majority of the insurance carriers using our platform are property & casualty insurance carriers, health insurance carriers, and life insurance carriers. Revenue from property & casualty insurance carriers, health insurance carriers, and life insurance carriers accounted for 97.1% and 87.4% of our total revenue for the year ended December 31, 2020 and 2019, respectively. If insurance carriers experience large or unexpected losses through the offering of insurance, these carriers may choose to decrease the amount of money they spend on customer acquisition, including with us.
In addition, we are dependent upon the economic success of the automobile, home, and healthcare industries. Decreases in consumer demand generally in such underlying industries could adversely affect the demand for property & casualty insurance, health insurance, and life insurance and, in turn, the number of Consumer Referrals available on our platform. In addition, consumer spending on automobile, home, and healthcare products generally declines during recessionary periods and other periods in which disposable income is adversely affected and may be affected by negative trends in the broader economy, including the cost of energy and gasoline, the availability and cost of credit, reductions in business and consumer confidence, stock market volatility and increased unemployment. Downturns in any of these underlying industries, which could be caused by a downturn in the economy at large, could materially and adversely affect our business, financial condition, operating results, cash flows, and prospects.
22
Our partners may negotiate with us to reduce our platform fees, which could harm our business, financial condition, operating results, cash flows, and prospects.
Many of the terms of our agreements with our partners, including our platform fees, are specifically negotiated with each partner. Our partners may negotiate with us to reduce our platform fees. The outcome of such negotiations could result in terms that are less favorable to us than those contained in our existing agreements or those obtained by our competitors, which could impact our relationship with our partners and could harm our business, financial condition, operating results, cash flows, and prospects.
Demand partners who access our platform can attract consumers directly through their own customer acquisition strategies, including third-party online platforms and other traditional methods of distribution, or obtain similar services from our competitors. Similarly, supply partners can seek to monetize high-intent consumers or maximize the value of non-converting consumers on their websites by building their own solutions or turning to other service providers or our competitors.
The majority of our demand partners do not have exclusive relationships with us, and they may choose to make systemic or incremental changes in the manner in which they market and distribute their products. They can attract consumers directly through their own customer acquisition strategies, including third-party online platforms and other traditional methods of distribution, such as referral arrangements, physical storefront operations or broker agreements. Such demand partners also may obtain Consumer Referrals through one or more online competitors of our business. If such demand partners determine to compete directly with us or choose to favor one or more third-party platforms, they could cease or reduce purchases of Consumer Referrals on our platform. In our insurance verticals, if consumers seek insurance policies directly from insurance carriers, or if insurance carrier partners seek Consumer Referrals through our competitors or cease providing us with access to their systems or information, the number of transactions by demand partners on our platform may decline, which could materially and adversely affect our business, financial condition, operating results, cash flows, and prospects.
Similarly, most of our supply partners do not have exclusive relationships with us, and they can seek other solutions to maximize their consumer traffic monetization, such as building their own solution or turning to other service providers or our competitors in order to monetize high-intent consumers or maximize the value of non-converting consumers on their websites. This could also lead to a reduction in the number of Consumer Referrals made available by supply partners on our platform and materially and adversely affect our business, financial condition, operating results, cash flows, and prospects.
If we fail to compete effectively against technology companies engaged in digital customer acquisition and other competitors, we could lose partners and our revenue may decline.
We operate in the broadly defined tech-enabled insurance distribution sector. Within this sector, our closest competitors are technology companies engaged in digital customer acquisition. This sector is intensely competitive, and we expect this competition to continue to increase in the future both from existing and new competitors that provide competing platforms or technology. We compete both for demand partners and high-quality Consumer Referrals. We compete on the basis of a number of factors, including return on investment, technology, and client service. With respect to high quality Consumer Referrals and for a share of demand partners’ customer acquisition budgets, we compete with technology companies engaged in digital customer acquisition for insurance carriers as well as other companies including:
|
|
• |
direct distribution companies focused on insurance products; |
|
|
• |
industry-specific portals or customer acquisition companies with insurance-focused research online destinations; |
|
|
• |
online marketing or media services providers; |
|
|
• |
major internet portals and search engine companies with online advertising platforms; and |
|
|
• |
supply partners with their own sales forces that sell their online Consumer Referrals directly to buyers. |
23
Finding, developing, and retaining high quality Consumer Referrals on a cost-effective basis is challenging because competition for web traffic among technology companies engaged in digital customer acquisition, websites, and search engines, as well as competition with traditional media companies, has resulted and may continue to result in significant increases in pricing, declining margins, reduction in revenue, and loss of market share. In addition, if we expand the scope of our services, we may compete with a greater number of technology companies, websites, buyers, and traditional media companies across an increasing range of different services, including in vertical markets where competitors may have advantages in expertise, brand recognition, and other areas. Internet search companies with brand recognition have significant numbers of direct sales personnel and web traffic that provide a significant competitive advantage and have a significant impact on pricing for Consumer Referrals or web traffic. Some of these companies may offer or develop more vertically targeted products that match consumers with products and services or match Consumer Referrals with buyers and, thus, compete with us more directly. The trend toward consolidation in online marketing may also affect pricing and availability of Consumer Referral inventory. Many of our current and potential competitors also have other competitive advantages over us, such as longer operating histories, greater brand recognition, larger client bases, greater access to Consumer Referrals or web traffic more generally, and significantly greater financial, technical, and marketing resources. As a result, we may not be able to compete successfully. Competition from the DTC distribution channel affected and may continue to affect both volume and price, and, thus, revenue, profit margins, and profitability. If we fail to deliver results that are superior to those that other technology companies engaged in digital customer acquisition deliver to partners, we could lose partners and market share, and our revenue may decline.
If we are unable to develop new offerings, achieve increased partner adoption of those offerings or penetrate new vertical markets, our business, financial condition, operating results, cash flows, and prospects could be materially and adversely affected.
Our continued improvement of our product and service offerings is critical to our continued growth. Accordingly, we must continually invest resources in product, technology, and development in order to improve the comprehensiveness and effectiveness of our platform, including by improving upon and expanding the tools we offer to our partners for consumer acquisition cost management and optimization.
In addition, while we have historically concentrated our efforts on the property & casualty insurance, health insurance, and life insurance markets, our growth strategy includes opportunistically penetrating other vertical markets, such as consumer finance, education, and home services. In order to penetrate new vertical markets successfully, it will be necessary to develop an understanding of those new markets and the associated risks, which may require substantial investments of time and resources, and even then we may not be successful and, as a result, our revenue may grow at a slower rate than we anticipate and our business, financial condition, operating results, cash flows, and prospects could be materially and adversely affected.
If we fail to manage future growth effectively, our business, financial condition, operating results, cash flows, and prospects could be materially and adversely affected.
We have at times experienced rapid growth and anticipate further growth. This growth has placed significant demands on management and our operational infrastructure. As we continue to grow, we must effectively integrate, develop, and motivate our employees, while maintaining the beneficial aspects of our company culture. If we do not manage the growth of our business and operations effectively, the quality of our services and efficiency of our operations could suffer and we may not be able to execute on our business plan, which could harm our business, financial condition, operating results, cash flows, and prospects.
Our past growth or the past growth in our verticals or by our competitors may not be indicative of future growth, and our revenue growth rate may decline in the future.
Our past growth or the past growth in our verticals or by our competitors may not be indicative of future growth, if any. We will not be able to grow as expected, or at all, if we do not accomplish the following:
|
|
• |
maintain and expand the number of demand and supply partners that use our platform; |
|
|
• |
increase the volume and quality of Consumer Referrals available on our platform and otherwise improve the value of our platform for our partners; |
24
|
|
• |
expand our presence to new verticals. |
Our revenue growth rates may also be limited if we are unable to achieve high market penetration rates as we experience increased competition. If our revenue or revenue growth rates decline, investors’ perceptions of our business may be adversely affected and the market price of our Class A common stock could decline.
If we are unable to attract, integrate, and retain qualified employees, our ability to develop and successfully grow our business could be harmed.
Our business depends on our ability to retain our key executives and management, including Steven Yi, Chief Executive Officer and Co-Founder, Eugene Nonko, Chief Technology Officer and Co-Founder, and Tigran Sinanyan, Chief Financial Officer, and to hire, develop, and retain other key employees. Our ability to expand our business depends on our being able to hire, train, and retain sufficient numbers of experienced information technology employees, as well as other personnel. Our success in recruiting highly skilled and qualified employees can depend on factors outside of our control, including the strength of the general economy and local employment markets and the availability of alternative forms of employment. Experienced information technology personnel, who are critical to the success of our business, are in particularly high demand. This demand is particularly acute in the Seattle, Washington area, where our technology and engineering team is based. Competition for their talents is intense, and retaining such individuals can be difficult. The loss of any of our executive officers or key employees could materially and adversely affect our ability to execute our business plan and strategy, and we may not be able to find adequate replacements on a timely basis, or at all. Most of our executive officers and other key employees are at-will employees, which means they may terminate their employment relationships with us at any time, and their knowledge of our business and industry would be extremely difficult to replace. We cannot ensure that we will be able to retain the services of any members of our senior management or other key employees. If we do not succeed in attracting well-qualified employees or retaining and motivating existing employees, our business, financial condition, operating results, cash flows, and prospects could be materially and adversely affected.
A reduction in DTC digital spend by our demand partners or lower conversion results may harm our business, financial condition, operating results, cash flows, and prospects.
We rely on demand partners’ DTC digital spend on our network of supply partner websites and on our proprietary websites. We have historically derived, and we expect to continue to derive, the majority of our revenue through the delivery of Consumer Referrals. One component of our platform that we use to generate buyer interest is our system of optimization tools, which is designed to offer pricing control, transparency, granular targeting, and real-time response to assist our partners in making buying and selling decisions that optimize customer acquisition spend. Demand partners will stop spending on our platform if their investments do not generate conversion results. The failure of our platform to effectively deliver customer acquisitions in a manner that results in increased revenue for our demand partners could have an adverse impact on our ability to maintain or increase our revenue from our demand partners’ DTC digital spend.
We depend on supply partners on our platform for a majority of our generation of Consumer Referrals. Any decline in the supply of Consumer Referrals available through these supply partners’ websites could cause our revenue to decline or our operating costs to increase.
A majority of the Consumer Referrals available on our platform is attributable to consumer traffic originating from supply partners on our platform. In many instances, supply partners can change the Consumer Referrals they make available on our platform at any time in ways that could impact our results of operations. If a supply partner decides not to make its Consumer Referrals available to us, decides to demand a higher revenue-share or places significant restrictions on the sale of such Consumer Referrals, we may not be able to find Consumer Referrals from other supply partners that satisfies our requirements in a timely and cost-effective manner. Consolidation of sellers could eventually lead to a concentration of desirable inventory on websites or networks owned by a small number of individuals or entities, which could limit the supply or impact the pricing of inventory available to us. We cannot assure you that we will be able to acquire Consumer Referrals that meet our partners’ performance, price, and quality requirements, in which case our revenue could decline or our operating costs could increase.
25
We rely on data provided to us by our demand partners, our supply partners, and consumers to improve our technology and service offerings, and if we are unable to maintain or increase the amount of such data available to us, we may be unable to provide our demand partners with a bidding experience that is relevant, efficient, and effective or our supply partners with satisfactory revenue yields, which could adversely affect our business, financial condition, operating results, cash flows, and prospects.
Our business relies on the data provided to us by our demand partners, our supply partners, and consumers. The large amount of information we use in operating our platform is critical to the optimal functioning of our platform. If we are unable to maintain or effectively utilize the data provided to us, including data from our demand partners regarding consumer conversion, the value that we provide to our partners may be limited. In addition, the quality, accuracy, and timeliness of this information may suffer, which may lead to a negative bidding experience for demand partners using our platform, or decreased yields for supply partners using our platform, and could materially and adversely affect our business, financial condition, operating results, cash flows, and prospects.
We have made substantial investments, including time and human resources, into our proprietary technology platform, which relies on consumer-provided data, third-party data, predictive modeling, and analytics engines to maximize value for our platform users. We cannot assure you that we will be able to continually collect and retain sufficient data or improve our data technologies to satisfy our operating needs. Failure to do so could materially and adversely affect our business, financial condition, operating results, cash flows and prospects.
In addition, to the extent consumers or third parties provide our suppliers’ websites or our proprietary websites with inaccurate information or fail to provide information, the quality of Consumer Referrals offered to our demand partners through our platform may suffer. A decrease in quality of Consumer Referrals could lead to a reduction in use of our platform by our demand partners.
We depend upon internet search companies to direct a significant portion of visitors to our suppliers’ websites and our proprietary websites. Changes in search engine algorithms have in the past harmed or may in the future harm the websites’ placements in both paid and organic search result listings, which may reduce the number of visitors to our supply partners’ websites and our proprietary websites and as a result, cause our revenue to decline.
Our success depends on the ability to attract online visitors to our suppliers’ websites and our proprietary websites and convert them into consumers for our partners in a cost-effective manner. We depend on internet search companies to direct a substantial share of visitors to third party and our proprietary websites. Search companies offer two types of search results: organic and paid listings. Organic listings are displayed based solely on formulas designed by the search companies. Paid listings are displayed based on a combination of the buyer’s bid price for particular keywords and the search engines’ assessment of the website’s relevance and quality. If one or more of the search engines or other online sources on which we or our suppliers rely for purchased listings modifies or terminates its relationship with us or decides to decrease its rating of the relevance and quality of our websites, our expenses could rise, we could lose consumers, and traffic to our suppliers’ websites and our proprietary websites could decrease, which could in turn decrease the amount and quality of Consumer Referrals made available for sale on our platform. Any of the foregoing could have a material and adverse effect on our business, financial condition, operating results, cash flows and prospects.
The ability to maintain or grow the number of visitors to our suppliers’ websites and our proprietary websites from search companies is not entirely within our control. Search companies frequently revise their algorithms and changes in their algorithms have in the past caused or could in the future cause our suppliers’ websites and our proprietary websites to receive less favorable placements. There have been fluctuations in organic rankings for a number of our suppliers’ websites and some of the paid listing campaigns have also been harmed by search engine algorithmic changes. Search companies could determine that the content of our suppliers’ websites or our proprietary websites is either not relevant or is of poor quality.
26
In addition, we or our supply partners may fail to optimally manage our paid listings, or our proprietary bid management technologies may fail, which may lead to a decrease in the number of visits to our supply partners’ websites or our proprietary websites. As a result, we may need to use more costly sources to replace lost visitors who could have contributed to our supply of Consumer Referrals, and such increased expense could adversely affect our business, financial condition, operating results, cash flows, and prospects. Even if we succeed in driving traffic to our suppliers’ websites and our proprietary websites, we may not be able to effectively monetize this traffic or otherwise retain users. Failure to do so could result in a smaller supply of Consumer Referrals available on our platform to our demand partners and thus lower revenue, which would have an adverse effect on our business, financial condition, operating results, cash flows, and prospects.
We face risks and uncertainties related to a novel strain of the coronavirus and the disease it causes (COVID-19), which could significantly disrupt our operations and which could have a material and adverse impact on our business, financial condition, operating results, cash flows, and prospects. These risks and uncertainties could pertain to other viruses, pandemics or other unforeseen and broad-based public health crises.
Our business has been and may continue to be adversely impacted by the effects of COVID-19. In addition to negative macroeconomic effects on business and consumer demand, the COVID-19 outbreak and any other related adverse public health developments may cause declines in revenue and margin, and disruption to our business operations. The businesses of our partners have been negatively affected and may continue to be disrupted by reduced demand, declines in consumer credit, increased default rates, absenteeism, quarantines, and restrictions on employees’ ability to work, office closures, and travel or health-related restrictions. For example, in our travel vertical, COVID-19 has led to a dramatic reduction in consumers shopping for travel-related products, and there is uncertainty about the timing and extent to which demand for travel-related products will return to pre-pandemic levels. As a result, we have experienced a dramatic decline in revenue from the travel vertical and expect this trend to continue indefinitely. Certain insurance companies have seen new applications for their various insurance products decrease (e.g., declines in new applications for auto insurance due to lower car sales). Additionally, health insurance and life insurance carriers have faced a significant number of claims related to COVID-19. More generally, insurance companies face risks related to, among others, reduced demand for insurance products and decrease in premium revenue, particularly if their customers are unable to afford insurance, insurance shopping patterns are disrupted, vehicle and home purchases are curtailed, small businesses suspend or discontinue operations, and insurance agencies are unable or unwilling to write business. Depending on the magnitude and duration of any disruption’s effect on demand partners’ customer acquisition spending and/or the availability of quality Consumer Referrals from our supply partners, our business, financial condition, operating results, cash flows, and prospects could be adversely affected.
In addition, COVID-19 or other disease outbreaks will in the short-run, and may over the longer term, adversely affect the economies and financial markets within many countries, including in the United States, resulting in an economic downturn that could negatively affect customer acquisition spend by our demand partners or on consumer insurance product search activity (and, in turn, Consumer Referral availability). For example, certain companies that operate in the consumer credit industries, such as credit cards and personal loans, have tightened their lending criteria, which in turn may impact a consumer’s ability to afford products like insurance, and increased volatility in the financial markets may make it harder for companies to access the capital markets at favorable rates as needed. Such effects of COVID-19, and other similar effects, could result in reduced customer acquisition spend or drops in Consumer Referral availability, which could have a material and adverse effect on our business, financial condition, operating results, cash flows, and prospects. There can be no assurance that any decrease in revenue or margin resulting from COVID-19 will be offset by increased revenue or margin in subsequent periods or that our business, financial condition, operating results, cash flows, and prospects will remain consistent with current or pre-pandemic expectations and/or performances.
Furthermore, we may experience disruptions to our business operations resulting from quarantines, self-isolations, or other restrictions on the ability of our employees to perform their jobs, conduct in-person meetings, and attend tradeshows, which may impact our sales and customer acquisition activities and our ability to design, develop or deliver our products and services in a timely manner or meet partner commitments, which could have a material and adverse impact on our business, financial condition, operating results, cash flows, and prospects.
27
Moreover, to the extent the COVID-19 pandemic or any worsening of the global business and economic environment as a result thereof adversely affects our business, financial condition, operating results, cash flows, and prospects, it may also have the effect of heightening or exacerbating many of the other risks described in these risk factors, such as those relating to a reduction in DTC digital spend by our demand partners, our dependence on insurance carriers and sellers on our platform, seasonal fluctuations, and our ability to raise additional capital or otherwise refinance on acceptable terms when and as needed.
Given that the magnitude and duration of the impact of the COVID-19 pandemic on our business and operations remains uncertain, the continued spread of COVID-19 or the occurrence of other pandemics and the imposition of related public health measures and travel and business restrictions could have a material and adverse impact on our business, financial condition, operating results, cash flows, and prospects.
Our business could be adversely affected by natural disasters, public health crises, political crises, economic downturns or other unexpected events.
A significant natural disaster, such as an earthquake, fire, hurricane, tornado, flood or significant power outage, could disrupt our operations, platform, the internet or the operations of our third-party technology providers. In particular, our corporate headquarters are located in Los Angeles, a region known for seismic activity. In addition, any unforeseen public health crises, such as epidemics, political crises, terrorist attacks, war, and other political instability, or other catastrophic events, whether in the United States or abroad, could adversely affect our operations or the economy as a whole. The impact of any natural disaster, act of terrorism or other disruption to us or our third-party providers’ abilities could result in decreased demand for our offerings or a delay in the provision of our offerings, which could adversely affect our business, financial condition, operating results, cash flows, and prospects. All of the aforementioned risks may be further increased if our disaster recovery plans prove to be inadequate.
Our business, financial condition, operating results, cash flows, and prospects are also subject to global economic conditions. If general economic conditions deteriorate in the United States or in other markets where we operate, our demand partners’ customer acquisition spending and consumer insurance product search activity (and in turn, Consumer Referral availability) on our platform may decline. An economic downturn resulting in a prolonged recessionary period may have a further adverse effect on our business, financial condition, operating results, cash flows, and prospects.
We may acquire other companies or technologies, which could divert our management’s attention, result in additional dilution to our stockholders, and otherwise disrupt our operations and harm our operating results, financial condition, and prospects.
We may determine to grow our business through the acquisition of complementary businesses and technologies rather than through internal development. The identification of suitable acquisition candidates can be difficult, time-consuming, and costly, and we may not be able to successfully complete identified acquisitions or the acquisitions may cause diversion of management time and focus away from operating our business. Following any acquisition, we may face difficulty integrating technology, finance, and accounting, research and development, human resources, consumer information, and sales and marketing functions; challenges retaining acquired employees; future write-offs of intangibles or other assets; and potential litigation, claims or other known and unknown liabilities.
Depending on the condition of any company or technology we may acquire, that acquisition may, at least in the near term, adversely affect our business, financial condition, operating results, cash flows, and prospects and, if not successfully integrated with our organization, may continue to have such effects over a longer period. We may not realize the anticipated benefits of any acquisitions and we may not be successful in overcoming these risks or any other problems encountered in connection with potential acquisitions. Our inability to overcome these risks could have an adverse effect on our profitability, return on equity, and return on assets, and our ability to implement our business strategy and enhance stockholder value, which in turn could have a material and adverse effect on our business, financial condition, operating results, cash flows, and prospects.
28
Future acquisitions also could result in dilutive issuances of our equity securities and the incurrence of debt, which could harm our financial condition.
Our quarterly revenue and results of operations may fluctuate significantly from quarter to quarter due to fluctuations in advertising spending, including seasonal and cyclical effects.
In addition to other factors that cause our results of operations to fluctuate, our results are also subject to significant seasonal fluctuation. In our property & casualty insurance vertical, revenue and results in our last fiscal quarter are typically weaker than in our first three fiscal quarters due to lower supply of Consumer Referrals during the holiday period on a cost-effective basis and lower customer acquisition budgets from some demand partners. In our first fiscal quarter, this trend generally reverses with greater supply of Consumer Referrals and often new customer acquisition budgets at the beginning of the year for our partners with fiscal years ending December 31. In our health insurance vertical, revenue and results in our second and third fiscal quarters are typically weaker than in our first and last fiscal quarters during which the open enrollment period for health insurance and annual enrollment for Medicare drives a material increase in consumer search volume for health insurance and Medicare products and a related increase in demand partner customer acquisition budgets.
Other factors affecting our partners’ businesses include macroeconomic factors such as credit availability, the strength of the economy, and employment. Any of the foregoing seasonal trends, or the combination of them, may negatively impact our quarterly revenue and results of operations.
Furthermore, advertising spend on the internet, similar to traditional media, tends to be cyclical and discretionary as a result of factors beyond our control, including budgetary constraints and buying patterns of partners, as well as economic conditions affecting the internet and media industry. For example, weather and other events have in the past led to short-term decreases in insurance industry partner advertising spend, increases in loss ratios and damage or interruption in our partners’ operations, any of which can lead to decreased partner spend on online performance marketing. In addition, inherent industry specific risks (e.g., insurance industry loss ratios and cutbacks) and poor macroeconomic conditions as well as other short-term events could decrease our partners’ advertising spending and thereby have a material and adverse effect on our business, financial condition, operating results, cash flows, and prospects.
If the market for digital customer acquisition services fails to continue to develop, our success may be limited, and our revenue may decrease.
The digital customer acquisition services market is relatively new and rapidly evolving, and it uses different measurements than traditional media to gauge its effectiveness. Some of our current or potential partners have little or no experience using the internet for customer acquisition purposes and have allocated only limited portions of their customer acquisition budgets to the internet. The adoption of digital customer acquisition, particularly by those companies that have historically relied upon traditional media for customer acquisition, requires the acceptance of a new way of conducting business, exchanging information, and evaluating new customer acquisition technologies and services.
In addition, we may experience resistance from traditional advertising agencies that may be advising our partners. We cannot assure you that the market for digital customer acquisition services will continue to grow. If the market for digital customer acquisition services fails to continue to develop or develops more slowly than we anticipate, the success of our business may be limited, and our revenue may stop growing or decrease.
If we fail to protect our brand, our ability to expand the use of our platform by buyers and sellers may be adversely affected.
Maintaining strong brand recognition and a reputation for delivering value to our partners is important to our business. A failure by us to protect our brand and deliver on these expectations could harm our reputation and damage our ability to attract and retain partners, which could adversely affect our business, financial condition, operating results, cash flows, and prospects. Furthermore, a failure to protect our trademarks and domain names could adversely affect our brand and make it more difficult for users to find our platform. In addition, our
29
competitors may have more resources than we do and may spend more advertising their brands and services. Accordingly, we could be forced to incur greater expense marketing our brand in the future to preserve our position in the market and, even with such greater expense, may not be successful in doing so. Furthermore, complaints or negative publicity about our business practices, legal compliance, marketing and advertising campaigns, data privacy and security issues, and other aspects of our business, whether valid or not, could damage our reputation and brand. If we are unable to maintain or enhance client awareness of our brand cost-effectively, our business, financial condition, operating results, cash flows, and prospects could be materially and adversely affected.
Our existing and any future indebtedness could adversely affect our ability to operate our business.
On September 23, 2020, QuoteLab, LLC entered into the 2020 Credit Agreement with JPMorgan Chase Bank, N.A., as lender and administrative agent, and the other lenders from time-to-time party thereto, providing for the 2020 Credit Facilities consisting of (i) the 2020 Term Loan Facility and (ii) the 2020 Revolving Credit Facility. Proceeds from the 2020 Term Loan Facility were used to refinance the 2019 Credit Facilities and pay related fees and expenses and fund a distribution to equity holders of QLH. The 2020 Revolving Credit Facility is available for general corporate purposes. We could in the future incur additional indebtedness.
Our existing or future indebtedness could have important consequences, including:
|
|
• |
requiring us to dedicate a substantial portion of our cash flow to payments on our indebtedness, which would reduce the amount of cash flow available to fund working capital, capital expenditures or other corporate purposes; |
|
|
• |
increasing our vulnerability to general adverse economic, industry, and market conditions; |
|
|
• |
subjecting us to restrictive covenants, including restrictions on our ability to pay dividends and requiring the pledge of substantially all of our assets as collateral, that may reduce our ability to take certain corporate actions or obtain further debt or equity financing; |
|
|
• |
limiting our ability to plan for and respond to business opportunities or changes in our business or industry; and |
|
|
• |
placing us at a competitive disadvantage compared to our competitors that have less debt or better debt servicing options. |
In addition, our indebtedness under the 2020 Credit Facilities bears interest at a variable rate, making us vulnerable to increases in the market rate of interest. If the market rate of interest increases substantially, we will have to pay additional interest on this indebtedness, which would reduce cash available for our other business needs.
We may not have sufficient funds, and may be unable to generate sufficient cash flows from operations, to pay the amounts due under our existing debt instruments. Failure to make payments or comply with other covenants under our existing or future debt instruments could result in an event of default. If an event of default occurs and the lender accelerates the amounts due, we may need to seek additional financing, which may not be available on acceptable terms, in a timely manner or at all. In such event, we may not be able to make accelerated payments, and the lender could seek to enforce security interests, if any, in the collateral securing such indebtedness, which includes or could include substantially all of our assets. In addition, the covenants under our existing or future debt instruments, any pledge of our assets as collateral and any negative pledge with respect to our intellectual property could limit our ability to obtain additional debt financing. Any of these events could have a material and adverse effect on our business, financial condition, operating results, cash flows, and prospects.
If we are unable to collect our receivables from our partners, our business, financial condition, operating results, cash flows, and prospects could be adversely affected.
We expect to obtain payment from our partners for work performed and maintain an allowance against receivables for potential losses on partner accounts. Actual losses on partner receivables could differ from those that we have historically experienced or currently anticipate and, as a result, we may need to adjust our allowances. We may not accurately assess the creditworthiness of our partners. Macroeconomic conditions, such as any evolving industry standards, changing regulatory conditions, changing consumer and partner demands, and the effects of
30
COVID-19, could also result in financial difficulties for our partners, including insolvency or bankruptcy. As a result, this could cause partners to delay payments to us, request modifications to their payment arrangements that could extend the timing of cash receipts, or default on their payment obligations to us. If we experience an increase in the time to bill and collect for our services, our business, financial condition, operating results, cash flows, and prospects could be adversely affected.
Developments with respect to LIBOR may affect our borrowings under our credit facilities.
On July 27, 2017, the Financial Conduct Authority announced that it would phase-out LIBOR by the end of 2021. It is unclear whether new methods of calculating LIBOR will be established such that it effectively continues to exist after 2021, or if alternative rates or benchmarks will be adopted. Changes in the method of calculating LIBOR, or the replacement of LIBOR with an alternative rate or benchmark, may adversely affect interest rates and result in higher borrowing costs. We cannot predict the effect of the potential changes to LIBOR or the establishment and use of alternative rates or benchmarks.
The 2020 Credit Agreement provides that interest may be based on LIBOR and contains provisions for the establishment of a replacement rate to LIBOR in the event LIBOR is phased-out; however, uncertainty remains as to any such replacement rate and any such replacement rate may be higher or lower than LIBOR may have been. The establishment of a replacement rate or implementation of any other potential changes may materially and adversely affect our business, financial condition, operating results, cash flows, and prospects.
Operating and growing our business may require additional capital, and if capital is not available to us, our business, financial condition, operating results, cash flows, and prospects may suffer.
Operating and growing our business is expected to require further investments in our technology and operations. We may be presented with opportunities that we want to pursue, and unforeseen challenges may present themselves, any of which could cause us to require additional capital beyond our internally generated cash flows. At any given time, if our cash needs exceed our expectations or we experience rapid growth, we could experience strain in our cash flow, which could adversely affect our operations in the event we were unable to obtain other sources of liquidity. If we seek to raise funds through equity or debt financing, those funds may prove to be unavailable, may only be available on terms that are not acceptable to us or may result in significant dilution to you or higher levels of leverage. If we are unable to obtain adequate financing or financing on terms satisfactory to us, when we require it, our ability to continue to pursue our business objectives and to respond to business opportunities, challenges or unforeseen circumstances could be significantly limited, and our business, financial condition, operating results, cash flows, and prospects could be materially and adversely affected.
Changes in tax laws or exposure to additional income tax liabilities could affect our future profitability.
We are subject to income taxes in the United States, various state and local jurisdictions and foreign jurisdictions. Our effective tax rate and profitability could be subject to volatility or adversely affected by a number of factors, including:
|
|
• |
changes in applicable tax laws and regulations, or their interpretation and application, including the possibility of retroactive effect; |
|
|
• |
changes in accounting and tax standards or practice; |
|
|
• |
changes in the valuation of deferred tax assets and liabilities; and |
|
|
• |
our operating results before taxes. |
In addition, we may be subject to audits of our income, sales, and other taxes by U.S. federal, state and local taxing authorities, and foreign authorities. Outcomes from these audits could have a material and adverse effect on our business, financial condition, operating results, cash flows, and prospects.
31
We may from time to time be subject to litigation, which may be extremely costly to defend, could result in substantial judgment or settlement costs or subject us to other remedies.
We are currently not a party to any material legal proceedings. From time to time, however, we may be involved in various legal proceedings, including, but not limited to, actions relating to breach of contract and intellectual property infringement, misappropriation or other violation. Claims may be expensive to defend, may divert management’s time away from our operations, and may affect the availability and premiums of our liability insurance coverage, regardless of whether they are meritorious or ultimately lead to a judgment against us. We cannot assure you that we will be able to successfully defend or resolve any current or future litigation matters, in which case those litigation matters could have a material and adverse effect on our business, financial condition, operating results, cash flows, and prospects.
Sellers, vendors, or their respective affiliates may engage in unauthorized or unlawful acts that could subject us to significant liability or cause us to lose demand partners and revenue.
We generate a majority of our Consumer Referrals from online media that we source directly from our supply partners’ websites, as well as indirectly from the affiliates of our supply partners. We also rely on third-party call centers and email marketers. Some of these third parties, vendors, and their respective affiliates are authorized to use our demand partners’ brands, subject to contractual restrictions. Any activity by suppliers, vendors, or their respective affiliates which violates the marketing guidelines of our demand partners or that our demand partners view as potentially damaging to their brands, whether or not permitted by our contracts with our demand partners, could harm our relationships and cause demand partners to terminate their relationship with us, resulting in a loss of revenue. Moreover, because we do not have a direct contractual relationship with the affiliates of our suppliers, we may not be able to monitor the compliance activity of such affiliates. If we are unable to cause our suppliers to monitor and enforce our demand partners’ contractual restrictions on such affiliates, our demand partners may terminate their relationships with us or decrease their customer acquisition budgets with us. In addition, we may also face liability for any failure of our suppliers, vendors or their respective affiliates to comply with regulatory requirements.
The law is unsettled on the extent of liability that an advertiser has for the activities of sellers or vendors. Insurance regulations may impose liability on our demand partners for misrepresentations made by their marketing service providers. In addition, certain of our contracts impose liability on us, including indemnification obligations, for the acts of our sellers or vendors. We could be subject to costly litigation and, if we are unsuccessful in defending ourselves, we could incur damages for the unauthorized or unlawful acts of sellers or vendors.
Risks related to our intellectual property rights and our technology
If we are unable to adequately obtain, maintain, protect or enforce our intellectual property rights, our ability to compete could be harmed.
Our ability to compete effectively depends upon our ability to obtain, maintain, protect, and enforce our intellectual property rights, proprietary systems, and technology. We rely on a combination of trade secret, trademark and copyright law, confidentiality agreements, and technical measures to establish, maintain and protect our intellectual property rights and technology. These laws are subject to change at any time and could further limit our ability to protect our intellectual property rights. Additionally, there is uncertainty concerning the scope of patent and other intellectual property protection for software and business methods, which are fields in which we rely on intellectual property laws to protect our rights. Despite our efforts to obtain, maintain, protect, and enforce our intellectual property rights, these efforts may not be sufficient to effectively prevent unauthorized disclosure or unauthorized use of our trade secrets or other confidential information or to prevent third parties from infringing, misappropriating, diluting or otherwise violating our intellectual property rights and offering similar or superior functionality. To the extent we are able to obtain enforceable intellectual property rights, such intellectual property rights may not prevent third parties from reverse engineering our proprietary information or independently developing product and service technology offerings and services similar to or duplicative of our product and service offerings. For example, monitoring and protecting our intellectual property rights can be challenging and costly and we may not be effective in policing or prosecuting such unauthorized use or disclosure.
32
We also may fail to maintain or be unable to obtain adequate protections for certain of our intellectual property rights in the U.S. or certain foreign countries, and our intellectual property rights may not receive the same degree of protection in foreign countries as they would in the U.S. because of the differences in foreign patent, trademark, copyright, and other laws concerning proprietary rights. Any of our intellectual property rights may be challenged or circumvented by others or invalidated or held unenforceable through administrative process or litigation in the U.S. or in foreign jurisdictions. Furthermore, legal standards relating to the validity, enforceability, and scope of protection of intellectual property rights are uncertain. In addition, our competitors may attempt to copy unprotected aspects of our product design or independently develop similar technology or design around our intellectual property rights. Third parties also may take actions that diminish the value of our proprietary rights or our reputation or cause partner confusion through the use of similar service names or domain names. Litigation regarding any intellectual property disputes may be costly and disruptive to us. Any of these results would harm our business, financial condition, operating results, cash flows, and prospects.
Additionally, we rely, in part, on trade secrets, proprietary know-how, and other confidential information to maintain our competitive position. We enter into confidentiality and invention assignment agreements with our employees and enter into confidentiality agreements with third parties, including our partners. However, we cannot guarantee that we have entered into such agreements with each party that has or may have had access to our proprietary information, know-how and trade secrets. Moreover, no assurance can be given that these agreements will be effective in controlling access to, distribution, use, misuse, misappropriation, reverse engineering or disclosure of our proprietary information, know-how and trade secrets. Further, these agreements may not prevent our competitors from independently developing technologies that are substantially equivalent or superior to our products and platform capabilities. These agreements may be breached, and we may not have adequate remedies for any such breach. Enforcing a claim that a party illegally disclosed or misappropriated a trade secret or know-how is difficult, expensive, and time-consuming, and the outcome is unpredictable. In addition, trade secrets and know-how can be difficult to protect and some courts inside and outside the U.S. are less willing or unwilling to protect trade secrets and know-how. If any of our trade secrets were to be lawfully obtained or independently developed by a competitor or other third party, we would have no right to prevent them from using that technology or information to compete with us. If any of our trade secrets were to be disclosed to or independently developed by a competitor or other third party, our competitive position would be materially and adversely harmed.
We currently hold various domain names relating to our brand, including mediaalpha.com, quotelab.com, and healthplans.com. Failure to maintain our domain names could adversely affect our reputation and brand and make it more difficult for current and future partners to find our website and our platform. We may be unable, without significant cost or at all, to prevent third parties from acquiring domain names that are similar to, infringe upon or otherwise decrease the value of our trademarks and other proprietary rights.
We may become subject to intellectual property disputes, which are costly and may subject us to significant liability and increased costs of doing business.
Our success depends, in part, on our ability to develop and commercialize our products and services without infringing, misappropriating or otherwise violating the intellectual property rights of third parties. However, we may not be aware that our products or services are infringing, misappropriating or otherwise violating third-party intellectual property rights and such third parties may bring claims alleging such infringement, misappropriation or violation. Third parties may be able to successfully challenge, oppose, invalidate, render unenforceable, dilute, misappropriate or circumvent our trademarks, copyrights, and other intellectual property rights. Additionally, companies in the internet, technology, and media industries own large numbers of patents, copyrights, trademarks, and trade secrets and frequently enter into litigation based on allegations of infringement or other violations of intellectual property rights. As we face increasing competition and become increasingly high profile, the possibility of receiving a larger number of intellectual property claims against us grows. In addition, various “non-practicing entities,” and other intellectual property rights holders may in the future attempt to assert intellectual property claims against us or seek to monetize the intellectual property rights they own to extract value through licensing or other settlements.
Any claim of infringement or other proceeding involving our intellectual property rights by a third party, even those without merit, against us or for which we are required to provide indemnification could cause us to incur substantial costs defending against the claim, could distract our management from our business, and could require us
33
to cease use of such intellectual property. Further, because of the substantial amount of discovery required in connection with intellectual property litigation, we risk compromising our confidential information during this type of litigation. We may be required to make substantial payments for legal fees, settlement fees, damages, royalties, or other fees in connection with a claimant securing a judgment against us. If a third party is able to obtain an injunction preventing us from accessing such third party’s intellectual property rights, or if we cannot license or develop alternative technology for any infringing aspect of our business, we would be forced to limit or stop sales of our products and platform capabilities or cease business activities related to such intellectual property.
We may be required to spend significant resources in order to monitor and protect our intellectual property rights, and some violations may be difficult or impossible to detect. Actions we may take to enforce our intellectual property rights may be expensive and divert management’s attention away from the ordinary operation of our business and could result in the impairment or loss of portions of our intellectual property. Our efforts to enforce our intellectual property rights may be met with defenses, counterclaims, and countersuits attacking the validity and enforceability of our intellectual property rights, and, if such defenses, counterclaims, and countersuits are successful, we could lose valuable intellectual property rights. Our inability to secure and protect our intellectual property rights could impair the functionality of our platform, delay introductions of enhancements to our platform, result in our substituting inferior or more costly technologies into our platform, or harm our reputation and brand, and could materially and adversely affect our brand and business, financial condition, operating results, cash flows, and prospects. Furthermore, such enforcement actions, even if successful, may not result in an adequate remedy. In addition, many companies have the capability to dedicate greater resources to enforce their intellectual property rights and to defend claims that may be brought against them.
Although we carry general liability insurance, our insurance may not cover potential claims of this type or may not be adequate to indemnify us for all liability that may be imposed. We cannot predict the outcome of lawsuits and cannot ensure that the results of any such actions will not have an adverse effect on our business, financial condition, operating results, cash flows, and prospects. Such claims could subject us to significant liability for damages and could result in our having to stop using technology found to be in violation of a third party’s rights. Further, we might be required to seek a license for third-party intellectual property, which may not be available on favorable or commercially reasonable terms and may significantly increase our operating expenses. Some licenses may be non-exclusive, and therefore our competitors may have access to the same technology licensed to us. If a third party does not offer us a license to its intellectual property on commercially reasonable terms, or at all, we could be required to develop alternative non-infringing technology, which could require significant time, effort and expense, and may ultimately not be successful. If we cannot license or develop technology for any infringing aspect of our business, we would be forced to limit our services, which could affect our ability to compete effectively. Any of these results would harm our business, financial condition, operating results, cash flows, and prospects.
Our business depends on our ability to maintain and improve the technological infrastructure that supports our platform, and any significant disruption in service on our platform could result in a loss of partners, which could harm our business, financial condition, operating results, cash flows, and prospects.
Our ability to service partners depends on the reliable performance of our technological infrastructure, including the cloud computing platforms we use. Interruptions, delays or failures in these systems, whether due to our cloud computing and other vendors, adverse weather conditions, natural disasters, power loss, computer viruses, cybersecurity attacks, physical break-ins, terrorism, errors in our software or otherwise, could be prolonged and could affect the security or availability of our platform. Our systems or those of third parties may also contain undetected errors or other performance problems or may fail due to human error. The reliability and security of our systems, and those of our partners and vendors, is important not only to maintaining our platform, but also to maintaining our reputation and ensuring the proper protection of our confidential and proprietary information. If we experience operational failures or prolonged disruptions or delays in the availability of our systems, we could lose current and potential partners, which could harm our business, financial condition, operating results, cash flows, and prospects.
Any errors, defects, or disruptions in our platform, or other performance problems with our platform could harm our brand and may damage the businesses of our partners. Our online systems, including our platform, could contain undetected errors, or “bugs,” that could adversely affect their performance. Additionally, we update our platform and our other online systems. These updates may contain undetected errors when first introduced or released, which may cause disruptions in our services and may, as a result, cause us to lose current and potential partners, which could harm our business, financial condition, operating results, cash flows, and prospects.
34
We rely on third-party service providers for many aspects of our business, including the operation of our platform, and any disruption of service experienced by such third-party service provider or our failure to manage and maintain existing relationships or identify other high-quality, third-party service providers could harm our business, financial condition, operating results, cash flows, and prospects.
Information technology systems form a key part of our business and accordingly we are dependent on our relationships with third-party service providers that provide the infrastructure for our platform and technological systems, including our cloud vendors and data center providers. If these third parties experience difficulty providing the services we require or meeting our standards for those services, or experience disruptions or financial distress or cease operations temporarily or permanently, it could make it difficult for us to operate some aspects of our business. In addition, such events could cause us to experience increased costs and delay our ability to provide services to partners until we have found alternative sources of the services provided by these third parties. If we are unsuccessful in identifying or finding high-quality, third-party service providers, if we fail to negotiate cost-effective relationships with them or if we are ineffective in managing and maintaining these relationships, it could materially and adversely affect our business, financial condition, operating results, cash flows, and prospects.
We rely on Amazon Web Services to deliver our platform to our partners, and any disruption of, or interference with, our use of Amazon Web Services could adversely affect our business, financial condition, operating results, cash flows, and prospects.
Amazon Web Services (“AWS”) is a third-party provider of cloud infrastructure services. We outsource substantially all of the infrastructure relating to our platform to AWS. AWS provides the cloud computing infrastructure we use to host our website, serve our users and support our operations and many of the internal tools we use to operate our business. Our platform, website, and internal tools use compute, storage, data transfer, and other functions and services provided by AWS. We do not have control over the operations of the facilities of AWS that we use. AWS’ facilities may be vulnerable to damage or interruption from earthquakes, hurricanes, floods, fires, cybersecurity attacks, terrorist attacks, power losses, telecommunications failures, and other events beyond our control. In the event that AWS’ or any other third-party provider’s systems or service abilities are hindered by any of the events discussed above, our ability to operate our platform may be impaired, resulting in missing financial targets for a particular period. A decision to close the facilities without adequate notice, or other unanticipated problems, could result in lengthy interruptions to our platform. All of the aforementioned risks may be exacerbated if our or our partners’ business continuity and disaster recovery plans prove to be inadequate.
Additionally, AWS may experience threats or attacks from computer malware, ransomware, viruses, social engineering (including phishing attacks), denial of service or other attacks, employee theft or misuse, and general hacking, which have become more prevalent in our industry. Any of these security incidents could result in unauthorized access to, damage to, disablement or encryption of, use or misuse of, disclosure of, modification of, destruction of, or loss of our data or our partners’ data or disrupt our ability to provide our platform or service. Our platform’s continuing and uninterrupted performance is critical to our success. Users may become dissatisfied by any system failure that interrupts our ability to provide our platform to them. We may not be able to easily switch our AWS operations to another cloud or other data center provider if there are disruptions or interference with our use of AWS, and, even if we do switch our operations, other cloud and data center providers are subject to the same risks. Sustained or repeated system failures would reduce the attractiveness of our platform to our partners, thereby reducing revenue. Moreover, negative publicity arising from these types of disruptions could damage our reputation and may adversely impact the use of our platform. We may not carry sufficient business interruption insurance to compensate us for losses that may occur as a result of any events that cause interruptions in our service.
AWS does not have an obligation to renew its agreements with us on commercially reasonable terms, or at all. Although alternative data center providers could host our platform on a substantially similar basis to AWS, transitioning the cloud infrastructure currently hosted by AWS to alternative providers could potentially be disruptive and we could incur significant one-time costs. If we are unable to renew our agreement with AWS on commercially reasonable terms, our agreement with AWS is prematurely terminated, or we add additional infrastructure providers, we may experience costs or downtime in connection with the transfer to, or the addition of, new data center providers. If AWS or other infrastructure providers increase the costs of their services, our business, financial condition, operating results, cash flows, and prospects could be materially and adversely affected.
35
Our business could be materially and adversely affected by a cybersecurity breach or other attack involving our computer systems or those of our partners or third-party service providers.
Our systems and those of our partners and third-party service providers could be vulnerable to hardware and cybersecurity issues. Our operations are dependent upon the ability to protect our or our third-party service providers’ computer equipment and systems against telecommunications failure or a similar catastrophic event. Cybersecurity incidents are increasing in frequency and evolving in nature and include, but are not limited to, installation of malicious software, ransomware, viruses, phishing attacks, denial of service or other attacks, breach by intentional or negligent conduct on the part of employees or other internal sources, unauthorized access to data and other electronic security breaches. Concerns about security increase when we transmit information (including personal data) electronically. Electronic transmissions can be subject to attack, interception, loss or corruption. In addition, computer viruses and malware can be distributed and spread rapidly over the internet and could infiltrate our systems or those of our buyers, sellers, and third-party service providers. Infiltration of our systems or those of our partners and third-party service providers could in the future lead to disruptions in systems, accidental or unauthorized access to or disclosure, loss, destruction, disablement or encryption of, use or misuse of or modification of confidential or otherwise protected information (including personal data) and the corruption of data.
Any damage or failure that causes an interruption in our operations could have an adverse effect on our business, financial condition, operating results, cash flows, and prospects. In addition, our operations are dependent upon our ability to protect the computer systems and network infrastructure utilized by us against damage from cybersecurity attacks by sophisticated third parties with substantial computing resources and capabilities and other disruptive problems caused by the internet or other users. Such disruptions would jeopardize the security of information stored in and transmitted through our computer systems and network infrastructure, which may result in significant liability and damage our reputation.
We take efforts to protect our systems and data, including establishing internal processes and implementing technological measures designed to provide multiple layers of security, and contract with third-party service providers to take similar steps. However, it is difficult or impossible to defend against every risk being posed by changing technologies as well as criminals’ intent on committing cyber-crime, and these efforts may not be successful in preventing, detecting, or stopping attacks. The increasing sophistication and resources of cyber criminals and other non-state threat actors and increased actions by nation-state actors make keeping up with new threats difficult and could result in a breach of security. Controls employed by our information technology department and our partners and third-party service providers, including cloud vendors, could prove inadequate. A breach of our security that results in unauthorized access to our data could expose us to a disruption or challenges relating to our daily operations, as well as to data loss, litigation, damages, fines and penalties, significant increases in compliance costs and reputational damage, any of which could have a material and adverse effect on our business, financial condition, operating results, cash flows, and prospects.
To the extent our systems rely on our partners or third-party service providers, through either a connection to, or an integration with, those third-parties’ systems, the risk of cybersecurity attacks and loss, corruption, or unauthorized publication of our information or the confidential information of consumers and employees may increase. Third-party risks may include insufficient security measures, data location uncertainty, and the possibility of data storage in inappropriate jurisdictions where laws or security measures may be inadequate. Although we generally have agreements relating to cybersecurity and data privacy in place with our partners and third-party service providers, they are limited in nature and we cannot assure you that such agreements will prevent the accidental or unauthorized access to or disclosure, loss, destruction, disablement or encryption of, use or misuse of or modification of data (including personal data) or enable us to obtain adequate or any reimbursement from our partners or third-party service providers in the event we should suffer any such incidents.
Any or all of the issues above could adversely affect our ability to attract new partners and continue our relationship with existing partners, cause our partners to cancel their contracts with us or subject us to governmental or third-party lawsuits, investigations, regulatory fines or other actions or liability, thereby harming our business, financial condition, operating results, cash flows, and prospects. Any accidental or unauthorized access to or disclosure, loss, destruction, disablement or encryption of, use or misuse of or modification of data, cybersecurity breach or other security incident that we or our partners could experience or the perception that one has occurred or may occur, could harm our reputation, reduce the demand for our products and services and disrupt normal business operations. In addition, it may require us to spend material resources to investigate or correct the breach and to prevent future security breaches and incidents, expose us to uninsured liability, increase our risk of regulatory
36
scrutiny, expose us to legal liabilities, including litigation, regulatory enforcement, indemnity obligations or damages for contract breach, and cause us to incur significant costs, any of which could materially adversely affect our business, financial condition, and results of operations. Moreover, there could be public announcements regarding any such incidents and any steps we take to respond to or remediate such incidents, and if securities analysts or investors perceive these announcements to be negative, it could have a substantial adverse effect on the price of our Class A common stock. These risks may increase as we continue to grow and collect, process, store, and transmit increasingly large amounts of data. Although we are not aware of any material information security breaches to date, we have detected common types of attempts to attack our information systems and data.
We collect, process, store, share, disclose, transfer, and use consumer information and other data, and an actual or perceived failure to protect such information and data or respect users’ privacy could damage our reputation and brand or negatively affect our ability to retain partners and harm our business, financial condition, operating results, cash flows, and prospects.
The operation of our platform involves the collection, processing, storage and transmission of consumers’ information, including personal information, and security breaches could expose us to a risk of loss or exposure of this information, which could result in potential liability, investigations, regulatory fines, litigation, and remediation costs, as well as reputational harm, all of which could materially and adversely affect our business, financial condition, operating results, cash flows, and prospects. For example, unauthorized parties could steal consumer names, email addresses, physical addresses, phone numbers, and other information, which we collect when providing our services.
Any failure or perceived failure by us to comply with our privacy policies, our privacy-related obligations to consumers or other third parties, or our privacy-related legal obligations, or any compromise of security that results in the unauthorized release or transfer of sensitive information, which could include personally identifiable information or other user data, may result in governmental investigations, enforcement actions, regulatory fines, litigation, and public statements against us by consumer advocacy groups or others, and could cause consumers and partners to lose trust in us, all of which could be costly and have an adverse effect on our business, financial condition, operating results, cash flows, and prospects. Regulatory agencies or business partners may institute more stringent data protection requirements or certifications than those which we are currently subject to and, if we cannot comply with those standards in a timely manner, we may lose the ability to maintain our platform. Moreover, if third parties that we work with violate applicable laws or our policies, such violations also may put consumer or partner information at risk and could in turn harm our reputation, business, financial condition, operating results, cash flows, and prospects.
There can be no assurance that any security measures that we or our third-party service providers have implemented will be effective against current or future security threats. While we have developed systems and processes to protect the integrity, confidentiality, and security of our and our partners’ data, our security measures or those of our third-party service providers could fail and result in unauthorized access to or disclosure, modification, misuse, loss or destruction of such data.
We may be unable to halt the operations of third-party websites that aggregate or misappropriate our data.
From time to time, third parties may misappropriate our data through website scraping, robots, or other means and aggregate this data on their websites with data from other companies. In addition, copycat websites may misappropriate data from our platform and attempt to imitate our brand or the functionality of our website. If we become aware of such websites, we intend to employ technological or legal measures in an attempt to halt their operations. However, we may be unable to detect all such websites in a timely manner and, even if we could, technological and legal measures may be insufficient to halt their operations. In some cases, particularly in the case of websites operating outside of the U.S., our available remedies may not be adequate to protect us against the effect of the operation of such websites. Regardless of whether we can successfully enforce our rights against the operators of these websites, any measures that we may take could require us to expend significant financial or other resources, which could harm our business, financial condition, operating results, cash flows, and prospects. In addition, to the extent that such activity creates confusion among consumers or advertisers, our brand and business could be harmed.
37
Our proprietary predictive modeling tools and artificial intelligence algorithms may not operate properly or as we expect them to, which could detrimentally impact our buyers’ advertising campaigns. Moreover, our proprietary predictive modeling tools and artificial intelligence algorithms may lead to unintentional bias and discrimination.
We use proprietary predictive modeling tools and artificial intelligence algorithms in our product offerings. The data that we gather from interactions with consumers is evaluated and curated by proprietary predictive modeling tools and artificial intelligence algorithms. The continuous development, maintenance, and operation of our back-end data analytics engine is expensive and complex, and may involve unforeseen difficulties, including material performance problems, undetected defects or errors. We may encounter technical obstacles, and it is possible that we may discover additional problems that prevent our proprietary predictive modeling tools and artificial intelligence algorithms from operating properly. If our data analytics do not function reliably, this could negatively impact either the bidding experience for buyers on our platform or our ability to filter bids as part of the bid screening process or accurately predict a consumer’s buying behavior. Any of these situations could result in buyers’ dissatisfaction with us, which could cause our buyers to stop using our platform or prevent prospective buyers from using our platform. Additionally, our proprietary predictive modeling tools and artificial intelligence algorithms may lead to unintentional bias and discrimination, which could subject us to legal or regulatory liability as well as reputational harm. Any of these eventualities could result in a material and adverse effect on our business, financial condition, operating results, cash flows, and prospects.
If the way cookies are used or shared, or if the use or transfer of cookies is restricted by third parties outside of our control or becomes subject to unfavorable legislation or regulation, our ability to develop and provide certain products or services could be affected.
Small text files (referred to as “cookies”) placed on internet browsers by certain websites are used to gather data regarding a user’s web browsing activity. For example, cookie data allows us to collect data about the websites and webpages that users may visit or to identify users on other websites who have previously visited our partners’ websites. This information helps us to recognize prior users and to gather accurate conversion data from our partners. The availability of cookie data may be limited by numerous potential factors, including general trends among internet users to refuse to accept cookies on their web browsers, web browsers blocking third-party cookies by default or otherwise transitioning away from using cookies, other laws or regulations limiting the transferability or use of information gathered using cookies, or the refusal of providers of such information to provide it to us or to provide it to us on favorable terms. If we are not able to obtain this information on the terms we anticipate, our product offerings may be affected, which may cause a reduction in revenue or a reduction in revenue growth.
Our use of “open source” software could adversely affect our ability to protect our proprietary software and subject us to possible litigation.
Some of our services and technologies incorporate software licensed under so-called “open source” licenses. In addition to risks related to general license requirements, usage of “open source” software can lead to greater risks than use of third-party commercial software, as “open source” licensors generally do not provide warranties or controls on origin of the software or other contractual protections regarding infringement claims or code quality, as it is generally freely accessible, usable, and modifiable, and is made available to the general public on an “as-is” basis under the terms of a non-negotiable license. Additionally, “open source” licenses frequently require that source code subject to the license be made available to the public, and often require that modifications or derivative works to “open source” software continue to be licensed under “open source” licenses. Certain “open source” licenses mandate that proprietary software, when combined in specific ways with “open source” software, become subject to the “open source” license.
From time to time, companies that incorporate open source software into their platforms have faced claims challenging the use of open source software and/or compliance with open source license terms. We could be subject to suits by parties claiming ownership of what we believe to be open source software, or claiming non-compliance with open source licensing terms. Some open source licenses require users who distribute software containing open source to make available source code for modifications or derivative works we create based upon the type of open source software we use, or grant other licenses to our intellectual property, which in some circumstances could include valuable proprietary code of the user. While we monitor our use of open source software and try to ensure
38
that none is used in a manner that would require us to disclose our proprietary source code or that would otherwise breach the terms of an open source agreement, such use could inadvertently occur, in part because open source license terms are often ambiguous. The terms of many open source licenses have not been interpreted by U.S. or foreign courts, and there is a risk that these licenses could be construed in a way that could impose unanticipated conditions or restrictions on our ability to provide our platform. If we are held to have breached or failed to fully comply with all the terms and conditions of an open source software license, or if an author or other third party that distributes such open source software were to allege that we had not complied with the conditions of one or more of these licenses, we could be required to incur significant legal expenses defending against such allegations, could be subject to significant damages, enjoined from the operation of our platform or other liability, or be required to seek costly licenses from third parties to continue providing our platform on terms that are not economically feasible, to re-engineer our platform, to discontinue or delay the provision of our platform if re-engineering could not be accomplished on a timely basis, or to make generally available, in source code form, our proprietary code, any of which would adversely affect our business, financial condition, operating results, cash flows, and prospects, and could help our competitors develop platforms that are similar to or better than ours.
We may not be able to protect and enforce our trademarks and trade names, or build name recognition in our markets of interest, thereby harming our competitive position.
If we apply to register trademarks in the U.S. and other countries, our applications may not be allowed for registration in a timely fashion or at all, and our registered trademarks may not be enforced. Furthermore, the steps that we have already taken to protect our intellectual property may not be sufficient or effective. Even if we do detect violations, we may need to engage in litigation to enforce our rights. In addition, the registered or unregistered trademarks or trade names that we own may be challenged, infringed, circumvented, declared generic, lapsed or determined to be infringing on or dilutive of other marks. We may not be able to protect our rights in these trademarks and trade names, which we need in order to build name recognition.
In addition, opposition or cancellation proceedings may in the future be filed against our trademark applications and registrations, and our trademarks may not survive such proceedings. In addition, third parties may file first for our trademarks in certain countries. If they succeed in registering such trademarks, and if we are not successful in challenging such third-party rights, we may not be able to use these trademarks to market our products in those countries. If we do not secure registrations for our trademarks, we may encounter more difficulty in enforcing them against third parties than we otherwise would. If we are unable to establish name recognition based on our trademarks and trade names, we may not be able to compete effectively, which could have a material adverse effect on our business, financial condition, operating results, cash flows, and prospects.
Risks related to laws and regulation
Changes in the regulation of the internet could adversely affect our business, financial condition, operating results, cash flows, and prospects.
Laws, rules and regulations governing internet communications, advertising and e-commerce are dynamic and the extent of future government regulation is uncertain. Federal and state regulations govern various aspects of our online business, including intellectual property ownership and infringement, trade secrets, the distribution of electronic communications, marketing and advertising, user privacy and data security, search engines, and internet tracking technologies. In addition, changes in laws or regulations that adversely affect the growth, popularity or use of the internet, including with respect to net neutrality, could decrease the demand for our offerings and increase our cost of doing business. Future taxation on the use of the internet or e-commerce transactions could also be imposed. Existing or future regulation or taxation could hinder growth in or adversely affect the use of the internet generally, including the viability of internet e-commerce, which could adversely affect our business, financial condition, operating results, cash flows, and prospects.
Our business is subject to a variety of laws and regulations, both in the U.S. and internationally, many of which are evolving.
We are subject to a wide variety of laws and regulations. Laws, regulations, and standards governing issues such as worker classification, employment, payments, worker confidentiality obligations, intellectual property, consumer protection, taxation, privacy, antitrust and data security are often complex and subject to varying interpretations, in many cases due to their lack of specificity and, as a result, their application in practice may
39
change or develop over time through judicial decisions or as new guidance or interpretations are provided by regulatory and governing bodies, such as federal and state administrative agencies. Many of these laws were adopted prior to the advent of the internet, mobile and related technologies and, as a result, do not contemplate or address the unique issues of the internet and mobile and related technologies. Other laws and regulations may be adopted in response to internet, mobile and related technologies. New and existing laws and regulations (or changes in interpretation of existing laws and regulations) may also be adopted, implemented, or interpreted to apply to us and other online platforms. As our platform’s scope expands, regulatory agencies or courts may claim that we, or our users, are subject to additional requirements or that we are prohibited from conducting our business in or with certain verticals or jurisdictions. It is also possible that certain provisions in agreements with our buyers, sellers, and service providers may be found to be unenforceable or not compliant with applicable law.
Recent financial, political, and other events may increase the level of regulatory scrutiny on larger companies and technology companies in general. The effects of recently imposed and proposed governmental antitrust actions are uncertain because of the dynamic nature of such actions. Scrutiny and regulation of the technology industry may increase, which could require us to devote significant legal and other resources to addressing such scrutiny and regulation. The growth and development of the technology industry in general may prompt calls for greater enforcement of U.S. and/or state antitrust laws, which may impose additional burdens on companies such as ours. Regulatory agencies may also enact new laws or promulgate new regulations that are adverse to our business, or they may view matters or interpret laws and regulations differently than they have in the past or in a manner adverse to our business. Such regulatory scrutiny or action may create different or conflicting obligations on us from one jurisdiction to another. We may become subject to taxation in additional jurisdictions in the future.
Laws and regulations regulating insurance activities are complex and could negatively affect the insurance carriers who use our platform, which could in turn have a material and adverse effect on our business, may reduce our profitability and potentially limit our growth.
The insurance industry in the U.S. is heavily regulated. The insurance regulatory framework addresses, among other things: granting licenses to companies and agents to transact particular business activities; and regulating trade, marketing, compensation, and claims practices. The cost of compliance with such regulations or any non-compliance could impose material costs on them and negatively affect their business, marketing practices, and budgets, any of which could reduce their level of business with us and thus have a material and adverse effect on our business, financial condition, operating results, cash flows, and prospects.
Furthermore, the laws and regulations governing the sale of insurance may change in ways that adversely impact our insurance partners’ businesses. These changes could impact the manner in which they are permitted to conduct their businesses and could force them to reduce the compensation they receive, which could negatively affect their marketing practices, budgets, and overall level of business with us, which could adversely impact our business, financial condition, operating results, cash flows, and prospects.
Changes and developments in the regulation of the healthcare industry could adversely affect our business, financial condition, operating results, cash flows, and prospects.
The U.S. healthcare industry is subject to an evolving regulatory regime at both the federal and state levels. In recent years, there have been multiple reform efforts made within the healthcare industry in an effort to curtail healthcare costs. For example, the Patient Protection and Affordable Care Act of 2010 (the “PPACA”) and related regulatory reforms have materially changed the regulation of health insurance. While it is difficult to determine the impact of potential reforms on our future business, it is possible that such changes in industry regulation could result in reduced demand for our platform. Our insurance partners may react to existing or future reforms, or general regulatory uncertainty, by reducing their reliance on our platform. Developments of this type could materially and adversely affect our business, financial condition, operating results, cash flows, and prospects.
Healthcare laws and regulations are rapidly evolving and may change significantly in the future, impacting the coverage and plan designs that are or will be provided by certain insurance carriers. Health reform efforts and measures may expand the role of government-sponsored coverage, including single payer or “Medicare-for-All” proposals, which could have far-reaching implications for the insurance industry if enacted. We are unable to predict the full impact of healthcare reform initiatives on our operations in light of the uncertainty regarding the terms and timing of any provisions enacted and the impact of any of those provisions on various healthcare and insurance
40
industry participants. In particular, because our platform helps connect consumers to websites and other distribution channels where they can shop for insurance policies from a panel of insurance carriers, the expansion of government-sponsored coverage through “Medicare-for-All” or the implantation of a single payer system may adversely impact our business, financial condition, operating results, cash flows, and prospects.
Changes in laws or regulations relating to privacy, data protection or the protection or transfer of personal data could materially and adversely affect our business, financial condition, operating results, cash flows, and prospects.
We are subject to a variety of federal, state, local, and international laws, directives, and regulations, as well as contractual obligations, relating to privacy and the collection, protection, use, retention, security, disclosure, transfer, and other processing of personal information and other data, including the California Online Privacy Protection Act, the Personal Information Protection and Electronic Documents Act, the Controlling the Assault of Non-Solicited Pornography and Marketing Act (the “CAN-SPAM Act”), Canada’s Anti-Spam Law (“CASL”), the Telephone Consumer Protection Act of 1991 (the “TCPA”), the U.S. Federal Health Insurance Portability and Accountability Act of 1996 (“HIPAA”), Section 5(c) of the Federal Trade Commission Act, the EU’s General Data Protection Regulation (“GDPR”), supplemented by national laws (such as, in the United Kingdom, the Data Protection Act 2018) and further implemented through binding guidance from the European Data Protection Board, and the California Consumer Privacy Act (the “CCPA”). These laws, rules and regulations evolve frequently and their scope may continually change, through new legislation, amendments to existing legislation and changes in enforcement, and may be inconsistent from one jurisdiction to another. As a result, implementation standards and enforcement practices are likely to remain uncertain for the foreseeable future. Although we endeavor to comply with our published policies and documentation and ensure their compliance with current laws, rules and regulations, we may at times fail to do so or be alleged to have failed to do so. The publication of our privacy policy and other documentation that provide promises and assurances about privacy and security can subject us to potential state and federal action in the U.S. if they are found to be deceptive, unfair, or misrepresentative of our actual practices. Any failure by us or other parties with whom we do business to comply with this documentation or with federal, state, local or international regulations could result in proceedings against us by governmental entities, private parties or others. In many jurisdictions, enforcement actions and consequences for non-compliance are rising.
In the U.S., these include enforcement actions in response to rules and regulations promulgated under the authority of federal agencies and state attorneys general and legislatures and consumer protection agencies. A number of federal and state laws and regulations relating to privacy affect and apply to the insurance industry specifically, including those imposed by the New York Department of Financial Services. In addition, privacy advocates and industry groups have proposed and may propose new and different self-regulatory standards that either legally or contractually apply to us. If we fail to follow these security standards even if no customer information is compromised, we may incur significant fines or experience a significant increase in costs.
Internationally, virtually every jurisdiction in which we operate has established its own data security and privacy legal framework with which we or our customers must comply, including, but not limited to the EU. The EU’s data protection landscape is currently unstable, resulting in potentially significant operational costs for internal compliance and risk to our business. The EU has adopted the GDPR, which went into effect in May 2018 and contains numerous requirements and changes from previously existing EU law, including more robust obligations on data processors and heavier documentation requirements for data protection compliance programs by companies. Among other requirements, the GDPR regulates transfers of personal data subject to the GDPR to third countries that have not been found to provide adequate protection to such personal data, including the U.S. While we have taken steps to mitigate the impact on us with respect to transfers of data, such as implementing standard contractual clauses, the efficacy and longevity of these transfer mechanisms remains uncertain. The Court of Justice of the European Union (the “CJEU”) issued a decision on July 16, 2020, invalidating the EU-US Privacy Shield Framework and calling the validity of standard contractual clauses into question under certain circumstances, which has made the legality of transferring personal data from the EU to the U.S. or various other jurisdictions outside of the EU more uncertain. While the European Data Protection Board recently issued certain draft guidance relating to ongoing use of the standard contractual clauses, including certain proposed amendments to the standard contractual clauses, the CJEU’s decision has increased uncertainty surrounding data transfers from the EU to third countries that may not offer the same level of protection for data subjects’ rights as the EU.
41
The enactment of the GDPR also introduced numerous privacy-related changes for companies operating in the EU, including greater control for data subjects (including, for example, the “right to be forgotten”), increased data portability for EU consumers, data breach notification requirements, and increased fines. In particular, under the GDPR, fines of up to €20 million or up to 4% of the annual global revenue of the non-compliant company, whichever is greater, could be imposed for violations of certain of the GDPR’s requirements. Such penalties are in addition to any civil litigation claims by customers and data subjects. The GDPR requirements apply not only to third-party transactions, but also to transfers of information between us and our subsidiaries, including employee information.
In addition to the GDPR, Directive 2002/58/EC (as amended by Directive 2009/136/EC) (together, the “e-Privacy Directive”) governs, among other things, the use of cookies and the sending of electronic direct marketing within the EU and, as such, will apply to our platform and products and our relationships with our partners. The ePrivacy Directive is expected to be replaced by an EU regulation known as the Regulation on Privacy and Electronic Communications (the “ePrivacy Regulation”), which is still under development and will replace current national laws that implement the ePrivacy Directive. Additional time and effort may need to be spent addressing differences between the ePrivacy Regulation and the GDPR. New rules related to the ePrivacy Regulation are likely to include enhanced consent requirements in order to use communications content and communications metadata, which may negatively impact our platform and products and our relationships with our partners.
Complying with the GDPR and the ePrivacy Regulation, when it becomes effective, may cause us to incur substantial operational costs or require us to change our business practices. Despite our efforts to bring practices into compliance before the effective date of the GDPR and ePrivacy Regulation, we may not be successful in our efforts to achieve compliance either due to internal or external factors such as resource allocation limitations or a lack of vendor cooperation. Non-compliance could result in proceedings against us by governmental entities, customers, data subjects or others. We may also experience difficulty retaining or obtaining new European or multi-national customers due to the legal requirements, compliance cost, potential risk exposure, and uncertainty for these entities, and we may experience significantly increased liability with respect to these customers pursuant to the terms set forth in our engagements with them.
Domestic laws in this area are also complex and developing rapidly. Many state legislatures have adopted legislation that regulates how businesses operate online, including measures relating to privacy, data security, and data breaches. Laws in all 50 states require businesses to provide notice to customers whose personally identifiable information has been disclosed as a result of a data breach. The laws are not consistent, and compliance in the event of a widespread data breach is costly. States are also frequently amending existing laws, requiring attention to frequently changing regulatory requirements. For example, California recently enacted the CCPA, which became effective on January 1, 2020. The CCPA, among other things, requires new disclosures to California consumers and affords such consumers new abilities to access and delete their personal information, opt-out of certain sales of personal information and receive detailed information about how their personal information is used. The CCPA provides for fines of up to $7,500 per violation, as well as a private right of action for data breaches that is expected to increase the frequency of data breach litigation. While the CCPA has already been amended multiple times, it is unclear how this legislation will be further modified or how it will be interpreted. The effects of this legislation potentially are far-reaching, however, and may require us to modify our data processing practices and policies and incur substantial compliance-related costs and expenses. Additionally, a new privacy law, the California Privacy Rights Act (the “CPRA”), was approved by California voters in the election of November 3, 2020. The CPRA, which will take effect in most material respects on January 1, 2023, modifies the CCPA significantly, including by expanding consumers’ rights with respect to certain sensitive personal information and creating a new state agency to oversee implementation and enforcement efforts, potentially resulting in further uncertainty and requiring us to incur additional costs and expenses in an effort to comply. The CCPA, CPRA and other changes in laws or regulations relating to privacy, data protection and information security, particularly any new or modified laws or regulations that require enhanced protection of certain types of data or new obligations with regard to data retention, transfer or disclosure, could greatly increase the cost of providing our offerings, require significant changes to our operations or even prevent us from providing certain offerings in jurisdictions in which we currently operate and in which we may operate in the future.
Further, as we continue to expand our platform offerings and user base, we may become subject to additional privacy-related laws and regulations. For example, the collection and storage of healthcare data by health insurance carriers subject them to compliance requirements under HIPAA. HIPAA and its implementing regulations contain substantial restrictions and requirements regarding the use, collection, security, storage, and disclosure of
42
individuals’ protected health information. In 2009, HIPAA was amended by the HITECH Act to impose certain of HIPAA’s privacy and security requirements directly upon business associates of covered entities. Health insurance carriers are covered entities under HIPAA. In the instance we are deemed to be a business associate of such carriers, we may be bound by compliance obligations under HIPAA, including security breach notification obligations, and subject to increased liability as a possible liable party. In such instance, if we knowingly breach the HITECH Act’s requirements, we could be exposed to criminal liability. A breach of our safeguards and processes could expose us to civil penalties up to $1.5 million for identical incidences and the possibility of civil litigation.
Additionally, we have incurred, and may continue to incur, significant expenses in an effort to comply with privacy, data protection and information security standards and protocols imposed by law, regulation, industry standards or contractual obligations. Despite our efforts to comply with applicable laws, regulations and other obligations relating to privacy, data protection, and information security, it is possible that our practices, offerings or platform could be inconsistent with, or fail or be alleged to fail to meet all requirements of, such laws, regulations or obligations. Our failure, or the failure by our third-party providers or partners, to comply with applicable laws or regulations or any other obligations relating to privacy, data protection or information security, or any compromise of security that results in unauthorized access to, or use or release of personally identifiable information or other data, or the perception that any of the foregoing types of failure or compromise has occurred, could damage our reputation, discourage new and existing partners from using our platform, delay planned uses, and disclosures of data or result in fines or proceedings by governmental agencies and private claims and litigation, any of which could materially and adversely affect our business, financial condition, operating results, cash flows, and prospects. Even if not subject to legal challenge, the perception of privacy concerns, whether or not valid, may harm our reputation and brand and materially and adversely affect our business, financial condition, operating results, cash flows, and prospects.
Any legal liability for the information we communicate to consumers could harm our business and operating results.
Consumers may rely upon information we communicate regarding insurance plans, including information relating to insurance premiums, coverage, benefits, exclusions, limitations, availability, and plan comparisons. If we provide inaccurate information or information that could be construed as misleading, we could be found liable for related damages and our relationships with our insurance partners could suffer.
Our and our partners’ communications with potential and existing consumers are subject to laws regulating telephone and email marketing practices.
We and our partners make telephone calls and send emails and text messages to potential and existing consumers. The U.S. regulates marketing by telephone and email and the laws and regulations governing the use of emails and telephone calls for marketing purposes continue to evolve, and changes in technology, the industry or consumer preferences may lead to the adoption of additional laws or regulations or changes in interpretation of existing laws or regulations. New laws or regulations, or changes to the manner in which existing laws and regulations are interpreted or enforced, may further restrict our and our partners’ ability to contact potential and existing consumers by phone and email and could render us and them unable to communicate with consumers in a cost-effective fashion. The TCPA prohibits companies from making telemarketing calls to numbers listed in the Federal Do-Not-Call Registry and imposes other obligations and limitations on making phone calls and sending text messages to consumers. The CAN-SPAM Act regulates commercial email messages and specifies penalties for the transmission of commercial email messages that do not comply with certain requirements, such as providing an opt-out mechanism for stopping future emails from senders. We and our partners may be required to comply with these and similar laws, rules and regulations. Failure to comply with obligations and restrictions related to telephone, text message, and email marketing could subject us and them to lawsuits, fines, statutory damages, consent decrees, injunctions, adverse publicity, and other losses that could harm, directly or indirectly, our business, financial condition, operating results, cash flows, and prospects.
43
Risks related to being a public company
Our quarterly operating results or other operating metrics may fluctuate significantly and may not meet expectations of research analysts, which could cause the trading price of our Class A common stock to decline.
Our quarterly operating results and other operating metrics have fluctuated in the past and may in the future fluctuate as a result of a number of factors, many of which are outside of our control and may be difficult to predict. Period to period variability or unpredictability of our results could result in our failure to meet our expectations or those of any analysts that cover us or investors with respect to revenue or other operating results for a particular period. If we fail to meet or exceed such expectations for these or any other reasons, the market price of our Class A common stock could fall substantially, and we could face litigation, including securities class actions.
In addition, if one or more analysts covering our business downgrade their evaluations of our Class A common stock or the stock of other companies in our industry, the price of our Class A common stock could decline. If one or more analysts cease to cover our Class A common stock, we could lose visibility in the market for our Class A common stock, which in turn could cause our stock price to decline.
We are required to make significant estimates and assumptions in the preparation of our financial statements. These estimates and assumptions may not be accurate and are subject to change.
The preparation of our consolidated financial statements in conformity with GAAP requires our management to make significant estimates and assumptions that affect the reported amounts of assets and liabilities and disclosures of contingent assets and liabilities at the date of our consolidated financial statements, and the reported amounts of income and expense during the reporting periods. If our underlying estimates and assumptions prove to be incorrect or if events occur that require us to revise our previous estimates or assumptions, our business, financial condition, operating results, cash flows, and prospects may be materially and adversely affected.
The obligations associated with being a public company require significant resources and management attention, which will increase our costs of operations and may divert focus from our business operations.
Prior to our IPO in October 2020, we were not required to comply with the requirements of the SEC or to file periodic reports with the SEC. Following the completion of our IPO, we are now required to file periodic reports containing our consolidated financial statements with the SEC within a specified time following the completion of quarterly and annual periods. As a public company, we incur significant legal, accounting, insurance, and other expenses. Continued compliance with these reporting requirements and other rules of the SEC and the rules of the NYSE will increase our legal and financial compliance costs and make some activities more time consuming and costly. Furthermore, the need to maintain the corporate infrastructure demanded of a public company may divert management’s attention from implementing our growth strategy, which could prevent us from successfully implementing our strategic initiatives and improving our business, financial condition, operating results, cash flows, and prospects.
We are an “emerging growth company,” and the reduced disclosure requirements applicable to emerging growth companies may make our Class A common stock less attractive to investors.
We are an “emerging growth company,” as defined in the JOBS Act. We could continue to be considered an emerging growth company for up to five years, although we would lose that status sooner if our gross revenue exceeds $1.07 billion, if we issue more than $1.0 billion in nonconvertible debt in a three-year period, or if the fair value of our common stock held by non-affiliates exceeds $700.0 million (and we have been a public company for at least 12 months and have filed one annual report on Form 10-K). For as long as we continue to be an emerging growth company, we may take advantage of exemptions from various reporting requirements that are applicable to other public companies that are not emerging growth companies, including reduced disclosure obligations regarding executive compensation in our periodic reports and proxy statements and exemptions from the requirements of holding a non-binding advisory vote on executive compensation and stockholder approval of any golden parachute payments not previously approved. It is unclear whether investors will find our Class A common stock less attractive because we may rely on these exemptions. If some investors find our Class A common stock less attractive as a result, there may be a less active trading market for our Class A common stock and our stock price may be more volatile.
44
In addition, the JOBS Act provides that an emerging growth company can take advantage of an extended transition period for complying with new or revised accounting standards. This allows an emerging growth company to delay the adoption of certain accounting standards until those standards would otherwise apply to private companies. We have elected to avail ourselves of this exemption from new or revised accounting standards and, therefore, while we are an emerging growth company we will not be subject to new or revised accounting standards (for example, Accounting Standards Codification, Topic 842, Leases) at the same time that they become applicable to other public companies that are not emerging growth companies. As a result, our financial statements may not be comparable to companies that comply with new or revised accounting pronouncements as of public company effective dates, and we will incur additional costs in connection with complying with the accounting standards applicable to public companies at such time or times as they become applicable to us.
Risks related to internal controls on financial reporting
We have identified a material weakness in our internal control over financial reporting related to the accounting for equity-based compensation arrangements. If we are unable to remediate the material weakness related to the accounting for equity-based compensation arrangements, or if we identify additional material weaknesses in the future or otherwise fail to maintain an effective system of internal controls, we may not be able to accurately or timely report our financial condition or results of operations, which may adversely affect our business.
In connection with the preparation of our consolidated financial statements, we identified material weaknesses in our internal control over financial reporting. A material weakness is a deficiency, or a combination of deficiencies, in internal control over financial reporting, such that there is a reasonable possibility that a material misstatement of our financial statements will not be prevented or detected on a timely basis.
The material weakness we identified relates to the accounting for equity-based compensation arrangements. Specifically, we did not design and maintain effective controls to ensure that the applicable guidance and accounting policies were appropriately applied to equity-based compensation arrangements and were properly reflected in our consolidated financial statements. The material weakness resulted in misstatements to Members’ Equity and Equity-based compensation which resulted in the restatement of our audited consolidated financial statements. Additionally, this control deficiency could result in a misstatement to the aforementioned accounts and disclosures that would result in a material misstatement of our consolidated financial statements that would not be prevented or detected, and accordingly, we determined this control deficiency constitutes a material weakness.
We are in the process of implementing measures designed to improve our internal control over financial reporting and remediate the control deficiency that led to the material weakness that remains unremediated related to the accounting for equity-based compensation arrangements. This includes designing and implementing new control activities related to the accounting for equity-based compensation arrangements, as well as engaging a third-party valuation specialist to supplement our finance and accounting personnel. We cannot assure you that the measures we have taken to date, and actions we may take in the future, will be sufficient to remediate the control deficiency that led to the material weakness in our internal control over financial reporting or that they will prevent or avoid potential future material weaknesses. In addition, neither our management nor an independent registered public accounting firm has performed an evaluation of our internal control over financial reporting in accordance with the provisions of the Sarbanes-Oxley Act because no such evaluation has been required. Had we or our independent registered public accounting firm performed an evaluation of our internal control over financial reporting in accordance with the provisions of the Sarbanes-Oxley Act, additional material weaknesses may have been identified. If we are unable to successfully remediate our existing material weakness or any future material weaknesses in our internal control over financial reporting, or identify any additional material weaknesses, the accuracy and timing of our financial reporting may be adversely affected, we may be unable to maintain compliance with securities law requirements regarding timely filing of periodic reports in addition to applicable stock exchange listing requirements, investors may lose confidence in our financial reporting, and our share price may decline as a result. As a public company, we will be required to provide an annual management report on the effectiveness of our internal control over financial reporting commencing with our second annual report on Form 10-K.
In addition, because the material weakness discussed above had not been fully remediated as of December 31, 2020, our management was unable to conclude that our disclosure controls and procedures were effective as of December 31, 2020. See Part III, Item 9A “Evaluation of Disclosure Controls and Procedures” of this Annual Report on Form 10-K.
45
If we cannot comply with the requirements of the Sarbanes-Oxley Act in a timely manner or attest that our internal control over financial reporting is effective or otherwise fail to maintain effective internal control over financial reporting, we may not be able to report our financial results accurately and timely, in which case our business may be harmed, investors may lose confidence in the accuracy and completeness of our financial reports and the price of our Class A common stock may decline.
Our management is responsible for establishing and maintaining adequate internal control over financial reporting and for evaluating and reporting on our system of internal control. Our internal control over financial reporting is a process designed to provide reasonable assurance regarding the reliability of financial reporting and the preparation of financial statements for external purposes in accordance with GAAP. As a public company, we are required to comply with the Sarbanes-Oxley Act and other rules that govern public companies. In particular, we will be required to certify our compliance with Section 404 of the Sarbanes-Oxley Act beginning with our second annual report on Form 10-K, which will require us to furnish annually a report by management on the effectiveness of our internal control over financial reporting. Moreover, beginning with our second annual report on Form 10-K, our independent registered public accounting firm will be required to attest to the effectiveness of our internal control over financial reporting on an annual basis unless we are a non-accelerated filer. However, while we remain an emerging growth company and elect transitional relief available to emerging growth companies, our independent registered public accounting firm will not be required to report on the effectiveness of our internal control over financial reporting. In addition, in connection with the preparation of our consolidated financial statements as of and for the years ended December 31, 2018 and 2019, we identified material weaknesses in our internal control over financial reporting. See “Risk factors—We have identified a material weakness in our internal control over financial reporting related to the accounting for equity-based compensation arrangements. If we are unable to remediate the material weakness related to the accounting for equity-based compensation arrangements, or if we identify additional material weaknesses in the future or otherwise fail to maintain an effective system of internal controls, we may not be able to accurately or timely report our financial condition or results of operations, which may adversely affect our business.”
If we continue to have material weaknesses or identify material weaknesses in our internal control over financial reporting in the future, if we cannot comply with the requirements of the Sarbanes-Oxley Act in a timely manner or attest that our internal control over financial reporting is effective, or if our independent registered public accounting firm cannot express an unqualified opinion as to the effectiveness of our internal control over financial reporting when required, we may not be able to accurately and timely report our financial results. As a result, investors, counterparties, and consumers may lose confidence in the accuracy and completeness of our financial reports; our liquidity, access to capital markets and perceptions of our creditworthiness could be adversely affected; and the market price of our Class A common stock could decline. In addition, we could become subject to investigations by the NYSE, the SEC or other regulatory authorities, which could require additional financial and management resources.
These events could have a material and adverse effect on our business, financial condition, operating results, cash flows, and prospects.
Risks related to our Class A common stock
The market price of our Class A common stock may be subject to substantial fluctuations, which may make it difficult for you to sell your shares at the volume, price and times desired.
The market price of our Class A common stock may be highly volatile, which may make it difficult for you to sell your shares at the volume, prices and times desired. Shares of technology companies have historically experienced levels of volatility that can exceed the overall market. Since shares of our Class A common stock were sold in our IPO in October 2020 at a price of $19 per share, the low and high closing sales prices of our Class A common stock have ranged from $31.86 to $49.03 per share, respectively, through December 31, 2020.
Some specific factors that may have a significant effect on the market price of our Class A common stock include:
|
|
• |
actual or anticipated fluctuations in our operating results or those of our competitors; |
|
|
• |
actual or anticipated changes in the growth rate of the online insurance/digital advertising market or the growth rate of our businesses or those of companies that investors deem comparable to us; |
46
|
|
• |
changes in governmental regulation; and |
|
|
• |
publication of research reports about us, our competitors or our industry, or changes in, or failure to meet, estimates made by securities analysts or ratings agencies of our financial and operating performance, or lack of research reports by industry analysts or ceasing of analyst coverage. |
Our issuance of additional capital stock in connection with financings, acquisitions, investments, our equity incentive plans or otherwise would dilute all other stockholders.
We may issue additional capital stock in the future. Any such issuance would result in dilution to all other stockholders. In the future, we may issue additional stock, including as a grant of equity awards to employees, directors and consultants under our equity incentive plans, to raise capital through equity financings or to acquire or make investments in companies, products or technologies for which we may issue equity securities to pay for such acquisition or investment. Any such issuances of additional capital stock may cause stockholders to experience significant dilution of their ownership interests and the per share value of our Class A common stock to decline.
We do not intend to pay dividends in the foreseeable future.
The declaration and amount of any future dividends to holders of our Class A common stock is at the discretion of our Board of Directors in accordance with applicable law and after taking into account various factors, including our financial condition, operating results, current and anticipated cash needs, cash flows, impact on our effective tax rate, indebtedness, contractual obligations, legal requirements, and other factors that our Board of Directors deems relevant. In addition, the 2020 Credit Agreement contains restrictions on our ability to pay dividends, subject to certain exceptions. Accordingly, we do not expect to pay dividends in the foreseeable future. As a result, capital appreciation, if any, of our Class A common stock will be your sole source of gain for the foreseeable future.
The market price of our Class A common stock could decline due to the large number of shares of Class A common stock eligible for future sale upon the exchange of Class B-1 units.
The market price of our Class A common stock could decline as a result of sales of a large number of shares of our Class A common stock eligible for sale and for future sale upon the exchange of Class B-1 units (together with an equal number of shares of our Class B common stock), or the perception that such sales could occur. These sales, or the possibility that these sales may occur, may also make it more difficult for us to raise additional capital by selling equity securities in the future, at a time and price that we deem appropriate.
As of December 31, 2020, 33.4 million Class A-1 units and 25.5 million Class B-1 units are outstanding. Each Class B-1 unit, together with one share of our Class B common stock, is exchangeable for one share of Class A common stock (or, at our election, cash of an equivalent value). Pursuant to a registration rights agreement, we have granted registration rights to certain of our existing investors, including White Mountains, Insignia, and the Senior Executives, with respect to their shares of our Class A common stock, including those delivered in exchange for Class B-1 units.
Sales of a substantial number of shares of our Class A common stock by our pre-initial public offering stockholders (“pre-IPO stockholders”) in the public market could cause the price of our Class A common stock to fall.
If our pre-IPO stockholders sell substantial amounts of our Class A common stock in the public market, the market price of our Class A common stock could decrease significantly. The perception in the public market that our pre-IPO stockholders might sell shares of Class A common stock could also depress our market price. As of January 31, 2021, we had 33.4 million shares of Class A common stock outstanding and 25.5 million shares of Class B common stock outstanding.
47
Our executive officers and directors are subject to the lock-up agreements and the Rule 144 holding period requirements. After all of these lock-up periods have expired and the holding periods have elapsed and, in the case of any restricted stock, the shares have vested, additional shares will be eligible for sale in the public market. The market price of shares of our Class A common stock may drop significantly when the restrictions on resale by our existing stockholders lapse. A decline in the price of shares of our Class A common stock might impede our ability to raise capital through the issuance of additional shares of our Class A common stock or other equity securities.
We cannot predict the effect our dual class structure may have on the market price of our Class A common stock.
We cannot predict whether our dual class structure will result in a lower or more volatile market price of our Class A common stock, in adverse publicity, or other adverse consequences. For example, certain index providers have announced restrictions on including companies with multiple-class share structures in certain of their indices. In July 2017, S&P Dow Jones announced that it will no longer admit companies with multiple-class share structures to certain of its indices. Affected indices include the Russell 2000 and the S&P 500, S&P MidCap 400, and S&P SmallCap 600, which together make up the S&P Composite 1500. Also in 2017, MSCI, a leading stock index provider, opened public consultations on their treatment of no-vote and multi-class structures and temporarily barred new multi-class listings from certain of its indices. Under such announced policies, the dual class structure of our stock would make us ineligible for inclusion in certain indices and, as a result, mutual funds, exchange-traded funds, and other investment vehicles that attempt to track those indices would not invest in our Class A common stock. These policies are relatively new and it is unclear what effect, if any, they will have on the valuations of publicly-traded companies excluded from such indices, but it is possible they may depress valuations, compared to similar companies that are included. Given the sustained flow of investment funds into passive strategies that seek to track certain indices, exclusion from certain stock indices would likely preclude investment by many of these funds and could make our Class A common stock less attractive to other investors. As a result, the market price of our Class A common stock could be adversely affected.
Certain provisions in our amended and restated certificate of incorporation, our amended and restated bylaws, our stockholders’ agreement and of Delaware law may prevent or delay an acquisition of MediaAlpha, Inc., which could decrease the trading price of our Class A common stock.
Our amended and restated certificate of incorporation, amended and restated bylaws and stockholders’ agreement contain, and Delaware law contains, provisions that are intended to deter coercive takeover practices and inadequate takeover bids by making such practices or bids unacceptably expensive to the bidder and to encourage prospective acquirers to negotiate with our Board of Directors rather than to attempt a hostile takeover. Among other things, these provisions:
|
|
• |
divide our Board of Directors into three staggered classes of directors that are each elected to three-year terms; |
|
|
• |
provide the Board of Directors with the sole ability to fill a vacancy created by the expansion of the Board of Directors; |
|
|
• |
prohibit stockholder action by written consent after the date on which White Mountains, Insignia, and the Founders cease to collectively own at least a majority in voting power of shares of our common stock; |
|
|
• |
authorize the issuance of “blank check” preferred stock that could be issued by our Board of Directors to increase the number of outstanding shares of capital stock, making a takeover more difficult and expensive; |
|
|
• |
prohibit cumulative voting in the election of directors, which could otherwise allow less than a majority of stockholders to elect director candidates; |
|
|
• |
provide that special meetings of the stockholders may be called only by or at the direction of the Board of Directors, the chairman of our board, the Chief Executive Officer or, so long as White Mountains, Insignia, and the Founders collectively own at least a majority in voting power of shares of our common stock, any such stockholder, subject to certain limitations; |
48
|
|
• |
require advance notice to be given by stockholders for any stockholder proposals or director nominees; |
|
|
• |
after the date on which White Mountains, Insignia, and the Founders cease to collectively own at least a majority in voting power of shares of our common stock, require the affirmative vote of holders of at least 75% of the voting power of our outstanding shares of common stock to amend certain provisions of our amended and restated certificate of incorporation and any provision of our amended and restated bylaws; |
|
|
• |
after the date on which White Mountains, Insignia, and the Founders cease to collectively own at least a majority in voting power of shares of our common stock, require the affirmative vote of holders of at least 75% of the voting power of our outstanding shares of common stock to remove directors and only for cause; |
|
|
• |
provide that each of White Mountains, Insignia and the Founders are entitled to (i) nominate two directors to the Board of Directors for so long as such stockholder owns at least 12.5% of our issued and outstanding shares of common stock as of the closing of our IPO and (ii) nominate one director to the Board of Directors for so long as such stockholder owns less than 12.5% but at least 5% of our issued and outstanding shares of common stock as of the closing of our IPO; |
|
|
• |
provide that White Mountains, Insignia and the Founders agree to vote for each other’s board nominees pursuant to the terms of the stockholders’ agreement; and |
|
|
• |
require the prior written consent of a majority in interest of White Mountains, Insignia and the Founders for any change in the size of the Board of Directors and to engage in change in control transactions, for so long as such stockholders own at least a majority of the issued and outstanding shares of common stock. |
In addition, Section 203 of the General Corporate Law of the State of Delaware (the “DGCL”) may affect the ability of an “interested stockholder” to engage in certain business combinations, for a period of three years following the time that the stockholder becomes an “interested stockholder.” We elected in our amended and restated certificate of incorporation not to be subject to Section 203 of the DGCL. Nevertheless, our amended and restated certificate of incorporation contains provisions that have the same effect as Section 203 of the DGCL, except that they provide that each of White Mountains, Insignia, and the Founders and their respective affiliates and transferees are not be deemed to be “interested stockholders,” and accordingly will not be subject to such restrictions.
These and other provisions could have the effect of discouraging, delaying or preventing a transaction involving a change in control of our company or could make it more difficult for you and other stockholders to elect directors of your choosing or to cause us to take other corporate actions that you desire. See “Description of capital stock.”
Our amended and restated certificate of incorporation and stockholders’ agreement contain provisions renouncing our interest and expectation to participate in certain corporate governance opportunities identified by or presented to certain of our existing investors.
Each of White Mountains, Insignia, and the Founders and their respective affiliates may engage in activities similar to ours or lines of business or have an interest in the same areas of corporate opportunities as we do. Our amended and restated certificate of incorporation and stockholders’ agreement provide that such stockholders and their respective affiliates will not have any duty to refrain from (1) engaging, directly or indirectly, in the same or similar business activities or lines of business as us, including those business activities or lines of business deemed to be competing with us, or (2) doing business with any of our clients, customers or vendors. In the event that White Mountains, Insignia or the Founders or any of their respective affiliates acquires knowledge of a potential business opportunity which may be a corporate opportunity for us, they will have no duty to communicate or offer such corporate opportunity to us. Our amended and restated certificate of incorporation and stockholders’ agreement also provide that, to the fullest extent permitted by law, none of such stockholders or their respective affiliates will be liable to us, for breach of any fiduciary duty or otherwise, by reason of the fact that any such stockholder or any of its affiliates directs such corporate opportunity to another person, or otherwise does not communicate information regarding such corporate opportunity to us, and we will waive and renounce any claim that such business
49
opportunity constituted a corporate opportunity that should have been presented to us. These potential conflicts of interest could have a material and adverse effect on our business, financial condition, operating results, cash flows and prospects if attractive business opportunities are allocated by White Mountains, Insignia or the Founders to themselves or their respective affiliates instead of to us.
Our amended and restated certificate of incorporation contains exclusive forum provisions that may discourage lawsuits against us and our directors and officers.
Our amended and restated certificate of incorporation provides that unless the Board of Directors otherwise determines, the state courts in the State of Delaware or, if no state court located within the State of Delaware has jurisdiction, the federal court for the District of Delaware, are the sole and exclusive forum for any derivative action or proceeding brought on behalf of us, any action asserting a claim of breach of a fiduciary duty owed by any of our directors or officers to us or our stockholders, any action asserting a claim against us or any of our directors or officers arising pursuant to any provision of the DGCL or our amended and restated certificate of incorporation or amended and restated bylaws, or any action asserting a claim against us or any of our directors or officers governed by the internal affairs doctrine under Delaware law. In addition, our amended and restated certificate of incorporation provides that the federal district courts of the United States are the exclusive forum for resolving any complaint asserting a cause of action arising under the Securities Act but that the forum selection provision will not apply to claims brought to enforce a duty or liability created by the Securities Exchange Act of 1934, as amended (the “Exchange Act”). While the Delaware Supreme Court has recently upheld provisions of the certificates of incorporation of other Delaware corporations that are similar to this forum provision, a court of a state other than the State of Delaware could decide that such provisions are not enforceable under the laws of that state. These exclusive forum provisions may limit the ability of our stockholders to bring a claim in a judicial forum that such stockholders find favorable for disputes with us or our directors or officers, which may discourage such lawsuits against us and our directors and officers. Alternatively, if a court were to find one or more of these exclusive forum provisions inapplicable to, or unenforceable in respect of, one or more of the specified types of actions or proceedings described above, we may incur additional costs associated with resolving such matters in other jurisdictions or forums, which could materially and adversely affect our business, financial condition, operating results, cash flows, and prospects. For example, under the Securities Act, federal courts have concurrent jurisdiction over all suits brought to enforce any duty or liability created by the Securities Act, and investors cannot waive compliance with the federal securities laws and the rules and regulations thereunder. Any person or entity purchasing or otherwise acquiring any interest in our Class A common stock shall be deemed to have notice of and consented to this exclusive forum provision, but will not be deemed to have waived our compliance with the federal securities laws and the rules and regulations thereunder.
Our amended and restated bylaws provide that, if a claiming party brings certain actions against us and is not successful on the merits, then it will be obligated to pay our litigation costs, which could have the effect of discouraging litigation, including claims brought by our stockholders.
Our amended and restated bylaws provide that, except to the extent prohibited by the DGCL, and unless our Board of Directors otherwise approves, in the event that any claiming party (a) initiates, asserts, joins, offers substantial assistance to or has a direct financial interest in a covered proceeding and (b) such claiming party does not obtain a judgment on the merits that substantially achieves, in substance and amount, the full remedy sought by such claiming party, then each such claiming party will be obligated to reimburse us and any applicable director, officer or other employee for all fees, costs, and expenses of every kind and description (including, but not limited to, all attorneys’ fees and other litigation expenses) that we or any such director, officer or other employee actually incurs in connection with the covered proceeding. While application of this standard will necessarily need to take into account the particular facts, circumstances, and equities of any particular claim, we would expect a claiming party to be required to prevail on the merits on substantially all of the claims asserted in the complaint and, as a result, receive substantially the full remedy that it was seeking (including, if applicable, any equitable remedy) in order to avoid responsibility for reimbursing such fees, costs, and expenses. Any person or entity purchasing or otherwise acquiring any interest in the shares of our capital stock will be deemed to have notice of and consented to this provision. This provision could have the effect of discouraging litigation against us, including claims brought by our stockholders and including claims that are partially (but not wholly) successful on the merits. However, it is currently unclear whether the Delaware legislature will take action to eliminate or limit the ability of stock corporations to implement provisions such as this, or whether Delaware courts will enforce in full a provision such as this for a Delaware stock corporation. If the Delaware legislature takes action to limit or eliminate our ability to include this provision in our amended and restated bylaws or a court were to find this provision inapplicable to, or
50
unenforceable in respect of, one or more of the specified types of actions or proceedings, we may incur additional costs associated with resolving such matters in other jurisdictions, which could adversely affect our business and financial condition.
Our Board of Directors has the ability to issue blank check preferred stock, which may discourage or impede acquisition attempts or other transactions.
Our Board of Directors has the power, subject to applicable law, to issue series of preferred stock that could, depending on the terms of the series, impede the completion of a merger, tender offer or other takeover attempt. For instance, subject to applicable law, a series of preferred stock may impede a business combination by including class voting rights, which would enable the holder or holders of such series to block a proposed transaction. Our Board of Directors will make any determination to issue shares of preferred stock based on its judgment as to our and our stockholders’ best interests. Our Board of Directors, in so acting, could issue shares of preferred stock having terms which could discourage an acquisition attempt or other transaction that some, or a majority, of the stockholders may believe to be in their best interests or in which stockholders would have received a premium for their stock over the then prevailing market price of the stock.
Different interests among our investors or between our investors and us, including with respect to related party transactions, could prevent us from achieving our business goals.
For the foreseeable future, we expect that a majority of our Board of Directors will include directors who are affiliated with White Mountains, Insignia, and the Founders. Certain of our pre-IPO stockholders could have business interests that conflict with those of the other investors, which may make it difficult for us to pursue strategic initiatives that require consensus among our owners.
Our relationship with our pre-IPO stockholders could create conflicts of interest among our investors, or between our investors and us, in a number of areas relating to our past and ongoing relationships. In addition, our pre-IPO stockholders may have different tax positions from us which could influence their decisions regarding whether and when to dispose of assets, whether and when to incur new or refinance existing indebtedness, especially in light of the existence of the tax receivables agreement, and whether and when we should terminate the tax receivables agreement and accelerate our obligations thereunder. In addition, the structuring of future transactions may take into consideration these pre-IPO stockholders’ tax or other considerations even where no similar benefit would accrue to us. Except as set forth in the tax receivables agreement and the stockholders’ agreement, there are no formal dispute resolution procedures in place to resolve conflicts between us and our pre-IPO stockholders or among our pre-IPO stockholders. We may not be able to resolve any potential conflicts between us and any pre-IPO stockholders and, even if we do, the resolution may be less favorable to us than if we were negotiating with an unaffiliated party. This concentration of ownership and voting power may also delay, defer or even prevent an acquisition by a third party or other change of control of our company which could deprive you of an opportunity to receive a premium for your shares of Class A common stock and may make some transactions more difficult or impossible without the support of such pre-IPO stockholders, even if such events are in the best interests of minority stockholders. Furthermore, this concentration of voting power may have a negative impact on the price of our Class A common stock.
Pursuant to the stockholders’ agreement, certain of our actions will generally require prior written consent of a majority in interest of White Mountains, Insignia, and the Founders, for so long as such stockholders continue to own at least a majority of the issued and outstanding shares of common stock. Each of White Mountains, Insignia, and the Founders is also entitled to nominate one or two directors to the Board of Directors for so long as such stockholder owns at least 12.5%, in the case of two directors, or less than 12.5% but at least 5%, in the case of one director, of our issued and outstanding shares of common stock as of the closing of our IPO.
Section 203 of the DGCL may affect the ability of an “interested stockholder” to engage in certain business combinations, for a period of three years following the time that the stockholder becomes an “interested stockholder.” We elected in our amended and restated certificate of incorporation not to be subject to Section 203 of the DGCL. Nevertheless, our amended and restated certificate of incorporation contain provisions that have the same effect as Section 203 of the DGCL, except that they provide that each of White Mountains, Insignia, and the Founders and their respective affiliates and transferees are not deemed to be “interested stockholders,” and accordingly are not subject to such restrictions.
51
In addition, because Insignia and the Founders hold their economic interest in our business indirectly through QLH, but not through MediaAlpha, Inc., these existing owners may have conflicting interests with holders of shares of our Class A common stock.
We are a “controlled company” within the meaning of the NYSE rules and, as a result, we qualify for exemptions from certain corporate governance requirements. Our stockholders do not have the same protections afforded to stockholders of companies that are subject to such requirements.
Certain of our pre-IPO stockholders that are a party to the stockholders’ agreement own a majority of the voting power of our outstanding common stock. Accordingly, we are considered a “controlled company” under the NYSE rules. Under these rules, a “controlled company” may elect not to comply with certain corporate governance requirements, including the requirements that, within one year of the date of listing of our Class A common stock:
|
|
• |
we have a board that is composed of a majority of “independent directors” as defined under the NYSE rules; and |
|
|
• |
we have a compensation committee and a nominating and corporate governance committee that is composed of independent directors. |
We intend to continue to take advantage of these exemptions for so long as we continue to qualify as a “controlled company.” Accordingly, our stockholders may not have the same protections afforded to stockholders of companies that are subject to all of the NYSE corporate governance requirements.
Risks related to our structure
We are a holding company and our only material asset is our indirect interest in QLH and, accordingly, we are dependent upon distributions from QLH to pay taxes and other expenses.
We are a holding company and have no material assets other than our indirect ownership of Class A-1 units. We have no independent means of generating revenue, all of which is generated by QLH’s subsidiary, QuoteLab, LLC. QLH is treated as a partnership for U.S. federal income tax purposes and, as such, is not itself subject to U.S. federal income tax. Instead, its taxable income is allocated to its members, including us. Accordingly, we incur income taxes on our allocable share of any such income. In addition, we will continue to incur expenses related to our operations. We intend (a) to continue to cause QuoteLab, LLC to make cash distributions to its sole member, QLH, and (b) in turn to continue to cause QL Holdings LLC to make pro rata cash distributions, or tax distributions, to its members, including us, to (i) fund our U.S. federal, state and local tax obligations in respect of our allocable share of QL Holdings LLC’s taxable income and (ii) cover our obligations under the tax receivables agreement. In certain cases, QLH may also make tax distributions for a fiscal quarter to another member in respect of its pre-exchange allocable share of QL Holdings LLC’s taxable income for such fiscal quarter relating to Class B-1 Units (if any) transferred to us by such member (pursuant to the exchange agreement) before the applicable tax distribution date. To the extent that we need funds to pay our tax or other liabilities or to fund our operations, and QL Holdings LLC or QuoteLab, LLC is restricted from making distributions to us under applicable agreements, laws or regulations or does not have sufficient cash to make these distributions, we may have to borrow funds to meet these obligations and operate our business, and our business, financial condition, operating results, cash flows, and prospects could be materially and adversely affected. To the extent that we are unable to make payments under the tax receivables agreement for any reason, such payments will be deferred and will accrue interest until paid.
In certain circumstances, recently enacted legislation may impute liability for adjustments to QL Holdings LLC’s tax return on QL Holdings LLC itself, which may cause QL Holdings LLC to be subject to material liabilities.
Recently enacted legislation may impute liability for adjustments to a partnership’s tax return on the partnership itself in certain circumstances, absent an election to the contrary. QL Holdings LLC may be subject to material liabilities pursuant to this legislation and related guidance if, for example, its calculations of taxable income are incorrect.
52
We are required to pay Insignia, the Senior Executives, and White Mountains for certain tax benefits we may claim in the future, and these amounts are expected to be material.
In connection with our IPO in October 2020, we purchased Class B-1 units of QL Holdings LLC from certain unitholders (including the Selling Class B-1 Unit Holders). In connection with this offering and in the future, Class B-1 units of QL Holdings LLC may be exchanged, together with an equal number of shares of our Class B common stock, for shares of our Class A common stock (or, at our election, cash of an equivalent value). Our initial purchase of units in the IPO and the exchanges of Class B-1 units in connection with this offering, the Pre-IPO Leveraged Distribution and other actual or deemed distributions by QL Holdings LLC to its members, and the post-IPO exchanges of Class B-1 units of QL Holdings LLC may result in increases in our share of the tax basis of the assets of QL Holdings LLC. In addition, certain net operating losses of Intermediate Holdco may be available to us as a result of the Reorganization Transactions. In connection with the IPO, we entered into the tax receivables agreement with Insignia, the Senior Executives, and White Mountains related to the tax basis step-up of the assets of QL Holdings LLC and certain net operating losses of Intermediate Holdco. Pursuant to the tax receivables agreement, we are required to pay Insignia and the Senior Executives 85% of the amount of the cash savings, if any, in U.S. federal, state and local income tax that we realize (or are deemed to realize) as a result of these possible increases in tax basis as well as certain other tax benefits attributable to payments under the tax receivables agreement itself. The tax receivables agreement also requires us to pay White Mountains 85% of the amount of the cash savings, if any, in U.S. federal, state and local income tax that we realize (or are deemed to realize) as a result of the utilization of the net operating losses of Intermediate Holdco attributable to periods prior to our IPO and the deduction of any imputed interest attributable to our payment obligations under the tax receivables agreement. We currently estimate that the amount of any such net operating losses is immaterial.
The payments that we make under the tax receivables agreement could be substantial. Assuming no material changes in relevant tax law and based on our current operating plan and other assumptions, if all of the Class B-1 units of QL Holdings LLC were acquired by us in taxable transactions at December 31, 2020 for a price of $39.07 (which is the last reported sale price of our Class A common stock as of December 31, 2020 on the NYSE) per Class B-1 unit of QL Holdings LLC, we estimate that the amount that we would be required to pay under the tax receivables agreement could be approximately $293 million. The actual amount we will be required to pay under the tax receivables agreement may be materially greater than this hypothetical amount as potential future payments will vary depending on a number of factors, including the timing of the exchanges, the price of our Class A common stock at the time of the exchanges, the amount, character, and timing of our income and the tax rates then applicable. Payments under the tax receivables agreement are not conditioned on Insignia’s, the Senior Executives’, or White Mountains’ continued ownership of any of our equity.
We will not be reimbursed for any payments made to Insignia, the Senior Executives, or White Mountains under the tax receivables agreement in the event that any tax benefits are disallowed.
Although we are not aware of any issue that would cause the U.S. Internal Revenue Service (the “IRS”) or other relevant tax authorities to challenge potential tax basis increases or other tax benefits covered by the tax receivables agreement, if the IRS successfully challenges the tax basis increases or the existence or amount of the net operating losses at any point in the future after payments are made under the tax receivables agreement, we will not be reimbursed for any payments made under the tax receivables agreement (although future payments under the tax receivables agreement, if any, would be netted against any unreimbursed payments to reflect the result of any such successful challenge by the IRS). As a result, we could make payments under the tax receivables agreement in excess of our cash tax savings that we ultimately realize. We might not determine whether we have effectively made such excess cash payments for a number of years following the time of such payments.
53
We may not be able to realize all or a portion of the tax benefits that are currently expected to result from our initial purchase (through Intermediate Holdco) of Class B-1 units of QL Holdings LLC from certain unitholders (including the Selling Class B-1 Unitholders) in the IPO, the Pre-IPO Leveraged Distribution and other actual or deemed distributions by QL Holdings LLC to its members, post-IPO exchanges of Class B-1 units of QL Holdings LLC, the utilization of pre-IPO net operating losses of Intermediate Holdco, and payments made under the tax receivables agreement.
Our ability to realize the tax benefits that we currently expect to be available as a result of (i) the increases in tax basis created by our purchase (through Intermediate Holdco) of Class B-1 units of QL Holdings LLC from certain unitholders (including the Selling Class B-1 Unitholders) in connection with the IPO, or by any post-IPO exchanges of Class B-1 units of QL Holdings LLC, in each case, together with an equal number of shares of our Class B common stock, for shares of our Class A common stock (or, at our election, cash of an equivalent value), (ii) the Pre-IPO Leveraged Distribution and other actual or deemed distributions by QL Holdings LLC to its members that result in tax basis adjustments to the assets of QL Holdings LLC, (iii) payments made pursuant to the tax receivables agreement, (iv) our ability to utilize the pre-IPO net operating losses of Intermediate Holdco, and (v) our ability to utilize the interest deductions imputed under the tax receivables agreement all depend on a number of assumptions, including that we earn sufficient taxable income each year during the period over which the deductions arising from such basis increases and payments are available and that there are no adverse changes in applicable law or regulations. If our actual taxable income is insufficient or there are adverse changes in applicable law or regulations, we may be unable to realize all or a portion of these expected benefits and our cash flows and stockholders’ equity could be negatively affected.
In certain cases, payments by us under the tax receivables agreement may be accelerated or significantly exceed the tax benefits we realize in respect of the tax attributes subject to the tax receivables agreement.
The tax receivables agreement provides that upon certain changes of control, or if, at any time, we elect an early termination of the tax receivables agreement or are in material breach of our obligations under the tax receivables agreement, we will be required to make immediate payments to the tax receivables agreement’s counterparties equal to the present value of the anticipated future tax benefits. Such payments would be based on certain valuation assumptions and deemed events set forth in the tax receivables agreement, including the assumption that we have sufficient taxable income to fully use such tax benefits. The benefits would be payable even though, in certain circumstances, no Class B-1 units of QL Holdings LLC have actually been exchanged and no net operating losses are actually used at the time of the accelerated payments. Accordingly, payments under the tax receivables agreement may be made years in advance of the actual realization, if any, of the anticipated tax benefits and may be significantly greater than the benefits we eventually realize. In these situations, our obligations under the tax receivables agreement could have a substantial negative impact on our liquidity.
We may not be able to finance our obligations under the tax receivables agreement and any indebtedness we incur may limit our subsidiaries’ ability to make distributions to us to pay these obligations. In addition, our obligations under the tax receivables agreement could have the effect of delaying, deferring or preventing certain mergers, asset sales, other forms of business combinations or other changes of control that could be in the best interests of holders of our Class A common stock.
54
Item 1B. Unresolved Staff Comments.
None.
Our principal executive office is located in Los Angeles, California. In addition to our Los Angeles office, we operate from two other offices located in Redmond, Washington and Tampa, Florida. We lease each of our offices. We believe that our current facilities are adequate to meet our immediate needs.
From time to time we are a party to various litigation matters incidental to the conduct of our business. We are not presently party to any legal proceedings the resolution of which we believe would have a material adverse effect on our business, prospects, financial condition, liquidity, results of operation, cash flows or capital levels.
Item 4. Mine Safety Disclosures.
Not applicable.
55
Item 5. Market for Registrant’s Common Equity, Related Stockholder Matters and Issuer Purchases of Equity Securities.
Market Information for Our Class A Common Stock
Our Class A common stock began trading on The New York Stock Exchange (NYSE) under the symbol “MAX” on October 28, 2020. Our Class B common stock is not listed or traded on any stock exchange.
Holders of Record
As of February 26, 2021, there were 34 holders of record of our Class A common stock and 15 holders of record of our Class B common stock. We believe there are a significantly larger number of beneficial owners of our common stock because many shares are held by brokers and other institutions on behalf of stockholders.
Dividend policy
We do not anticipate declaring or paying any cash dividends on our Class A common stock in the foreseeable future. Any future determination to declare and pay cash dividends, if any, will be made at the discretion of our Board of Directors and will depend on a variety of factors, including applicable laws, our financial condition, results of operations, contractual restrictions, capital requirements, business prospects, general business or financial market conditions, and other factors our Board of Directors may deem relevant. In addition, the 2020 Credit Agreement contains covenants that restrict QuoteLab, LLC’s and, in turn, our ability to pay cash dividends, subject to certain exceptions. Investors should not purchase our Class A common stock with the expectation of receiving cash dividends.
Our Class B common stock is not entitled to any dividend payments.
Securities authorized for issuance under equity compensation plans
|
|
|
Number of securities to be issued upon vesting of restricted stock units and awards |
|
|
Weighted average price |
|
|
Number of securities remaining available for future issuance under equity compensation plans (excluding securities reflected in the first column) |
|
|||
|
QLH Class B-1 Units (Restricted Stock Awards) |
|
|
524,684 |
|
|
|
- |
|
|
|
- |
|
|
PubCo Restricted Class A Shares (Restricted Stock Awards) |
|
|
1,061,605 |
|
|
|
- |
|
|
|
- |
|
|
2020 Omnibus Incentive Compensation Plan |
|
|
5,482,876 |
|
|
|
- |
|
|
|
6,793,630 |
|
56
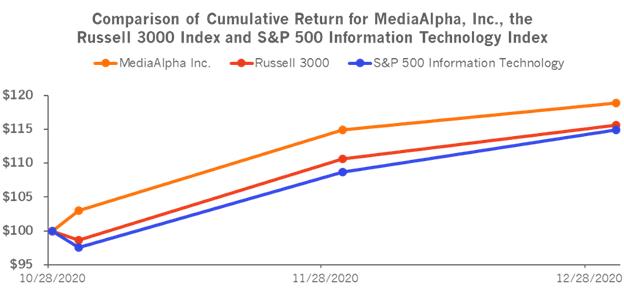
The performance graph and related information shall not be deemed to be "soliciting material" or "filed" for purposes of Section 18 of the Exchange Act nor shall such information be incorporated by reference into any filing of MediaAlpha, Inc. under the Exchange Act or the Securities Act, except to the extent we specifically incorporate it by reference in such filing.
The graph set forth above compares the cumulative total return to stockholders on our Class A common stock relative to the cumulative total returns of the Russell 3000 Index and the S&P 500 Information Technology Index between October 28, 2020 (the date our Class A common stock commenced trading on NYSE) through December 31, 2020. All values assume a $100 initial investment and data for the Russell 3000 and the S&P 500 Information Technology Index assume reinvestment of dividends. The comparisons are based on historical data and are not indicative of, nor intended to forecast, the future performance of our Class A common stock.
Issuer Purchases of Equity Securities
The following table provides information about our share repurchase activity for the quarter ended December 31, 2020:
|
Period: |
|
Total Number of Shares (or Units) Purchased (1) |
|
|
Average Price Paid per Share (or Unit) |
|
|
Total Number of Shares (or Units) Purchased as Part of Publicly Announced Plans or Programs |
|
Maximum Number (or Approximate Dollar Value) of Shares (or Units) that May Yet Be Purchased Under the Plans or Programs (b) |
||
|
|
|
|
|
|
|
|
|
|
N/A |
|
N/A |
|
|
November, 2020 |
|
|
109,867 |
|
|
|
38.39 |
|
|
N/A |
|
N/A |
|
December, 2020 |
|
|
|
|
|
|
|
|
|
N/A |
|
N/A |
(1) These Class A Common Stock withholdings and purchases were made to satisfy tax withholding and payment obligations in connection with the vesting of awards of shares of our Class A Common Stock. We withheld and purchased these shares at their fair market values based upon the trading prices of our Class A Common Shares at the close of trading on NYSE on the purchase dates.
Item 6. Selected Financial Data.
Not applicable.
57
Item 7. Management’s Discussion and Analysis of Financial Condition and Results of Operations.
You should read the following discussion and analysis of our financial condition and results of operations together with our audited consolidated financial statements and related notes included in "Financial Statements and Supplementary Data." Some of the information contained in this discussion and analysis, including information with respect to our plans and strategy for our business, includes forward-looking statements involving significant risks and uncertainties. As a result of many factors, such as those set forth in "Risk Factors," our actual results may differ materially from the results described in, or implied by, these forward-looking statements.
Management overview
Our mission is to help insurance carriers and distributors target and acquire customers more efficiently and at greater scale through technology and data science. Our technology platform brings leading insurance carriers and high-intent consumers together through a real-time, transparent, and results-driven ecosystem. We believe we are the largest online customer acquisition channel in our core verticals of property & casualty insurance, health insurance, and life insurance, supporting over $1.4 billion in Transaction Value across our platform over the last two years.
We have multi-faceted relationships with top-tier insurance carriers and distributors. A buyer or a demand partner within our ecosystem is generally an insurance carrier or distributor seeking to reach high-intent insurance consumers. A seller or a supply partner is typically an insurance carrier looking to maximize the value of non-converting or low LTV consumers, or an insurance-focused research destination looking to monetize the high-intent insurance shoppers on their websites. On a monthly basis, an average of 31.2 million consumers shop for insurance products through the websites of our diversified group of supply partners and our proprietary websites, driving an average of over 6.6 million Consumer Referrals on our platform for the year ended December 31, 2020.
We generate revenue by earning a fee for each Consumer Referral sold on our platform. A transaction becomes payable only on a qualifying consumer action, such as a click, call or lead, and is not contingent on the sale of a product to the consumer.
We believe in the disruptive power of transparency. Traditionally, insurance customer acquisition platforms operated in a black box. We recognized that a consumer may be valued differently by one insurer versus another; therefore, insurers should be able to determine pricing granularly based on the value that a particular customer segment is expected to bring to their business. As a result, we developed a technology platform that powers an ecosystem where buyers and sellers can transact with full transparency, control, and confidence, aligning the interests of the parties participating on our platform.
We believe our technology is a key differentiator and a powerful driver of our performance. We maintain deep, custom integrations with partners representing the majority of our Transaction Value to enable automated, data-driven processes that optimize our partners’ customer acquisition spend and revenue. Through our platform, our insurance carrier partners can target and price across over 35 separate consumer attributes to manage customized acquisition strategies.
Financial Highlights
For the year ended December 31, 2020, we earned $584.8 million of revenue representing a 43.3% increase over the $408.0 million of revenue we earned for the year ended December 31, 2019 primarily driven by increases in revenue in our P&C insurance vertical of $178.2 million or 81.2% and Health insurance revenue by $35.5 million or 34.1%, partially offset by a decline in revenue in our Other vertical of $34.3 million or 66.8%, primarily driven by decline in our Travel vertical due reduced consumer search volume and budget contraction as a result of COVID-19.
For the year ended December 31, 2020, we earned $10.6 million in net income, compared to $17.8 million for the year ended December 31, 2019, a decrease of 40.7% that was driven primarily by increased professional fee expenses and equity-based compensation incurred in connection with the IPO.
58
For the year ended December 31, 2020, we had a net loss attributable to MediaAlpha, Inc. of $4.4 million, compared to $0.0 million for the year ended December 31, 2019 on account of loss attributable to MediaAlpha, Inc. and non-controlling interest subsequent to IPO and pre-IPO Reorganization Transactions. For period prior to the Reorganization Transactions net income attributable to QLH was $19.2 million for the year ended December 31, 2020 and $17.8 million for the year ended December 31, 2019.
For the year ended December 31, 2020, we earned $58.1 million in Adjusted EBITDA, compared to $42.9 million for the year ended December 31, 2019, an increase of 35.3% that was primarily driven by strong year over year growth in contribution from our P&C and Health verticals.
For the year ended December 31, 2020, we earned in $85.4 million in gross profit (revenue less cost of revenue), compared to $65.1 million for the year ended December 31, 2019, an increase of 31.2% due to increased revenue contribution from our core insurance verticals, offset by increased equity-based compensation.
For the year ended December 31, 2020, gross margin (revenue less cost of revenue divided by revenue) decreased to 14.6% compared to 16.0% for the year ended December 31, 2019, a decrease of 8.5% due to increased equity-based compensation and increased revenue from strategic supply partners at lower revenue share.
For the year ended December 31, 2020, our Contribution increased to $92.6 million, compared to $69.3 million for the year ended December 31, 2019, an increase of 33.6% due to increased volume of consumer referrals and resulting revenue contribution from our core insurance verticals.
For the year ended December 31, 2020, Contribution Margin decreased to 15.8% compared to 17.0% for the year ended December 31, 2019, due to increased volume of consumer referrals and resulting revenue contribution from strategic supply partners at lower revenue share to MediaAlpha.
Adjusted EBITDA, Contribution, and Contribution Margin are business and operating metrics that are not presented in accordance with GAAP. We use such metrics, together with financial measures prepared in accordance with GAAP, to measure our operating performance. See “—Key business and operating metrics” below. We also present Transaction Value, which is an operating metric not presented in accordance with GAAP. Although Transaction Value is a driver of revenue in accordance with GAAP, we do not believe Transaction Value is a financial measure because it only measures the gross transaction activity across our platform. Transaction activity on the platform translates to earnings that are recorded as revenue as described below under “—Key components of our results of operations—revenue.” As described below under “—Key business and operating metrics—Transaction value,” we present Transaction Value because we believe it is useful to investors to assess the overall level of activity on our platform and to better understand the sources of our revenue across our different transaction models and verticals.
Key factors affecting our business
Revenue
We believe that our future performance will depend on many factors, including those described below and in the section titled “Risk factors” included elsewhere in this Report.
Secular trends in the insurance industry
Our technology platform was created to serve and grow with our core insurance end markets. As such, we believe secular trends in the insurance industry are a critical driver of our revenue and will continue to provide strong tailwinds for our business. More insurance consumers are shopping online and direct-to-consumer marketing, which fuels our revenue, is the fastest growing insurance distribution channel. In addition, insurance customer acquisition spending is growing. As mass-market customer acquisition spend is becoming more costly, insurance carriers and distributors are increasingly focusing on optimizing customer acquisition spend, which is at the core of the service we deliver on our platform. As long as these secular trends persist, we expect growth in digital insurance customer acquisition spend to continue, and we believe we are well-positioned to benefit from the industry’s growth.
59
Transaction Value from open platform transactions is a direct driver of our revenue, while Transaction Value from private platform transactions is an indirect driver of our revenue (see “Key business and operating metrics” below). Transaction Value on our platform grew to $815.7 million for the year ended December 31, 2020 from $560.1 million for the year ended December 31, 2019. We have developed multi-faceted, deeply integrated partnerships with insurance carriers and distributors, who are often both buyers and sellers on our platform. We believe the versatility and breadth of our offerings, coupled with our focus on high-quality products, provide significant value to insurance carriers and distributors, resulting in strong retention rates. As a result, many insurance carriers and distributors use our platform as their central hub for broadly managing digital customer acquisition and monetization. For the year ended December 31, 2020, 96.7% of total Transaction Value executed on our platform came from demand partner relationships from 2019.
Our demand and supply partners
Our success depends on our ability to retain and grow the number of demand and supply partners on our platform. The aggregate number of demand and supply partners on our platform increased to 1,460 for the year ended December 31, 2020 from 1,200 for the year ended December 31, 2019, driven by increased engagement in our P&C and Health verticals, partially offset by decreased engagement in our travel sub-vertical (other) as advertising spend in this vertical decreased period over period. We retain and attract demand partners by finding high-quality sources of Consumer Referrals to make available to our demand partners. We seek to develop, acquire and retain relationships with high-quality supply partners by developing flexible platforms to enable our supply partners to maximize their revenue, manage their demand side relationships in scalable and flexible ways and focus on long-term sustainable economics with respect to revenue share. Our relationships with our partners are deep, long standing and involve the top-tier insurance carriers in the industry. In terms of buyers, 15 of the top 20 largest auto insurance carriers by customer acquisition spend are on our platform. Approximately half of our supply partners have been on our platform since 2016.
Consumer Referrals
Our results also depend on the number of Consumer Referrals purchased on our platform. The aggregate number of consumer clicks, calls and leads purchased by insurance buyers on our platform grew to 79.4 million for the year ended December 31, 2020 from 60.2 million for the year ended December 31, 2019. We seek to increase the number and scale of our supply relationships and drive consumers to our proprietary properties through a variety of paid traffic acquisition sources. We are investing in diversifying our paid media sources to extend beyond search engine marketing, which historically represented the bulk of our paid media spend, and into other online media sources, including native, social, and display advertising.
Seasonality
Our results are subject to significant fluctuation as a result of seasonality. For our quarters ending December 31, our property & casualty insurance vertical is characterized by seasonal weakness due to lower supply of Consumer Referrals during the holiday period on a cost-effective basis and lower customer acquisition budgets from some buyers. In our quarters ending March 31, this trend generally reverses with greater supply of Consumer Referrals and often customer acquisition budgets at the beginning of the year for our partners with fiscal years ending December 31. Our quarters ending March 31 and December 31 are typically characterized by seasonal strength for our health insurance vertical due to open enrollment for health insurance and annual enrollment for Medicare, with a material increase in consumer search volume for health products and a related increase in buyer customer acquisition budgets.
Other factors affecting our partners’ businesses include macro factors such as credit availability in the market, the strength of the economy and employment.
60
Our earnings may fluctuate from time to time as a result of federal, state, international and industry-based laws, directives and regulations and developing standards with respect to the enforcement of those regulations. Our business is affected directly because we operate websites, conduct telemarketing and email marketing and collect, process, store, share, disclose, transfer and use consumer information and other data. Our business is affected indirectly as our clients adjust their operations as a result of regulatory changes and enforcement activity within their industries. For example, the recent enactment of the CCPA, which became effective on January 1, 2020, may affect our business. While the CCPA has already been amended multiple times, it is unclear how this legislation will be further modified or how it will be interpreted. The effects of this legislation potentially are far-reaching, however, and may require us to modify our data processing practices and policies and incur substantial compliance-related costs and expenses. For a description of laws and regulations to which we are generally subject, see Item 1 “Business” and Item 1A “Risk Factors.”
COVID-19 and impact on travel
In 2015, we began to expand into the travel vertical, which is ultimately driven by consumer spending on airfare, hotels, rentals and other travel products. However, as a result of COVID-19, we have experienced a dramatic decline in revenue from the travel vertical and expect this trend to continue indefinitely. For the years ended December 31, 2020 and, 2019 revenue from the travel vertical comprised approximately 2.1% and 11.1%, respectively, of our total revenue. While we have sought to maintain our commercial relationships in the travel vertical and remain positioned to capitalize on transactions in the travel vertical when travel activity resumes, we do not expect that revenue from the travel vertical will match our historical results or have any material impact on our overall revenue or profitability for the foreseeable future.
Key business and operating metrics
In addition to traditional financial metrics, we rely upon certain business and operating metrics that are not presented in accordance with GAAP to estimate the volume of spending on our platform, estimate and recognize revenue, evaluate our business performance and facilitate our operations. Such business and operating metrics should not be considered in isolation from, or as an alternative to, measures presented in accordance with GAAP and should be considered together with other operating and financial performance measures presented in accordance with GAAP. Also, such business and operating metrics may not necessarily be comparable to similarly titled measures presented by other companies.
Adjusted EBITDA
We define “Adjusted EBITDA” as net income excluding interest expense, income tax benefit (expense), depreciation expense on property and equipment, and amortization of intangible assets, as well as equity-based compensation expense and transaction expenses. Adjusted EBITDA is a non-GAAP financial measure that we present to supplement the financial information we present on a GAAP basis. We monitor and present Adjusted EBITDA because it is a key measure used by our management to understand and evaluate our operating performance, to establish budgets and to develop operational goals for managing our business. We believe that Adjusted EBITDA helps identify underlying trends in our business that could otherwise be masked by the effect of the expenses that we exclude in the calculations of Adjusted EBITDA. Accordingly, we believe that Adjusted EBITDA provides useful information to investors and others in understanding and evaluating our operating results, enhancing the overall understanding of our past performance and future prospects. In addition, presenting Adjusted EBITDA provides investors with a metric to evaluate the capital efficiency of our business.
Adjusted EBITDA is not presented in accordance with GAAP and should not be considered in isolation of, or as an alternative to, measures presented in accordance with GAAP. There are a number of limitations related to the use of Adjusted EBITDA rather than net income, which is the most directly comparable financial measure calculated and presented in accordance with GAAP. These limitations include the fact that Adjusted EBITDA excludes interest expense on debt, income tax benefit (expense) and depreciation and amortization. In addition, other companies may use other measures to evaluate their performance, including different definitions of “Adjusted EBITDA,” which could reduce the usefulness of our Adjusted EBITDA as a tool for comparison.
61
The following table reconciles Adjusted EBITDA with net income, the most directly comparable financial measure calculated and presented in accordance with GAAP, for the year ended December 31, 2020, 2019 and 2018.
|
|
|
|
Year ended December 31, |
|
|||||||||
|
(in thousands) |
|
|
2020 |
|
|
2019 |
|
|
2018 |
|
|||
|
Net income |
|
|
$ |
10,562 |
|
|
$ |
17,820 |
|
|
$ |
18,125 |
|
|
Equity-based compensation expense |
|
|
|
25,536 |
|
|
|
3,594 |
|
|
|
824 |
|
|
Interest expense |
|
|
|
7,938 |
|
|
|
7,021 |
|
|
|
1,194 |
|
|
Income tax (benefit) |
|
|
|
(1,267 |
) |
|
|
— |
|
|
|
— |
|
|
Depreciation expense on property and equipment |
|
|
|
289 |
|
|
|
272 |
|
|
|
187 |
|
|
Amortization of intangible assets |
|
|
|
3,201 |
|
|
|
5,381 |
|
|
|
11,769 |
|
|
Transaction expenses(1) |
|
|
|
11,815 |
|
|
|
8,831 |
|
|
|
— |
|
|
Adjusted EBITDA |
|
|
$ |
58,074 |
|
|
$ |
42,919 |
|
|
$ |
32,099 |
|
|
|
(1) |
For the twelve-months ended December 31, 2020, transaction expenses include $5.9 million in legal, and other consulting fees, $3.6 million in transaction bonus related to the Reorganization Transaction and IPO, $2.0 million in loss on extinguishment of debt related to the termination of 2019 Credit Facilities, and $0.3 million related to reversal of tax indemnification receivable created in connection with the Reorganization Transaction. For the twelve-months ended December 31, 2019, transaction expenses included $7.2 million in legal, investment banking and other consulting fees and $1.6 million in transaction bonuses related to a transaction with Insignia in February 2019. |
Contribution and Contribution Margin
We define “Contribution” as revenue less revenue share payments and online advertising costs, or, as reported in our consolidated statement of operations, revenue less cost of revenue (i.e., gross profit), as adjusted to exclude the following items from cost of revenue: equity-based compensation; salaries, wages, and related; internet and hosting; amortization; depreciation; other services; and merchant-related fees. We define “Contribution Margin” as Contribution expressed as a percentage of revenue for the same period. Contribution and Contribution Margin are non-GAAP financial measures that we present to supplement the financial information we present on a GAAP basis. We use Contribution and Contribution Margin to measure the return on our relationships with our supply partners (excluding certain fixed costs), the financial return on and efficacy of our online advertising costs to drive consumers to our proprietary websites, and our operating leverage. We do not use Contribution and Contribution Margin as measures of overall profitability. We present Contribution and Contribution Margin because they are used by our management and board of directors to manage our operating performance, including evaluating our operational performance against budget and assessing our overall operating efficiency and operating leverage. For example, if Contribution Margin increases and our headcount costs remain steady, our Adjusted EBITDA and operating leverage increase. If Contribution Margin decreases, we may choose to re-evaluate and re-negotiate our revenue share agreements with our supply partners, to make optimization and pricing changes with respect to our bids for keywords from primary traffic acquisition sources, or to change our overall cost structure with respect to headcount, fixed costs and other costs. Other companies may calculate Contribution and Contribution Margin differently than we do. Contribution and Contribution Margin have their limitations as analytical tools, and you should not consider them in isolation or as substitutes for analysis of our results presented in accordance with GAAP.
62
The following table reconciles Contribution and Contribution Margin with gross profit, the most directly comparable financial measure calculated and presented in accordance with GAAP, for years ended December 31, 2020, 2019 and 2018.
|
|
|
|
Year Ended December 31, |
|
|||||||||
|
(in thousands) |
|
|
2020 |
|
|
2019 |
|
|
2018 |
|
|||
|
Revenue |
|
|
$ |
584,814 |
|
|
$ |
408,005 |
|
|
$ |
296,910 |
|
|
Less cost of revenue |
|
|
|
(499,434 |
) |
|
|
(342,909 |
) |
|
|
(247,670 |
) |
|
Gross profit |
|
|
$ |
85,380 |
|
|
$ |
65,096 |
|
|
$ |
49,240 |
|
|
Adjusted to exclude the following (as related to cost of revenue): |
|
|
|
|
|
|
|
|
|
|
|
|
|
|
Equity-based compensation |
|
|
|
2,809 |
|
|
|
181 |
|
|
|
54 |
|
|
Salaries, wages, and related |
|
|
|
2,188 |
|
|
|
1,471 |
|
|
|
1,265 |
|
|
Internet and hosting |
|
|
|
438 |
|
|
|
520 |
|
|
|
387 |
|
|
Amortization |
|
|
|
— |
|
|
|
511 |
|
|
|
738 |
|
|
Depreciation |
|
|
|
24 |
|
|
|
22 |
|
|
|
23 |
|
|
Other expenses |
|
|
|
284 |
|
|
|
263 |
|
|
|
247 |
|
|
Other services |
|
|
|
902 |
|
|
|
778 |
|
|
584 |
|
|
|
Merchant-related fees |
|
|
|
585 |
|
|
|
452 |
|
|
259 |
|
|
|
Contribution |
|
|
$ |
92,610 |
|
|
$ |
69,294 |
|
|
$ |
52,797 |
|
|
Gross Margin |
|
|
|
14.6 |
% |
|
|
16.0 |
% |
|
|
16.6 |
% |
|
Contribution Margin |
|
|
|
15.8 |
% |
|
|
17.0 |
% |
|
|
17.8 |
% |
Transaction Value
We define “Transaction Value” as the total gross dollars transacted by our partners on our platform. Transaction Value is a direct driver of revenue, with differing revenue recognition based on the economic relationship we have with our partners. Our partners use our platform to transact via open and private platform transactions. In our open platform model, revenue recognized represents the Transaction Value and revenue share payments to our supply partners represent costs of revenue. In our private platform model, revenue recognized represents a platform fee billed to the demand partner or supply partner based on an agreed-upon percentage of the Transaction Value for the Consumer Referrals transacted, and accordingly there are no associated costs of revenue. We utilize Transaction Value to assess revenue and to assess the overall level of transaction activity through our platform. We believe it is useful to investors to assess the overall level of activity on our platform and to better understand the sources of our revenue across our different transaction models and verticals.
The following table presents Transaction Value by platform model for the years ended December 31, 2020, 2019, and 2018.
|
|
|
|
Year Ended December 31, |
|
|||||||||
|
|
|
2020 |
|
|
2019 |
|
|
2018 |
|
||||
|
Open platform transactions |
|
|
$ |
573,242 |
|
|
$ |
399,945 |
|
|
$ |
291,331 |
|
|
Percentage of total Transaction Value |
|
|
|
70.3 |
% |
|
|
71.4 |
% |
|
|
73.3 |
% |
|
Private platform transactions |
|
|
$ |
242,470 |
|
|
|
160,181 |
|
|
|
105,924 |
|
|
Percentage of total Transaction Value |
|
|
|
29.7 |
% |
|
|
28.6 |
% |
|
|
26.7 |
% |
|
Total Transaction Value |
|
|
$ |
815,712 |
|
|
$ |
560,126 |
|
|
$ |
397,255 |
|
63
The following table presents Transaction Value by vertical for the years ended December 31, 2020, 2019, and 2018.
|
|
|
|
Year Ended December 31, |
|
|||||||||
|
|
|
|
2020 |
|
|
2019 |
|
|
2018 |
|
|||
|
(in thousands) |
|
|
|
|
|
|
|
|
|
|
|
|
|
|
Property & casualty insurance |
|
|
$ |
549,916 |
|
|
$ |
322,817 |
|
|
$ |
225,930 |
|
|
Percentage of total Transaction Value |
|
|
|
67.4 |
% |
|
|
57.6 |
% |
|
|
56.9 |
% |
|
Health insurance |
|
|
|
175,539 |
|
|
|
122,320 |
|
|
|
83,624 |
|
|
Percentage of total Transaction Value |
|
|
|
21.5 |
% |
|
|
21.8 |
% |
|
|
21.1 |
% |
|
Life insurance |
|
|
|
42,206 |
|
|
|
34,884 |
|
|
|
30,136 |
|
|
Percentage of total Transaction Value |
|
|
|
5.2 |
% |
|
|
6.2 |
% |
|
|
7.6 |
% |
|
Other |
|
|
|
48,051 |
|
|
|
80,105 |
|
|
|
57,565 |
|
|
Percentage of total Transaction Value |
|
|
|
5.9 |
% |
|
|
14.3 |
% |
|
|
14.5 |
% |
|
Total Transaction Value |
|
|
$ |
815,712 |
|
|
$ |
560,126 |
|
|
$ |
397,255 |
|
Consumer Referrals
We define “Consumer Referral” as any consumer click, call or lead purchased by a buyer on our platform. Click revenue is recognized on a pay-per-click basis and revenue is earned and recognized when a consumer clicks on a listed buyer’s advertisement, presented subsequent to the consumer’s search (e.g. auto insurance quote search or health insurance quote search). Call revenue is earned and recognized when a consumer transfers to a buyer and remains engaged for a requisite duration of time, as specified by each buyer. Lead revenue is recognized when we deliver data leads to buyers. Data leads are generated through insurance carriers or insurance-focused research destination websites who make the data leads available to buy through our platform or when users complete a full quote request on our proprietary websites. Delivery occurs at the time of lead transfer. The data we generate from each Consumer Referral feeds into our analytics model to generate conversion probabilities for each unique consumer, enabling discovery of predicted return and cost per sale across the platform and helping us to improve our platform technology. We monitor the number of Consumer Referrals on our platform in order to measure Transaction Value, revenue and overall business performance across our verticals and platform models. For the years ended December 31, 2020, Transaction Value generated from clicks, calls and leads was 79.9%, 8.1% and 12.0%, respectively.
Number of demand and supply partners
The aggregate number of demand and supply partners on our platform determines in part the level of Consumer Referral demand and supply on our platform. We use the number of demand and supply partners on our platform to evaluate our current business performance and future business prospects.
Key components of our results of operations
Revenue
We operate primarily in the property & casualty insurance, health insurance and life insurance verticals and generate revenue through the purchase and sale of Consumer Referrals.
The price and amount of Consumer Referrals purchased and sold on our platform varies and is a function of a number of market conditions and consumer attributes, including (i) geographic location of consumers, (ii) demographic attributes of consumers, (iii) the source of Consumer Referrals and quality of conversion by source, (iv) buyer bids and (v) buyer demand and budget.
In our open platform transactions, we have control over the Consumer Referrals that are sold to our demand partners. In these arrangements, we have separate agreements with demand partners and suppliers. Suppliers are not party to the contractual arrangements with our demand partners, nor are the suppliers the beneficiaries of our demand partner agreements. We earn fees from our demand partners and separately pay (i) a revenue share to suppliers and (ii) a fee to internet search companies to drive consumers to our proprietary websites. We are the
64
principal in the open platform transactions. As a result, the fees paid by demand partners are recognized as revenue and the fees paid to suppliers are included in cost of revenue.
With respect to our private platform transactions, buyers and suppliers contract with one another directly and leverage our platform to facilitate transparent, real-time transactions utilizing the reporting and analytical tools available to them from use of our platform. We charge a platform fee on the Consumer Referrals transacted. We act as an agent in the private platform transactions and recognize revenue on the platform fee received. There are no separate payments made by us to suppliers in our private platform.
We adopted Accounting Standards Codification (“ASC”) 606, Revenue from Contracts with Customers (“ASC 606”), as issued by the Financial Accounting Standards Board ("FASB"), which governs how we recognize revenue derived from Consumer Referrals. We recognize revenue when we transfer promised goods or services to clients in an amount that reflects the consideration to which we are entitled. We recognize revenue pursuant to the framework contained in ASC 606: (i) identify the contract with a client; (ii) identify the performance obligations in the contract, including whether they are distinct in the context of the contract; (iii) determine the transaction price, including the constraint on variable consideration; (iv) allocate the transaction price to the performance obligations in the contract; and (v) recognize revenue when we satisfy the performance obligations.
Generally, our contracts with buyers specify a period of time covered and a budget governing spend limits. While contracts can specify a term, most of our contracts can be terminated at any time without penalty upon 30- or 60-days’ notice. As a result, the transaction price for the delivery of each Consumer Referral is determined and recorded in real time and no estimation of variable consideration or future consideration is required. We satisfy our performance obligations as services are provided. We do not promise to provide any other significant goods or services to our partners after delivery and generally do not offer a right of return.
Cost and operating expenses
Cost and operating expenses consist primarily of cost of revenue, sales and marketing expenses, product expenses and general and administrative expenses.
Cost of revenue
Our cost of revenue is comprised primarily of revenue share payments to suppliers and traffic acquisition costs paid to top tier search engines as well as telephony infrastructure costs, internet and hosting, merchant fees, salaries and related expenses, amortization expense and other expenses.
Sales and marketing
Sales and marketing expenses consist primarily of an allocation of personnel expenses for employees engaged in demand side and supply side business development, marketing and media acquisition activities and includes salaries, wages and benefits, including non-cash equity-based compensation. Sales and marketing expenses also include costs related to attracting partners to our platform, including marketing and promotions, tradeshow and related travel and entertainment expenses. Sales and marketing expenses also include an allocated portion of rent and facilities expenses and depreciation and amortization expense.
Product development
Product development expenses consist primarily of an allocation of personnel expenses for employees engaged in technology, engineering and product development and includes salaries, wages and benefits, including non-cash equity-based compensation. Product development expenses also include an allocated portion of rent and facilities expenses and depreciation and amortization expense.
65
General and administrative expenses consist primarily of an allocation of personnel expenses for executive, finance, legal, human resources, and business analytics employees, and includes salaries, wages and benefits, including non-cash equity-based compensation. General and administrative expenses also include professional services and an allocated portion of rent and facilities expenses and depreciation expense.
Other expense
Other expenses consist of the loss on extinguishment recognized in connection with the termination of the 2019 Credit Facilities in 2020.
Interest expense
Interest expense consists primarily of interest expense associated with outstanding borrowings under our loan and security agreements and the amortization of deferred financing costs and debt discounts associated with these arrangements. See “—Liquidity and capital resources—Financing activities” below.
Provision for income taxes
Prior to the Reorganization Transactions and IPO, the Company was not subject to corporate income taxation. As such, income tax expense (benefit) recorded during 2020 reflected the expected tax expense on the net earnings subsequent to the Reorganization Transactions and IPO related to MediaAlpha, Inc.'s economic interest in QLH.
The effective tax rate for the year ended December 31, 2020 was (13.4)%, compared to the effective tax rate for the years ended December 31, 2019 and 2018 of 0.0% and 0.0%, respectively. The 2020 income tax benefit was different than the U.S. federal statutory income tax rate of 21% primarily due to QLH being treated as a partnership and Media Alpha, Inc. is only responsible for paying taxes on its allocable share of income from the partnership. The 2019 and 2018 income tax expense was different than the U.S. federal statutory income tax rate of 21% primarily due to QLH being a pass-through entity and generally does not pay income taxes on its taxable income. Instead, the members are liable for paying the tax on their proportionate share of tax. The change in the effective tax rate between the periods was primarily a result of a mix of earnings between entities and the change in the noncontrolling interest as a result of the Reorganization Transactions and the IPO.
Net income (loss) attributable to QLH prior to Reorganization Transactions
Net income (loss) incurred prior to the Reorganization Transactions i.e. October 27, 2020 is attributed to QLH. Net income attributable to QLH prior to Reorganization Transactions was $19.2 million for the period January 1, 2020 to October 27, 2020 compared to $17.8 million and $18.1 million for the years ended December 31, 2019 and 2018, respectively.
Net income (loss) attributable to Non-controlling interest
Net income (loss) is attributed to non-controlling interests in accordance with QLH’s limited liability company agreement. We allocate the share of net income (loss) incurred subsequent to the Reorganization Transactions to the non-controlling interest holders pari-passu to their holding at period-end. The non-controlling interests balance represents the Class B-1 units held at QLH. Net loss attributable to non-controlling interest was $4.2 million for year ended December 31, 2020 and $0.0 for the year ended December 31, 2019 and 2018.
Results of operations
The following table sets forth our operating results and related percentage of revenue for the years ended December 31, 2020, 2019, and 2018:
66
|
|
|
Year Ended December 31, |
|
|||||||||||||||||||||
|
|
|
2020 |
|
|
2019 |
|
|
2018 |
|
|||||||||||||||
|
(in thousands) |
|
|
|
|
|
|
|
|
|
|
|
|
|
|
|
|
|
|
|
|
|
|
|
|
|
Revenue |
|
$ |
584,814 |
|
|
|
100.0 |
% |
|
$ |
408,005 |
|
|
|
100.0 |
% |
|
$ |
296,910 |
|
|
|
100.0 |
% |
|
Cost of operating expenses |
|
|
|
|
|
|
|
|
|
|
|
|
|
|
|
|
|
|
|
|
|
|
|
|
|
Cost of revenue |
|
|
499,434 |
|
|
|
85.4 |
% |
|
|
342,909 |
|
|
|
84.0 |
% |
|
|
247,670 |
|
|
|
83.4 |
% |
|
Sales and marketing |
|
|
20,483 |
|
|
|
3.5 |
% |
|
|
13,822 |
|
|
|
3.4 |
% |
|
|
11,739 |
|
|
|
4.0 |
% |
|
Product development |
|
|
12,449 |
|
|
|
2.1 |
% |
|
|
7,042 |
|
|
|
1.7 |
% |
|
|
10,339 |
|
|
|
3.5 |
% |
|
General and administrative |
|
|
32,913 |
|
|
|
5.6 |
% |
|
|
19,391 |
|
|
|
4.8 |
% |
|
|
7,843 |
|
|
|
2.6 |
% |
|
Total cost and operating expenses |
|
|
565,279 |
|
|
|
96.7 |
% |
|
|
383,164 |
|
|
|
93.9 |
% |
|
|
277,591 |
|
|
|
93.5 |
% |
|
Income from operations |
|
|
19,535 |
|
|
|
3.3 |
% |
|
|
24,841 |
|
|
|
6.1 |
% |
|
|
19,319 |
|
|
|
6.5 |
% |
|
Other expense |
|
|
2,302 |
|
|
|
0.4 |
% |
|
|
— |
|
|
|
0.0 |
% |
|
|
— |
|
|
|
0.0 |
% |
|
Interest expense |
|
|
7,938 |
|
|
|
1.4 |
% |
|
|
7,021 |
|
|
|
1.7 |
% |
|
|
1,194 |
|
|
|
0.4 |
% |
|
Total other expense |
|
|
10,240 |
|
|
|
1.8 |
% |
|
|
7,021 |
|
|
|
1.7 |
% |
|
|
1,194 |
|
|
|
0.4 |
% |
|
Income before income taxes |
|
|
9,295 |
|
|
|
1.6 |
% |
|
|
17,820 |
|
|
|
4.4 |
% |
|
|
18,125 |
|
|
|
6.1 |
% |
|
Income tax (benefit) |
|
|
(1,267 |
) |
|
|
-0.2 |
% |
|
|
— |
|
|
|
0.0 |
% |
|
|
— |
|
|
|
0.0 |
% |
|
Net income |
|
$ |
10,562 |
|
|
|
1.8 |
% |
|
$ |
17,820 |
|
|
|
4.4 |
% |
|
$ |
18,125 |
|
|
|
6.1 |
% |
|
Net income attributable to QLH prior to Reorganization Transactions |
|
|
19,166 |
|
|
|
3.3 |
% |
|
|
17,820 |
|
|
|
4.4 |
% |
|
|
18,125 |
|
|
|
6.1 |
% |
|
Net (loss) attributable to non-controlling interest |
|
|
(4,238 |
) |
|
|
-0.7 |
% |
|
|
— |
|
|
|
0.0 |
% |
|
|
— |
|
|
|
0.0 |
% |
|
Net (loss) attributable to MediaAlpha, Inc. |
|
$ |
(4,366 |
) |
|
|
-0.7 |
% |
|
$ |
— |
|
|
|
0.0 |
% |
|
$ |
— |
|
|
|
0.0 |
% |
|
Net (loss) per share of Class A common stock - basic and diluted |
|
$ |
(0.14 |
) |
|
|
|
|
|
|
— |
|
|
|
|
|
|
|
— |
|
|
|
|
|
|
Weighted average shares of Class A common stock outstanding - basic and diluted |
|
|
32,134,170 |
|
|
|
|
|
|
|
— |
|
|
|
|
|
|
|
— |
|
|
|
|
|
Revenue
The following table presents our revenue, disaggregated by vertical, for the years ended December 31, 2020, 2019, and 2018, and the dollar and percentage changes between the two periods:
|
(in thousands) |
|
Year ended December 31, 2020 |
|
|
$ |
|
|
% |
|
|
Year ended December 31, 2019 |
|
|
$ |
|
|
% |
|
|
Year ended December 31, 2018 |
|
|||||||
|
Property & casualty insurance |
|
$ |
397,710 |
|
|
|
178,243 |
|
|
|
81.2 |
% |
|
$ |
219,467 |
|
|
$ |
57,379 |
|
|
|
35.4 |
% |
|
$ |
162,088 |
|
|
Percentage of revenue |
|
|
68 |
% |
|
|
|
|
|
|
|
|
|
|
53.8 |
% |
|
|
|
|
|
|
|
|
|
|
54.6 |
% |
|
Health insurance |
|
|
139,796 |
|
|
|
35,535 |
|
|
|
34.1 |
% |
|
|
104,261 |
|
|
|
32,824 |
|
|
|
45.9 |
% |
|
|
71,437 |
|
|
Percentage of revenue |
|
|
24 |
% |
|
|
|
|
|
|
|
|
|
|
25.6 |
% |
|
|
|
|
|
|
|
|
|
|
24.1 |
% |
|
Life insurance |
|
|
30,313 |
|
|
|
(2,699 |
) |
|
|
(8.2 |
)% |
|
|
33,012 |
|
|
|
4,470 |
|
|
|
15.7 |
% |
|
|
28,542 |
|
|
Percentage of revenue |
|
|
5 |
% |
|
|
|
|
|
|
|
|
|
|
8.1 |
% |
|
|
|
|
|
|
|
|
|
|
9.6 |
% |
|
Other |
|
|
16,995 |
|
|
|
(34,270 |
) |
|
|
(66.8 |
)% |
|
|
51,265 |
|
|
|
16,422 |
|
|
|
47.1 |
% |
|
|
34,843 |
|
|
Percentage of revenue |
|
|
3 |
% |
|
|
|
|
|
|
|
|
|
|
12.6 |
% |
|
|
|
|
|
|
|
|
|
|
11.7 |
% |
|
Revenue |
|
$ |
584,814 |
|
|
|
176,809 |
|
|
|
43.3 |
% |
|
$ |
408,005 |
|
|
|
111,095 |
|
|
|
37.4 |
% |
|
$ |
296,910 |
|
67
2020 compared to 2019
Property & casualty insurance revenue increased $178.2 million, or 81.2%, from $219.5 million for the year ended December 31, 2019. The increase was due to an increase in spend from auto and home insurance carriers, driven by improving carrier profitability and the growing trend of property & casualty insurance carriers allocating customer acquisition budgets to the DTC channel, which in turn allowed our supply partners to drive more consumers through their websites. These dynamics led to a period over period increase in supply from both new and existing supply partners.
Health insurance revenue increased $35.5 million, or 34.1%, from $104.3 million for the year ended December 31, 2019. This increase was driven by increased customer acquisition budget allocation from Health and Medicare insurance carriers, which in turn allowed our supply partners to drive more consumers through their websites, and increased supply from our proprietary properties as we increased the volume of media spend to satisfy the increased demand.
Life insurance revenue decreased $2.7 million, or 8.2%, from $33.0 million for the year ended December 31, 2019. This decrease was driven by lower allocation from carriers and brokers, as budgets from Demand Partners contracted due to COVID-19 mortality concerns.
Other revenue decreased $34.3 million, or 66.8%, from $51.3 million for the year ended December 31, 2019. This decrease was driven primarily by a decrease in Travel comparison shopping, due to concerns around COVID-19.
2019 compared to 2018
Property & casualty insurance revenue increased $57.4 million, or 35.4%, from $162.1 million for the year ended December 31, 2018. The increase was due to an increase in spend from auto insurance carriers, driven by improving carrier profitability and the growing trend of property & casualty insurance carriers allocating customer acquisition budgets to the DTC channel, which in turn allowed our supply partners to drive more consumers through their websites. These dynamics led to a period over period increase in supply from both new and existing supply partners.
Health insurance revenue increased $32.8 million, or 45.9%, from $71.4 million for the year ended December 31, 2018. This increase was driven by increased customer acquisition budget allocation from health insurance carriers, which in turn allowed our supply partners to drive more consumers through their websites, and increased supply from our proprietary properties as we increased the volume of media spend to satisfy the increased demand.
Life insurance revenue increased $4.5 million, or 15.7%, from $28.5 million for the year ended December 31, 2018. This increase was driven by increased customer acquisition budget allocation from life insurance carriers, which in turn led to improved monetization and allowed our supply partners to drive more consumers through their websites.
Other revenue increased $16.4 million, or 47.1%, from $34.8 million for the year ended December 31, 2018. This increase was driven primarily by growth in our travel vertical as we increased our market share with new supply partners. For the year ended December 31, 2019, revenue from travel grew to $45.2 million from $26.9 million for the year ended December 31, 2018.
Cost of revenue
The following table presents our cost of revenue for the years ended December 31, 2020, 2019, and 2018 and the dollar and percentage changes between the two periods:
68
|
|
Year ended December 31, 2020 |
|
|
$ |
|
|
% |
|
|
Year ended December 31, 2019 |
|
|
$ |
|
|
% |
|
|
Year ended December 31, 2018 |
|
||||||||
|
Cost of revenue |
|
$ |
499,434 |
|
|
$ |
156,525 |
|
|
|
45.6 |
% |
|
$ |
342,909 |
|
|
$ |
95,239 |
|
|
|
38.5 |
% |
|
$ |
247,670 |
|
|
As a percentage of total revenue |
|
|
85.4 |
% |
|
|
|
|
|
|
|
|
|
|
84.0 |
% |
|
|
|
|
|
|
|
|
|
|
83.4 |
% |
2020 compared to 2019
For the year ended December 31, 2020, cost of revenue increased by $156.5 million, or 45.6%, from $342.9 million for the year ended December 31, 2019. The increase was driven primarily by the increase in revenue and corresponding increase in revenue share payments to suppliers of $132.4 million as supply partners increased volume. Additionally, there was an increase of $21.3 million in media costs as we increased paid media acquisition to drive more consumers to our proprietary websites to meet buyer demand and increased equity-based compensation of $2.6 million.
As we experience growth in revenue, we expect the relationship between our costs and revenue to remain in line with our historical results.
2019 compared to 2018
For the year ended December 31, 2019, cost of revenue increased by $95.2 million, or 38.5%, from $247.7 million for the year ended December 31, 2018. The increase was driven primarily by the increase in revenue and corresponding increase in revenue share payments to suppliers of $74.4 million as supply partners increased volume. Additionally, there was an increase of $20.2 million in media costs as we increased paid media acquisition to drive more consumers to our proprietary websites to meet buyer demand.
As we experience growth in revenue, we expect the relationship between our costs and revenue to remain in line with our historical results.
Sales and marketing
The following table presents our sales and marketing expenses for the years ended December 31, 2020, 2019, and 2018 and the dollar and percentage changes between the two periods:
|
|
Year ended December 31, 2020 |
|
|
$ |
|
|
% |
|
|
Year ended December 31, 2019 |
|
|
$ |
|
|
% |
|
|
Year ended December 31, 2018 |
|
||||||||
|
Sales and marketing |
|
$ |
20,483 |
|
|
$ |
6,661 |
|
|
|
48.2 |
% |
|
$ |
13,822 |
|
|
$ |
2,083 |
|
|
|
17.7 |
% |
|
$ |
11,739 |
|
|
As a percentage of total revenue |
|
|
3.5 |
% |
|
|
|
|
|
|
|
|
|
|
3.4 |
% |
|
|
|
|
|
|
|
|
|
|
4.0 |
% |
2020 compared to 2019
For the year ended December 31, 2020, sales and marketing expenses increased by $6.7 million, or 48.2%, from $13.8 million for the year ended December 31, 2019. The increase in sales and marketing expense was primarily due to the increase in equity-based compensation expense of $5.2 million, and an increase in personnel-related costs of $2.0 million driven by increased headcount to support current and future business growth, and one-time bonuses paid in connection with the IPO. These costs were partially offset by a decrease in amortization expense of $0.2 million, as certain intangible assets were fully amortized.
2019 compared to 2018
For the year ended December 31, 2019, sales and marketing expenses increased by $2.1 million, or 17.7%, from $11.7 million for the year ended December 31, 2018. The increase in sales and marketing expense was primarily due to the increase in equity-based compensation expense of $1.0 million and an increase in personnel-
69
related costs of $1.4 million, as we increased our headcount to support current and future growth of the business, and an increase in other expense of $0.1 million partially offset by a decrease in amortization expense of $0.4 million, as certain intangible assets were fully amortized.
Product development
The following table presents our product development expenses for the years ended December 31, 2020, 2019, and 2018, and the dollar and percentage changes between the two periods:
|
|
Year ended December 31, 2020 |
|
|
$ |
|
|
% |
|
|
Year ended December 31, 2019 |
|
|
$ |
|
|
% |
|
|
Year ended December 31, 2018 |
|
||||||||
|
Product development |
|
$ |
12,449 |
|
|
$ |
5,407 |
|
|
|
76.8 |
% |
|
$ |
7,042 |
|
|
$ |
(3,297 |
) |
|
|
-31.9 |
% |
|
$ |
10,339 |
|
|
As a percentage of total revenue |
|
|
2.1 |
% |
|
|
|
|
|
|
|
|
|
|
1.7 |
% |
|
|
|
|
|
|
|
|
|
|
3.5 |
% |
2020 compared to 2019
For the year ended December 31, 2020, product development expenses increased by $5.4 million, or 76.8%, from $7.0 million for the year ended December 31, 2019. The increase is primarily due to an increase in equity-based compensation of $4.2 million, an increase in personnel-related costs of $2.6 million, as we continued to hire engineering and product development talent to further enhance our technology and one-time bonuses paid in connection with the IPO partially offset by a decrease in amortization expense of $1.5 million, as certain intangible assets were fully amortized.
2019 compared to 2018
For the year ended December 31, 2019, product development expenses decreased by $3.3 million, or 31.9%, from $10.3 million for the year ended December 31, 2018. The decrease in product development expense was primarily due to the decrease in amortization expense of $5.8 million, as certain intangible assets were fully amortized. This decrease was offset by an increase in personnel-related costs of $1.9 million, as we continued to hire engineering and product development talent to further enhance our technology, an increase in equity-based compensation of $0.4 million, and other expenses of $0.2 million.
General and administrative
The following table presents our general and administrative expenses for the years ended December 31, 2020 and 2019, and the dollar and percentage changes between the two periods:
|
|
Year ended December 31, 2020 |
|
|
$ |
|
|
% |
|
|
Year ended December 31, 2019 |
|
|
$ |
|
|
% |
|
|
Year ended December 31, 2018 |
|
||||||||
|
General and administrative |
|
$ |
32,913 |
|
|
$ |
13,522 |
|
|
|
69.7 |
% |
|
$ |
19,391 |
|
|
$ |
11,548 |
|
|
|
147.2 |
% |
|
$ |
7,843 |
|
|
As a percentage of total revenue |
|
|
5.6 |
% |
|
|
|
|
|
|
|
|
|
|
4.8 |
% |
|
|
|
|
|
|
|
|
|
|
2.6 |
% |
2020 compared to 2019
For the year ended December 31, 2020, general and administrative expenses increased by $13.5 million, or 69.7%, from $19.4 million for the year ended December 31, 2019. The increase is primarily due to an increase in equity-based compensation expense of $10.0 million, an increase in other expenses of $1.8 million, driven by professional fees incurred in connection with the IPO, and an increase in personnel-related costs of $1.7 million, as we hired additional leadership talent to support our growth and one-time bonuses paid in connection with the IPO.
70
For the year ended December 31, 2019, general and administrative expenses increased by $11.5 million, or 147.2%, from $7.8 million for the year ended December 31, 2018. The increase in general and administrative expenses in both dollars and as a percentage of revenue was primarily due to an increase of $7.2 million in legal, investment banking and other consulting fees related to the February 2019 transaction with Insignia, $2.4 million in personnel-related, an increase in equity-based compensation expense of $1.3 million, and a $0.6 million increase in other expenses.
Equity-based compensation
The following table presents our equity-based compensation expense that was included in cost and operating expenses for the years ended December 31, 2020, 2019, and 2018 and the dollar and percentage changes between the two periods:
|
|
Year ended December 31, 2020 |
|
|
$ |
|
|
% |
|
|
Year ended December 31, 2019 |
|
|
$ |
|
|
% |
|
|
Year ended December 31, 2018 |
|
||||||
|
Cost of revenue |
|
$ |
2,809 |
|
|
$ |
2,628 |
|
|
1451.9% |
|
|
$ |
181 |
|
|
$ |
127 |
|
|
235.2% |
|
|
$ |
54 |
|
|
Sales and marketing |
|
|
6,544 |
|
|
|
5,160 |
|
|
372.8% |
|
|
|
1,384 |
|
|
|
959 |
|
|
225.6% |
|
|
|
425 |
|
|
Product development |
|
|
4,722 |
|
|
|
4,190 |
|
|
787.6% |
|
|
|
532 |
|
|
|
365 |
|
|
218.6% |
|
|
|
167 |
|
|
General and administrative |
|
|
11,461 |
|
|
|
9,964 |
|
|
665.6% |
|
|
|
1,497 |
|
|
|
1,319 |
|
|
741.0% |
|
|
|
178 |
|
|
Total |
|
$ |
25,536 |
|
|
$ |
21,942 |
|
|
610.5% |
|
|
$ |
3,594 |
|
|
$ |
2,770 |
|
|
336.2% |
|
|
$ |
824 |
|
2020 compared to 2019
For the year ended December 31, 2020, equity-based compensation expense increased $21.9 million, or 610.5%, compared to the year ended December 31, 2019. This change was primarily driven by grants of stock awards to Senior Executives and Legacy Profit Interest Holders and restricted stock units under the 2020 Omnibus Incentive plan.
2019 compared to 2018
For the year ended December 31, 2019, equity-based compensation expense increased $2.8 million, or 336.2%, compared to the year ended December 31, 2018, reflecting equity-based compensation recognized in connection with a transaction with Insignia in February 2019.
Depreciation
The following table presents our depreciation expense that was included in cost and operating expenses for the years ended December 31, 2020, 2019, and 2018, and the dollar and percentage changes between the two periods:
|
|
Year ended December 31, 2020 |
|
|
$ |
|
|
% |
|
|
Year ended December 31, 2019 |
|
|
$ |
|
|
% |
|
|
Year ended December 31, 2018 |
|
||||||
|
Cost of revenue |
|
$ |
24 |
|
|
$ |
2 |
|
|
9.1% |
|
|
$ |
22 |
|
|
$ |
(1 |
) |
|
-4.3% |
|
|
$ |
23 |
|
|
Sales and marketing |
|
|
108 |
|
|
|
16 |
|
|
17.4% |
|
|
|
92 |
|
|
|
17 |
|
|
22.7% |
|
|
|
75 |
|
|
Product development |
|
|
90 |
|
|
|
(2 |
) |
|
-2.2% |
|
|
|
92 |
|
|
|
46 |
|
|
100.0% |
|
|
|
46 |
|
|
General and administrative |
|
|
67 |
|
|
|
1 |
|
|
1.5% |
|
|
|
66 |
|
|
|
23 |
|
|
53.5% |
|
|
|
43 |
|
|
Total |
|
$ |
289 |
|
|
$ |
17 |
|
|
6.3% |
|
|
$ |
272 |
|
|
$ |
85 |
|
|
45.5% |
|
|
$ |
187 |
|
2020 compared to 2019
There were no material changes in depreciation expense in the year ended December 31, 2020 as compared with the same period ended December 31, 2019.
71
There were no material changes in depreciation expense in the year ended December 31, 2019 as compared with the same period ended December 31, 2018.
Amortization
The following table presents our amortization of intangible asset expense that was included in cost and operating expenses for the years ended December 31, 2020 and 2019, and the dollar and percentage changes between the two periods:
|
|
Year ended December 31, 2020 |
|
|
$ |
|
|
% |
|
|
Year ended December 31, 2019 |
|
|
$ |
|
|
% |
|
|
Year ended December 31, 2018 |
|
||||||||
|
Cost of revenue |
|
$ |
- |
|
|
$ |
(510 |
) |
|
-100.0% |
|
|
$ |
510 |
|
|
$ |
(228 |
) |
|
-30.9% |
|
|
$ |
738 |
|
||
|
Sales and marketing |
|
|
3,201 |
|
|
|
(200 |
) |
|
-5.9% |
|
|
|
3,401 |
|
|
|
(383 |
) |
|
-10.1% |
|
|
|
3,784 |
|
||
|
Product development |
|
|
— |
|
|
|
(1,470 |
) |
|
-100.0% |
|
|
|
1,470 |
|
|
|
(5,777 |
) |
|
-79.7% |
|
|
|
7,247 |
|
||
|
General and administrative |
|
|
— |
|
|
|
— |
|
|
|
— |
|
|
|
— |
|
|
|
— |
|
|
|
— |
|
|
|
— |
|
|
Total |
|
$ |
3,201 |
|
|
$ |
(2,180 |
) |
|
-40.5% |
|
|
$ |
5,381 |
|
|
$ |
(6,388 |
) |
|
-54.3% |
|
|
$ |
11,769 |
|
||
2020 compared to 2019
For the year ended December 31, 2020, amortization of intangible asset expense decreased $2.2 million or 40.5%, compared to the year ended December 31, 2019. This change was primarily driven by intangible assets that were fully amortized in 2019.
2019 compared to 2018
For the year ended December 31, 2019, amortization of intangible asset expense decreased $6.4 million or 54.3%, compared to the year ended December 31, 2018. This change was primarily driven by intangible assets that were fully amortized in 2019.
Other expenses
The following table presents our other expenses for the years ended December 31, 2020, 2019, and 2018 the dollar and percentage changes between the two periods:
|
(in thousands) |
|
Year ended December 31, 2020 |
|
|
$ |
|
|
% |
|
|
Year ended December 31, 2019 |
|
|
$ |
|
|
% |
|
|
Year ended December 31, 2018 |
|
|||||||
|
|
$ |
2,302 |
|
|
$ |
2,302 |
|
|
|
100.0 |
% |
|
$ |
— |
|
|
$ |
— |
|
|
|
0.0 |
% |
|
$ |
— |
|
|
|
As a percentage of total revenue |
|
|
0.4 |
% |
|
|
|
|
|
|
|
|
|
|
0.0 |
% |
|
|
|
|
|
|
|
|
|
|
0.0 |
% |
For the year ended December 31, 2020, other expenses represented a loss on extinguishment recognized in connection with the termination of the 2019 Credit Facilities. There was no other expense in 2019 or 2018.
72
The following table presents our interest expense for the years ended December 31, 2020, 2019, and 2018 and the dollar and percentage changes between the two periods:
|
(in thousands) |
|
Year ended December 31, 2020 |
|
|
$ |
|
|
% |
|
|
Year ended December 31, 2019 |
|
|
$ |
|
|
% |
|
|
Year ended December 31, 2018 |
|
|||||||
|
|
$ |
7,938 |
|
|
$ |
917 |
|
|
|
13.1 |
% |
|
$ |
7,021 |
|
|
$ |
5,827 |
|
|
|
488.0 |
% |
|
$ |
1,194 |
|
|
|
As a percentage of total revenue |
|
|
1.4 |
% |
|
|
|
|
|
|
|
|
|
|
1.7 |
% |
|
|
|
|
|
|
|
|
|
|
0.4 |
% |
2020 compared to 2019
For the year ended December 31, 2020, interest expense increased by $0.9 million or 13.1% from $7.0 million for the year ended December 31, 2019, higher outstanding balance as of December 31, 2020 due to the 2020 credit facility, compared to the 2019 credit facility.
2019 compared to 2018
For the year ended December 31, 2019, interest expense increased by $5.8 million from $1.2 million for the year ended December 31, 2018. The increase in interest expense was driven by the additional borrowings of $85.0 million through the 2019 Credit Facilities.
Income tax (benefit)
The following table presents our income tax expense for the years ended December 31, 2020, 2019, and 2018 and the dollar and percentage changes between the two periods:
|
(in thousands) |
|
Year ended December 31, 2020 |
|
|
$ |
|
|
% |
|
|
Year ended December 31, 2019 |
|
|
$ |
|
|
% |
|
|
Year ended December 31, 2018 |
|
|||||||
|
Income tax (benefit) |
|
|
(1,267 |
) |
|
$ |
(1,267 |
) |
|
|
100 |
% |
|
$ |
— |
|
|
$ |
— |
|
|
|
0.0 |
% |
|
$ |
— |
|
|
As a percentage of total revenue |
|
|
0 |
% |
|
|
|
|
|
|
|
|
|
|
0 |
% |
|
|
|
|
|
|
|
|
|
|
0.0 |
% |
Prior to its reorganization in October 2020, QLH was organized as a limited liability company and incurred no income taxes. Subsequent to the Reorganization Transactions, MediaAlpha, Inc. is subject to U.S. federal, state and foreign income taxes with respect to its allocable share of any taxable income or loss of QLH.
Segment information
We operate in the United States and in a single operating segment. Operating segments are defined as components of an enterprise about which separate financial information is available that is evaluated regularly by the chief operating decision maker, or decision-making group, in deciding how to allocate resources and in assessing performance. Our chief operating decision maker is our chief executive officer, who reviews financial information presented on a consolidated basis for purposes of allocating resources and evaluating financial performance. No expense or operating income is evaluated at a segment level. Since we operate in one operating segment and reportable segment, all required financial segment information can be found in the consolidated financial statements.
73
Liquidity and capital resources
Overview
Prior to the completion of our IPO in October 2020, our liquidity needs were funded primarily through cash flow generated from operations. Our principal uses of cash have been to fund operations as well as make distributions to holders of Class A and Class B units at QLH, interest payments and mandatory principal payments on our long-term debt.
On October 30, 2020, we closed our IPO selling 7,027,606 shares of Class A common stock at a public offering price of $19.00 per share, which includes 769,104 shares issued pursuant to the underwriters’ over-allotment option. We received $124.2 million, net of underwriting discounts and commissions, which we used in part to repurchase 4,772,449 Class B-1 units of MediaAlpha, Inc.
MediaAlpha, Inc. contributed (i) $84.3 million of the net proceeds to Intermediate Holdco for Intermediate Holdco to repurchase 4,772,449 Class B-1 units of QLH (which Class B-1 units are converted into Class A-1 units) and (ii) $23.6 million of the net proceeds to Intermediate Holdco for further contribution to QLH, and in turn to QL, to repay outstanding borrowings under the 2020 Term Loan Facility. The remaining net proceeds of $16.3 million were contributed to Intermediate Holdco for further contribution to QLH and QL to pay for costs associated with the IPO and to use for working capital, capital expenditures and general corporate purposes. Immediately following the completion of the IPO, there were 33,169,141 shares of Class A common stock outstanding, representing an approximately 56.5% ownership interest in QLH. Additionally, immediately following the completion of the IPO, there were 25,536,043 shares of Class B common stock outstanding, equivalent to all but 41,620 Class B-1 units of QLH not held by us, representing an approximately 43.5% ownership interest in QLH.
Cash Flows
As of December 31, 2020, and December 31, 2019, our cash and cash equivalents totaled $23.5 million and $10.0 million, respectively.
We believe that our current sources of liquidity, which include cash flow generated from operations, cash and funds available under the 2020 Credit Facilities, will be sufficient to meet our projected operating and debt service requirements for at least the next 12 months. To the extent that our current liquidity is insufficient to fund future activities, we may need to raise additional funds. In the future, we may attempt to raise additional capital through the sale of equity securities or through debt financing arrangements. If we raise additional funds by issuing equity securities, the ownership of our existing stockholders will be diluted. The incurrence of additional debt financing would result in debt service obligations, and any future instruments governing such debt could provide for operating and financing covenants that could restrict our operations.
The following table presents a summary of our cash flows for the years ended December 31, 2020, 2019, and 2018 and the dollar and percentage changes between the periods:
|
(in thousands) |
|
Year ended December 31, 2020 |
|
|
$ |
|
|
% |
|
|
Year ended December 31, 2019 |
|
|
$ |
|
|
% |
|
|
Year ended December 31, 2018 |
|
|||||||
|
operating activities |
|
$ |
51,410 |
|
|
$ |
29,267 |
|
|
|
132.2 |
% |
|
$ |
22,143 |
|
|
$ |
(506 |
) |
|
|
(2.2 |
)% |
|
$ |
22,649 |
|
|
Net cash used in investing activities |
|
|
(10,296 |
) |
|
|
(10,002 |
) |
|
|
3,402.0 |
% |
|
|
(294 |
) |
|
|
346 |
|
|
|
(54.1 |
)% |
|
|
(640 |
) |
|
Net cash used in financing activities |
|
|
(27,588 |
) |
|
|
(10,105 |
) |
|
|
57.8 |
% |
|
|
(17,483 |
) |
|
|
7,962 |
|
|
|
(31.3 |
)% |
|
|
(25,445 |
) |
74
Net cash provided by operating activities primarily consists of net income, adjusted for certain (i) non-cash items including equity-based compensation expense, depreciation on property and equipment and amortization of intangible assets and deferred debt issuance costs and (ii) changes in operating assets and liabilities (accounts receivable, prepaid expenses and other current assets, accounts payable, accrued expenses and deferred rent).
Collection of accounts receivable depends upon the timing of our receipt of payments. We aim to align our separate payment obligations to supply partners and traffic acquisition sources for our proprietary websites with the timing of our receipt of separate payments from our demand partners. With respect to supply partners who are also demand partners, we maintain separate agreements for selling and buying and, in the majority of cases, such partners do not have a right of offset with respect to their buy-side payments, nor do we have a right of offset with respect to sell-side payments to such partners. If we were to experience a delay in receiving a payment from a buyer within a quarter, our operating cash flows for that quarter could be adversely impacted.
Cash flows provided by operating activities were $51.4 million for the year ended December 31, 2020 as compared to $22.1 million for the year ended December 31, 2019. The increase is primarily due to higher non-cash adjustment related to equity-based compensation expense and higher working capital usage primarily driven by growth in our business and expenses incurred in connection with the IPO partially offset by lower net income.
Cash flows provided by operating activities were $22.1 million for the year ended December 31, 2019 as compared to $22.7 million for the year ended December 31, 2018. The decrease is primarily on account of lower net income, excluding the impact of non-cash charges partially offset by higher working capital usage driven primarily by growth in our business.
Investing activities
Our investing activities primarily consist of purchases of property and equipment, acquisition of intangible assets and investments.
Cash flows used in investing activities were $10.3 million for the year ended December 31, 2020 as compared to $0.3 million for the year ended December 31, 2019. The increase is due to our investment in a cost method investment during the year ended December 31, 2020.
Cash flows used in investing activities were $0.3 million for the year ended December 31, 2019 as compared to $0.6 million for the year ended December 31, 2018. The decrease is primarily on account of higher purchases of property and equipment during the year ended December 31, 2018.
Financing activities
Our financing activities primarily consist of proceeds from and repayments on our term debt facilities, and revolving line of credit, payments of debt issue costs, transactions related with our common stock, and member contributions and distributions prior to the IPO.
Cash flows used in financing activities were $27.6 million for the year ended December 31, 2020 as compared to $17.5 million for the year ended December 31, 2019. The increase is primarily due to members’ distribution, repayment of term debt related to extinguishment of 2019 Credit Facilities and partial prepayment of 2020 Credit Facilities, and payments to Legacy Profit Interest Holders and Senior executives in exchange for Class B-1 units of QLH. The increase was partially offset by proceeds from the 2020 Credit Facilities and net proceeds from issuance of Class A common stock in connection with the IPO.
Cash flows used in financing activities were $17.5 million for the year ended December 31, 2019 as compared to $25.4 million for the year ended December 31, 2018. The decrease is on account of higher members’ distributions, repurchase of Class A units at QLH, and repayment of term debt partially offset by proceeds from the 2019 Credit Facilities and members’ contributions.
75
Senior secured credit facilities
As of December 31, 2020, we had $182.7 million of outstanding borrowings, net of deferred debt issuance costs of $3.7 million, under the 2020 Credit Facilities consisting of (i) a $210 million term loan and (ii) a $5.0 million revolving credit facility.
On September 23, 2020, we terminated and repaid in full the 2019 Credit Facilities, and QL entered into the 2020 Credit Agreement with JPMorgan Chase Bank, N.A., as lender and administrative agent, and the other lenders from time-to-time party thereto, providing for the 2020 Credit Facilities consisting of (i) the 2020 Term Loan Facility and (ii) the 2020 Revolving Credit Facility. On December 1, 2020, we prepaid $23.6 million of the term loan on the 2020 Credit Facility pursuant to the contractual repayment option not subject to a penalty.
Our obligations under the 2020 Credit Facilities are guaranteed by QLH and the domestic subsidiaries of QL, subject to certain exceptions. The 2020 Credit Facilities are secured by substantially all of the tangible and intangible assets of QL and the guarantors under the 2020 Credit Agreement (including, without limitation, all of the equity interests in QL held by QLH), subject to permitted liens and certain exceptions. QL and its subsidiaries are subject under the 2020 Credit Facilities to customary affirmative and negative covenants, including limitations on their ability to incur additional indebtedness and engage in certain business transactions, such as distributions and other restricted payments, acquisitions and other investments and mergers. In addition, the 2020 Credit Agreement contains two financial maintenance covenants, requiring QL to (1) comply with a maximum Consolidated Total Net Leverage Ratio (as defined in the 2020 Credit Agreement) and (2) maintain a minimum Consolidated Fixed Charge Coverage Ratio (as defined in the 2020 Credit Agreement). Events of default under the 2020 Credit Agreement include, among other things, nonpayment of principal when due; nonpayment of interest, fees or other amounts after a grace period; material inaccuracy of representations and warranties; violation of covenants (subject, in the case of certain affirmative covenants, to a grace period); cross-event of default to material debt; bankruptcy events; certain ERISA events; material judgments; change of control; and actual or asserted invalidity of the 2020 Credit Agreement and non-perfection of the security interest on any material portion of the collateral. If an event of default occurs, the lenders will be permitted to declare all outstanding borrowings immediately due and payable. There can be no guarantee that we will be in compliance with all covenants related to the 2020 Credit Facilities in the future and, if we are not in compliance with any such covenants, that waivers will be obtained.
Proceeds from the 2020 Term Loan Facility were used to refinance the 2019 Credit Facilities and pay related fees and expenses and fund a distribution to equity holders of QLH. The 2020 Revolving Credit Facility is available for general corporate purposes and includes a letter of credit sub-facility of up to $2.5 million. The 2020 Credit Facilities also include an uncommitted incremental facility, which, subject to certain conditions, provides for additional term loan facilities, an increase in commitments under the 2020 Term Loan Facility and/or an increase in commitments under the 2020 Revolving Credit Facility, in an aggregate amount of up to $50.0 million.
Contractual Obligations
The following table sets forth certain contractual obligations as of December 31, 2020 and the timing and effect that such commitments are expected to have on our liquidity and capital requirements in future periods.
|
|
|
Total |
|
|
Less than 1 year |
|
|
1-3 years |
|
|
3-5 years |
|
|
More than 5 years |
|
|||||
|
Long-term debt (1) |
|
$ |
186,375 |
|
|
$ |
- |
|
|
$ |
- |
|
|
$ |
186,375 |
|
|
$ |
- |
|
|
Operating lease obligations |
|
|
4,601 |
|
|
|
747 |
|
|
|
1,551 |
|
|
|
2,303 |
|
|
|
- |
|
|
Liabilities under the tax receivable agreement (2) |
|
|
22,498 |
|
|
|
- |
|
|
|
3,899 |
|
|
|
2,501 |
|
|
|
16,098 |
|
|
Total contractual obligations |
|
$ |
213,474 |
|
|
$ |
747 |
|
|
$ |
5,450 |
|
|
$ |
191,179 |
|
|
$ |
16,098 |
|
(1) See Part II, Item 8 “Financial Statements and Supplementary Data - Note 7 to the Consolidated Financial Statements – Long -term debt” of this Annual Report on Form 10-K.
(2) See Part II, Item 8 “Financial Statements and Supplementary Data - Note 11 to the Consolidated Financial Statements – Income Taxes” of this Annual Report on Form 10-K.
76
Our purchase (through Intermediate Holdco) of Class B-1 units of QLH from certain unitholders (including the Selling Class B-1 Unit Holders) in connection with the IPO as well as any future exchanges of Class of Class B-1 units of QLH, together with an equal number of shares of our Class B common stock, for shares of our Class A common stock (or, at our election, cash of an equivalent value), and the Pre-IPO Leveraged Distribution and other actual or deemed distributions by QLH to its members pursuant to the Exchange Agreement (See Part II, Item 8 “Financial Statements and Supplementary Data - Note 1 to the Consolidated Financial Statements – Organization and Background” of this Annual Report on Form 10-K) are expected to result in increases in our allocable tax basis in the assets of QLH. These increases in tax basis are expected to increase (for tax purposes) depreciation and amortization deductions allocable to us and, therefore, reduce the amount of tax that we otherwise would be required to pay in the future. This increase in tax basis may also decrease gain (or increase loss) on future dispositions of certain assets to the extent tax basis is allocated to those assets.
In connection with the IPO, we entered into the Tax Receivables Agreement (“TRA”) with Insignia, the Senior Executives, and White Mountains related to the tax basis step-up of the assets of QLH and certain net operating losses of Intermediate Holdco. The agreement requires us to pay Insignia and the Senior Executives 85% of the cash savings, if any, in U.S. federal, state and local income tax we realize (or are deemed to realize) as a result of (i) any increases in tax basis of assets of QLH resulting from any exchange of Class B-1 units of QLH, as discussed above, and (3) certain other tax benefits related to making our payments under the TRA. The TRA also requires us to pay White Mountains 85% of the amount of the cash savings, if any, in U.S. federal, state and local income tax that we realize (or are deemed to realize) as a result of the utilization of the net operating losses of Intermediate Holdco attributable to periods prior to the IPO and the deduction of any imputed interest attributable to our payment obligations under the TRA.
In addition to tax expenses, we will also make payments under the TRA, which we expect to be significant. We will account for the income tax effects and corresponding TRA’s effects resulting from future exchanges of Class B-1 units by us by recognizing an increase in our deferred tax assets, based on enacted tax rates at the date of the exchange. Further, we will evaluate the likelihood that we will realize the benefit represented by the deferred tax asset and, to the extent that we estimate that it is more likely than not that we will not realize the benefit, we will reduce the carrying amount of the deferred tax asset with a valuation allowance. The amounts to be recorded for both the deferred tax assets and the liability for our obligations under the TRA will be estimated at the time of any purchase or redemption as a reduction to shareholders’ equity, and the effects of changes in any of our estimates after this date will be included in net income (loss). Similarly, the effect of subsequent changes in the enacted tax rates will be included in net income (loss). Judgement is required in assessing the future tax consequences of events that have been recognized in our consolidated financial statements. A change in our assessment of such consequences, such as realization of deferred tax assets, changes in tax laws or interpretations thereof could materially impact our results.
Income taxes
Our income tax expense, deferred tax assets and TRA liability reflect management’s best assessment of estimated current and future taxes. Significant judgments and estimates are required in determining the consolidated income tax expense, deferred tax assets and TRA liability. Deferred income taxes arise from temporary differences between the tax basis of assets and liabilities and their reported amounts in the financial statements, which will result in taxable or deductible amounts in the future. In evaluating our ability to recover our deferred tax assets, we consider all available positive and negative evidence, including projected future taxable income and results of recent operations. In projecting future taxable income, we begin with historical results and incorporate assumptions about the amount of future state and federal pre-tax operating income adjusted for items that do not have tax consequences. The assumptions about future taxable income require significant judgment and are consistent with the plans and estimates we are using to manage our business.
77
Off-balance sheet arrangements
We have not entered into any off-balance sheet arrangements, as defined in Regulation S-K.
Recent accounting pronouncements
For a discussion of new accounting pronouncements recently adopted and not yet adopted, See Part II, Item 8 “Financial Statements and Supplementary Data - Note 2 to the Consolidated Financial Statements – Summary of significant accounting policies” of this Annual Report on Form 10-K.
Critical accounting policies and estimates
We prepare our consolidated financial statements in accordance with GAAP, and in doing so, we have to make estimates, assumptions and judgments affecting the reported amounts of assets, liabilities, revenues and expenses, as well as the related disclosure of contingent assets and liabilities. We base our estimates, assumptions and judgments on historical experience and on various other factors we believe to be reasonable under the circumstances. Different assumptions and judgments would change the estimates used in the preparation of our condensed consolidated financial statements, which, in turn, could change our results from those reported. We evaluate our critical accounting estimates, assumptions and judgments on an ongoing basis.
An accounting policy is considered to be critical if the nature of the estimates or assumptions is material due to the levels of subjectivity and judgment necessary to account for highly uncertain matters or the susceptibility of such matters to change, and the effect of the estimates and assumptions on financial condition or operating performance. The accounting policies we believe to reflect our more significant estimates, judgments and assumptions that are most critical to understanding and evaluating our reported financial results are: revenue recognition, goodwill and intangible assets, impairment of long-lived assets, equity-based compensation, income taxes, and payable to related parties under the tax receivable agreement.
Also, See Part II, Item 8 “Financial Statements and Supplementary Data - Note 2 to the Consolidated Financial Statements – Summary of significant accounting policies” of this Annual Report on Form 10-K.
Revenue recognition
For a description of our policies with respect to revenue recognition, see “—Key components of our results of operations—Revenue” in this section.
Business combinations
We account for business combinations in accordance with ASC 805, which requires, among other things, the acquiring entity in a business combination to recognize the fair value of all the assets acquired and liabilities assumed; the recognition of acquisition-related costs in the consolidated results of operations; the recognition of restructuring costs in the consolidated results of operations for which the acquirer becomes obligated after the acquisition date; and contingent purchase consideration to be recognized at their fair values on the acquisition date with subsequent adjustments recognized in the consolidated results of operations. The excess of the purchase price over the fair value of the identified assets and liabilities is recorded as goodwill. Operating results of the acquired entity are reflected in our consolidated financial statements from date of acquisition.
We perform valuations of assets acquired and liabilities assumed for an acquisition and allocate the purchase price to its respective net tangible and intangible assets. Determining the fair value of assets acquired and liabilities assumed requires management to use significant judgment and estimates including the selection of valuation methodologies, estimates of future revenue, costs, and cash flows, discount rates and selection of comparable companies and comparable transactions. For material acquisitions, we engage the assistance of valuation specialists in concluding on fair value measurements of certain assets acquired or liabilities assumed in a business combination. During the measurement period, which is not to exceed one year from the acquisition date, we may record adjustments to the assets acquired and liabilities assumed, with the corresponding offset to goodwill.
78
Goodwill is calculated as the excess of the purchase consideration paid in a business combination over the fair value of the assets acquired less liabilities assumed. Goodwill is not amortized, but rather is evaluated for impairment on an annual basis, or whenever indications of potential impairment exist. In the absence of any indications of potential impairment, the evaluation of goodwill is performed during the fourth quarter of each year. For the purposes of goodwill impairment testing, the Company has one reporting unit.
Goodwill impairment is the amount by which a reporting unit’s carrying value exceeds its fair value, not to exceed the carrying amount of goodwill. When testing goodwill for impairment, we first perform a qualitative assessment to determine whether it is necessary to perform a goodwill impairment test. We are required to perform a goodwill impairment test only if we conclude that it is more likely than not that the reporting unit’s fair value is less than the carrying value of its assets. Should this be the case, the next step is to identify whether a potential impairment exists by comparing the estimated fair value of the reporting unit with the carrying value, including goodwill. If the estimated fair value of the reporting unit exceeds the carrying value, goodwill is not considered to be impaired and no additional steps are necessary. If, however, the fair value of the reporting unit is less than its carrying value, then the amount of the impairment loss is the amount by which the reporting unit’s carrying value exceeds its fair value, not to exceed the carrying amount of goodwill.
For the years ended December 31, 2020 and 2019, there were no impairments recognized for goodwill.
Impairment of long-lived assets
Long-lived assets such as property and equipment and intangible assets are reviewed for impairment whenever events or changes in circumstances indicate that the carrying amount of an asset group may not be recoverable. Factors that we consider in deciding when to perform an impairment review include significant underperformance of our business in relation to expectations, significant negative industry or economic trends and significant changes or planned changes in the use of our assets. An impairment loss is recognized on long-lived assets in the consolidated statement of operations when indicators of impairment are present and the undiscounted cash flows estimated to be generated by those assets are less than the carrying amount of the assets. In such cases, the carrying value of these assets are adjusted to their estimated fair values and assets held for sale are adjusted to their estimated fair values less selling expenses.
For the years ended December 31, 2020 and 2019, there were no impairments recognized for long-lived assets.
Equity-based compensation
Prior to the IPO, certain of our employees (including the Founders) were granted Class B units, directly or indirectly, in QLH for services in connection with our operations and were considered to fall within the scope of equity-based compensation.
We use a contingent claims analysis framework that relies on a Black-Scholes option-pricing model to determine the fair value of the QLH Class B units. As of each valuation date of QLH Class B units, the contingent claims analysis framework relies on the fair value of the total equity of QLH; management’s expected term to an exit event such as an event leading to a sale or an initial public offering of QLH; an estimate of equity volatility applicable to units of QLH commensurate to the term from the valuation to an exit date; a dividend yield and a risk-free rate as of each valuation date; and a calculated breakpoint that is akin to a strike price, above which the QLH Class B units contractually share in the proceeds to QLH upon an exit event. Fair value of total equity for QLH is established using both a market multiples approach and a discounted cash flow method; as well as a price established from certain equity transactions with third-party investors. Compensation expense of those awards is recognized, over the requisite service period, which is generally the vesting period of the respective award. Forfeitures are accounted for as they occur. Upon IPO because all of the QLH Class B profits interests were either (1) settled or (2) cancelled and replaced upon the IPO, there are 0 QLH Class B units outstanding as of December 31, 2020.
79
We are subject to U.S. federal, state and foreign income taxes with respect to our allocable share of any taxable income or loss of QLH, as well as any stand-alone income or loss we generate. Significant judgment is required in determining our provision or benefit for income taxes and in evaluating uncertain tax positions.
We account for income taxes under the asset and liability method, which requires the recognition of deferred tax assets and liabilities for the expected future tax consequences of events included in our consolidated financial statements. Under this method, we determine deferred tax assets and liabilities on the basis of the differences between the consolidated financial statements and tax bases of assets and liabilities by using enacted tax rates in effect for the year in which the differences are expected to reverse. The effect of a change in tax rates on deferred tax assets and liabilities is recognized on our consolidated statement of operations in the period in which the enactment date occurs.
We record valuation allowances against our deferred tax assets when they are more likely than not to be realized. In making such a determination, we consider all available positive and negative evidence, including future reversals of existing taxable temporary differences, projected future taxable income, tax planning strategies and recent results of operations.
We recognize tax benefits from uncertain tax positions only if it is more likely than not the tax position will be sustained on examination by the taxing authorities based on the technical merits of the position. The tax benefits recognized from such positions are measured based on the largest benefit having a greater than 50% likelihood of being realized.
Payable to Related Parties Pursuant to the tax receivable agreement
As described in Part II, Item 8 “Financial Statements and Supplementary Data - Note 1 to the Consolidated Financial Statements – Organization and Background” of this Annual Report on Form 10-K, we are a party to the Tax Receivable Agreement (TRA) under which we are contractually committed to pay the non-controlling interest holders in QLH 85% of the amount of any tax benefits that we actually realize, or in some cases are deemed to realize as a result of certain transactions. Amounts payable under the TRA are contingent upon, among other things, the generation of future taxable income. The projection of future taxable income involves significant judgment. In projecting future taxable income, we consider our historical results and incorporate certain assumptions including the growth rate of the Company and the amount, character, and timing of the taxable income in the future. Actual taxable income may differ from our estimates, which could significantly impact the liability under the TRAs.
Additionally, we estimate the amount of TRA Payments expected to be paid within the next 12 months and classify this amount as current on our Consolidated Balance Sheets. This determination is based on our estimate of taxable income for the next fiscal year. To the extent our estimate differs from actual results, we may be required to reclassify portions of our liabilities under the TRA between current and non-current. If all of the remaining Class B-1 unitholders were to exchange all of their LLC Units, the Company would recognize a deferred tax asset of approximately $275 million and a TRA liability of approximately $293 million, assuming (i) that the Class B-1 unitholders redeemed or exchanged all of their Class B-1 Units immediately as of December 31, 2020 at a price of $39.07 per share of its Class A common stock, (ii) no material changes in relevant tax law, (iii) a constant corporate tax rate of 23.7%, (iv) that the Company earns sufficient taxable income in each year to realize on a current basis all tax benefits that are subject to the TRA, and (v) that the attributes from Intermediate Holdco are not limited pursuant to section 382 of the Internal Revenue Code. The actual amount of deferred tax assets and related liabilities are impacted by the timing of the exchanges, the valuation of Corporation, the price of the Company’s shares of Class A common stock at the time of the exchange, and the tax rates then in effect. The Company may elect to completely terminate the TRA early only with the written approval of each of a majority of its independent directors, although it has no plans to do so at this time. As a result, the Company would be required to make an immediate cash payment equal to the present value of the anticipated future tax benefits that are the subject of the TRA.
80
Item 7A. Quantitative and Qualitative Disclosures About Market Risk.
In the normal course of business, we are subject to market risks. Market risk represents the risk of loss that may impact our financial position due to adverse changes in financial market prices and rates.
Interest rate risk
The 2020 Credit Facilities bear interest at a variable rate. As a result, we may be exposed to fluctuations in interest rates to the extent of our outstanding borrowings under the 2020 Credit Facilities. A hypothetical 1.0% increase or decrease in the interest rate associated with the 2020 Credit Facilities would have resulted in a $0.5 million impact to interest expense for the period starting September 23, 2020 (the date on which we entered into the 2020 Credit Agreement) and ending December 31, 2020.
Concentrations of credit risk and of significant demand and supply partners
We maintain cash balances that can, at times, exceed amounts insured by the Federal Deposit Insurance Corporation. We have not experienced any losses in these accounts and believe we are not exposed to any unusual credit risk in this area based on the financial strength of institutions with which we maintain our deposits.
Our accounts receivable, which are unsecured, may expose us to credit risks due to collectability. We control credit risk by investigating the creditworthiness of all customers prior to establishing relationships with them, performing periodic reviews of the credit activities of those customers during the course of the business relationship, regularly analyzing the collectability of accounts receivable, and recording allowances for doubtful accounts when these receivables become uncollectible.
Customer concentrations for the years ended December 31, 2020 and 2019 consisted of one customer that accounted for approximately $132.3 million, or 23%, and $78.8 million, or 19%, of revenue, respectively. Our two largest customers accounted for approximately $23.7 million and $9.8 million, or 24% and 10%, respectively of the Company’s accounts receivable as of December 31, 2020 compared to one customer for approximately $4.7 million, or 8%, as of December 31, 2019.
The Company’s accounts payable can expose the Company to business risks such as supplier concentrations. For the year ended December 31, 2020, supplier concentrations consisted of one supplier that accounted for approximately $60.0 million, or 11% of total purchases and for the year ended December 31, 2019 two suppliers that accounted for approximately $84.6 million, or 24%, of total purchases. Our two largest suppliers accounted for approximately $24.5 million, or 25%, of the Company’s total accounts payable as of December 31, 2020 compared to $14.7 million, or 36%, as of December 31, 2019
81
Item 8. Financial Statements and Supplementary Data
Index to Consolidated Financial Statements
|
|
|
Page |
|
|
83 |
|
|
|
84 |
|
|
|
85 |
|
|
|
86 |
|
|
|
87 |
|
|
|
88 |
82
Report of Independent Registered Public Accounting Firm
To the Board of Directors and Stockholders of MediaAlpha, Inc.
Opinion on the Financial Statements
We have audited the accompanying consolidated balance sheets of MediaAlpha, Inc. and its subsidiaries (the “Company”) as of December 31, 2020 and 2019, and the related consolidated statements of operations, of redeemable Class A units, members’ equity (deficit), and stockholders' equity (deficit) and of cash flows for each of the three years in the period ended December 31, 2020, including the related notes and schedule of valuation and qualifying accounts and allowances for each of the three years in the period ended December 31, 2020 appearing under Item 15(a)(2) (collectively referred to as the “consolidated financial statements”). In our opinion, the consolidated financial statements present fairly, in all material respects, the financial position of the Company as of December 31, 2020 and 2019, and the results of its operations and its cash flows for each of the three years in the period ended December 31, 2020 in conformity with accounting principles generally accepted in the United States of America.
Basis for Opinion
These consolidated financial statements are the responsibility of the Company’s management. Our responsibility is to express an opinion on the Company’s consolidated financial statements based on our audits. We are a public accounting firm registered with the Public Company Accounting Oversight Board (United States) (PCAOB) and are required to be independent with respect to the Company in accordance with the U.S. federal securities laws and the applicable rules and regulations of the Securities and Exchange Commission and the PCAOB.
We conducted our audits of these consolidated financial statements in accordance with the standards of the PCAOB. Those standards require that we plan and perform the audits to obtain reasonable assurance about whether the consolidated financial statements are free of material misstatement, whether due to error or fraud.
Our audits included performing procedures to assess the risks of material misstatement of the consolidated financial statements, whether due to error or fraud, and performing procedures that respond to those risks. Such procedures included examining, on a test basis, evidence regarding the amounts and disclosures in the consolidated financial statements. Our audits also included evaluating the accounting principles used and significant estimates made by management, as well as evaluating the overall presentation of the consolidated financial statements. We believe that our audits provide a reasonable basis for our opinion.
/s/ PricewaterhouseCoopers LLP
Boston, Massachusetts
March 15, 2021
We have served as the Company’s auditor since 2017.
83
(In thousands, except share data and per share amounts)
|
|
|
As of December 31, |
|
|||||
|
|
|
2020 |
|
|
2019 |
|
||
|
|
|
|
|
|||||
|
Assets |
|
|
|
|
|
|
|
|
|
Current assets |
|
|
|
|
|
|
|
|
|
Cash and cash equivalents |
|
$ |
23,554 |
|
|
$ |
10,028 |
|
|
Accounts receivable, net of allowance for doubtful accounts |
|
|
96,295 |
|
|
|
56,012 |
|
|
Prepaid expenses and other current assets |
|
|
7,950 |
|
|
|
1,448 |
|
|
Total current assets |
|
$ |
127,799 |
|
|
$ |
67,488 |
|
|
Property and equipment, net |
|
|
762 |
|
|
|
755 |
|
|
Intangible assets, net |
|
|
15,551 |
|
|
|
18,752 |
|
|
Goodwill |
|
|
18,402 |
|
|
|
18,402 |
|
|
Deferred tax assets |
|
|
31,613 |
|
|
|
— |
|
|
Other non-current assets |
|
|
16,210 |
|
|
|
— |
|
|
Total assets |
|
$ |
210,337 |
|
|
$ |
105,397 |
|
|
Liabilities, Redeemable Class A units and Stockholders'/Members’ (Deficit) |
|
|
|
|
|
|
|
|
|
Current liabilities |
|
|
|
|
|
|
|
|
|
Accounts payable |
|
|
98,249 |
|
|
|
40,455 |
|
|
Accrued expenses |
|
|
9,206 |
|
|
|
6,584 |
|
|
Current portion of long-term debt |
|
|
— |
|
|
|
873 |
|
|
Total current liabilities |
|
$ |
107,455 |
|
|
$ |
47,912 |
|
|
Long-term debt, net of current portion |
|
|
182,668 |
|
|
|
96,665 |
|
|
Liabilities under tax receivable agreement |
|
|
22,498 |
|
|
|
- |
|
|
Other long-term liabilities |
|
|
2,834 |
|
|
|
319 |
|
|
Total liabilities |
|
$ |
315,455 |
|
|
$ |
144,896 |
|
|
Redeemable Class A units |
|
|
— |
|
|
|
74,097 |
|
|
Stockholders'/Members’ (deficit) equity: |
|
|
|
|
|
|
|
|
|
Members' Equity |
|
|
— |
|
|
|
79,547 |
|
|
Class A common stock, $0.01 par value - 1.0 billion shares authorized; 33.4 million shares issued and outstanding as of December 31, 2020 |
|
|
334 |
|
|
|
— |
|
|
Class B common stock, $0.01 par value - 100 million shares authorized;25.5 million shares issued and outstanding as of December 31, 2020 |
|
|
255 |
|
|
|
— |
|
|
Preferred stock, $0.01 par value - 50 million shares authorized; 0 shares issued and outstanding as of December 31, 2020 |
|
|
— |
|
|
|
— |
|
|
Additional paid-in capital |
|
|
384,611 |
|
|
|
— |
|
|
Accumulated Deficit |
|
|
(418,973 |
) |
|
|
(193,143 |
) |
|
Total stockholders' (deficit) attributable to MediaAlpha Inc., and members' (deficit) |
|
$ |
(33,773 |
) |
|
$ |
(113,596 |
) |
|
Non-controlling interests |
|
|
(71,345 |
) |
|
|
— |
|
|
Total stockholders'/members' deficit |
|
$ |
(105,118 |
) |
|
$ |
(113,596 |
) |
|
Total liabilities and stockholders'/members' deficit |
|
$ |
210,337 |
|
|
$ |
105,397 |
|
The accompanying notes are an integral part of these consolidated financial statements.
84
Consolidated Statements of Operations
(In thousands, except share data and per share amounts)
|
|
|
Year ended December 31, |
|
|||||||||
|
|
|
2020 |
|
|
2019 |
|
|
2018 |
|
|||
|
|
|
|
|
|
|
|
|
|
|
|
|
|
|
Revenue |
|
$ |
584,814 |
|
|
$ |
408,005 |
|
|
$ |
296,910 |
|
|
Cost and operating expenses |
|
|
|
|
|
|
|
|
|
|
|
|
|
Cost of revenue |
|
|
499,434 |
|
|
|
342,909 |
|
|
|
247,670 |
|
|
Sales and marketing |
|
|
20,483 |
|
|
|
13,822 |
|
|
|
11,739 |
|
|
Product development |
|
|
12,449 |
|
|
|
7,042 |
|
|
|
10,339 |
|
|
General and administrative |
|
|
32,913 |
|
|
|
19,391 |
|
|
|
7,843 |
|
|
Total cost and operating expenses |
|
|
565,279 |
|
|
|
383,164 |
|
|
|
277,591 |
|
|
Income from operations |
|
|
19,535 |
|
|
|
24,841 |
|
|
|
19,319 |
|
|
Other expense |
|
|
2,302 |
|
|
|
— |
|
|
|
— |
|
|
Interest expense |
|
|
7,938 |
|
|
|
7,021 |
|
|
|
1,194 |
|
|
Total other expense |
|
|
10,240 |
|
|
|
7,021 |
|
|
|
1,194 |
|
|
Income before income taxes |
|
|
9,295 |
|
|
|
17,820 |
|
|
|
18,125 |
|
|
Income tax (benefit) |
|
|
(1,267 |
) |
|
|
— |
|
|
|
— |
|
|
Net income |
|
$ |
10,562 |
|
|
$ |
17,820 |
|
|
$ |
18,125 |
|
|
Net income attributable to QLH prior to Reorganization Transactions |
|
|
19,166 |
|
|
|
17,820 |
|
|
|
18,125 |
|
|
Net (loss) attributable to non-controlling interest |
|
|
(4,238 |
) |
|
|
- |
|
|
|
- |
|
|
Net income attributable to MediaAlpha, Inc. |
|
$ |
(4,366 |
) |
|
$ |
- |
|
|
$ |
- |
|
|
Net (loss) per share of Class A common stock - basic and diluted (1) |
|
$ |
(0.14 |
) |
|
$ |
- |
|
|
$ |
- |
|
|
Weighted average shares of Class A common stock outstanding - basic and diluted (1) |
|
|
32,134,170 |
|
|
|
— |
|
|
|
— |
|
(1) Represents net loss per share of Class A common stock and weighted-average shares of Class A common stock outstanding for the portion of the period following the Reorganization Transactions and MediaAlpha, Inc.'s initial public offering described in Note 1- Organization. See Note 12 - Net Loss Per Share for additional details.
The accompanying notes are an integral part of these consolidated financial statements.
85
Consolidated Statements of Redeemable Class A units, Members’ Equity (Deficit), and Stockholders' Equity (Deficit)
(In thousands, except share data)
|
|
Redeemable Class A |
|
|
|
|
Members' Equity (deficit) |
|
|
Class A common stock |
|
|
Class B common stock |
|
|
Additional Paid-In Capital |
|
|
Accumulated Deficit |
|
|
Non- Controlling Interest |
|
|
Total shareholders’ |
|
|||||||||||||||||||||
|
|
Units |
|
|
Amount |
|
|
|
|
Amount |
|
|
Units |
|
|
Amount |
|
|
Units |
|
|
Amount |
|
|
Amount |
|
|
Amount |
|
|
Amount |
|
|
Equity (Deficit) |
|
||||||||||||
|
Balance at December 31, 2017 |
|
|
— |
|
|
$ |
— |
|
|
|
|
$ |
75,129 |
|
|
|
— |
|
|
$ |
— |
|
|
|
— |
|
|
$ |
— |
|
|
$ |
— |
|
|
$ |
(37,720 |
) |
|
$ |
— |
|
|
$ |
37,409 |
|
|
Equity-based compensation |
|
|
— |
|
|
|
— |
|
|
|
|
|
824 |
|
|
|
— |
|
|
|
— |
|
|
|
— |
|
|
|
— |
|
|
|
— |
|
|
|
— |
|
|
|
— |
|
|
|
824 |
|
|
Member distributions |
|
|
— |
|
|
|
— |
|
|
|
|
|
— |
|
|
|
— |
|
|
|
— |
|
|
|
— |
|
|
|
— |
|
|
|
— |
|
|
|
(15,878 |
) |
|
|
— |
|
|
|
(15,878 |
) |
|
Net income |
|
|
— |
|
|
|
— |
|
|
|
|
|
— |
|
|
|
— |
|
|
|
— |
|
|
|
— |
|
|
|
— |
|
|
|
— |
|
|
|
18,125 |
|
|
|
— |
|
|
|
18,125 |
|
|
Balance at December 31, 2018 |
|
|
— |
|
|
$ |
— |
|
|
|
|
$ |
75,953 |
|
|
|
— |
|
|
$ |
— |
|
|
|
— |
|
|
$ |
— |
|
|
$ |
— |
|
|
$ |
(35,473 |
) |
|
$ |
— |
|
|
$ |
40,480 |
|
|
Issuance of Class A units |
|
|
284,211 |
|
|
|
62,806 |
|
|
|
|
|
— |
|
|
|
— |
|
|
|
— |
|
|
|
— |
|
|
|
— |
|
|
|
— |
|
|
|
— |
|
|
|
— |
|
|
|
|
|
|
Class A units repurchased |
|
|
— |
|
|
|
— |
|
|
|
|
|
— |
|
|
|
— |
|
|
|
— |
|
|
|
— |
|
|
|
— |
|
|
|
— |
|
|
|
(62,806 |
) |
|
|
— |
|
|
|
(62,806 |
) |
|
Remeasurement of redeemable Class A units |
|
|
— |
|
|
|
11,291 |
|
|
|
|
|
— |
|
|
|
— |
|
|
|
— |
|
|
|
— |
|
|
|
— |
|
|
|
— |
|
|
|
(11,291 |
) |
|
|
— |
|
|
|
(11,291 |
) |
|
Class B units repurchased |
|
|
— |
|
|
|
— |
|
|
|
|
|
— |
|
|
|
— |
|
|
|
— |
|
|
|
— |
|
|
|
— |
|
|
|
— |
|
|
|
(5,753 |
) |
|
|
— |
|
|
|
(5,753 |
) |
|
Equity-based compensation |
|
|
— |
|
|
|
— |
|
|
|
|
|
3,594 |
|
|
|
— |
|
|
|
— |
|
|
|
— |
|
|
|
— |
|
|
|
— |
|
|
|
— |
|
|
|
— |
|
|
|
3,594 |
|
|
Member distributions |
|
|
— |
|
|
|
— |
|
|
|
|
|
|
|
|
|
— |
|
|
|
— |
|
|
|
— |
|
|
|
— |
|
|
|
— |
|
|
|
(95,640 |
) |
|
|
— |
|
|
|
(95,640 |
) |
|
Net income |
|
|
— |
|
|
|
— |
|
|
|
|
|
|
|
|
|
— |
|
|
|
— |
|
|
|
— |
|
|
|
— |
|
|
|
— |
|
|
|
17,820 |
|
|
|
— |
|
|
|
17,820 |
|
|
Balance at December 31, 2019 |
|
|
284,211 |
|
|
$ |
74,097 |
|
|
|
|
|
79,547 |
|
|
|
— |
|
|
$ |
— |
|
|
|
— |
|
|
$ |
— |
|
|
$ |
— |
|
|
$ |
(193,143 |
) |
|
$ |
— |
|
|
$ |
(113,596 |
) |
|
Remeasurement of redeemable Class A units |
|
|
— |
|
|
|
106,969 |
|
|
|
|
|
— |
|
|
|
— |
|
|
|
— |
|
|
|
— |
|
|
|
— |
|
|
|
— |
|
|
|
(106,969 |
) |
|
|
— |
|
|
|
(106,969 |
) |
|
Class B units repurchased |
|
|
— |
|
|
|
— |
|
|
|
|
|
— |
|
|
|
— |
|
|
|
— |
|
|
|
— |
|
|
|
— |
|
|
|
— |
|
|
|
(2,244 |
) |
|
|
— |
|
|
|
(2,244 |
) |
|
Equity-based compensation |
|
|
— |
|
|
|
— |
|
|
|
|
|
5,571 |
|
|
|
— |
|
|
|
— |
|
|
|
— |
|
|
|
— |
|
|
|
— |
|
|
|
— |
|
|
|
— |
|
|
|
5,571 |
|
|
Member distributions |
|
|
— |
|
|
|
— |
|
|
|
|
|
— |
|
|
|
— |
|
|
|
— |
|
|
|
— |
|
|
|
— |
|
|
|
— |
|
|
|
(131,417 |
) |
|
|
— |
|
|
|
(131,417 |
) |
|
Net income before Reorganization Transactions |
|
|
— |
|
|
|
— |
|
|
|
|
|
— |
|
|
|
— |
|
|
|
— |
|
|
|
— |
|
|
|
— |
|
|
|
— |
|
|
|
19,166 |
|
|
|
— |
|
|
|
19,166 |
|
|
Effect of Reorganization transactions |
|
|
(284,211 |
) |
|
|
(181,066 |
) |
|
|
|
|
(85,118 |
) |
|
|
26,141,535 |
|
|
|
261 |
|
|
|
30,308,492 |
|
|
|
303 |
|
|
|
370,304 |
|
|
|
— |
|
|
|
(79,735 |
) |
|
|
206,015 |
|
|
Establishment of liabilities under tax receivable agreement and related changes to deferred tax assets associated with increases in tax basis |
|
|
— |
|
|
|
— |
|
|
|
|
|
— |
|
|
|
— |
|
|
|
— |
|
|
|
— |
|
|
|
— |
|
|
|
(16,354 |
) |
|
|
— |
|
|
|
— |
|
|
|
(16,354 |
) |
|
Issuance of Class A common stock, net of issuance costs |
|
|
— |
|
|
|
— |
|
|
|
|
|
— |
|
|
|
7,027,606 |
|
|
|
71 |
|
|
|
— |
|
|
|
— |
|
|
|
111,881 |
|
|
|
— |
|
|
|
— |
|
|
|
111,952 |
|
|
Repurchase of Class B common stock |
|
|
— |
|
|
|
— |
|
|
|
|
|
— |
|
|
|
— |
|
|
|
— |
|
|
|
(4,772,449 |
) |
|
|
(48 |
) |
|
|
(96,858 |
) |
|
|
— |
|
|
|
12,538 |
|
|
|
(84,368 |
) |
|
Vesting of restricted stock units |
|
|
— |
|
|
|
— |
|
|
|
|
|
— |
|
|
|
230,047 |
|
|
2 |
|
|
|
— |
|
|
|
— |
|
|
|
— |
|
|
|
— |
|
|
|
— |
|
|
|
2 |
|
|
|
Equity- based compensation, net of forfeitures |
|
|
— |
|
|
|
— |
|
|
|
|
|
— |
|
|
|
(28,132 |
) |
|
|
— |
|
|
|
— |
|
|
|
— |
|
|
|
19,873 |
|
|
|
— |
|
|
|
90 |
|
|
|
19,963 |
|
|
Shares withheld on tax withholding on vesting of restricted stock units |
|
|
— |
|
|
|
— |
|
|
|
|
|
— |
|
|
|
— |
|
|
|
— |
|
|
|
— |
|
|
|
— |
|
|
|
(4,235 |
) |
|
|
— |
|
|
|
— |
|
|
|
(4,235 |
) |
|
Net (loss) after Reorganization Transactions |
|
|
— |
|
|
|
— |
|
|
|
|
|
— |
|
|
|
— |
|
|
|
— |
|
|
|
— |
|
|
|
— |
|
|
|
— |
|
|
|
(4,366 |
) |
|
|
(4,238 |
) |
|
|
(8,604 |
) |
|
Balance at December 31, 2020 |
|
|
— |
|
|
$ |
— |
|
|
|
|
$ |
— |
|
|
|
33,371,056 |
|
|
$ |
334 |
|
|
|
25,536,043 |
|
|
$ |
255 |
|
|
$ |
384,611 |
|
|
$ |
(418,973 |
) |
|
$ |
(71,345 |
) |
|
$ |
(105,118 |
) |
The accompanying notes are an integral part of these consolidated financial statements.
86
Consolidated Statements of Cash Flows
(In thousands)
|
|
Year ended December 31, |
|
||||||||||
|
|
|
2020 |
|
|
2019 |
|
|
2018 |
|
|||
|
|
|
|
|
|
|
|
|
|||||
|
Cash Flows from operating activities |
|
|
|
|
|
|
|
|
|
|
|
|
|
Net income |
|
$ |
10,562 |
|
|
$ |
17,820 |
|
|
$ |
18,125 |
|
|
Adjustments to reconcile net income to net cash provided by operating activities: |
|
|
|
|
|
|
|
|
|
|
|
|
|
Non-cash equity-based compensation expense |
|
|
24,745 |
|
|
|
2,308 |
|
|
|
824 |
|
|
Depreciation expense on property and equipment |
|
|
289 |
|
|
|
272 |
|
|
|
187 |
|
|
Amortization of intangible assets |
|
|
3,201 |
|
|
|
5,381 |
|
|
|
11,769 |
|
|
Amortization of deferred debt issuance costs |
|
|
1,228 |
|
|
|
665 |
|
|
|
15 |
|
|
Loss on extinguishment of debt |
|
|
1,998 |
|
|
|
- |
|
|
|
- |
|
|
Bad debt expense |
|
|
526 |
|
|
|
354 |
|
|
|
533 |
|
|
Deferred taxes |
|
|
(545 |
) |
|
|
- |
|
|
|
- |
|
|
Tax receivable agreement liability adjustments |
|
|
413 |
|
|
|
- |
|
|
|
- |
|
|
Changes in operating assets and liabilities: |
|
|
|
|
|
|
|
|
|
|
|
|
|
Accounts receivable |
|
|
(40,809 |
) |
|
|
(19,216 |
) |
|
|
(5,155 |
) |
|
Prepaid expenses and other current assets |
|
|
(6,482 |
) |
|
|
(162 |
) |
|
|
(262 |
) |
|
Other assets |
|
|
(4,375 |
) |
|
|
- |
|
|
|
- |
|
|
Accounts payable |
|
|
57,793 |
|
|
|
13,441 |
|
|
|
(5,373 |
) |
|
Accrued expenses |
|
|
2,866 |
|
|
|
1,280 |
|
|
|
1,986 |
|
|
Net cash provided by operating activities |
|
$ |
51,410 |
|
|
$ |
22,143 |
|
|
$ |
22,649 |
|
|
|
|
|
|
|
|
|
|
|
|
|
|
|
|
Cash flows from investing activities |
|
|
|
|
|
|
|
|
|
|
|
|
|
Purchases of property and equipment |
|
|
(296 |
) |
|
|
(146 |
) |
|
|
(630 |
) |
|
Acquisition of intangible assets |
|
|
- |
|
|
|
(148 |
) |
|
|
(10 |
) |
|
Purchase of cost method investment |
|
|
(10,000 |
) |
|
|
- |
|
|
|
- |
|
|
Net cash (used in) investing activities |
|
$ |
(10,296 |
) |
|
$ |
(294 |
) |
|
$ |
(640 |
) |
|
|
|
|
|
|
|
|
|
|
|
|
|
|
|
Cash flows from financing activities |
|
|
|
|
|
|
|
|
|
|
|
|
|
Proceeds received from: |
|
|
|
|
|
|
|
|
|
|
|
|
|
Proceeds from issuance of Class A common stock, net of underwriter commission |
|
|
124,179 |
|
|
|
- |
|
|
|
- |
|
|
Issuance of long-term debt |
|
|
210,000 |
|
|
|
100,000 |
|
|
|
- |
|
|
Revolving line of credit |
|
|
7,500 |
|
|
|
- |
|
|
|
3,000 |
|
|
Member contributions |
|
|
- |
|
|
|
62,806 |
|
|
|
- |
|
|
|
|
|
|
|
|
|
|
|
|
|
|
|
|
Payments made for: |
|
|
|
|
|
|
|
|
|
|
|
|
|
Repayments on revolving line of credit |
|
|
(7,500 |
) |
|
|
- |
|
|
|
(9,000 |
) |
|
Repayments on long-term debt |
|
|
(123,648 |
) |
|
|
(15,073 |
) |
|
|
(3,567 |
) |
|
Debt issuance costs |
|
|
(4,467 |
) |
|
|
(2,303 |
) |
|
|
- |
|
|
Repurchase of Class B units at QLH up to fair value |
|
|
(1,453 |
) |
|
|
(4,467 |
) |
|
|
- |
|
|
IPO costs to third parties |
|
|
(12,227 |
) |
|
|
- |
|
|
|
- |
|
|
Shares withheld for taxes on vesting of restricted stock units |
|
|
(4,235 |
) |
|
|
- |
|
|
|
- |
|
|
Repurchase of Class B common stock |
|
|
(84,320 |
) |
|
|
- |
|
|
|
- |
|
|
Redemption of Class A units |
|
|
- |
|
|
|
(62,806 |
) |
|
|
- |
|
|
Member distributions |
|
|
(131,417 |
) |
|
|
(95,640 |
) |
|
|
(15,878 |
) |
|
Net cash (used in) financing activities |
|
$ |
(27,588 |
) |
|
$ |
(17,483 |
) |
|
$ |
(25,445 |
) |
|
|
|
|
|
|
|
|
|
|
|
|
|
|
|
Net increase (decrease) in cash and cash equivalents |
|
|
13,526 |
|
|
|
4,366 |
|
|
|
(3,436 |
) |
|
Cash and cash equivalents, beginning of period |
|
|
10,028 |
|
|
|
5,662 |
|
|
|
9,098 |
|
|
Cash and cash equivalents, end of period |
|
$ |
23,554 |
|
|
$ |
10,028 |
|
|
$ |
5,662 |
|
|
|
|
|
|
|
|
|
|
|
|
|
|
|
|
Supplemental disclosures of cash flow information |
|
|
|
|
|
|
|
|
|
|
|
|
|
Cash paid during the period for: |
|
|
|
|
|
|
|
|
|
|
|
|
|
Interest |
|
$ |
6,040 |
|
|
$ |
6,399 |
|
|
$ |
1,201 |
|
|
Redemption of Class B units of QLH in excess of fair value |
|
$ |
791 |
|
|
$ |
1,286 |
|
|
$ |
— |
|
|
Non-cash Investing and Financing Activities: |
|
|
|
|
|
|
|
|
|
|
|
|
|
Establishment of liabilities under the tax receivable agreement in connection with the Reorganization Transactions |
|
$ |
(22,085 |
) |
|
$ |
— |
|
|
$ |
— |
|
|
Establishment of tax indemnification receivable in connection with the Reorganization Transactions |
|
$ |
(1,835 |
) |
|
$ |
— |
|
|
$ |
— |
|
|
Establishment of deferred tax assets in connection with the Reorganization Transactions |
|
$ |
(31,068 |
) |
|
$ |
— |
|
|
$ |
— |
|
|
|
|
|
|
|
|
|
|
|
|
|
|
|
The accompanying notes are an integral part of these consolidated financial statements.
87
Notes to the Consolidated Financial Statements
1. Organization and Background
Nature of business
MediaAlpha specializes in end customer acquisition for insurance carriers, distributors and other clients in various verticals, including property & casualty insurance, health insurance and life insurance. The corporate headquarters is in Los Angeles, California, with additional offices throughout the United States.
Organization and Initial Public Offering
MediaAlpha, Inc. was incorporated as a Delaware corporation on July 9, 2020 in contemplation of an initial public offering (“IPO”). Following a series of reorganization transactions, we serve as the ultimate holding company, by and through our wholly owned subsidiary Guilford Holdings, Inc. (“Intermediate Holdco”), of QL Holdings LLC (“QLH”) and its subsidiaries. QLH was formed on March 7, 2014 as a Delaware limited liability company.
On October 30, 2020 we completed our IPO and sold 7,027,606 shares of Class A Common Stock at a public offering price of $19.00 per share, which includes 769,104 shares sold in connection with the full exercise of the underwriter’s option to purchase additional shares. We received $124.2 million, net of underwriting discounts and commissions.
In connection with the completion of our IPO, we completed a series of reorganization transactions (“Reorganization Transactions”) pursuant to a reorganization agreement by and among Parent Company, Intermediate Holdco, QLH, and certain other parties. The Reorganization Transactions included the following:
|
|
• |
the amendment and restatement of the articles of incorporation and bylaws of Parent Company (the Amended and Restated Certificate of Incorporation and the Amended and Restated Bylaws) pursuant to which we amended and restated our certificate of incorporation to authorize two classes of common stock, Class A common stock and Class B common stock; |
|
|
• |
the amendment and restatement of QLH’s limited liability company agreement (the Fourth Amended and Restated Limited Liability Agreement of QLH) to, among other things, convert legacy Class A units of QLH held by Intermediate Holdco into voting, managing member Class A-1 units and to convert all other legacy Class A and Class B units held by Insignia, the Senior Executives and Legacy Profit Interests Holders into non-managing member, non-voting Class B-1 units of QLH; |
|
|
• |
the contribution by White Mountains Capital, Inc. of Intermediate Holdco to Parent Company in exchange for 24,142,096 shares of Class A common stock of Parent Company; and |
|
|
• |
the issuance of 30,308,492 shares of Class B common stock to Insignia, Senior Executives and the Legacy Profit Interests Holders, and the issuance of 1,999,439 shares of Class A common stock to the Legacy Profit Interests Holders. |
As a result, MediaAlpha, Inc., through Intermediate Holdco, is the sole managing member of QLH and consolidates the financial results of QLH and its subsidiaries and reports a non-controlling interest related to the portion of Class B-1 Units not owned by MediaAlpha, Inc. The Reorganization was considered a transaction between entities under common control. As a result, the financial statements for periods prior to our IPO and the Reorganization Transactions have been adjusted to combine the previously separate entities for presentation purposes.
88
On October 27, 2020, the Company entered into an exchange agreement with Insignia and the Senior Executives, which each hold Class B common stock. Pursuant to and subject to the terms of the exchange agreement and the fourth amended and restated limited liability company agreement of QLH, holders of Class B common stock, from time to time, may exchange one Class B share, together with a corresponding Class B-1 unit, for one share of the Company’s Class A common stock (or, at the Company’s election, cash of an equivalent value).
We have reserved for issuance 25,536,043 shares of our Class A common stock for potential exchange in the future for Class B-1 units, which equals the aggregate number of shares of Class B common stock outstanding. Exchange of the Class B-1 units and Class B common stock is at the unit holder's discretion and the exchange does not have fixed or determinable dates or prices.
Tax Receivables Agreement
In connection with our IPO, we entered into a tax receivables agreement (“TRA”) with Insignia, the Senior Executives, and White Mountains related to the tax basis step-up of the assets of QLH and certain net operating losses of Intermediate Holdco. The agreement requires us to pay Insignia and the Senior Executives 85% of the cash savings, if any, in U.S. federal, state and local income tax we realize (or are deemed to realize) as a result of (i) any increases in tax basis following our purchase (through Intermediate Holdco) of Class B-1 units of QLH from certain unitholders (including the Selling Class B-1 Unit Holders) in connection with the IPO, as well as any future exchanges described above; (ii) the pre-IPO leveraged distribution and actual or deemed other distributions by QLH to its members that result in tax basis adjustments to the assets of QLH, and (iii) certain other tax benefits attributable to payments under the TRA itself.
The TRA also requires us to pay White Mountains 85% of the amount of the cash savings, if any, in U.S. federal, state and local income tax that we realize (or are deemed to realize) as a result of the utilization of the net operating losses of Intermediate Holdco attributable to periods prior to the IPO and the deduction of any imputed interest attributable to our payment obligations under the TRA.
Impact of COVID-19
The COVID-19 pandemic continues to impact the United States and many countries around the world. The outbreak and government measures taken in response have had a significant impact, both direct and indirect, on businesses and commerce. The future progression of the pandemic and its effects on our business and operations are uncertain and we are unable to estimate the full impact at this time. However, our travel vertical has experienced a decline in revenue and, although we do not believe the situation will materially impact our liquidity or capital position, we do not expect revenue from the travel vertical to recover in the foreseeable future.
We are monitoring the potential impact of the COVID-19 pandemic on our business, results of operations and financial condition. To date, we have not experienced material business disruptions or incurred impairment losses in the carrying values of our assets as result of the pandemic and are not aware of any specific related event or circumstance that would require us to revise the estimates reflected in these consolidated financial statements. The extent to which the COVID-19 pandemic will further impact our business, results of operations and financial condition, will depend on future developments that are highly uncertain, including as a result of new information that may emerge concerning COVID-19, the actions taken to contain or treat it, and the duration and intensity of the related effects.
2. Summary of significant accounting policies
Basis of presentation
The consolidated financial statements have been prepared in accordance with accounting principles generally accepted in the United States of America (“US GAAP”) and pursuant to the rules and regulations of the Securities and Exchange Commission. The consolidated financial statements include the accounts of MediaAlpha, Inc. and its consolidated subsidiaries. All intercompany transactions and balances have been eliminated in consolidation.
89
As discussed in Note 1, as a result of our IPO and Reorganization, MediaAlpha, Inc., through Intermediate Holdco, is the sole managing member of QLH and consolidates the financial results of QLH and its subsidiaries and reports a non-controlling interest related to the portion of Class B-1 Units not owned by MediaAlpha, Inc., which reduces net income attributable to holders of MediaAlpha Inc.’s Class A common stock. The Reorganization was considered a transaction between entities under common control. As a result, the financial statements for periods prior to our IPO and the Reorganization Transactions have been adjusted to combine the previously separate entities for presentation purposes.
Use of estimates
The preparation of consolidated financial statements in conformity with US GAAP requires management to make estimates and assumptions that affect the reported amounts of certain assets and liabilities, certain disclosures at the date of the consolidated financial statements, as well as the reported amounts of revenue and expenses during the reporting period. Significant estimates and assumptions reflected in these consolidated financial statements include, but are not limited to, valuation of goodwill and long-lived assets for impairment, inputs into the valuation of our equity-based compensation related QLH Class B Units, estimates of deferred tax assets related to the step-up in basis under the TRA, and the associated liability under the TRA. Significant estimates affecting the consolidated financial statements have been prepared on the basis of the most current and best available information, including historical experience, known trends and other market-specific or other relevant factors that we believe to be reasonable. On an ongoing basis, management evaluates its estimates, as there are changes in circumstances, facts and experience. Changes in estimates are recorded in periods which they become known. The full extent to which the COVID-19 pandemic will directly or indirectly impact our business, results of operations and financial condition, including revenues, expenses, reserves and allowances, asset recoverability, and employee-related amounts, will depend on future developments that are highly uncertain, including as a result of new information that may emerge concerning COVID-19 and the actions taken to contain it or treat COVID-19, as well as the economic impact on our customers and markets. We have made estimates of the impact of COVID-19 within our financial statements and there may be changes to those estimates in future periods. Actual results may differ from these estimates.
Revenue recognition
The Company generates revenue by delivering qualified calls, leads and click transactions (“Consumer Referrals”) to its buyer customers who acquire Consumer Referrals (“customers” or “buyers”) on its technology platform.
On January 1, 2018, the Company adopted Accounting Standards Codification (“ASC”) 606, Revenue from Contracts with Customers (“ASC 606”), as issued by the Financial Accounting Standards Board ("FASB"), which governs how the Company recognizes revenue derived from the Consumer Referrals. The Company recognizes revenue when the Company transfers promised goods or services to customers in an amount that reflects the consideration to which the Company is entitled. The Company recognizes revenue pursuant to the framework contained in ASC 606: (i) identify the contract with a customer; (ii) identify the performance obligations in the contract, including whether they are distinct in the context of the contract; (iii) determine the transaction price, including the constraint on variable consideration; (iv) allocate the transaction price to the performance obligations in the contract; and (v) recognize revenue when the Company satisfies the performance obligations.
Generally, the Company’s contracts with buyers specify a period of time covered and a budget governing spend limits. Many of our agreements with our partners have no fixed term and are cancellable upon 30 or 60 days’ notice without penalty. As a result, the transaction price for the delivery of each Consumer Referral is determined and recorded in real time and no estimation of variable consideration or future consideration is required. The transaction with the Company’s customer is for the delivery of Consumer Referrals.
The Company has assessed the services promised in its contracts with customers and has identified one performance obligation, which is the delivery of Consumer Referrals that meet its customers’ specifications.
90
Consumer Referral transactions are summarized as follows:
|
|
• |
Click revenue is recognized on a pay-per-click basis and revenue is earned and recognized when a consumer clicks on a listed buyer’s advertisement, presented subsequent to a consumer search (e.g. auto insurance quote search or health insurance quote search). |
|
|
• |
Call revenue is earned and recognized when a consumer transfers to a call buyer and remains engaged for a requisite duration of time, as specified by each buyer. |
|
|
• |
Lead revenue is recognized when the Company delivers data leads to buyer. Data leads are generated through insurance carriers or insurance-focused research destination websites who make the data leads available to buy through the Company’s platform or when users complete a full quote request on the Company’s proprietary websites. Delivery occurs at the time of lead transfer. |
The Company satisfies its performance obligation as services are provided. The Company does not promise to provide any other significant goods or services to its customers after delivery. The Company generally does not offer a right of return.
The Company bills customers monthly in arrears for Consumer Referrals delivered during the preceding month. The Company’s standard payment terms are 30-60 days. Consequently, the Company does not have significant financing components in its arrangements.
In the Company’s open platform transactions, the Company has control over the Consumer Referrals that are sold to buyers. In these arrangements, the Company has separate agreements with its customers and suppliers (or “supply partners” or “sellers”). Suppliers are neither party to the contractual arrangements with the Company’s customers, nor are the suppliers the beneficiaries of the Company’s customer agreements. The Company earns fees from its customers and separately pays internet search companies to drive consumers to the Company’s proprietary websites and suppliers. The Company is the principal in the open platform transactions. As a result, the fees paid by its customers are recognized as revenue and the fees paid to its suppliers are included in cost of revenue.
With respect to our private platform transactions, buyers and supply partners contract with one another directly and leverage the Company’s platform to facilitate transparent, real-time transactions utilizing the reporting and analytical tools available to them through the Company’s platform. The Company charges a platform fee on the Consumer Referrals transacted. The Company acts as an agent in the private platform transactions and recognizes revenue on the platform fee received. The Company recognizes revenue concurrent with Consumer Referral transactions that are facilitated by the platform. There are no separate payments made by the Company to supply partners in the Company’s private platform transactions. The Company has elected to exclude sales tax from revenue as permitted by ASC 606-10.
Cash and cash equivalents
Cash and cash equivalents consist entirely of cash deposits.
Accounts receivable
The Company provides credit to customers in the ordinary course of business and believes its credit policies are prudent and reflect industry practices and business risk. Accounts receivable are stated at amounts due from customers. The Company reviews accounts receivable on a periodic basis and determines an allowance for doubtful accounts by considering a number of factors including the length of time trade accounts receivable are past due, the Company’s previous loss history, the customer’s current ability to pay its obligation to the Company, and the condition of the general economy and the industry as a whole. The Company writes off outstanding accounts receivable against the allowance when the Company has exhausted all collection efforts and the potential recovery is considered remote. Payments subsequently received on such receivables are credited to the allowance for doubtful accounts.
The Company reported an allowance for doubtful accounts of $0.4 million as of December 31, 2020 and $0.3 million as of December 31, 2019.
91
Concentrations of Credit Risk and of Significant Customers and Suppliers
Financial instruments that potentially expose the Company to concentrations of credit risk consist primarily of cash and cash equivalents and accounts receivable. The Company maintains cash balances that can, at times, exceed amounts insured by the Federal Deposit Insurance Corporation. The Company has not experienced any losses in these accounts, and believes it is not exposed to unusual credit risk beyond the normal credit risk in this area based on the financial strength of institutions with which the Company maintains its deposits.
The Company’s accounts receivable, which are unsecured, may expose the Company to credit risk due to collectability. The Company controls credit risk by investigating the creditworthiness of all customers prior to establishing relationships with them, performing periodic reviews of the credit activities of those customers during the course of the business relationship, regularly analyzing the collectability of accounts receivables, and recording allowances for doubtful accounts when these receivables become uncollectible.
Customer concentrations for the years ended December 31, 2020 and 2019 consisted of one customer that accounted for approximately $132.3 million, or 23%, and $78.8 million, or 19%, of revenue, respectively. Our two largest customers accounted for approximately $23.7 million and $9.8 million, or 24% and 10%, respectively of the Company’s accounts receivable as of December 31, 2020 compared to one customer for approximately $4.7 million, or 8%, as of December 31, 2019.
The Company’s accounts payable can expose the Company to business risks such as supplier concentrations. For the year ended December 31, 2020, supplier concentrations consisted of one supplier that accounted for approximately $60.0 million, or 11% of total purchases and for the twelve months ended December 31, 2019 two suppliers that accounted for approximately $84.6 million, or 24%, of total purchases. Our two largest suppliers accounted for approximately $24.5 million, or 25%, of the Company’s total accounts payable as of December 31, 2020 compared to $14.7 million, or 36%, as of December 31, 2019.
Property and equipment
Property and equipment are stated at cost, net of accumulated depreciation and amortization. Depreciation and amortization expense is calculated using the straight-line method over the estimated useful lives of each asset as follows:
|
|
|
Estimated useful life |
|
Leasehold improvements |
|
The shorter of their lease term or the estimated useful life of the improvements |
|
Computer |
|
3 years |
|
Furniture and fixtures |
|
3 years |
Betterments, renewals, and extraordinary repairs that materially extend the useful lives of assets are capitalized; other repairs and maintenance charges are expensed as incurred. The cost and related accumulated depreciation and amortization applicable to assets retired are removed from the accounts, and the gain or loss on disposition is recognized in the consolidated statement of operations for the period.
Internal-use software development costs
The Company capitalizes certain costs incurred in connection with developing internal use software. The Company expenses all costs that relate to the planning and post-implementation phases of development as operating expenses. Costs incurred in the development phase are capitalized and amortized over the product’s estimated useful life. Costs associated with the repair or maintenance of existing software is included in operating expenses. Amortization expense for capitalized internal-use software development costs is calculated using the straight-line method over the estimated useful life of the software, which is approximately three years.
92
As the Company’s software product is mature, costs incurred on development of new features and functionality in 2020 and 2019 were insignificant; therefore, the Company did not capitalize any software development costs during the period.
Business Combinations
The Company accounts for business combinations in accordance with ASC Topic 805, which requires, among other things, the acquiring entity in a business combination to recognize the fair value of all the assets acquired and liabilities assumed; the recognition of acquisition-related costs in the consolidated results of operations; the recognition of restructuring costs in the consolidated results of operations for which the acquirer becomes obligated after the acquisition date; and contingent purchase consideration to be recognized at their fair values on the acquisition date with subsequent adjustments recognized in the consolidated results of operations. The excess of the purchase price over the fair value of the identified assets and liabilities is recorded as goodwill. Operating results of the acquired entity are reflected in the Company’s consolidated financial statements from date of acquisition.
Goodwill and intangible assets
Goodwill is calculated as the excess of the purchase consideration paid in a business combination over the fair value of the assets acquired less liabilities assumed. Goodwill is not amortized, but rather is evaluated for impairment on an annual basis, or whenever indications of potential impairment exist. In the absence of any indications of potential impairment, the evaluation of goodwill is performed during the fourth quarter of each year. For the purposes of goodwill impairment testing, the Company has one reporting unit.
Goodwill impairment is the amount by which a reporting unit’s carrying value exceeds its fair value, not to exceed the carrying amount of goodwill. When testing goodwill for impairment, the Company first performs a qualitative assessment to determine whether it is necessary to perform a goodwill impairment test. The Company is required to perform a goodwill impairment test only if it concludes that it is more likely than not that the reporting unit’s fair value is less than the carrying value of its assets. Should this be the case, the next step is to identify whether a potential impairment exists by comparing the estimated fair value of the reporting unit with the carrying value, including goodwill. If the estimated fair value of the reporting unit exceeds the carrying value, goodwill is not considered to be impaired and no additional steps are necessary. If, however, the fair value of the reporting unit is less than its carrying value, then the amount of the impairment loss is the amount by which the reporting unit’s carrying value exceeds its fair value, not to exceed the carrying amount of goodwill.
Finite-lived intangible assets include technology and intellectual property, customer relationships, costs to acquire third-party publishers, non-compete agreements and domain names stated net of accumulated amortization or impairment charges. These assets are amortized over their estimated useful lives based on methods that approximate the pattern in which the economic benefits are expected to be realized. The amortization periods range from 2 years to 10 years.
For the years ended December 31, 2020 and 2019, there were no impairments recognized for goodwill or intangible assets, based on the testing performed at the end of each fiscal year.
Impairment of long-lived assets
Long-lived assets such as property and equipment are reviewed for impairment whenever events or changes in circumstances indicate that the carrying amount of an asset may not be recoverable. Factors that the Company considers in deciding when to perform an impairment review include significant underperformance of the business in relation to expectations, significant negative industry or economic trends, and significant changes or planned changes in the use of the assets. An impairment loss is recognized on long-lived assets in the consolidated statements of operations when indicators of impairment are present and the undiscounted cash flows estimated to be generated by those assets are less than the carrying amount of the assets. In such cases, the carrying value of these assets are adjusted to their estimated fair values and assets held for sale are adjusted to their estimated fair values less selling expenses.
93
For the years ended December 31, 2020 and 2019, there were no impairments recognized for long-lived assets.
Accounts payable
Accounts payable are obligations to pay for goods or services that have been acquired in the ordinary course of business. Accounts payable are recognized initially at their settlement value and are classified as current liabilities if payment is due within one year or less. Accounts payable as of December 31, 2020 and 2019 consist of payments to suppliers and costs to acquire traffic from search engines.
Deferred debt issuance costs
Costs incurred that are directly associated with obtaining access to capital under credit facilities are capitalized and amortized to interest expense over the terms of the applicable debt agreements using the effective interest method. Unamortized deferred costs are presented as a direct deduction from the carrying amount of the related long-term debt on the accompanying consolidated balance sheets.
Deferred initial public offering costs
Deferred offering costs are capitalized, and consist of legal, consulting, banking, and accounting fees directly attributable to the IPO. The Company reclassified $12.2 million for the year ended December 31, 2020 and $0.0 for the year ended December 31, 2019 and 2018, of offering costs into stockholders’ equity as a reduction of the net proceeds received from the IPO. As of December 31, 2020 and 2019, no offering costs were deferred on the consolidated balance sheets.
Equity-based compensation
The Company incurs equity-based compensation expense primarily from restricted stock units (“RSUs”), and unvested LLC Units of QLH. Equity awards to employees are measured and recognized in the consolidated financial statements based on the fair value of the award on the grant date. For awards subject to service conditions only, the fair value of the award on the grant date is expensed on a straight-line basis over the requisite service period of the award. The grant date fair value of RSUs is determined using the market closing price of Class A common stock on the date of grant. The Company records forfeitures related to equity-based compensation for its awards based on actual forfeitures as they occur.
Prior to the IPO, the Company maintained a QLH Class B Restricted Unit Plan (the "QLH Plan"), whereby QLH had the authority to issue units in the form of profits interests to directors, employees, managers, independent contractors, and advisors of QLH and its subsidiaries upon approval of the Board of Directors. The Class B units were equity-classified share-based payments and were recognized utilizing the straight-line method. The fair value of the QLH Class B profits interests was determined on the grant date using the option pricing model. As per the original award terms, all unvested Profit Interest Units on the IPO date were exchanged into QLH Class B-1 units, which when vested, together with Class B common stock are exchangeable for Class A common stock. The awards are no longer in the form of profits interests post-IPO.
The Company classifies equity-based compensation expense in its consolidated statements of operations in the same manner in which the recipient’s payroll costs are classified or in which the recipient’s service payments are classified.
Segment information
The Company operates in the United States and in a single operating segment. Operating segments are defined as components of an enterprise about which separate financial information is available that is evaluated regularly by the chief operating decision maker, or decision-making group, in deciding how to allocate resources and in assessing performance. The Company’s chief operating decision maker is its chief executive officer, who reviews financial information presented on a consolidated basis for purposes of allocating resources and evaluating financial performance. Since the Company operates in one operating segment, all required financial segment information can be found in the consolidated financial statements.
94
Prior to the IPO, Members’ equity, specifically the legacy Class A and Class B units in QLH, was held by related parties. Subsequent to the IPO, Class B common stock is also held by related parties. Therefore, equity transactions recorded in Members’ equity or Class B common stock are related party transactions. We are also party to the Tax Receivable Agreements under which we are contractually committed to pay the Class B-1 unit holders in QLH 85% of the amount of any tax benefits that we actually realize, or in some cases are deemed to realize as a result of certain transactions.
Leases
The Company categorizes non-cancellable leases at their inception as either operating or capital leases. Costs for operating leases that include incentives such as payment escalations or rent abatements are recognized on a straight-line basis over the term of the lease. Additionally, inducements received from lessors are treated as a reduction of costs over the term of the agreement.
Valuation of redeemable Class A units
Mezzanine equity classification is required in accordance with ASC 480, Distinguishing Liabilities from Equity when an equity instrument is redeemable (1) at a fixed or determinable price on a fixed or determinable date, (2) at the option of the shareholder, or (3) upon the occurrence of an event that is not solely within the control of the reporting entity.
Prior to IPO, QLH’s Class A units held by Insignia Capital Group featured redemption rights that were considered to be outside of the Company’s control and subject to occurrence of uncertain future events. Conditionally redeemable Class A units (including Class A units that feature redemption rights that are either within the control of the holder or subject to redemption upon the occurrence of uncertain events not solely within QLH’s control) are classified as temporary equity. At all other times, shares of Class A units were classified as members’ (deficit) equity. QLH recognizes changes in redemption value immediately as they occur and will adjust the carrying value of the security to equal the redemption value at the end of each reporting period. Increases or decreases in the carrying amount of redeemable Class A units are effected by charges to accumulated deficit.
The redeemable Class A units are not part of the Company’s equity structure subsequent to the IPO and Reorganization Transaction and thus are presented only in the comparative balance sheet.
Fair value measurements
The Company accounts for the fair value of its financial instruments in accordance with FASB ASC Topic 820, Fair Value Measurements and Disclosures (“ASC 820”). Non-recurring, non-financial assets and liabilities are also accounted for under the provisions of ASC 820.
ASC 820 defines fair value, establishes a framework for measuring fair value under US GAAP and enhances disclosures about fair value measurements. Fair value is defined as the exchange price that would be received for an asset or paid to transfer a liability (an exit price) in the principal or most advantageous market for an asset or liability in an orderly transaction between market participants on the measurement date. Valuation techniques used to measure fair value must maximize the use of observable inputs and minimize the use of unobservable inputs. Financial assets and liabilities carried at fair value are to be classified and disclosed in one of the following three levels of the fair value hierarchy, of which the first two are considered observable and the last unobservable:
Level 1 Quoted prices in active markets for identical assets or liabilities.
Level 2 Observable inputs (other than Level 1 quoted prices), such as quoted prices in active markets for similar assets or liabilities, quoted prices in markets that are not active for identical or similar assets or liabilities, or other inputs that are observable or can be corroborated by observable market data.
Level 3 Unobservable inputs that are supported by little or no market activity and that are significant to determining the fair value of the assets or liabilities, including pricing models, discounted cash flow methodologies and similar techniques.
95
The carrying values of the Company’s accounts receivable, accounts payable and accrued expenses and other current liabilities approximate their fair values due to the short-term nature of these assets and liabilities. Although market quotes for the fair value of long-term debt related to the Company’s revolving line of credit and term loan are not readily available, the Company believes its carrying value approximates fair value because the interest rates are variable and reflective of market rates and the debt may be repaid, in full or in part, without any penalty.
Sales taxes
ASC 606-10 provides that the presentation of taxes assessed by a governmental authority, which are directly imposed on revenue-producing transactions (i.e., sales, use, and excise taxes) between a seller and a customer, on a gross basis (included in revenue and costs), or on a net basis (excluded from revenue), is a management decision on accounting policies that should be disclosed. In addition, for any such taxes that are reported on a gross basis, the amounts of those taxes should be disclosed in the consolidated financial statements for each period for which a consolidated statement of operations is presented, if those amounts are significant. The Company has elected to exclude sales taxes from revenue.
Cost of revenue
The Company’s cost of revenue is comprised primarily of payments to suppliers and traffic acquisition costs paid to top tier search engines as well as telephony infrastructure costs, internet and hosting, merchant fees, salaries and related expenses, amortization expense and other expenses. For the years ended December 31, 2020,2019 and 2018 cost of revenue was $499.4 million, $342.9 million, and $247.7 million respectively. The costs consisted primarily of 417.7 million of payments to suppliers and $74.4 million of traffic acquisition costs during 2020, $284.5 million of payments to suppliers and $54.2 million of traffic acquisition costs during 2019, and $210.1 million of payments to suppliers and $34.0 million of traffic acquisition costs during 2018. Other costs including salaries and related expenses, internet and hosting, amortization, and other expenses were $7.4 million, $4.2 million, and $3.5 million for the years ended December 31, 2020, 2019, and 2018, respectively.
Income taxes
The Company is taxed as a corporation and pays corporate federal, state and local taxes on income allocated to it from QLH subsequent to the Reorganization Transactions based upon MediaAlpha, Inc.’s economic interest held in QLH. QLH is treated as a pass-through partnership for income tax reporting purposes and not subject to federal income tax. Accordingly, the Company is not liable for income taxes on the portion of QLH’s earnings not allocated to it.
The Company accounts for income taxes under the asset and liability method, which requires the recognition of deferred tax assets and liabilities for the expected future tax consequences of events included in our consolidated financial statements. Under this method, we determine deferred tax assets and liabilities on the basis of the differences between the consolidated financial statements and tax bases of assets and liabilities by using enacted tax rates in effect for the year in which the differences are expected to reverse. The effect of a change in tax rates on deferred tax assets and liabilities is recognized on our consolidated statement of operations in the period in which the enactment date occurs. The Company records valuation allowances against our deferred tax assets when they are more-likely-than-not to be realized. In making such a determination, we consider all available positive and negative evidence, including future reversals of existing taxable temporary differences, projected future taxable income, tax planning strategies and recent results of operations.
The Company recognizes interest and penalties related to the liability for unrecognized tax benefits, if any, as a component of the income tax expense line in the accompanying consolidated statement of operations.
The Company records uncertain tax positions on the basis of a two-step process: (1) determine whether it is more likely than not that the tax positions will be sustained on the basis of the technical merits of the position and (2) for those tax positions that meet the more-likely-than-not recognition threshold, recognize the largest amount of tax benefit that is more than 50 percent likely to be realized upon ultimate settlement with the related tax authority. As of the years ended December 31, 2020, the Company recognized $2.3 million in liabilities for uncertain tax positions included within other long-term liabilities on our consolidated balance sheet.
96
In January 2018, the FASB released guidance on the accounting for tax on the global intangible low-taxed income (“GILTI”) provisions of the Act. The GILTI provisions impose a tax on foreign income in excess of a deemed return on tangible assets of foreign corporations. The guidance allows companies to make an accounting policy election to either (i) account for GILTI as a component of tax expense in the period in which they are subject to the rules (the period cost method), or (ii) account for GILTI in the Company’s measurement of deferred taxes (the deferred method). After completing the analysis of the GILTI provisions, we elected to account for GILTI using the period cost method.
Non-controlling interest
In connection with the Reorganization Transactions, the Company became, the sole managing member of QLH and as a result consolidates the results of operations of QLH. In accordance with the QLH’s limited liability company agreement, the Company allocates the share of net income (loss) to the non-controlling interest pari-passu to their rights per the holding at a point in time. The non-controlling interests balance represents the holders of Class B-1 units.
Earnings (Loss) per share
Basic earnings (loss) per share is computed by dividing net income (loss) attributable to MediaAlpha, Inc. by the weighted-average number of shares of Class A common stock outstanding during the period. The Company’s Class B common stock are excluded as it represents the voting rights of the legacy QLH holders and have no economic rights at MediaAlpha, Inc. Diluted earnings (loss) per share is computed giving effect to all potential weighted-average dilutive shares for the period following the Reorganization Transaction including Class B-1 units of QLH and Class A restricted shares that are convertible into Class A common stock and RSUs. The dilutive effect of outstanding awards, if any, is reflected in diluted earnings per share by application of the treasury stock method or if-converted method, as applicable.
Earnings per share is presented for the two-month period between the IPO of October 27, 2020 and the year ended December 31, 2020. Prior to the IPO the QLH membership structure consisted of Class A Units and B Units. MediaAlpha, Inc.’s current capital structure is not reflective of the capital structure of QLH prior to the Reorganization Transactions. Therefore, net (loss) per share has not been presented for the portion of the fiscal year ended prior to the completion of the Reorganization Transactions, or for the years ended December 31, 2019 and 2018.
Tax Receivable Agreement
The Company is a party to the TRA under which we are contractually committed to pay the non-controlling interest holders in QLH 85% of the amount of any tax benefits that we actually realize, or in some cases are deemed to realize as a result of certain transactions. Amounts payable under the TRA are contingent upon, among other things, the generation of future taxable income. The projection of future taxable income involves significant judgment. In projecting future taxable income, we consider our historical results and incorporate certain assumptions including the growth rate of the Company and the amount, character, and timing of the taxable income in the future. Actual taxable income may differ from our estimates, which could significantly impact the liability under the TRAs.
Comprehensive Income
For the year ended December 31, 2020, 2019, and 2018, the Company did not have any differences between its net income and comprehensive income.
97
As an “emerging growth company,” the Jumpstart Our Business Startups Act, or the JOBS Act, allows the Company to delay adoption of new or revised accounting pronouncements applicable to public companies until such pronouncements are made applicable to private companies. The Company has elected to use the adoption dates applicable to private companies. As a result, the Company’s financial statements may not be comparable to the financial statements of issuers who are required to comply with the effective date for new or revised accounting standards that are applicable to public companies.
Recently issued not yet adopted accounting pronouncements
In August 2018, the FASB issued Accounting Standards Update (“ASU”) No. 2018-15, Intangibles-Goodwill and Other-Internal-Use Software (Subtopic 350-40) - Customer’s Accounting for Implementation Costs Incurred in a Cloud Computing Arrangement That Is a Service Contract. The ASU aligns the accounting for implementation costs incurred in a hosting arrangement that is a service contract with the accounting for implementation costs incurred to develop or obtain internal-use software under ASC 350-40. Costs for implementation activities in the application development stage are capitalized depending on the nature of the costs, while costs incurred during the preliminary project and post implementation stages are expensed as the activities are performed. ASU 2018-15 is effective annual reporting periods beginning after December 15, 2020 and the interim periods within annual periods beginning after December 15, 2021 and can be applied either prospectively to implementation costs incurred after the date of adoption or retrospectively to all arrangements. The Company plans to adopt the ASU using prospective transition as of January 1, 2021. The ASU is currently not expected to have a material impact on our consolidated financial statements.
In February 2016, the FASB issued ASU No. 2016-02, Leases (ASC 842) (“ASU 2016-02”), which sets out the principles for the recognition, measurement, presentation and disclosure of leases for both parties to a contract (i.e., lessees and lessors). The new standard requires lessees to apply a dual approach, classifying leases as either finance or operating leases based on the principle of whether or not the lease is effectively a financed purchase by the lessee. This classification will determine whether lease expense is recognized based on an effective interest method or on a straight-line basis over the term of the lease, respectively. The new guidance requires lessees to recognize lease assets and liabilities on the balance sheet for both operating and financing leases, with the exception of leases with an original term of 12 months or less. Under existing guidance, recognition of lease assets and liabilities is not required for operating leases. The lease assets and liabilities to be recognized are both measured initially based on the present value of the lease payments. ASU 2016-02 initially required adoption using a modified retrospective approach, under which all years presented in the financial statements would be prepared under the revised guidance. In July 2018, the FASB issued ASU No. 2018-11 which added an optional transition method under which financial statements may be prepared under the revised guidance for the year of adoption, but not for prior years. Under the latter method, entities will recognize a cumulative catch-up adjustment to the opening balance of retained earnings in the period of adoption. In June 2020, the FASB issued ASU No. 2020-05 that deferred the effective date for non-public entities and emerging growth companies that choose to take advantage of the extended transition periods to annual reporting periods beginning after December 15, 2021, and interim periods within fiscal years beginning after December 15, 2022. The Company is currently in the process of evaluating the potential impact of this new accounting guidance, which is effective for the Company for annual periods beginning after December 15, 2021.
In June 2016, the FASB issued ASU 2016-13, Financial Instruments—Credit Losses (Topic 326): Measurement of Credit Losses on Financial Instruments, to require the measurement of all expected credit losses for financial assets held at the reporting date based on historical experience, current conditions, and reasonable and supportable forecasts. The ASU also amends the accounting for credit losses on available-for-sale debt securities and purchased financial assets with credit deterioration. In February 2020, the FASB issued ASU 2020-02, Financial Instruments—Credit Losses (Topic 326) and Leases (Topic 842)—Amendments to SEC Paragraphs Pursuant to SEC Staff Accounting Bulletin No. 119 and Update to SEC Section on Effective Date Related to Accounting Standards Update No. 2016-02, Leases (Topic 842) (SEC Update), which amends the language in Subtopic 326-20 and addresses questions primarily regarding documentation and company policies. The guidance in ASU 2016-13 and ASU 2020-02 related to credit losses is effective for fiscal years beginning after December 15, 2022, including interim periods within those fiscal years. Early adoption is permitted. The Company is currently evaluating the impact of the new guidance on its consolidated financial statements.
98
In December 2019, the FASB issued ASU No. 2019-12, Income Taxes (Topic 740): Simplifying the Accounting for Income Taxes (“ASU 2019-12”), which simplifies the accounting for income taxes. ASU 2019-12 is effective for fiscal years beginning after December 15, 2020 for public companies and for fiscal years beginning after December 15, 2021 for all other entities and early adoption is permitted. The Company has not yet evaluated the impact the adoption of ASU 2019-12 will have on the Company’s financial statements.
In March 2020 and January 2021, the FASB issued ASU No. 2020-04, Reference Rate Reform (Topic 848): Facilitation of the Effects of Reference Rate Reform on Financial Reporting and ASU 2021-01, Reference Rate Reform (Topic 848): Scope, respectively. ASU 2020-04 and ASU 2021-01 provide optional expedients and exceptions for applying U.S. GAAP, to contracts, and other transactions that reference the London Interbank Offered Rate or another reference rate expected to be discontinued because of reference rate reform, if certain criteria are met. The guidance in ASU 2020-04 and ASU 2021-01 was effective upon issuance and, once adopted, may be applied prospectively to contract modifications and hedging relationships through December 31, 2022. The Company is currently evaluating the impact of the adoption of ASU 2020-04 and ASU 2021-01 on its consolidated financial statements.
3. Disaggregation of revenue
The following table shows the Company’s revenue disaggregated by transaction model:
|
|
|
Year Ended December 31, |
|
|||||||||
|
(in thousands) |
|
2020 |
|
|
2019 |
|
|
2018 |
|
|||
|
|
|
|
|
|
|
|
|
|
|
|
|
|
|
Open platform transactions |
|
$ |
573,242 |
|
|
$ |
399,945 |
|
|
$ |
291,331 |
|
|
Private platform transactions |
|
$ |
11,572 |
|
|
|
8,060 |
|
|
|
5,579 |
|
|
Revenue |
|
$ |
584,814 |
|
|
$ |
408,005 |
|
|
$ |
296,910 |
|
The following table shows the Company’s revenue disaggregated by product vertical:
|
|
|
Year Ended December 31, |
|
|||||||||
|
(in thousands) |
|
2020 |
|
|
2019 |
|
|
2018 |
|
|||
|
|
|
|
|
|
|
|
|
|
|
|
|
|
|
Property & casualty insurance |
|
$ |
397,710 |
|
|
$ |
219,467 |
|
|
$ |
162,088 |
|
|
Health insurance |
|
|
139,796 |
|
|
|
104,261 |
|
|
|
71,437 |
|
|
Life insurance |
|
|
30,313 |
|
|
|
33,012 |
|
|
|
28,542 |
|
|
Other |
|
|
16,995 |
|
|
|
51,265 |
|
|
|
34,843 |
|
|
Revenue |
|
$ |
584,814 |
|
|
$ |
408,005 |
|
|
$ |
296,910 |
|
4. Property and equipment
Property and equipment consisted of
|
|
Year ended December 31, |
|
||||||
|
(in thousands) |
|
2020 |
|
|
2019 |
|
||
|
Leasehold improvements |
|
$ |
918 |
|
|
$ |
783 |
|
|
Furniture and fixtures |
|
|
318 |
|
|
|
302 |
|
|
Computers |
|
|
360 |
|
|
|
215 |
|
|
Property and equipment, gross |
|
|
1,596 |
|
|
|
1,300 |
|
|
Less: Accumulated depreciation |
|
|
(834 |
) |
|
|
(545 |
) |
|
Property and equipment, net |
|
$ |
762 |
|
|
$ |
755 |
|
Depreciation expense related to property and equipment amounted to $0.3 million, $0.3 million, and $0.2 million for the years ended December 31, 2020, 2019, and 2018, respectively.
99
5. Goodwill and intangible assets
Goodwill and intangible assets consisted of:
|
|
December 31, 2020 |
|
December 31, 2019 |
|
||||||||||||||||||||||||
|
(in thousands) |
|
Useful life (months) |
|
|
Gross carrying amount |
|
|
Accumulated amortization |
|
|
Net carrying amount |
|
|
Gross carrying amount |
|
|
Accumulated amortization |
|
|
Net carrying amount |
|
|||||||
|
Technology and intellectual property |
|
|
60 |
|
|
$ |
- |
|
|
$ |
- |
|
|
$ |
— |
|
|
$ |
32,027 |
|
|
$ |
(32,027 |
) |
|
$ |
— |
|
|
Customer relationships |
|
|
120 |
|
|
|
25,040 |
|
|
|
(10,016 |
) |
|
|
15,024 |
|
|
|
25,040 |
|
|
|
(7,094 |
) |
|
|
17,946 |
|
|
Costs to acquire third party publishers |
|
|
24 |
|
|
|
- |
|
|
|
- |
|
|
|
— |
|
|
|
1,363 |
|
|
|
(1,363 |
) |
|
|
- |
|
|
Non-compete agreements |
|
|
60 |
|
|
|
303 |
|
|
|
(211 |
) |
|
|
92 |
|
|
|
303 |
|
|
|
(155 |
) |
|
|
148 |
|
|
Domain names |
|
|
60 |
|
|
|
1,224 |
|
|
|
(789 |
) |
|
|
435 |
|
|
|
1,224 |
|
|
|
(566 |
) |
|
|
658 |
|
|
Intangible assets |
|
|
|
|
|
$ |
26,567 |
|
|
$ |
(11,016 |
) |
|
$ |
15,551 |
|
|
$ |
59,957 |
|
|
$ |
(41,205 |
) |
|
$ |
18,752 |
|
|
Goodwill |
|
Indefinite |
|
|
$ |
18,402 |
|
|
|
— |
|
|
$ |
18,402 |
|
|
$ |
18,402 |
|
|
|
— |
|
|
$ |
18,402 |
|
|
Amortization expense related to intangible assets amounted to $3.2 million, $5.4 million, and $11.8 million for the years ended December 31, 2020, 2019, and 2018, respectively. We did not have any impairments of goodwill for the years ended December 31 2020 and 2019, respectively.
The following table presents the change in goodwill and intangible assets:
|
|
|
|
|
|
|
December 31, 2020 |
|
|
|
|
December 31, 2019 |
|
||||||||||
|
(in thousands) |
|
|
|
|
|
Goodwill |
|
|
Intangible assets |
|
|
|
|
Goodwill |
|
|
Intangible assets |
|
||||
|
Beginning balance at January 1, |
|
|
|
|
|
$ |
18,402 |
|
|
$ |
18,752 |
|
|
|
|
$ |
18,402 |
|
|
$ |
23,985 |
|
|
Addition to goodwill and intangible assets |
|
|
|
|
|
|
— |
|
|
|
— |
|
|
|
|
|
— |
|
|
|
148 |
|
|
Amortization |
|
|
|
|
|
|
— |
|
|
|
(3,201 |
) |
|
|
|
|
— |
|
|
|
(5,381 |
) |
|
Ending balance |
|
|
|
|
|
$ |
18,402 |
|
|
$ |
15,551 |
|
|
|
|
$ |
18,402 |
|
|
$ |
18,752 |
|
As of December 31, 2020, future amortization expense on identifiable intangible assets with estimable useful lives over the next five years is as follows:
|
|
|
|
|
|
Amortization expense |
|
||
|
2021 |
|
|
|
|
|
$ |
2,983 |
|
|
2022 |
|
|
|
|
|
|
2,730 |
|
|
2023 |
|
|
|
|
|
|
2,388 |
|
|
2024 |
|
|
|
|
|
|
2,211 |
|
|
2025 |
|
|
|
|
|
|
2,028 |
|
|
Thereafter |
|
|
|
|
|
|
3,211 |
|
|
|
|
|
|
|
|
$ |
15,551 |
|
100
Accrued expenses consisted of:
|
|
|
|
As of |
|
|||||
|
|
|
|
December 31, 2020 |
|
|
December 31, 2019 |
|
||
|
(in thousands) |
|
|
|
|
|
|
|
|
|
|
Accrued liabilities |
|
|
|
|
|
|
|
|
|
|
Accrued payroll and related expenses |
|
|
$ |
6,686 |
|
|
$ |
4,954 |
|
|
Accrued operating expenses |
|
|
|
1,545 |
|
|
|
754 |
|
|
Other accrued expenses |
|
|
|
975 |
|
|
|
876 |
|
|
Total accrued liabilities |
|
|
$ |
9,206 |
|
|
$ |
6,584 |
|
|
|
|
|
|
|
|
|
|
|
|
7. Long-term debt
Credit facility
2019 Revolver and Term Loan
On February 26, 2019, QLH, through its subsidiaries acting as borrower and guarantor, entered into a secured credit facility (“2019 Credit Facilities”) with Monroe Capital. The credit facility was comprised of (a) a term loan in an initial principal amount of $100.0 million (“2019 Term Loan Facility”) and (b) a revolving line of credit of up to $5.0 million (“2019 Revolving Credit Facility”). Proceeds from the $100.0 million 2019 Term Loan Facility were used to (i) repay the 2017 Term Loan Facility in full, (ii) pay a cash dividend to QLH Class A Unit Holders and certain QLH Class B Unit Holders, (iii) pay transaction expenses, and (iv) fund the redemption of certain QLH Class A and Class B Unit Holders for cash.
On June 12, 2019, we executed an amendment to the 2019 Credit Facilities to include City National Bank as a lender. Monroe Capital assigned $25.0 million of the 2019 Term Loan Facility and the entire $5.0 million of the 2019 Revolving Credit Facility to City National Bank. In connection with the assignment of the debt, the applicable margin on borrowings was reduced from LIBOR plus 5.50% to LIBOR plus 4.85% and the Company incurred $0.2 million of debt issuance costs. This amendment was accounted for as a modification to the 2019 Credit Facilities.
As of December 31, 2019, the Company had no outstanding amount drawn on the 2019 Revolving Credit Facility and $97.5 million outstanding, net of deferred debt issuance costs of $1.7 million, on the 2019 Term Loan Facility, of which $0.9 million was classified within current portion of long-term debt and $96.7 million was classified within long-term debt, net of current portion on our consolidated balance sheets.
2020 Revolver and Term Loan
On September 23, 2020, the Company entered into a new senior secured credit facility (“2020 Credit Facilities”) with a syndicate of banks and financial institutions, comprising of (a) $210.0 million term loan (“2020 Term Loan Facility”), which was fully drawn at close and (b) a revolving line of credit of $5.0 million (“2020 Revolving Credit Facility”). Proceeds from the $210.0 million term loan were used to (i) repay the 2019 Term Loan Facilities in full, (ii) pay $105.8 million in cash distributions to QLH Class A Unit Holders and certain QLH Class B Unit Holders, and (iii) pay related transaction expenses.
The 2020 Credit Facilities bear interest at a variable rate based upon, at the Company’s option, a per annum rate of either the Alternate Base Rate (“ABR”) or Adjusted LIBO Rate, plus an Applicable Rate (“ABR Borrowings” and “Eurodollar Borrowings”). The ABR is defined as a fluctuating interest rate equal to the greatest of (a) the U.S. Prime Rate published by the Wall Street Journal, (b) the NYFRB Rate plus 0.50% and (c) the Adjusted LIBO Rate for a one-month interest period plus 1.00%. If the ABR is determined to be less than 1.50%, such rate shall be deemed to be 1.50%. If the Adjusted LIBO Rate is determined to be less than 0.50%, such rate shall be deemed to 0.50%. The Applicable Rate is between 2.25% and 2.75% for ABR Borrowings and between 3.25% and 3.75% for Eurodollar borrowings based on the Company maintaining certain leverage ratios.
101
The 2020 Credit Facilities are collateralized by substantially all of the Company’s assets and contain certain financial and non-financial covenants. The financial covenants include a minimum Fixed Charge Coverage Ratio and a maximum Total Net Leverage Ratio (in each case, as defined in the 2020 Credit Facilities). Non-financial covenants include restrictions on investments, dividends, asset sales, and the incurrence of additional debt and liens. As of December 31, 2020, we were in compliance with all covenants.
The 2020 Credit Facilities have a maturity date of September 22, 2023, subject to an extension of the termination date, at which time all outstanding borrowings and accrued interest are due. Under the 2020 Term Loan Facility, principal repayments of $2.6 million are made quarterly, due on the first business day following the last day of each March, June, September and December, beginning with December 31, 2020. Additionally, the 2020 Term Loan Facility requires a mandatory debt repayment based on an excess cash flow calculation performed annually. The percentage of excess cash flow to be repaid declines based on the Consolidated Total Net Leverage Ratio.
On December 1, 2020, the Company prepaid $23.6 million of the 2020 Term Loan Facility pursuant to the contractual repayment option not subject to a penalty (the “Prepayment”).
As of December 31, 2020, the Company had no outstanding amount drawn on the 2020 Revolving Credit Facility and $182.7 million outstanding on the 2020 Term Loan Facility, net of deferred debt issuance costs of $3.7 million classified within long-term debt, net of current portion on our consolidated balance sheet. Additionally, during the year ended December 31, 2020, the Company recognized a loss on extinguishment of the 2019 Credit Facilities of $2.0 million, which has been recorded within other expenses on our consolidated statement of operations.
The expected future principal payments for all borrowings as of December 31, 2020 is as follows (in thousands):
|
(in thousands) |
|
Contractual maturity |
|
|
|
|
$ |
- |
|
|
|
2022 |
|
|
- |
|
|
2023 |
|
|
186,375 |
|
|
Debt and issuance costs |
|
|
186,375 |
|
|
Unamortized debt issuance costs |
|
|
(3,707 |
) |
|
Total long-term debt |
|
$ |
182,668 |
|
The Company incurred interest expense of $7.9 million, $7.0 million, and $1.2 million for the years ended December 31, 2020, 2019, and 2018, respectively. Included in interest expense is $1.2 million, $0.7 million, and $0.0 million of amortization of debt issuance costs for the years ended December 31, 2020, 2019, and 2018, respectively. As of December 31, 2020, and 2019, unamortized deferred debt issuance costs amounted to $3.7 million and $1.7 million. Accrued interest was $0.7 million as of December 31, 2020 and less than $0.1 million as of December 31, 2019, respectively.
The carrying amount of the current and long-term debt under the 2019 and 2020 Credit Facilities approximated their fair values because these borrowings have a variable interest rate structure with no prepayment penalties and are classified within the Level 2 hierarchy.
8. Commitments and contingencies
Operating leases
The Company is obligated under certain non-cancellable operating leases for its facilities, which expire on various dates through 2027. Certain facility leases contain predetermined fixed escalation of minimum rents. The Company recognizes rent expense on a straight-line basis for these leases and records the difference between recognized rental expense and the amounts payable under the lease agreement as deferred rent. The deferred rent liability was $0.4 million as of December 31, 2020 and 2019. Total rental expense amounted to $0.7 million, $0.5 million, and $0.4 million for the years ended December 31, 2020, 2019, and 2018, respectively, and is recorded in operating expenses in the consolidated statements of operations.
102
Future minimum lease payments under the non-cancellable leases are as follows:
|
(in thousands) |
|
Rent Payments |
|
|
|
|
|
|
|
|
|
2021 |
|
$ |
747 |
|
|
2022 |
|
|
771 |
|
|
2023 |
|
|
780 |
|
|
2024 |
|
|
813 |
|
|
2025 |
|
|
838 |
|
|
Thereafter |
|
|
652 |
|
|
Total |
|
$ |
4,601 |
|
Litigation
The Company is subject to certain legal proceedings and claims that arise in the normal course of business. In the opinion of management, the Company does not believe that the amount of liability, if any, as a result of these proceedings and claims will have a materially adverse effect on the Company’s consolidated financial position, results of operations, and cash flows. As of December 31, 2020, and 2019, the Company does not have any contingency reserves established for any litigation liabilities.
9. Redeemable Class A units, Members’ Equity, and Stockholders' Equity
Amendment and Restatement of Certificate of Incorporation
In connection with the Reorganization Transactions we amended and restated our certificate of incorporation to, among other things, provide for the (i) authorization of 1,000,000,000 shares of Class A common stock with a par value of $0.01 per share; (ii) authorization of 100,000,000 shares of Class B common stock with a par value of $0.01 per share; and (iii) authorization of 50,000,000 shares of preferred stock par value $0.01 per share. Holders of Class A and Class B common stock are entitled to one vote per share on all matters to be voted upon by the stockholders. Holders of our Class A common stock and Class B common stock will vote together as a single class on all matters (including the election of directors) submitted to a vote of stockholders, unless otherwise required by law.
Holders of our Class B common stock are not entitled to receive dividends and will not be entitled to receive any distributions upon the liquidation, dissolution or winding up of the Company. Shares of our Class B common stock are issuable only in connection with the corresponding issuance of an equal number of Class B-1 units. Shares of Class B common stock may only be issued to the extent necessary to maintain the one-to-one ratio between the Class B-1 unit held by the non-controlling interest holders and the number of shares of Class B common stock held by the noncontrolling interest holders. Shares of Class B common stock are transferable only together with an equal number of LLC Interests. Each share of our Class B common stock will be redeemed and cancelled by us if the holder exchanges one Class B-1 unit, together with the corresponding share of Class B common stock, for one share of Class A common stock (or, at our election, cash of an equivalent value).
We must, at all times, maintain a one-to-one ratio between the number of outstanding shares of Class A common stock and the number of Class A-1 unit owned by us (subject to certain exceptions for treasury shares and shares underlying certain convertible or exchangeable securities).
Initial public offering
As discussed in Note 1, on October 30, 2020 we completed our IPO and sold 7,027,606 shares of Class A Common Stock at a public offering price of $19.00 per share, which includes 769,104 shares sold in connection with the full exercise of the underwriter’s option to purchase additional shares. We received $124.2 million, net of underwriting discounts and commissions, which we used in part to repurchase 4,772,449 Class B-1 units from the Selling Class B-1 Unit Holders. Immediately following the completion of the IPO, there were 25,536,043 shares of Class B common stock outstanding, equivalent to all but 41,620 Class B-1 units not held by us, representing an approximately 43.5% ownership interest in QLH.
103
MediaAlpha, Inc. contributed (i) $84.3 million of the net proceeds to Intermediate Holdco for Intermediate Holdco to repurchase 4,772,449 Class B-1 units (which Class B-1 units were converted into Class A-1 units) and (ii) $23.6 million of the net proceeds to Intermediate Holdco for further contribution to QLH, and in turn to QuoteLab LLC, to repay outstanding borrowings under the 2020 Term Loan Facility. The remaining net proceeds of $16.3 million were contributed to Intermediate Holdco for further contribution to QLH and QL to pay for costs associated with the offering and to use for working capital, capital expenditures and general corporate purposes.
QL Holdings Recapitalization
As discussed in Note -1 above, the Fourth Amended and Restated Limited Liability Agreement of QLH, among other things, recapitalized the Class A units held by Intermediate Holdco, to voting, managing member Class A-1 units and recapitalized all other legacy Class A units and Class B units into non-voting, non-managing member, Class B-1 units. After the contribution of Intermediate Holdco to MediaAlpha, Inc., the Company became the sole voting member of QLH, by and through Intermediate Holdco, and control the management of QLH.
Redeemable Class A Units
As described in Note 1, in connection with the Reorganization Transactions, the QLH’s limited liability company agreement was amended and restated to, among other things, effectuate the conversion of 284,221 redeemable convertible preferred units into Class B-1 Units. Prior to the Reorganization Transactions QLH’s Class A units that were held by Insignia feature a redemption right that was considered to be outside of the Company’s control.
The Company considered these Class A units, subject to possible redemption, in accordance with the guidance in FASB ASC 480. Conditionally redeemable Class A units (including Class A units that feature redemption rights that are either within the control of the holder or subject to redemption upon the occurrence of uncertain events not solely within QLH’s control) are classified as temporary equity. As of December 31, 2019, 284,211 units of the 1,136,842 outstanding Class A units were classified outside of permanent equity.
Distribution to Legacy Profit Interest Holders
Upon completion of the September 23, 2020 recapitalization event, QuoteLab, LLC executed a leveraged distribution, borrowing approximately $210 million from its lender and, after satisfying existing indebtedness and transaction related expenses, issued net proceeds to QLH as a dividend. A portion of these debt proceeds were distributed to Senior Executives, certain Legacy Profit Interest Holders, White Mountains, and Insignia as a dividend. The leveraged distribution was distributed to all Legacy Profits Interests Holders, whether vested or unvested, as long as the Participation Threshold was met.
10. Equity-based compensation plans
A summary of equity-based compensation cost recognized during the year ended December 31, 2020, 2019, and 2018 is as follows:
|
|
2020 |
|
|
2019 |
|
|
2018 |
|
||||
|
QLH Class B units |
|
$ |
5,556 |
|
|
$ |
3,594 |
|
|
$ |
824 |
|
|
QLH restricted Class B-1 units |
|
|
90 |
|
|
|
- |
|
|
|
- |
|
|
Restricted Class A shares |
|
|
211 |
|
|
|
- |
|
|
|
- |
|
|
Restricted stock units |
|
|
19,679 |
|
|
|
- |
|
|
|
- |
|
|
Equity-based compensation expense |
|
$ |
25,536 |
|
|
$ |
3,594 |
|
|
$ |
824 |
|
|
|
|
|
|
|
|
|
|
|
|
|
|
|
|
Total income tax benefit recognized related to equity-based compensation |
|
$ |
3,088 |
|
|
$ |
- |
|
|
$ |
- |
|
104
Equity-based compensation cost is allocated to the following expense categories in its condensed consolidated statement of operations during the year ended December 31, 2020, 2019 and 2018 as follows:
|
|
|
2020 |
|
|
2019 |
|
|
2018 |
|
|||
|
Cost of revenue |
|
$ |
2,809 |
|
|
$ |
181 |
|
|
$ |
54 |
|
|
Sales and marketing |
|
|
6,544 |
|
|
|
1,384 |
|
|
|
425 |
|
|
Product development |
|
|
4,723 |
|
|
|
532 |
|
|
|
167 |
|
|
General and administrative |
|
|
11,460 |
|
|
|
1,497 |
|
|
|
178 |
|
|
Total equity-based compensation |
|
$ |
25,536 |
|
|
$ |
3,594 |
|
|
$ |
824 |
|
No compensation cost was capitalized during fiscal 2020, 2019, or 2018.
QLH Class B Profits Interests
Prior to the IPO, the Company maintained a QLH Class B Restricted Unit Plan (the "QLH Plan"), whereby QLH had the authority to issue up to 177,300 Class B units in the form of profits interests to directors, employees, managers, independent contractors, and advisors of QLH and its subsidiaries upon approval of the Board of Directors. The QLH Class B units granted to employees were generally subject to a four-year vesting period, whereby the awards become 25% vested on the first anniversary of the vesting commencement date and then vest ratably on a monthly basis thereafter through the end of the vesting period. The Class B units are equity-classified share-based payments and were recognized utilizing the straight-line method.
In connection with the IPO, the Board of Directors approved the acceleration of vesting on a portion of certain employees’ awards as of the IPO date. As a result of this modification, there was no incremental compensation cost; however, the Company recognized $2.7 million of compensation cost on the IPO date related to the portion of the awards that were accelerated.
As required per the original award terms, all awards on the IPO date, related to 43 employees or their beneficiaries, were exchanged to have substantially equivalent rights and to maintain the grantees’ ownership interests in the remaining assets of the Company. The senior executives received Class B-1 units, which, when vested, together with shares of Company Class B are exchangeable for shares of Company Class A common stock. All other grantees received shares of Company Class A common stock. The awards continue to be subject to the QLH Plan, and those that are unvested are subject to the same vesting terms and conditions. The awards remain equity-classified; however, the awards are no longer in the form of profits interests.
A portion of vested awards on the IPO date were settled for cash. Ultimately, as of the IPO date, all of the legacy QLH Class B profits interests were either (1) settled for cash or (2) cancelled in exchange for QLH Class B-1 units and Company Class A shares.
The fair value of the QLH Class B profits interests was determined on the grant date using the option pricing model based on the following assumptions:
|
|
|
Twelve months ended December 31, |
||||
|
|
2020 |
|
2019 |
|
2018 |
|
|
Expected term (in years) |
|
0.5 - 2 years |
|
2 - 3 years |
|
3 -5 years |
|
Expected volatility |
|
70% - 88% |
|
70%-75% |
|
50-55% |
|
Expected dividend yield |
|
— |
|
— |
|
— |
|
Risk-free interest rate |
|
0.11% - 1.41% |
|
1.58% - 2.19% |
|
2.57% - 2.74% |
|
Discount for lack of marketability |
|
25% - 30% |
|
30% |
|
30% |
A summary of Class B Unit activity for fiscal years 2020, 2019, and 2018 is as follows:
105
|
|
Number of Units |
|
|
Weighted - average grant-date fair value |
|
|
Aggregate Intrinsic Value (in thousands) |
|
||||
|
QLH Class B units |
|
|
|
|
|
|
|
|
|
|
|
|
|
Outstanding as of December 31, 2017 |
|
|
81,590 |
|
|
$ |
41.36 |
|
|
$ |
6,274 |
|
|
Granted |
|
|
19,000 |
|
|
|
62.08 |
|
|
|
|
|
|
Repurchased |
|
|
- |
|
|
|
- |
|
|
|
|
|
|
Forfeited |
|
|
(2,500 |
) |
|
|
46.09 |
|
|
|
|
|
|
Settled or cancelled |
|
|
- |
|
|
|
- |
|
|
|
|
|
|
Outstanding as of December 31, 2018 |
|
|
98,090 |
|
|
$ |
45.25 |
|
|
$ |
22,244 |
|
|
Granted |
|
|
100,738 |
|
|
$ |
71.69 |
|
|
|
|
|
|
Repurchased |
|
|
(31,799 |
) |
|
|
44.61 |
|
|
|
|
|
|
Forfeited |
|
|
(3,229 |
) |
|
|
46.09 |
|
|
|
|
|
|
Settled or cancelled |
|
|
- |
|
|
|
- |
|
|
|
|
|
|
Outstanding as of December 31, 2019 |
|
|
163,800 |
|
|
$ |
61.62 |
|
|
$ |
28,622 |
|
|
Granted |
|
|
25,500 |
|
|
$ |
105.85 |
|
|
|
|
|
|
Repurchased |
|
|
(8,568 |
) |
|
|
51.03 |
|
|
|
|
|
|
Forfeited |
|
|
(3,432 |
) |
|
|
74.22 |
|
|
|
|
|
|
Settled or cancelled(1) |
|
|
(177,300 |
) |
|
|
68.25 |
|
|
|
|
|
|
Outstanding as of December 31, 2020 |
|
|
- |
|
|
$ |
- |
|
|
$ |
- |
|
(1) Upon the IPO and the concurrent 44 x stock split, these units were exchanged for 6,470,599 QLH Class B-1 units and Company Class A shares, of which 902,847 vested shares were cash-settled at fair market value. Because all of the QLH Class B profits interests were either (1) settled or (2) cancelled and replaced upon the IPO, there are 0 QLH Class B units outstanding as of December 31, 2020.
For the year ended December 31, 2020, 2019, and 2018, cash used to settle redemptions of Class B units was $19.4 million, $5.8 million, and $0.0 million, respectively. Redemptions include redemptions arising in connection with the Insignia Recapitalization, optional unit repurchases by the Company following an employee’s termination of employment, and settlement of a portion of the grantee’s awards upon the IPO. During the year ended December 31, 2020, 2019, and 2018, the Company recognized $0.8 million, $1.3 million, and $0 million, respectively, of equity-based compensation cost for the amount by which the Class B units were redeemed in excess of fair value at the date of redemption. These amounts are included within operating cash flow. During the year ended December 31, 2020, 2019, and 2018, the redemption amount which was not in excess of fair value on the date of redemption was $18.6 million, $4.5 million, and $0 million, respectively. Cash used to settle a portion of the awards upon the IPO was $15.9 million (net of underwriter discounts), which was included within financing cash flow, as the cash payment did not exceed the fair value of the award at the date of repurchase.
QLH Restricted Class B-1 Units
Upon the IPO, senior executives that held legacy QLH Class B profits interests received QLH Class B-1 units, which have a substantially equivalent value and which together with Company Class B shares can be exchanged for Company Class A shares when vested. The cancellation and concurrent replacement of Class B profits interests for Class B-1 units was considered a modification. The modification did not result in incremental compensation cost, as the fair value of the replacement awards, determined by using the per share price of Company Class A shares (into which QLH restricted Class B-1 units are convertible) offered to the public in connection with the IPO, did not differ from the fair value of the QLH Class B profits interests immediately before the modification. The awards that were unvested on the modification date are QLH restricted Class B-1 units and are subject to the same vesting terms as the legacy QLH Class B profits interests under the QLH Plan. Under the QLH Plan, 6,470,599 QLH Class B-1 units and Company Class A shares are authorized.
106
The QLH restricted Class B-1 units granted to employees are generally subject to a four-year vesting period, whereby the awards become 25% vested on the first anniversary of the vesting commencement date and then vest ratably on a monthly basis thereafter through the end of the vesting period. The QLH restricted Class B-1 units are equity-classified share-based payments, and the remaining unrecognized cost, which is based on the original grant-date fair value of the Class B profits interests, is recognized utilizing the straight-line method.
Grantees have made 83(b) election under the Internal Revenue Code; therefore, the QLH Class B-1 Units are subject to gross share settlement.
A summary of unvested QLH Class B-1 unit activity for 2020, 2019, and 2018 is as follows:
|
|
|
Number of Units |
|
|
Weighted - average grant-date fair value |
|
||
|
|
|
|
|
|
|
|
|
|
|
Unvested and outstanding as of December 31, 2019 |
|
|
- |
|
|
|
- |
|
|
Granted |
|
|
583,398 |
|
|
$ |
2.79 |
|
|
Vested |
|
|
(53,047 |
) |
|
|
1.77 |
|
|
Forfeited |
|
|
(5,667 |
) |
|
|
1.93 |
|
|
Settled or cancelled |
|
|
- |
|
|
|
- |
|
|
Unvested and outstanding as of December 31, 2020 |
|
|
524,684 |
|
|
$ |
2.90 |
|
As of December 31, 2020, total unrecognized compensation cost related to unvested QLH Class B-1 units was $1.4 million which is expected to be recognized over a weighted average period of 3.0 years. The total fair value of QLH Class B-1 units that vested during the year ended December 31, 2020, 2019, and 2018 was $2.0 million, $0, and $0, respectively.
Company Restricted Class A Shares
Upon the IPO, non-senior executives that held legacy QLH Class B profits interests received Company Class A shares. The cancellation and concurrent replacement of the QLH Class B profits interests for Company Class A shares was considered as a modification. The modification did not result in incremental compensation cost, as the fair value of the replacement awards, determined by using the per share price of Company Class A shares offered to the public in connection with the IPO, did not differ from the fair value of the QLH Class B profits interests immediately before the modification. The awards that were unvested on the modification date are Company restricted Class A shares and are subject to the same vesting terms as the legacy QLH Class B profits interests under the QLH Plan. Under the QLH Plan, 6,470,599 QLH Class B-1 units and Company Class A shares are authorized.
The Company restricted Class A shares granted to employees are generally subject to a four-year vesting period, whereby the awards become 25% vested on the first anniversary of the vesting commencement date and then vest ratably on a monthly basis thereafter through the end of the vesting period. The Company restricted Class A shares are equity-classified share-based payments, and the remaining unrecognized cost, which is based on the original grant-date fair value of the QLH Class B profits interests, is recognized utilizing the straight-line method. Grantees have made 83(b) election under the Internal Revenue Code; therefore, the Company Restricted Class A shares are subject to gross share settlement.
A summary of unvested Company Class A share activity for 2020, 2019, and 2018 is as follows:
107
|
|
|
Number of Units |
|
|
Weighted - average grant-date fair value |
|
||
|
|
|
|
|
|
|
|
|
|
|
Unvested and outstanding as of December 31, 2019 |
|
|
- |
|
|
|
- |
|
|
Granted |
|
|
1,210,253 |
|
|
$ |
3.21 |
|
|
Vested |
|
|
(120,516 |
) |
|
|
1.72 |
|
|
Forfeited |
|
|
(28,132 |
) |
|
|
1.93 |
|
|
Settled or cancelled |
|
|
- |
|
|
|
- |
|
|
Unvested and outstanding as of December 31, 2020 |
|
|
1,061,605 |
|
|
$ |
3.41 |
|
As of December 31, 2020, total unrecognized compensation cost related to unvested Company Class A shares was $3.3 million, which is expected to be recognized over a weighted average period of 3.06 years. The total fair value of Company restricted Class A shares that vested during fiscal 2020, 2019, and 2018 was $4.5 million $0, and $0, respectively.
Restricted Stock Units
In October 2020, the Company adopted the 2020 Omnibus Incentive Plan (the "Omnibus Plan") under which the Company may grant up to 12,506,550 restricted stock units and other equity-based awards to employees, directors, officers, and consultants of the Company. The restricted stock units represent the right to receive one share of Company Class A common stock. The restricted stock units granted generally vest quarterly over periods ranging from three to four years. However, a portion of some restricted stock unit grants were already fully vested based on employee tenure as of the grant date, which resulted in a requisite service period which is shorter than three to four years. The restricted stock units are equity-classified share-based payments and the related cost is recognized utilizing the straight-line method. Upon vesting of the restricted stock units, the Company generally issues new shares to the participants, net of withholding taxes, except for certain executives and non-employee directors who receive gross share settlement.
The fair value of the restricted stock units is determined based on the closing market price of the Company’s Class A shares on the date of grant, with the exception of those restricted stock units granted on the IPO effective date, for which the Company used the per share price of Company Class A shares offered to the public in connection with the IPO.
A summary of unvested restricted stock unit activity for fiscal years 2020, 2019, and 2018 is as follows:
|
|
|
Number of Units |
|
|
Weighted - average grant-date fair value |
|
||
|
|
|
|
|
|
|
|
|
|
|
Unvested and outstanding as of December 31, 2019 |
|
|
- |
|
|
|
- |
|
|
Granted |
|
|
5,822,790 |
|
|
$ |
22.22 |
|
|
Vested |
|
|
(339,914 |
) |
|
|
38.39 |
|
|
Forfeited |
|
|
- |
|
|
|
- |
|
|
Settled or cancelled |
|
|
- |
|
|
|
- |
|
|
Unvested and outstanding as of December 31, 2020 |
|
|
5,482,876 |
|
|
$ |
21.22 |
|
108
As of December 31, 2020, total unrecognized compensation cost related to unvested restricted stock units was $109.7 million, which is expected to be recognized over a weighted average period of 2.85 years.
The total fair value of Company restricted stock units that vested during the year ended December 31, 2020, 2019, and 2018 was $13.0 million, $0, and $0, respectively.
11. Income Taxes
MediaAlpha, Inc. is taxed as a corporation and pays corporate federal, state and local taxes on income allocated to it from QL Holdings, LLC based upon MediaAlpha, Inc.’s economic interest held in QLH. QLH is treated as a pass-through partnership for income tax reporting purposes and not subject to federal income tax. Accordingly, the Company is not liable for income taxes on the portion of QL Holdings, LLC’s earnings not allocated to it. The results for the years ended December 31, 2019 and 2018 do not reflect income tax expense because, prior to the Reorganization Transactions, the consolidated QL Holdings, LLC pass-through entity was not subject to corporate tax.
For financial reporting purposes, income before income taxes includes the following components:
|
|
|
Year Ended December 31, |
|
|||||||||
|
(in thousands) |
|
2020 |
|
|
2019 |
|
|
2018 |
|
|||
|
United States |
|
$ |
9,048 |
|
|
$ |
- |
|
|
$ |
- |
|
|
Foreign |
|
|
247 |
|
|
|
|
|
|
|
|
|
|
Total |
|
$ |
9,295 |
|
|
$ |
— |
|
|
$ |
— |
|
Components of income tax expense consisted of the following for the years indicated:
|
|
|
Year Ended December 31, |
|
|||||||||
|
(in thousands) |
|
2020 |
|
|
2019 |
|
|
2018 |
|
|||
|
Current income tax expense (benefit) |
|
|
|
|
|
|
|
|
|
|
|
|
|
Federal |
|
$ |
(417 |
) |
|
$ |
- |
|
|
$ |
- |
|
|
State |
|
|
(438 |
) |
|
|
- |
|
|
|
- |
|
|
Foreign |
|
|
51 |
|
|
|
- |
|
|
|
- |
|
|
|
|
$ |
(804 |
) |
|
$ |
- |
|
|
$ |
- |
|
|
|
|
|
|
|
|
|
|
|
|
|
|
|
|
Deferred income tax expense (benefit) |
|
|
|
|
|
|
|
|
|
|
|
|
|
Federal |
|
$ |
(354 |
) |
|
$ |
- |
|
|
$ |
- |
|
|
State |
|
|
(108 |
) |
|
|
- |
|
|
|
- |
|
|
Foreign |
|
|
(1 |
) |
|
|
- |
|
|
|
- |
|
|
|
|
$ |
(463 |
) |
|
$ |
- |
|
|
$ |
- |
|
|
Income tax (benefit) |
|
$ |
(1,267 |
) |
|
$ |
- |
|
|
$ |
- |
|
109
A reconciliation of the United States statutory income tax rate to the Company's effective income tax rate is as follows for the years indicated:
|
|
|
Year Ended December 31, |
|
|||||||||
|
|
2020 |
|
|
2019 |
|
|
2018 |
|
||||
|
Statutory federal tax rate |
|
|
21.0 |
% |
|
|
21.0 |
% |
|
|
21.0 |
% |
|
Income attributable to noncontrolling interests and nontaxable income |
|
|
-33.3 |
% |
|
|
-21.0 |
% |
|
|
-21.0 |
% |
|
State income taxes, net of federal benefit |
|
|
-1.1 |
% |
|
|
|
|
|
|
|
|
|
Transaction costs |
|
|
3.4 |
% |
|
|
|
|
|
|
|
|
|
Change in uncertain tax positions |
|
|
-3.3 |
% |
|
|
|
|
|
|
|
|
|
Other |
|
|
-0.1 |
% |
|
|
0.0 |
% |
|
|
|
|
|
Effective income tax rate |
|
|
-13.4 |
% |
|
|
0.0 |
% |
|
|
0.0 |
% |
The Company’s effective tax rate was (13.4)% in 2020, in comparison to the U.S. statutory tax rate in 2020 of 21.0%. The comparison of our effective tax rate to the U.S. statutory tax rate was primarily influenced by the fact that the Company is not liable for income taxes on the portion of QLH’s earnings that are attributable to the non-controlling interests and was not a taxable entity prior to the Reorganization Transactions.
Our accounting for the indefinite reinvestment assertion is complete. In general, it is our intention to permanently reinvest all earnings in excess of previously taxed amounts. While we believe that the financial reporting bases may be greater than the tax bases of investments in foreign subsidiaries for any earnings in excess of previously taxed amounts, such amounts are considered permanently reinvested.
Our accounting policy choice for GILTI is complete. Under U.S. GAAP, we are allowed to make an accounting policy choice of either (1) treating taxes due on future U.S. inclusions in taxable income related to GILTI as a current-period expense when incurred (the period cost method) or (2) factoring such amounts into the measurement of our deferred taxes (the deferred method). We selected the period cost method.
Details of the Company’s deferred tax assets and liabilities are as follows:
|
|
Year Ended December 31, |
|
||||||
|
(in thousands) |
|
2020 |
|
|
2019 |
|
||
|
Deferred tax assets: |
|
|
|
|
|
|
|
|
|
Investment in partnership |
|
$ |
25,443 |
|
|
$ |
- |
|
|
Net operating loss carryforwards and tax credits |
|
|
1,906 |
|
|
|
- |
|
|
Tax receivable agreement |
|
|
5,324 |
|
|
|
- |
|
|
Other |
|
|
846 |
|
|
|
- |
|
|
Total |
|
$ |
33,519 |
|
|
$ |
- |
|
|
Valuation allowance |
|
|
(1,906 |
) |
|
|
- |
|
|
Total deferred tax assets |
|
$ |
31,613 |
|
|
$ |
- |
|
|
Deferred tax liabilities: |
|
|
|
|
|
|
|
|
|
Total deferred tax liabilities |
|
$ |
- |
|
|
$ |
- |
|
|
Deferred tax assets |
|
$ |
31,613 |
|
|
$ |
- |
|
As of December 31, 2020, the Company had state net operating loss carryforwards (“NOLs”) of $13.7 million, of which all have definite lives. State NOLs of $0.3 million will begin to expire in 2028. As of December 31, 2020, the Company had foreign tax credit carryforwards of $1.0 million, which will begin to expire in 2028.
Valuation allowances will be recognized on deferred tax assets if it is more-likely-than-not that some or all of the deferred tax assets will not be utilized. In measuring deferred tax assets, the Company considers all available evidence, both positive and negative, to determine whether a valuation allowance is needed. As of December 31, 2020, the Company recorded a $1.9 million valuation allowance against deferred tax assets related to state NOLs and foreign tax credits as it believes it is more likely-than-not that such attributes will expire prior to utilization.
.
110
A reconciliation of the beginning and ending amount of unrecognized tax benefits is as follows for the years indicated. The Company did not have uncertain tax benefits during the years ended December 31, 2019 and 2018 because, prior to the Reorganization Transactions, the Company was not subject to corporate income taxes.
|
|
Year Ended December 31, |
|
||||||||||
|
(in thousands) |
|
2020 |
|
|
2019 |
|
|
2018 |
|
|||
|
Beginning balance |
|
$ |
- |
|
|
$ |
- |
|
|
$ |
- |
|
|
Increase related to Reorganization Transactions |
|
|
1,925 |
|
|
|
- |
|
|
|
- |
|
|
Increase related to current year tax positions |
|
|
731 |
|
|
|
- |
|
|
|
- |
|
|
Decrease related to lapse in applicable statute of limitations |
|
|
(385 |
) |
|
|
- |
|
|
|
- |
|
|
Ending balance |
|
$ |
2,271 |
|
|
$ |
— |
|
|
$ |
— |
|
As of December 31, 2020, the total liability related to uncertain tax positions was $2.3 million. Out of this amount of $1.8 million has been indemnified by White Mountains, for which an indemnification asset was recognized. The decrease in the liability for uncertain tax positions was due to a lapse of statue limitations. If recognized, $2.3 million of the amount of unrecognized tax benefits would impact our effective tax rate. Additionally, the Company will be indemnified for any tax imposed on which a reserve was recorded and as the Company recognizes uncertain tax positions the benefits would impact pre-tax results. The Company recognizes interest and penalties, if applicable, related to uncertain tax positions as a component of income tax expense. Accrued interest and penalties were approximately $0.7 million as of December 31, 2020 and 2019, and therefore did not impact the effective income tax rate.
The Company files income tax returns as required by the tax laws of the jurisdictions in which it operates. In the normal course of business, the Company may be subject to examination by federal and certain state and local tax authorities. As of December 31, 2020, the Company’s federal income tax returns for the years 2017 through 2019 and state and local tax returns for the years 2015 through 2018, and foreign income tax returns for the years 2018 and 2019 remain open and are subject to examination. Currently, no tax authorities are auditing any of the Company’s income tax matters.
Tax Receivable Agreement
In connection with the Reorganization Transactions and the IPO, the Company entered into the TRA, with Insignia, Senior Executives, and White Mountain. The Company expects to obtain an increase in its share of the tax basis in the net assets of QLH as Class B-1 units are redeemed from or exchanged (or, at our election, cash of an equivalent value). The Company intends to treat any redemptions and exchanges of Class B-1 units as direct purchases Class B-1 units for U.S. federal income tax purposes. These increases in tax basis may reduce the amounts that it would otherwise pay in the future to various tax authorities.
The TRA provides for the payment by MediaAlpha, Inc. to Insignia and the Senior Executives of 85% of the amount of any tax benefits the Company actually realizes, or in some cases is deemed to realize, as a result of (i) increases in the Company’s share of the tax basis in the net assets of QLH resulting from any redemptions or exchanges of Class B-1 units, (ii) tax basis increases attributable to payments made under the TRA, and (iii) deductions attributable to imputed interest pursuant to the TRA. The TRA will also require us to pay White Mountains 85% of the amount of the cash savings, if any, in U.S. federal, state and local income tax that we realize (or are deemed to realize) as a result of the utilization of the net operating losses of Intermediate Holdco attributable to periods prior to the IPO and the deduction of any imputed interest attributable to our payment obligations under the TRA. The Company expects to benefit from the remaining 15% of any of cash savings that it realizes.
No payments were made to pursuant to the TRA during the year ended December 31, 2020. The amounts payable under the TRA will vary depending upon a number of factors, including the amount, character, and timing of the taxable income of MediaAlpha, Inc. in the future.
111
The following table presents the calculation of basic and diluted net loss per share for the period following the IPO (in thousands except per share amounts):
|
|
|
For the period |
|
|
|
|
October 27, 2020 through December 31, 2020 |
|
||
|
|
|
|
|
|
|
Numerator: |
|
|
|
|
|
Net (loss) |
|
$ |
(8,604 |
) |
|
Less: net (loss) attributable to non-controlling interest |
|
|
(4,238 |
) |
|
Net (loss) attributable to MediaAlpha, Inc. |
|
$ |
(4,366 |
) |
|
Denominator: |
|
|
|
|
|
Weighted-average shares of Class A common stock outstanding - basic and diluted |
|
|
32,134,170 |
|
|
|
|
|
|
|
|
Net (loss) per share of Class A common stock - basic and diluted |
|
$ |
(0.14 |
) |
During the period October 27, 2020 through December 31, 2020, the Company incurred net losses and, therefore, the effect of the Company’s potentially dilutive securities were not included in the calculation of diluted loss per share as the effect would be anti-dilutive. The following table contains share/unit totals with a potentially dilutive impact:
|
|
|
As of December 31, 2020 |
|
|
|
QLH Class B / B-1 Units (Replacement awards) |
|
|
25,571,996 |
|
|
Restricted Class A Shares |
|
|
1,061,605 |
|
|
Restricted stock units |
|
|
5,482,876 |
|
|
Potential dilutive shares |
|
|
32,116,477 |
|
13. Non-Controlling Interest
As of December 31, 2020, the non-controlling interests of QLH owned 42.9% of the outstanding LLC Units, with the remaining 57.1% owned by MediaAlpha, Inc. As of December 31, 2019, the Reorganization Transactions had not yet occurred and the Company held no interest in QLH.
14. Selected Quarterly Financial Data (Unaudited)
The following table contains selected unaudited consolidated statement of operations information for each quarter of the years ended December 31, 2020 and 2019. We have prepared the unaudited quarterly consolidated statements of operations data on a consistent basis with the consolidated financial statements included in this Annual Report on Form 10-K. The results of historical periods are not necessarily indicative of results for a full year or for any future period.
112
|
(in thousands except per share amounts) |
|
|
|
|
|
|
|
|
|
|
|
|
|
|
|
|
|
|
|
Three Months Ended |
|
|||||||||||||
|
|
|
Dec. 31, 2020 |
|
|
Sept. 30, 2020 |
|
|
Jun. 30, 2020 |
|
|
Mar. 31, 2020 |
|
||||
|
Revenue |
|
|
190,205 |
|
|
|
151,548 |
|
|
|
123,616 |
|
|
|
119,445 |
|
|
Income (loss) from Operations |
|
|
(11,127 |
) |
|
|
8,431 |
|
|
|
11,681 |
|
|
|
10,550 |
|
|
Net (loss) income |
|
$ |
(13,238 |
) |
|
$ |
4,819 |
|
|
$ |
10,146 |
|
|
$ |
8,835 |
|
|
Net income (loss) attributable to QLH prior to Reorganization Transaction |
|
$ |
(4,634 |
) |
|
$ |
4,819 |
|
|
$ |
10,146 |
|
|
$ |
8,835 |
|
|
Net (loss) attributable to non-controlling interest |
|
|
(4,238 |
) |
|
|
- |
|
|
|
- |
|
|
|
- |
|
|
Net (loss) income attributable to MediaAlpha, Inc. |
|
$ |
(4,366 |
) |
|
$ |
- |
|
|
$ |
- |
|
|
$ |
- |
|
|
Net (loss) per share of Class A common stock - basic and diluted |
|
$ |
(0.14 |
) |
|
$ |
- |
|
|
$ |
- |
|
|
$ |
- |
|
|
|
|
|
|
|
|
|
|
|
|
|
|
|
|
|
|
|
|
|
|
|
|
|
|
|
|
|
|
|
|
|
|
|
|
|
|
|
|
|
|
|
|
|
|
|
|
|
|
|
|
|
|
|
|
|
|
Three Months Ended |
|
|||||||||||||
|
|
|
Dec. 31, 2019 |
|
|
Sept. 30, 2019 |
|
|
Jun. 30, 2019 |
|
|
Mar. 31, 2019 |
|
||||
|
Revenue |
|
|
126,148 |
|
|
|
110,397 |
|
|
|
89,111 |
|
|
|
82,349 |
|
|
Income (loss) from Operations |
|
|
12,139 |
|
|
|
9,683 |
|
|
|
7,335 |
|
|
|
(4,316 |
) |
|
Net income (loss) |
|
$ |
10,377 |
|
|
$ |
7,763 |
|
|
$ |
4,959 |
|
|
$ |
(5,279 |
) |
|
Net income (loss) attributable to QLH prior to Reorganization Transaction |
|
$ |
10,377 |
|
|
$ |
7,763 |
|
|
$ |
4,959 |
|
|
$ |
(5,279 |
) |
|
Net income (loss) attributable to Non-controlling interest |
|
|
- |
|
|
|
- |
|
|
|
- |
|
|
|
- |
|
|
Net income (loss) attributable to MediaAlpha, Inc. |
|
$ |
- |
|
|
$ |
- |
|
|
$ |
- |
|
|
$ |
- |
|
|
Net (loss) per share of Class A common stock - basic and diluted |
|
$ |
- |
|
|
$ |
- |
|
|
$ |
- |
|
|
$ |
- |
|
113
Item 9. Changes in and Disagreements With Accountants on Accounting and Financial Disclosure.
None.
Item 9A. Controls and Procedures.
Evaluation of Disclosure Controls and Procedures
As of December 31, 2020, we carried out an evaluation, under the supervision and with the participation of our management, including our Chief Executive Officer (principal executive officer) and Chief Financial Officer (principal financial officer), of the effectiveness of the design and operation of our disclosure controls and procedures (as defined in Rules 13a-15(e) and 15d-15(e) under the Securities Exchange Act of 1934, as amended (the “Exchange Act”)) to determine whether such disclosure controls and procedures provide reasonable assurance that information to be disclosed by us in the reports that we file or submit under the Exchange Act is recorded, processed, summarized and reported within the time periods specified in the rules and forms of the SEC and such information is accumulated and communicated to management, including our principal executive officer and principal financial officer or persons performing similar functions, as appropriate to allow timely decisions regarding disclosure. Based on that evaluation, our principal executive officer and our principal financial officer have concluded that as of December 31, 2020, our disclosure controls and procedures were not effective because of the material weakness in our internal control over financial reporting described below. Our management, including our Chief Executive Officer and Chief Financial Officer, has concluded that, notwithstanding the material weakness in our internal control over financial reporting, the consolidated financial statements in this Annual Report on Form 10-K fairly present, in all material respects, our financial position, results of operations and cash flows for the period presented in conformity with U.S. GAAP.
Material Weakness in Internal Control over Financial Reporting
A material weakness is a deficiency, or combination of deficiencies, in internal control over financial reporting such that there is a reasonable possibility that a material misstatement of our annual or interim consolidated financial statements will not be prevented or detected on a timely basis.
As previously reported, we identified a material weakness related to the accounting for non-standard equity-based compensation arrangements. Specifically, we did not design and maintain effective controls to evaluate different features built into the equity award in determining the appropriate vesting period of the award. Additionally, the Company determined the historical method it used to determine the grant date fair value of the equity award was not permissible under applicable guidance, and the Company did not appropriately account for repurchases of equity awards. This material weakness resulted in a restatement of our consolidated financial statements for the years ended December 31, 2019 and 2018.
Management’s Remediation plan for the Previously Identified Material Weakness
As part of our remedial efforts, we reassessed our policy relating to the accounting for and recording of equity-based compensation, we engaged a third-party valuation firm to determine grant date fair values for each tranche of equity grants, we engaged a third-party consulting firm to review our equity-based compensation model that included a full review of our equity-based compensation expense for each award grant, and we have identified and are in the process of implementing a third-party equity-based compensation software system to streamline and automate the tracking and expensing of our equity-based compensation awards.
While significant progress has been made, additional time is required to complete implementation and to assess and ensure the sustainability of the relevant processes. The material weakness cannot be considered remediated until the applicable remedial controls operate for a sufficient period of time and we have concluded, through testing, that these controls are designed and operating effectively.
114
Management’s Report on Internal Control Over Financial Reporting
This Annual Report does not include a report of management’s assessment regarding internal control over financial reporting or an attestation report of our independent registered public accounting firm due to a transition period established by rules of the SEC for newly public companies.
Changes in Internal Control Over Financial Reporting
There was no change in our internal control over financial reporting during the quarter ended December 31, 2020 that has materially affected, or is reasonably likely to materially affect, our internal control over financial reporting.
Inherent Limitations on Effectiveness of Controls
In designing and evaluating the disclosure controls and procedures, management recognizes that any controls and procedures, no matter how well designed and operated, can provide only reasonable assurance of achieving the desired control objectives. In addition, the design of disclosure controls and procedures must reflect the fact that there are resource constraints and management is required to apply its judgment in evaluating the benefits of possible controls and procedures relative to their cost.
None.
115
Item 10. Directors, Executive Officers and Corporate Governance.
Executive Officers
The following table sets forth information as of the date hereof regarding individuals who serve as our executive officers:
|
|
Age |
|
Position |
|
|
Steven Yi |
|
50 |
|
Chief Executive Officer, President, and Co-Founder |
|
Eugene Nonko |
|
40 |
|
Chief Technology Officer and Co-Founder |
|
Ambrose Wang |
|
42 |
|
Co-Founder |
|
Tigran Sinanyan |
|
38 |
|
Chief Financial Officer and Treasurer |
|
Keith Cramer |
|
40 |
|
Senior Vice President, Supply Partnerships |
|
Amy Yeh |
|
42 |
|
Senior Vice President, Technology |
|
Brian Mikalis |
|
46 |
|
Senior Vice President, Demand Partnerships |
|
Robert Perine |
|
28 |
|
Vice President, Product |
|
Serge Topjian |
|
36 |
|
Vice President, Media Buying |
|
Jeff Sweetser |
|
37 |
|
Vice President, Supply Partnerships |
|
Lance Martinez |
|
49 |
|
General Counsel and Secretary |
Steven Yi, 50, has served as the Chief Executive Officer of the Company since June 2011. Prior to joining the Company, Mr. Yi co-founded and served as the Chief Executive Officer of Fareloop LLC, a travel comparison website, from 2009 to 2011, and served as Senior Vice President and General Manager, Marketing Services, at Oversee.net, a technology-driven media company that owned and operated a portfolio of consumer and business-to-business properties, from 2007 to 2009. Mr. Yi received his undergraduate degree in East Asian Studies from Harvard University and his J.D. from Harvard Law School.
Eugene Nonko, 40, has served as the Chief Technology Officer of the Company since June 2011. Prior to joining the Company, Mr. Nonko served as Vice President, Research and Development at Oversee.net, a technology-driven media company that owned and operated a portfolio of consumer and business-to-business properties, from 2004 to 2010, and served as a Software Engineer at Microsoft, a leading multinational technology company, from 2001 to 2004. Mr. Nonko received his B.S. and M.S. in Information Technology and Economics from Altai State Technical University.
Ambrose Wang, 42, has served as Co-Founder of the Company since June 2011. Prior to joining the Company, Mr. Wang co-founded Fareloop, LLC, a travel comparison website, from 2009 to 2011, and served as Executive Producer at Oversee.net, a technology-driven media company that owned and operated a portfolio of consumer and business-to-business properties, from 2006 to 2009. Prior to that, Mr. Wang founded Imigis Consulting, an online marketing services company, from 2001 to 2006. Mr. Wang received his undergraduate degree in Computing from Oxford University.
Tigran Sinanyan, 38, has served as the Chief Financial Officer of the Company since August 2015 and previously served as Vice President, Finance, of the Company, from January 2012 to August 2015. Prior to joining the Company, Mr. Sinanyan served as Senior Manager, Corporate Development and Finance, at Oversee.net, a technology-driven media company that owned and operated a portfolio of consumer and business-to-business properties, from 2007 to 2012. Prior to that, Mr. Sinanyan served as Manager of Strategy and Corporate Development at Lexicon Marketing, a direct response TV marketer of products and services to the U.S. Hispanic market, from October 2005 to October 2007. Mr. Sinanyan received his undergraduate degree in Business Administration from the University of California, Berkeley, Haas School of Business.
Keith Cramer, 40, has served as Senior Vice President, Supply Partnerships, of the Company since March 2014. Prior to joining the Company, Mr. Cramer served as a Vice President at Vantage Media, an advertising technology company that specialized in online customer acquisition in the insurance and education verticals, from 2012 to 2014. Prior to that, Mr. Cramer served at QuinStreet, an online performance marketing company that provides online platform solutions to match consumers with brands in digital media, as Senior Director, Insurance, from 2010 to 2012, as Director, Insurance, from 2009 to 2010, and as Senior Manager, SureHits Publishing, from 2008 to 2009. Mr. Cramer received his undergraduate degree in Management and Economics from the University of Florida, Warrington College of Business Administration and his M.B.A. from Oklahoma Christian University.
116
Amy Yeh, 42, has served as Senior Vice President, Technology, of the Company since January 2019 and Vice President, Engineering, of the Company from March 2015 to December 2018. Prior to joining the Company, Ms. Yeh served as the Chief Technology Officer at Wedge Buster, a gaming company specializing in sports gaming and fantasy sports on social networks and mobile platforms, from 2011 to 2015, and served as the Chief Product Officer at Federated Media Publishing, a digital content and marketing company that delivers advertising opportunities and engagement tools to reach agencies’ and brands’ target audiences, from 2010 to 2011. Prior to that, Ms. Yeh served as Senior Vice President, New Media and Digital Technology at STAR TV, a premier satellite television broadcaster in Asia, from 2008 to 2009. Ms. Yeh received her undergraduate degree in Computer Science and Integrated Biology from the University of California, Berkeley.
Brian Mikalis, 46, has served as Senior Vice President, Demand Partnerships, of the Company since March 2020. Prior to joining the Company, Mr. Mikalis served as Senior Vice President, National Sales, at Firefly, a marketing company that installs and sells digital advertising on displays mounted to the tops of taxi and rideshare vehicles, from 2019 to 2020. Prior to that, Mr. Mikalis served at Pandora, a leading music and podcast discovery platform, as Senior Vice President, Monetization and Mid-Market Sales, from 2012 to 2018 and as Vice President, Performance, Inside and Local Sales, from 2009 to 2012. Mr. Mikalis received his undergraduate degree in Economics from the University of California, Santa Barbara and his M.B.A. from Saint Mary’s College of California.
Robert Perine, 38, has served as Vice President, Product, of the Company since August 2017. Prior to joining the Company, Mr. Perine served in Product Management at OpenX, a programmatic advertising technology company that optimizes a company’s advertising revenue, from 2015 to 2017, and served as Senior Manager, Product Management, at Demand Media, an online content company that operates brands including eHow, livestrong.com and Society6, from 2009 to 2015. Mr. Perine received his undergraduate degree in Computer Science from University of Southern California.
Serge Topjian, 36, has served as Vice President, Media Buying, of the Company since January 2018 and Vice President, Paid Media, of the Company from May 2013 to January 2018. Prior to joining the Company, Mr. Topjian served as Senior Manager, Search Engine Marketing, at LegalZoom, a technology platform that provides access to professional legal advice, from 2013 to 2015, and served as Manager, Search Engine Marketing, at Oversee.net, a technology-driven media company that owned and operated a portfolio of consumer and business-to-business properties, from 2008 to 2011. Mr. Topjian received his undergraduate degree in Business Administration, Economics and Management from California State University, Northridge.
Jeff Sweetser, 37, has served as Vice President, Supply Partnerships, of the Company since January 2020, and as a Senior Director, Supply Partnerships, of the Company since October 2015. Prior to joining the Company, Mr. Sweetser served as a Senior Director at Katch, an advertising technology company that specialized in online customer acquisition in the insurance and education verticals, from 2014 to 2015, as a Director from 2013-2014, and as Senior Manager from 2012-2013. Prior to that, Mr. Sweetser served at Inflection, a big data company as a Senior Manager, Affiliate Sales, from 2011 to 2012. Mr. Sweetser received his undergraduate degree in Marketing from Santa Clara University, the Leavey School of Business.
Lance Martinez, 49, has served as General Counsel of the Company since December 2017. Prior to joining the Company, Mr. Martinez served as a Partner at Invictus Advisors, a boutique business consultancy and law firm focused on providing services to entrepreneurial companies, from 2011 to 2017. Mr. Martinez served at Oversee.net, a technology-driven media company that owned and operated a portfolio of consumer and business-to-business properties, as General Counsel, Domain Services, from 2009 to 2011 and as General Manager, Domain Management, from 2007 to 2009. Mr. Martinez received his undergraduate degree in Economics from the University of California, Davis and his J.D. from Yale Law School.
117
Composition of the Board of Directors
Our Board of Directors consists of nine members. The following table sets forth information as of the date hereof regarding individuals who serve as members of our Board of Directors:
|
|
Age |
|
Position |
|
Committee memberships |
|
|
Venmal (Raji) Arasu |
|
51 |
|
Director |
|
Audit Committee, Compensation Committee |
|
Anthony Broglio |
|
46 |
|
Director |
|
Compensation Committee |
|
Christopher Delehanty |
|
38 |
|
Director |
|
Audit Committee |
|
David Lowe |
|
60 |
|
Director |
|
Nominating & Corporate Governance Committee |
|
Jennifer Moyer |
|
49 |
|
Director |
|
Compensation Committee, Nominating & Corporate Governance Committee |
|
Eugene Nonko |
|
40 |
|
Director, Chief Technology Officer, and Co-Founder |
|
— |
|
Lara Sweet |
|
46 |
|
Director |
|
Audit Committee, Compensation Committee |
|
Kathy Vrabeck |
|
57 |
|
Director and Board Chair |
|
Nominating & Corporate Governance Committee |
|
Steven Yi |
|
50 |
|
Director, Chief Executive Officer, President, and Co- Founder |
|
Nominating & Corporate Governance Committee |
Venmal (Raji) Arasu, 51, was appointed director of the Company upon the completion of the IPO. Ms. Arasu is currently Senior Vice President, Intuit Platform of Intuit Inc., a business and financial software company that develops and sells financial, accounting, tax preparation software, and related services for small businesses, accountants, and individuals. Ms. Arasu previously served as the Chief Technology Officer for StubHub, Inc., the online and mobile ticketing marketplace subsidiary of eBay Inc., from November 2011 to January 2016. At eBay, she served as the Vice President of Engineering from 2008 to 2011, and in other positions of increasing authority from 2001 to 2008. She has served as one of NIC Inc.’s directors since 2015. Ms. Arasu holds a B.S. in Computer Engineering from Pune University, Pune, India. Ms. Arasu is qualified to serve on the Board of Directors because of her engineering expertise in technology, business strategy, and management experience.
Anthony Broglio, 46, was appointed director of the Company in July 2020 and prior to the IPO served as director of QLH. Mr. Broglio is a founding Partner at Insignia, a San Francisco Bay Area private equity firm focused on lower middle-market companies. Insignia has owned a minority stake in QLH since the Insignia transaction in 2019 and is a stockholder of the Company. Prior to founding Insignia in 2012, Mr. Broglio worked as a Principal and member of the executive committee of Lake Capital, a Chicago-based private equity fund with over $1.3 billion under management. During his more than nine years with Lake Capital, Mr. Broglio served on the boards of twelve portfolio companies. Mr. Broglio received a B.S. in Finance from the University of Colorado and an M.B.A. with Honors from the University of Chicago Booth School of Business. Mr. Broglio is qualified to serve on our Board of Directors because of his financial expertise and management experience.
Christopher Delehanty, 38, was appointed director of the Company in July 2020 and prior to the IPO served as a director of QL Holdings LLC. Mr. Delehanty is Head of Corporate Development and M&A at White Mountains, where he focuses on the company’s direct investing and merger and acquisition activity in the insurance and financial services sectors. White Mountains has owned a stake in QL Holdings LLC since 2014 and is a stockholder of the Company. Prior to joining White Mountains in 2009, Mr. Delehanty worked in private equity and investment banking at Alta Communications and UBS Investment Bank. Mr. Delehanty currently sits on the board of NSM Insurance Group, a full-service MGU and program administrator for specialty property & casualty insurance. Mr. Delehanty received his B.S. in Finance from Boston College. Mr. Delehanty is qualified to serve on our Board of Directors because of his financial expertise and management and board experience.
David Lowe, 60, was appointed director of the Company upon the completion of the IPO. Mr. Lowe is a founding Partner and Chief Executive Officer of Insignia, a San Francisco Bay Area private equity firm focused on lower middle-market companies. Insignia has owned a minority stake in QL Holdings LLC since the Insignia
118
transaction in 2019 and is a stockholder of the Company. Prior to that, Mr. Lowe was a co-founder and Vice Chairman of Friedman Fleischer & Lowe, a San Francisco-based private equity firm with over $2.5 billion under management. During his 13 years at Friedman Fleischer & Lowe, Mr. Lowe was on the Investment Committee and served as Chairman of the boards of Guardian Home Care Holdings, Discovery Foods, Church’s Chicken, Benevis, GeoVera Insurance Group Holdings, and Advanced Career Technologies, as well as a director at DPMS, SteelPoint Technologies, and Korn/Ferry International. Mr. Lowe currently serves as Chairman on the boards of Truco Enterprises, Tillamook Country Smoker, and Century Snacks. Mr. Lowe received a B.A. with Honors from the University of California at Davis and an M.B.A. from the Stanford Graduate School of Business. Mr. Lowe is qualified to serve on our Board of Directors because of his financial expertise and management experience.
Jennifer Moyer, 49, was appointed director of the Company upon the completion of the IPO and serves as the chair of the Compensation Committee. Ms. Moyer has been the Chief Administrative Officer of White Mountains, a financial services holding company, since 2017. White Mountains has owned a stake in QL Holdings LLC since 2014 and is a stockholder of the Company. Prior to joining White Mountains, Ms. Moyer worked at Goldman Sachs for 23 years in a variety of leadership roles including Chief of Staff for Asia Pacific Ex-Japan and Managing Director in Human Capital Management for Asia Pacific. Ms. Moyer received a B.A. in Social Anthropology from Harvard College and an M.B.A. from the Tuck School of Business at Dartmouth. Ms. Moyer is qualified to serve on our Board of Directors because of her extensive experience as a senior executive with management expertise, as well as her human capital management and corporate governance experience.
Lara Sweet, 46, was appointed director of the Company upon the completion of the IPO and serves as the chair of the Audit Committee. Ms. Sweet is the Chief People Officer at Snap Inc., a camera company and owner of the application Snapchat. Ms. Sweet has served in that role since May 2019. Prior to that, Ms. Sweet served as Snap Inc.’s interim Chief Financial Officer from January 2019 to May 2019, Chief Accounting Officer from October 2017 to September 2019, and as Controller from June 2016 to October 2017. Prior to Snap, Ms. Sweet worked at AOL, Inc. for over six years, most recently serving as Controller and Chief Accounting Officer from November 2014 to June 2016. Prior to that, Ms. Sweet served as AOL’s Vice President, Internal Audit from April 2014 to November 2014 and Vice President, Assistant Controller from August 2011 to April 2014. Ms. Sweet holds a B.S. in Accounting from George Mason University and is a member of the American Institute of Certified Public Accountants. Ms. Sweet is qualified to serve on our Board of Directors because of her financial expertise and management experience.
Kathy Vrabeck, 57, was appointed director of the Company upon the completion of the IPO and serves as the chair of our Board of Directors as well as the chair of the Nominating & Corporate Governance Committee. Ms. Vrabeck is a Senior Client Partner in the Los Angeles office of Korn Ferry, a global talent and organizational advisory firm, where she leads Korn Ferry’s Consumer Digital sector. Prior to joining Korn Ferry in October 2015, she was a Partner at Heidrick & Struggles International, Inc., an executive search firm, where she served as both Global Sector Leader of their Media, Entertainment and Digital practice and partner-in-charge of the Los Angeles office. Prior to that, Ms. Vrabeck was with Legendary Entertainment, a media company, from March 2009 to March 2011 where she served as President, Legendary Digital and was responsible for the creation, management and delivery of digital entertainment, with a focus on video games, across current and next-generation platforms. From May 2007 to November 2008, Ms. Vrabeck was with Electronic Arts, Inc., a developer, marketer, publisher and distributor of video games (“EA”), where she served as President, EA Casual Entertainment. Ms. Vrabeck serves as Chair of the GameStop (NYSE:GME) board of directors. Ms. Vrabeck received a bachelor’s degree in French and economics from DePauw University and an M.B.A. from Indiana University. Ms. Vrabeck is qualified to serve on our Board of Directors because of her expertise in digital media and her management and board experience.
Election of directors
Our Board of Directors is divided into three classes, each of which is composed of three directors. The directors designated as Class I directors have terms expiring at the first annual meeting of stockholders following the completion of the IPO, which we expect to hold in 2021. The directors designated as Class II directors have terms expiring at the following year’s annual meeting of stockholders, which we expect to hold in 2022, and the directors designated as Class III directors have terms expiring at the following year’s annual meeting of stockholders, which we expect to hold in 2023. Commencing with the first annual meeting of stockholders following the completion of the IPO, which we expect to hold in 2021, directors for each class will be elected at the annual meeting of stockholders held in the year in which the term for that class expires and thereafter will serve for a term of three years. As a result, a portion of our Board of Directors will be elected each year. At any meeting of stockholders for
119
the election of directors at which a quorum is present, the election will be determined by the affirmative vote of a majority of the issued and outstanding shares of common stock, voting together as one class, entitled to vote in the election.
•Our Class I directors are Anthony Broglio, Christopher Delehanty, and Eugene Nonko.
•Our Class II directors are David Lowe, Jennifer Moyer, and Steven Yi.
•Our Class III directors are Venmal (Raji) Arasu, Lara Sweet, and Kathy Vrabeck.
There is no limit on the number of terms a director may serve on our Board of Directors. In case of any increase or decrease, from time to time, in the number of directors, the number of directors in each class will be apportioned as nearly equal as possible. The division of our Board of Directors into three classes with staggered three-year terms may have the effect of discouraging, delaying or preventing a transaction involving a change in control.
Pursuant to the stockholders’ agreement we entered into with White Mountains, Insignia, and the Founders in connection with the IPO, for so long as each of White Mountains, Insignia, and the Founders owns at least 12.5% of our issued and outstanding shares of common stock as of the closing of the IPO, such stockholder is entitled to nominate two directors to serve on our Board of Directors. When such stockholder owns less than 12.5% but at least 5% of our issued and outstanding shares of common stock as of the closing of the IPO, such stockholder will be entitled to nominate one director. White Mountains, Insignia, and the Founders have agreed in the stockholders’ agreement to vote for each other’s board nominees.
Our amended and restated bylaws provide that the authorized number of directors may only be changed by a resolution adopted by a majority of our Board of Directors, subject to the terms of our stockholders’ agreement.
Under the stockholders’ agreement and subject to our amended and restated certificate of incorporation, our amended and restated bylaws and applicable law, certain actions cannot be taken by us without the prior written consent of a majority in interest of White Mountains, Insignia, and the Founders, for so long as such stockholders continue to own at least a majority of the issued and outstanding shares of common stock after the completion of the IPO. These actions include, among others, increasing or decreasing the size of the board and engaging in change of control transactions.
Controlled company
Certain of our existing investors that are a party to the stockholders’ agreement own a majority of the voting power of our outstanding common stock. Accordingly, we are considered a “controlled company” under the NYSE rules. Under these rules, a “controlled company” may elect not to comply with certain corporate governance requirements, including the requirements that, within one year of the date of listing of our Class A common stock:
•we have a board that is composed of a majority of “independent directors” as defined under the NYSE rules; and
•we have a compensation committee and nominating and corporate governance committee that is composed of independent directors.
We intend to continue to take advantage of these exemptions for so long as we continue to qualify as a “controlled company.” These exemptions do not modify the independence requirements for our audit committee, and we intend to continue to comply with the applicable requirements of the Sarbanes-Oxley Act and rules with respect to our audit committee within the applicable time frame.
Director independence
Our Board of Directors has undertaken a review of the composition of our Board of Directors, the Audit Committee, the Compensation Committee and the independence of each director on the Board of Directors. Based upon information requested from and provided by each director concerning his or her background, employment and affiliations, including family relationships, our Board of Directors has determined that each of Venmal (Raji) Arasu, Anthony Broglio, David Lowe, Lara Sweet, and Kathy Vrabeck is “independent” as defined under the rules of the NYSE. Our Board of Directors also determined that Venmal (Raji) Arasu and Lara Sweet, who serve on our Audit Committee, satisfy the independence standards for that committee established by the SEC and the rules of the NYSE. In making such determinations, our Board of Directors considered the relationships that each such non-employee director has with our Company and all other facts and circumstances our Board of Directors deemed
120
relevant in determining independence, including the beneficial ownership of our capital stock by each non-employee director and any institutional stockholder with which he or she is affiliated.
Board committees
Our Board of Directors has established standing committees in connection with the discharge of its responsibilities. These committees include the Audit Committee, the Compensation Committee and the Nominating and Corporate Governance Committee. Our Board of Directors may also establish such other committees as it deems appropriate, in accordance with applicable law and our corporate governance documents. A copy of each committee’s charter is posted on the corporate governance section of our website, www.mediaalpha.com. Information contained on our website is not incorporated by reference into this Annual Report on Form 10-K, and you should not consider information contained on our website to be part of this Annual Report on Form 10-K or in deciding whether to purchase shares of our common stock.
Audit committee
The Audit Committee’s primary responsibilities include:
•overseeing management’s establishment and maintenance of adequate systems of internal accounting and financial controls;
•reviewing the effectiveness of our legal and regulatory compliance programs;
•overseeing our financial reporting process, including the filing of financial reports; and
•selecting independent auditors, evaluating their independence and performance and approving audit fees and services performed by them.
The members of our Audit Committee are Venmal (Raji) Arasu, Christopher Delehanty, and Lara Sweet. Our Board of Directors has determined that Lara Sweet is an “audit committee financial expert” as defined by applicable SEC rules.
Compensation committee
The Compensation Committee’s primary responsibilities include:
•ensuring our executive compensation programs are appropriately competitive, supporting organizational objectives and stockholder interests and emphasizing pay for performance linkage;
•evaluating and approving compensation and setting performance criteria for compensation programs for our chief executive officer and other executive officers; and
•overseeing the implementation and administration of our compensation plans.
The members of our Compensation Committee are Venmal (Raji) Arasu, Anthony Broglio, Jennifer Moyer, and Lara Sweet.
Nominating and corporate governance committee
The Nominating and Corporate Governance Committee’s primary responsibilities include:
•recommending nominees for our Board of Directors and its committees;
•recommending the size and composition of our Board of Directors and its committees;
•reviewing our corporate governance guidelines and proposed amendments to our certificate of incorporation and bylaws; and
•reviewing and making recommendations to address stockholder proposals.
The members of our Nominating and Corporate Governance Committee are David Lowe, Jennifer Moyer, Kathy Vrabeck, Steven Yi.
We have adopted a code of business conduct and ethics, or “Code of Ethics,” which will apply to all of our directors, officers and employees, including our principal executive officer, principal financial officer, principal accounting officer and persons performing similar functions. The Code of Ethics will be available upon written
121
request to our Corporate Secretary or on our website at www.mediaalpha.com. If we amend or grant any waiver from a provision of our Code of Ethics that applies to any of our executive officers, we will publicly disclose such amendment or waiver on our website and as required by applicable law.
Item 11. Executive Compensation.
This section provides a discussion of the compensation paid or awarded to our principal executive officer and our two other most highly compensated executive officers for fiscal 2020. We refer to these individuals as our named executive officers (“NEOs”). For fiscal 2020, our NEOs were Steven Yi, our Chief Executive Officer and Co-Founder; Eugene Nonko, our Chief Technology Officer and Co-Founder; and Tigran Sinanyan, our Chief Financial Officer.
This discussion contains forward-looking statements that are based on our current plans, considerations, expectations and determinations regarding future compensation programs. Actual compensation programs that we adopt may differ materially from currently planned programs as summarized in this discussion. As an “emerging growth company” as defined in the JOBS Act, we are not required to include a Compensation Discussion and Analysis section and have elected to comply with the disclosure requirements applicable to emerging growth companies.
Summary compensation table for fiscal year 2020 and 2019
The following table sets forth the total compensation awarded to, or earned by or paid to, our NEOs with respect to fiscal year 2020 and 2019.
|
Name and Principal Position |
|
Year |
|
Salary ($) (1) |
|
|
Bonus ($) |
|
|
|
Stock Awards ($) |
|
|
|
Nonequity incentive plan compensation ($) |
|
|
|
All Other Compensation ($) (7) |
|
|
Total ($) |
|
||||||
|
|
2020 |
|
$ |
512,750 |
|
|
$ |
— |
|
|
|
$ |
34,917,535 |
|
(4) |
|
$ |
675,000 |
|
(6) |
|
$ |
8,550 |
|
|
$ |
36,113,835 |
|
|
|
Steve Yi |
|
2019 |
|
$ |
500,000 |
|
|
$ |
200,000 |
|
(3) |
|
$ |
1,893,783 |
|
(5) |
|
$ |
600,000 |
|
|
|
$ |
8,400 |
|
|
$ |
3,202,183 |
|
|
Chief Executive Officer and Co-founder |
|
|
|
|
|
|
|
|
|
|
|
|
|
|
|
|
|
|
|
|
|
|
|
|
|
|
|
|
|
|
Eugene Nonko |
|
2020 |
|
$ |
534,000 |
|
|
$ |
— |
|
|
|
$ |
34,917,535 |
|
(4) |
|
$ |
675,000 |
|
(6) |
|
$ |
8,550 |
|
|
$ |
36,135,085 |
|
|
Eugene Nonko |
|
2019 |
|
$ |
534,000 |
|
|
$ |
200,000 |
|
(3) |
|
$ |
1,893,783 |
|
(5) |
|
$ |
600,000 |
|
|
|
$ |
8,400 |
|
|
$ |
3,236,183 |
|
|
Chief Technology Officer and Co-founder |
|
|
|
|
|
|
|
|
|
|
|
|
|
|
|
|
|
|
|
|
|
|
|
|
|
|
|
|
|
|
Tigran Sinanyan |
|
2020 |
|
$ |
350,000 |
|
|
$ |
200,000 |
|
(2) |
|
$ |
2,083,272 |
|
(4) |
|
$ |
270,000 |
|
(6) |
|
$ |
8,550 |
|
|
$ |
2,911,822 |
|
|
Tigran Sinanyan |
|
2019 |
|
$ |
300,000 |
|
|
$ |
75,000 |
|
(3) |
|
$ |
235,365 |
|
(5) |
|
$ |
240,000 |
|
|
|
$ |
57,847 |
|
|
$ |
908,212 |
|
|
Chief Financial Officer |
|
|
|
|
|
|
|
|
|
|
|
|
|
|
|
|
|
|
|
|
|
|
|
|
|
|
|
|
|
(1)Salary amounts shown above represent actual salary earned during the year, reported as gross earnings (i.e., gross amounts before taxes and applicable payroll deductions).
(2)For Mr. Sinanyan, reflects the portion of 2020 annual cash bonus awarded for successful completion of our IPO, determined in the discretion of our Compensation Committee. The remaining portion of the NEO’s 2020 annual cash bonus was tied to achievement of Company performance metrics for 2020, and is reported in the “Nonequity incentive plan compensation” column and described in footnote (6) below. Annual cash bonuses for 2020 performance will be paid in early 2021. Amounts in this column are reported as gross earnings (i.e., gross amounts before taxes and applicable payroll deductions).
(3)For each NEO, reflects the portion of 2019 annual cash bonus awarded for the successful completion of our 2019 recapitalization transaction and investment from Insignia, determined in the discretion of the board of directors of QL Holdings LLC. The remaining portion of the NEO’s 2019 annual cash bonus was tied to achievement of Company performance metrics for 2019, and is reported in the “Nonequity incentive plan compensation” column and described in footnote (4) below. Annual cash bonuses for 2019 performance were paid in early 2020. Amounts in this column are reported as gross earnings (i.e., gross amounts before taxes and applicable payroll deductions).
122
(4) The amounts in this column reflect the aggregate grant date fair value of time-vesting restricted stock units granted in fiscal 2020, computed in accordance with Accounting Standards Codification topic 718 as issued by the Financial Accounting Standards Board. For a description of the assumptions used to determine the compensation cost of these awards, see Note 10 to the consolidated financial statements included in Part II-Item 8 Financial Statement and Supplementary Data. For Mr. Sinanyan, the stock awards for 2020 also include QLH Class B-1 units which vests ratable each month over a period of three years (i.e. beginning on May 1, 2020 and ending on April 1, 2023).
(5) The amounts in this column reflect the aggregate grant date fair value of time-vesting Profits Interest Units (defined below under “—Elements of executive compensation—Equity incentive program”) granted in fiscal 2019, computed in accordance with Accounting Standards Codification topic 718 as issued by the Financial Accounting Standards Board. For a description of the assumptions used to determine the compensation cost of these awards, see Note 10 to the consolidated financial statements included in Part II-Item 8 Financial Statement and Supplementary Data.
(6)For each NEO, reflects the portion of 2020 annual cash bonus earned in respect of superior achievement of the Company’s performance goal for 2020, as described under “—Elements of executive compensation—Annual cash bonuses” below. Such amounts were earned at 135% of target. Annual cash bonuses for 2020 performance will be paid in early 2021. Amounts in this column are reported as gross earnings (i.e., gross amounts before taxes and applicable payroll deductions).
(7)Reflects, for each NEO, $8,550 and $8,400 of matching contributions under our 401(k) plan made in respect of fiscal 2020 and 2019, respectively. In addition, fiscal year 2019, for Messrs. Sinanyan only, reflects cash received upon redemption of 25% of his then outstanding and unvested profits interest units in connection with our 2019 recapitalization transaction, equal to $49,447 in the aggregate.
Outstanding equity awards at 2020 fiscal year-end
The following table sets forth information regarding outstanding equity compensation awards held as of December 31, 2020 by our NEOs.
|
|
Number of units that have not vested (#) |
|
|
|
Market value of units that have not vested ($)(3) |
|
|||
|
|
|
1,837,765 |
|
(1) |
|
$ |
71,801,479 |
|
|
|
Eugene Nonko |
|
|
1,837,765 |
|
(1) |
|
$ |
71,801,479 |
|
|
Tigran Sinanyan |
|
|
91,888 |
|
(1) |
|
$ |
3,590,064 |
|
|
Tigran Sinanyan |
|
|
76,190 |
|
(2) |
|
$ |
2,976,743 |
|
|
Tigran Sinanyan |
|
|
29,507 |
|
(2) |
|
$ |
1,152,838 |
|
(1)Reflects the number of unvested time-vesting restricted stock units held, directly or indirectly, by the NEOs as of December 31, 2020. Each NEO’s restricted stock unit award vests quarterly over the first three years following the date of grant which was October 30, 2020 (i.e. beginning on January 30, 2021 and ending on October 30, 2023), subject to continued employment or service with us through each vesting date.
(2)Reflects the number of Class B-1 units, held, directly or indirectly, as of December 31, 2020. As per the original award terms, all unvested Profit Interest Units on the IPO date were exchanged into Class B-1 units, which when vested, together with Class B common stock are exchangeable for Class A common stock. The awards are no longer in the form of profits interests following the IPO. Mr. Sinanyan's award vests over four years, subject to continued service through the applicable vesting date. For Mr. Sinanyan, 25% of the units vested on April 1, 2020, which was the first anniversary of the vesting commencement date set forth in the executive’s award agreement, and the remaining 75% of the Units vests ratably each month over the following 36 months (i.e., beginning on May 1, 2020 and ending on March 31, 2023).
123
(3)The value is based on $39.07, the closing price of the Company’s common stock on December 31, 2020.
Elements of executive compensation
Base salary
Base salaries are intended to provide a level of compensation sufficient to attract and retain an effective management team, when considered in combination with the other components of our executive compensation program. For fiscal year 2020, the relative levels of base salary for our NEOs are designed to reflect each NEO’s scope of responsibility, and in the case of Messrs. Yi and Nonko, reflect the base salary rates agreed to under their respective employment agreements, described below. See the “Salary” column of Summary compensation table for fiscal year 2020, above, for the base salary amounts received by each NEO in fiscal 2020.
Annual cash bonuses
Annual bonus compensation holds executives accountable, rewards the executives based on actual business results and helps create a “pay for performance” culture. The employment agreements for each of Messrs. Yi and Nonko provide that the executive is eligible for an annual target bonus opportunity of 100% of his base salary upon the attainment of one or more pre-established performance goals established by the Board of Directors or the Compensation Committee, in consultation with the executive. Any earned annual bonuses are generally payable as a lump sum during the calendar year following the calendar year with respect to which it is earned following completion of the annual audit of financial statements, unless otherwise approved by the Board of Directors.
In 2020, each NEO was granted a target bonus opportunity that would be payable upon achievement of our annual Adjusted EBITDA target. In light of achievement of the Adjusted EBITDA target for 2020 each NEO was awarded a cash bonus equal to 135% of the executive’s target bonus. Additionally, Messrs. Sinanyan was awarded a discretionary amount for successful completion of our IPO Bonuses in respect of 2020 performance will be paid in early 2021. The following chart shows, for 2020, each NEO’s target bonus opportunity, earned bonus based on Adjusted EBITDA achievement, and additional bonus awarded for successful completion of our IPO:
|
|
2020 target bonus opportunity ($) |
|
|
Bonus earned for Adjusted EBITDA achievement 135% target |
|
|
Bonus for successful IPO ($)(2) |
|
|
Total 2020 bonus payment ($) |
|
|||||
|
Steven Yi |
|
$ |
500,000 |
|
|
$ |
175,000 |
|
|
$ |
— |
|
|
$ |
675,000 |
|
|
Eugene Nonko |
|
$ |
500,000 |
|
|
$ |
175,000 |
|
|
$ |
— |
|
|
$ |
675,000 |
|
|
Tigran Sinanyan |
|
$ |
200,000 |
|
|
$ |
70,000 |
|
|
$ |
200,000 |
|
|
$ |
470,000 |
|
(1)Bonuses earned for Adjusted EBITDA achievement are shown in the “Non-equity incentive plan compensation” column of the Summary compensation table for fiscal 2020 above.
(2)Bonuses awarded for the successful completion of our 2019 recapitalization transaction are shown in the “Bonus” column of the Summary compensation table for fiscal 2020 above.
Yi and Nonko employment agreements
In 2020, in connection with the IPO, the Company and QuoteLab, LLC entered into amended and restated employment agreements with Messrs. Yi and Nonko, in light of the scope and complexity of their public company roles and job responsibilities as the leaders of our business. The amended and restated employment agreements provide for compensation and severance levels that consider the competitive market assessment prepared by the compensation consultant engaged by our Board of Directors, Compensia Inc. (“Compensia”). The executive’s employment agreement sets forth his base salary and target annual bonus (equal to 100% of base salary) and provides for eligibility to participate in our employee benefit plans generally. See “—Summary compensation table for fiscal year 2020” above for information on base salaries and annual bonuses paid to our NEOs in respect of fiscal 2020. The executive’s annual base salary rate will be reviewed annually and may be increased but not decreased.
Under Messrs. Yi’s and Nonko’s employment agreements, upon a termination of employment for any reason, the executive will be entitled to any unpaid base salary through the date of termination and any other amounts or
124
benefits required to be paid or provided either by law or under any employer plan or program (including any earned but unpaid payment of his annual bonus for any fiscal year preceding the fiscal year in which termination occurs, payable on the date bonuses are paid to our other senior executives).
If the executive’s employment is terminated by us without “cause” or by the executive for “good reason” (as such terms are defined in the employment agreement and described below), the executive will additionally be entitled to the following, subject to his delivery of a release of claims in favor of the Company and its affiliates and his material compliance with certain noncompetition, nonsolicitation and other restrictive covenants set forth in his amended employment agreement:
•cash severance equal to 18 months’ base salary, at the rate in effect at the time of termination;
•a severance bonus for the calendar year during which the termination occurs, equal to (x) the executive’s target bonus multiplied by (y) a fraction, the numerator of which is equal to the number of days worked during the calendar year plus 183 days, and the denominator of which is the total number of days in the calendar year, subject to a 12-month minimum;
•the executive will receive 18 months of service credit under the time-based equity awards he then holds; and
•employer contributions to the premium cost for COBRA coverage for the executive and his eligible dependents until the 18-month anniversary of the executive’s termination (or, if earlier, until the executive obtains other employment that offers group health benefits or is otherwise no longer eligible for COBRA coverage).
The executive will also be eligible to receive such severance if, within three months preceding, or 12 months following, a change of control (as defined in the Omnibus Incentive Plan, described below) (the “Change of Control Protection Period”), the executive’s employment is terminated due to the expiration and non-renewal by us of the term of his amended employment agreement. In addition, if during the Change of Control Protection Period, the executive’s employment is terminated by us without cause, by him for good reason, or due to the expiration and non-renewal by us of the term of his employment agreement, the executive will be entitled to full vesting of the time-based equity awards he then holds.
Under the executive’s employment agreement, “cause” generally means the executive’s:
•plea of guilty or nolo contendere to, or indictment for, any felony, or conviction of a crime involving moral turpitude that has had or could reasonably be expected to have a material adverse effect on the Company or any of its subsidiaries;
•commitment of an act of fraud, embezzlement, material misappropriation or breach of fiduciary duty against the Company or any of its subsidiaries;
•failure for any reason, after 10 days’ written notice, to correct or cease any refusal or intentional or willful failure to comply with the lawful, reasonably appropriate requirement of the employer;
•chronic absence from work, other than for medical reasons, or a breach of his obligation to devote his business time, attention and efforts to the business (unless approved by the Board of Directors in writing, or cured by the executive within 10 days following notice from his employer of the event);
•use of illegal drugs that has materially affected the performance of his duties (unless the event is cured by the executive within 10 days following notice from his employer of the event);
•gross negligence or willful misconduct in his duties that has caused substantial injury to the Company (unless the event is cured by the executive within 10 days following notice from his employer of the event); or
•breach of any non-competition, non-solicitation, and/or confidentiality provision or any material breach of any proprietary or confidential information or assignment of inventions agreement between the executive and the Company or any of its subsidiaries (unless the event is cured by the executive within 10 days following notice from his employer of the event).
Under the executive’s employment agreement, “good reason” generally means the occurrence of any of the following events without the consent of the executive, unless such events are fully corrected by the employer within 30 days following written notice, and provided that the executive gives written notice of his resignation within 30
125
days after his actual knowledge of the event and the executive actually terminates his employment within 30 days following the expiration of the employer’s cure period:
•reduction in the amount of the executive’s base salary rate or target bonus opportunity (other than an across-the-board reduction in the salary level or target bonus opportunities of our senior executives as a group by the same percentage amount and approved by the Board of Directors including at least one [founder]);
•change in the executive’s titles, reporting requirements or reduction in his responsibilities materially inconsistent with the positions he holds;
•change in the executive’s place of work to a location more than 25 miles from his present place of work; or
•material breach of the Company’s obligations under the employment agreement.
In addition, under the amended and restated employment agreements, Each of Messrs. Yi and Nonko will also be entitled to payment of any withheld distributions under QL Holdings LLC’s limited liability company agreement upon any of the foregoing qualifying terminations of employment.
Sinanyan employment agreement
In connection with the IPO, the Company and QuoteLab, LLC entered into a new employment agreement with Mr. Sinanyan, setting forth his base salary, target annual bonus and severance opportunities. The Company determined that it would be appropriate to enter into a new employment agreement with Mr. Sinanyan in light of the scope and complexity of his public company role and job responsibilities as our Chief Financial Officer.
Mr. Sinanyan’s new employment agreement provides for base salary, target annual bonus and severance levels that take into account the competitive market assessment prepared by Compensia. Initially, Mr. Sinanyan’s annual base salary rate will be $350,000. His annual base salary rate will be reviewed annually and may be increased but not decreased. His initial target annual bonus opportunity will be 57% of his annual base salary rate and will be subject to the attainment of one or more pre-established performance goals.
In addition, under his new employment agreement, Mr. Sinanyan will be eligible (subject to his delivery of a release of claims in favor of the Company and its affiliates, as well as his material compliance with certain noncompetition, nonsolicitation and other restrictive covenants set forth in his employment agreement) to receive severance if his employment is terminated by us without “cause” or by him for “good reason” (as such terms is defined in the employment agreement and are substantially similar to the definitions in Messrs. Yi and Nonko’s former employment agreements), equal to 12 months’ base salary; up to 12 months of employer contributions to the premium cost for COBRA coverage; and a prorated portion of his annual bonus for the year of termination (subject to a six-month minimum). If, within three months preceding, or 12 months following, a change of control (as defined in the Omnibus Incentive Plan, described below), Mr. Sinanyan’s employment is terminated (x) by us without “cause,” (y) by him for “good reason,” or (z) due to the expiration and non-renewal by us of the term of his employment agreement, his severance would instead equal 18 months’ base salary; up to 18 months of employer contributions to the premium cost for COBRA coverage; a prorated portion of his annual bonus for the year of termination (subject to a six-month minimum); and full vesting of the time-based equity awards he then holds. Mr. Sinanyan will also be entitled to payment of any withheld distributions under QL Holdings LLC’s limited liability company agreement upon any of the foregoing qualifying terminations of employment.
Benefit program
Our NEOs are entitled to participate in the various benefit programs we offer to all of our employees, including a 401(k) plan (until December 31, 2020), medical plan, dental plan, vision plan, life insurance plan, and long-term and short-term disability plans. Under our 401(k) plan, we make safe-harbor matching contributions equal to not less than 3% of an employee’s plan-eligible compensation and may elect to make profit sharing contributions in our discretion. For fiscal 2020, each NEO received a safe-harbor matching contribution of $8,550, and no profit-sharing contributions were made to the plan.
Equity incentive program
In connection with the IPO, we established an omnibus incentive plan (the “Omnibus Incentive Plan”) for the benefit of our employees, officers, directors and consultants, which we will use to provide equity-based incentives to such individuals, aligning their interests with those of our stockholders, described in further detail below.
126
In connection with the IPO, we granted restricted stock unit awards under the Omnibus Incentive Plan (a description of which is provided below) to certain officers, including the NEOs. Messrs. Yi and Nonko each received a restricted stock unit award covering 1,837,765 shares of our Class A common stock. Mr. Sinanyan received a restricted stock unit award covering 91,888 shares of our Class A common stock. The restricted stock units will vest quarterly over the first three years following the date of grant, subject to continued employment or service with us through each vesting date, with limited exceptions for (i) in the case of Messrs. Yi and Nonko, a termination of employment or service due to death or “disability,” or a termination by us without “cause” or by the executive for “good reason” (as such terms will be defined in their respective amended and restated employment agreements), or (ii) for all awards, a change of control or certain qualifying terminations in connection with a change of control (as defined in the Omnibus Incentive Plan, described below). Each restricted stock unit will be entitled to dividend equivalents, which will be payable in cash or shares, as determined by our Compensation Committee, if and when the underlying restricted stock unit vests.
2020 Omnibus incentive plan
In 2020, in connection with the IPO, we adopted the Omnibus Incentive Plan pursuant to which equity-based and cash incentives may be granted to current or prospective directors, officers, employees, and consultants. Awards may include nonqualified stock options, incentive (qualified) stock options, stock appreciation rights, restricted share awards, restricted stock units, performance awards, cash incentive awards, and other equity-based awards (including deferred share units and fully vested shares), as determined by our Compensation Committee, which administers the Omnibus Incentive Plan. Our stockholders approved the Omnibus Incentive Plan prior to the closing of the IPO. Awards may be subject to clawback or forfeiture to the extent required by applicable law (including, without limitation, Section 304 of the Sarbanes-Oxley Act and Section 954 of the Dodd-Frank Wall Street Reform and Consumer Protection Act) and/or the rules and regulations of the NYSE or other applicable securities exchange, or if so required pursuant to a written policy adopted by the Company or the provisions of an award agreement.
Section 162(m) Considerations
In general, Section 162(m) of the Code denies a publicly held corporation a deduction for U.S. federal income tax purposes for compensation paid to any covered employee in excess of $1,000,000 per year. Under Section 162(m) of the Code, as amended by the Tax Cuts and Jobs Act of 2017, the term “covered employee” generally means the chief executive officer, chief financial officer and each NEO whose compensation is required to be reported for the relevant fiscal year. In December 2019, the IRS released proposed regulations under Section 162(m) of the Code, which addressed changes to the Tax Cuts and Jobs Act and, among other things, extended the coverage of Section 162(m) of the Code to include compensation paid by a partnership for services performed for it by a covered employee of a corporation that is a partner in the partnership. The proposed regulations, if they become effective in their current form, may reduce the amount of tax deductions available to the Company and its subsidiaries. Our Compensation Committee retains authority to make payments or grant awards under the Omnibus Incentive Plan or otherwise that are not fully deductible if, in its sole discretion, such payments are necessary to achieve our compensation objectives and to protect stockholder interests.
Director compensation for fiscal year 2020
The following table summarizes the compensation earned by, or awarded or paid to, those directors who, for the year ended December 31, 2020, were compensated for their service as directors. None of the other directors (i.e., those not listed in the table) earned, were awarded or were paid any compensation from us for the year ended December 31, 2020, for their service as directors.
|
|
Year |
|
Board Fees (1)) |
|
|
Stock Awards |
|
|||
|
Morgan Davis |
|
2020 |
|
$ |
40,000 |
|
|
$ |
— |
|
|
Venmal (Raji) Arasu |
|
2020 |
|
$ |
14,375 |
|
|
$ |
300,010 |
|
|
Lara Sweet |
|
2020 |
|
$ |
16,875 |
|
|
$ |
300,010 |
|
|
Kathy Vrabeck |
|
2020 |
|
$ |
18,750 |
|
|
$ |
300,010 |
|
(1)Reflects an annual cash retainer of $40,000, payable quarterly in arrears.
127
(2)Represents the aggregate grant date fair value of the restricted stock unit award granted on October 30, 2020. In addition, three of our non-employee directors who joined our Board of Directors in connection with the IPO, Kathy Vrabeck, Lara Sweet and Venmal (Raji) Arasu, received their initial one-time equity award of $300,000 in the form of restricted stock units, which vests quarterly over three years following the date of grant, subject to continued services through the applicable vesting date. Each of the three non-employee directors were granted 15,790 restricted stock units which vests quarterly over three years (i.e. beginning on October 30, 2020 and ending on October 30, 2023).
In connection with the IPO, the Company implemented a new director compensation policy that will apply to non-employee directors. Members of our Board of Directors who are representatives of White Mountains and Insignia each agreed, subject to annual confirmation and provided that the Company remains a controlled company, to waive fees that would have been due to them under the new director compensation policy in respect of their services on our Board of Directors.
Under the new 2020 director compensation policy, each such non-employee director is entitled to:
•an annual cash retainer of $40,000, payable quarterly in arrears;
•annual equity-based compensation of $175,000 in the form of restricted stock units, subject to the terms described below; and
•for new non-employee directors who join our Board of Directors, an initial, one-time equity award of $300,000 in the form of restricted stock units, granted as of the time of their appointment, which vest quarterly over three years following the date of grant, subject to continued services through the applicable vesting date.
Annual equity awards will be granted to each director as of the date of our annual stockholder meeting, commencing with our first annual stockholder meeting, prospectively for the year of service following the annual stockholder meeting, and will vest on the earlier of (x) the one-year anniversary of the grant date and (y) the following year’s annual stockholder meeting, subject to continued service. Any non-employee director who joins our Board of Directors mid-year will receive prorated annual cash retainers during the director’s first year of service.
In addition, our new director compensation policy provides for annual retainers for the chairperson of our Board of Directors, lead independent director (if applicable), committee chairs and committee members, in the following amounts:
•$25,000 for the chair;
•$20,000 for the lead independent director (if not the chair);
•$20,000 for the chair of our Audit Committee;
•$15,000 for the chair of our Compensation Committee;
•$10,000 for the chair of our Nominating and Corporate Governance Committee;
•$10,000 for each member of the Audit Committee, other than the chair;
•$7,500 for each member of the Compensation Committee, other than the chair; and
•$5,000 for each member of the Nominating and Corporate Governance Committee, other than the chair.
Item 12. Security Ownership of Certain Beneficial Owners and Management and Related Stockholder Matters.
The following table sets forth information with respect to the beneficial ownership of our Class A common stock and Class B common stock, as of March 1, 2021, by:
• each of our named executive officers and directors;
• each person, or group of affiliated persons, known by us to beneficially own more than 5% of our outstanding common stock; and
• all of our executive officers and directors as a group.
128
The number of shares beneficially owned by each stockholder is determined under rules of the SEC and includes voting or investment power with respect to securities. Under these rules, beneficial ownership includes any shares as to which the individual or entity has sole or shared voting power or investment power. In computing the number of shares beneficially owned by an individual or entity and the percentage ownership of that person, shares of common stock subject to options, warrants or other rights held by such person that are currently exercisable or will become exercisable within 60 days are considered outstanding, although these shares are not considered outstanding for purposes of computing the percentage ownership of any other person.
To our knowledge, each of the stockholders listed has sole voting and investment power with respect to the shares beneficially owned by the stockholder unless noted otherwise, subject to community property laws where applicable. Unless otherwise set forth in the footnotes to the table, the address for each listed stockholder is c/o MediaAlpha, Inc., 700 South Flower Street, Suite 640, Los Angeles, California 90017.
|
|
|
Shares of Class A common stock beneficially owned |
|
|
Shares of Class B common stock beneficially owned |
|
||||||||||
|
|
Number |
|
|
% |
|
|
Number |
|
|
% |
|
|||||
|
Named Executive Officers and Directors: |
|
|
|
|
|
|
|
|
|
|
|
|
|
|
|
|
|
Steven Yi (1) |
|
|
306,294 |
|
|
* |
|
|
|
4,811,919 |
|
|
|
19 |
% |
|
|
Eugene Nonko(2) |
|
|
306,294 |
|
|
* |
|
|
|
4,811,919 |
|
|
|
19 |
% |
|
|
Tigran Sinanyan |
|
|
15,315 |
|
|
* |
|
|
|
485,227 |
|
|
|
2 |
% |
|
|
All Directors and Executive Officers as a Group (7 People) |
|
|
809,369 |
|
|
|
2 |
% |
|
|
14,900,636 |
|
|
|
58 |
% |
|
Other 5% Stockholder: |
|
|
|
|
|
|
|
|
|
|
|
|
|
|
|
|
|
White Mountains(3) |
|
|
20,532,202 |
|
|
|
62 |
% |
|
— |
|
|
— |
|
||
|
Kayne Anderson Rudnick Investment Management LLC (4) |
|
|
4,478,491 |
|
|
|
14 |
% |
|
|
|
|
|
|
|
|
|
Insignia(5) |
|
— |
|
|
— |
|
|
|
10,635,407 |
|
|
|
42 |
% |
||
|
Ambrose Wang(6) |
|
|
30,630 |
|
|
* |
|
|
|
3,412,183 |
|
|
|
13 |
% |
|
* Represents beneficial ownership of less than 1%.
(1)Reflects shares of Class B Common Stock held directly by OBF Investments, LLC and 35% of the 565,783 shares of Class B Common Stock held directly by QuoteLab Holdings, Inc. OBF Investments, LLC is indirectly owned by Mr. Yi and his immediate family. Mr. Yi is the indirect holder of 35% of the voting interests and economic interests in QuoteLab Holdings, Inc.
(2)Reflects shares of Class B Common Stock held directly by O.N.E. Holdings, LLC and 35% of the 565,783 shares of Class B Common Stock held directly by QuoteLab Holdings, Inc. Mr. Nonko is the managing member and O.N.E. Holdings, LLC is owned by Mr. Nonko and his immediate family. Mr. Nonko is the indirect holder of 35% of the voting interests and economic interests in QuoteLab Holdings, Inc.
(3)Reflects shares of Class A common stock held by White Mountains Investments (Luxembourg) S.à.r.l., which is a wholly owned indirect subsidiary of White Mountains Insurance Group Ltd. The board of directors and senior officers of White Mountains Insurance Group Ltd. exercise joint voting and investment control over the securities held by White Mountains Investments (Luxembourg) S.à.r.l. The members of such board of directors and such senior officers disclaim beneficial ownership with respect to such securities. The principal business address for White Mountains is 23 South Main Street, Suite 3B, Hanover, NH 03755.
(4) The information relates to beneficial ownership as of December 31, 2020, as reported in an amended Schedule 13G filed with the SEC on February 12, 2021 by Kayne Anderson Rudnick Investment Management LLC (“Kayne”), Virtus Investment Advisers, Inc. (“Virtus Investments”) and Virtus Equity Trust, on behalf of Virtus KAR Small Cap Growth Fund (“Virtus KAR”). For these purposes, (i) Kayne has sole voting power with respect to 1,222,742 shares of Class A common stock, shared voting power with respect to 3,252,749 shares of Class A common stock, sole dispositive power with respect to 1,222,742 shares of Class A common stock, and shared dispositive power with respect to 3,252,749 shares of Class A common stock; (ii) Virtus Investments has shared voting power with respect to 3,252,749 shares of Class A common stock and shared dispositive power with
129
respect to 3,252,749 shares of Class A common stock; and (iii) Virtus KAR has shared voting power with respect to 3,177,190 shares of Class A common stock and shared dispositive power with respect to 3,177,190 shares of Class A common stock.
(5)Reflects shares of Class B common stock held directly by Insignia A QL Holdings, LLC (“Insignia A”) and Insignia QL Holdings, LLC (“Insignia QL”). Insignia Capital Partners (Parallel A), L.P. (“Parallel A”) and Insignia Capital Partners (AIV), L.P. (“Insignia AIV”) are members of Insignia A having the power to appoint the majority of the board of managers of Insignia A. Insignia Capital Partners, L.P. (“Insignia Capital” and together with Parallel A and Insignia AIV, the “Insignia Fund”) is the managing member of Insignia QL. Insignia Capital Partners GP, LLC (“Insignia GP”) is the general partner of the Insignia Fund. The three member Investment Committee of Insignia GP comprised of David Lowe, Anthony Broglio and Melvyn Deane exercises voting and investment control over the securities held directly by Insignia A and Insignia QL, which acts by a majority vote of its members. Consequently, the Insignia Fund and Insignia GP may be deemed to beneficially own the securities held directly by Insignia A and Insignia QL. Messrs. Lowe, Broglio and Deane disclaim beneficial ownership of the securities held directly by Insignia A and Insignia QL. The principal business address of Insignia A, Insignia QL, the Insignia Fund and Insignia GP is 1333 North California Boulevard, Suite 520, Walnut Creek, CA, 94596.
(6) Reflects shares of Class B Common Stock held directly by Wang Family Investments LLC and 30% of the 565,783 shares of Class B Common Stock held directly by QuoteLab Holdings, Inc. Mr. Wang is the managing member and Wang Family Investments LLC is owned by Mr. Wang and his immediate family. Mr. Wang is the indirect holder of 30% of the voting interests and economic interests in QuoteLab Holdings, Inc.
Item 13. Certain Relationships and Related Transactions, and Director Independence.
Other than compensation arrangements for our executive officers and directors which are described elsewhere in this Annual Report on Form 10-K, below we describe transactions since January 1, 2017 to which we were or will be a participant and in which:
•The amounts involved exceeded or will exceed $120,000; and
•Any of our directors, executive officers or holders of more than 5% of our outstanding voting securities, or any member of the immediate family of, or person sharing the household with, the foregoing persons, had or will have a direct or indirect material interest.
In connection with our IPO and pre-IPO Reorganization Transactions, we engaged in certain transactions with White Mountains, Insignia, the Founders and the other Senior Executives, each of which (other than the Senior Executives) is, and will remain, a beneficial owner of 5% or more of our voting securities through ownership of shares of our Class A common stock or Class B common stock. These transactions are described in detail below.
Reorganization agreement
Prior to the IPO, we entered into the reorganization agreement with QLH, White Mountains, Intermediate Holdco, the Legacy Profits Interest Holders and the other members of QLH that sets forth a series of reorganization transactions consummated in connection with the IPO reorganization. These transactions are described in detail under “Part II- Item 8, Note 1 to the Consolidated Financial Statements – Organization and Background” of this Annual Report on Form 10-K.”
Fourth amended and restated limited liability company agreement of QL Holdings LLC
We operate our business through QLH, together with its subsidiaries. The operations of QLH, and the rights and obligations of its members are governed by the fourth amended and restated limited liability company agreement of QLH. Through our wholly owned subsidiary, Intermediate Holdco, we serve as sole managing member of QLH. As such, we control its business and affairs and are responsible for the management of its business.
The fourth amended and restated limited liability company agreement of QLH establishes two classes of equity: Class A-1 units and Class B-1 units. Class A-1 units may be issued only to our wholly owned subsidiary, Intermediate Holdco, as the sole managing member of QLH. Class B-1 units may be issued only to persons or entities we permit which, as of the date of this Annual Report on Form 10-K, are Insignia and the Senior Executives. For a description of the fourth amended and restated limited liability company agreement of QLH and the rights
130
provided to holders of Class A-1 units and Class B-1 units thereunder, see “Part II- Item 8, Note 1 to the Consolidated Financial Statements – Organization and Background” of this Annual Report on Form 10-K.”
Exchange agreement
Immediately prior to the completion of the IPO, we entered into the exchange agreement with Insignia and the Senior Executives, which each hold Class B-1 units of QL Holdings LLC. Pursuant to and subject to the terms of the exchange agreement and the fourth amended and restated limited liability company agreement of QLH, holders of Class B-1 units, at any time and from time to time, may exchange one Class B-1 unit, together with the corresponding share of our Class B common stock, for one share of our Class A common stock (or, at our election, cash of an equivalent value). The amount of Class A common stock issued or conveyed will be subject to equitable adjustments for stock splits, stock dividends, reclassifications and other similar transactions.
Tax receivables agreement
We will obtain an increase in our share of the tax basis of the tangible and intangible assets of QLH as a result of (i) our purchase (through Intermediate Holdco) of Class B-1 units of QLH from certain unitholders (including the Selling Class B-1 Unit Holders) in connection with the IPO, (ii) the Pre-IPO Leveraged Distribution and other actual or deemed distributions by QLH to its members, and (iii) certain post-IPO exchanges of Class B-1 units of QLH, together with an equal number of shares of our Class B common stock, for shares of our Class A common stock (or, at our election, cash of an equivalent value). These increases in tax basis are expected to increase our depreciation and amortization deductions (for tax purposes) and create other tax benefits and therefore may reduce the amount of cash taxes that we would otherwise be required to pay in the future. This existing and increased tax basis may also decrease gain (or increase loss) on future dispositions of certain assets to the extent tax basis is allocated to those assets. We expect to treat any such exchanges of Class B-1 units as our direct purchases of Class B-1 units from holders of Class B-1 units for U.S. federal income and other applicable tax purposes, regardless of whether such Class B-1 units are surrendered by such holders to QLH or to us directly in the exchange.
Immediately prior to the completion of the IPO, we entered into the tax receivables agreement with Insignia, the Senior Executives, and White Mountains related to the tax basis step-up of the assets of QLH and certain net operating losses of Intermediate Holdco. The agreement requires us to pay Insignia and the Senior Executives 85% of the cash savings, if any, in U.S. federal, state and local income tax we realize (or are deemed to realize) as a result of (i) any increases in tax basis following our purchase (through Intermediate Holdco) of Class B-1 units from certain unitholders (including the Selling Class B-1 Unit Holders) in connection with the IPO, as well as any post-IPO exchanges described above, (ii) the Pre-IPO Leveraged Distribution and other actual or deemed distributions by QLH to its members that result in tax basis adjustments to the assets of QLH, and (iii) certain other tax benefits attributable to payments under the tax receivables agreement itself.
The tax receivables agreement also requires us to pay White Mountains 85% of the amount of the cash savings, if any, in U.S. federal, state and local income tax that we realize (or are deemed to realize) as a result of the utilization of the net operating losses of Intermediate Holdco attributable to periods prior to the IPO and the deduction of any imputed interest attributable to our payment obligations under the tax receivables agreement. We currently estimate that the amount of any such net operating losses is immaterial.
The obligations under the tax receivables agreement are our obligations and not obligations of QLH. We will benefit from the remaining 15% of any realized (or deemed to be realized) cash tax savings. For a description of the tax receivables agreement, see “Part II- Item 8, Note 1 to the Consolidated Financial Statements – Organization and Background” of this Annual Report on Form 10-K
Registration rights agreement
Immediately prior to the completion of the IPO, we entered into the registration rights agreement with certain of our pre-IPO shareholders, including White Mountains, Insignia, and the Senior Executives, to register for sale under the Securities Act shares of our Class A common stock, including those delivered in exchange for Class B-1 units of QLH in the circumstances described above. Subject to certain conditions and limitations, this agreement provides White Mountains, Insignia, and the Senior Executives with certain registration rights.
Stockholders’ agreement
Upon the completion of the IPO, we entered into the stockholders’ agreement with White Mountains, Insignia, and the Founders. The stockholders’ agreement contains provisions related to the composition of our Board of Directors, the committees of our Board of Directors and our corporate governance. Under the stockholders’
131
agreement, White Mountains, Insignia, and the Founders are entitled to nominate a majority of the members of our Board of Directors. In addition, White Mountains, Insignia, and the Founders agreed in the stockholders’ agreement to vote for each other’s board nominees.
Indemnification of directors and officers
Our amended and restated bylaws provide that, to the fullest extent permitted by law, we will indemnify any officer or director of our company against all damages, claims and liabilities arising out of the fact that the person is or was our director or officer, or served any other enterprise at our request as a director, officer, employee, agent or fiduciary. In addition, our amended and restated certificate of incorporation provides that our directors will not be personally liable to us or our stockholders for monetary damages for breach of fiduciary duty, except as required by applicable law, as in effect from time to time.
We have entered into customary indemnification agreements with our directors and officers. These agreements require us to indemnify these individuals to the fullest extent permitted under the DGCL against liabilities that may arise by reason of their service to us, and to advance expenses incurred as a result of any proceeding against them as to which they could be indemnified.
There is no pending litigation or proceeding involving any of our directors or officers to which indemnification is being sought, and we are not aware of any pending litigation that may result in claims for indemnification by any director or officer.
Policies and procedures for related party transactions
We have a policy that all material transactions with a related party, as well as all material transactions in which there is an actual, or in some cases, perceived, conflict of interest, will be subject to prior review and approval by our Audit Committee and its independent members, who will determine whether such transactions or proposals are fair and reasonable to MediaAlpha, Inc. and its stockholders. In general, potential related-party transactions will be identified by our management and discussed with our Audit Committee at its meetings. Detailed proposals, including, where applicable, financial and legal analyses, alternatives and management recommendations, will be provided to our Audit Committee with respect to each issue under consideration, and decisions will be made by our Audit Committee with respect to the foregoing related-party transactions after opportunity for discussion and review of materials. When applicable, our Audit Committee will request further information and, from time to time, will request guidance or confirmation from internal or external counsel or auditors.
All related party transactions described in this section occurred prior to adoption of this policy and as such, these transactions were not subject to the approval and review procedures set forth in the policy.
Item 14. Principal Accounting Fees and Services.
The following table summarizes the fees accrued by us for audit and non-audit services provided by PricewaterhouseCoopers LLP for fiscal years 2020 and 2019:
|
Fees |
|
2020 |
|
|
|
2019 |
|
||
|
Audit fees (1) |
|
|
6,114,500 |
|
|
|
|
1,487,500 |
|
|
Audit-related fees (2) |
|
|
- |
|
|
|
|
- |
|
|
Tax fees (3) |
|
|
80,000 |
|
|
|
|
- |
|
|
Other Services fees (4) |
|
|
5,000 |
|
|
|
|
- |
|
|
Total Accounting Fees |
|
|
6,199,500 |
|
|
|
|
1,487,500 |
|
(1)Audit fees for fiscal year 2020 include fees billed for professional services rendered in connection with the audit of our consolidated financial statements, reviews of our quarterly consolidated financial statements, issuances of consents, and similar matters. This category also includes fees for services incurred in connection with the IPO, including 2020 audit of Guilford Holdings, Inc. and 2020 MediaAlpha, Inc., and non-recurring transactions closed in 2020. Audit fees for 2019 includes professional services rendered in connection with the original 2019 audit for QLH, 2018 and 2019 PCAOB uplift efforts for QL Holdings LLC, and 2018 and 2019 audits for Quotelab, LLC.
132
(2)Audit-related fees include fees billed for assurance and related services that are reasonably related to the performance of the audit or review of our consolidated financial statements and not reported under “Audit Fees”. For fiscal years 2020 and 2019, there were no audit-related fees incurred for professional services.
(3)Tax fees include fees for professional services for domestic and international tax advisory and compliance services. For fiscal 2020 tax fees incurred consisted of the analysis of transaction costs incurred by the us in connection with the IPO.
(4)Other services fees include fees for permitted products and services other than those that meet the criteria above. We did not incur any other service fees for fiscal year 2019.
133
Item 15. Exhibits, Financial Statement Schedules.
|
|
(a) |
The following documents are filed as part of this report: |
|
|
1. |
Financial Statements |
The following financial statements are filed as part of this report under Part II, Item 8 "Financial Statements and Supplementary Data.".
|
|
|
Page |
|
|
|
|
|
|
83 |
|
|
|
84 |
|
|
|
85 |
|
|
|
86 |
|
|
|
87 |
|
|
|
88 |
|
|
2. |
Financial Statement Schedule for the Years Ended December 31, 2020, 2019 and 2018 |
All other financial statement schedules are omitted because they are not applicable, or the required information is shown in the consolidated financial statements or notes thereto. See Part II, Item 8 "Financial Statements and Supplementary Data."
|
|
3. |
Exhibits (Listed by numbers corresponding to Item 601 of Regulation S-K) |
|
|
|
|
|
Incorporated by Reference |
||||||
|
Exhibit Number |
|
Exhibit Description |
|
Form |
|
File No. |
|
Exhibit |
|
Filing Date |
|
|
|
|
|
|
|
|
|
|
|
|
|
3.1 |
|
Amended and Restated Certificate of Incorporation of MediaAlpha, Inc. |
|
8-K |
|
001-39671 |
|
3.1 |
|
November 2, 2020 |
|
|
|
|
|
|
|
|
|
|
|
|
|
3.2 |
|
|
8-K |
|
001-39671 |
|
3.2 |
|
November 2, 2020 |
|
|
|
|
|
|
|
|
|
|
|
|
|
|
4.2 |
|
|
8-K |
|
001-39671 |
|
4.1 |
|
November 2, 2020 |
|
|
|
|
|
|
|
|
|
|
|
|
|
|
10.1 |
|
|
8-K |
|
001-39671 |
|
10.1 |
|
November 2, 2020 |
|
|
|
|
|
|
|
|
|
|
|
|
|
|
10.2 |
|
|
8-K |
|
001-39671 |
|
10.2 |
|
November 2, 2020 |
|
|
|
|
|
|
|
|
|
|
|
|
|
134
|
|
|
8-K |
|
001-39671 |
|
10.3 |
|
November 2, 2020 |
||
|
|
|
|
|
|
|
|
|
|
|
|
|
10.4 |
|
|
8-K |
|
001-39671 |
|
10.4 |
|
November 2, 2020 |
|
|
|
|
|
|
|
|
|
|
|
|
|
|
10.5 |
|
|
8-K |
|
001-39671 |
|
10.5 |
|
November 2, 2020 |
|
|
|
|
|
|
|
|
|
|
|
|
|
|
10.6+ |
|
|
8-K |
|
001-39671 |
|
10.6 |
|
November 2, 2020 |
|
|
|
|
|
|
|
|
|
|
|
|
|
|
10.7+ |
|
|
8-K |
|
001-39671 |
|
10.7 |
|
November 2, 2020 |
|
|
|
|
|
|
|
|
|
|
|
|
|
|
10.8+ |
|
|
8-K |
|
001-39671 |
|
10.8 |
|
November 2, 2020 |
|
|
|
|
|
|
|
|
|
|
|
|
|
|
10.9+ |
|
|
8-K |
|
001-39671 |
|
10.9 |
|
November 2, 2020 |
|
|
|
|
|
|
|
|
|
|
|
|
|
|
10.10+ |
|
|
8-K |
|
001-39671 |
|
10.10 |
|
November 2, 2020 |
|
|
|
|
|
|
|
|
|
|
|
|
|
|
10.11+ |
|
|
8-K |
|
001-39671 |
|
10.11 |
|
November 2, 2020 |
|
|
|
|
|
|
|
|
|
|
|
|
|
|
10.12+ |
|
|
8-K |
|
001-39671 |
|
10.12 |
|
November 2, 2020 |
|
|
|
|
|
|
|
|
|
|
|
|
|
|
23.1* |
|
|
|
|
|
|
|
|
|
|
|
|
|
|
|
|
|
|
|
|
|
|
|
31.1* |
|
|
|
|
|
|
|
|
|
|
|
|
|
|
|
|
|
|
|
|
|
|
|
31.2* |
|
|
|
|
|
|
|
|
|
|
|
|
|
|
|
|
|
|
|
|
|
|
135
|
|
|
|
|
|
|
|
|
|
||
|
|
|
|
|
|
|
|
|
|
|
|
|
101.INS |
|
XBRL Instance Document |
|
|
|
|
|
|
|
|
|
|
|
|
|
|
|
|
|
|
|
|
|
101.SCH |
|
XBRL Taxonomy Extension Schema Document |
|
|
|
|
|
|
|
|
|
|
|
|
|
|
|
|
|
|
|
|
|
101.CAL |
|
XBRL Taxonomy Extension Calculation Linkbase Document |
|
|
|
|
|
|
|
|
|
|
|
|
|
|
|
|
|
|
|
|
|
101.DEF |
|
XBRL Taxonomy Extension Definition Linkbase Document |
|
|
|
|
|
|
|
|
|
|
|
|
|
|
|
|
|
|
|
|
|
101.LAB |
|
XBRL Taxonomy Extension Label Linkbase Document |
|
|
|
|
|
|
|
|
|
|
|
|
|
|
|
|
|
|
|
|
|
101.PRE |
|
XBRL Taxonomy Extension Presentation Linkbase Document |
|
|
|
|
|
|
|
|
+ Management contract or compensatory plan or arrangement.
* Filed herewith.
** Furnished herewith. This exhibit should not be deemed to be "filed" for purposes of Section 18 of the Exchange Act.
None.
136
Schedule I – Valuation and Qualifying Accounts and Allowances
|
|
|
Balance at Beginning of the period |
|
|
Additions during the period |
|
|
Write-offs |
|
|
Balance at End of period |
|
||||
|
|
|
|
|
|
|
|
|
|
|
|
|
|
|
|
|
|
|
Deferred tax valuation allowance |
|
|
|
|
|
|
|
|
|
|
|
|
|
|
|
|
|
Fiscal year 2020 |
|
$ |
- |
|
|
|
1,906 |
|
|
|
- |
|
|
$ |
1,906 |
|
|
Fiscal year 2019 |
|
$ |
- |
|
|
|
- |
|
|
|
- |
|
|
$ |
- |
|
|
Fiscal year 2018 |
|
$ |
- |
|
|
|
- |
|
|
|
- |
|
|
$ |
- |
|
|
|
|
|
|
|
|
|
|
|
|
|
|
|
|
|
|
|
|
Allowance for doubtful accounts |
|
|
|
|
|
|
|
|
|
|
|
|
|
|
|
|
|
Fiscal year 2020 |
|
$ |
302 |
|
|
|
526 |
|
|
|
(388 |
) |
|
$ |
441 |
|
|
Fiscal year 2019 |
|
$ |
480 |
|
|
|
354 |
|
|
|
(532 |
) |
|
$ |
302 |
|
|
Fiscal year 2018 |
|
$ |
40 |
|
|
|
532 |
|
|
|
(92 |
) |
|
$ |
480 |
|
137
Pursuant to the requirements of Section 13 or 15(d) of the Securities Exchange Act of 1934, as amended, the Registrant has duly caused this Report to be signed on its behalf by the undersigned, thereunto duly authorized.
|
|
|
MediaAlpha, Inc. |
|
|
|
|
|
|
|
Date: March 15, 2021 |
|
By: |
/s/ Tigran Sinanyan |
|
|
|
|
Tigran Sinanyan |
|
|
|
|
Chief Financial Officer & Treasurer |
Pursuant to the requirements of the Securities Exchange Act of 1934, as amended, this Report has been signed below by the following persons on behalf of the Registrant in the capacities and on the dates indicated.
|
Signature |
|
Title |
|
Date |
|
|
|
|
|
|
|
/s/ Steve Yi |
|
Director and Chief Executive Officer |
|
March 15, 2021 |
|
Steve Yi |
|
|
|
|
|
|
|
|
|
|
|
/s/ Tigran Sinanyan |
|
Chief Financial Officer & Treasurer |
|
|
|
Tigran Sinanyan |
|
|
|
|
|
|
|
|
|
|
|
/s/ Venmal (Raji) Arasu |
|
Director |
|
|
|
Name |
|
|
|
|
|
|
|
|
|
|
|
/s/ Anthony Broglio |
|
Director |
|
|
|
Name |
|
|
|
|
|
|
|
|
|
|
|
/s/ Christopher Delehanty |
|
Director |
|
|
|
Name |
|
|
|
|
|
|
|
|
|
|
|
/s/ David Lowe |
|
Director |
|
|
|
Name |
|
|
|
|
|
|
|
|
|
|
|
/s/ Jennifer Moyer |
|
Director |
|
|
|
Name |
|
|
|
|
|
|
|
|
|
|
|
/s/ Eugene Nonko |
|
Director and Chief Technology Officer |
|
|
|
Name |
|
|
|
|
|
|
|
|
|
|
|
/s/ Lara Sweet |
|
Director |
|
|
|
Name |
|
|
|
|
|
|
|
|
|
|
|
/s/ Kathy Vrabeck |
|
Chair of the Board of Directors |
|
|
|
Name |
|
|
|
|
138