Attached files
| file | filename |
|---|---|
| EX-99.1 - EXHIBIT 99.1 - Lument Finance Trust, Inc. | tm219767d1_ex99-1.htm |
| 8-K - FORM 8-K - Lument Finance Trust, Inc. | tm219767d1_8k.htm |
Exhibit 99.2

March 2021 Lument Finance Trust Q4 2020 Earnings Supplemental
Disclaimer 2 This presentation, any related webcast/conference call, and other oral statements made by our representatives from time to ti me may constitute forward - looking statements within the meaning of Section 27A of the Securities Act of 1933, as amended, and Section 21E of the Securi tie s Exchange Act of 1934, as amended, which reflect the current views of Lument Finance Trust, Inc. (NYSE: LFT) (“LFT” or the “Company”) with respect to, among other things, the Company’s operations and financial performance. You can identify these forward - looking statements by the use of words such as “o utlook,” “indicator,” “believes,” “expects,” “potential,” “continues,” “may,” “will,” “should,” “seeks,” “approximately,” “predicts,” “projects,” “ int ends,” “plans,” “estimates,” “anticipates” or the negative version of these words or other comparable words. Such forward - looking statements are subject to v arious risks and uncertainties. Accordingly, there are or will be important factors that could cause actual outcomes or results to differ mate ria lly from those indicated in these statements. The Company believes these factors include but are not limited to those described under the section entitle d “ Risk Factors” in its Annual Report for fiscal year 2020 on Form 10 - K and other periodic filings with the Securities and Exchange Commission (“SEC”), when ev aluating these forward - looking statements. Additionally, many of these risks and uncertainties are currently amplified by and will continue to be am pli fied by, or in the future may be amplified by, the COVID - 19 outbreak. It is not possible to predict or identify all such risks. Additional information concern ing these and other risk factors are contained in our 2020 Form 10 - K which is available on the SEC’s website at www.sec.gov . These factors should not be construed as exhaustive and should be read in conjunction with the other cautionary statements that are included in this presentation and in the filings. Th e Company assumes no obligation to update or supplement forward-looking statements that become untrue because of subsequent events or circumstances This presentation includes non - GAAP financial measures within the meaning of Item 10(e) of Regulation S - K, as promulgated by the SEC. While we believe the non - GAAP information included in this presentation provides supplemental information to assist investors in analyzing our fi nancials and to assist investors in comparing our results with other peer issuers, these measures are not in accordance with GAAP, and they should n ot be considered a substitute for, or superior to, our financial information calculated in accordance with GAAP. Our GAAP financial results and the reconci lia tions from these results contained herein should be carefully evaluated

Company Overview 3 Key Investment Highlights Strong Sponsorship/Ownership • Access to extensive loan origination platform through affiliation with Lument, a premier national mortgage originator and asset manager • Experienced management team with average of 23 years of industry experience across multiple economic cycles • Affiliation with ORIX Corporation USA, an established international financial firm • The Company is an externally - managed real estate investment trust focused on investing in, financing and managing a portfolio of commercial real estate debt investments • The Company is externally managed by Lument Investment Management, an affiliate of ORIX Corporation USA Attractive Investment Profile • Emphasis on middle market multifamily investments which are well positioned for the current environment • Strong credit and asset management capabilities with zero delinquencies or defaults during the COVID era • Attractive financing sources via non - recourse, non mark - to - market CRE CLOs

Business Update 4 Portfolio • 100% of the loans in our CRE investment portfolio were current as of as of 12/31/20 • During the “COVID era”, we have not granted a single forbearance nor have we experienced a single loan default • 90% of portfolio was multifamily as of 12/31/20. We have no hospitality assets and limited office and retail exposure (less than 10% of portfolio UPB) • LIBOR floors exist on 100% of our loans Performance • Industry leading total shareholder return (1) of 13% including dividends during 2020 despite ongoing pandemic. • Most commercial mortgage REITs in our space had a negative return for the year CLO Financing • Existing CLOs provide non mark - to - market financing • We currently do not finance any of our assets with repurchase facilities and, as such, we are not subject to margin calls Liquidity • To date, we have maintained consistent liquidity and feel our current level of liquidity is adequate • Unrestricted cash of $11.4 million as of December 31, 2020 vs $9.7 million as of September 30, 2020 Lending Environment • Our Manager has seen a significant increase in investment pipeline activity over the last few months, driven by both multifamily value - add acquisition and newly constructed lease up financing requests Note: (1) Based on closing stock prices as of 12/31/2019 and 12/31/2020 and includes all dividends declared during each year.

Q4 2020 Key Updates 5 Note: (1 ) We believe that Distributable Earnings provides meaningful information to consider in addition to our net income (loss) and ca sh flows from operating activities determined in accordance with GAAP . Distributable Earnings mirrors how we calculated Core Earnings in the past. ( 2) Based on UPB. (3 ) If all extensions are exercised by the borrowers, the CRE loan portfolio will have a weighted average remaining term of 37 months. Financial Results • Q4 2020 GAAP Net Income of $ 2.5 million, or $0.10 per share. FY 2020 GAAP Net Income of $8.4 million, or $0.34 per share, which represents a 217% increase year - over - year • Q4 2020 Distributable Earnings (1) of $ 2.6 million, or $ 0.10 per share. FY 2020 Distributable Earnings of $9.8 million or $0.39 per share, which represents a 29% increase year - over - year • Q4 2020 Book Value Per Share of $ 4.56 Dividends • On September 17, 2020, we announced a dividend increase from $0.075 per share to $0.085 per share, a 13% increase over the prior quarter • On December 18, 2020, we announced our second consecutive dividend increase from $0.085 per share to $0.09 per share, a 6% increase over the prior quarter • On December 21, 2020, we announced a one - time special cash dividend of $0.04 per share Highlights • During Q4 2020, the Company acquired and/or funded $5.0 million of new loans and participations at a weighted average spread of LIBOR + 3.94% • 100 % of the new acquisitions were multifamily assets • The Company experienced $56.6 million of loan payoffs during the quarter • For the full year 2020, the Company acquired and/or funded $57.6 million of new loans and participations at a weighted average spread of LIBOR + 3.34% Investment Portfolio Overview • As of 12/31/2020 , 99.8 % (2) of LFT’s investment portfolio consisted of floating - rate CRE loans • The $ 547.3 million CRE loan portfolio had a weighted average remaining term of 12 months (3) and a weighted average coupon of L + 3.50% • The portfolio had a weighted - average LIBOR floor of 1.64% • 90% (2) of the portfolio was multifamily Capitalization • The floating - rate CRE loan portfolio is financed with $ 465.3 million of investment grade notes issued through two CRE CLOs

Q4 and Full Year 2020 Income Statement Summary 6 Summary Income Statement (thousands) Three Months Ended December 31, 2020 Twelve Months Ended December 31, 2020 Net interest income $ 4,639 $18,431 Total other income (loss) (54) (1,071) Operating expenses (2,155) (9,386) Benefit (provision) from income taxes 39 476 Preferred dividends 4 15 Net income attributable to common stockholders $2,465 $8,435 Weighted average shares outstanding during the period 24,943,383 24,934,505 Net income per share $0.10 $0.34 GAAP Net Income to Distributable Earnings Reconciliation (thousands) Three Months Ended December 31, 2020 Twelve Months Ended December 31, 2020 Net Income attributable to common stockholders $ 2,465 $8,435 Adjustments: Unrealized losses (gains) on mortgage servicing rights 177 1,781 Recognized compensation expense related to restricted stock 3 20 Adjustment for (provision for) income taxes (39) (476) Distributable earnings (1) $2,606 $9,759 Weighted average shares outstanding during the period 24,943,383 24,934,505 Distributable earnings per share $ 0.10 $0.39 Dividend per share (2) $ 0.13 $0.37 Note: (1) See Appendix for definition of Distributable Earnings. (2) Includes one - time special dividend of $0.04 per share.
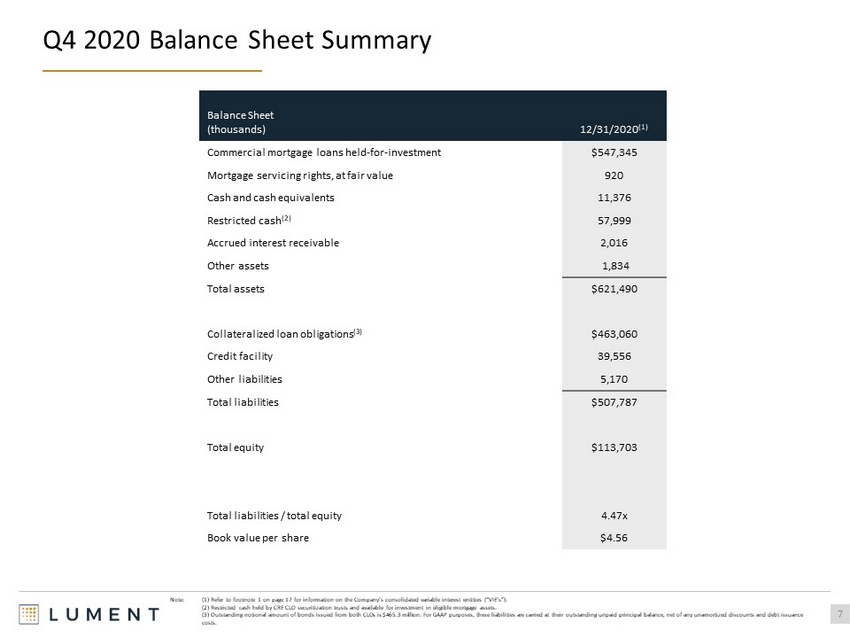
Q4 2020 Balance Sheet Summary 7 Balance Sheet (thousands) 12/31/2020 (1) Commercial mortgage loans held - for - investment $ 547,345 Mortgage servicing rights, at fair value 920 Cash and cash equivalents 11,376 Restricted cash (2) 57,999 Accrued interest receivable 2,016 Other assets 1,834 Total assets $ 621,490 Collateralized loan obligations (3) $ 463,060 Credit facility 39,556 Other liabilities 5,170 Total liabilities $ 507,787 Total equity $ 113,703 Total liabilities / total equity 4.47x Book value per share $ 4.56 Note: (1) Refer to footnote 1 on page 17 for information on the Company’s consolidated variable interest entities (“VIE’s”). (2) Restricted cash held by CRE CLO securitization trusts and available for investment in eligible mortgage assets. (3) Outstanding notional amount of bonds issued from both CLOs is $ 465.3 million. For GAAP purposes, these liabilities are carried at their outstanding unpaid principal balance, net of any unamortiz ed discounts and debt issuance costs.

Track Record of EPS Growth and Book Value Stability 8 $0.06 $0.08 $0.10 $0.10 $0.09 $0.09 $0.11 $0.10 Q1 2020 Q2 2020 Q3 2020 Q4 2020 GAAP Earnings/Share Distributable Earnings/Share $4.57 $4.57 $4.59 $4.56 Q1 2020 Q2 2020 Q3 2020 Q4 2020 GAAP Earnings & Distributable Earnings (1) Per Share of Common Stock Book Value Per Share Note: (1) See Appendix for definition of Distributable Earnings.

Q4 2020 Summary of Investment Portfolio 9 Floating 99.8% Fixed 0.2% First Mortgages 99.8% Residential MSRs 0.2% Investment Portfolio as of September 30, 2020 (thousands) UPB / Notional Net Carrying Value Weighted Average Coupon Weighted Average Remaining Term (months) Weighted Average LTV at Loan Origination Weighted Average Stabilized LTV at Loan Origination First Mortgages $ 547,345 $ 547,345 L + 3.50% 12 (1 ) 74.24% 69.34% Residential MSRs $191,799 $920 0.25% 269 (2 ) Total $739,144 $548,265 Note: (1) If all extensions are exercised by the borrowers, the CRE loan portfolio will have a weighted average remaining term of 37 months. (2) The weighted average remaining term of the residential MSR portfolio is based on the maturity dates of the underlying res id ential loan pool and excludes the impact of potential borrower prepayments. We anticipate that the weighted average remaining term of the portfolio to be less than 269 months. Investment Type Interest Rate Type $548.3 million $548.3 million

Q4 2020 Balance Sheet Summary 10 Multifamily , $5.0 , 100.0% Net Funding Activity (1) Q4 2020 Loan Acquisitions (1) $5.0 million Note: (1) $ In millions. $598.9 $5.0 $(56.6) $547.3 Q3 2020 Portfolio Fundings / Acquisitions Payoffs / Sales Q4 2020 Portfolio • The CRE loan portfolio decreased by $51.6 million in Q4 • We acquired $4.9 million of loans at par from an affiliate of the Manager and funded an additional $0.1 million of future funding participations • We experienced $56.6 million of loan payoffs. $8.0 million of these loans were held in FL1 which is past its reinvestment period, $48.4 million were held in FL2, and $0.2 million were participations held outside the CLOs

Investment Portfolio 11 TX , $211.7 , 39% IL , $82.5 , 15% GA , $43.7 , 8% VA , $40.7 , 7% MD , $33.8 , 6% Other States , $134.9 , 25% Geographic Concentration (1) Multi - Family , $490.1 , 90% Retail , $35.2 , 6% Office , $17.9 , 3% Self - Storage , $4.2 , 1% Property Type (1) $ 547.3 million $ 547.3 million Note: (1) $ In millions, based on UPB. • As of Q4 2020, the Company owned a portfolio of floating - rate CRE loans with an aggregate UPB of $ 547.3 million. 90% of the portfolio was invested in loans backed by multifamily assets • The Company anticipates that the majority of loan activity will continue to be related to multifamily assets. The Company does not own any hospitality assets and has limited exposure to retail and office properties (less than 10% of portfolio UPB) • LIBOR floors exist on 100% of the loans in the Portfolio • During the “COVID era,” the Company has not granted a single forbearance nor has it experienced a single loan default
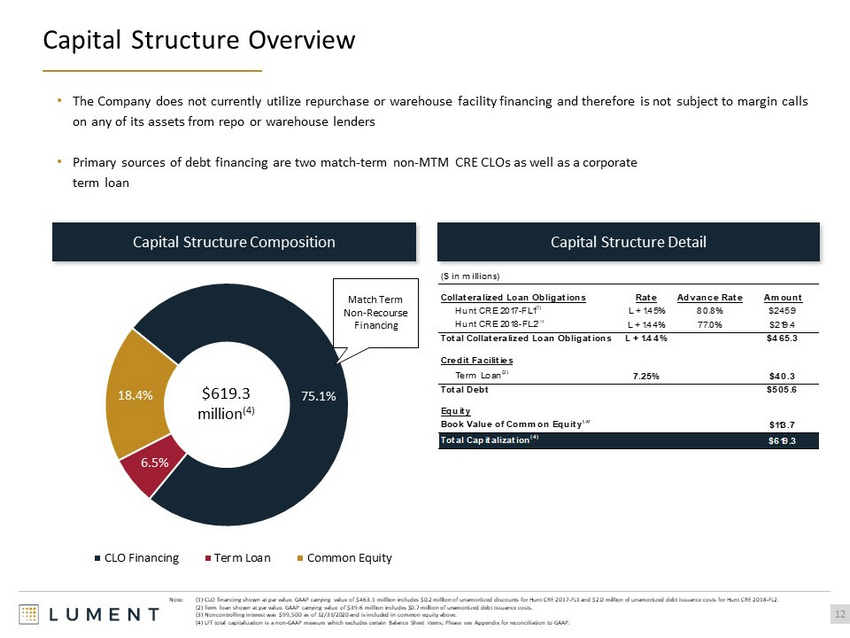
Capital Structure Overview 12 75.1% 6.5% 18.4% CLO Financing Term Loan Common Equity $ 619.3 million (4) Capital Structure Composition Capital Structure Detail Note: (1) CLO financing shown at par value. GAAP carrying value of $ 463.1 million includes $ 0.2 million of unamortized discounts for Hunt CRE 2017 - FL1 and $ 2.0 million of unamortized debt issuance costs for Hunt CRE 2018 - FL2. (2) Term loan shown at par value. GAAP carrying value of $ 39.6 million includes $0.7 million of unamortized debt issuance costs. (3) Noncontrolling interest was $99,500 as of 12/31/2020 and is included in common equity above. (4) LFT total capitalization is a non - GAAP measure which excludes certain Balance Sheet items; Please see Appendix for reconcil iation to GAAP. Match Term Non - Recourse Financing • The Company does not currently utilize repurchase or warehouse facility financing and therefore is not subject to margin call s on any of its assets from repo or warehouse lenders • Primary sources of debt financing are two match - term non - MTM CRE CLOs as well as a corporate term loan ($ in millions) Collateralized Loan Obligations Rate Advance Rate Amount Hunt CRE 2017-FL1 (1) L + 1.45% 80.8% $245.9 Hunt CRE 2018-FL2 (1) L + 1.44% 77.0% $219.4 Total Collateralized Loan Obligations L + 1.44% $465.3 Credit Facilities Term Loan (2) 7.25% $40.3 Total Debt $505.6 Equity Book Value of Common Equity (3) $113.7 Total Capitalization (4) $619.3

Interest Rate Sensitivity as of December 31, 2020 13 Floating Rate Assets (1) $547 Floating Rate Liabilities (2) - $465 Net Exposure $82 $669 ($1,163) ($2,327) ($3,490) ($4,482) -25 bps +0 bps +25 bps +50 bps +75 bps +100 bps $ in Thousands Change in LIBOR Floating - Rate Exposure Annual Net Interest Income Sensitivity to Shifts in One - Month LIBOR (3) $ in Millions Note: (1) Comprised of the Company’s portfolio of floating - rate CRE loans. (2) Comprised of outstanding securitization notes in the CRE CLOs. (3) Assumes starting one - month LIBOR rate of 0.1439%. (4) Negative LIBOR will not have further impacts on P&L. (4)

Appendix

12/31/2020 CRE Loan Portfolio Details 15 Continued on the following page Note: (1) All loan spreads are indexed to one - month LIBOR. (2) LTV as of the date the loan was originated by an affiliate. LTV has not been updated for any subsequent draws or loan mod if ications and is not reflective of any changes in value which may have occurred subsequent to the origination date. # Loan Name Closing Date Maturity Date Property Type City State Current Balance Note Spread (1) Initial Term (months) As-Is LTV at Origination (2) 1 Loan 1 6/5/2018 6/4/2021 Multi-Family Palatine IL 35,625,000 4.30% 37 68.50% 2 Loan 2 11/30/2018 12/6/2021 Multi-Family Nacogdoches TX 35,441,348 4.05% 36 70.39% 3 Loan 3 7/9/2018 8/6/2021 Multi-Family Pikesville MD 33,752,111 3.25% 36 77.59% 4 Loan 4 8/8/2018 8/6/2021 Multi-Family Dallas TX 32,526,660 3.65% 36 81.23% 5 Loan 5 11/22/2019 8/6/2022 Multi-Family Virginia Beach VA 26,500,000 2.75% 33 77.10% 6 Loan 6 5/18/2018 6/4/2021 Multi-Family Woodridge IL 25,355,116 3.75% 37 76.43% 7 Loan 7 12/10/2019 7/6/2022 Multi-Family San Antonio TX 24,540,507 3.15% 30 71.90% 8 Loan 8 1/15/2020 7/6/2022 Multi-Family Chattanooga TN 24,180,000 2.95% 30 80.60% 9 Loan 9 11/26/2019 12/6/2021 Multi-Family Doraville GA 20,000,000 2.75% 25 76.10% 10 Loan 10 12/6/2018 12/6/2021 Multi-Family Greensboro NC 18,703,039 3.35% 37 79.78% 11 Loan 11 12/28/2018 1/6/2022 Retail Austin TX 18,000,000 3.90% 37 71.40% 12 Loan 12 7/10/2019 8/6/2022 Multi-Family Amarillo TX 17,754,112 2.90% 37 76.37% 13 Loan 13 12/28/2018 1/6/2022 Retail Austin TX 17,172,624 4.10% 37 60.50% 14 Loan 14 3/13/2019 4/6/2022 Multi-Family Baytown TX 16,707,856 3.10% 37 80.47% 15 Loan 15 6/28/2018 7/6/2021 Multi-Family Greenville SC 15,245,253 3.90% 37 76.29% 16 Loan 16 8/29/2019 8/6/2022 Multi-Family Austell GA 14,632,203 3.40% 36 72.50% 17 Loan 17 7/23/2018 8/6/2021 Office Chicago IL 12,828,794 3.75% 37 72.74% 18 Loan 18 8/8/2019 8/6/2022 Multi-Family Fort Worth TX 12,649,099 3.00% 36 75.83% 19 Loan 19 1/9/2018 2/6/2021 Multi-Family North Highlands CA 10,158,934 3.95% 37 79.03% 20 Loan 20 3/29/2019 4/6/2021 Multi-Family Portsmouth VA 10,000,000 3.25% 25 61.35%
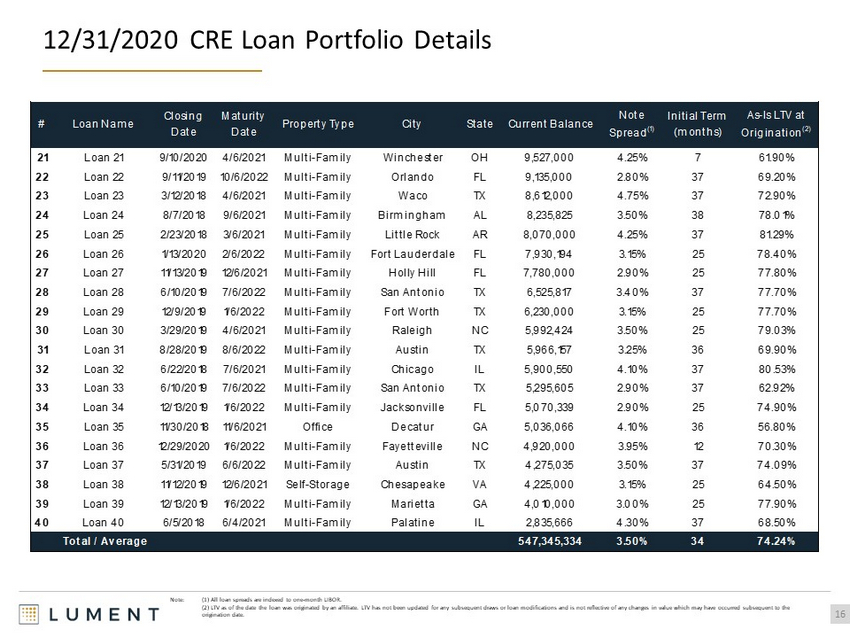
12/31/2020 CRE Loan Portfolio Details 16 Note: (1) All loan spreads are indexed to one - month LIBOR. (2) LTV as of the date the loan was originated by an affiliate. LTV has not been updated for any subsequent draws or loan mod if ications and is not reflective of any changes in value which may have occurred subsequent to the origination date. # Loan Name Closing Date Maturity Date Property Type City State Current Balance Note Spread (1) Initial Term (months) As-Is LTV at Origination (2) 21 Loan 21 9/10/2020 4/6/2021 Multi-Family Winchester OH 9,527,000 4.25% 7 61.90% 22 Loan 22 9/11/2019 10/6/2022 Multi-Family Orlando FL 9,135,000 2.80% 37 69.20% 23 Loan 23 3/12/2018 4/6/2021 Multi-Family Waco TX 8,612,000 4.75% 37 72.90% 24 Loan 24 8/7/2018 9/6/2021 Multi-Family Birmingham AL 8,235,825 3.50% 38 78.01% 25 Loan 25 2/23/2018 3/6/2021 Multi-Family Little Rock AR 8,070,000 4.25% 37 81.29% 26 Loan 26 1/13/2020 2/6/2022 Multi-Family Fort Lauderdale FL 7,930,194 3.15% 25 78.40% 27 Loan 27 11/13/2019 12/6/2021 Multi-Family Holly Hill FL 7,780,000 2.90% 25 77.80% 28 Loan 28 6/10/2019 7/6/2022 Multi-Family San Antonio TX 6,525,817 3.40% 37 77.70% 29 Loan 29 12/9/2019 1/6/2022 Multi-Family Fort Worth TX 6,230,000 3.15% 25 77.70% 30 Loan 30 3/29/2019 4/6/2021 Multi-Family Raleigh NC 5,992,424 3.50% 25 79.03% 31 Loan 31 8/28/2019 8/6/2022 Multi-Family Austin TX 5,966,157 3.25% 36 69.90% 32 Loan 32 6/22/2018 7/6/2021 Multi-Family Chicago IL 5,900,550 4.10% 37 80.53% 33 Loan 33 6/10/2019 7/6/2022 Multi-Family San Antonio TX 5,295,605 2.90% 37 62.92% 34 Loan 34 12/13/2019 1/6/2022 Multi-Family Jacksonville FL 5,070,339 2.90% 25 74.90% 35 Loan 35 11/30/2018 11/6/2021 Office Decatur GA 5,036,066 4.10% 36 56.80% 36 Loan 36 12/29/2020 1/6/2022 Multi-Family Fayetteville NC 4,920,000 3.95% 12 70.30% 37 Loan 37 5/31/2019 6/6/2022 Multi-Family Austin TX 4,275,035 3.50% 37 74.09% 38 Loan 38 11/12/2019 12/6/2021 Self-Storage Chesapeake VA 4,225,000 3.15% 25 64.50% 39 Loan 39 12/13/2019 1/6/2022 Multi-Family Marietta GA 4,010,000 3.00% 25 77.90% 40 Loan 40 6/5/2018 6/4/2021 Multi-Family Palatine IL 2,835,666 4.30% 37 68.50% Total / Average 547,345,334 3.50% 34 74.24%

Consolidated Balance Sheets 17

Consolidated Statement of Income 18

Reconciliation of GAAP to Distributable Earnings 19 GAAP to Distributable Earnings Reconciliation Three Months Ended December 31, 2020 Year Ended December 31, 2020 Reconciliation of GAAP to non - GAAP Information Net income attributable to common stockholders $2,464,678 $8,434,770 Adjustments for non - Distributable earnings Unrealized loss on mortgage servicing rights 177,476 1,780,528 Subtotal 177,476 1,780,528 Other Adjustments Recognized compensation expense related to restricted common stock 2,949 20,292 Provision for income taxes (38,861) (476,248) Subtotal (35,912) (455,956) Distributable Earnings $2,606,242 $9,759,342 Weighted average shares outstanding, b asic and diluted 24,943,383 24,934,505 Distributable Earnings per share, b asic and diluted $0.10 $0.39

Detailed Walk of Capitalization 20 (in 000's) 12/31/2020 Total GAAP liabilities and stockholders' equity $ 621,490 Adjustments for Capitalization ( - ) Accrued interest payable ( 433) ( - ) Dividends payable (3,243) ( - ) Fees and expenses payable to Manager ( 1,156) ( - ) Other accounts payable and accrued expenses (338) ( + ) Other capitalized financing & issuance costs 2,950 LFT Capitalization $ 619,269

Key Definitions 21 “ Distributable Earnings ” is a non - GAAP measure, which we define as GAAP net income (loss) attributable to holders' of common stock, or, without duplication, owners of the Company's subsidiaries, computed in accordance with GAAP, including realized losses not otherwise included in GAAP net income (l oss) and excluding ( i ) non - cash equity compensation, (ii) incentive compensation payable to the Manager, (iii) depreciation and amortization, (iv) any unrealized ga ins or losses or other similar non - cash items that are included in net income for that applicable repotting period, regardless of whether such items are included in other com prehensive income (loss) or net income (loss), and (v) one - time events pursuant to changes in GAAP and certain material non - cash income or expense items after discussi ons with the Company's board of directors and approved by a majority of the Company's independent directors. Distributable Earnings mirrors how we calculate Core Earn ing s pursuant to the terms of our management agreement between our Manager and us, or our Management Agreement, for purposes of calculating the incentive fee p aya ble to our Manager. While Distributable Earnings excludes the impact of any unrealized provisions for credit losses, any loan losses are charged off an d r ealized through Distributable Earnings when deemed non - recoverable. Non - recoverability is determined ( i ) upon the resolution of a loan (i.e. when the loan is repaid, fully or partially, or in the case of foreclosures, when the underlying asset is sold), or (ii) with respect to any amount due under any loan, when such amount is determined to be non - collectible . We believe that Distributable Earnings provides meaningful information to consider in addition to our net income (loss) and c ash flows from operating activities determined in accordance with GAAP. We believe Distributable Earnings is a useful financial metric for existing and potential future hol der s of our common stock as historically, over time, Distributable Earnings has been a strong indicator of our dividends per share. As a REIT, we generally must distribute annually at least 90% of our taxable income, subject to certain adjustments, and therefore we believe our dividends are one of the principal reasons stockholders may invest in our common stock. Refer to Note 16 to our consolidated financial statements for further discussion of our distribution requirements as a REIT. Furthermore , Distributable Earnings help us to evaluate our performance excluding the effects of certain transactions and GAAP adjustments that we believe are not necessarily indicative of our current loan portfolio and operations, and is a performance metric we consider when declaring our dividends . Distributable Earnings does not represent net income (loss) or cash generated from operating activities and should not be con sid ered as an alternative to GAAP net income (loss), or an indication of GAAP cash flows from operations, a measure of our liquidity, or an indication of funds available for our cash needs . In addition, our methodology for calculating Distributable Earnings may differ from the methodologies employed by other companies to calculate the same or similar performance measures, and accordingly, our reported Distributable Earnings may not be comparable to the Distributable Earnings reported by other companies.

March 2021