Attached files
| file | filename |
|---|---|
| 8-K - 8-K - FARMER BROTHERS CO | farm-20210315.htm |

March 2021Investor Presentation

2 Safe Harbor Certain statements contained in this presentation are not based on historical fact and are forward-looking statements within the meaning of federal securities laws and regulations. These statements are based on management's current expectations, assumptions, estimates and observations of future events and include any statements that do not directly relate to any historical or current fact. These forward-looking statements can be identified by the use of words like “anticipates,” “estimates,” “projects,” “expects,” “plans,” “believes,” “intends,” “will,” “could,” “assumes” and other words of similar meaning. Owing to the uncertainties inherent in forward-looking statements, actual results could differ materially from those set forth in forward-looking statements. The Company intends these forward-looking statements to speak only at the time of this press release and does not undertake to update or revise these statements as more information becomes available except as required under federal securities laws and the rules and regulations of the Securities and Exchange Commission (“SEC”). Factors that could cause actual results to differ materially from those in forward-looking statements include, but are not limited to, duration of the COVID-19 pandemic’s disruption to the Company’s business and customers, levels of consumer confidence in national and local economic business conditions, the duration and magnitude of the pandemic’s impact on unemployment rates, the success of the Company’s strategy to recover from the effects of the pandemic, the success of the Company's turnaround strategy, the execution of the five key initiatives, the impact of capital improvement projects, the adequacy and availability of capital resources to fund the Company’s existing and planned business operations and the Company’s capital expenditure requirements, the relative effectiveness of compensation-based employee incentives in causing improvements in Company performance, the capacity to meet the demands of our large national account customers, the extent of execution of plans for the growth of Company business and achievement of financial metrics related to those plans, the success of the Company to retain and/or attract qualified employees, the success of the Company’s adaptation to technology and new commerce channels, the effect of the capital markets as well as other external factors on stockholder value, fluctuations in availability and cost of green coffee, competition, organizational changes, the effectiveness of our hedging strategies in reducing price and interest rate risk, changes in consumer preferences, our ability to provide sustainability in ways that do not materially impair profitability, changes in the strength of the economy, business conditions in the coffee industry and food industry in general, our continued success in attracting new customers, variances from budgeted sales mix and growth rates, weather and special or unusual events, as well as other risks described in this report and other factors described from time to time in our filings with the SEC. The results of one period are not necessarily indicative of the results that may be expected for any future period.
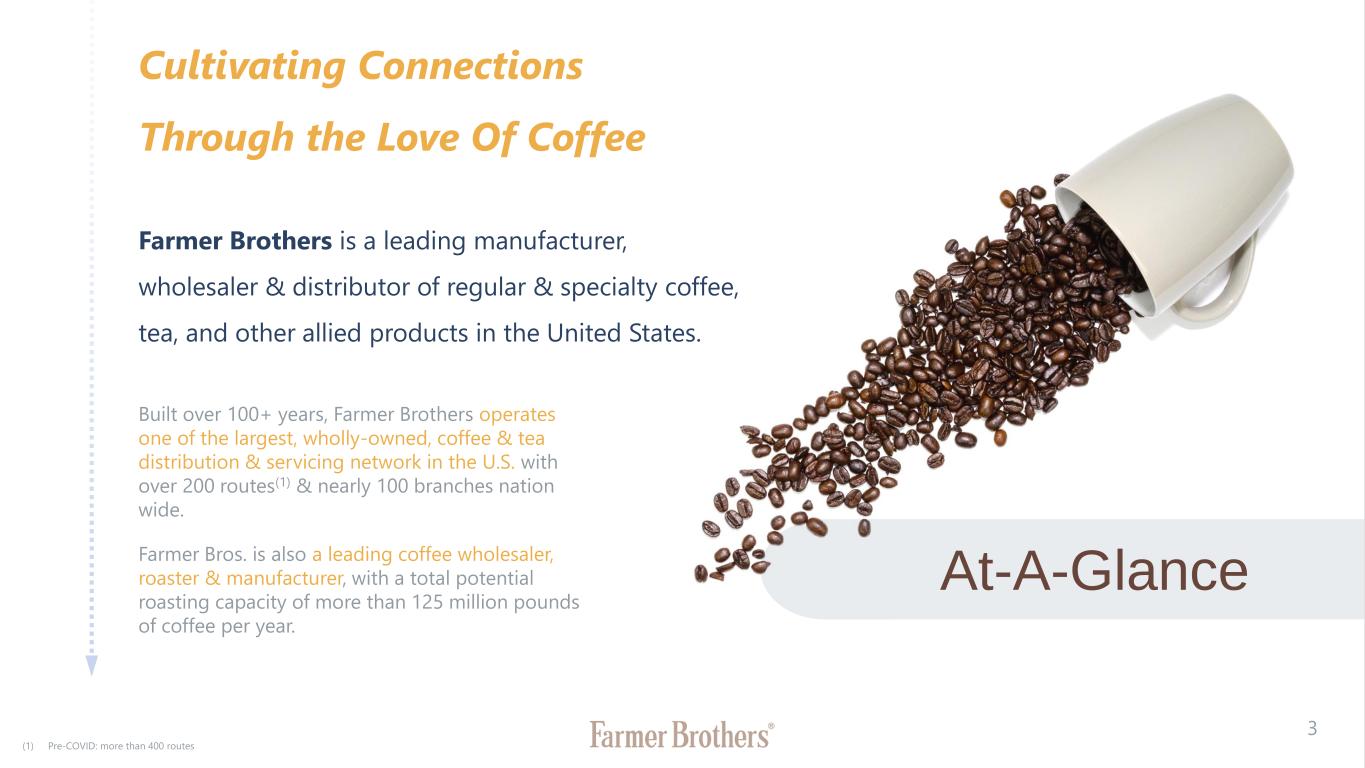
3 Cultivating Connections Through the Love Of Coffee Farmer Brothers is a leading manufacturer, wholesaler & distributor of regular & specialty coffee, tea, and other allied products in the United States. At-A-Glance Built over 100+ years, Farmer Brothers operates one of the largest, wholly-owned, coffee & tea distribution & servicing network in the U.S. with over 200 routes(1) & nearly 100 branches nation wide. Farmer Bros. is also a leading coffee wholesaler, roaster & manufacturer, with a total potential roasting capacity of more than 125 million pounds of coffee per year. (1) Pre-COVID: more than 400 routes

4 Why Now? Poised for Growth & Margin Expansion as COVID-19 Recedes Large & Growing Demand • Coffee is a $76 billion industry growing at 3-5% annually(1) • 63% of American adults drink coffee at least once a day(2) • Favorable consumer trends are emerging as innovation & new products continue to enter the market • Specialty coffee makes up 25% of the market & is forecasted to grow at 12.5% per year through 2021(3) Significant Fixed-Cost Leverage Opportunity • Built over 100+ years; operates one of the largest distribution & equipment service networks in America • Leading manufacturing & roasting capabilities leverage DSD network to cost-effectively (pilot) launch new products • One of the largest & most skilled equipment servicing fleets in the country keeps us “sticky” & provides a strategic advantage New Management Executing on Turnaround Strategy • New team embarked on comprehensive turnaround in 2019, which was accelerated during the COVID-19 pandemic • Rationalized distribution; improved margin profile; implemented new distribution initiatives & technologies; all of which are set to improve margins & increase growth in a post-pandemic environment (1) Techonomic AFH Beverage Study 2016 RSE, 2014-2016 CAGR (2) Statistic 2020 (3) Nielsen XAOC latest 52 weeks; WE 1/27/18

Business Overview
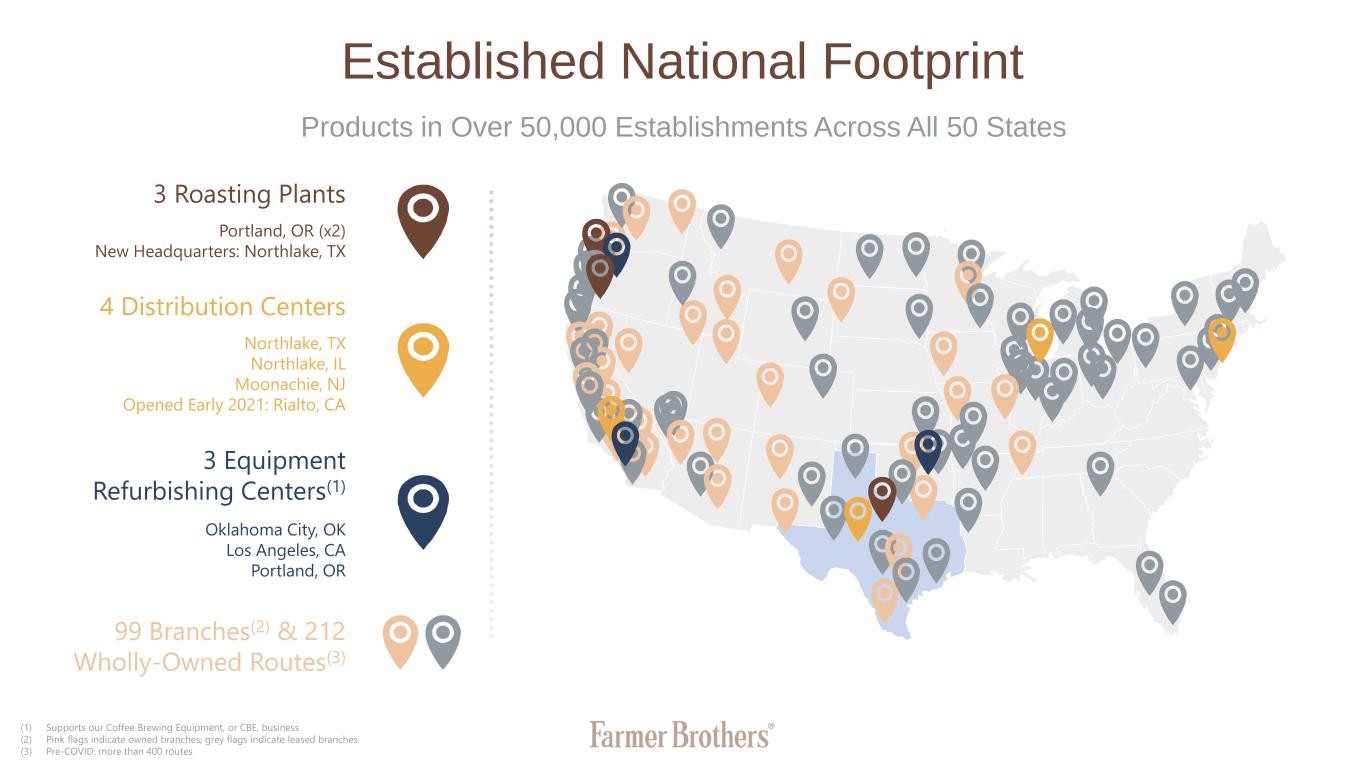
Established National Footprint Products in Over 50,000 Establishments Across All 50 States 3 Roasting Plants Portland, OR (x2) New Headquarters: Northlake, TX 4 Distribution Centers Northlake, TX Northlake, IL Moonachie, NJ Opened Early 2021: Rialto, CA 3 Equipment Refurbishing Centers(1) Oklahoma City, OK Los Angeles, CA Portland, OR 99 Branches(2) & 212 Wholly-Owned Routes(3) (1) Supports our Coffee Brewing Equipment, or CBE, business (2) Pink flags indicate owned branches; grey flags indicate leased branches (3) Pre-COVID: more than 400 routes
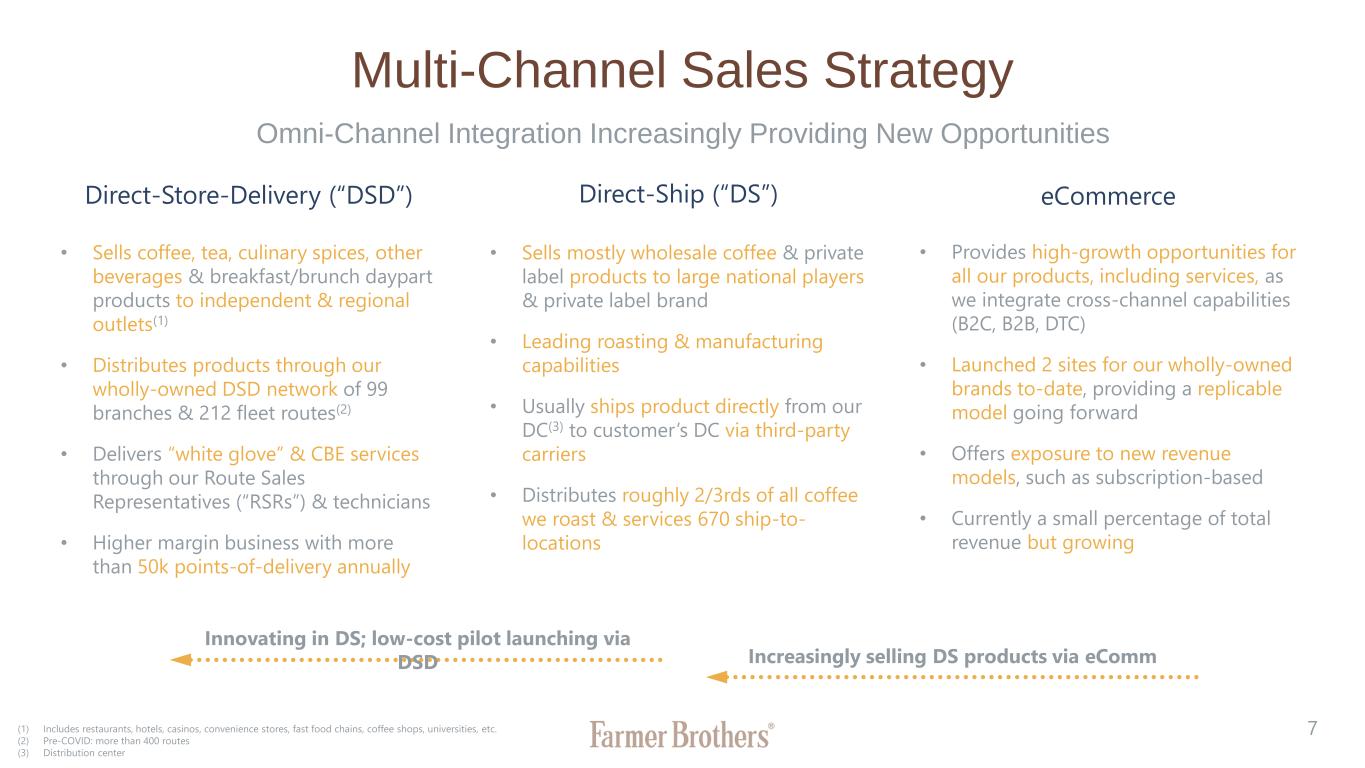
7 Multi-Channel Sales Strategy Omni-Channel Integration Increasingly Providing New Opportunities Direct-Store-Delivery (“DSD”) • Sells coffee, tea, culinary spices, other beverages & breakfast/brunch daypart products to independent & regional outlets(1) • Distributes products through our wholly-owned DSD network of 99 branches & 212 fleet routes(2) • Delivers “white glove” & CBE services through our Route Sales Representatives (“RSRs”) & technicians • Higher margin business with more than 50k points-of-delivery annually Direct-Ship (“DS”) • Sells mostly wholesale coffee & private label products to large national players & private label brand • Leading roasting & manufacturing capabilities • Usually ships product directly from our DC(3) to customer’s DC via third-party carriers • Distributes roughly 2/3rds of all coffee we roast & services 670 ship-to- locations eCommerce • Provides high-growth opportunities for all our products, including services, as we integrate cross-channel capabilities (B2C, B2B, DTC) • Launched 2 sites for our wholly-owned brands to-date, providing a replicable model going forward • Offers exposure to new revenue models, such as subscription-based • Currently a small percentage of total revenue but growing Increasingly selling DS products via eComm Innovating in DS; low-cost pilot launching via DSD (1) Includes restaurants, hotels, casinos, convenience stores, fast food chains, coffee shops, universities, etc. (2) Pre-COVID: more than 400 routes (3) Distribution center

8 DSD: Well-balanced National Business(1) DSD Sales by Region West Northwest South North East Sales by Customer Type Restaurants Convenience Stores & Hotels Healthcare, Casinos, Coffee Shops & All Other DSD Product Sales Coffee Tea, Culinary, Allied (1) As of 3/31/2020

9 Network Supports Coffee & Much More Coffee Accounts for Roughly(1): ~95% of our DS Revenue Other DS products include: • Specialty private labeling & consumer branding, including flavor design, packaging, artwork, etc. We Produce Over 80 Million Pounds of Coffee a Year & Offer More Than 1,000 Different Products ~50% of our DSD Revenue Other DSD products include: • Non-coffee beverages, such as teas & cocoa • Allied, or non-coffee products, such as spices, pancake & biscuit mixes, gravy & sauce mixes, soup bases, dressings, syrups & sauces • Coffee & tea equipment & other ancillary products • Equipment maintenance & refurbishing services Some of Our Brands (1) As of 2020 fiscal yearend
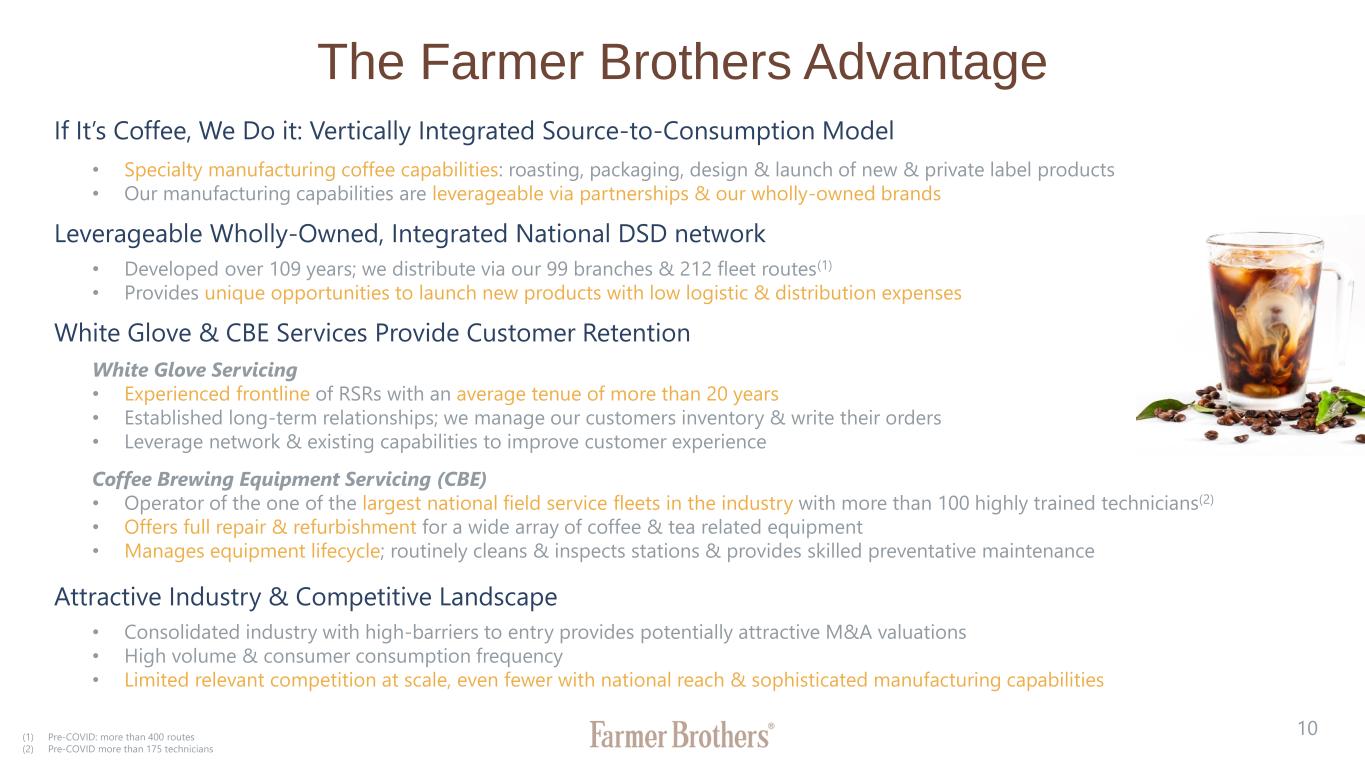
10 The Farmer Brothers Advantage If It’s Coffee, We Do it: Vertically Integrated Source-to-Consumption Model • Specialty manufacturing coffee capabilities: roasting, packaging, design & launch of new & private label products • Our manufacturing capabilities are leverageable via partnerships & our wholly-owned brands Leverageable Wholly-Owned, Integrated National DSD network • Developed over 109 years; we distribute via our 99 branches & 212 fleet routes(1) • Provides unique opportunities to launch new products with low logistic & distribution expenses White Glove & CBE Services Provide Customer Retention White Glove Servicing • Experienced frontline of RSRs with an average tenue of more than 20 years • Established long-term relationships; we manage our customers inventory & write their orders • Leverage network & existing capabilities to improve customer experience Coffee Brewing Equipment Servicing (CBE) • Operator of the one of the largest national field service fleets in the industry with more than 100 highly trained technicians(2) • Offers full repair & refurbishment for a wide array of coffee & tea related equipment • Manages equipment lifecycle; routinely cleans & inspects stations & provides skilled preventative maintenance Attractive Industry & Competitive Landscape • Consolidated industry with high-barriers to entry provides potentially attractive M&A valuations • High volume & consumer consumption frequency • Limited relevant competition at scale, even fewer with national reach & sophisticated manufacturing capabilities (1) Pre-COVID: more than 400 routes (2) Pre-COVID more than 175 technicians

11 Community & Sustainably Driven Sustainability Leadership Abroad • Dedicated staffing focused on sustainability; 9-year history of sustainability reporting with yearly reports • Co-founding member of World Coffee Research (WCR); supports research in origin countries to increase sustainability • Project Direct; work with growers in pursuit of shared value; 11-year-old sourcing history in El Salvador & Nicaragua • Public goal of responsibly sourcing 100% of our green coffee by 2025; currently at 35% Environmentally-Focused at Home • Refurbishing facilities repurpose ~9,000 units/year; 6,744 fewer units purchased in 2020; costs saving of $9.9 million over 2019 • Driving towards zero-waste status in roasting & distribution facilities; companywide, 76% of waste diverted from landfills • 100% of our roasting facilities have achieved zero waste status; 90% diversion from landfill since 2018; currently at 92% diversion • Northlake, IL, distribution center is zero waste (95% diversion); 10% of our branches are zero waste • Recognized by Newsweek as one of America’s Most Responsible Companies of 2021 • First coffee-focused company to adopt the Science Based Targets Initiative (SBTi) with a 1.5°C scenario • Top 7% on CDP Worldwide’s 2020 Supplier Engagement Leaderboard on Climate Change; only 400 companies recognized out of 9,600 worldwide; scored into the CDP Leadership band (meaning A or A-) since 2017 • HQ office & Portland facility are LEED® Silver certified We View Social Involvement & Sustainability as Part of Our Responsibility

Turnaround & Optimization Strategy

13 Turnaround Timeline New Management Team (2019-2020) • Begins to form in late 2019; experienced in turnarounds, specifically in coffee, DSD, distribution & manufacturing • Laid out comprehensive “5 E’s” turnaround strategy Problem (~2018) • Relocated corporate headquarters from CA to TX (loss of innate knowledge/experience) • Previous management team prioritized & invested heavily in capacity • Cash flow began to deteriorate as acquisitions at questionable valuations were integrated; inventory built up • The combination of financial & operational challenges lead to liquidity issues Our “5 E” Plan (2019-2020) • Execute optimization, Elevate innovation, Enrich customer relationships, Enhance process, Empower talent Optimization Execution: COVID Disruptions & Recent Strategy Acceleration (2020-2021) • Defend: stabilized balance sheet by mid 2020; implemented cost-savings; enhanced working capital position; implemented capital spending controls; amended revolver to improve liquidity flexibility • Optimize: executed operational initiatives by late 2020; optimized product portfolio; closed inefficient manufacturing plant; opened new distribution center closer to our highest concentrated markets • Offense: leverage manufacturing & distribution network via partnerships, cross-channel selling, and innovation Looking Forward: Turn to Offense (2021+) • Positioned to drive margin expansion & growth as COVID recedes & volumes increase

14 Execution on 5 E’s Elevate Innovation • Launched eComm sites for two of our wholly-owned retail brands (Boyd’s & Public Domain) using a replicable model • Omni-channel (cross) integration gives customers the products they need in whatever way is most convenient to them • Bringing the latest in new products to our network via partnerships & innovation Execute Optimization • Rebalanced volumes across roasting facilities; opened West Coast distribution center & closed Houston facility • Consolidated many & continue to consolidate SKU’s categorically to improve product portfolio & sustainability • Improved demand planning by collecting & using better data instead of forecasting; reduced variability & cost Enrich Customer Relationships • Revamped marketing & sales strategies; rolled-out handheld devices with pre-sale capabilities (HighJump) across DSD network • Implemented & scaled new digital technologies: eComm platform & advanced CRM • Launched tailored customer loyalty programs & deployed dedicated Sales Ambassador’s to high-volume markets • Trained RSR’s in basic equipment repair Enhance Processes • Implemented analytics software to capture more profitability & data (PowerBI in DSD) • HighJump rollout provides more reliable data for sales & inventory in real-time • Enhancing our processes & systems will elevate the execution of our team & customer service Empowering Talent • Migrated from 6 disparate/HR systems to 2 and transitioned to an employee life cycle model • Deployed new training tools, aligned incentives & created a new Leadership Development Program • Implemented several wellness and D&I initiatives

15 Revamped Management Team Deverl Maserang, President & CEO – Joined September 2019 • Over 35 years of leadership in turnarounds & global supply-chain transformations in coffee, food & distribution arenas • Previously CEO & President at Earthbound Farm Organics, where he led the turnaround & returned the Company to profitability in 18-months; prior to that, held executive committee roles at Starbucks & Chiquita/Fresh Express, and held several other senior roles Pepsi Cola, United Parcel Service & various start-ups Nathalie Fontanilla Oetzel, VP of Product Marketing & Innovation – Joined December 2019 • Over 20 years in the food industry having worked on various food categories • Previously VP of Marketing, Research Development & Innovation at Danone North America’s, working for the Earthbound Farm business unit; member of executive leadership team, led Earthbound Farm’s marketing & innovation programs Maurice Moragne, Chief Sales Officer – Joined June 2020 • Over 30 years of success & change management experience in food/agriculture, tobacco & cosmetics industries • Unique scope of experience spanning sales, trade marketing, brand management, & general management across a wide array of industries & distribution channels Rueben Inofuentes, Chief Supply Officer – Joined November 2019 • Over 20 years of experience in operations & supply chain • Previously COO for JR286, a global leader in the sporting goods industry • Over 20 years of financial executive and strategy experience in the food & beverage & retail industries • Previously Sr. VP and VP of GameStop & 7-Eleven Scott Drake, Chief Financial Officer & Treasure – Joined March 2020

16 Stabilized Balance Sheet & Right-Sized Cost Structure Addressed Pension Overhang • Consolidated three defined benefit plans into two frozen plans • Terminated Retiree Medical Plan, eliminating over $14 million of obligations Amended Debt Revolver • From credit facility to ABL structure to better leverage significant collateral package with real estate holdings & equipment • Eliminated leverage & interest coverage covenants & provided liquidity flexibility to execute on key strategic initiatives Optimized Cost Structure Across Business • Rationalized customer strategy; implemented tiers & prioritized most profitable customers • Reduced product portfolio & implemented cost-saving technologies • Improved working capital position; reduced AR, balanced inventory & added CAPEX spending controls • Restructured workforce hierarchy: improved department reporting & reduced headcount • Rebalanced manufacturing & production capabilities across national network Millions in Annual Savings

17 Rebalanced Manufacturing & Production Capabilities • Shut down oldest manufacturing facility, which was inefficient, inflexible & costly to operate • Rebalanced volumes to nearby and newly improved DFW facility & to Portland facilities • Relocated best equipment from Houston; added new NEPTUNE roaster; operationalized new retail packaging lines • Currently roasting & packaging >50 million lbs. of coffe per year; at full capacity (req. addl. investment), can do more than 100 million lbs./yr. • Established premier distribution center in Rialto, CA • More than 40% of our customers are located on the West Coast • Facility includes a refurbishing center for our CBE business & newly added equipment to enhance specialty & flavoring capabilities Opened: West Coast Distribution Center Improved: Dallas-Fort Worth Facility (DFW) Closed: Houston Manufacturing Facility Dallas-Fort Worth Facility West Coast Distribution Center
18 COVID-19: Accelerating Our Strategy Reduced Volumes Provided Deeper Business Insights; Optimized Business from Ground Up The Impact Direct-Store-Delivery (DSD) • Experienced YoY downdraws of ~70% at trough • As of 2020 calendar year end, was down ~40% on a YoY basis; has posted consistent month-to-month improvements YTD Direct Ship (DS) • Experienced YoY downdraws of ~15% at trough • As of 2020 yearend; was down ~10% on a YoY basis (removed some unprofitable customers) The Response • Conducted a detailed audit of our product portfolio & rationalized our business • Tier-ranked our customers & developed new targeting strategies for top-tier buckets • Cut unprofitable accounts & optimized SKUs • Strengthened our balance sheet & liquidity position • Implemented $6.5 million monthly savings goals; exceeded throughout 4Q20 • Improved working capital position • Improved production & distribution structure • Restructured sales team: added Chief Sales Office & Sales Ambassadors • Rationalized service regions; reduced regions from 9 to 4 • Modernized business by implementing several new technologies; added pre-sale capabilities • Improved inventory reporting from 2 days to 60 minutes

19 Forward-Looking Growth Initiatives Move Closer to Customers • White glove services; keep our customers in-stock & expand our base (typically, we are our customers sole coffee provider) • CBE business; piloting third-party maintenance & repairs opportunities Further Unlock 109-Year-Old National Distribution Network • Leverage network to become the premier specialty distribution company • Build market-expanding partnerships that expose us to industry innovation; cost-effectively test & scale new products Innovate & Integrate: eComm (DTC), B2C & B2B • Invest in infrastructure & operational upgrades, such as a fully automated back office, which is underway • Leverage cross-channel synergies to test & launch new allied & coffee products • Continue to roll-out eComm sites across our business; two sites launched to-date Improve Go-to-Market Sales Approaches • Improve pre-sale strategies; phone/online to remote/low volume customers allows route drivers more time to sell • Leverage fully dedicated Sales Ambassadors to pursue new customers • Continue to improve customer support; already added a 24/7 call center Leverage Internal & External Contract Manufacturing Capabilities • Become a contract manufacturer for both our institutional food service & retail channels • Run efficiently & near capacity; continue to utilize partnerships & cross-channel integration

Takeaways 20 New Management Quickly established & executed on turnaround initiatives Stabilized the Business Strengthened balance sheet; right-sized cost structure & improved working capital Optimized Supply Chain Exited Houston; re-entered CA; improved DFW; effectively rebalancing volumes Accelerate Growth Initiatives Leverage structure & innovate; partnerships; eComm & Omni-channel; allied; specialty; etc.

Financials

22 Selected Income Data(1) (1) Unaudited ($ in thousands, except per share data) FY 2017 FY 2018 FY 2019 FY 2020 FY21 Q1 (Sep) FY21 Q2 (Dec) Net Revenue 541,500 606,544 595,942 501,320 97,270 104,571 GOGS 354,622 399,502 416,840 363,198 74,851 78,321 Gross Profit 186,878 207,042 179,102 138,122 22,419 26,250 Selling Expenses 133,534 153,391 139,647 121,762 23,498 24,769 G&A Expenses 42,945 49,429 48,959 42,569 9,746 11,570 Restructuring & Other Expenses 11,016 662 4,733 - - - Impairment of Goodwill, Intangible & Fixed Assets - 3,820 - 42,030 - 1,243 Net Losses/(Gains): Sale of Assets (39,578) (966) 465 (25,237) 618 (1,168) Operating Expenses 147,700 205,918 193,804 181,124 33,862 36,414 Operating Income/(Loss) 38,934 1,053 (14,702) (43,002) (11,443) (10,164) Total Other (Expense)/Income (1,812) (2,091) (18,782) 5,720 5,315 6,142 Income Before Provision for Income Taxes 37,366 (967) (33,484) (37,282) (6,128) (4,022) Provision for Income Taxes 14,815 17,313 40,111 (195) 142 13,703 Net Income 22,551 (18,280) (73,595) (37,087) (6,270) (17,725) Preferred Stock Dividends - 390 535 554 142 143 Net Income Attr. to Common Stockholders 22,551 (18,670) (74,130) (37,641) (6,412) (17,868) EPS (GAAP) 1.34 (1.11) (4.36) (2.19) (0.37) (1.02) Diluted S/O 16,786 16,760 16,996 17,206 17,420 17,532

23 Gross Income & Margin(1) 0 5 10 15 20 25 30 35 40 45 $- $10,000 $20,000 $30,000 $40,000 $50,000 $60,000 MAR '17 JUN '17 SEP '17 DEC '17 MAR '18 JUN '18 SEP '18 DEC '18 MAR '19 JUN '19 SEP '19 DEC '19 MAR '20 JUN '20 SEP '20 DEC '20 Gross Income Gross Margin Cost Improvements Reflected in Gross Margins Are Accelerating Historical Gross Margins ~35% % (1) Source: FactSet

24 Adjusted EBITDA(1) (1) Unaudited ($ in thousands) FY 2017 FY 2018 FY 2019 FY 2020 FY21 Q1 (Sep) FY21 Q2 (Dec) Depreciation & Amortization 22,968 30,464 31,065 29,896 7,041 7,308 EBITDA 62,519 32,674 14,565 (7,556) 2,906 5,294 Adjusted EBITDA 42,979 47,563 31,883 18,740 5,693 8,274 Reconciliation Net Income/(Loss) 22,551 (18,280) (73,595) (37,087) (6,270) (17,725) Income Tax Expense 14,815 17,313 40,111 (195) 142 13,703 Interest Expense 2,185 3,177 6,036 5,590 1,993 2,002 D&A Expense 22,968 30,464 31,065 29,896 7,041 7,308 ESOP & Stock-based Comp Expense 3,959 3,822 3,723 4,328 1,155 794 Net Losses/(Gains) from Sale of Assets (39,578) (966) 465 (25,238) 618 (1,168) Income from ST Investments (1,856) (19) - - - - Non-Recurring Proxy Contest-Related Expenses 5,185 - - 463 - - Impairment Losses on Goodwill & Intangible Assets - 3,820 - 42,030 - 1,243 Restructuring, Strategic & Other Non-Recurring 12,750 8,232 13,130 4,713 1,014 2,117 Pension/Postretirement One-Time Expense - - 10,948 (5,760) - - Adjusted EBITDA 42,979 47,563 31,883 18,740 5,693 8,274

25 Common Size & Margin Profile(1) (1) Unaudited FY 2017 FY 2018 FY 2019 FY 2020 FY21 Q1 (Sep) FY21 Q2 (Dec) Gross Margin 34.5% 34.1% 30.1% 27.6% 23.0% 25.1% Selling Expenses 24.6% 25.5% 23.4% 24.3% 24.2% 23.7% G&A Expenses 7.9% 7.9% 8.2% 8.5% 10.0% 11.1% Operating Margin 7.2% 0.2% -2.5% -8.6% -11.8% -9.7% EBITDA Margin 11.5% 5.4% 2.4% -1.5% 3.0% 5.1% Adjusted EBITDA Margin 7.9% 7.8% 5.4% 3.7% 5.9% 7.9% Profit Margin 4.2% -3.0% -12.3% -7.4% -6.4% -17.0%

26 Selected Balance Sheet Data(1) (1) Unaudited ($ in thousands) FY 2017 FY 2018 FY 2019 FY 2020 FY21 Q1 (Sep) FY21 Q2 (Dec) Cash & Cash Equivalents 6,609 2,438 6,983 60,013 11,025 5,857 Accounts Receivable 46,446 58,498 55,155 40,882 42,115 41,864 Inventory 56,251 104,431 87,910 67,408 71,729 80,617 Goodwill & Intangibles 29,614 67,739 65,102 20,662 20,059 19,457 Accounts Payable 39,784 56,603 72,771 36,987 50,038 49,797 Current Portion of LT Debt 27,621 89,787 - - - - LT Debt Excl. Lease Obligations - - 92,000 122,000 69,800 82,000 Lease Obligations 237 58 (2) 15,637 21,818 20,770 Accrued Postretirement Benefits 19,788 20,473 23,024 9,993 10,151 10,309 Accrued Pension Liabilities 51,281 40,380 47,216 58,772 59,097 56,358 Stockholder's Equity 215,135 229,055 157,494 111,913 103,628 96,193

Contact Us Investor Relations investor.relations@farmerbros.com
