Attached files
| file | filename |
|---|---|
| EX-21.1 - EX-21.1 - Certara, Inc. | cert-20201231xex21d1.htm |
| EX-32.2 - EX-32.2 - Certara, Inc. | cert-20201231xex32d2.htm |
| EX-32.1 - EX-32.1 - Certara, Inc. | cert-20201231xex32d1.htm |
| EX-31.2 - EX-31.2 - Certara, Inc. | cert-20201231xex31d2.htm |
| EX-31.1 - EX-31.1 - Certara, Inc. | cert-20201231xex31d1.htm |
| EX-10.18 - EX-10.18 - Certara, Inc. | cert-20201231xex10d18.htm |
| EX-10.14 - EX-10.14 - Certara, Inc. | cert-20201231xex10d14.htm |
| EX-10.12 - EX-10.12 - Certara, Inc. | cert-20201231xex10d12.htm |
| EX-10.11 - EX-10.11 - Certara, Inc. | cert-20201231xex10d11.htm |
| EX-10.2 - EX-10.2 - Certara, Inc. | cert-20201231xex10d2.htm |
| EX-4.2 - EX-4.2 - Certara, Inc. | cert-20201231xex4d2.htm |
UNITED STATES
SECURITIES AND EXCHANGE COMMISSION
Washington, D.C. 20549
FORM 10-K
(Mark One)
☒ | ANNUAL REPORT PURSUANT TO SECTION 13 OR 15(d) OF THE SECURITIES EXCHANGE ACT OF 1934 |
For the fiscal year ended December 31, 2020
OR
☐ | TRANSITION REPORT PURSUANT TO SECTION 13 OR 15(d) OF THE SECURITIES EXCHANGE ACT OF 1934 |
For the transition period from _____to _____
Commission File Number: 001-39799
Certara, Inc.
(Exact Name of Registrant as Specified in Its Charter)
Delaware | 82-2180925 |
(State or other jurisdiction of incorporation or organization) | (I.R.S. Employer Identification No.) |
| |
100 Overlook Center, Suite 101 Princeton, New Jersey | 08540 |
(Address of principal executive offices) | (Zip Code) |
Registrant’s telephone number, including area code: (609) 716-7900
Securities registered pursuant to Section 12(b) of the Act:
|
| |
| Name of each exchange |
Title of each class | | Trading Symbol | | on which registered |
Common stock, par value $0.01 per share | | CERT | | The Nasdaq Stock Market LLC |
Securities registered pursuant to Section 12(g) of the Act: None
Indicate by check mark if the registrant is a well-known seasoned issuer, as defined in Rule 405 of the Securities Act.
Yes ☐ No ☒
Indicate by check mark if the registrant is not required to file reports pursuant to Section 13 or Section 15(d) of the Act.
Yes ☐ No ☒
Indicate by check mark whether the registrant (1) has filed all reports required to be filed by Section 13 or 15(d) of the Securities Exchange Act of 1934 during the preceding 12 months (or for such shorter period that the registrant was required to file such reports), and (2) has been subject to such filing requirements for the past 90 days. Yes ☒ No ☐
Indicate by check mark whether the registrant has submitted electronically every Interactive Data File required to be submitted pursuant to Rule 405 of Regulation S-T (§ 232.405 of this chapter) during the preceding 12 months (or for such shorter period that the registrant was required to submit such files). Yes ☒ No ☐
Indicate by check mark whether the registrant is a large accelerated filer, an accelerated filer, a non-accelerated filer, a smaller reporting company, or an emerging growth company. See the definitions of “large accelerated filer,” “accelerated filer,” “smaller reporting company,” and “emerging growth company” in Rule 12b-2 of the Exchange Act.
Large accelerated filer ☐ | | Accelerated filer ☐ |
| | |
Non-accelerated filer ☒ | Smaller reporting company ☐ | |
| | |
| | Emerging growth company ☒ |
If an emerging growth company, indicate by check mark if the registrant has elected not to use the extended transition period for complying with any new or revised financial accounting standards provided pursuant to Section 13(a) of the Exchange Act. ☐
Indicate by check mark whether the registrant has filed a report on and attestation to its management’s assessment of the effectiveness of its internal control over financial reporting under Section 404(b) of the Sarbanes-Oxley Act (15 U.S.C. 7262(b)) by the registered public accounting firm that prepared or issued its audit report. ☐
Indicate by check mark whether the registrant is a shell company (as defined in Rule 12b-2 of the Exchange Act). Yes ☐ No ☒
The registrant was not a public company as of June 30, 2019, the last business day of its most recently completed second fiscal quarter, and therefore, cannot calculate the aggregate market value of its voting and non-voting common equity held by non-affiliates as of such date. The registrant’s common stock began trading on The Nasdaq Global Select Market on December 11, 2020.
As of March 4, 2021, the registrant had 152,979,479 shares of common stock, par value $0.01 per share, outstanding.
DOCUMENTS INCORPORATED BY REFERENCE
Portions of the proxy statement for the registrant’s 2021 Annual Meeting of Stockholders to be held May 18, 2021 are incorporated by reference in Part III of this Annual Report on Form 10-K.
| Page |
| |
| |
6 | |
| |
19 | |
| |
48 | |
| |
48 | |
| |
49 | |
| |
49 | |
| |
| |
| |
50 | |
| |
52 | |
| |
Item 7. Management’s Discussion and Analysis of Financial Condition and Results of Operations | 52 |
| |
Item 7A. Quantitative and Qualitative Disclosures About Market Risk | 76 |
| |
78 | |
| |
Item 9. Changes in and Disagreements With Accountants on Accounting and Financial Disclosure | 113 |
| |
113 | |
| |
113 | |
| |
| |
| |
Item 10. Directors, Executive Officers and Corporate Governance | 114 |
| |
114 | |
| |
120 | |
| |
Item 13. Certain Relationships and Related Transactions, and Director Independence | 120 |
| |
120 | |
| |
| |
| |
121 | |
| |
122 | |
| |
123 |
2
Certara, Inc.
Unless otherwise indicated, references to the “Company,” “Certara,” “we,” “us” and “our” refer to Certara, Inc. and its consolidated subsidiaries.
SPECIAL NOTE REGARDING FORWARD-LOOKING STATEMENTS
This Annual Report on Form 10-K (this “Annual Report”) contains “forward-looking statements” within the meaning of Section 27A of the Securities Act of 1933, as amended (the “Securities Act”), and Section 21E of the Securities Exchange Act of 1934, as amended (the “Exchange Act”), which are subject to the “safe harbor” created by those sections. All statements (other than statements of historical facts) in this Annual Report regarding the prospects of the industry and our prospects, plans, financial position and business strategy may constitute forward-looking statements. In addition, forward-looking statements generally can be identified by the use of forward-looking terminology such as “may,” “should,” “expect,” “might,” “intend,” “will,” “estimate,” “anticipate,” “plan,” “believe,” “predict,” “potential,” “continue,” “suggest,” “project” or “target” or the negatives of these terms or variations of them or similar terminology. Although we believe that the expectations reflected in these forward-looking statements are reasonable, we cannot provide any assurance that these expectations will prove to be correct. Such statements reflect the current views of our management with respect to our operations, results of operations and future financial performance. The following factors are among those that may cause actual results to differ materially from the forward-looking statements:
| ● | our ability to compete within our market; |
| ● | any deceleration in, or resistance to, the acceptance of model-informed biopharmaceutical discovery; |
| ● | changes or delays in government regulation relating to the biopharmaceutical industry; |
| ● | increasing competition, regulation and other cost pressures within the pharmaceutical and biotechnology industries; |
| ● | trends in research and development (“R&D”) spending, the use of third parties by biopharmaceutical companies and a shift toward more R&D occurring at smaller biotechnology companies; |
| ● | consolidation within the biopharmaceutical industry; |
| ● | reduction in the use of our products by academic institutions; |
| ● | pricing pressures due to increased customer utilization of our products; |
| ● | our ability to successfully enter new markets, increase our customer base and expand our relationships with existing customers; |
| ● | the occurrence of natural disasters and epidemic diseases, such as the recent COVID-19 pandemic; |
| ● | any delays or defects in our release of new or enhanced software or other biosimulation tools; |
| ● | failure of our existing customers to renew their software licenses or any delays or terminations of contracts or reductions in scope of work by our existing customers; |
| ● | our ability to accurately estimate costs associated with our fixed-fee contracts; |
| ● | our ability to retain key personnel or recruit additional qualified personnel; |
| ● | risks related to our contracts with government customers, including the ability of third parties to challenge our receipt of such contracts; |
| ● | our ability to sustain recent growth rates; |
| ● | any future acquisitions and our ability to successfully integrate such acquisitions; |
| ● | the accuracy of our addressable market estimates; |
| ● | the length and unpredictability of our software and service sales cycles; |
| ● | our ability to successfully operate a global business; |
| ● | our ability to comply with applicable anti-corruption, trade compliance and economic sanctions laws and regulations; |
| ● | risks related to litigation against us; |
| ● | the adequacy of our insurance coverage and our ability to obtain adequate insurance coverage in the future; |
| ● | our ability to perform our services in accordance with contractual requirements, regulatory standards and ethical considerations; |
| ● | the loss of more than one of our major customers; |
3
| ● | our future capital needs; |
| ● | the ability or inability of our bookings to accurately predict our future revenue and our ability to realize the anticipated revenue reflected in our backlog; |
| ● | any disruption in the operations of the third-party providers who host our software solutions or any limitations on their capacity or interference with our use; |
| ● | our ability to reliably meet our data storage and management requirements, or the experience of any failures or interruptions in the delivery of our services over the internet; |
| ● | our ability to comply with the terms of any licenses governing our use of third-party open source software utilized in our software solutions; |
| ● | any breach of our security measures or unauthorized access to customer data; |
| ● | our ability to comply with applicable privacy and data security laws; |
| ● | our ability to adequately enforce or defend our ownership and use of our intellectual property and other proprietary rights; |
| ● | any allegations that we are infringing, misappropriating or otherwise violating a third party’s intellectual property rights; |
| ● | our ability to meet the obligations under our current or future indebtedness as they become due and have sufficient capital to operate our business and react to changes in the economy or industry; |
| ● | any limitations on our ability to pursue our business strategies due to restrictions under our current or future indebtedness or inability to comply with any restrictions under such indebtedness; |
| ● | any impairment of goodwill or other intangible assets; |
| ● | our ability to use our net operating loss (“NOLs”) and R&D tax credit carryforwards to offset future taxable income; |
| ● | the accuracy of our estimates and judgments relating to our critical accounting policies and any changes in financial reporting standards or interpretations; |
| ● | any inability to design, implement, and maintain effective internal controls when required by law; |
| ● | the costs and management time associated with operating as a publicly traded company; and |
| ● | the other factors discussed under “Risk Factors.” |
You should not rely upon forward-looking statements as predictions of future events. The forward-looking statements in this Annual Report are based on our beliefs, assumptions and expectations of future performance, taking into account the information currently available to us. These statements are only predictions based upon our current expectations and projections about future events. There are important factors, including those described in the section titled “Risk Factors” and elsewhere in this Annual Report, that could cause our actual results, level of activity, performance or achievements to differ materially from the results, level of activity, performance or achievements expressed or implied by the forward-looking statements. Other sections of this Annual Report may include additional factors that could adversely impact our business and financial performance. Moreover, we operate in a very competitive and rapidly changing environment. New risks emerge from time to time and it is not possible for our management to predict all risks, nor can we assess the impact of all factors on our business or the extent to which any factor, or combination of factors, may cause actual results to differ materially from those contained in any forward-looking statements we may make in this Annual Report. Before investing in our common stock, investors should be aware that the occurrence of the events described under the caption “Risk Factors” and elsewhere in this Annual Report could have a material adverse effect on our business, results of operations and financial condition.
Although we believe that the expectations reflected in the forward-looking statements are reasonable, we cannot guarantee that the future results, levels of activity, performance and events and circumstances reflected in the forward-looking statements will be achieved or occur. For a more detailed discussion of the risks, uncertainties and other factors that could cause actual results to differ, please refer to the “Risk Factors” in this Annual Report, as such risk factors may be updated from time to time in our periodic filings with the U.S. Securities and Exchange Commission (SEC). Our periodic filings are accessible on the SEC’s website at www.sec.gov.
4
The forward-looking statements made in this Annual Report relate only to events as of the date on which the statements are made. Except as required by law, we undertake no obligation to update publicly any forward-looking statements for any reason after the date of this Annual Report to conform these statements to actual results or to changes in our expectations.
In addition, statements that “we believe” and similar statements reflect our beliefs and opinions on the relevant subject. These statements are based upon information available to us as of the date of this Annual Report, and while we believe such information forms a reasonable basis for such statements, such information may be limited or incomplete, and our statements should not be read to indicate that we have conducted an exhaustive inquiry into, or review of, all potentially available relevant information. These statements are inherently uncertain and investors are cautioned not to unduly rely upon these statements.
Channels for Disclosure of Information
Investors and others should note that we may announce material information to the public through filings with the SEC, our Investors Relations website (https://ir.certara.com), press releases, public conference calls and public webcasts. We use these channels to communicate with the public about the Company, our products, our services and other matters. We encourage our investors, the media and others to review the information disclosed through such channels as such information could be deemed to be material information. The information on such channels, including on our website, is not incorporated by reference in this Annual Report and shall not be deemed to be incorporated by reference into any other filing under the Securities Act or the Exchange Act, except as expressly set forth by specific reference in such a filing. Please note that this list of disclosure channels may be updated from time to time.
5
Our Company
We accelerate medicines to patients using biosimulation software and technology to transform traditional drug discovery and development.
Biosimulation is a powerful technology used to conduct virtual trials using virtual patients to better understand how drugs behave in different individuals. Biopharmaceutical companies use our proprietary biosimulation software throughout drug discovery and development to inform critical decisions that not only save significant time and money but also advance drug safety and efficacy, improving millions of lives each year.
As a global leader in biosimulation based on 2020 revenue, we provide an integrated, end-to-end platform used by more than 1,650 biopharmaceutical companies and academic institutions across 61 countries, including all of the top 35 biopharmaceutical companies by R&D spend in 2019. Since 2014, customers who use our biosimulation software and technology-enabled services have received over 90% of all new drug approvals by the U.S. Food and Drug Administration (“FDA”). Moreover, 17 global regulatory authorities license our biosimulation software to independently analyze, verify, and review regulatory submissions, including the FDA, Europe’s European Medicines Agency (“EMA”), Health Canada, Japan’s Pharmaceuticals and Medical Devices Agency (“PMDA”), and China’s National Medical Products Administration (“NMPA”). Demand for our offerings continues to expand rapidly.
While traditional drug development has led to meaningful therapies, such as vaccines and chemotherapy, many patients still wait for life-saving medicines, which can take more than 10 years and $2 billion to bring to market. Change is necessary to continue delivering remarkable gains in human health at an accelerated pace. We, and many others in the biopharmaceutical industry, believe that biosimulation enables this change.
We build our biosimulation technology on first principles of biology, chemistry, and pharmacology with proprietary mathematical algorithms that model how medicines and diseases behave in the body. For over two decades, we have honed and validated our biosimulation technology with an abundance of data from scientific literature, lab research, and preclinical and clinical studies. In turn, our customers use biosimulation to conduct virtual trials to answer critical questions, such as: What will be the human response to a drug based on preclinical data? How will other drugs interfere with this new drug? What is a safe and efficacious dose for children, the elderly, or patients with pre-existing conditions? Virtual trials may be used to optimize dosing on populations that are otherwise difficult to study for ethical or logistical reasons, such as infants, pregnant women, the elderly, and cancer patients.
The benefits of biosimulation are significant. One of our customers, a top ten global biopharmaceutical company by R&D spend, estimated that they saved more than half a billion dollars over three years using biosimulation to inform key decisions. Biosimulation can reduce the size of and cost of human trials, the most expensive and time-consuming part of drug development, and in some cases, eliminate certain human trials completely. An analysis published on Applied Clinical Trials Online, to which we contributed, estimated that $1 billion was saved in clinical trial costs using biosimulation for a cancer drug due to consistently shorter completion times in the later phase clinical trials.
We develop and apply our biosimulation technology throughout drug discovery and development with what we believe to be the largest and best team of scientists with deep expertise in biosimulation. Our scientists are recognized key opinion leaders who are at the forefront of the science and technology underpinning the rapidly emerging biosimulation field. We have collaborated on more than 5,000 customer projects in the past decade in therapeutic areas ranging from cancer and hematology to diabetes and hundreds of rare diseases. Over the past year, we have worked on more than 30 programs on vaccines and therapeutics to combat COVID-19.
6
Biosimulation results need to be incorporated into regulatory documents for compelling submissions. Accordingly, we provide regulatory science solutions and integrate them with biosimulation, so that our customers can navigate the complex and evolving regulatory landscape and maximize their chances of approval. Our differentiated regulatory services are powered by submissions management software and natural language processing for scalability and speed, allowing us to deliver more than 200 regulatory submissions over the past four years. Our team of regulatory professionals has extensive experience applying industry guidelines and global regulatory requirements.
The final hurdle to delivering medicines to patients is market access, defined as strategies, processes, and activities to ensure that therapies are available to patients at the right price. We believe that biosimulation and market access will continue to be increasingly intertwined as healthcare systems and countries move toward outcomes-based pricing. We have recently expanded into technology-enabled market access solutions, which help our customers understand the real-world impact of therapies and dosing regimens earlier in the process and effectively communicate this to payors and health authorities. Our solutions are underpinned by technologies such as Bayesian statistical software and software as a service (“SaaS”)-based value communication tools.
We have a proven track record of steady growth, driven by higher adoption of biosimulation, expansion of our technology portfolio, strategic acquisitions, and cross-selling of biosimulation, regulatory science, and market access solutions across our end-to-end platform:
| ● | From 2019 to 2020, our revenue increased by 17% from $208.5 million to $243.5 million. |
| ● | The number of customers with Annual Customer Value (“ACV”) of $100,000 or more in revenue increased from 228 in 2019 to 261 in 2020. |
| ● | The number of customers with ACV of $1,000,000 or more in revenue increased from 44 in 2019 to 53 in 2020. |
We believe that biosimulation is at an inflection point, driven by increasing global regulatory adoption and advancements in technology. We believe we are well-positioned to capture the significant market opportunity ahead of us. Our growth strategy is to build out the depth and breadth of our scalable, end-to-end biopharmaceutical platform to advance all stages of the continuum, from discovery and development to regulatory submission and market access. We continue to innovate and introduce new functionality and uses of biosimulation and technology-enabled solutions. We increasingly integrate the science and data we obtain across this end-to-end platform to inform critical decisions. We further reduce the cost and time of human trials to materially accelerate the speed of development and availability of therapies to patients worldwide. As exciting, new research areas arise, we attract and hire specialized talent and acquire businesses to expand our offerings to address these market opportunities.
With continued innovation in and adoption of our biosimulation software and technology-enabled services, we believe more biopharmaceutical companies worldwide will leverage more of our end-to-end platform to reduce cost, accelerate speed to market, and ensure safety and efficacy of medicines for all patients.
Our Markets
We believe our addressable market within the biopharmaceutical industry is large and rapidly expanding. The current total addressable market (“TAM”) for our solutions represents an estimated $11.6 billion today and is expected to grow at a compound annual growth rate (“CAGR”) of approximately 12% to 15% annually over the next five years. Our TAM estimate includes the biosimulation market estimated at $2.4 billion, which is estimated to grow at 15% CAGR over such period according to Grand View Research; the regulatory science market estimated at $7.9 billion, which is estimated to grow at 12% CAGR over such period according to Grand View Research; and the market access market estimated at $1.3 billion, which is estimated to grow at 12% CAGR over such period according to SpendEdge. With increasing adoption of technology across all stages of drug discovery and development, we believe our end-to-end platform and growth strategies position us to further penetrate the rapidly growing technology-enabled biopharmaceutical R&D market of the future.
7
Traditional drug discovery and development is costly and prone to failure. The biopharmaceutical industry was estimated to have spent a total of approximately $188 billion in 2020 on R&D. It takes more than 10 years to bring a drug to market, and the cost has grown significantly in the past decade from $1.2 billion in 2010 to $2.0 billion in 2019. The probability of success of compounds entering Phase I trials is only 7%. With only 53% of Phase III drugs reaching the market, late-stage failures are common and especially painful as sponsors have already incurred significant cost and time. At the same time, scientific advances are driving increased complexity as the R&D pipeline shifts from small molecules to biologics and cell and gene therapies.
With greater investment dollars being spent and increasing competition in the race to develop novel medicines, the speed and efficiency with which drugs are developed and brought to market have never been more critical. As a result, the demand for and willingness to adopt innovative approaches to discovery, development, and commercialization are rapidly increasing. Continued development and innovation in software and technology such as biosimulation, virtual trials, and real-world evidence tools are helping biopharmaceutical companies increase efficiency and decrease costs. This is further supported by regulatory agencies that have increasingly issued guidance on the adoption of many of these innovations. As technology and analytics become increasingly powerful and the application of new solutions is validated, we anticipate this will drive further demand for these innovations. We believe we are still in the early stages of a long-term trend that will continue to advance traditional drug discovery and development into a technology-enabled era of advanced modeling and analytics.
In addition, as a result of the COVID-19 pandemic, we believe that the demand for innovative technology solutions in drug discovery and development is accelerating. Disruption of clinical trials during the pandemic has highlighted some of the limitations of human trials and is expected to drive increased utilization of technology during and after the pandemic. Sponsors, regulators, and their partners have adopted a number of technology-driven solutions and procedures, which we believe they will continue to utilize and benefit from in the post-COVID environment. Moving forward, we believe there will be an increase in adoption of software and technology-enabled solutions as a means to proactively mitigate the future risks of disruptions to clinical trials. We believe that these trends will only serve to accelerate our market opportunity.
Our core markets today include:
| ● | Biosimulation: Biosimulation is the mathematical modeling of biological processes and systems to simulate how a drug affects the body, how the body affects the drug, how potential doses will affect different patient groups, and how patients will respond under various clinical scenarios. Biosimulation informs every stage of the drug discovery and development process and brings value through: |
| ● | Identifying potential winners and losers at an earlier stage and allowing programs to “fail faster;” |
| ● | Streamlining preclinical and clinical studies or eliminating certain ones altogether; |
| ● | Optimizing dosing for different populations for enhanced safety and efficacy; and |
| ● | Increasing probability of success and return on R&D, amongst others. |
| ● | Regulatory Science: Regulatory science is the development and application of scientific methods, tools, and approaches to support regulatory and other policy objectives. Expert management of these processes is critical to drugs receiving regulatory approval and ultimately reaching patients and generating sales. Providers of regulatory technology and expertise drive significant value for biopharmaceutical companies through: |
| ● | Utilizing best-in-class technology to reduce time-intensive regulatory writing activities and the need for regulatory writing staff; |
| ● | Managing submission timelines and other requirements of global regulatory agencies; |
8
| ● | Generating clear, accurate applications and submissions; and |
| ● | Developing comprehensive global regulatory strategies, amongst others. |
| ● | Market Access: To achieve commercial access, sponsors must assess, optimize and persuasively communicate the value of a new therapy, both therapeutic and economic, that stakeholders such as payors and health care providers will accept and act on. Market access services, including real-world evidence and health economics outcomes research, generate value by: |
| ● | Creating cost and comparative effectiveness models to support pricing and payor reimbursement; |
| ● | Analyzing payor needs and using economic models to develop contracting strategies that optimize value; and |
| ● | Collecting and analyzing real-world data for use in market and payor communications, amongst others. |
We believe that our end-to-end platform is well-positioned to continue benefiting from market trends. In addition to continued growth in our core markets, we expect to capture a broader share of overall biopharmaceutical R&D spend as we continue to innovate and add new solutions to our end-to-end platform.
Our Competitive Strengths
We compete by offering a broad and deep combination of industry-standard biosimulation software and technology-enabled services across all stages of the continuum, from discovery and development to regulatory approval and market access. We have cultivated the following competitive strengths for more than two decades:
Our Proprietary, Scalable Biosimulation Software
Our proprietary, scalable biosimulation software, built on first principles and including more than 9.3 million lines of code, integrates biosimulation models, scientific knowledge, and data, which we believe would require years of effort, immense resources, and scarce expertise to duplicate. Our versatile biosimulation software is deployed to public and private cloud networks, on-premises, and data centers. Scientists can run multiple simulation projects on a cloud compute platform or internal clusters. We protect our proprietary technology through intellectual property rights, including copyrights, patents, trade secrets, know-how, and trademarks.
Our Integrated End-to-End Platform
We have developed a differentiated, integrated end-to-end platform of software and technology-enabled services, powered by proprietary technology and unique talent, spanning discovery through market access. Our customers, facing declining R&D productivity and an increasingly complex regulatory and market access environment, seek trusted partners to accelerate their R&D programs and achieve regulatory and commercial success. Our integrated set of solutions uniquely positions us to be their first-choice partner. More than ninety percent of our top 50 customers by revenue use both our biosimulation solutions and regulatory and market access offerings.
Our Innovation Framework
We are at the forefront of innovation in biosimulation. Beyond our sustained R&D investment ($26.7 million or 11% of revenues in 2020), our innovation framework advances both incremental and breakthrough innovations in biosimulation to transform traditional drug discovery and development.
| ● | Customer-Centricity: Through our consortium model and approximately 1,000 biosimulation projects and workshops annually, we derive significant insights that inform the development of our biosimulation software. These insights help us to anticipate and align our technology roadmap with our customers’ needs and priorities. |
9
| ● | Regulatory Alignment: As we continuously engage with regulators through our customers’ programs, training workshops, and attendance at FDA and other regulator meetings, we develop an in-depth understanding of how to align our biosimulation software and services to meet evolving regulatory expectations and requirements. |
| ● | Scalable Data Collection and Curation: Using artificial intelligence and our scientific team, we have curated data from more than 8,500 clinical studies and 18,000 peer-reviewed manuscripts. We have created 25 different virtual patient populations, approximately 100 compound drug files, more than 45 clinical outcomes databases, and advanced mathematical models for ten organs. |
| ● | Scientific Research: We work with our customers, a scientific advisory board of thought leaders, and more than 120 academic institutions to innovate bottom-up, mechanistic models of drug, disease, and human biology. Each mathematical equation or parameter estimation is based on up-to-date scientific knowledge and data. We use scientific literature, lab data, and our customers’ preclinical and clinical studies to refine, verify, and validate these models to ensure that they meet rigorous scientific and quality standards. |
Our Trusted, Long-Term Customer and Regulatory Partnerships
We work continuously and closely with our customers to provide software and technology-enabled services from drug discovery and development to regulatory science and market access, applying biosimulation throughout the continuum to maximize R&D productivity and increase the probability of success. We have substantial repeat business and long-term partnerships. Our top 30 customers by revenue in 2020 have been with us for more than ten years on average. We are often favored by our customers for follow-on projects throughout a drug’s lifecycle, leveraging our early engagements in preclinical or Phase I to provide continuous support in later phases such as dose optimization for a Phase III study or a new drug application regulatory filing.
| ● | Consortium Model with Biopharmaceutical Companies: Our Simcyp Platform benefits from a unique business and customer collaboration model that we term a “consortium.” Established more than 20 years ago, our consortium model provides for intense and detailed customer input into software enhancements. This R&D feedback loop, driven by customer needs, results in ongoing advancement and incorporation of more scientific data that increases the value of our Simcyp Platform over time. Our consortium members, consisting of scientists from leading global biopharmaceutical companies, sign multi-year contracts and actively participate in consortium meetings, so that we continuously extend our scientific and commercial leadership. |
| ● | Long-Standing Regulatory Partnerships: Seventeen regulatory agencies license our biosimulation software. In addition, our scientists are regularly invited by U.S., European, and Japanese regulatory agencies to teach and participate in their workshops. We have received four grants and a Cooperative Research and Development Agreement from the FDA as well as grants from six European organizations, including the EU Commission, to develop biosimulation models and conduct biosimulation analyses. |
| ● | Academic Centers of Excellence: We work closely with the global academic community on research, publications, and training of the next generation of biopharmaceutical scientists. We have established nine Centers of Excellence worldwide, which use our biosimulation software in their courses and scientific research. Additionally, nearly 400 academic institutions worldwide license our biosimulation software. |
| ● | Certara University: We recognize that education in the theory and practice of biosimulation is pivotal to adoption and achieving the benefits of biosimulation. Certara University provides in-person and online training on biosimulation and the use of our biosimulation software to more than 4,500 scientists in the past three years. |
The Deep Expertise of Our People and Our Culture of Innovation
We are led by a diverse, global, and talented team of scientists, software engineers, and subject matter experts who not only advance our technology but also seek to understand and tackle our customers’ greatest challenges. Over the last decade, we have worked on more than 5,000 customer projects, leading to extensive experience, which our customers
10
highly value. As of December 31, 2020, approximately 300 of our employees held PhD, PharmD, or MD degrees. Our team of software engineers and technologists excels at applying computer science, engineering, and scientific and mathematical principles in designing and developing complex software with consistent execution. World-leading experts in biosimulation, drug discovery and development, software development, regulatory science, and market access work and thrive at Certara.
Our global executive management team brings together extensive experience in science, technology, and business. Sharing core values of dedication, quality, and respect, the executive management team is focused on fostering our passion for science and growing our culture of innovation, excellence, collaboration, and customer-centricity as well as delivering exceptional performance.
Our Growth Strategy
Our growth strategy is to build upon our scalable, end-to-end platform. We continue to innovate in biosimulation, engage with regulatory agencies, and land and expand our customer partnerships. We remain focused on reducing the cost, time, and probability of failure of clinical trials for our customers, so that they can materially accelerate the availability of future therapies that are needed by patients worldwide. As exciting, new research areas arise, such as cell and gene therapy, we attract and hire specialized talent and acquire businesses to expand our offerings accordingly.
Advance Our Technology
The science, technology, and data behind biosimulation continue to advance rapidly, and our top investment priority is to develop additional functionality and uses for biosimulation to improve patient outcomes. We release new software, additional features, and upgrades on a frequent and regular basis. In the past two years, we have introduced more than 10 new software applications and upgrades, including D360 Biologics Scientific Informatics, Simcyp Immuno-oncology Quantitative Systems Pharmacology (“QSP”), and COVID-19 Quantitative Systems Pharmacology.
We are investing in three major areas to elevate our technology:
| ● | Spearheading the Frontier of QSP and Toxicology, an emerging approach with enormous potential for industry-wide transformation to optimize decisions in both drug discovery and development. In addition to QSP for immunogenicity, immuno-oncology, and COVID-19, we are ramping up our QSP consortia for neurodegenerative diseases, such as Alzheimer’s and Parkinson’s, and for quantitative systems toxicology and safety (“QSTS”). Neuroscience is expected to have the most growth in QSP modeling over the next several years, followed by oncology and autoimmune disorders. All of our mechanistic simulators communicate seamlessly with each other, which is a major advantage for complex drug discovery and development programs; |
| ● | Continuing to Develop Cloud-Based Solutions, such as Certara Integral Data Repository, CODEx Clinical Outcomes Databases, and BaseCase Value Communication Software, which enhance computing scalability, significantly reduce maintenance time and cost, and promote access, collaboration and mobility. This also allows us to easily deliver new features and explore new business models; and |
| ● | Architecting an Ecosystem of Interconnected Software Applications to facilitate seamless workflows and sharing of data across the drug discovery and development continuum for efficiency and speed. |
Grow Within Our Existing Customers
As we continue to expand our portfolio of offerings, we integrate our solutions and sell more across our end-to-end platform. Our scientists and regulatory and market access experts, business developers, marketing professionals, and business leaders work together to ensure a high-quality customer experience and nurture long-term partnerships. As a result, our customer relationships grow steadily over time, driven by higher adoption of biosimulation with additional user licenses and more modules.
11
We also cross-sell our software and technology-enabled services throughout our end-to-end platform. Many of our customers who use biosimulation also rely on us for regulatory strategy, writing, and submissions support, including the majority of our top 50 customers. The number of customers with annual customer value of $100,000 or more in revenue increased from 228 in 2019 to 261 in 2020, a 14% increase. The success of our land and expand approach is further demonstrated by our high re-occurring revenue streams with an aggregate renewal rate of 90% for our software customers from 2019 to 2020 and net revenue repeat rate (defined as the level of technology-enabled services revenue generated from our existing customers from period to period, accounting for expansion and churn) of 116% for our technology-enabled services customers from 2019 to 2020.
Expand Our Customer Base Globally
We are growing our footprint globally to match that of the biopharmaceutical industry. There are more than 4,800 biopharmaceutical companies worldwide with active R&D pipelines, up from nearly 2,400 in 2011, according to Informa’s Pharma R&D Annual Review 2020. Informa also estimates that the R&D pipeline encompasses approximately 18,000 drug programs in 2020. As drug discovery and development in Asia Pacific grows, we are investing heavily to expand our presence in the region to work with these customers where they are, just as we already have in North America, Europe and Japan. We continue to build our sales and marketing capabilities and capacity to expand our global reach. In October 2020, we opened an office in Shanghai, China.
Scale Through Acquisitions
Biosimulation is an exciting technology with many promising, future developments, and we believe there are numerous opportunities to pursue strategic acquisitions to accelerate our development roadmap. We have a proven record of successfully acquiring and integrating software and services companies. To date, we have acquired 12 companies of which nine included software or technology such as Simcyp, the core of our mechanistic biosimulation platform, and Xenologiq, which jumpstarted our biosimulation initiative using QSP. As we build out the depth and breadth of our biosimulation platform, we continually seek and assess a range of highly focused opportunities in our immediately addressable market and in related adjacent markets, whether through acquisitions, licenses, or partnerships.
Inspire Our People
Our people, 900 strong, are the key to our success. The diversity and depth of expertise, experience, and backgrounds in our vibrant community bring richness of ideas, problem-solving capabilities, and mutual respect. We are dedicated to attracting, retaining, and growing leading scientists and experts who are passionate about developing medicines that matter. We strive to encourage intellectual curiosity and offer a myriad of professional development opportunities. We continue to invest in our people to help them thrive and solidify our position as an employer of choice in our industry.
The Certara End-to-End Platform
We provide both software and technology-enabled services to enable customers to realize the full benefits of biosimulation in drug discovery, preclinical and clinical research, regulatory submission, and market access. Our software is primarily subscription-based with licenses ranging from one to three years.
12
Certara End-to-end Platform
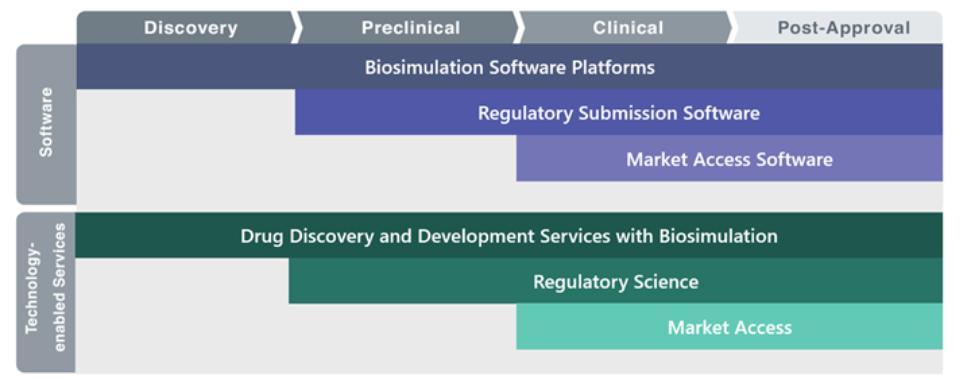
Software
Our software, utilized by more than 20,000 licensed users in biosimulation and 28,000 more in regulatory and market access, addresses six main applications: 1) mechanistic biosimulation; 2) empirical pharmacokinetic and pharmacodynamic biosimulation; 3) scientific informatics; 4) clinical outcomes databases for biosimulation; 5) authoring and management of regulatory submissions; and 6) market access communication. We deploy our software to customers on public and private cloud networks, on-premises, and in data centers.
| ● | Mechanistic Biosimulation Platform (Simcyp): Mechanistic biosimulation predicts both how a drug is handled within the body (known as “pharmacokinetics” or “PK”) and drug effect (known as “pharmacodynamics” or “PD”), without the need for actual in vivo human or animal studies. Seventeen of the top 20 biopharmaceutical companies by R&D spend in 2019 licensed Simcyp. Simcyp includes three main modules: |
| ● | Physiologically-based pharmacokinetic (“PBPK”) modeling and simulation: Our industry-standard Simcyp PBPK Simulator includes a whole-body model to run virtual “what if?” scenarios without human clinical studies. One benefit is understanding how dosing should be adjusted for special populations such as children or the elderly. A second is to identify potential drug-drug interactions so they can be included on drug labels to make the product safer. Simcyp is used by 11 regulatory agencies to evaluate submissions. |
| ● | Quantitative systems pharmacology: A rapidly growing field in biosimulation, QSP combines computational modeling and vast amounts of ‘omics (e.g., genomics, proteomics, metabolomics) data to predict clinical efficacy outcomes for novel targets, drug modalities, and combination therapies. By using QSP to understand the physiological mechanisms driving efficacy, customers can terminate unpromising discovery programs earlier, and promote stronger candidates to clinical testing, thus reducing costly late-stage failures. Once marketed, the same physiological knowledge can differentiate launch messaging, helping the drug to stand out from the competition. |
| ● | Quantitative systems toxicology and safety: QSTS integrates toxicology with quantitative analysis of large networks of molecular and functional biological changes to identify drug toxicity and adverse drug reactions earlier. |
13
Our Simcyp Platform has generated results that inform approximately 250 label claims for more than 75 drugs. Had customers attempted to acquire the same information through conventional human trials, we believe they would have faced millions in additional costs and significant launch delays, given that clinical trials are estimated to take 1 to 2.5 years on average and cost many millions of dollars, according to Nature Reviews Drug Discovery.
| ● | Empirical PK/PD Biosimulation Platform (Phoenix): Once our customers have empirical data from their actual trials assessing drug dissolution, blood concentration, and effect, they must interpret the data and make interpolations and extrapolations to inform dosing, handling of drug-drug interactions, and formulation decisions for subsequent trials and for patient use after launch. Phoenix includes multiple modules for the full empirical biosimulation workflow including conventional and biosimulation-driven interpretation (WinNonlin, NLME, and IVIVC), and related workflow modules for validated data handling, model management, and regulatory reporting (PK Submit, Certara Integral, Validation Suites). Customers benefit by gaining a validated, streamlined workflow for reporting their clinical pharmacology information to the FDA and other agencies. Furthermore, customers can be confident they are using the same tools used by regulators to evaluate their products. |
| ● | Scientific Informatics Platform (D360): D360 provides customers with self-service access and analytics to manage their small molecule and biologics discovery projects. The platform includes chemical structure search capabilities for structure-activity relationship analysis, molecular design tools and visualization solutions. The product connects seamlessly with biology and chemistry data systems from third-party companies, without extensive IT setup and maintenance. We estimate that more than 6,000 discovery research scientists worldwide use D360. |
| ● | Clinical Outcomes Databases for Biosimulation (CODEx): Our customers license our 45+ proprietary CODEx databases in a range of disease areas for meta-analysis of a new drug’s safety and efficacy in relation to competitive products. The databases cover more than 8,500 clinical trials and observational studies and are accessible via an online portal with analytical and visualization tools. In 2020, we introduced a new CODEx database for COVID-19. |
| ● | Authoring and Management of Regulatory Submissions Platform (GlobalSubmit): Our customers license our advanced, cloud-based electronic common technical document (“eCTD”) software for publishing, review, validation, and electronic filing of regulatory submissions. |
| ● | Market Access Communication Platform (BaseCase): We license a cloud-based SaaS platform for drag-and-drop visualization of biosimulation results and other complex data. Customers use our software to communicate the value of a new therapy to payors and providers to gain formulary acceptance and reimbursement. |
Technology-Enabled Services
Our technology-enabled, biosimulation services help customers who do not have staff capability or availability to gain the benefits of biosimulation. We also provide related, technology-enabled services to guide our customers’ new drugs through the regulatory submission process and into the market. Our technology-enabled services include integrated drug development services include mechanistic biosimulation, empirical biosimulation, drug development and regulatory writing and medical communications, regulatory operations, and market access. Regulatory agencies promote and endorse the use of biosimulation in drug development as “model informed drug discovery and development,” which integrates our software and technology-enabled services to inform key decisions during drug discovery, development, approval, and subsequent market access.
| ● | Mechanistic Biosimulation: We utilize our Simcyp Platform for predicting PK to determine first-in-human dose selection, design more efficient and effective clinical studies, evaluate new drug formulations, and predict drug-drug interactions. We use our QSP and QSTS software to advise customers on target selection and ranking and strategies for avoiding toxicities. |
14
| ● | Empirical Biosimulation: We use our Phoenix Platform and other tools to provide a wide range of quantitative biosimulation approaches such as non-compartmental analysis, PK/PD modeling, and population PK/PD analyses. |
| ● | Drug Development and Regulatory Strategy: We develop and deliver drug development and regulatory plans and provide high-level regulatory input to customer projects, incorporating biosimulation and supporting decision making through critical development and investment stage gates. |
| ● | Clinical Pharmacology: We provide early-phase development plans and study designs across the development life cycle, often incorporating biosimulation. We use clinical pharmacology gap analysis and modeling to anticipate and manage development risks. |
| ● | Model-Based Meta-Analysis: We utilize curated clinical trial data from our CODEx clinical outcomes database platform together with model-based meta-analysis to assess a new drug’s safety and efficacy in relation to competitive products. |
| ● | Regulatory Writing and Medical Communications: We support submissions from early-stage investigational new drugs to late-stage new drug applications, biologics license applications, and market authorization applications, by writing regulatory documents such as clinical study protocols/reports, safety submissions, and other summary documents for submission to the FDA and global regulatory authorities. We manage technical editing including transparency and disclosure services to ensure that our customers’ regulatory documents are “filing-ready.” Our team also offers advanced publication planning and writing support for scientific and medical publications. We deploy natural language processing software and other technology to enable efficient and scalable document creation. |
| ● | Regulatory Operations: We manage the submission of regulatory documents using our GlobalSubmit platform. Our submission management services include submission leadership, program management and planning, due diligence and readiness preparation, submission compilation, and eCTD publishing. We support applications to all major health agencies, including the FDA, Europe’s EMA, Health Canada, Japan’s PMDA, and China’s NMPA. |
| ● | Market Access: We assist customers in demonstrating the value of new drugs and health technologies to payors and other stakeholders to support their efforts in securing reimbursement and access in global markets. These services include conducting real-world evidence and health economics outcomes research, delivering value and access consultancy solutions, creating cost and comparative effectiveness models to support pricing and payor reimbursement, and collecting and analyzing real world data for use in market and payor communications. We use our proprietary technology called the Health Outcomes Performance Estimator (HOPE), based on a Bayesian engine, that translates clinical trial findings and population health knowledge into expected real-world impact. |
Sales and Marketing
Our sales and marketing functions pursue a coordinated approach with a global commercial team of business development, product management, and marketing experts. Our global commercial team collaborates with our scientists, subject matter experts, and technologists to engage with customers and prospects to understand their needs and offer tailored solutions with our biosimulation software and technology-enabled services. Our scientists and experts have authored thousands of scientific publications, posters, and articles to share biosimulation knowledge and methods to advance adoption. We also partner with software distributors in global regions to expand our reach.
15
Competition
The market for our biosimulation products and related services for the biopharmaceutical industry is competitive and highly fragmented. In biosimulation software, we primarily compete with companies smaller than ourselves, such as Simulations Plus and NONMEM, a division of ICON. Other competitors include Schrodinger, open-sourced solutions such as R and PK-Sim, and internally-developed software in biopharmaceutical companies. We generally compete in biosimulation software on the basis of the quality and capabilities of our products, our scientific and technical expertise, our ability to innovate and develop solutions attractive to customers, our customer and regulatory agency partnerships, and price, amongst other factors.
Our technology-enabled services generally compete with companies significantly smaller than ourselves, such as Nuventra, Metrum Research Group, and Simulations Plus. We also face competition in this space from in-house teams at biopharmaceutical companies and academic and government institutions. In some standard biosimulation services and in regulatory science and market access, we compete with contract research organizations. We generally compete in the technology-enabled services markets on the basis of our reputation and experience, our expertise and the qualifications of our team, our ability to offer services attractive to customers, and price, amongst other factors.
We believe that our competitive position is strong, and that we are able to effectively win new projects with our integrated, end-to-end platform.
Intellectual Property
We safeguard and enhance our innovative technology platforms, systems, processes, and databases with a full array of intellectual property rights, including copyrights, trade secrets and know-how, patents, and tradenames/trademarks.
All of our proprietary software products are copyright protected, and further reinforced by contractual provisions in our software license agreements prohibiting our users from reverse engineering, deriving, or otherwise using the source code and underlying algorithms for anything other than the permitted and intended use. Embedded within some of our biosimulation tools, including the Simcyp Simulator, are several decades’ worth of proprietary data that have been compiled and collated from both public and private sources. These data, in tandem with our proprietary source code and algorithms, create powerful modeling tools that cannot be readily duplicated. Continual ongoing development of source code and algorithms as well as new version release of modelling tools also ensures that our proprietary software products are difficult to copy. Our processes and systems are further protected by trade secrets and know-how, which we secure by requiring and strictly enforcing confidentiality obligations with our employees, contractors, customers, and other third parties, and invention assignment agreements with our employees, as well as through administrative and technical safeguards. However, trade secrets and confidential know-how are difficult to protect. Agreements may not always provide meaningful protection. These agreements may also be breached, and we may not have an adequate remedy for any such breach. In addition, our trade secrets and/or confidential know-how may become known or be independently developed by a third party, or misused by any collaborator to whom we disclose such information. Despite any measures taken to protect our intellectual property, unauthorized parties may attempt to copy aspects of our products or to obtain or use information that we regard as proprietary. Although we take steps to protect our proprietary information, third parties may independently develop the same or similar proprietary information or may otherwise gain access to our proprietary information. As a result, we may be unable to meaningfully protect our trade secrets and proprietary information. We license and use the intellectual property of third parties, primarily in our software development, although no one such license is considered to be material to the business as a whole.
We also maintain a portfolio of issued and pending patents in several of jurisdictions in which we do business. As of December 31, 2020, our patent portfolio consisted of 29 issued patents and nine pending patent applications related to our software and technology. The Company does not currently consider any of its issued patents to be material to its business. Several of our most recently filed patent applications relate to our liquid biopsy project, and describe a method of gleaning information from a simple blood test that can be used to predict and optimize how that individual patient will absorb and metabolize a drug, thereby allowing a clinician to determine the optimal dosing of a drug on an individual basis. We believe these patent applications, if issued, will accelerate our leadership in individualized precision dosing.
16
We cannot predict whether the patent applications we are currently pursuing will issue as patents in any particular jurisdiction or whether the claims of any issued patents will provide sufficient proprietary protection from competitors.
We also have applied for and/or obtained and maintain registration in the United States and other countries for numerous trademarks, including Certara, Simcyp, Phoenix, Virtual Twin, WinNonlin, and BaseCase. We pursue trademark registrations to the extent we believe doing so would be beneficial to our competitive position.
We are not presently a party to any legal proceedings relating to intellectual property that, in the opinion of our management, would individually or taken together have a material adverse effect on our business, financial condition, results of operations or cash flows.
Human Capital
We are led by a diverse, global, and talented team of scientists, software developers, and subject matter experts who seek to understand our customers’ challenges and are dedicated to tackling these challenges. As of December 31, 2020, we employed a total of 903 individuals, including 846 full-time employees and 57 part-time employees, of which 300 held Ph.Ds. in their respective disciplines, including clinical pharmacology and pharmacometrics. As of December 31, 2020, we employed 299 scientists, 188 regulatory experts, 70 market access specialists, and 97 software developers and technologists. Most of the senior management team and the members of our board of directors hold either PhDs and/or other advanced degrees. We are very proud to say that some of the world-leading experts in biosimulation, drug discovery and development, software development, regulatory science, and market access work and thrive at Certara. We offer employees a myriad of professional development opportunities and encourage a performance-driven environment. In 2020, we focused on creating a robust culture in a remote work environment to encourage retention and engagement, and instituted a number of health and wellness initiatives, such as a global fitness challenge. We also enhanced our diversity and inclusion programs, including instituting company-wide unconscious bias training and expanding our recruiting efforts to reach a more diverse talent pool, in keeping with our CEO’s pledge to act on supporting a more inclusive workplace. None of our employees are represented by a labor union, and we have never experienced a work stoppage. We believe that our relations with our employees are positive.
Government Regulation
Regulation of Biopharmaceutical Products
The development, testing, manufacturing, labeling, approval, promotion, distribution and post-approval monitoring and reporting of biopharmaceutical products are subject to regulation by numerous governmental authorities at both the national and local levels, including the FDA in the United States, as well as those of other countries, such as the EMA in the European Union and the Medicines and Healthcare products Regulatory Agency in the United Kingdom. Although our biosimulation software products and platforms are not approved by the FDA or other government agencies, our customers’ products are subject to these regulations, which may be applicable to us to the extent that the services and deliverables we provide to our customers are used in their marketing applications. Consequently, we must comply with relevant laws and regulations relating to certain aspects of the drug and biologic development and approval process. For example, our customers may require that documents or records we produce that may be used in the approval process be compliant with part 11 of Title 21 of the U.S. Code of Federal Regulations, which relates to the creation, modification, maintenance, storage, retrieval, or transmittal of electronic records submitted to the FDA. Further, certain portions of our business, such as the biosimulation work we conduct in connection with designing clinical trials, must comply with current Good Laboratory Practices (“GLP”) and Good Clinical Practices (“GCP”) requirements as established by the International Council on Harmonisation of Technical Requirements for Registration of Pharmaceuticals for Human Use, as adopted by the FDA and similar regulatory authorities in other countries, which helps ensure the quality and integrity of the data we produce. To help ensure compliance with GLP and GCP, we have established a robust quality management system that includes standard operating procedures, working practice documents and processes, and quality assurance personnel to audit deliverables intended to be used in our customers’ drug and biologic approval applications.
17
Privacy and Security Laws
The collection, processing, use, disclosure, disposal and protection of information about individuals, in particular healthcare data, is highly regulated both in the United States and other jurisdictions, including but not limited to, under Health Insurance Portability and Accountability Act of 1996 (“HIPAA”), as amended by the Health Information Technology for Economic and Clinical Health Act (“HITECH”); U.S. state privacy, security and breach notification and healthcare information laws; the European Union’s General Data Protection Directive (“GDPR”); and other European privacy laws as well as privacy laws being adopted in other regions around the world. Although most of the clinical data we receive from our customers is de-identified, in certain parts of our business, such as our real-world data and analytics program, we hold confidential personal health and other information relating to persons who have been, are and may in the future be involved in clinical trials. The possession, retention, use and disclosure of such information is highly regulated, including under the laws and regulations described above. These data privacy and security regulations govern the use, handling and disclosure of information about individuals and, in the case of HIPAA, require the use of standard contracts, privacy and security standards and other administrative simplification provisions. In relation to HIPAA, we do not consider our service offerings to generally cause us to be subject as a covered entity; however, in certain circumstances we are subject to HIPAA as a business associate and may enter into business associate agreements with our customers who are covered entities under HIPAA. These business associate agreements define our obligations to safeguard the personal health information of patients provided by our customers. We have adopted identity protection practices and have implemented procedures to satisfy data protection requirements and safeguards regarding the creation, receipt, maintenance and transmission of protected health information.
In addition, the FTC and many state attorneys general are interpreting existing federal and state consumer protection laws to impose evolving standards for the online collection, use, dissemination and security of information about individuals, including health-related information. Courts may also adopt the standards for fair information practices promulgated by the FTC, which concern consumer notice, choice, security and access. Consumer protection laws require us to publish statements that describe how we handle information about individuals and choices individuals may have about the way we handle their information. Certain states have also adopted robust data privacy and security laws and regulations. For example, the CCPA, which took effect in 2020, imposes obligations and restrictions on businesses regarding their collection, use, and sharing of personal information and provides new and enhanced data privacy rights to California residents, such as affording them the right to access and delete their personal information and to opt out of certain sharing of personal information. Protected health information that is subject to HIPAA is excluded from the CCPA, however, information we hold about individuals which is not subject to HIPAA would be subject to the CCPA It is unclear how HIPAA and the other exceptions may be applied under the CCPA.
The collection, use, storage, disclosure, transfer, or other processing of any personal data regarding individuals in the European Union, including personal health data, is subject to the GDPR, which became effective on May 25, 2018. The GDPR is wide-ranging in scope and imposes numerous requirements on companies that process personal data, including requirements relating to processing health and other sensitive data, obtaining consent of the individuals to whom the personal data relates, providing information to individuals regarding data processing activities, implementing safeguards to protect the security and confidentiality of personal data, providing notification of data breaches, and taking certain measures when engaging third-party processors. The GDPR also imposes strict rules on the transfer of personal data to countries outside the European Union, including the United States, and permits data protection authorities to impose large penalties for violations of the GDPR, including potential fines of up to €20 million or 4% of annual global revenues, whichever is greater. The GDPR also confers a private right of action on data subjects and consumer associations to lodge complaints with supervisory authorities, seek judicial remedies, and obtain compensation for damages resulting from violations of the GDPR.
Recent legal developments in Europe have created complexity and uncertainty regarding transfers of personal data from the European Economic Area (“EEA”) to the United States, e.g. on July 16, 2020, the CJEU invalidated the Privacy Shield under which personal data could be transferred from the EEA to U.S. entities who had self-certified under the Privacy Shield scheme. While the CJEU upheld the adequacy of the standard contractual clauses (a standard form of contract approved by the European Commission as an adequate personal data transfer mechanism, and potential alternative to the Privacy Shield), it made clear that reliance on them alone may not necessarily be sufficient in all circumstances; this has created uncertainty. We have previously relied on our own Privacy Shield certification and our
18
relevant customers’/ clients’/ partners’/ providers’/ third parties’ Privacy Shield certification(s) for the purposes of transferring personal data from the EEA to the United States in compliance with the GDPR’s data export conditions. We also currently rely on the standard contractual clauses to transfer personal data outside the EEA, including to the United States, among other data transfer mechanisms pursuant to the GDPR, but excluding Privacy Shield.
In response to the data privacy laws and regulations discussed above and those in other countries in which we do business, we have implemented several technological safeguards, processes, contractual third-parties provisions, and employee trainings to help ensure that we handle information about our employees, customers, and in a compliant manner. We maintain a global privacy policy and related procedures, and train our workforce to understand and comply with applicable privacy laws.
Bribery, Anti-Corruption and Other Laws
We are subject to compliance with the U.S. Foreign Corrupt Practices Act (“FCPA”) and similar anti-bribery laws, such as the U.K. Bribery Act of 2010 (“Bribery Act”), which generally prohibit companies and their intermediaries from making improper payments to foreign government officials for the purpose of obtaining or retaining business. In addition, in the United States, we may also be subject to certain state and federal fraud and abuse laws, including the federal Anti-Kickback Statute and False Claims Act, that are intended to reduce waste, fraud and abuse in the health care industry. Our employees, distributors, and agents are required to comply with these laws, and we have implemented policies, procedures, and training, to minimize the risk of violating these laws.
Our Corporate Information
Certara, Inc. was incorporated in Delaware on June 27, 2017. Our principal business office is located at 100 Overlook Center, Suite 101, Princeton, New Jersey 08540, and the telephone number of our principal business office is (609) 716-7900. Our internet address is www.certara.com. Our internet website and the information contained therein or connected to or linked from our internet web site are not incorporated information and do not constitute a part of this Annual Report or any amendment thereto.
Available Information
Our Investor Relations website is located at https://ir.certara.com. We have used, and intend to continue to use, our Investor Relations website and our corporate website located at www.certara.com as a means of disclosing material non-public information and for complying with our disclosure obligations under Regulation FD. The following filings are available through our Investor Relations website as soon as reasonably practicable after we file them with, or furnish them to, the SEC: Annual Report on Form 10-K, Quarterly Reports on Form 10-Q, current reports on Form 8-K, and our Proxy Statement for our annual meeting of stockholders, as applicable. These filings are also available for download free of charge through a link on our Investor Relations website. The SEC also maintains an Internet website at www.sec.gov that contains reports, proxy statements and other information about issuers, like us, that file electronically with the SEC. Our internet website and the information contained therein or connected to or linked from our internet web site are not incorporated information and do not constitute a part of this Annual Report.
Investing in our common stock involves a high degree of risk. You should carefully consider the following risk factors together with other information in this filing, including our consolidated financial statements and related notes included elsewhere in this filing, before deciding whether to invest in shares of our common stock. The occurrence of any of the events described below could harm our business, financial condition, results of operations and growth prospects. In such an event, the trading price of our common stock may decline and you may lose all or part of your investment.
19
Summary of Risk Factors
Our business is subject to numerous risks and uncertainties, discussed in more detail in the following section. These risks include, among others, the following key risks:
| ● | We compete in a competitive and highly fragmented market. |
| ● | Deceleration in, or resistance to, the acceptance of model-informed biopharmaceutical discovery and development by regulatory authorities or academic institutions could damage our reputation or reduce the demand for our products and services. |
| ● | Changes or delays in government regulation relating to the biopharmaceutical industry could decrease the need for some of the services we provide. |
| ● | Reduction in research and development spending by our customers for a variety of reasons, as well as delays in the drug discovery and development process, may reduce demand for our products and services and negatively impact our results of operations and financial condition. |
| ● | Consolidation within the biopharmaceutical industry may reduce the pool of potential customers for our products and services or reduce the number of licenses for our software products. |
| ● | As customers increase their utilization of our products and services, we may be subject to additional pricing pressures. |
| ● | Our continued revenue growth depends on our ability to successfully enter new markets, increase our customer base and expand our relationship and the products and services we provide to our existing customers. |
| ● | Our business may be subject to risks arising from natural disasters and epidemic diseases, such as the recent COVID-19 pandemic. |
| ● | Delays or defects in the release of new or enhanced software or other biosimulation tools may result in increased cost to us, delayed market acceptance of our products, diminished demand for our products, delayed or lost revenue, and liability. |
| ● | If our existing customers do not renew their software licenses, do not buy additional solutions from us or renew at lower prices, our business and operating results will suffer. |
| ● | Our customers may delay or terminate contracts, or reduce the scope of work, for reasons beyond our control, or we may underprice or overrun cost estimates with our fixed-fee contracts, potentially resulting in financial losses. |
| ● | We depend on key personnel and may not be able to retain these employees or recruit additional qualified personnel, which could harm our business. |
| ● | We have government customers and have received government grants, which subject us to risks including early termination, audits, investigations, sanctions, or penalties. |
| ● | Our recent growth rates may not be sustainable or indicative of future growth. |
| ● | We may acquire other companies or technologies, which could divert our management’s attention, result in additional dilution to our stockholders, and otherwise disrupt our operations and adversely affect our operating results. |
| ● | Our estimated addressable market is subject to inherent challenges and uncertainties. If we have overestimated the size of our addressable market or the various markets in which we operate, our future growth opportunities may be limited. |
| ● | We are subject to risks associated with the operation of a global business. |
| ● | We are subject to the FCPA and the Bribery Act and similar anti-corruption laws and regulations in other countries. Violations of these laws and regulations could harm our reputation and business, or materially adversely affect our business, results of operations, financial condition and/or cash flows. |
| ● | Our failure to comply with trade compliance and economic sanctions laws and regulations of the United States and applicable international jurisdictions could materially adversely affect our reputation and results of operations. |
| ● | Current and future litigation against us, which may arise in the ordinary course of our business, could be costly and time consuming to defend. |
| ● | Our insurance coverage may not be sufficient to avoid material impact on our financial position resulting from claims or liabilities against us, and we may not be able to obtain insurance coverage on attractive terms, or at all, in the future. |
| ● | If we fail to perform our services in accordance with contractual requirements, regulatory standards and ethical considerations, we could be liable for significant costs or penalties and our reputation could be harmed. |
| ● | We derive a significant percentage of our revenues from a concentrated group of customers and the loss of more than one of our major customers could materially and adversely affect our business, results of operations and/or financial condition. |
| ● | We rely upon third-party providers of cloud-based infrastructure to host our software solutions. Any disruption in the operations of these third-party providers, limitations on capacity or interference with our use could adversely affect our business, financial condition and results of operations. |
| ● | If we are not able to reliably meet our data storage and management requirements, or if we experience any failure or interruption in the delivery of our services over the internet, customer satisfaction and our reputation could be harmed and customer contracts may be terminated. |
| ● | Our software solutions utilize third-party open source software, and any failure to comply with the terms of one or more of these open source licenses could adversely affect our business, subject us to litigation and create potential liability. |
| ● | If our security measures are breached or unauthorized access to customer data is otherwise obtained, our solutions may be perceived as not being secure, customers may reduce the use of or stop using our solutions and we may incur significant liabilities. |
| ● | We are subject to numerous privacy and data security laws and related contractual requirements and our failure to comply with those obligations could cause us significant harm. |
| ● | We may be unable to adequately enforce or defend our ownership and use of our intellectual property and other proprietary rights. |
| ● | Third parties may initiate legal proceedings alleging that we are infringing, misappropriating or otherwise violating their intellectual property rights, the outcome of which would be uncertain and could have a material adverse effect on the success of our business. |
| ● | Provisions in our organizational documents could delay or prevent a change of control. |
| ● | EQT Investor (“EQT”) holds a substantial amount of our outstanding common stock, and its interests may be different than the interests of other holders of our common stock. |
| ● | Failure to comply with requirements to design, implement and maintain effective internal controls could have a material adverse effect on our business and stock price. |
| ● | Our amended and restated certificate of incorporation provides, subject to limited exceptions, that the Court of Chancery of the State of Delaware and, to the extent enforceable, the federal district courts of the United States of America will be the sole and exclusive forums for certain stockholder litigation matters, which could limit our stockholder’s ability to obtain a favorable judicial forum for disputes with us or our current and former directors, officers, employees or stockholders. |
| ● | Our board of directors are authorized to issue and designate shares of our preferred stock in additional series without stockholder approval. |
| ● | We incur substantial costs as a result of operating as a publicly traded company, and our management is required to devote substantial time to compliance initiatives. |
Risks Related to Our Industry
We compete in a competitive and highly fragmented market.
The market for our biosimulation products and related services for the biopharmaceutical industry is competitive and highly fragmented. In biosimulation software, we compete with other scientific software providers, technology companies, in-house development by biopharmaceutical companies, and certain open source solutions. In the technology-enabled services market, we compete with specialized companies, in-house teams at biopharmaceutical companies, academic and government institutions. In some standard biosimulation services, and in regulatory, and market access, we also compete with contract research organizations. Some of our competitors and potential competitors have longer operating histories in certain segments of our industry than we do and could have greater financial, technical, marketing, research and development and other resources. Some of our competitors offer products and services directed at more specific markets than those we target, enabling these competitors to focus a greater proportion of their efforts and resources on those specific markets. Some competing products are developed and made available at
21
lower cost by government organizations and academic institutions, and these entities may be able to devote substantial resources to product development. Some clinical research organizations or technology companies may decide to enter into or expand their offerings in the biosimulation area, whether through acquisition or internal development. We also face competition from open source software initiatives, in which developers provide software and intellectual property free of charge, such as R and PK-Sim software. In addition, some of our customers spend significant internal resources in order to develop their own solutions. There can be no assurance that our current or potential competitors will not develop products, services or technologies that are comparable, or superior to, or will render obsolete, the products, services and technologies we offer. There can be no assurance that our competitors will not adapt more quickly than we do to technological advances and customer demands, thereby increasing such competitors’ market share relative to ours. Any material decrease in demand for our technologies or services may have a material adverse effect on our business, financial condition and results of operations.
Deceleration in, or resistance to, the acceptance of model-informed biopharmaceutical discovery and development by regulatory authorities or academic institutions could damage our reputation or reduce the demand for our products and services.
There has been a steady increase in the recognition by regulatory and academic institutions of the role that modeling and simulation can play in the biopharmaceutical development and approval process, as demonstrated by new regulations and guidance documents describing and encouraging the use of modeling and simulation in the biopharmaceutical discovery, development, testing and approval process, which has directly led to an increase in the demand for our services. Changes in government or regulatory policy, or a reversal in the trend toward increasing the acceptance of and reliance upon in silico data (trials, studies, or experiments conducted via computer or computer simulation) in the drug approval process, could decrease the demand for our products and services or lead regulatory authorities to cease use of, or to recommend against the use of, our products and services. This, in turn, could have a material adverse impact on our revenue and future growth.
Our software products are licensed by the FDA, the EMA and 15 other regulatory authorities, who use them in assessing new drug applications. These licenses, which accounted for 0.2% of our annual revenue in 2020, and 0.2% in 2019, are typically renewed on an annual basis, and there is no obligation for these regulatory authorities to renew these licenses at the same or any level. Although we do not believe that reduction or elimination of the use of any of our software products that are currently licensed by regulatory authorities would have a direct impact on the use of those products by our industry customers, it could diminish our reputation and negatively impact our ability to effectively market and sell our software products, particularly if such move were part of a wider reversal of government or regulatory acceptance of in silico data.
We also work closely with the global academic community on research, publications, and training of the next generation of biopharmaceutical scientists. Our software products are used in many academic institutions, often free of charge, where students, including PhD candidates, are first exposed to the types of tools and models that we offer. Upon graduating, these students often become employed by biopharmaceutical companies, where they continue to use our products and advocate for their continued use. If academic institutions decide to use competitive products, or develop their own biosimulation products, or reduce the exposure to biosimulation tools in general, familiarity with our products by the future generations of pharmacometricians and clinical pharmacologists will be diminished, which could ultimately result in a reduction in demand for our products.
Changes or delays in government regulation relating to the biopharmaceutical industry could decrease the need for some of the services we provide.
Governmental agencies throughout the world, but particularly in the United States where the majority of our customers are based, strictly regulate the biopharmaceutical development process. Our business involves helping biopharmaceutical companies strategically and tactically navigate the regulatory approval process. New or amended regulations are expected to result in higher regulatory standards and potentially additional revenues for companies that service these industries. However, some changes in regulations, such as a relaxation in regulatory requirements or the introduction of streamlined or expedited approval procedures, or an increase in regulatory requirements that we have difficulty satisfying or that make our regulatory strategy services less competitive, could eliminate or substantially reduce the
22
demand for our regulatory services. Regulatory developments that could potentially increase demand for our services could also be postponed or not fully implemented. For example, we provide a technology-enabled service for automated redaction of these large, complex documents. The EMA issued proposed rules that would require our customers to publish suitably redacted clinical reports submitted as part of a regulatory application. The EMA has since delayed implementation of this requirement, reducing demand for our document redaction technology and services. Any material decrease or delay in demand for our technologies or services may have a material adverse effect on our business, financial condition and results of operations.
We cannot predict the likelihood, nature or extent of government regulation that may arise from future legislation or administrative action, or changes to governmental regulation that may be required as a result of judicial decisions, either in the United States or abroad. If we are slow or unable to adapt to changes in existing requirements or the adoption of new requirements or policies, or if we are not able to maintain regulatory compliance, our business may be harmed.
Reduction in research and development spending by our customers for a variety of reasons, as well as delays in the drug discovery and development process, may reduce demand for our products and services and negatively impact our results of operations and financial condition.
We provide biosimulation software platforms and services to the biopharmaceutical industry, both private and public companies as well as government and academic institutions. Because our products and services depend on our customers’ research and development expenditures, our revenues may be materially negatively affected by any economic, competitive, regulatory, demand, or other market impact that decreases our customers’ profitability or causes them to decrease or delay research and development spend. In such an event, our revenues may be reduced through increased downward pricing pressure, reduction in the scope of projects, delays or cancellations of ongoing projects, or our customers’ shifting away from using third parties for their modeling and simulation work. Our customers’ expenses could continue to increase as a result of the higher costs of developing more complex drugs and biologics and complying with more onerous government regulations. Furthermore, our customers finance their research and development spending from both private and public sources, including the capital markets. As a result, our revenues and financial performance may be adversely impacted if our customers are unable to obtain sufficient capital on acceptable terms to finance their research and development spending. Government and university-based funding of scientific research can vary for a number of reasons, including general economic conditions, political priorities, changes in the number of students and other demographic changes.
Our customers’ profitability could decline as a result of efforts by government and third-party payors to reduce the cost of healthcare. Governments worldwide have increased efforts to expand healthcare coverage while at the same time curtailing and better controlling the increasing costs of healthcare. If cost-containment efforts or other measures substantially changing existing insurance models limit our customers’ profitability, they may decrease research and development spending, which could decrease the demand for our services and materially adversely affect our growth prospects. In addition, industry trends, economic factors, regulatory developments, patent protection and political and other events and circumstances that affect the biopharmaceutical industry, such as volatility or declines in securities markets limiting capital and liquidity or decreased government funding of scientific research, or other circumstances that decrease our customers’ research and development spending also affect us.
Delays in the biopharmaceutical development cycle, particularly related to clinical trials being delayed or canceled, such as those caused by the recent COVID-19 pandemic, could also impact the demand for our products and services.
Furthermore, our financial success depends upon the creditworthiness and ultimate collection of amounts due from our customers. If we are not able to collect amounts due from our customers in a timely fashion due to funding or liquidity challenges or for any other reason, we may be required to write-off significant accounts receivable and recognize bad debt expenses, which could materially and adversely affect our operating results. All of these events could have a material adverse effect on our business, results of operations or financial condition.
23
Consolidation within the biopharmaceutical industry may reduce the pool of potential customers for our products and services or reduce the number of licenses for our software products.
A significant portion of our customer base consists of biopharmaceutical companies, and our revenue is dependent upon expenditures by these customers. Consolidation through mergers or business failures within the biopharmaceutical industry may reduce the number of potential customers, particularly larger customers, for our products and services. Consolidation of major biopharmaceutical companies could result in consolidation of software licenses used by those companies, reduction of the number of individual user licenses, or increased pressure to negotiate price discounts or other terms for service that are less favorable to us, which may have a material adverse effect on our revenue and financial condition. Personnel redundancies and layoffs by merged companies to achieve deal synergies would result in a commensurate reduction in total users of our software, reducing the license fees we charge based on number of users.
As customers increase their utilization of our products and services, we may be subject to additional pricing pressures.
One of our strategic goals is to increase the breadth and utilization of products and services we provide to our existing customers, such as increasing the number of user licenses for our software products, selling licenses for new software products and expanding the number and scope of services we provide to individual customers. As the total annual expenditure from a particular customer increases, we may experience pricing pressure, often from the customer’s procurement department, in the form of requests for discounts or rebates, price freezes and less favorable payment terms. This could have an adverse impact on our profitability.
Risks Related to Our Business
Our continued revenue growth depends on our ability to successfully enter new markets, increase our customer base and expand our relationship and the products and services we provide to our existing customers.
Our products and services are used primarily by modeling and simulation specialists in pharmaceutical, biotechnology, and government research or regulatory organizations. We have relationships with many large companies in the biopharmaceutical sector, and part of our growth strategy entails deriving more revenues from these existing customers by expanding their use of our existing and new products and services. Our ability to increase revenues with existing customers may be limited without significant investment in marketing our existing products and services or developing new products, which could be time-consuming and costly and may not be successful. We are also focused on increasing the number of emerging or smaller biotechnology customers that we serve. These small companies are increasingly responsible for much of the discovery and development of new molecules and treatments, and their share of the total industry research and development discovery and development dollars is rapidly growing. Attracting these smaller customers may require us to expend additional resources on targeted marketing, as they may not be as familiar with our company or products. And although these small biotechnology companies tend to use third parties such as Certara for many of their development activities, these smaller companies also tend to be less financially secure. If their products are not successful or they have difficulty raising sufficient investment capital, they may not be able to timely or fully pay for our services, or they may terminate or decrease the scope of projects for which they use our products and services, which could adversely impact our revenues.
Our strategy also includes expanding into new markets, new geographies, and new areas within our existing markets, either organically or by acquiring other companies in these markets. For example, we recently acquired several QSP models in the field of neurodegenerative diseases and are currently creating a consortium of customers to further develop these models. If our strategies are not executed successfully, or we cannot integrate acquired models into our platform, our products and services may not achieve market acceptance or penetration in targeted new departments within our existing customers or new customers. We cannot guarantee that we will be able to identify new biosimulation or regulatory and market access technologies of interest to our customers, or develop or acquire them in a timely fashion. Even if we are able to identify and develop new technologies and biosimulation tools of interest, we may not be able to negotiate license agreements on acceptable terms, or at all. Some of our products, such as our QSP models, require significant time and investment to develop to a point where they can achieve market acceptance, and we may not be able to develop them at a rate that matches market demand. We may also face more significant pricing pressure as we expand
24
geographically and our customer profile evolves. For example, smaller biotechnology companies, or companies based in countries that have less developed economies, may not be able to afford our products and services at our customary rates. If we are unable to develop or acquire new services and products and/or create demand for those newly developed services and products, accelerate the development of products where there is a market demand, or maintain or increase our historic pricing levels, our future business, results of operations, financial condition and cash flows could be adversely affected.
Our business may be subject to risks arising from natural disasters and epidemic diseases, such as the recent COVID-19 pandemic.
We may be subject to risks related to natural disasters and public health crises, such as the global pandemic associated with COVID-19.
The COVID-19 pandemic has also had a significant and sustained negative impact on the global economy and a negative impact on many of our customers. Many of our customers have experienced or may in the future be adversely impacted by supply chain interruptions, disruptions to pipeline development and clinical trials, decreased product demand (including due to reduced elective healthcare consumption and as a result of increased unemployment), costs associated with the COVID-19 pandemic and interruptions or delays in regulatory approvals due to the impact of the COVID-19 pandemic on the operations of certain regulatory authorities. We may also see a reduction in total users of our software due to layoffs resulting from the COVID-19 pandemic in the biopharmaceutical industry. These and other adverse impacts on our customers and economic conditions related to the COVID-19 pandemic may cause our customers to significantly scale back their operations or research and development spending and limit the use of third parties, which could have a material adverse effect on our business.
We have undertaken several actions to mitigate and/or limit the spread of COVID-19 amongst our employees, including restricting employee travel, closing our offices in compliance with local guidelines and, when reopening offices, implementing a number of safety measures, such as increasing sanitation, mandating social distancing or use of personal protective equipment, and limiting the number of employees at each location. Furthermore, even if we follow what we believe to be best practices, there can be no assurance that our measures will prevent the transmission of SARS-CoV-2 between employees. Any incidents of actual or perceived transmission may expose us to liability claims, adversely impact employee productivity and morale, and result in negative publicity and reputational harm.
Travel restrictions and the cancellation of industry conferences have significantly limited face-to-face interactions with existing and potential customers, which have traditionally been an effective avenue for developing new business. If our scientists and consultants are not able to effectively communicate and interact with our existing and potential customers remotely, a prolonged period of limited direct contact with customers could translate into reduced bookings and negatively impact our revenue generation.
The extent to which the COVID-19 pandemic may impact our business in the future is highly uncertain and cannot be predicted. In addition, a recession or a prolonged period of depressed economic activity related to COVID-19 and measures taken to mitigate its spread could have a material adverse effect on our business, financial condition and results of operations.
In addition to the current COVID-19 pandemic, our business could be negatively impacted by other natural disasters, such as new disease epidemics, significant weather events, the outbreak of war or acts of terrorism, or other “acts of God.” The COVID-19 pandemic and such other events may also exacerbate a number of the other risks discussed in this section, any of which could have a material effect on us. We are a global company with offices in many countries. Disruptions in the infrastructure, either on a local or global scale, caused by these types of events could adversely affect our ability to serve our customers.
Although we have disaster recovery plans, carry business interruption insurance policies and typically have provisions in our contracts that protect us in certain force majeure type events, our coverage might not be adequate to compensate us for all losses that may occur.
25
Delays or defects in the release of new or enhanced software or other biosimulation tools may result in increased cost to us, delayed market acceptance of our products, diminished demand for our products, delayed or lost revenue, and liability.
Market acceptance of our products depends upon the continuous, effective and reliable operation of our software and other biosimulation tools and models. New or enhanced products or services can require long development and testing periods, which may result in delays in scheduled introduction. Our software solutions and biosimulation tools and models are inherently complex and may contain defects or errors. The risk of errors is particularly significant when a new product is first introduced or when new versions or enhancements of existing software solutions are released. Although we extensively test and conduct quality control on each new or enhanced biosimulation product before it is released to the market, there can be no assurance that significant errors will not be found in existing or future releases. As a result, in the months following the introduction of certain releases, we may need to devote significant resources to correct these errors. There can be no assurance, however, that all of these errors can be corrected. Many of our customers also require that new versions of our software be internally validated before implementing it, which can result in implementation delays or the decision to skip smaller updates altogether. Any errors, defects, disruptions or other performance problems with our products could hurt our reputation and may damage our customers’ businesses. Any delays in the release schedule for new or enhanced products or services may delay market acceptance of these products or services and may result in delays in new customer orders for these new or enhanced products or services or the loss of customer orders, which may have a material adverse effect on our business, financial condition and results of operations.
To the extent that defects or errors cause our software or other biosimulation tools to malfunction and our customers’ use of our products is interrupted, or the data derived from the use of our products is incorrect or incomplete, our customers may delay or withhold payment to us, cancel their agreements with us or elect not to renew, make service credit claims, warranty claims or other claims against us, and we could lose future sales. The occurrence of any of these events could result in diminishing demand for our software, a reduction of our revenues, an increase in collection cycles for accounts receivable, require us to increase our warranty provisions or incur the expense of litigation or substantial liability.
If our existing customers do not renew their software licenses, do not buy additional solutions from us or renew at lower prices, our business and operating results will suffer.
We expect to continue to derive a significant portion of our software revenues from the renewal of existing license agreements. As a result, maintaining the renewal rate of our existing customers and selling additional software solutions to them is critical to our future operating results. Factors that may affect the renewal rate for our customers and our ability to sell additional solutions to them include:
| ● | the price, performance and functionality of our software solutions; |
| ● | the availability, price, performance and functionality of competing products; |
| ● | the effectiveness of our professional services; |
| ● | our ability to develop complementary software solutions, applications and services; |
| ● | the stability, performance and security of our technological infrastructure; and |
| ● | the business environment of our customers. |
We deliver our software through either (i) a product license that permits our customers to install the software solution directly onto their own in-house hardware and use it for a specified term, or (ii) a subscription that allows our customers to access the cloud-based software solution for a specified term. Our customers have no obligation to renew their product licenses or subscriptions for our software solutions after the license term expires, which are typically between one and three years, and some of our contracts may be terminated or reduced in scope either immediately or upon notice. In addition, our customers may negotiate terms less advantageous to us upon renewal, which may reduce our revenues from these customers.
Our customers depend on our support organization to resolve technical issues relating to our solutions, as our software requires expert usage to fully exploit its capabilities. Any failure to offer high-quality technical support, or a market perception that we do not offer high-quality support, could adversely affect our renewal rates and our ability to sell our additional solutions to existing or to sell to prospective customers. Factors that are not within our control may also
26
contribute to a reduction in our software revenues. For instance, our customers may reduce the number of their employees who are engaged in research and who would have use of our software, which would result in a corresponding reduction in the number of user licenses needed for some of our solutions and thus a lower aggregate renewal fee. The loss, reduction in scope or delay of a large contract, or the loss or delay of multiple contracts, could materially adversely affect our business.
Our future operating results also depend, in part, on our ability to sell new software solutions and licenses to our existing customers. The willingness of existing customers to license our software will depend on our ability to scale and adapt our existing software solutions to meet the performance and other requirements of our customers, which we may not do successfully. If our customers fail to renew their agreements, renew their agreements upon less favorable terms or at lower fee levels or fail to purchase new software solutions and licenses from us, our revenues may decline and our future revenues may be constrained. Furthermore, our sales process is dependent on the reputation of our solutions and business and on positive recommendations from our existing customers. Any dissatisfaction from existing customers may adversely impact our ability to sell our solutions to new customers.
Our customers may delay or terminate contracts, or reduce the scope of work, for reasons beyond our control, or we may underprice or overrun cost estimates with our fixed-fee contracts, potentially resulting in financial losses.
Many of our technology-enabled service contracts may be terminated by the customer at its discretion immediately or after a short notice period without penalty. Customers terminate, delay or reduce the scope of these types of contracts for a variety of reasons, including but not limited to:
| ● | lack of available funding or financing; |
| ● | mergers or acquisitions involving the customer; |
| ● | a change in customer priorities; |
| ● | delay or termination of a specific product candidate development program; and |
| ● | the customer decides to shift business to a competitor or to use internal resources. |
As a result, contract terminations, delays and reductions in scope occur regularly in the normal course of our business. However, the delay, loss or reduction in scope of a large contract or multiple smaller contracts could result in under-utilization of our personnel, a decline in revenue and profitability and adjustments to our bookings, any or all of which could have a material adverse effect on our business, results of operations, financial condition and/or cash flows.
Many of our contracts with customers also provide for services on a fixed-price or fee-for-service with a cap basis. Accordingly, we bear the financial risk if we initially underprice our contracts or otherwise overrun our cost estimates. In these situations, we attempt to revise the scope of activity from the contract specifications and negotiate contract modifications shifting the additional cost to the customer, but are not always successful. If we fail to adequately price our contracts or if we experience significant cost overruns (including direct and indirect costs such as pass-through costs), or if we are delayed in, or fail to, execute contract modifications with customers increasing the scope of activity, our results of operations could be materially adversely affected. From time to time, we have had to commit unanticipated resources to complete projects, resulting in lower margins and profitability on those projects. We might experience similar situations in the future, which could have a material adverse impact on our results of operations and cash flows.
We depend on key personnel and may not be able to retain these employees or recruit additional qualified personnel, which could harm our business.
Our success depends to a significant extent on the continued services of our senior management and other key contributors throughout our business. As of December 31, 2020, approximately 300 of our employees held PhDs, PharmDs, or MDs. It is challenging to attract and retain critical and qualified employees because of the specialized scientific nature of our business and significant competition for qualified personnel in the biopharmaceutical industry. Many of our scientists also play a significant role in marketing and selling our products and services to new and existing customers. If any of our senior scientists or members of senior management team, such as our CEO, CFO or division presidents, do not continue in their present positions, our operations could be disrupted. Compensation for our employees makes up our most significant fixed cost. Unexpected revenue shortfalls in the future may make it difficult
27
for us to retain all of our employees. The loss of any key employee, or our inability to continue to recruit, retain and motivate key personnel, replace departed personnel in a timely fashion, or train our scientists to develop new business, may adversely impact our ability to compete effectively and grow our business and negatively affect our ability to meet our short and long-term financial and operational objectives.
We have government customers and have received government grants, which subject us to risks including early termination, audits, investigations, sanctions, or penalties.
We derive limited revenue from contracts with U.S. government, including the FDA and the Center for Disease Control and Prevention within the Department of Health and Human Services. We have also accepted limited grant funds from the U.S. government, whereby we are reimbursed for certain expenses incurred, subject to our compliance with the specific requirements of the applicable grant, including rigorous documentation requirements. We may enter into further contracts with the U.S. or foreign governments in the future, or accept additional grant funds. These subject us to statutes and regulations applicable to companies doing business with the government. These types of contracts customarily contain provisions that give the government substantial rights and remedies, many of which are not typically found in commercial contracts and which are unfavorable to contractors, including provisions that allow the government to unilaterally terminate or modify our federal government contracts, in whole or in part, at the government’s convenience or in the government’s best interest, including if funds become unavailable to the applicable government agency. Under general principles of government contracting law, if the government terminates a contract for convenience, the terminated company may generally recover only its incurred or committed costs and settlement expenses and profit on work completed prior to the termination. If the government terminates a contract for default, the defaulting company may be liable for any extra costs incurred by the government in procuring undelivered items from another source.
In addition, government contracts and grants normally contain additional requirements that may increase our costs of doing business, reduce our profits, and expose us to liability for failure to comply with these terms and conditions. These requirements include, for example:
| ● | compliance with complex regulations for procurement, formation, administration, and performance of government contracts under the Federal Acquisition Regulations, agency-specific regulations supplemental to the Federal Acquisition Regulations, and regulations specific to the administration of grants by the U.S. government; |
| ● | specialized disclosure and accounting requirements unique to government contracts and grants; |
| ● | mandatory financial and compliance audits that may result in potential liability for price or cost adjustments, recoupment of government funds after such funds have been spent, civil and criminal penalties, or administrative sanctions such as suspension or debarment from doing business with the U.S. government; |
| ● | public disclosures of certain contract, grant, and company information; and |
| ● | mandatory socioeconomic compliance requirements, including labor requirements, non-discrimination and affirmative action programs and environmental compliance requirements. |
Government contracts and grants are also generally subject to greater scrutiny by the government, which can unilaterally initiate reviews, audits and investigations regarding our compliance with government contract and grant requirements. In addition, if we fail to comply with government contract laws, regulations and contract or grant requirements, our contracts and grants may be subject to termination or suspension, and we may be subject to financial and/or other liability under our contracts or under the Federal Civil False Claims Act. The False Claims Act’s “whistleblower” provisions allow private individuals, including present and former employees, to sue on behalf of the U.S. government. The False Claims Act statute provides for treble damages and other penalties and, if our operations are found to be in violation of the False Claims Act, we could face other adverse action, including suspension or prohibition from doing business with the United States government. Any penalties, damages, fines, suspension, or damages could adversely affect our ability to operate our business and our financial results.
28
Our recent growth rates may not be sustainable or indicative of future growth.
We have experienced significant growth in recent years. Revenue increased from $208.5 million for 2019 to $243.5 million for 2020. Our historical rate of growth may not be sustainable or indicative of our future rate of growth. We believe that our continued growth in revenue, as well as our ability to improve or maintain margins and profitability, will depend upon, among other factors, our ability to address the challenges, risks and difficulties described elsewhere in this “Risk Factors” section and the extent to which our various product offerings grow and contribute to our results of operations. We cannot provide assurance that we will be able to successfully manage any such challenges or risks to our future growth. In addition, our customer base may not continue to grow or may decline due to a variety of possible risks, including increased competition, changes in the regulatory landscape and the maturation of our business. Any of these factors could cause our revenue growth to decline and may adversely affect our margins and profitability. Failure to continue our revenue growth or improve margins would have a material adverse effect on our business, financial condition and results of operations. You should not rely on our historical rate of revenue growth as an indication of our future performance.
We regularly evaluate potential acquisitions of other companies or technologies, which could divert our management’s attention, result in additional dilution to our stockholders, and otherwise disrupt our operations and adversely affect our operating results.
We have acquired multiple businesses and technologies in the past and we regularly evaluate opportunities to acquire or invest in businesses, solutions or technologies that we believe could complement or expand our solutions, enhance our technical capabilities or otherwise offer growth opportunities. The pursuit of potential acquisitions may divert the attention of management and cause us to incur various expenses in identifying, investigating and pursuing suitable acquisitions, whether or not they are consummated.
If we acquire additional businesses, we may not be able to integrate the acquired personnel, operations and technologies successfully, effectively manage the combined business following the acquisition or preserve the operational synergies between our business units that we underwrite at the time of the acquisition. We cannot assure that following any acquisition we would achieve the expected synergies to justify the transaction, due to a number of factors, including:
| ● | inability to integrate or benefit from acquired technologies or services in a profitable manner; |
| ● | unanticipated costs or liabilities associated with the acquisition; |
| ● | incurrence of acquisition-related costs; |
| ● | difficulty integrating the accounting systems, operations and personnel of the acquired business; |
| ● | difficulties and additional expenses associated with supporting legacy products and hosting infrastructure of the acquired business; |
| ● | difficulty converting the customers of the acquired business onto our solutions and contract terms, including disparities in the revenues, licensing, support or professional services model of the acquired company; |
| ● | diversion of management’s attention from other business concerns; |
| ● | adverse effects to our existing business relationships with business partners and customers as a result of the acquisition; |
| ● | the potential loss of key employees; |
| ● | use of resources that are needed in other parts of our business; and |
| ● | use of substantial portions of our available cash to consummate the acquisition. |
In addition, a significant portion of the purchase price of companies we acquire may be allocated to acquired goodwill and other intangible assets, which must be assessed for impairment at least annually. In the future, if our acquisitions do not yield expected returns, we may be required to take charges to our operating results based on this impairment assessment process, which could adversely affect our results of operations.
Acquisitions could also result in dilutive issuances of equity securities or the incurrence of debt, which could adversely affect our operating results. In addition, if an acquired business fails to meet our expectations, our operating results, business and financial position may suffer.
29
Our estimated addressable market is subject to inherent challenges and uncertainties. If we have overestimated the size of our addressable market or the various markets in which we operate, our future growth opportunities may be limited.
Our TAM is based on publicly available third-party market research and internal estimates regarding the size of our markets, and is subject to significant uncertainty and is based on assumptions that may not prove to be accurate. We base the TAM for our business off our current core markets, biosimulation, regulatory science, and market access. These estimates may change or prove to be inaccurate. While we believe the information on which we base our TAM is generally reliable, such information is inherently imprecise. In addition, our expectations, assumptions and estimates of future opportunities are necessarily subject to a high degree of uncertainty and risk due to a variety of factors, including those described herein. If third-party or internally generated data prove to be inaccurate or we make errors in our assumptions based on that data, our future growth opportunities may be affected. If our TAM, or the size of any of the various markets in which we operate, proves to be inaccurate, our future growth opportunities may be limited and there could be a material adverse effect on our prospects, business, financial condition and results of operations.
We are subject to risks associated with the operation of a global business.
We derive a significant portion of our total revenue from our operations in international markets. During the years ended December 31, 2020 and 2019, 26% and 27%, respectively, of our revenues were transacted in foreign currencies, the majority of which included the British pound sterling, the euro and Japanese yen. Our global business may be affected by local economic conditions, including inflation, recession and currency exchange rate fluctuations. Changes in the value of the U.S. dollar relative to other currencies could result in material foreign currency exchange rate fluctuations and, as a result, our net earnings could be materially adversely affected. In addition, political and economic changes, including international conflicts and terrorist acts, throughout the world may interfere with our or our customers’ activities in particular locations and result in a material adverse effect on our business, financial condition and operating results. Potential trade restrictions, exchange controls, adverse tax consequences and legal restrictions may affect our revenue from customers located outside the United States and the repatriation of funds into the United States. Also, we could be subject to unexpected changes in regulatory requirements, the difficulties of compliance with a wide variety of foreign laws and regulations, potentially negative consequences from changes in or interpretations of U.S. and foreign tax laws, import and export licensing requirements and longer accounts receivable cycles in certain foreign countries. Foreign currency exchange rate hedges, transactions, re-measurements, or translations could also materially impact our financial results. These risks, individually or in the aggregate, could have an adverse effect on our results of operations and financial condition.
We are subject to the FCPA and the Bribery Act and similar anti-corruption laws and regulations in other countries. Violations of these laws and regulations could harm our reputation and business, or materially adversely affect our business, results of operations, financial condition and/or cash flows.
We operate in numerous countries around the world and are subject to the FCPA, the Bribery Act and similar anti-bribery laws in the countries in which we operate. Our business involves sales to government and state-owned agencies and brings us and others acting on our behalf, into contact with government officials around the world. The FCPA and the Bribery Act prohibit us and our officers, directors, employees and third parties acting on our behalf, including agents, from corruptly offering, promising, authorizing or providing anything of value to a “foreign official” for the purposes of influencing official decisions or obtaining or retaining business or otherwise obtaining favorable treatment. The FCPA further requires us to make and keep books, records and accounts that accurately reflect transactions and dispositions of assets and to maintain a system of adequate internal accounting controls. The Bribery Act also prohibits “commercial” bribery and accepting bribes.
Although our officers, directors, employees, distributors, and agents are required to comply with these laws, we cannot be sure that our internal policies and procedures will always protect us from liability for violations of these laws committed by persons associated with us, including our employees or third parties acting on our behalf. Violations of anti-corruption laws, or even allegations of such violations, could disrupt our business and result in a material adverse effect on our reputation, business, results of operations, financial condition and/or cash flows. For example, violations
30
may result in criminal or civil penalties, disgorgement of profits, related stockholder lawsuits, debarment from government contracting and other remedial measures.
Our failure to comply with trade compliance and economic sanctions laws and regulations of the United States and applicable international jurisdictions could materially adversely affect our reputation and results of operations
We must operate our business in compliance with applicable economic and trade sanctions laws and regulations, such as those administered and enforced by the U.S. Department of Treasury’s Office of Foreign Assets Control, the U.S. Department of State, the U.S. Department of Commerce, the United Nations Security Council and other relevant sanctions authorities. Our global operations expose us to the risk of violating, or being accused of violating, economic and trade sanctions laws and regulations. Our failure to comply with these laws and regulations may expose us to reputational harm as well as significant penalties, including criminal fines, imprisonment, civil fines, disgorgement of profits, injunctions and debarment from government contracts, as well as other remedial measures. Investigations of alleged violations can be expensive and disruptive. Despite our compliance efforts and activities we cannot assure compliance by our employees or representatives for which we may be held responsible, and any such violation could materially adversely affect our reputation, business, financial condition and results of operations.
Current and future litigation against us, which may arise in the ordinary course of our business, could be costly and time consuming to defend.
We are subject to claims that arise in the ordinary course of business, such as claims brought by our customers in connection with commercial disputes, employment claims made by our current or former employees, or claims brought by third-parties for failure to adequately protect their personal data. Third parties may in the future assert intellectual property rights to technologies that are important to our business and demand back royalties or demand that we license their technology. Litigation may result in substantial costs and may divert management’s attention and resources, which may seriously harm our business, overall financial condition and operating results. Insurance may not cover such claims, may not be sufficient for one or more of such claims and may not continue to be available on terms acceptable to us. A claim brought against us that is uninsured or underinsured could result in unanticipated costs, negatively affecting our business, financial condition and results of operations.
Our insurance coverage may not be sufficient to avoid material impact on our financial position resulting from claims or liabilities against us, and we may not be able to obtain insurance coverage on attractive terms, or at all, in the future.
We maintain insurance coverage for protection against many risks of liability, including directors and officers liability, professional errors and omissions, breach of fiduciary duty, and cybersecurity risks. The extent of our insurance coverage is under continuous review and is modified as we deem it necessary. Despite this insurance, it is possible that claims or liabilities against us may have not be fully insured, or our insurance carriers may contest coverage, which could have a material adverse impact on our financial position or results of operations. In addition, we may not be able to obtain any insurance coverage, or adequate insurance coverage on attractive terms, or at all, when our existing insurance coverage expires and the cost of obtaining such insurance coverage may materially increase.
If we fail to perform our services in accordance with contractual requirements, regulatory standards and ethical considerations, we could be liable for significant costs or penalties and our reputation could be harmed.
The services we provide to biopharmaceutical companies and other customers are complex and subject to contractual requirements, regulatory standards and ethical considerations. For example, some of our services must adhere to regulatory requirements of the FDA governing our activities relating to preclinical studies and clinical trials, including GLP and GCP. Additionally, we are subject to compliance with FDA’s regulations set forth in part 11 of title 21 of the Code of Federal Regulations, which relates to the creation, modification, maintenance, storage, retrieval, or transmittal of electronic records submitted to the FDA. We may be subject to inspection by regulatory authorities in connection with our customers’ marketing applications and other regulatory submissions. If we fail to perform our services in accordance with regulatory requirements, regulatory authorities may take action against us or our customers for failure to comply with applicable regulations governing the development and testing of therapeutic products. Regulatory authorities may
31
also disqualify certain data or analyses from consideration in connection with applications for regulatory approvals, which would result in our customers not being able to rely on our services in connection with their regulatory submissions and may subject our customers to additional or repeat clinical trials and delays in the development and regulatory approval process. Mistakes in providing services to our customers, such as dosing models, could affect medical decisions for patients in clinical trials and create liability for personal injury. Such actions may include sanctions, such as warning or untitled letters, injunctions or failure of such regulatory authorities to grant marketing approval of products, delay, suspension or withdrawal of approvals, license revocation, loss of accreditation, product seizures or recalls, operational restrictions, civil or criminal penalties or prosecutions, damages or fines. Customers may also bring claims against us for breach of our contractual obligations or errors in the outcomes of our products or services, may terminate their contracts with us and/or may choose not to award further work to us. Any such action could have a material adverse effect on our reputation, business, financial condition and results of operations.
We derive a significant percentage of our revenues from a concentrated group of customers and the loss of more than one of our major customers could materially and adversely affect our business, results of operations and/or financial condition.
Our ten largest customers accounted for 28% and 28% of revenues for the years ended December 31, 2020 and 2019, respectively. The loss of any of our major customers could have a material adverse effect on our results of operations and financial condition. We may not be able to maintain our customer relationships, and our customers may delay payment under, or fail to renew, their agreements with us, which could adversely affect our business, results of operations or financial condition. Any reduction in the amount of revenues that we derive from these customers, without an offsetting increase in new sales to other customers, could have a material adverse effect on our operating results. A significant change in the liquidity or financial position of our customers could also have a material adverse effect on the collectability of our accounts receivable, our liquidity, and our future operating results.
The U.S. government’s determination to award a future contract or contract option may be challenged by an interested party, and, if that challenge is successful, that future contract or option may be terminated.
The laws and regulations governing the procurement of goods and services by the United States government provide procedures by which other bidders and interested parties may challenge the award of a government contract at the U.S. Government Accountability Office (“GAO”) or in federal court. If we are awarded a government contract, such challenges or protests could be filed even if there are not any valid legal grounds on which to base the protest. If any such protests are filed, the government agency may decide to suspend our performance under the contract while such protests are being considered by the GAO or the applicable federal court, thus potentially delaying delivery of payment. In addition, we could be forced to expend significant funds to defend any potential award. If a protest is successful, the government may be ordered to terminate any one or more of our contracts and reselect bids. The government agencies with which we have contracts could even be directed to award a potential contract to one of the other bidders.
We may need additional funding. If we are unable to raise additional capital on terms acceptable to us or at all or generate cash flows necessary to maintain or expand our operations, we may not be able to compete successfully, which would harm our business, results of operations, and financial condition.
We expect to devote substantial financial resources to our ongoing and planned activities, including the continued investment in our biosimulation software platform.
As of December 31, 2020 we had cash and cash equivalents of $271.4 million. We believe that our existing cash and cash equivalents will be sufficient to fund our operations and capital expenditure requirements for at least the next 12 months. However, we have based this estimate on assumptions that may prove to be wrong, and our operating plans may change as a result of many factors currently unknown to us. As a result, we could deplete our capital resources sooner than we currently expect.
Our future capital requirements will depend on many factors, including:
| ● | the growth of our revenue; |
32
| ● | the growth of our employee base; |
| ● | the timing and launch of new products, for example QSP and QSTS consortia; |
| ● | the continued expansion of sales and marketing activities; and |
| ● | mergers and acquisitions of technologies or services complementing or extending our biosimulation, regulatory science and market access businesses. |
In the event that we require additional financing, we may not be able to raise such financing on terms acceptable to us or at all. In addition, we may seek additional capital due to favorable market conditions or strategic considerations, even if we believe we have sufficient funds for our current or future operating plans. If we are unable to raise additional capital on terms acceptable to us or at all or generate cash flows necessary to maintain or expand our operations and invest in our computational platform, we may not be able to compete successfully, which would harm our business, operations, and financial condition.
Our bookings might not accurately predict our future revenue, and we might not realize all or any part of the anticipated revenue reflected in our backlog.
Our bookings represent anticipated revenue for work not yet completed or performed under a signed contract or purchase order where there is sufficient or reasonable certainty about the customer’s ability and intent to fund and commence the software or services. Bookings vary from period to period depending on numerous factors, including sales performance and the overall health of the biopharmaceutical industry, among others. Once work begins, we recognize direct revenue over the life of the contract based on our performance of services under the contract. Contracts may be terminated or delayed by our customers for reasons beyond our control. To the extent projects are delayed, the anticipated timing of our direct revenue could be materially affected.
In the event a customer terminates a contract, we are generally entitled to be paid for services rendered through the termination date and for services provided in winding down the project. However, we are generally not entitled to receive the full amount of direct revenue reflected in our bookings in the event of a contract termination. A number of factors may affect bookings and the direct revenue generated from our bookings, including:
| ● | the size, complexity and duration of solutions; |
| ● | changes in the scope of work during the course of a project; and |
| ● | the cancellation or delay of a solution. |
Our bookings for the year ended December 31, 2020 were $288.3 million compared to bookings of $259.5 million for the year ended December 31, 2019. Although an increase in bookings will generally result in an increase in future direct revenue to be recognized over time (depending on future contract modifications, contract cancellations and other adjustments), an increase in bookings at a particular point in time does not necessarily correspond to an increase in direct revenues during a particular period. The timing and extent to which bookings will result in direct revenue depends on many factors, including the timing of commencement of work, the rate at which we perform services, scope changes, cancellations, delays, receipt of regulatory approvals and the nature, duration, size, complexity and phase of the studies. In addition, delayed projects remain in bookings until they are canceled. As a result of these factors, our bookings are not necessarily a reliable indicator of future direct revenue and we might not realize all or any part of the direct revenue from the authorizations in bookings as of any point in time.
33
Risks Related to Intellectual Property, Information Technology and Data Privacy
We rely upon third-party providers of cloud-based infrastructure to host our software solutions. Any disruption in the operations of these third-party providers, limitations on capacity or interference with our use could adversely affect our business, financial condition and results of operations.
We outsource substantially all of the infrastructure relating to our hosted software solutions to third-party hosting services. Customers of our hosted software solutions need to be able to access our software platform at any time, without interruption or degradation of performance, and we provide them with service-level commitments with respect to uptime. Our hosted software solutions depend on protecting the virtual cloud infrastructure hosted by third-party hosting services by maintaining its configuration, architecture, features and interconnection specifications, as well as the information stored in these virtual data centers, which is transmitted by third-party internet service providers. Any limitation on the capacity of our third-party hosting services could impede our ability to onboard new customers or expand the usage of our existing customers, which could adversely affect our business, financial condition and results of operations. In addition, any incident affecting our third-party hosting services’ infrastructure that may be caused by cyber-attacks, natural disasters, fire, flood, severe storm, earthquake, power loss, telecommunications failures, terrorist or other attacks and other similar events beyond our control could negatively affect our cloud-based solutions. Work-from-home and other measures introduced to mitigate the spread of the COVID-19 pandemic have impacted our third-party vendors by increasing operational challenges and risks, including vulnerabilities to cybersecurity and information technology infrastructure threats. A prolonged service disruption affecting our cloud-based solutions for any of the foregoing reasons would negatively impact our ability to serve our customers and could damage our reputation with current and potential customers, expose us to liability, cause us to lose customers or otherwise harm our business. We may also incur significant costs for using alternative equipment or taking other actions in preparation for, or in reaction to, events that damage the third-party hosting services we use.
In the event that our service agreements with our third-party hosting services are terminated, or there is a lapse of service, elimination of services or features that we utilize, interruption of internet service provider connectivity or damage to such facilities, we could experience interruptions in access to our platform as well as significant delays and additional expense in arranging or creating new facilities and services and/or re-architecting our hosted software solutions for deployment on a different cloud infrastructure service provider, which could adversely affect our business, financial condition and results of operations.
If we are not able to reliably meet our data storage and management requirements, or if we experience any failure or interruption in the delivery of our services over the internet, customer satisfaction and our reputation could be harmed and customer contracts may be terminated.
As part of our current business model, the portion of our software that is delivered over the internet as SaaS is increasing, and we store and manage significant data for our customers, resulting in substantial information technology infrastructure and ongoing technological challenges, which we expect to continue to increase over time. If we do not reliably meet these data storage and management requirements, or if we experience any failure or interruption in the delivery of our services over the internet, customer satisfaction and our reputation could be harmed, leading to reduced revenues and increased expenses. Our hosting services are subject to service-level agreements and, in the event that we fail to meet guaranteed service or performance levels, we could be subject to customer credits or termination of these customer contracts. If the cost of meeting these data storage and management requirements increases, our results of operations could be harmed.
Our software solutions utilize third-party open source software, and any failure to comply with the terms of one or more of these open source licenses could adversely affect our business, subject us to litigation and create potential liability.
Some of our software solutions utilize software covered by open source licenses, and we expect to continue to incorporate open source software in our solutions in the future. Open source software is typically freely accessible, usable and modifiable, and is used by our development team in an effort to reduce development costs and speed up the development process. Use of open source software also in some respects entails greater risks than use of third party
34
commercial software, as open source licensors generally do not provide warranties or other contractual protections regarding infringement claims or the quality of the code, including with respect to security vulnerabilities.
Although we have processes intended to fully comply with all license requirements in our software, certain open source software licenses require, among other things, that a licensor that distributes the open source software as a component of the licensor’s proprietary software, to provide or offer to provide to the customer-licensee part or all of the source code to the licensor’s proprietary software. If the owner of the copyright of the relevant open source software were to allege that we had not complied with the conditions of one or more of these licenses, we could be required to incur significant legal expenses defending against such allegations and could be subject to significant damages, enjoined from the sale of our solutions that contain the open source software and required to comply with onerous conditions or restrictions on these solutions, which could disrupt the distribution and sale of these solutions. Litigation or other enforcement actions initiated by a copyright owner could have a negative effect on our business, financial condition and results of operations, or require us to devote additional research and development resources to change our solutions. Moreover, we could effectively be required to publicly release the affected portions of our source code, re-engineer all or a portion of our solutions or otherwise be limited in the licensing of our solutions, each of which could reduce or eliminate the value of our solutions. Disclosing our proprietary source code could allow our competitors to create similar products with lower development effort and time and ultimately could result in a loss of sales. Any of these events could create liability for us and damage our reputation, which could have a material adverse effect on our revenue, business, results of operations and financial condition and the market price of our shares.
If our security measures are breached or unauthorized access to customer data is otherwise obtained, our solutions may be perceived as not being secure, customers may reduce the use of or stop using our solutions and we may incur significant liabilities.
The evolution of technology systems introduces ever more complex security risks that are difficult to predict and defend against. An increasing number of companies, including those with significant online operations, have recently disclosed breaches of their security, some of which involved sophisticated tactics and techniques allegedly attributable to criminal enterprises or nation-state actors. While we believe that we have taken appropriate measures to prevent unintended access to the data we hold (including implementing security and privacy controls, training our workforce and implementing new technology) and we continue to improve and enhance our systems in this regard, our efforts may not always be successful. In addition, we do not know whether our current practices will be deemed sufficient under applicable laws or whether new regulatory requirements might make our current practices insufficient.
Our solutions involve the collection, analysis and retention of our customers’ proprietary information related to their drug development efforts, including clinical data. Unauthorized access to this information or data, whether by third-party action or employee error, and whether deliberate or unintentional, could result in the loss of information, litigation, indemnity obligations, damage to our reputation and other liability. Our increased reliance on remote access to our information systems due to the COVID-19 pandemic has increased our exposure to potential cybersecurity breaches and the risk of loss or exposure of such information and data. Additionally, we rely on third-parties and their security procedures for the secure storage, processing, maintenance, and transmission of information that is critical to our operations and such third-parties may also suffer cybersecurity incidents. Depending on their nature and scope, this could potentially result in the misappropriation, destruction, corruption or unavailability of critical data and confidential or proprietary information (our own or that of third parties, including information about our customers and employees) and the disruption of business operations.
If there is a cybersecurity incident and we know or suspect that certain personal information has been accessed, or used inappropriately, we may need to inform the affected individuals and may be subject to significant fines and penalties. Further, under certain regulatory schemes, such as the California Consumer Privacy Act (the “CCPA”), individuals may bring private claims and we may be liable for statutory damages. Further, if the technical and operational solutions we have adopted to maintain data security fail, our existing and potential customers may lose confidence in our ability to maintain the confidentiality of their intellectual property, we may be subject to breach of contract claims by our customers and we may suffer reputational and other harm as a result. Our insurance may not be adequate to cover losses associated with such events, and in any case, such insurance may not cover all of the types of costs, expenses and losses we could incur to respond to and remediate a security breach. Defending against investigations, claims or litigation based
35
on any security breach or incident, regardless of their merit, will be costly and may cause reputation harm. The successful assertion of one or more large claims against us that exceed available insurance coverage, denial of coverage as to any specific claim, or any change or cessation in our insurance policies and coverages, including premium increases or the imposition of large deductible requirements, could have a material adverse effect on our reputation, business, financial condition and results of operations.
We are subject to numerous privacy and data security laws and related contractual requirements and our failure to comply with those obligations could cause us significant harm.
In the normal course of our business, we collect, process, use and disclose information about individuals, including protected health information and other patient data, as well as information relating to health professionals and our employees. The collection, processing, use, disclosure, disposal and protection of such information is highly regulated both in the United States and other jurisdictions, including but not limited to, under HIPAA, as amended by HITECH; U.S. state privacy, security and breach notification and healthcare information laws; the European Union’s GDPR; and other European privacy laws as well as privacy laws being adopted in other regions around the world. These laws and regulations are complex and their interpretation is rapidly evolving, making implementation and enforcement, and thus compliance requirements, ambiguous, uncertain and potentially inconsistent. In addition, our collection, processing, use, disclosure, and protection of information is subject to related contractual requirements. Compliance with such laws and related contractual requirements may require changes to our collection, use, transfer, disclosure, or other processing of information about individuals, and may thereby increase compliance costs. Failure to comply with such laws and/or related contractual obligations could result in regulatory enforcement or claims against us for breach of contract, or may lead third parties to terminate their contracts with us and/or choose not to work with us in the future. Should this occur, there could be a material adverse effect on our reputation, business, financial condition, and results of operations.
These regulations often govern the use, handling and disclosure of information about individuals, including medical information and require the use of standard contracts, privacy and security standards and other administrative simplification provisions. In relation to HIPAA, we do not consider our service offerings to generally cause us to be subject as a covered entity; however, in certain circumstances, we are subject to HIPAA as a business associate and may enter into business associate agreements.
Additionally, the Federal Trade Commission (the “FTC”) and many state attorneys general are interpreting existing federal and state consumer protection laws to impose evolving standards for the online collection, use, dissemination and security of information about individuals, including health-related information. Courts may also adopt the standards for fair information practices promulgated by the FTC, which concern consumer notice, choice, security and access. Consumer protection laws require us to publish statements that describe how we handle information about individuals and choices individuals may have about the way we handle their information. If such information that we publish is considered untrue, we may be subject to government claims of unfair or deceptive trade practices, which could lead to significant liabilities and consequences. Furthermore, according to the FTC violating consumers’ privacy rights or failing to take appropriate steps to keep information about consumers secure may constitute unfair acts or practices in or affecting commerce in violation of Section 5(a) of the FTC Act.
In addition, certain states have adopted robust privacy and security laws and regulations. Such laws and regulations will be subject to interpretation by various courts and other governmental authorities, thus creating potentially complex compliance issues for us and our future customers and strategic partners. For example, the CCPA, which took effect in 2020, imposes obligations and restrictions on businesses regarding their collection, use, and sharing of personal information and provides new and enhanced data privacy rights to California residents, such as affording them the right to access and delete their personal information and to opt out of certain sharing of personal information. Protected health information that is subject to HIPAA is excluded from the CCPA, however, information we hold about individuals which is not subject to HIPAA would be subject to the CCPA. It is unclear how HIPAA and the other exceptions may be applied under the CCPA. The CCPA may increase our compliance costs and potential liability. Many similar privacy laws have been proposed at the federal level and in other states.
36
The GDPR became enforceable on May 25, 2018. The GDPR regulates our processing of personal data, and imposes stringent requirements. The GDPR includes sanctions for violations up to the greater of €20 million or 4.0% of worldwide gross annual revenue and applies to services providers such as us. In addition, following the transitional period following Brexit, must comply with the GDPR and also the UK GDPR, with each regime having the ability to fine up to the greater of €20 million (£17 million) or 4% of global turnover. The relationship between the United Kingdom and the European Union in relation to certain aspects of data protection law remains unclear, for example how data transfers between EU member states and the United Kingdom are treated and the role of the Information Commissioner’s Office following the end of the transitional period. These changes will lead to additional costs and increase our overall risk exposure.
Recent legal developments in Europe have created complexity and uncertainty regarding transfers of personal data from the EEA to the United States, e.g. on July 16, 2020, the Court of Justice of the European Union (“CJEU”) invalidated the EU-US Privacy Shield Framework (“Privacy Shield”) under which personal data could be transferred from the EEA to U.S. entities who had self-certified under the Privacy Shield scheme. While the CJEU upheld the adequacy of the standard contractual clauses (a standard form of contract approved by the European Commission as an adequate personal data transfer mechanism, and potential alternative to the Privacy Shield), it made clear that reliance on them alone may not necessarily be sufficient in all circumstances; this has created uncertainty. We have previously relied on our own Privacy Shield certification and our relevant customers’ and third parties’ Privacy Shield certification(s) for the purposes of transferring personal data from the EEA to the United States in compliance with the GDPR’s data export conditions. We also currently rely on the standard contractual clauses to transfer personal data outside the EEA, including to the United States.
We believe we maintain adequate processes and systems to ensure our and our customers’ compliance with the requirements of the GDPR, but it is possible that we could fail to comply or that we could incur liability due to the acts or omissions of our customers. Further, these recent developments will require us to review and amend the legal mechanisms by which we make and/or receive personal data transfers to/ in the United States. In the event we are not able to secure indemnification or the indemnification and any insurance coverage is inadequate to cover our losses, we could suffer significant financial, operational, reputational and other harm and our business, results of operations, financial condition and/or cash flows could be materially adversely affected. Further, as supervisory authorities issue further guidance on personal data export mechanisms, including circumstances where the standard contractual clauses cannot be used, and/or start taking enforcement action, we could suffer additional costs, complaints and/or regulatory investigations or fines, and/or if we are otherwise unable to transfer personal data between and among countries and regions in which we operate, it could affect the manner in which we provide our services, the geographical location or segregation of our relevant systems and operations, and could adversely affect our financial results.
The United States, the European Union, and other jurisdictions where we operate continue to issue new, and enhance existing, privacy and data security protection regulations related to the collection, use, disclosure, disposal and protection of information about individuals, including medical information. Privacy and data security laws are rapidly evolving both in the United States and internationally, and the future interpretation of those laws is somewhat uncertain. For example, we do not know how E.U. regulators will interpret or enforce many aspects of the GDPR and some regulators may do so in an inconsistent manner. In the United States, privacy and data security is an area of emphasis for some but not all state regulators, and new legislation has been and likely will continue to be introduced at the state and/or federal level. Additional legislation or regulation might, among other things, require us to implement new security measures and processes or bring within the legislation or regulation de-identified health or other information about individuals, each of which may require substantial expenditures or limit our ability to offer some of our services.
We may be unable to adequately enforce or defend our ownership and use of our intellectual property and other proprietary rights.
Our success is dependent upon our intellectual property and other proprietary rights. We rely upon a combination of trademark, trade secret, copyright, patent and unfair competition laws, as well as contractual provisions, to protect our intellectual property and other proprietary rights. In addition, we attempt to protect our intellectual property and proprietary information by enforcing cyber and physical security measures and requiring our employees and certain of our consultants to enter into confidentiality, non-competition and assignment-of-inventions agreements. The steps we
37
take to protect these rights may not be adequate to prevent misappropriation of our technology by third parties or may not be adequate under the laws of some foreign countries, which may not protect our intellectual property rights to the same extent as do the laws of the United States. Our attempts to protect our intellectual property may be challenged by others or invalidated through administrative process or litigation, and agreement terms that address non-competition are difficult to enforce in many jurisdictions and may not be enforceable in any particular case. In addition, there remains the possibility that others will “reverse engineer” our software products in order to introduce competing products, or that others will develop competing technology independently. If we resort to legal proceedings to enforce our intellectual property rights or to determine the validity and scope of the intellectual property or other proprietary rights of others, the proceedings could be burdensome and expensive, even if we were to prevail. The failure to adequately protect our intellectual property and other proprietary rights may have a material adverse effect on our business, results of operations or financial condition.
Third parties may initiate legal proceedings alleging that we are infringing, misappropriating or otherwise violating their intellectual property rights, the outcome of which would be uncertain and could have a material adverse effect on the success of our business.
Our commercial success depends upon our ability to develop, market and sell our products and services, allowing our customers to use our proprietary technologies without infringing, misappropriating or otherwise violating the intellectual property and proprietary rights of third parties. There is considerable patent and other intellectual property litigation in the software, pharmaceutical and biotechnology industries. We may become party to, or be threatened with, adversarial proceedings or litigation regarding intellectual property rights with respect to our technology and product candidates.
The legal threshold for initiating litigation or contested proceedings is low, so that even lawsuits or proceedings with a low probability of success might be initiated and require significant resources to defend. Litigation and contested proceedings can also be expensive and time-consuming, and our adversaries in these proceedings may have the ability to dedicate substantially greater resources to prosecuting these legal actions than we can. The risks of being involved in such litigation and proceedings may increase with the greater visibility associated with being a public company. Third parties may assert infringement claims against us based on existing patents or patents that may be granted in the future, regardless of merit. We may not be aware of all such intellectual property rights potentially relating to our technology, or we may incorrectly conclude that third-party intellectual property is invalid or that our activities do not infringe such intellectual property. Thus, we do not know with certainty that our technology does not and will not infringe, misappropriate or otherwise violate any third party’s intellectual property.
Parties making claims against us may obtain injunctive or other equitable relief, which could effectively block our ability to further develop and commercialize the product candidates that we may identify. Defense of these claims, regardless of their merit, would involve substantial litigation expense and would be a substantial diversion of employee resources from our business. In the event of a successful claim of infringement against us, we may have to pay substantial damages (including treble damages and attorneys’ fees for willful infringement), pay royalties, redesign our infringing products, be forced to indemnify our customers or collaborators or obtain one or more licenses from third parties, which may be impossible or require substantial time and monetary expenditure.
We may choose to take a license or, if we are found to infringe, misappropriate or otherwise violate a third party’s intellectual property rights, we could also be required to obtain a license from such third party to continue developing and marketing our technology. However, we may not be able to obtain any required license on commercially reasonable terms or at all. Even if we were able to obtain a license, it could be non-exclusive, thereby giving our competitors and other third parties access to the same technologies licensed to us and could require us to make substantial licensing and royalty payments. We could be forced, including by court order, to cease developing and commercializing the infringing technology or product. A finding of infringement could prevent us from commercializing any product candidates or force us to cease some of our business operations, which could materially harm our business. In addition, we may be forced to redesign a product. Claims that we have misappropriated the confidential information or trade secrets of third parties could have a similar material adverse effect on our reputation, business, financial condition and results of operations.
38
If we fail to comply with certain healthcare laws, including fraud and abuse laws, we could face substantial penalties and our business, results of operations, financial condition and prospects could be adversely affected.
Even though we do not order healthcare services or bill directly to Medicare, Medicaid or other third party payors, as a result of contractual, statutory or regulatory requirements, we may be subject to healthcare fraud and abuse laws of both the federal government and the states in which we conduct our business. Because of the breadth of these laws and the narrowness of available statutory and regulatory exceptions, it is possible that some of our business activities could be subject to challenge under one or more of such laws. If we or our operations are found to be in violation of any of the laws described above or any other governmental regulations that apply to us, we may be subject to penalties, including civil and criminal penalties, damages, fines, imprisonment and the curtailment or restructuring of our operations, any of which could materially adversely affect our ability to operate our business and our financial results.
Risks Related to Our Indebtedness
Our indebtedness could materially adversely affect our financial condition and our ability to operate our business, react to changes in the economy or industry or pay our debts and meet our obligations under our debt and could divert our cash flow from operations to debt payments.
As of December 31, 2020, we had $304.1 million in total borrowings under our credit agreement, dated July 15, 2017 (“Credit Agreement”) and no borrowings under our loan agreement, dated July 6, 2017 (“Loan Agreement”), which was paid off during the year and subsequently terminated. As of December 31, 2020, we had a $20.0 million revolving credit facility under our Credit Agreement under which we had $19.9 million of availability after giving effect to outstanding letters of credit. In addition, subject to restrictions governing our Credit Agreement, we may incur additional debt.
Our debt could have important consequences to you, including the following:
| ● | it may be difficult for us to satisfy our obligations, including debt service requirements under our outstanding debt, resulting in possible defaults on and acceleration of such indebtedness; |
| ● | our ability to obtain additional financing for working capital, capital expenditures, debt service requirements or other general corporate purposes may be impaired; |
| ● | a portion of cash flow from operations may be dedicated to the payment of principal and interest on our debt, therefore reducing our ability to use our cash flow to fund our operations, capital expenditures, future business opportunities, acquisitions and other purposes; |
| ● | we may be more vulnerable to economic downturns and adverse industry conditions and our flexibility to plan for, or react to, changes in our business or industry may be more limited; |
| ● | our ability to capitalize on business opportunities and to react to competitive pressures, as compared to our competitors, may be compromised due to our level of debt; and |
| ● | our ability to borrow additional funds or to refinance debt may be limited. |
Furthermore, all of our debt under our Credit Agreement bears interest at variable rates. If these rates were to increase significantly, whether because of an increase in market interest rates or a decrease in our creditworthiness, our ability to borrow additional funds may be reduced and the risks related to our debt would intensify.
Servicing our debt requires a significant amount of cash. For the years ended December 31, 2020 and December 31, 2019, we used operating cash of $48.7 million and $34.6 million, respectively, to service our debt. On December 28, 2020, we used $83.0 million of proceeds to pay off our indebtedness on the Loan Agreement. Our ability to generate sufficient cash depends on numerous factors beyond our control, and we may be unable to generate sufficient cash flow to service our debt obligations.
39
Our business may not generate sufficient cash flow from operating activities to service our debt obligations. Our ability to make payments on and to refinance our debt and to fund planned capital expenditures depends on our ability to generate cash in the future. To some extent, this is subject to general economic, financial, competitive, legislative, regulatory and other factors that are beyond our control.
If we are unable to generate sufficient cash flow from operations to service our debt and meet our other commitments, we may need to refinance all or a portion of our debt, sell material assets or operations, delay capital expenditures or raise additional debt or equity capital. We may not be able to effect any of these actions on a timely basis, on commercially reasonable terms or at all, and these actions may not be sufficient to meet our capital requirements. In addition, the terms of our existing or future debt agreements may restrict us from pursuing any of these alternatives.
Restrictive covenants governing our Credit Agreement may restrict our ability to pursue our business strategies, and failure to comply with any of these restrictions could result in acceleration of our debt.
The operating and financial restrictions and covenants governing our Credit Agreement may materially adversely affect our ability to finance future operations or capital needs or to engage in other business activities. Such agreements limit our ability, among other things, to:
| ● | incur additional indebtedness and guarantee indebtedness; |
| ● | pay dividends on or make distributions in respect of our common stock or make other restricted payments; |
| ● | make certain acquisitions, investments, loans and advances; |
| ● | transfer or sell certain assets; |
| ● | create liens on certain assets; |
| ● | consolidate, merge, sell or otherwise dispose of all or substantially all of our assets; |
| ● | make certain payments in respect of certain junior debt obligations; |
| ● | create negative pledges; |
| ● | enter into certain transactions with our affiliates; and |
| ● | designate our subsidiaries as unrestricted subsidiaries. |
In addition, the restrictive covenants in our Credit Agreement require us to maintain a specified first lien leverage ratio when a certain percentage of our revolving credit facility commitments are borrowed and outstanding as of the end of each fiscal quarter. In certain circumstances, our ability to meet this financial covenant may be affected by events beyond our control.
A breach of any of these covenants could result in a default under our Credit Agreement. Upon the occurrence of an event of default under our Credit Agreement, the lenders could elect to declare all amounts outstanding under our Credit Agreement to be immediately due and payable and terminate any commitments to extend further credit. If we were unable to repay those amounts, the lenders under our Credit Agreement could proceed against the collateral granted to them to secure that indebtedness. We have pledged substantially all of our assets as collateral to secure our Credit Agreement. In the event of an acceleration of our debt upon a default, we may not have or be able to obtain sufficient funds to make any accelerated payments.
40
Furthermore, the terms of any future indebtedness we may incur could have further additional restrictive covenants. We may not be able to maintain compliance with these covenants in the future, and in the event that we are not able to maintain compliance, we cannot assure you that we will be able to obtain waivers from the lenders or amend the covenants.
We and our subsidiaries may still be able to incur substantially more debt. This could further exacerbate the risks associated with our leverage.
We and our subsidiaries may be able to incur substantial additional debt in the future. Although the agreements governing our Credit Agreement contain restrictions on the incurrence of additional debt, these restrictions are subject to a number of qualifications and exceptions, and the debt incurred in compliance with these restrictions could be substantial. Additionally, we may successfully obtain waivers of these restrictions. If we incur additional debt above the levels currently in effect, the risks associated with our leverage, including those described above, would increase. Our Credit Agreement includes a revolving credit facility in an aggregate principal amount of $20.0 million, with a sub-commitment for issuance of letters of credit of $10.0 million, under which we had $19.9 million of availability as of December 31, 2020, after giving effect to outstanding letters of credit.
Risks Related to our Financial Statements and Results
Impairment of goodwill or other intangible assets may adversely impact future results of operations.
We have intangible assets, including goodwill and other finite-lived and indefinite-lived intangibles, on our balance sheet due to our acquisitions of businesses. The initial identification and valuation of these intangible assets and the determination of the estimated useful lives at the time of acquisition involve use of management judgments and estimates. These estimates are based on, among other factors, input from accredited valuation consultants, reviews of projected future income cash flows and statutory regulations. The use of alternative estimates and assumptions might have increased or decreased the estimated fair value of our goodwill and other intangible assets that could potentially result in a different impact to our results of operations. If the future growth and operating results of our business are not as strong as anticipated and/or our market capitalization declines, this could impact the assumptions used in calculating the fair value of goodwill or other indefinite-lived intangibles. To the extent goodwill or other indefinite-lived intangibles are impaired, their carrying value will be written down to its implied fair value and a charge will be made to our income from continuing operations. Such an impairment charge could materially and adversely affect our operating results. As of December 31, 2020 and 2019, the carrying amount of goodwill and other intangibles was $915.0 million and $943.0 million, respectively, on our consolidated balance sheets.
Our ability to use our NOLs and R&D tax credit carryforwards to offset future taxable income may be subject to certain limitations.
As of December 31, 2020, we had federal and state NOLs of approximately $3.3 million and $3.0 million, respectively, which are available to reduce future taxable income and expire between 2024 and 2036 and 2029 and 2038, respectively. As of December 31, 2020, we had federal and state R&D tax credit carryforwards of approximately $2.3 million and $0.6 million, respectively, to offset future income taxes, which expire between 2024 and 2040. We also had foreign tax credits of approximately $12.5 million, which will start to expire in 2025. These carryforwards that may be utilized in a future period may be subject to limitations based upon changes in the ownership of our stock in a future period. Additionally, we carried forward foreign NOLs of approximately $16.1 million which will start to expire in 2022, foreign research and development credits of $2.5 million which expire between 2029 and 2030, and Canadian investment tax credits of approximately $2.7 million which expire between 2030 and 2039. Our carryforwards are subject to review and possible adjustment by the appropriate taxing authorities.
In addition, in general, under Section 382 of the Internal Revenue Code of 1986, as amended (the “Code”), and corresponding provisions of state law, a corporation that undergoes an “ownership change,” generally defined as a greater than 50 percentage point change (by value) in its equity ownership by certain stockholders over a three year period, is subject to limitations on its ability to utilize its pre-change NOLs, R&D tax credit carryforwards and disallowed interest expense carryforwards to offset future taxable income. We have performed an analysis through
41
August 15, 2017 and determined that an ownership change as of that date occurred. Additionally, we have performed an analysis for the period August 15, 2017 through December 31, 2020 and determined that an ownership change did not occur during this period. We may experience further ownership changes in the future and/or subsequent changes in our stock ownership (which may be outside our control). As a result, if, and to the extent that, we earn net taxable income, our ability to use our pre-change NOLs, R&D tax credit carryforwards and disallowed interest expense carryforwards to offset such taxable income may be subject to limitations.
If our estimates or judgments relating to our critical accounting policies prove to be incorrect or financial reporting standards or interpretations change, our results of operations could be adversely affected.
The preparation of financial statements in conformity with U.S. generally accepted accounting principles (“GAAP”) requires management to make estimates and assumptions that affect the amounts reported in the consolidated financial statements and accompanying notes. We base our estimates on historical experience, known trends and events, and various other factors that we believe to be reasonable under the circumstances, as provided in “Management’s Discussion and Analysis of Financial Condition and Results of Operations — Critical Accounting Policies and Significant Judgments and Estimates.” The results of these estimates form the basis for making judgments about the carrying values of assets and liabilities that are not readily apparent from other sources. Significant assumptions and estimates used in preparing our consolidated financial statements include the estimated variable consideration included in the transaction price in our contracts with customers and equity-based compensation. Our results of operations may be adversely affected if our assumptions change or if actual circumstances differ from those in our assumptions, which could cause our results of operations to fall below the expectations of securities analysts and investors, resulting in a decline in the trading price of our common stock.
Additionally, we regularly monitor our compliance with applicable financial reporting standards and review new pronouncements and drafts thereof that are relevant to us. As a result of new standards, changes to existing standards and changes in their interpretation, we might be required to change our accounting policies, alter our operational policies, and implement new or enhance existing systems so that they reflect new or amended financial reporting standards, or we may be required to restate our published financial statements. Such changes to existing standards or changes in their interpretation may have an adverse effect on our reputation, business, financial position, and profit.
Risks Related to Ownership of Our Common Stock
We are an “emerging growth company” and the reduced disclosure requirements applicable to emerging growth companies may make our common stock less attractive to investors.
We are an “emerging growth company,” as defined in the U.S. Jumpstart Our Business Startups Act of 2012 (“JOBS Act”). For so long as we remain an emerging growth company, we are permitted by SEC rules and plan to rely on exemptions from certain disclosure requirements that are applicable to other SEC-registered public companies that are not emerging growth companies. These exemptions include not being required to comply with the auditor attestation requirements of Section 404 of the U.S. Sarbanes-Oxley Act of 2002, as amended (“SOX”), not being required to comply with any requirement that may be adopted by the Public Company Accounting Oversight Board regarding mandatory audit firm rotation or a supplement to the auditor’s report providing additional information about the audit and the financial statements, reduced disclosure obligations regarding executive compensation and exemptions from the requirements of holding a nonbinding advisory vote on executive compensation and stockholder approval of any golden parachute payments not previously approved. As a result, the information we provide stockholders will be different than the information that is available with respect to other public companies. In this filing, we have not included all of the executive compensation related information that would be required if we were not an emerging growth company. We cannot predict whether investors will find our common stock less attractive if we rely on these exemptions.
If some investors find our common stock less attractive as a result, there may be a less active trading market for our common stock and our stock price may be more volatile.
42
In addition, the JOBS Act provides that an emerging growth company can take advantage of an extended transition period for complying with new or revised accounting standards. This allows an emerging growth company to delay the adoption of certain accounting standards until those standards would otherwise apply to private companies. We have elected to avail ourselves of this exemption from new or revised accounting standards and, therefore, we will not be subject to the same new or revised accounting standards as other public companies that are not emerging growth companies. As a result, our financial statements may not be comparable to companies that comply with new or revised accounting pronouncements as of public company effective dates.
We are a holding company with no operations and rely on our operating subsidiaries to provide us with funds necessary to meet our financial obligations.
We are a holding company with no material direct operations. Our principal assets are the shares of common stock of Certara Holdco, Inc. (“Certara Holdco”) that we hold indirectly through our subsidiaries. Certara Holdco, together with its subsidiaries, owns substantially all of our operating assets. As a result, we are dependent on loans, dividends and other payments from our subsidiaries to generate the funds necessary to meet our financial obligations. Our subsidiaries are legally distinct from us and may be prohibited or restricted from paying dividends or otherwise making funds available to us, including restrictions under the covenants of the agreements governing our Credit Agreement. If we are unable to obtain funds from our subsidiaries, we may be unable to meet our financial obligations.
Future sales, or the perception of future sales, by us or our existing stockholders in the public market could cause the market price for our common stock to decline.
The sale of additional shares of our common stock in the public market, or the perception that such sales could occur, could harm the prevailing market price of shares of our common stock. These sales, or the possibility that these sales may occur, also might make it more difficult for us to sell equity securities in the future at a time and at a price that we deem appropriate.
Shares held by our affiliates, as that term is defined under Rule 144 of the Securities Act (“Rule 144”), including our directors, executive officers and other affiliates (including EQT and Arsenal Capital Partners and its affiliates (“Arsenal”), are “restricted securities” within the meaning of Rule 144 and subject to certain restrictions on resale. Restricted securities may be sold in the public market only if they are registered under the Securities Act or are sold pursuant to an exemption from registration such as Rule 144.
Shares covered by registration rights represent approximately 64.9% of our outstanding common stock as of December 31, 2020. Registration of any of these outstanding shares of common stock would result in such shares becoming freely tradable without compliance with Rule 144 upon effectiveness of the registration statement.
As restrictions on resale end or if these stockholders exercise their registration rights, the market price of our shares of common stock could drop significantly if the holders of these shares sell them or are perceived by the market as intending to sell them. These factors could also make it more difficult for us to raise additional funds through future offerings of our shares of common stock or other securities.
In addition, the shares of our common stock reserved for future issuance under the 2020 Incentive Plan or our 2020 Employee Stock Purchase Plan will become eligible for sale in the public market once those shares are issued, subject to provisions relating to various vesting agreements, lock-up agreements and Rule 144, as applicable. A total of 20,000,000 and 1,700,000 shares of common stock have been reserved for future issuance under the 2020 Incentive Plan and our 2020 Employee Stock Purchase Plan, respectively.
In the future, we may also issue our securities in connection with investments or acquisitions. The amount of shares of our common stock issued in connection with an investment or acquisition could constitute a material portion of our then-outstanding shares of our common stock. Any issuance of additional securities in connection with investments or acquisitions may result in additional dilution to you.
43
Provisions in our organizational documents could delay or prevent a change of control.
Certain provisions of our amended and restated certificate of incorporation, amended and restated bylaws and stockholders agreement may have the effect of delaying or preventing a merger, acquisition, tender offer, takeover attempt or other change of control transaction that a stockholder might consider to be in its best interest, including attempts that might result in a premium over the market price of our common stock.
These provisions provide for, among other things:
| ● | the division of our board of directors into three classes, as nearly equal in size as possible, with directors in each class serving three-year terms and with terms of the directors of only one class expiring in any given year; |
| ● | that at any time when EQT and certain of its affiliates beneficially own, in the aggregate, less than 40% in voting power of the stock of our company entitled to vote generally in the election of directors, directors may only be removed for cause, and only by the affirmative vote of the holders of at least two-thirds in voting power of all the then-outstanding shares of stock entitled to vote thereon, voting together as a single class; |
| ● | the ability of our board of directors to issue one or more series of preferred stock with voting or other rights or preferences that could have the effect of impeding the success of an attempt to acquire us or otherwise effect a change of control; |
| ● | advance notice for nominations of directors by stockholders and for stockholders to include matters to be considered at stockholder meetings; |
| ● | that special stockholder meetings may be called only by or at the direction of our board of directors or the chairman of our board of directors; provided, however, that at any time when EQT and certain of its affiliates beneficially own, in the aggregate, at least 40% in voting power of our stock entitled to vote generally in the election of directors, EQT may request a special stockholder meeting be held, which provision may have the effect of deferring, delaying or discouraging hostile takeovers, or changes in control or management of our Company; and |
| ● | that certain provisions of our amended and restated certificate of incorporation and amended and restated bylaws pertaining to amendments, our board of directors, limitation of director liability, stockholder consents, annual and special stockholder meetings, competition and corporate opportunities and business combinations, may be amended only by the affirmative vote of the holders of at least two-thirds in voting power of all the then-outstanding shares of our stock entitled to vote thereon, voting together as a single class, if EQT and certain of its affiliates beneficially own, in the aggregate, less than 40% in voting power of our stock entitled to vote generally in the election of directors, which limitation may have the effect of deferring, delaying or discouraging hostile takeovers, or changes in control or management of our Company. |
These provisions could make it more difficult for a third party to acquire us, even if the third party’s offer may be considered beneficial by many of our stockholders. As a result, our stockholders may be limited in their ability to obtain a premium for their shares.
EQT holds a substantial amount of our outstanding common stock, and its interests may be different than the interests of other holders of our common stock.
As of December 31, 2020, EQT owns approximately 49.0% of our outstanding common stock, and has the ability to nominate a majority of the members of our board of directors. As a result, EQT is able to control actions to be taken by us, including future issuances of our common stock or other securities, the payment of dividends, if any, on our common stock, amendments to our organizational documents and the approval of significant corporate transactions, including mergers, sales of substantially all of our assets, distributions of our assets, the incurrence of indebtedness and any incurrence of liens on our assets.
44
The interests of EQT may be materially different than the interests of our other stakeholders. In addition, EQT may have an interest in pursuing acquisitions, divestitures and other transactions that, in their judgment, could enhance their investment, even though such transactions might involve risks to you. For example, EQT may cause us to take actions or pursue strategies that could impact our ability to make payments under our Credit Facilities or cause a change of control. In addition, to the extent permitted by agreements governing our Credit Facilities, EQT may cause us to pay dividends rather than make capital expenditures or repay debt. EQT is in the business of making investments in companies and may from time to time acquire and hold interests in businesses that compete directly or indirectly with us. Our amended and restated certificate of incorporation will provide that none of EQT, any of their respective affiliates or any director who is not employed by us (including any non-employee director who serves as one of our officers in both his director and officer capacities) or his or her affiliates will have any duty to refrain from engaging, directly or indirectly, in the same business activities or similar business activities or lines of business in which we operate. EQT also may pursue acquisition opportunities that may be complementary to our business, and, as a result, those acquisition opportunities may not be available to us.
So long as EQT continues to own a significant amount of our outstanding common stock, even though such amount is less than 50%, they will be able to strongly influence or effectively control our decisions and, so long as EQT continues to own shares of our outstanding common stock, EQT will have the ability to nominate individuals to our board of directors. In addition, EQT will be able to determine the outcome of all matters requiring stockholder approval and will be able to cause or prevent a change of control of our company or a change in the composition of our board of directors and could preclude any unsolicited acquisition of our company. The concentration of ownership could deprive you of an opportunity to receive a premium for your shares of common stock as part of a sale of our company and ultimately might affect the market price of our common stock.
Our amended and restated certificate of incorporation provides, subject to limited exceptions, that the Court of Chancery of the State of Delaware and, to the extent enforceable, the federal district courts of the United States of America will be the sole and exclusive forums for certain stockholder litigation matters, which could limit our stockholder’s ability to obtain a favorable judicial forum for disputes with us or our current and former directors, officers, employees or stockholders.
Our amended and restated certificate of incorporation provides, subject to limited exceptions, that unless we consent in writing to the selection of an alternative forum, the Court of Chancery of the State of Delaware shall, to the fullest extent permitted by law, be the sole and exclusive forum for any (i) derivative action or proceeding brought on behalf of our company, (ii) action asserting a claim of breach of a fiduciary duty owed by any current or former director, officer, employee or stockholder of our company to the Company or our stockholders, (iii) action asserting a claim against the Company or any current or former director, officer, employee or stockholder of the Company arising pursuant to any provision of the Delaware General Corporation Law (“DGCL”), or our amended and restated certificate of incorporation or our amended and restated bylaws (as either might be amended from time to time) or (iv) action asserting a claim governed by the internal affairs doctrine of the State of Delaware. Unless we consent in writing to the selection of an alternative forum, the federal district courts of the United States of America shall be the exclusive forum for the resolution of any complaint asserting a cause of action arising under the federal securities laws of the United States of America. Any person or entity purchasing or otherwise acquiring any interest in shares of our capital stock shall be deemed to have notice of and consented to the forum provisions in our amended and restated certificate of incorporation. Although our amended and restated certificate of incorporation contains the exclusive forum provision described above, it is possible that a court could find that such a provision is inapplicable for a particular claim or action or that such provision is unenforceable.
These choice of forum provisions may limit a stockholder’s ability to bring a claim in a different judicial forum, including one that it may find favorable or convenient for disputes with us or any of our directors, officers or other employees which may discourage lawsuits with respect to such claims. Alternatively, if a court were to find the choice of forum provisions that will be contained in our amended and restated certificate of incorporation to be inapplicable or unenforceable with respect to one or more of the specified types of actions or proceedings, we may incur additional costs associated with resolving such action in other jurisdictions, which could harm our business, operating results and financial condition.
45
Our board of directors are authorized to issue and designate shares of our preferred stock in additional series without stockholder approval.
Our amended and restated certificate of incorporation authorizes our board of directors, without the approval of our stockholders, to issue 50,000,000 shares of our preferred stock, subject to limitations prescribed by applicable law, rules and regulations and the provisions of our amended and restated certificate of incorporation, as shares of preferred stock in series, to establish from time to time the number of shares to be included in each such series and to fix the designation, powers, preferences and rights of the shares of each such series and the qualifications, limitations or restrictions thereof. The powers, preferences and rights of these additional series of preferred stock may be senior to or on parity with our common stock, which may reduce its value.
General Risk Factors
Our stock price may change significantly, and you may not be able to resell shares of our common stock at or above the price you paid or at all, and you could lose all or part of your investment as a result.
The trading price of our common stock is likely to be volatile. The stock market has experienced extreme volatility. This volatility often has been unrelated or disproportionate to the operating performance of particular companies. You may not be able to resell your shares at or above the initial price you paid due to a number of factors such as those listed in other portions of this “Risk Factors” section and the following:
| ● | results of operations that vary from the expectations of securities analysts and investors; |
| ● | results of operations that vary from those of our competitors; |
| ● | changes in expectations as to our future financial performance, including financial estimates and investment recommendations by securities analysts and investors; |
| ● | declines in the market prices of stocks generally; |
| ● | strategic actions by us or our competitors; |
| ● | announcements by us or our competitors of significant contracts, new products, acquisitions, joint marketing relationships, joint ventures, other strategic relationships or capital commitments; |
| ● | changes in general economic or market conditions or trends in our industry or markets; |
| ● | changes in business or regulatory conditions; |
| ● | additions or departures of key management personnel; |
| ● | future sales of our common stock or other securities by us or our existing stockholders, or the perception of such future sales; |
| ● | investor perceptions of the investment opportunity associated with our common stock relative to other investment alternatives; |
| ● | the public’s response to press releases or other public announcements by us or third parties, including our filings with the SEC; |
| ● | announcements relating to litigation; |
46
| ● | guidance, if any, that we provide to the public, any changes in this guidance or our failure to meet this guidance; |
| ● | the development and sustainability of an active trading market for our stock; |
| ● | changes in accounting principles; and |
| ● | other events or factors, including those resulting from natural disasters, war, acts of terrorism or responses to these events. |
These broad market and industry fluctuations may materially adversely affect the market price of our common stock, regardless of our actual operating performance. In addition, price volatility may be greater if the public float and trading volume of our common stock are low.
In the past, following periods of market volatility, stockholders have instituted securities class action litigation. If we were involved in securities litigation, it could have a substantial cost and divert resources and the attention of executive management from our business regardless of the outcome of such litigation.
Our quarterly operating results fluctuate and may fall short of prior periods, our projections or the expectations of securities analysts or investors, which could materially adversely affect our stock price.
Our operating results have fluctuated from quarter to quarter at points in the past, and they may do so in the future. Therefore, results of any one fiscal quarter are not a reliable indication of results to be expected for any other fiscal quarter or for any year. If we fail to increase our results over prior periods, to achieve our projected results or to meet the expectations of securities analysts or investors, our stock price may decline, and the decrease in the stock price may be disproportionate to the shortfall in our financial performance. Results may be affected by various factors, including those described in these risk factors.
If securities analysts do not publish research or reports about our business or if they downgrade our stock or our sector, our stock price and trading volume could decline.
The trading market for our common stock will rely in part on the research and reports that industry or financial analysts publish about us or our business or industry. We do not control these analysts. Furthermore, if one or more of the analysts who do cover us were to downgrade our stock or our industry, or the stock of any of our competitors, or publish inaccurate or unfavorable research about our business or industry, the price of our stock could decline. If one or more of these analysts ceases coverage of us or fails to publish reports on us regularly, we could lose visibility in the market, which in turn could cause our stock price or trading volume to decline.
Failure to comply with requirements to design, implement and maintain effective internal controls could have a material adverse effect on our business and stock price.
As a public company, we have significant requirements for enhanced financial reporting and internal controls. The process of designing and implementing effective internal controls is a continuous effort that requires us to anticipate and react to changes in our business and the economic and regulatory environments and to expend significant resources to maintain a system of internal controls that is adequate to satisfy our reporting obligations as a public company. If we are unable to establish or maintain appropriate internal financial reporting controls and procedures, it could cause us to fail to meet our reporting obligations on a timely basis, result in material misstatements in our consolidated financial statements and harm our results of operations. In addition, we will be required, pursuant to Section 404, to furnish a report by management on, among other things, the effectiveness of our internal control over financial reporting in our next annual report. This assessment will need to include disclosure of any material weaknesses identified by our management in our internal control over financial reporting. The rules governing the standards that must be met for our management to assess our internal control over financial reporting are complex and require significant documentation, testing and possible remediation. Testing internal controls may divert our management’s attention from other matters that are important to our business. Our independent registered public accounting firm may be required to issue an
47
attestation report on effectiveness of our internal controls. However, while we remain an emerging growth company, we will not be required to include an attestation report on internal control over financial reporting issued by our independent registered public accounting firm.
In connection with the implementation of the necessary procedures and practices related to internal control over financial reporting, we may identify deficiencies that we may not be able to remediate in time to meet the deadline imposed by the SOX for compliance with the requirements of Section 404. In addition, we may encounter problems or delays in completing the remediation of any deficiencies identified by our independent registered public accounting firm in connection with the issuance of their attestation report.
Our testing, or the subsequent testing by our independent registered public accounting firm, may reveal deficiencies in our internal controls over financial reporting that are deemed to be material weaknesses. A material weakness in internal controls could result in our failure to detect a material misstatement of our annual or quarterly consolidated financial statements or disclosures. We may not be able to conclude on an ongoing basis that we have effective internal controls over financial reporting in accordance with Section 404. If we are unable to conclude that we have effective internal controls over financial reporting, investors could lose confidence in our reported financial information, which could have a material adverse effect on the trading price of our common stock.
We incur substantial costs as a result of operating as a publicly traded company, and our management is required to devote substantial time to compliance initiatives.
As a publicly traded company, and particularly after we are no longer an emerging growth company, we will incur additional legal, accounting, and other expenses that we did not previously incur. Although we are currently unable to estimate these costs with any degree of certainty, they may be material in amount. In addition, the SOX, the Dodd-Frank Wall Street Reform and Consumer Protection Act, and the rules of the SEC, and the stock exchange on which our common shares are listed, have imposed various requirements on public companies. Our management and other personnel need to devote a substantial amount of time to these compliance initiatives as well as investor relations. Moreover, these rules and regulations increase our legal and financial compliance costs and make some activities more time-consuming and costly.
Changes in accounting standards issued by the Financial Accounting Standards Board (the “FASB”), or other standard-setting bodies may adversely affect trends and comparability of our financial results.
We are required to prepare our financial statements in accordance with GAAP, which is periodically revised and/or expanded. From time to time, we are required to adopt new or revised accounting standards issued by recognized authoritative bodies, including the FASB and the SEC. It is possible that future accounting standards we are required to adopt may require additional changes to the current accounting treatment that we apply to our financial statements and may result in significant changes to our results, disclosures and supporting reporting systems. Such changes could result in a material adverse impact on our results of operations and financial condition.
Item 1B. Unresolved Staff Comments.
None.
As of December 31, 2020, we had 45 offices in 14 countries, with our headquarters located in Princeton, New Jersey. We lease or sublease all of our offices. None of our facilities are used for anything other than general office use. We believe that our facilities are adequate for our operations and that suitable additional space will be available when needed. Because of the COVID-19 pandemic, in March 2020, we temporarily closed all of our offices. As of December 31, 2020, the majority of our offices remained closed, and we have instituted a protocol for assessing the need to re-open any facilities and determining what safety measures are required or recommended by local health authorities to re-open such facilities. For the few offices that we have re-opened, we maintain the required safety measures, and strictly limit the number of employees who may be in an office at any time. We believe our employees have been able to maintain
48
the same level of productivity in a remote working environment as they did prior to the pandemic. We expect that most of our offices will re-open in some capacity once the current pandemic has abated.
As of December 31, 2020, our material operating locations, which we define as the facilities we lease with more than 10,000 square feet, were as follows:
| | APPROXIMATE | | LEASE EXPIRATION |
LOCATION |
| SQUARE FOOTAGE |
| DATES |
Wilmington, Delaware, USA | | 18,250 | | 2/28/2027 |
Princeton, New Jersey, USA |
| 17,560 |
| 6/30/2025 |
Makati, Philippines |
| 16,710 |
| 10/31/2022 |
Sheffield, UK |
| 13,910 |
| 1/28/2028 |
Raleigh, North Carolina, USA |
| 11,560 |
| 2/28/2022 |
From time to time, we may become involved in legal proceedings arising in the ordinary course of our business. Management believes that we do not have any pending or threatened litigation which, individually or in the aggregate, would have a material adverse effect on our business, results of operations, financial condition and/or cash flows.
Item 4. Mine Safety Disclosures.
Not applicable.
49
Item 5. Market for Registrant’s Common Equity, Related Stockholder Matters and Issuer Purchases of Equity Securities.
Market Information
Our common stock has been listed on The Nasdaq Global Select Market (the “Nasdaq”) under the symbol “CERT” since December 11, 2020. Prior to that date, there was no public trading market for our common stock.
As of March 4, 2021, there were 87 holders of record of our common stock as reported by our transfer agent. Holders of record are defined as those stockholders whose shares are registered in their names in our stock records and do not include beneficial owners of common stock whose shares are held in the names of brokers, dealers, and clearing agencies.
Dividend Policy
We currently do not expect to declare any dividends on our common stock in the foreseeable future. Instead, we anticipate that all of our earnings in the foreseeable future will be used to provide working capital, to support our operations, to finance the growth and development of our business and to reduce our net debt. Any determination to declare dividends in the future will be at the discretion of our board of directors, subject to applicable laws, and will be dependent on a number of factors, including our earnings, capital requirements and overall financial condition. In addition, because we are a holding company, our ability to pay dividends on our common stock may be limited by restrictions on our ability to obtain sufficient funds through dividends from subsidiaries, including restrictions under our Credit Agreement, and may be further restricted by the terms of any future debt or preferred securities.
Stock Performance Graph
This performance graph shall not be deemed “soliciting material” or to be “filed” with the Securities and Exchange Commission, or the SEC, for purposes of Section 18 of the Securities Exchange Act of 1934, as amended, or the Exchange Act, or otherwise subject to the liabilities under that Section, and shall not be deemed to be incorporated by reference into any of our filings under the Securities Act of 1933, as amended, or the Securities Act.
The following graph compares (i) the cumulative total stockholder return on our common stock from December 11, 2020 (the date our common stock commenced trading on NASDAQ) through December 31, 2020 with (ii) the cumulative total return of the NASDAQ Index and the NASDAQ-100 Technology Sector Index over the same period, assuming the investment of $100 in our common stock and in each index on December 11, 2020 and the reinvestment of dividends. The graph uses the closing market price on December 11, 2020 of $38.08 per share as the initial value of our common
50
stock. As discussed above, we have never declared or paid a cash dividend on our common stock and do not anticipate declaring or paying a cash dividend in the foreseeable future.
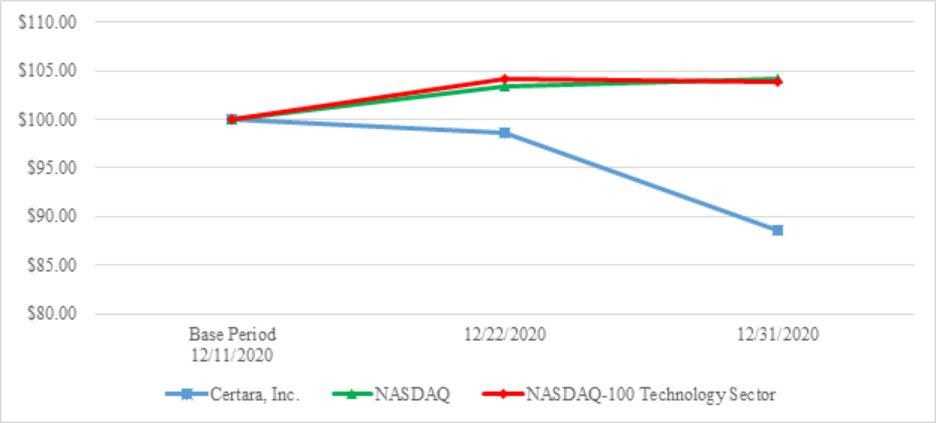
Recent Sales of Unregistered Securities
Prior to the completion of our initial public offering (“IPO”) on December 15, 2020, all of our outstanding common stock was held by EQT. On December 10, 2020, in connection with our IPO, we issued 5,941,693 shares of unvested restricted common stock to holders of unvested Class B Profits Interest Units (the “Class B Units”) in EQT in exchange for such unvested Class B Units. All recipients of such restricted common stock are our directors or employees. The exchange ratio was based on the terms of the Class B Unit award agreements and our IPO price of $23.00 per share.
These issuance of restricted stock were deemed to be exempt from registration under the Securities Act in reliance upon Section 4(a)(2) of the Securities Act or Regulation D promulgated thereunder, or Rule 701 promulgated under Section 3(b) of the Securities Act, as transactions by an issuer not involving any public offering or pursuant to benefit plans and contracts relating to compensation as provided under Rule 701. None of the foregoing transactions involved any underwriters, underwriting discounts or commissions or any public offering.
Issuer Purchases of Equity Securities
None.
Use of Proceeds from Initial Public Offering
On December 15, 2020, we completed our IPO in which we sold 14,630,000 shares of our common stock and certain selling stockholders sold 18,783,250 shares of our common stock (representing the full exercise of the underwriters’ option to purchase additional shares) at a public offering price of $23.00 per share. The offer and sale of the shares in the IPO were registered under the Securities Act pursuant to a registration statement on Form S-1 (File No. 333-250182), which was declared effective by the SEC on December 10, 2020. We received net proceeds of $316.3 million after deducting underwriting discounts and commissions in respect of the IPO closing. We did not receive any proceeds from the sale of shares by the selling stockholders. We incurred offering costs (in addition to underwriting discounts and commissions) for our IPO payable by us of $4.4 million, net of the tax effect of $0.3 million.
We utilized a portion of the net proceeds of the IPO to repay an aggregate of $80.0 million in principal amount of our outstanding indebtedness under the Loan Agreement and accrued interest of $3.0 million. We used the remainder of the net proceeds from the IPO for general corporate purposes, including the payment of offering costs related to the IPO.
51
Jefferies LLC and Morgan Stanley & Co. LLC acted as representatives of the underwriters for our IPO.
No payments were made by us to directors, officers or persons owning ten percent or more of our common stock or to their associates, or to our affiliates, other than payments in the ordinary course of business to officers for salaries and to non-employee directors pursuant to our director compensation policy.
Item 6. Selected Financial Data.
Not required.
Item 7. Management’s Discussion and Analysis of Financial Condition and Results of Operations.
You should read the following discussion of our financial condition and results of operations in conjunction with our audited consolidated financial statements and the related notes and other financial information included elsewhere in this Annual Report and our audited consolidated financial statements and notes thereto.
As discussed in the section titled “Special Note Regarding Forward Looking Statements,” the following discussion and analysis, in addition to historical financial information, contains forward-looking statements that involve risks and uncertainties. Our actual results could differ materially from those anticipated in these forward-looking statements as a result of various factors, including those set forth in the section titled “Risk Factors” under Part I, Item 1A above.
We operate on a fiscal year that ends on December 31.
Executive Overview
We accelerate medicines to patients using biosimulation software and technology to transform traditional drug discovery and development. Biosimulation is a powerful technology used to conduct virtual trials using virtual patients to predict how drugs behave in different individuals. Biopharmaceutical companies use our proprietary biosimulation software throughout drug discovery and development to inform critical decisions that not only save significant time and money but also advance drug safety and efficacy, improving millions of lives each year.
As a global leader in biosimulation based on 2020 revenue, we provide an integrated, end-to-end platform used by more than 1,650 biopharmaceutical companies and academic institutions across 61 countries, including all of the top 35 biopharmaceutical companies by R&D spend in 2020. Since 2014, customers who use our biosimulation software and technology-enabled services have received over 90% of all new drug approvals by the FDA. Moreover, 17 global regulatory authorities license our biosimulation software to independently analyze, verify, and review regulatory submissions, including the FDA, Europe’s EMA, Health Canada, Japan’s PMDA, and China’s NMPA. Demand for our offerings continues to expand rapidly.
We build our biosimulation technology on first principles of biology, chemistry, and pharmacology with proprietary mathematical algorithms that model how medicines and diseases behave in the body. For over two decades, we have honed and validated our biosimulation technology with an abundance of data from scientific literature, lab research, and preclinical and clinical studies. In turn, our customers use biosimulation to conduct virtual trials to answer critical questions, such as: What will be the human response to a drug based on preclinical data? How will other drugs interfere with this new drug? What is a safe and efficacious dose for children, the elderly, or patients with pre-existing conditions? Virtual trials may be used to optimize dosing on populations that are otherwise difficult to study for ethical or logistical reasons, such as infants, pregnant women, the elderly, and cancer patients.
Biosimulation results need to be incorporated into regulatory documents for compelling submissions. Accordingly, we provide regulatory science solutions and integrate them with biosimulation so that our customers can navigate the complex and evolving regulatory landscape and maximize their chances of approval. Our differentiated regulatory services are powered by submissions management software and natural language processing for scalability and speed, allowing us to deliver more than 200 regulatory submissions over the past four years. Our team of more than 200 regulatory professionals has extensive experience applying industry guidelines and global regulatory requirements.
52
The final hurdle to delivering medicines to patients is market access, defined as strategies, processes, and activities to ensure that therapies are available to patients at the right price. We believe that biosimulation and market access will continue to be increasingly intertwined as health systems and countries move toward outcomes-based pricing. We have recently expanded into technology-enabled market access solutions, which help our customers understand the real-world impact of therapies and dosing regimens earlier in the process and effectively communicate this to payors and health authorities. Our solutions are underpinned by technologies such as Bayesian statistical software and SaaS-based value communication tools.
With continued innovation in and adoption of our biosimulation software and technology-enabled services, we believe more biopharmaceutical companies worldwide will leverage more of our end-to-end platform to reduce cost, accelerate speed to market, and ensure safety and efficacy of medicines for all patients.
On December 15, 2020, we completed our IPO, pursuant to which we issued and sold 14,630,000 shares of our common stock and certain selling stockholders sold 18,783,250 shares of our common stock (representing the full exercise of the underwriters’ option to purchase additional shares), at a public offering price of $23.00 per share. We received net proceeds of $316.3 million, after deducting underwriters’ discounts and commissions, but before offering costs. We incurred offering costs of $4.4 million, net of the tax effect of $0.3 million, which we recognized as a charge to additional paid-in capital.
In connection with the closing of our IPO, we repaid in full the $80.0 million outstanding principal amount and $3.0 million accrued interest on our Loan Agreement.
Key Factors Affecting Our Performance
We believe that the growth of and future success of our business depends on many factors. While each of these factors presents significant opportunities for our business, they also pose important challenges that we must successfully address to sustain our growth and improve results of operations.
Customer Retention and Expansion
Our future operating results depend, in part, on our ability to successfully enter new markets, increase our customer base, and retain and expand our relationships with existing customers. We monitor two key performance indicators to evaluate retention and expansion: new bookings and renewal rates.
| ● | Bookings: Our new bookings represent a signed contract or purchase order where there is sufficient or reasonable certainty about the customer’s ability and intent to fund and commence the software and/or services. Bookings vary from period to period depending on numerous factors, including the overall health of the biopharmaceutical industry, regulatory developments, industry consolidation, and sales performance. Bookings have varied and will continue to vary significantly from quarter to quarter and from year to year. See “Risk Factors — Risks Related to Our Business — Our bookings might not accurately predict our future revenue, and we might not realize all or any part of the anticipated revenue reflected in our backlog.” |
| ● | Renewal Rates: Our renewal rates measure the percentage of software customers who renew their licenses or subscriptions at the end of the license or subscription periods. The renewal rate is based on revenues and excludes the effect of price increases or expansions. |
The table below summarizes our quarterly bookings and renewal rate trends:
|
| 2018 |
| 2019 |
| 2020 |
| ||||||||||||||||||||||||
| | Q1 | | Q2 | | Q3 | | Q4 | | FULL YEAR | | Q1 | | Q2 | | Q3 | | Q4 | | FULL YEAR | | Q1 | | Q2 | | Q3 | | Q4 |
| FULL YEAR |
|
Bookings |
| 53.4 |
| 45.3 |
| 46.0 |
| 82.9 |
| 227.5 |
| 66.6 |
| 74.7 |
| 48.5 |
| 69.6 |
| 259.5 |
| 61.0 |
| 70.1 |
| 72.9 |
| 84.3 |
| 288.3 | |
Renewal Rate |
| 93 | % | 94 | % | 96 | % | 92 | % | 94 | % | 93 | % | 89 | %(1) | 95 | % | 95 | % | 93 | % | 92 | % | 96 | % | 84 | %(2) | 89 | % | 90 | % |
| (1) | Due to late renewals by several large biosimulation software customers. |
53
| (2) | Due to the completion of a large contract for a regulatory submission software. |
Investments in Growth
We have invested and intend to continue to invest in expanding the breadth and depth of our solutions, including through acquisitions and international expansion. We expect to continue to invest (i) in scientific talent to expand our ability to deliver solutions across the drug development spectrum; (ii) in sales and marketing to promote our solutions to new and existing customers and in existing and expanded geographies; (iii) in research and development to support existing solutions and innovate new technology; and (iv) in other operational and administrative functions to support our expected growth. We expect that our headcount will increase over time and also expect our total operating expenses will continue to increase over time, albeit, at a rate lower than revenue growth.
Our Operating Environment
The acceptance of model-informed biopharmaceutical discovery and development by regulatory authorities affects the demand for our products and services. Support for the use of biosimulation in discovery and development from regulatory bodies, such as the FDA and EMA, has been critical to its rapid adoption by the biopharmaceutical industry. There has been a steady increase in the recognition by regulatory and academic institutions of the role that modeling and simulation can play in the biopharmaceutical development and approval process, as demonstrated by new regulations and guidance documents describing and encouraging the use of modeling and simulation in the biopharmaceutical discovery, development, testing, and approval process, which has directly led to an increase in the demand for our services. Changes in government or regulatory policy, or a reversal in the trend toward increasing the acceptance of and reliance upon in silico data in the drug approval process, could decrease the demand for our products and services or lead regulatory authorities to cease use of, or to recommend against the use of, our products and services.
Governmental agencies throughout the world, but particularly in the United States where the majority of our customers are based, strictly regulate the biopharmaceutical development process. Our business involves helping biopharmaceutical companies strategically and tactically navigate the regulatory approval process. New or amended regulations are expected to result in higher regulatory standards and often additional revenues for companies that service these industries. However, some changes in regulations, such as a relaxation in regulatory requirements or the introduction of streamlined or expedited approval procedures, or an increase in regulatory requirements that we have difficulty satisfying or that make our regulatory strategy services less competitive, could eliminate or substantially reduce the demand for our regulatory services.
Competition
The market for our biosimulation products and related services for the biopharmaceutical industry is competitive and highly fragmented. In biosimulation software, we compete with other scientific software providers, technology companies, in-house development by biopharmaceutical companies, and certain open source solutions. In the technology-enabled services market, we compete with specialized companies, in-house teams at biopharmaceutical companies, and academic and government institutions. In some standard biosimulation services, and in regulatory and market access, we also compete with contract research organizations. Some of our competitors and potential competitors have longer operating histories in certain segments of our industry than we do and could have greater financial, technical, marketing, R&D, and other resources. Some of our competitors offer products and services directed at more specific markets than those we target, enabling these competitors to focus a greater proportion of their efforts and resources on those specific markets. Some competing products are developed and made available at lower cost by government organizations and academic institutions, and these entities may be able to devote substantial resources to product development. Some clinical research organizations or technology companies may decide to enter into or expand their offerings in the biosimulation area, whether through acquisition or internal development. We also face competition from open source software initiatives, in which developers provide software and intellectual property free of charge, such as R and PK-Sim software. In addition, some of our customers spend significant internal resources in order to develop their own solutions.
54
Impact of COVID-19
The continued spread of COVID-19 may adversely impact our business, financial condition or results of operations as a result of increased costs, negative impacts to our healthy workforce or a sustained economic downturn. The extent to which the COVID-19 pandemic may impact our business in the future is highly uncertain and cannot be predicted. In addition, a recession or a prolonged period of depressed economic activity related to COVID-19 and measures taken to mitigate its spread could have a material adverse effect on our business, financial condition and results of operations. As of December 31, 2020, there have been no material adverse impacts on the Company’s financial condition, results of operations or cash flows.
Non-GAAP Measures
Management uses various financial metrics, including total revenues, income from operations, net income, and certain metrics that are not required by, or presented in accordance with, GAAP, such as Adjusted EBITDA, Adjusted Net Income, and Adjusted Diluted Earnings Per Share, to measure and assess the performance of our business, to evaluate the effectiveness of our business strategies, to make budgeting decisions, to make certain compensation decisions, and to compare our performance against that of other peer companies using similar measures. We believe that presentation of the GAAP and the non-GAAP metrics in this filing will aid investors in understanding our business.
Management measures operating performance based on Adjusted EBITDA defined for a particular period as net income (loss) excluding interest expense, provision (benefit) for income taxes, depreciation and amortization expense, intangible asset amortization, equity-based compensation expense, acquisition and integration expense, and other items not indicative of our ongoing operating performance. Management also measures operating performance based on Adjusted Net Income defined for a particular period as net income (loss) excluding, equity-based compensation expense, acquisition and integration expense, and other items not indicative of our ongoing operating performance. Further, management measures operating performance based on Adjusted Diluted Earnings Per Share defined for a particular period as Adjusted Net Income divided by the weighted-average diluted common shares outstanding.
We believe Adjusted EBITDA, Adjusted Net Income, and Adjusted Diluted Earnings Per Share are helpful to investors, analysts, and other interested parties because they can assist in providing a more consistent and comparable overview of our operations across our historical periods. In addition, these measures are frequently used by analysts, investors, and other interested parties to evaluate and assess performance.
Adjusted EBITDA, Adjusted Net Income, and Adjusted Diluted Earnings Per Share are non-GAAP measures and are presented for supplemental purposes only and should not be considered as an alternative or substitute to financial information presented in accordance with GAAP. Adjusted EBITDA, Adjusted Net Income and Adjusted Diluted Earnings Per Share have certain limitations in that they do not include the impact of certain expenses that are reflected in our consolidated statements of operations that are necessary to run our business. Other companies, including other companies in our industry, may not use these measures and may calculate both differently than as presented, limiting the usefulness as a comparative measure.
55
The following table reconciles Net loss to Adjusted EBITDA :
|
| YEAR ENDED DECEMBER 31, | |||||||
|
| 2020 |
| 2019 |
| 2018 | |||
| | (in thousands) | |||||||
Net loss(a) | | $ | (49,397) | | $ | (8,926) | | $ | (33,258) |
Interest expense(a) | |
| 25,296 | |
| 28,004 | |
| 27,802 |
Interest income(a) | |
| (44) | |
| (9) | |
| (9) |
(Benefit from) provision for income taxes(a) | |
| (784) | |
| (225) | |
| 697 |
Depreciation and amortization expense(a) | |
| 2,443 | |
| 2,596 | |
| 2,416 |
Intangible asset amortization(a) | |
| 40,310 | |
| 38,964 | |
| 34,595 |
Currency loss(a) | | | 715 | | | 431 | | | 23 |
Equity-based compensation expense(b) | |
| 64,507 | |
| 1,691 | |
| 1,711 |
Acquisition-related expense(c) | |
| 1,456 | |
| 2,471 | |
| 6,718 |
Integration expense(d) | |
| 78 | |
| 546 | |
| 2,822 |
Transaction related expenses(e) | |
| 1,908 | |
| — | |
| — |
Severance expense(f) | |
| 557 | |
| 2,057 | |
| 1,356 |
Reorganization expense(g) | |
| 525 | |
| 222 | |
| — |
Loss on disposal of fixed assets(h) | |
| 19 | |
| 113 | |
| 91 |
Executive recruiting expense(i) | |
| 288 | |
| 476 | |
| — |
Adjusted EBITDA | | $ | 87,877 | | $ | 68,411 | | $ | 44,964 |
The following table reconciles Net loss to Adjusted Net Income (Loss):
|
| YEAR ENDED DECEMBER 31, | |||||||
|
| 2020 |
| 2019 |
| 2018 | |||
| | (in thousands) | |||||||
Net loss(a) | | $ | (49,397) | | $ | (8,926) | | $ | (33,258) |
Currency loss(a) | | | 715 | | | 431 | | | 23 |
Equity-based compensation expense(b) | |
| 64,507 | |
| 1,691 | |
| 1,711 |
Acquisition-related expense(c) | |
| 1,456 | |
| 2,471 | |
| 6,718 |
Integration expense(d) | |
| 78 | |
| 546 | |
| 2,822 |
Transaction related expenses(e) | |
| 1,908 | |
| — | |
| — |
Severance expense(f) | |
| 557 | |
| 2,057 | |
| 1,356 |
Reorganization expense(g) | |
| 525 | |
| 222 | |
| — |
Loss on disposal of fixed assets(h) | |
| 19 | |
| 113 | |
| 91 |
Executive recruiting expense(i) | |
| 288 | |
| 476 | |
| — |
Income tax expense impact of adjustments(j) | | | 1,381 | | | 1,758 | | | 2,951 |
Adjusted Net Income(Loss) | | $ | 22,037 | | $ | 839 | | $ | (17,586) |
56
The following table reconciles diluted earnings per share to Adjusted Diluted Earnings Per Share:
| | YEAR ENDED DECEMBER 31, | |||||||
| | 2020 | | 2019 | | 2018 | |||
| | (in thousands) | |||||||
Diluted earnings per share(a) |
| $ | (0.37) |
| $ | (0.07) |
| $ | (0.25) |
Currency loss(a) | | | 0.01 | | | — | | | — |
Equity-based compensation expense(b) | | | 0.48 | | | 0.01 | | | 0.01 |
Acquisition-related expense(c) | |
| 0.01 | |
| 0.02 | |
| 0.05 |
Integration expense(d) | |
| — | |
| 0.01 | |
| 0.02 |
Transaction related expenses(e) | |
| 0.01 | |
| — | |
| — |
Severance expense(f) | |
| 0.01 | |
| 0.02 | |
| 0.01 |
Reorganization expense(g) | |
| 0.01 | |
| — | |
| — |
Loss on disposal of fixed assets(h) | |
| — | |
| — | |
| — |
Executive recruiting expense(i) | |
| — | |
| 0.01 | |
| — |
Income tax expense impact of adjustments(j) | |
| 0.01 | |
| 0.01 | |
| 0.02 |
Effect of using adjusted diluted shares(k) | | | — | | | — | | | — |
Adjusted Diluted Earnings Per Share | | $ | 0.17 | | $ | 0.01 | | $ | (0.14) |
Diluted weighted average common shares outstanding | | | 133,247,212 | | | 132,407,786 | | | 132,407,786 |
Effect of potentially dilutive shares outstanding (l) | | | 229,383 | | | — | | | — |
Adjusted diluted weighted average common shares outstanding | | | 133,476,595 | | | 132,407,786 | | | 132,407,786 |
| (a) | Represents amounts as determined under GAAP. |
| (b) | Represents expense related to equity-based compensation. Equity-based compensation has been, and will continue to be for the foreseeable future, a recurring expense in our business and an important part of our compensation strategy. |
| (c) | Represents costs associated with mergers and acquisitions and any retention bonuses pursuant to the acquisitions. |
| (d) | Represents integration costs related to post-acquisition integration activities. |
| (e) | Represents costs associated with our initial public offering that are not capitalized. |
| (f) | Represents charges for severance provided to former executives and non-executives. |
| (g) | Represents expense related to reorganization, including legal entity reorganization. |
| (h) | Represents the gain/loss related to disposal of fixed assets. |
| (i) | Represents recruiting and relocation expenses related to hiring a CEO and other senior executives. |
| (j) | Represents the income tax effect of the non-GAAP adjustments calculated using the applicable statutory rate by jurisdiction. |
| (k) | Represents the effect of using the Adjusted diluted weighted average common shares outstanding. |
| (l) | Represents potentially dilutive shares that were excluded from the Company's GAAP diluted weighted average common shares outstanding because the Company had a reported net loss and therefore including these shares would have been anti-dilutive. |
57
Components of Results of Operations
Revenues
Our business generates revenue from the sales of software products and delivery of consulting services.
| ● | Software. Our software business generates revenues from software licenses, software subscriptions and software maintenance as follows: |
| ● | Software licenses: We recognize revenue for software license fees upfront, upon delivery of the software license. |
| ● | Software subscription: Subscription revenue consists of subscription fees to provide our customers access to and related support for our cloud-based solutions. We recognize subscription fees ratably over the term of the subscription, usually one to three years. Any subscription revenue paid upfront that is not recognized in the current period is included in deferred revenue in our consolidated balance sheet until earned. |
| ● | Software maintenance: Software maintenance revenue includes fees for providing updates and technical support for software offerings. Software maintenance revenue is recognized ratably over the contract term, usually one year. |
| ● | Services. Our services business generates revenues primarily from technology-enabled services and professional services, which include software implementation services. Our service arrangements are time and materials, fixed fee, or prepaid. Revenues are recognized over the time services are performed for time and materials, and over time by estimating progress to completion for fixed fee and prepaid services. |
Cost of Revenues
Cost of revenues consists primarily of employee related expenses, equity-based compensation, the costs of third-party subcontractors, travel costs, distributor fees, amortization of capitalized software and allocated overhead. We may add or expand computing infrastructure service providers, make additional investments in the availability and security of our solutions, or add resources to support our growth.
Operating Expenses
| ● | Sales and Marketing. Sales and marketing expense consists primarily of employee-related expenses, equity-based compensation, sales commissions, brand development, advertising, travel-related expenses and industry conferences and events. We plan to continue to invest in sales and marketing to increase penetration of our existing client base and expand to new clients. |
| ● | Research and Development. Research and development expense accounts for a significant portion of our operating expenses. We recognize expenses as incurred. Research and development expenses consist primarily of employee-related expenses, equity-based compensation, third-party consulting, allocated software costs and tax credits. We plan to continue to invest in our R&D efforts to enhance and scale our software product offerings by development of new features and increased functionality. |
| ● | General and Administrative. General and administrative expense consists of personnel-related expenses associated with our executive, legal, finance, human resources, information technology, and other administrative functions, including salaries, benefits, bonuses, and equity-based compensation. General and administrative expense also includes professional fees for external legal, accounting and other consulting services, allocated overhead costs, and other general operating expenses. |
58
We expect to increase the size of our general and administrative staff to support the anticipated growth of our business. As a public company, we expect to incur significant expenses on an ongoing basis that we did not incur as a private company. Those costs include additional director and officer liability insurance expenses, as well as third-party and internal resources related to accounting, auditing, SOX compliance, legal, and investor and public relations expenses. As a result, we expect the dollar amount of our general and administrative expense to increase for the foreseeable future. Excluding public company expenses, we expect general and administrative expense to grow at a rate lower than revenues.
| ● | Intangible Asset Amortization. Intangible asset amortization consists primarily of amortization expense related to intangible assets recorded in connection with acquisitions and amortization of capitalize software development costs. |
| ● | Depreciation and Amortization Expense. Depreciation and amortization expense consists of depreciation of property and equipment and amortization of leasehold improvements. |
Other Expenses
| ● | Interest Expense. Interest expense consists primarily of interest expense associated with the Credit Agreement, including amortization of debt issuance costs and discounts. We expect interest expense to decline as a result of lower outstanding indebtedness going forward. |
| ● | Miscellaneous. Miscellaneous expense consists of miscellaneous non-operating expenses primarily comprised of foreign exchange transaction gains and losses. |
| ● | Provision for (Benefit from) Income Taxes. Provision for (benefit from) income taxes consists of U.S. federal and state income taxes and income taxes in certain foreign jurisdictions in which we conduct business. We expect income tax expense to increase over time as the Company continues to grow net income. |
Acquisitions
BaseCase Acquisition
On January 25, 2018, we acquired 100% of the equity of BaseCase, a SaaS company in the life sciences industry. The purchase price of $25.3 million was funded through proceeds of $25.0 million received from an additional tranche of term debt and cash on hand. See Note 5, "Business Combinations," of the consolidated financial statements.
Analytica Laser Acquisition
On April 3, 2018, we acquired 100% of the equity of Analytica Laser, a provider of real-world evidence and health economics outcomes research, value and access consultancy, cost and comparative effectiveness modeling, and collection and analysis of real-world data for use in market and payor communications. The purchase price of $40.0 million was funded through proceeds of $40.0 million received from an additional tranche of term debt and cash on hand. See Note 5, "Business Combinations," of the consolidated financial statements.
59
Results of Operations
| | YEAR ENDED DECEMBER 31, | |||||||
|
| 2020 |
| 2019 |
| 2018 | |||
| | (in thousands) | |||||||
Statement of operations data: | | | | | | | | | |
Revenues | | $ | 243,530 | | $ | 208,511 | | $ | 163,719 |
Cost of revenues | |
| 100,765 | |
| 79,770 | |
| 71,043 |
Operating expenses: | |
| | |
|
| |
| |
Sales and marketing | |
| 19,202 | |
| 10,732 | |
| 9,416 |
Research and development | |
| 19,644 | |
| 11,633 | |
| 10,478 |
General and administrative | |
| 88,482 | |
| 47,926 | |
| 43,393 |
Intangible asset amortization | |
| 37,414 | |
| 36,241 | |
| 31,625 |
Depreciation and amortization expense | |
| 2,443 | |
| 2,596 | |
| 2,416 |
Total operating expenses | |
| 167,185 | |
| 109,128 | |
| 97,328 |
Income (loss) from operations | |
| (24,420) | |
| 19,613 | |
| (4,652) |
Other expenses: | |
|
| |
|
| |
|
|
Interest expense | |
| (25,296) | |
| (28,004) | |
| (27,802) |
Miscellaneous, net | |
| (465) | |
| (760) | |
| (107) |
Total other expenses | |
| (25,761) | |
| (28,764) | |
| (27,909) |
Loss from operations before income taxes | |
| (50,181) | |
| (9,151) | |
| (32,561) |
(Benefit from) provision for income taxes | |
| (784) | |
| (225) | |
| 697 |
Net loss | | $ | (49,397) | | $ | (8,926) | | $ | (33,258) |
Comparison of the Year Ended December 31, 2020 and 2019
Revenues
| | YEAR ENDED DECEMBER 31, |
| CHANGE |
| |||||||
|
| 2020 |
| 2019 |
| $ |
| % |
| |||
| | ( in thousands) |
| |||||||||
Software | | $ | 73,463 | | $ | 68,341 | | $ | 5,122 | | 7 | % |
Services | |
| 170,067 | |
| 140,170 | |
| 29,897 | | 21 | % |
Total revenues | | $ | 243,530 | | $ | 208,511 | | $ | 35,019 | | 17 | % |
Revenues increased by $35.0 million, or 17%, to $243.5 million for the year ended December 31, 2020 as compared to the same period in 2019. The increase in revenues was a direct result of growth in our technology enabled services and software product offerings from strong renewal rates and client expansions.
Software revenue increased by $5.1 million, or 7%, to $73.5 million for the year ended December 31, 2020 as compared to the same period in 2019, driven primarily by growth in sales of our software licenses of 10%, or $3.3 million and subscriptions revenue of 8%, or $2.3 million, partially offset by a decline in software maintenance revenue or $0.5 million. The growth is attributable to maintaining high net revenue retention rates and renewal rates for our core software products.
Services revenue increased by $29.9 million, or 21%, to $170.1 million for the year ended December 31, 2020 as compared to the same period in 2019, primarily driven by organic growth in our technology-enabled services product lines of 23%, or $30.6 million, partially offset by a $0.7 million decrease in professional services offerings. The growth is primarily attributable to strong growth in biosimulation and regulatory services from client expansions and new customer acquisition.
60
Cost of Revenues
|
| YEAR ENDED DECEMBER 31, |
| CHANGE |
| |||||||
|
| 2020 |
| 2019 |
| $ |
| % |
| |||
| | (in thousands) |
| |||||||||
Cost of revenues | | $ | 100,765 | | $ | 79,770 | | $ | 20,995 | | 26 | % |
Cost of revenues increased by $21.0 million, or 26%, to $100.8 million for the year ended December 31, 2020 as compared to 2019. The increase was primarily due to a $8.6 million increase in stock-based compensation driven by the exchange of performance vesting Class B Units in connection with the December 2020 offering and an increase to employee-related costs of $8.6 million related to increased headcount. The remaining increase is due to consulting costs and bonus expense, partially offset by decreases in travel related costs, retention, and software expenses.
Sales and Marketing Expense
| | YEAR ENDED DECEMBER 31, | | CHANGE |
| |||||||
|
| 2020 |
| 2019 |
| $ |
| % |
| |||
| | (in thousands) |
| |||||||||
Sales and marketing | | $ | 19,202 | | $ | 10,732 | | $ | 8,470 | | 79 | % |
% of total revenues | |
| 8 | % |
| 5 | % |
|
| |
| |
Sales and marketing increased by $8.5 million, or 79%, to $19.2 million for the year ended December 31, 2020 as compared to 2019. The increase was primarily due to a $7.3 million increase in stock-based compensation driven by the exchange of performance vesting Class B Units in connection with the December 2020 offering. The remainder of the increase is due to sales commissions, employee-related costs, and other marketing costs, offset by decreases in advertising and tradeshow, travel and entertainment, bonus, and consulting expenses.
Research and Development Expense
| | YEAR ENDED DECEMBER 31, |
| CHANGE |
| |||||||
|
| 2020 |
| 2019 |
| $ |
| % |
| |||
| | (in thousands) |
| |||||||||
Research and development | | $ | 19,644 | | $ | 11,633 | | $ | 8,011 | | 69 | % |
% of total revenues | |
| 8 | % |
| 6 | % |
|
| |
| |
Research and development expenses increased by $8.0 million, or 69%, to $19.6 million for the year ended December 31, 2020 as compared to 2019. The increase was primarily due to a $7.0 million increase in stock-based compensation driven by the exchange of performance vesting Class B Units in connection with the December 2020 offering. The remaining increase was due to employee-related costs, consulting expenses, and bonus expense, partially offset by lower capitalization of software development costs, tax credits, and travel and entertainment spend.
General and Administrative Expense
|
| YEAR ENDED DECEMBER 31, |
| CHANGE |
| |||||||
|
| 2020 |
| 2019 |
| $ |
| % |
| |||
| | (in thousands) |
| |||||||||
General and administrative | | $ | 88,482 | | $ | 47,926 | | $ | 40,556 | | 85 | % |
% of total revenues | |
| 36 | % |
| 23 | % |
|
| |
| |
General and administrative expenses increased by $40.6 million, or 85%, to $88.5 million for the year ended December 31, 2020 as compared to 2019. The increase was primarily due to a $39.8 million increase in stock-based compensation driven by the exchange of performance vesting Class B Units in connection with the December 2020 offering. The remaining increase is due to increases in professional fees, IPO transaction costs, employee-related costs, bonus expense, IT-related costs, and D&O insurance coverage, partially offset by decreases in travel and entertainment spend, severance expenses, restructuring costs, acquisitions and integration costs, and office supply expense.
61
Intangible Asset Amortization Expense
|
| YEAR ENDED DECEMBER 31, |
| CHANGE |
| |||||||
|
| 2020 |
| 2019 |
| $ |
| % |
| |||
| | (in thousands) |
| |||||||||
Intangibles asset amortization | | $ | 37,414 | | $ | 36,241 | | $ | 1,173 | | 3 | % |
% of total revenues | |
| 15 | % |
| 17 | % |
|
| |
| |
Intangible asset amortization expense increased by $1.2 million, or 3%, to $37.4 million for the year ended December 31, 2020 as compared to 2019. The increase in intangible asset amortization was a direct result of increases in capitalized software development costs and increases in acquired intangible assets.
Depreciation and Amortization Expense
| | YEAR ENDED DECEMBER 31, |
| CHANGE |
| |||||||
|
| 2020 |
| 2019 |
| $ |
| % |
| |||
| | (in thousands) |
| |||||||||
Depreciation and amortization | | $ | 2,443 | | $ | 2,596 | | $ | (153) | | (6) | % |
% of total revenues | |
| 1 | % |
| 1 | % |
|
| |
| |
Depreciation and amortization expense of $2.4 million was relatively flat for the year ended December 31, 2020 as compared to 2019.
Interest Expense
|
| YEAR ENDED DECEMBER 31, |
| CHANGE |
| |||||||
|
| 2020 |
| 2019 |
| $ |
| % |
| |||
| | (in thousands) |
| |||||||||
Interest expense | | $ | 25,296 | | $ | 28,004 | | $ | (2,708) | | (10) | % |
% of total revenues | |
| 10 | % |
| 13 | % |
|
| |
| |
Interest expense decreased by $2.7 million, or 10%, to $25.3 million for the year ended December 31, 2020 as compared to 2019. The decrease in interest expense was primarily due to lower outstanding debt resulting from payoff of our higher interest term loans and lower interest rates on the outstanding debt.
Miscellaneous, net
| | YEAR ENDED DECEMBER 31, |
| CHANGE |
| |||||||
|
| 2020 |
| 2019 |
| $ |
| % |
| |||
| | (in thousands) |
| |||||||||
Miscellaneous, net | | $ | 465 | | $ | 760 | | $ | (295) | | (39) | % |
% of total revenues | |
| 0 | % |
| 0 | % |
|
| |
| |
Miscellaneous expenses decreased by $0.3 million, or 39%, to $0.5 million for the year ended December 31, 2020 as compared to 2019. The decrease in miscellaneous expenses was primarily due to a $0.2 million decrease in asset disposals and sublease losses and a $0.2 million Australian stimulus income provided by the Australian government, partially offset by a $0.3 million unfavorable foreign currency exchange rate fluctuations compared to the U.S. dollar, particularly with the pound sterling.
62
(Benefit from) Provision for Income Taxes
| | YEAR ENDED DECEMBER 31, | | CHANGE |
| |||||||
|
| 2020 |
| | 2019 |
| $ |
| % |
| ||
| | ( in thousands) |
| |||||||||
(Benefit from) income taxes | | $ | (784) |
| $ | (225) | | $ | 559 | | 248 | % |
Effective income tax rate | |
| 1.6 | % | | 2.5 | % |
|
| |
| |
Our income tax benefit was $0.8 million, resulting in an effective income tax rate of 1.6%, for the year ended December 31, 2020, as compared to an income tax benefit of $0.2 million, or an effective income tax rate of 2.5%, in 2019. Our income tax benefit for the year ended December 31, 2020 was primarily due to the tax effects of the U.S. pre-tax loss and the impact of tax rate changes in certain jurisdictions.
Net Loss
| | YEAR ENDED DECEMBER 31, |
| CHANGE |
| |||||||
|
| 2020 |
| 2019 |
| $ |
| % |
| |||
| | (in thousands) |
| |||||||||
Net loss | | $ | (49,397) | | $ | (8,926) | | $ | 40,471 | | 453 | % |
Net loss increased by $40.5 million, or 453%, to $49.4 million for the year ended December 31, 2020 as compared to the same period in 2019. The increase was primarily due to an increase in operating expenses, namely general and administrative expenses, sales and marketing, and research and development expenses.
Comparison of the Year Ended December 31, 2019 and 2018
Revenues
| | YEAR ENDED DECEMBER 31, | | CHANGE | | |||||||
|
| 2019 |
| 2018 |
| $ |
| % |
| |||
| | (in thousands) |
| |||||||||
Software | | $ | 68,341 | | $ | 46,849 | | $ | 21,492 | | 46 | % |
Services | |
| 140,170 | |
| 116,870 | |
| 23,300 | | 20 | % |
Total revenues | | $ | 208,511 | | $ | 163,719 | | $ | 44,792 | | 27 | % |
Revenues increased by $44.8 million, or 27%, to $208.5 million for the year ended December 31, 2019 as compared to the same period in 2018. The increase in revenues was a direct result of growth in our services and software product offerings, strong renewal rates and client expansions in software, as well as growth in our technology-enabled services, primarily in biosimulation, market access, and regulatory writing offerings.
Software revenue increased by $21.5 million, or 46%, to $68.3 million for the year ended December 31, 2019 as compared to the same period in 2018, driven primarily by an increase in sales of our software licenses of 16%, or $4.6 million, as well as an increase in subscriptions revenue of 8%, or $2.3 million, and software maintenance revenue of 8%, or $0.3 million. In addition to organic growth, we incurred a reduction in 2018 software licenses and software subscriptions of $8.3 million and $6.1 million respectively, as compared to $0 and $0.3 million in 2019, relating to purchase accounting fair value adjustments of deferred revenue.
Services revenue increased by $23.3 million, or 20%, to $140.2 million for the year ended December 31, 2019 as compared to the same period in 2018, primarily driven by both organic and acquisition growth in our technology-enabled services product lines of 20%, or $22.7 million and professional service offerings of $0.5 million.
63
Cost of Revenues
| | YEAR ENDED DECEMBER 31, | | CHANGE | | |||||||
|
| 2019 |
| 2018 |
| $ | | % |
| |||
| | (in thousands) |
| |||||||||
Cost of revenues | | $ | 79,770 | | $ | 71,043 | | $ | 8,727 | | 12 | % |
Cost of revenues increased by $8.7 million, or 12%, to $79.8 million for the year ended December 31, 2019 as compared to 2018. The increase in cost of revenues was primarily due to increases in employee-related costs, including bonus expense, of $6.0 million. The remaining increase is due to consulting costs, distributor fees, and software expenses, partially offset by a decrease in amortization of software development costs and integration costs.
Sales and Marketing Expense
| | YEAR ENDED DECEMBER 31, | | CHANGE | | |||||||
|
| 2019 |
| 2018 |
| $ |
| % |
| |||
| | (in thousands) |
| |||||||||
Sales and marketing | | $ | 10,732 | | $ | 9,416 | | $ | 1,316 | | 14 | % |
% of total revenues | |
| 5 | % |
| 6 | % |
|
| |
| |
Sales and marketing increased by $1.3 million, or 14%, to $10.7 million for the year ended December 31, 2019 as compared to 2018. Sales and marketing increased primarily due to increases in employee-related costs, including bonus expense, of $0.7 million. The remaining increase is due to sales commissions, consulting expenses, and travel and entertainment costs, partially offset by a decrease in other marketing costs.
Research and Development Expense
| | YEAR ENDED DECEMBER 31, | | CHANGE | | |||||||
|
| 2019 |
| 2018 |
| $ |
| % |
| |||
| | (in thousands) |
| |||||||||
Research and development | | $ | 11,633 | | $ | 10,478 | | $ | 1,155 | | 11 | % |
% of total revenues | |
| 6 | % |
| 6 | % |
|
| |
| |
Research and development expenses increased by $1.2 million, or 11%, to $11.6 million for the year ended December 31, 2019 as compared to 2018. The increase in R&D expenses was primarily due to increases in employee-related costs, including bonus expense, of $2.2 million. This was partially offset by higher capitalization of software development costs, tax credits, and a decrease in startup costs.
General and Administrative Expense
| | YEAR ENDED DECEMBER 31, | | CHANGE | | |||||||
|
| 2019 |
| 2018 |
| $ |
| % |
| |||
| | (in thousands) |
| |||||||||
General and administrative | | $ | 47,926 | | $ | 43,393 | | $ | 4,533 | | 10 | % |
% of total revenues | |
| 23 | % |
| 27 | % |
|
| |
| |
General and administrative expenses increased by $4.5 million, or 10%, to $47.9 million for the year ended December 31, 2019 as compared to 2018. The increase in general and administrative expenses was primarily due to increases in employee-related costs, including bonus expense, of $3.7 million. The remaining increase is due to facilities costs, software expenses, accounting fees, and severance, integration, restructuring, and reorganization costs, partially offset by decreases in travel and entertainment costs and acquisition-related synergies.
64
Intangible Asset Amortization Expense
| | YEAR ENDED DECEMBER 31, | | CHANGE | | |||||||
|
| 2019 |
| 2018 |
| $ |
| % |
| |||
| | (in thousands) |
| |||||||||
Intangibles asset amortization | | $ | 36,241 | | $ | 31,625 | | $ | 4,616 | | 15 | % |
% of total revenues | |
| 17 | % |
| 19 | % |
|
| |
| |
Intangible asset amortization expense increased by $4.6 million, or 15%, to $36.2 million for the year ended December 31, 2019 as compared to 2018. The increase in intangible asset amortization was a direct result of increases in capitalized software development costs and increases in acquired intangible assets.
Depreciation and Amortization Expense
| | YEAR ENDED DECEMBER 31, | | CHANGE | | |||||||
|
| 2019 |
| 2018 |
| $ |
| % |
| |||
| | (in thousands) |
| |||||||||
Depreciation and amortization | | $ | 2,596 | | $ | 2,416 | | $ | 180 | | 7 | % |
% of total revenues | |
| 1 | % |
| 1 | % |
|
| |
| |
Depreciation and amortization expense of $2.6 million was relatively flat for the year ended December 31, 2019 as compared to 2018.
Interest Expense
| | YEAR ENDED DECEMBER 31, | | CHANGE | | |||||||
|
| 2019 |
| 2018 |
| $ |
| % |
| |||
| | (in thousands) |
| |||||||||
Interest expense | | $ | 28,004 | | $ | 27,802 | | $ | 202 | | 1 | % |
% of total revenues | |
| 13 | % |
| 17 | % |
|
| |
| |
Interest expense increased by $0.2 million, or 1%, to $28.0 million for the year ended December 31, 2019 as compared to 2018. The increase in interest expense was primarily due to the full year effect of interest on acquisition-related borrowings.
Miscellaneous, net
| | | | | | | | | | | | |
| | YEAR ENDED DECEMBER 31, | | CHANGE | | |||||||
|
| 2019 |
| 2018 |
| $ |
| % |
| |||
| | (in thousands) |
| |||||||||
Miscellaneous, net | | $ | 760 | | $ | 107 | | $ | 653 | | 610 | % |
% of total revenues | |
| 0 | % |
| 0 | % |
|
| |
| |
Miscellaneous expenses increased by $0.7 million, or 610%, to $0.8 million for the year ended December 31, 2019 as compared to 2018. The increase in miscellaneous expenses was primarily due to unfavorable foreign exchange rates compared to the U.S. dollar, particularly with the pound sterling.
(Benefit from) Provision for Income Taxes
| | YEAR ENDED DECEMBER 31, | | CHANGE | | |||||||
|
| 2019 |
| 2018 |
| $ |
| % |
| |||
| | (in thousands) |
| |||||||||
(Benefit from) provision for income taxes | | $ | (225) |
| $ | 697 | | $ | 922 | | nm | |
Effective income tax rate | |
| 2.5 | % | | (2.1) | % |
| | |
| |
65
Our income tax benefit was $0.2 million, resulting in an effective income tax rate of 2.5%, for the year ended December 31, 2019, as compared to an income tax expense of $0.7 million, or an effective income tax rate of (2.1%), in 2018. Our income tax benefit for the year ended December 31, 2019 was primarily due to the tax effects of the U.S. pre-tax loss and the impact of tax rate changes in certain jurisdictions.
Net Loss
| | | | | | | | | | | | |
| | YEAR ENDED DECEMBER 31, | | CHANGE | | |||||||
|
| 2019 |
| 2018 |
| $ |
| % |
| |||
| | (in thousands) |
| |||||||||
Net loss | | $ | (8,926) | | $ | (33,258) | | $ | 24,332 | | (73) | % |
Net loss decreased by $24.3 million, or 73%, to $8.9 million for the year ended December 31, 2019 as compared to the same period in 2018. The decrease was primarily due to an increase in operating income and positive change in taxes, partially offset by increase in other expenses, each as described above.
Liquidity and Capital Resources
As of December 31, 2020, we had cash and cash equivalents of $271.4 million, of which $19.9 million represents cash and cash equivalents held outside of the United States.
Cash Flows
The following table presents a summary of our cash flows for the periods shown:
| | YEAR ENDED DECEMBER 31, | |||||||
|
| 2020 |
| 2019 |
| 2018 | |||
| | (in thousands) | |||||||
Net cash provided by operating activities | | $ | 44,810 | | $ | 38,025 | | $ | 11,592 |
Net cash used in investing activities | |
| (8,612) | |
| (9,517) | | | (73,905) |
Net cash provided by (used in) financing activities | |
| 208,214 | |
| (8,489) | | | 57,296 |
Effect due to foreign exchange rate changes on cash, cash equivalents, and restricted cash | |
| (883) | |
| (2,444) | | | (1,337) |
Net increase (decrease) in cash, cash equivalents and restricted cash | | $ | 243,529 | | $ | 17,575 | | $ | (6,354) |
Cash paid for interest | | $ | 27,607 | | $ | 26,428 | | $ | 25,713 |
Cash paid for income taxes | | $ | 12,278 | | $ | 4,109 | | $ | 3,165 |
Operating Activities
During the year ended December 31, 2020, operating activities provided approximately $44.8 million of cash and cash equivalents, primarily resulting from a net loss of $49.4 million, offset by $100.9 million of non-cash operating expenses inclusive of depreciation and amortization, amortization of debt issuance costs, equity-based compensation costs, and deferred income taxes. Changes in our operating assets and liabilities used cash and cash equivalents of approximately $6.7 million.
During the year ended December 31, 2019, operating activities provided approximately $38.0 million of cash and cash equivalents, primarily resulting from a net loss of $8.9 million, offset by $38.2 million of non-cash operating expenses inclusive of depreciation and amortization, amortization of debt issuance costs, equity-based compensation costs, and deferred income taxes. Changes in our operating assets and liabilities provided cash and cash equivalents of approximately $8.7 million.
66
During the year ended December 31, 2018, operating activities provided approximately $11.6 million of cash and cash equivalents, primarily resulting from a net loss of $33.3 million, offset by $36.4 million of non-cash operating expenses inclusive of depreciation and amortization, amortization of debt issuance cost, equity-based compensation costs, deferred income taxes, and a $0.1 million non-cash loss on retirement of assets. Changes in our operating assets and liabilities provided cash and cash equivalents of approximately $8.3 million.
Investing Activities
During the year ended December 31, 2020, investing activities used approximately $8.6 million of cash, primarily for investing in capital expenditures and capitalized software development to support our growth.
During the year ended December 31, 2019, investing activities used approximately $9.5 million of cash, primarily for investing in capital expenditures and capitalized software development to support our growth.
During the year ended December 31, 2018, investing activities used approximately $73.9 million of cash, primarily for business acquisitions of $62.4 million, and investing in capital expenditures and capitalized software development to support our growth.
Financing Activities
During the year ended December 31, 2020, financing activities provided approximately $208.2 million of cash, primarily attributable to proceeds from issuance of common stock in connection with our IPO, partially offset by payments on long-term debt.
During the year ended December 31, 2019, financing activities used approximately $8.5 million of cash, primarily attributable to payments on long-term debt, capital lease obligations, and our revolving credit facility, and unit repurchases, partially offset by proceeds from capital contributions.
During the year ended December 31, 2018, financing activities provided approximately $57.3 million of cash, consisting of proceeds from borrowings on long-term debt and our revolving credit facility, and capital contributions, partially offset by payments on contingent consideration obligations, long-term debt, capital lease obligations, and our revolving credit facility, units repurchases, and debt issuance costs.
Funding Requirements
We believe that our existing cash and cash equivalents will be sufficient to fund our operations and capital expenditure requirements for the foreseeable future. Our future capital requirements will depend on many factors, including funding for potential acquisitions, investments, and other growth and strategic opportunities that might require use of existing cash, borrowings under our revolving credit facility, or additional long-term financing. We may also use existing cash and cash flows from operations to pay down long-term debt from time to time.
While we believe we have sufficient liquidity to fund our operations for the foreseeable future, our sources of liquidity could be affected by factors described under “Risk Factors” elsewhere in this filing.
Indebtedness
Credit Facilities
Loan Agreement
During the year ended December 31, 2020, we were party to a loan agreement, dated July 6, 2017, (the “Loan Agreement”) providing for a $100.0 million senior unsecured term loan. The Loan Agreement was set to mature on August 14, 2025. Borrowings under the Loan Agreement bore interest at a rate per annum equal to 8.25% payable semi-annually on January 15th and July 15th and on the final maturity date. During the year ended December 31, 2020, we
67
repaid the $100.0 million aggregate principal amount owed, plus $7.1 million in interest owed, under the Loan Agreement. As we could voluntarily repay outstanding loans without premium or penalty, we did not incur any early termination penalties or write offs of any deferred financing costs as a result of the repayment of the indebtedness. Our obligations under the Loan Agreement were discharged on December 28, 2020, the date of the final prepayment and the agreement was terminated.
Credit Agreement
Certain of our wholly owned indirect subsidiaries, Certara Holdco, Inc. and Certara USA, Inc. (collectively, the “Borrowers”), are party to a Credit Agreement that provides for a $250.0 million senior secured term loan and commitments under a revolving credit facility in an aggregate principal amount of $20.0 million, with a sub-commitment for issuance of letters of credit of $10.0 million. The Credit Agreement matures on August 14, 2024, with respect to the term loan thereunder, and August 14, 2022, with respect to the revolving credit facility thereunder.
In January 2018, the Borrowers amended the Credit Agreement to borrow incremental term loans in the amount of $25.0 million to be used for general corporate purposes. Additionally, in April 2018, the Borrowers amended the Credit Agreement to (i) borrow incremental term loans in the amount of $40.0 million to be used for general corporate purposes and (ii) provide a reduction of 50 basis points in the margin under the term loan. The terms of such incremental term loans were the same as the terms of the Borrowers’ existing term loans, including in respect of maturity, and are considered an increase in the aggregate principal amount of the existing term loans outstanding under the Credit Agreement and are part of the existing term loan.
Borrowings under the Credit Agreement currently bear interest at a rate per annum equal to either (i) the Eurocurrency rate, with a floor of 0.00%, as adjusted for the reserve percentage required under regulations issued by the Federal Reserve Board for determining maximum reserve requirements with respect to Eurocurrency funding, plus an applicable margin rate of 3.50% for the term loan and between 4.00% and 3.50% for revolving credit loans, depending on the applicable first lien leverage ratio, (ii) an alternate base rate (“ABR”), with a floor of 1.00%, plus an applicable margin rate of 2.50% for the term loan or between 3.00% and 2.50% for revolving credit loans, depending on the applicable first lien leverage ratio. The ABR is determined as the greatest of (a) the prime rate, (b) the federal funds effective rate, plus 0.50% and (iii) the Eurocurrency rate plus 1.00%.
Additionally, we are obligated to pay under the revolving credit facility (i) a commitment fee of between 0.50% and 0.25% per annum of the unused amount of the revolving credit facility, depending on the applicable first lien leverage ratio, (ii) customary letter of credit issuance and participation fees, and (iii) other customary fees and expenses of the letter of credit issuers.
The Credit Agreement provides that the Borrowers may request increased commitments and additional term loans or additional term or revolving facilities under the Credit Agreement, in each case, subject to certain conditions and in an aggregate principal amount not to exceed the sum of (a) the greater of (i) $50.0 million and (ii) 100% of Consolidated Adjusted EBITDA (as defined in the Credit Agreement) for the most recently completed four fiscal quarter period for which internal financial statements have been delivered (or are required to be delivered) prior to the date of any such incurrence, plus (b) an additional amount, subject to compliance on a pro forma basis with (i) a consolidated first lien leverage ratio of no greater than 5.00 to 1.00 for incremental first lien debt or (ii) if incurred in connection with a permitted acquisition, the first lien leverage ratio immediately prior to such acquisition, plus (c) certain other amounts as specified in the Credit Agreement. The Credit Agreement also provides for the incurrence of junior secured and unsecured debt, subject to certain conditions and ratios specified in the Credit Agreement.
The term loan under the Credit Agreement amortizes at a rate of approximately 1.00% per annum, paid in quarterly installments approximately equal to the product of (a) 0.25% times (b) the aggregate principal amount of the initial term loan outstanding immediately after the borrowing of the initial term loan on the closing date and each incremental term loan outstanding immediately after the borrowing thereof on the applicable closing date (with respect to each term loan repayment date prior to the term loan maturity date, as such product may be reduced by, and after giving pro forma effect to, any voluntary and mandatory prepayments as described in the Credit Agreement).
68
The Credit Agreement requires the Borrowers to prepay, subject to certain exceptions, outstanding term loans thereunder with:
| ● | 50% (which percentage will be reduced to 25% and 0% based upon the achievement and maintenance of first lien leverage ratios equal to or less than 4.50 to 1.00 and 4.00 to 1.00, respectively) of the Borrowers’ annual excess cash flow; |
| ● | 100% (which percentage will be reduced to 50% and 0% based upon the achievement and maintenance of first lien leverage ratios equal to or less than 4.50 to 1.00 and 4.00 to 1.00, respectively) of net cash proceeds of certain non-ordinary course asset sales or other dispositions of property, in excess of certain amounts specified in the Credit Agreement and subject to customary reinvestment rights; and |
| ● | 100% of net cash proceeds of certain issuances of debt obligations of the Borrowers and their restricted subsidiaries, except as permitted under the Credit Agreement. |
There is no scheduled amortization under the revolving credit facility. The Borrowers may voluntarily reduce the unutilized portion of the commitment amount and repay outstanding loans under the Credit Agreement at any time without premium or penalty.
All obligations under the Credit Agreement are unconditionally guaranteed by our wholly owned indirect subsidiary and the parent of the Borrowers, Certara Intermediate, Inc. (“Holdings”), the Borrowers and certain of the Borrowers’ existing and future direct and indirect wholly owned domestic subsidiaries, subject to certain exceptions. All obligations under the Credit Agreement, and the guarantees of those obligations, are secured on a first lien basis, subject to certain exceptions, by substantially all of Holdings’ and the Borrowers’ assets and the assets of the other guarantors.
The Credit Agreement contains covenants that, among other things, limit the ability of the Borrowers to incur additional debt; create liens against their assets; make acquisitions; pay dividends on their capital stock or redeem, repurchase, or retire their capital stock; make investments, acquisitions, loans, and advances; create negative pledges; merge or consolidate with another entity; transfer or sell assets; and enter into certain transactions with their affiliates.
In addition, the revolving credit facility under the Credit Agreement is subject to a first lien leverage ratio test of 7.50 to 1.00, tested quarterly if, and only if, on the last day of any fiscal quarter, the revolving credit facility and letters of credit (to the extent not cash collateralized or backstopped or, in the aggregate, not in excess of $5.0 million) are outstanding and/or issued, as applicable, in an aggregate principal amount exceeding 35% of the total amount of the revolving credit facility commitments thereunder.
The Credit Agreement also contains certain customary representations and warranties, affirmative covenants and reporting obligations. In addition, the lenders under the Credit Agreement will be permitted to accelerate the loans and terminate commitments thereunder or exercise other specified remedies available to secured creditors upon the occurrence of certain events of default, subject to certain grace periods and exceptions, which include, among others, payment defaults, breaches of representations and warranties, covenant defaults, cross-defaults to certain material indebtedness, certain events of bankruptcy and insolvency, certain pension plan related events, material judgments, and any change of control.
As of December 31, 2020, we had $304.1 million of outstanding borrowings on the term loan, and $19.9 million of availability under the revolving credit facility, and outstanding letters of credit of $0.1 million under the Credit Agreement.
As of December 31, 2020, we and the Borrowers were in compliance with the covenants of each of the Credit Agreement.
69
Contractual Obligations and Commercial Commitments
We enter into long-term contractual obligations and commitments in the normal course of business, including operating leases.
The following table summarizes our contractual obligations as of December 31, 2020:
| | | | | | | | | | | | | MORE THAN | ||
|
| TOTAL |
| 1 YEAR |
| 2 TO 3 YEARS |
| 4 TO 5 YEARS |
| 5 YEARS | |||||
| | (in thousands) | |||||||||||||
Lease obligations:(1) | | | | | | | | | | | | | | | |
Operating leases | | $ | 20,908 | | $ | 6,023 | | $ | 7,889 | | $ | 4,624 | | $ | 2,372 |
Capital leases(2) | |
| 633 | |
| 304 | |
| 329 | |
| — | |
| — |
Principal payments of long-term debt | |
| 304,099 | |
| 4,680 | |
| 6,306 | |
| 293,113 | |
| — |
Interest on long-term debt(3) | |
| 41,154 | |
| 11,528 | |
| 22,697 | |
| 6,929 | |
| — |
Total | | $ | 366,794 | | $ | 22,535 | | $ | 37,221 | | $ | 304,666 | | $ | 2,372 |
| (1) | Includes the initial lease term and optional renewal terms that are included in the lease term of our headquarters and other office leases. |
| (2) | Inclusive of interest expense. |
| (3) | Represents the expected cash payments for interest on our long-term debt based on the amounts outstanding as of the end of each period and the interest rates applicable on such debt as of December 31, 2020. |
As of December 31, 2020, contractual obligations for lease obligations decreased by $4.3 million from December 31, 2019, due to payments. As of December 31, 2020, contractual obligations for principal payments of long-term debt and interest on debt decreased by $104.1 million and $82.8 million, respectively, from December 31, 2019. The decrease in principal payments of long-term debt is due to scheduled payments on our Credit Agreement plus a $100 million prepayment on the Loan Agreement. The decrease in interest on debt is due to lower outstanding debt balances and lower interest rates.
Income Taxes
We recorded income tax benefit of $0.8 million for the year ended December 31, 2020 and income tax benefit of $0.2 million for the year ended December 31, 2019.
As of December 31, 2020, we had federal and state NOLs of approximately $3.3 million and $3.0 million, respectively, which are available to reduce future taxable income and expire between 2024 and 2036 and 2029 and 2038, respectively. We had federal and state R&D tax credit carryforwards of approximately $2.3 million and $0.6 million, respectively, to offset future income taxes, which expire between 2024 and 2040. We also had foreign tax credits of approximately $12.5 million, which will start to expire in 2025. These carryforwards that may be utilized in a future period may be subject to limitations based upon changes in the ownership of our stock in a future period. Additionally, we carried forward foreign NOLs of approximately $16.1 million which will start to expire in 2022, foreign research and development credits of $2.5 million which expire between 2029 and 2030, and Canadian investment tax credits of approximately $2.7 million which expire between 2030 and 2039. Our carryforwards are subject to review and possible adjustment by the appropriate taxing authorities.
As required by Accounting Standards Codification (‘‘ASC’’) Topic 740, Income Taxes, our management has evaluated the positive and negative evidence bearing upon the realizability of our deferred tax assets, which are composed principally of NOL carryforwards, R&D credit carryforwards, investment tax credit carryforward, and foreign tax credit carryforwards. Management has determined that it is more likely than not that we will not realize the benefits of foreign tax credit carryforwards. At the foreign subsidiaries, management has determined that it is more likely than not that we will not realize the benefits of certain NOL carryforwards. As a result, a valuation allowance of $16.7 million was recorded at December 31, 2020. Additionally, the Company released the valuation allowance against certain U.S.
70
carryforwards and foreign investment tax credits, as management deemed such attributes more likely than not to be realized.
Off-Balance Sheet Arrangements
During the periods presented, we did not have, and currently we do not have, any off-balance sheet arrangements, as defined under the rules and regulations of the SEC.
Critical Accounting Policies and Estimates
Our management’s discussion and analysis of our financial condition and results of operations are based on our consolidated financial statements, which have been prepared in accordance with GAAP. The preparation of these consolidated financial statements requires us to make judgments and estimates that affect the reported amounts of assets, liabilities, revenues, and expenses and the disclosure of contingent assets and liabilities in our consolidated financial statements. We base our estimates on historical experience, known trends and events, and various other factors that we believe to be reasonable under the circumstances, the results of which form the basis for making judgments about the carrying values of assets and liabilities that are not readily apparent from other sources. Actual results may differ from these estimates under different assumptions or conditions. On an ongoing basis, we evaluate our judgments and estimates in light of changes in circumstances, facts, and experience. The effects of material revisions in estimates, if any, are reflected in the consolidated financial statements prospectively from the date of change in estimates.
While our significant accounting policies are described in more detail in the notes to our consolidated financial statements appearing elsewhere in this filing, we believe the following accounting policies used in the preparation of our consolidated financial statements require the most significant judgments and estimates.
Revenues
Our revenue is primarily derived from the sale of software products and delivery of consulting services.
On January 1, 2019, we adopted ASC 606, Revenue from Contracts with Customers, on a modified retrospective basis. Prior to January 1, 2019 size we applied ASC 605, Revenues Recognition, and Recognized Revenue, when the following criteria have been met: (1) persuasive evidence of an arrangement exists; (2) delivery has occurred or services have been rendered; (3) the price is fixed and determinable; and (4) collectability is reasonably assured.
Under ASC 606, we recognize revenue when control of the promised good or service is transferred to the customer in an amount that reflects the consideration for which we are expected to be entitled in exchange for those services.
Software Licenses and Support
License revenue includes perpetual license fees and term license fees, which provide customers with the same functionality and differ mainly in the duration over which the customer benefits from the use of software. Both revenues from perpetual license and term license performance obligations are generally recognized up front at the point in time when the software license has been delivered. A source of software license revenue is from term and bundled licenses that are time-based arrangements for one or multiple software products sold together with maintenance and support for the term of the license arrangement. We have determined that post-customer support and the right to unspecified enhancements and upgrades on a “when-and-if-available” basis included with term licenses is an immaterial component of the transaction price and, therefore, recognize these performance obligation components up front with the license when delivered.
Software Services
For contracts that include multiple performance obligations, such as a software license plus software training, implementation, and/or maintenance/support, or in contracts where there are multiple software licenses, the transaction price is allocated to each of the performance obligations on a pro-rata basis based on the relative standalone selling price
71
of each performance obligation. Maintenance services agreements consist of fees for providing software updates and for providing technical support for software products for a specified term. Revenues allocated to maintenance services are recognized ratably over the contract term beginning on the delivery date of each offering. Maintenance contracts generally have a term of one year. Expenses related to maintenance and subscription are recognized as incurred. While transfer of control of the software training and implementation performance obligations are performed over time, the services are typically started and completed within a few days. Due to the quick nature of the performance obligation from start to finish and the immaterial amounts, we recognize any software training or implementation revenue at the completion of the service. Any unrecognized portion of amounts paid in advance for licenses and services is recorded as deferred revenue.
License revenue and post-contract services are combined and reported as software revenue on the consolidated statements of operations and comprehensive loss.
Subscription Revenues
Subscription revenue consists of subscription fees for access to, and related support for, our cloud-based solutions. We typically invoice subscription fees in advance in annual installments and recognize subscription revenue ratably over the term of the applicable agreement, usually one to three years, which is initially deferred and recognized ratably over the life of the contract. Unearned maintenance and subscription revenues are recorded as deferred revenue. Our subscription services arrangements are generally non-cancelable and do not contain refund-type provisions. In rare instances that subscription services arrangements are deemed cancelable, we will adjust the transaction price and period for revenue recognition accordingly to be reflective of the contract term.
Services and Other Revenues
Services primarily represent advisory services, which may be either strategic consulting services, reporting and analysis services, regulatory writing services, or any combination of the three. Strategic consulting services consists of consulting, training, and process redesign that enables customers to identify which uncertainties are greatest and matter most and then to design development programs, trial sequences, and individual trials in such a way that those trials systematically reduce the identified uncertainties, in the most rapid and cost-effective manner possible. Our professional services contracts are time and materials, fixed fee, or prepaid. Services revenues are generally recognized over time as the services are performed. Revenues for fixed price services and prepaid are generally recognized over time applying input methods to estimate progress to completion. Training revenues are recognized as the services are performed over time.
Consortium revenues consist of contractual agreements with customers where the customer receives multiple benefits as part of their contract with the Company, as follows: access to the latest version simulator software, which has at least one new release per year, free access to a preset number of training workshops, a block of consulting hours to be used at the customer’s discretion, as well as voting rights at the annual consortium meeting where development priorities for the upcoming year are set. The Company’s consortium contracts are generally for three years with an annual termination clause and annual upfront billings. Consortium revenues are recognized over time as the benefits of the consortium arrangement are realized over the course of the contract. Both the training and consulting services performance obligations will utilize an output method to measure the progress at the end of each reporting period. As the simulation license was determined to be a functional license with the right to access, the license revenue is recognized evenly over the contract period.
Revenue Recognition under ASC 605
The adoption of ASC 606 changed the way we recognize revenue related to term and bundled license agreements. Prior to ASC 606, the Company recognized software licenses and support revenue in accordance with ASC 985, Software. Revenues from software license agreements are recognized when all of the following criteria are met as set forth in ASC 985: (1) persuasive evidence of an arrangement exists; (2) delivery has occurred; (3) the fee is fixed or determinable; and (4) collectability is reasonably assured.
72
A source of software license revenue is from term and bundled licenses that are time-based arrangements for one or multiple software products that are sold together with maintenance and support for the term of the license arrangement. The Company does not have vendor specific objective evidence (“VSOE”) to determine fair value of the maintenance and support in term arrangements and, therefore, recognizes revenues from these bundled time-based licenses ratably over the license term, which typically ranges from one to three years.
We allocate revenues from perpetual software arrangements involving multiple elements to each element based on the relative fair values as determined by the VSOE for each element. We limit our assessment of VSOE for each element to the price charged when the same element is sold separately. We analyzed all of the elements included in multiple-element arrangements and determined that the Company has sufficient VSOE to allocate revenues to maintenance and support, deployment, and training. We sell training separately and have established VSOE on this basis. VSOE for maintenance and support is determined based upon the renewal rates in contracts themselves, which is based on a fixed percentage of the current perpetual license list price. Deployment services are charged based on standard hourly rates. Accordingly, assuming all other revenue recognition criteria are met, revenues from perpetual licenses are recognized upon delivery of the software using the residual method in accordance with ASC 985.
Software maintenance agreements provide for technical support and the right to unspecified enhancements and upgrades on a “when-and-if-available” basis. Post-contract support revenues on perpetual agreements are recognized ratably over the term of the support period (generally one year). Deployment, training, and other service revenues are recognized as the related services are provided. Any unrecognized portion of amounts paid in advance for licenses and services is recorded as deferred revenue.
Equity-Based Compensation
Upon consummation of the IPO, vested Class B Units were exchanged by EQT for shares of common stock of the Company held by EQT, and unvested Class B Units were exchanged for shares of restricted common stock issued by the Company. While the Class B Units are no longer outstanding, the grant date fair value of the time-based vesting Class B Units will continue to be recognized over the remaining service period of the restricted common stock, and therefore our methods for estimating fair value of our Class B Units remains relevant.
We estimated the fair value of the Class B Units granted by EQT to certain Company employees using the Monte Carlo option pricing model in 2019 and the Black-Scholes option-pricing model in 2018. In order to derive an estimate of each security class of EQT, we first determined the enterprise value of EQT. To do this we used the enterprise value of the Company as a proxy because the primary asset of EQT is its investment in the Company and therefore the total enterprise value was assumed to be the same.
The three valuation methodologies used to determine the enterprise value, each of which was given equal weighting, include the following:
| ● | The Discounted Cash Flow Method (the “DCF Method”), a form of the Income Approach, was used to estimate the enterprise value by discounting the projected future free cash flows using an appropriate discount rate. We performed the DCF Method using a “debt-free” analysis, which entails estimating the free cash flows available to both debt and equity investors. The DCF Method incorporates several variables of observable and unobservable inputs, including, but not limited to, the Company’s prospective financial information and assumes outlays for capital expenditures, future terminal values, an effective tax rate assumption and a discount rate based on a number of factors including market interest rates, a weighted average cost of capital analysis based on an assumed capital structure, and includes adjustments for market risk and company specific risk. |
| ● | The Guideline Public Company Method (the “GPC Method”), a form of the Market Approach, was used to estimate the enterprise value by multiplying historical and anticipated financial metrics by a multiple that was derived from an analysis of comparable publicly traded companies. The GPC Method estimates enterprise value based on a comparison of our company to comparable public companies in a similar line of business. From the comparable companies, a representative market multiple is determined and subsequently applied to our historical and prospective financial results to estimate the enterprise value. |
73
| ● | The Merger and Acquisition Method, a form of the Market Approach, was used to estimate the enterprise value by multiplying historical financial metrics by a multiple that was derived from an analysis of companies that were the target of a merger or acquisition transaction. |
Application of these approaches involves the use of estimates, judgments and assumptions that are highly complex and subjective, including those regarding our future expected revenue, expenses, cash flows, discount rates, market multiples, the selection of comparable public companies and the probability of future events.
We then subtracted the interest-bearing debt from the enterprise value to determine the operating equity value. The operating equity value is then adjusted for cash and cash equivalents to determine the total equity value.
We then allocated the total equity value of EQT to the Class A Units and the various Class B Units, by utilizing the appropriate option pricing framework. We concluded on the fair value of the Class A Units and the various Class B Units by taking into consideration the relative rights and privileges of the various security classes as well as the following assumptions of the option pricing framework:
Expected Exercise Term. We estimate the expected life of equity awards based upon the timing of a potential liquidity event.
Expected Equity Volatility. Prior to filing the IPO, we were a private entity and therefore, the selected equity volatility was based on the historical and implied volatility of comparable publicly traded companies over a similar expected term. This is representative of the expected future equity volatility of the Company and of the equity volatility of EQT since its equity is similar.
Risk-Free Interest Rates. We based the risk-free interest rate on the rate for a U.S. Treasury zero-coupon issue with a term that closely approximates the expected life of the option grant at the date nearest the option grant date.
The concluded fair value of the Class A Units was taken into consideration as the strike price of some of the newly issued Class B Units through an iterative process, in order to determine the fair value of those newly issued Class B Units, since management’s intent was to issue those units as at-the-money equity awards.
The assumptions underlying these valuations represent management’s best estimates, which involve inherent uncertainties and the application of management’s judgment. As a result, if factors or expected outcomes change and we use significantly different assumptions or estimates, our equity-based compensation expense could be materially different.
Following the completion of the IPO, the fair value of our common stock is determined based on the quoted market price.
Goodwill and Other Intangible Assets
Goodwill is tested for impairment at the reporting unit level, which is one level below or the same as an operating segment. When testing goodwill for impairment, the Company first performs a qualitative assessment to determine whether it is necessary to perform step one of a two-step annual goodwill impairment test for each reporting unit. The Company is required to perform step one only if it concludes that it is more likely than not that a reporting unit’s fair value is less than its carrying value. Should this be the case, the first step of the two-step process is to identify whether a potential impairment exists by comparing the estimated fair values of the Company’s reporting units with their respective book values, including goodwill. If the estimated fair value of the reporting unit exceeds book value, goodwill is considered not to be impaired, and no additional steps are necessary. If, however, the fair value of the reporting unit is less than book value, then the second step is performed to determine if goodwill is impaired and to measure the amount of impairment loss, if any. The amount of the impairment loss is the excess of the carrying amount of the goodwill over its implied fair value. The estimate of implied fair value of goodwill is primarily based on an estimate of the discounted cash flows expected to result from that reporting unit but may require valuations of certain internally generated and unrecognized intangible assets such as the Company’s software, technology, patents, and trademarks. If the carrying
74
amount of goodwill exceeds the implied fair value of that goodwill, an impairment loss is recognized in an amount equal to the excess.
Other identifiable intangible assets with finite lives, such as software products acquired in acquisitions, non-compete agreements, tradenames, and customer relationship assets, are amortized over their estimated lives using either a straight-line method or a method based on pattern of expected economic benefit of the asset as follows: acquired software — three to ten years; non-compete agreements — two to five years; tradenames — 20 years; customer relationships — 11 to 16 years; and trademarks — 10 to 17 years. The Company evaluates finite intangible assets for impairment whenever events or changes in circumstances indicate that the carrying amount of the asset might not be recoverable. An impairment loss is recognized when estimated undiscounted future cash flows expected to result from the use of the asset are less than its carrying amount.
Software Development Costs
Software development costs are accounted for in accordance with ASC Subtopic 985-20 if the software is to be sold, leased or otherwise marketed, or by ASC Subtopic 350-40 if the software is for internal use. After the technological feasibility of the software has been established (for software to be marketed), or at the beginning of application development (for internal-use software), software development costs, which include primarily salaries and related payroll costs and costs of independent contractors incurred during development, are capitalized. Research and development costs incurred prior to the establishment of technological feasibility (for software to be marketed), or prior to application development (for internal-use software), are expensed as incurred. Software development costs are amortized on a product-by-product basis commencing on the date of general release of the products (for software to be marketed) or the date placed in service (for internal-use software).
JOBS Act Election
We qualify as an “emerging growth company” as defined in the JOBS Act. An emerging growth company may take advantage of reduced reporting requirements that are not otherwise applicable to public companies. These provisions include, but are not limited to:
| ● | being permitted to present only two years of audited financial statements and only two years of related ‘‘Management’s Discussion and Analysis of Financial Condition and Results of Operations’’ in our periodic reports and registration statements, including in this filing; |
| ● | not being required to comply with the auditor attestation requirements on the effectiveness of our internal controls over financial reporting; |
| ● | not being required to comply with any requirement that may be adopted by the Public Company Accounting Oversight Board regarding mandatory audit firm rotation or a supplement to the auditor’s report providing additional information about the audit and the financial statements (auditor discussion of critical audit matters); |
| ● | reduced disclosure obligations regarding executive compensation arrangements in our periodic reports, proxy statements and registration statements, including in this filing; and |
| ● | exemptions from the requirements of holding a nonbinding advisory vote on executive compensation and stockholder approval of any golden parachute payments not previously approved. |
We may use these provisions until the last day of our fiscal year in which the fifth anniversary of the completion of our IPO occurs.
However, if certain events occur prior to the end of such five-year period, including if we become a “large accelerated filer,” our annual gross revenues exceed $1.07 billion, or we issue more than $1.0 billion of non-convertible debt in any three-year period, we will cease to be an emerging growth company prior to the end of such five-year period.
75
The JOBS Act provides that an emerging growth company can take advantage of an extended transition period for complying with new or revised accounting standards until those standards apply to private companies. We have elected to take advantage of the benefits of this extended transition period and, therefore, we will not be subject to the same new or revised accounting standards as other public companies that are not emerging growth companies. Our financial statements may therefore not be comparable to those of companies that comply with such new or revised accounting standards. Until the date that we are no longer an emerging growth company or affirmatively and irrevocably opt out of the exemption provided by Section 7(a)(2)(B) of the Securities Act of 1933, as amended, upon issuance of a new or revised accounting standard that applies to our financial statements and that has a different effective date for public and private companies, we will disclose the date on which we will adopt the recently issued accounting standard.
Recently Adopted and Issued Accounting Standards
We have reviewed all recently issued standards and have determined that, other than as disclosed in Note 2 to our consolidated financial statements appearing elsewhere in this filing, such standards will not have a material impact on our consolidated financial statements or do not otherwise apply to our operations.
Item 7A. Quantitative and Qualitative Disclosures About Market Risk.
Market risk is broadly defined as potential economic losses due to adverse changes in the fair value of a financial instrument. In the normal course of business, we are exposed to market risks, including foreign currency exchange rate risk and interest rate risk.
Foreign Currency Exchange Rate Risk
We are exposed to foreign currency exchange rate risk by virtue of our international operations. This risk arises because we use different currencies to recognize revenue and pay operating expenses. We derived 26% of our revenue for the year ended December 31, 2020 from operations outside of the United States. Our strategy for managing foreign currency risk relies on efforts to negotiate customer contracts to receive payment in the same currency used to pay expenses. As of December 31, 2020, we had no outstanding foreign currency forward contracts. Foreign currency exchange rate risk is evidenced in our consolidated financial statements through translation risk and transaction and re-measurement risk.
Translation Risk
We are exposed to movements in foreign currencies, predominately in U.S. dollars, pounds sterling, euros, or Japanese yen, with the majority in U.S. dollars. The vast majority of our contracts are entered into by our U.S. and U.K., E.U., and Japanese subsidiaries. Contracts entered into by our U.S. subsidiaries are almost always denominated in U.S. dollars. Contracts entered into by our other subsidiaries are generally denominated in U.S. dollars, pounds sterling, euros, or Japanese yen, with the majority in U.S. dollars. If the U.S. dollar had weakened 10% relative to the pound sterling, the euro, and the Japanese yen in the year ended December 31, 2020, income from operations would have been lower by approximately $1.7 million, based on revenues and costs related to our foreign operations.
Changes in exchange rates between the applicable foreign currency and the U.S. dollar will affect the translation of foreign subsidiaries’ financial results into U.S. dollars for purposes of reporting our consolidated financial results. The process by which we translate each foreign subsidiary’s financial results to U.S. dollars is as follows:
| ● | we translate statement of operations accounts at the exchange rates on the dates those elements are recognized or the average exchange rates for the relevant monthly period; |
| ● | we translate balance sheet asset and liability accounts at the end of period exchange rates; and |
| ● | we translate equity accounts at historical exchange rates. |
76
Translation of the balance sheet in this manner affects stockholders’ equity through the foreign currency translation adjustment account. This account exists only in the foreign subsidiary’s U.S. dollar balance sheet and is necessary to keep the foreign balance sheet, stated in U.S. dollars, in balance.
We report translation adjustments within accumulated other comprehensive loss as a separate component of stockholders’ deficit on our consolidated balance sheets. Gains or losses from translating amounts in foreign currencies are recorded in other comprehensive income or other comprehensive loss on our consolidated statements of operations and comprehensive loss.
Transaction and Re-measurement Risk
We have currency risk resulting from the passage of time between the recognition of revenue, invoicing of customers under contracts, and the collection of payment. If a contract is denominated in a currency other than the subsidiary’s functional currency, we recognize an unbilled services asset at the time of revenue recognition and a receivable at the time of invoicing for the local currency equivalent of the foreign currency invoice amount. Changes in exchange rates from the time we recognize revenue until the time the customer pays will result in our receiving either more or less in local currency than the amount that was originally invoiced. We recognize this difference as a foreign currency transaction gain or loss, as applicable.
We also have currency risk as a result of intercompany loans or other intercompany borrowings throughout our organization when such intercompany debt is denominated in a currency other than the subsidiary’s functional currency. Changes in exchange rates from the time a subsidiary records the intercompany debt until the time the subsidiary pays the intercompany debt will result in a foreign currency transaction gain or loss. We record all foreign currency transaction and re-measurement gains and losses as other income (expense), net on the consolidated statement of operations and comprehensive loss. We do not have significant operations in countries considered highly inflationary.
Interest Rate Risk
We have borrowings under our Credit Agreement that bear interest at a rate per annum equal to either (a) the Eurocurrency rate, with a floor of 0.0%, as adjusted for the reserve percentage required under regulations issued by the Federal Reserve Board for determining maximum reserve requirements with respect to Eurocurrency funding, plus an applicable margin rate of 3.5% for the term loan and between 4.0% and 3.5% for revolving credit loans, depending on the applicable first lien leverage ratio or (b) an ABR, with a floor of 1.00%, plus an applicable margin rate of 2.5% for the term loan or between 3.0% and 2.5% for revolving credit loans, depending on the applicable first lien leverage ratio.
The ABR is determined as the greatest of (a) the prime rate, (b) the federal funds effective rate, plus 0.5% or (c) the Eurocurrency rate plus 1.0%. As of December 31, 2020, we had $304.1 million of outstanding borrowings on the term loan, no outstanding borrowings under the revolving credit facility and an outstanding letter of credit of $0.1 million under the Credit Agreement.
Each quarter-point increase in the Eurocurrency rate would increase interest expense on our current variable rate debt by approximately $0.2 million for the year ended December 31, 2020. Our exposure to interest rate risk is minimized by our interest rate swaps. As of December 31, 2020, we recorded the fair value of our interest rate swaps in the amount of $3.7 million as a derivative liability.
Other Risk
Although we perform services for customers located in a number of jurisdictions, we have not experienced any material difficulties in receiving funds remitted from foreign countries. However, new or modified exchange control restrictions could have an adverse effect on our ability to repatriate cash to fund our operations and make principal and interest payments, when necessary.
77
Item 8. Financial Statements and Supplementary Data.
Certara, Inc.
Index to Consolidated Financial Statements
| PAGE |
| |
79 | |
80 | |
Consolidated Statements of Operations and Comprehensive Loss | 81 |
82 | |
83 | |
84 |
78
REPORT OF INDEPENDENT REGISTERED PUBLIC ACCOUNTING FIRM
Board of Directors and Stockholders of
Certara, Inc.
Opinion on the Financial Statements
We have audited the accompanying consolidated balance sheets of Certara, Inc. and Subsidiaries (the “Company”) as of December 31, 2020 and 2019, and the related consolidated statements of operations and comprehensive loss, stockholders’ equity, and cash flows for each of the three years in the period ended December 31, 2020, and the related notes (collectively referred to as the “consolidated financial statements”). In our opinion, the consolidated financial statements present fairly, in all material respects, the financial position of Certara, Inc. and Subsidiaries as of December 31, 2020 and 2019, and the results of their operations and their cash flows for each of the three years in the period ended December 31, 2020, in conformity with accounting principles generally accepted in the United States of America.
Basis for Opinion
These consolidated financial statements are the responsibility of the Company’s management. Our responsibility is to express an opinion on these consolidated financial statements based on our audits. We are a public accounting firm registered with the Public Company Accounting Oversight Board (United States) (“PCAOB”) and are required to be independent with respect to the Company in accordance with the U.S. federal securities laws and the applicable rules and regulations of the Securities and Exchange Commission and the PCAOB.
We conducted our audits in accordance with the standards of the PCAOB. Those standards require that we plan and perform the audit to obtain reasonable assurance about whether the consolidated financial statements are free of material misstatement, whether due to error or fraud. The Company is not required to have, nor were we engaged to perform, an audit of its internal control over financial reporting. As part of our audits, we are required to obtain an understanding of internal control over financial reporting, but not for the purpose of expressing an opinion on the effectiveness of the Company’s internal control over financial reporting. Accordingly, we express no such opinion.
Our audits included performing procedures to assess the risks of material misstatement of the consolidated financial statements, whether due to error or fraud, and performing procedures that respond to those risks. Such procedures included examining, on a test basis, evidence regarding the amounts and disclosures in the consolidated financial statements. Our audits also included evaluating the accounting principles used and significant estimates made by management, as well as evaluating the overall presentation of the consolidated financial statements. We believe that our audits provide a reasonable basis for our opinion.
Adoption of New Accounting Standard
As discussed in Note 2 to the consolidated financial statements, Certara, Inc. and Subsidiaries adopted Accounting Standard Codification ASU 2014-09, Revenue from Contracts with Customers (“Topic 606”), beginning January 1, 2019, using the modified retrospective method.
/s/CohnReznick LLP
Tysons, Virginia
March 15, 2021
We have served as Certara, Inc. and Subsidiaries’ auditor since October 2019.
79
CERTARA, INC. AND SUBSIDIARIES
| | DECEMBER 31, | ||||
(IN THOUSANDS, EXCEPT PER SHARE AND SHARE DATA) | | 2020 |
| 2019 | ||
Assets | | |
|
| |
|
Current assets: | | |
|
| |
|
Cash and cash equivalents | | $ | 271,382 | | $ | 29,256 |
Accounts receivable, net of allowance for doubtful accounts of $132 and $185, respectively | |
| 54,091 | |
| 49,642 |
Restricted cash | |
| 1,909 | |
| 506 |
Prepaid expenses and other current assets | |
| 19,202 | |
| 8,119 |
Total current assets | |
| 346,584 | |
| 87,523 |
Other assets: | |
|
| |
|
|
Property and equipment, net | |
| 3,872 | |
| 4,623 |
Long-term deposits | |
| 1,163 | |
| 1,096 |
Goodwill | |
| 518,592 | |
| 514,996 |
Intangible assets, net of accumulated amortization of $127,172 and $85,925, respectively | |
| 396,445 | |
| 427,998 |
Deferred income taxes | |
| 2,744 | |
| 833 |
Total assets | | $ | 1,269,400 | | $ | 1,037,069 |
Liabilities and stockholders’ equity | |
|
| |
|
|
Current liabilities: | |
|
| |
|
|
Accounts payable | | $ | 6,394 | | $ | 4,917 |
Accrued expenses | |
| 30,729 | |
| 27,036 |
Current portion of deferred revenue | |
| 30,662 | |
| 26,240 |
Current portion of interest rate swap liability | |
| 2,605 | |
| 551 |
Current portion of long-term debt | |
| 4,680 | |
| 4,210 |
Current portion of capital lease obligations | |
| 275 | |
| 48 |
Total current liabilities | |
| 75,345 | |
| 63,002 |
Long-term liabilities: | |
|
| |
|
|
Capital lease obligations, net of current portion | |
| 318 | |
| — |
Deferred revenue, net of current portion | |
| 545 | |
| 1,137 |
Deferred income taxes | |
| 75,894 | |
| 82,160 |
Long-term portion of interest rate swap liability | |
| 1,066 | |
| 1,601 |
Long-term debt, net of current portion and debt discount | |
| 294,100 | |
| 397,121 |
Total liabilities | |
| 447,268 | |
| 545,021 |
Commitments and contingencies | |
|
| |
|
|
Stockholders' equity | |
|
| |
|
|
Preferred shares, $0.01 par value, 50,000,000 and no shares authorized as of December 31, 2020 and 2019, respectively, no shares issued and outstanding as of December 31, 2020 and 2019, respectively | | | — | | | — |
Common shares, $0.01 par value, 600,000,000 shares authorized, 152,979,479 and 132,407,786 shares issued and outstanding as of December 31, 2020 and 2019, respectively | |
| 1,529 | |
| 1,324 |
Additional paid-in capital | |
| 884,528 | |
| 509,162 |
Accumulated deficit | |
| (62,338) | |
| (12,941) |
Accumulated other comprehensive loss | |
| (1,587) | |
| (5,497) |
Total stockholders’ equity | |
| 822,132 | |
| 492,048 |
Total liabilities and stockholders’ equity | | $ | 1,269,400 | | $ | 1,037,069 |
The accompanying notes are an integral part of the consolidated financial statements
80
CERTARA, INC. AND SUBSIDIARIES
CONSOLIDATED STATEMENTS OF OPERATIONS AND COMPREHENSIVE LOSS
| | YEAR ENDED DECEMBER 31, | |||||||
(IN THOUSANDS, EXCEPT PER SHARE AND SHARE DATA) |
| 2020 |
| 2019 |
| 2018 | |||
Revenues | | $ | 243,530 | | $ | 208,511 | | $ | 163,719 |
Cost of revenues | |
| 100,765 | |
| 79,770 | | | 71,043 |
Operating expenses: | |
| | |
| | | | |
Sales and marketing | |
| 19,202 | |
| 10,732 | | | 9,416 |
Research and development | |
| 19,644 | |
| 11,633 | | | 10,478 |
General and administrative | |
| 88,482 | |
| 47,926 | | | 43,393 |
Intangible asset amortization | |
| 37,414 | |
| 36,241 | | | 31,625 |
Depreciation and amortization expense | |
| 2,443 | |
| 2,596 | | | 2,416 |
Total operating expenses | |
| 167,185 | |
| 109,128 | | | 97,328 |
Income (loss) from operations | |
| (24,420) | |
| 19,613 | | | (4,652) |
Other income (expenses): | |
| | |
| | | | |
Interest expense | |
| (25,296) | |
| (28,004) | | | (27,802) |
Miscellaneous, net | |
| (465) | |
| (760) | | | (107) |
Total other income (expenses) | |
| (25,761) | |
| (28,764) | | | (27,909) |
Loss before income taxes | |
| (50,181) | |
| (9,151) | | | (32,561) |
(Benefit from) provision for income taxes | |
| (784) | |
| (225) | | | 697 |
Net loss | |
| (49,397) | |
| (8,926) | | | (33,258) |
Other comprehensive income (loss) | |
| | |
| | | | |
Foreign currency translation adjustment, net of tax of $(277), $267, and $(1,437) | |
| 5,045 | |
| 433 | | | (16,721) |
Change in fair value of interest rate swap, net of tax of $(384), $(520), and $0 | |
| (1,135) | |
| (4,283) | | | 1,079 |
Total other comprehensive income (loss) | |
| 3,910 | |
| (3,850) | | | (15,642) |
Comprehensive loss | | $ | (45,487) | | $ | (12,776) | | $ | (48,900) |
Net loss per common share – basic and diluted | | $ | (0.37) | | $ | (0.07) | | $ | (0.25) |
Basic and diluted weighted average common shares outstanding | |
| 133,247,212 | |
| 132,407,786 | | | 132,407,786 |
The accompanying notes are an integral part of the consolidated financial statements
81
CERTARA, INC. AND SUBSIDIARIES
CONSOLIDATED STATEMENTS OF STOCKHOLDERS’ EQUITY
| | | | | | | | | | RETAINED | | ACCUMULATED | | | | ||
| | | | | | | | | | EARNINGS | | OTHER | | TOTAL | |||
| | COMMON STOCK | | ADDITIONAL | | (ACCUMULATED | | COMPREHENSIVE | | STOCKHOLDER’S | |||||||
(IN THOUSANDS, EXCEPT SHARE DATA) |
| SHARES |
| AMOUNT |
| PAID-IN CAPITAL |
| DEFICIT) |
| INCOME (LOSS) |
| EQUITY | |||||
Balance as of December 31, 2017 | | 132,407,786 | | $ | 1,324 | | $ | 505,803 | | $ | 18,826 | | $ | 13,995 | | $ | 539,948 |
Equity compensation | | — | | | — | | | 1,711 | | | — | | | — | | | 1,711 |
Capital contributions | | — | | | — | | | 1,110 | | | — | | | — | | | 1,110 |
Repurchase of Parent Class B Units | | — | | | — | | | (1,100) | | | — | | | — | | | (1,100) |
Change in fair value of interest rate swap, net of tax | | — | | | — | | | — | | | — | | | 1,079 | | | 1,079 |
Net loss | | — | | | — | | | — | | | (33,258) | | | — | | | (33,258) |
Foreign currency translation adjustment | | — | | | — | | | — | | | — | | | (16,721) | | | (16,721) |
Balance as of December 31, 2018 |
| 132,407,786 | | | 1,324 | | | 507,524 | | | (14,432) | | | (1,647) | | | 492,769 |
Cumulative effect adjustment upon adoption of Topic 606 |
| — | |
| — | |
| — | |
| 10,417 | |
| — | |
| 10,417 |
Equity compensation |
| — | |
| — | |
| 1,691 | |
| — | |
| — | |
| 1,691 |
Repurchases of Parent Class B Units |
| — | |
| — | |
| (703) | |
| — | |
| — | |
| (703) |
Capital contributions |
| — | |
| — | |
| 650 | |
| — | |
| — | |
| 650 |
Change in fair value of interest rate swap, net of tax |
| — | |
| — | |
| — | |
| — | |
| (4,283) | |
| (4,283) |
Net loss |
| — | |
| — | |
| — | |
| (8,926) | |
| — | |
| (8,926) |
Foreign currency translation adjustment |
| — | |
| — | |
| — | |
| — | |
| 433 | |
| 433 |
Balance as of December 31, 2019 |
| 132,407,786 | | $ | 1,324 | | $ | 509,162 | | $ | (12,941) | | $ | (5,497) | | $ | 492,048 |
Equity compensation |
| — | |
| — | |
| 64,507 | |
| — | |
| — | |
| 64,507 |
Repurchases of Parent Class B Units |
| — | |
| — | |
| (1,079) | |
| — | |
| — | |
| (1,079) |
Capital contributions |
| — | |
| — | |
| 250 | |
| — | |
| — | |
| 250 |
Issuance of common stock upon initial public offering, net |
| 14,630,000 | |
| 146 | |
| 311,747 | |
| — | |
| — | |
| 311,893 |
Issuance of restricted stock |
| 5,941,693 | |
| 59 | |
| (59) | |
| — | |
| — | |
| — |
Change in fair value of interest rate swap, net of tax | | — | | | — | | | — | | | — | | | (1,135) | | | (1,135) |
Net loss | | — | | | — | | | — | | | (49,397) | | | — | | | (49,397) |
Foreign currency translation adjustment, net of tax | | — | | | — | | | — | | | — | | | 5,045 | | | 5,045 |
Balance as of December 31, 2020 |
| 152,979,479 | | $ | 1,529 | | $ | 884,528 | | $ | (62,338) | | $ | (1,587) | | $ | 822,132 |
The accompanying notes are an integral part of the consolidated financial statements
82
CERTARA, INC. AND SUBSIDIARIES
CONSOLIDATED STATEMENTS OF CASH FLOWS
| | YEAR ENDED DECEMBER 31, | |||||||
(IN THOUSANDS) |
| 2020 |
| 2019 |
| 2018 | |||
Cash flows from operating activities: |
| |
|
| |
| | | |
Net loss | | $ | (49,397) | | $ | (8,926) | | $ | (33,258) |
Adjustments to reconcile net loss to net cash provided by operating activities: | |
| | |
| | | | |
Depreciation and amortization of property and equipment | |
| 2,443 | |
| 2,596 | | | 2,416 |
Amortization of intangible assets | |
| 40,310 | |
| 38,964 | | | 34,595 |
Amortization of debt issuance costs | |
| 1,520 | |
| 1,536 | | | 1,517 |
(Recovery of) provision for doubtful accounts | |
| (53) | |
| 10 | | | (250) |
Loss on retirement of assets | |
| 19 | |
| 113 | | | 91 |
Equity compensation expense | |
| 64,507 | |
| 1,691 | | | 1,711 |
Deferred income taxes | |
| (7,825) | |
| (6,703) | | | (3,548) |
Changes in assets and liabilities, net of acquisitions: | |
| | |
| | | | |
Accounts receivable | |
| (3,932) | |
| (1,521) | | | (2,031) |
Prepaid expenses and other assets | |
| (8,257) | |
| (1,831) | | | (2,614) |
Accounts payable and accrued expenses | |
| 2,381 | |
| 10,031 | | | (6,357) |
Deferred revenue | |
| 3,094 | |
| 2,065 | | | 19,320 |
Net cash provided by operating activities | |
| 44,810 | |
| 38,025 | | | 11,592 |
Cash flows from investing activities: | |
|
| |
|
| | | |
Capital expenditures | |
| (863) | |
| (2,107) | | | (4,758) |
Capitalized development costs | |
| (7,074) | |
| (7,410) | | | (6,727) |
Business acquisitions, net of cash acquired | |
| (675) | |
| — | | | (62,420) |
Net cash used in investing activities | |
| (8,612) | |
| (9,517) | | | (73,905) |
Cash flows from financing activities: | |
|
| |
|
| | | |
Capital contributions | |
| 250 | |
| 650 | | | 1,110 |
Unit repurchase | |
| (1,079) | |
| (703) | | | (1,100) |
Proceeds from issuance of common stock upon initial public offering, net of underwriters’ discounts and commissions | | | 316,301 | | | — | | | — |
Proceeds from borrowings on long-term debt | |
| — | |
| — | | | 65,000 |
Payments on long-term debt and capital lease obligations | |
| (104,358) | |
| (3,436) | | | (3,981) |
Proceeds from line of credit | |
| 19,880 | |
| — | | | 10,000 |
Payments on line of credit | |
| (19,880) | |
| (5,000) | | | (5,000) |
Payments of deferred offering costs | | | (2,900) | | | — | | | — |
Payment of debt issuance costs | | | — | | | — | | | (1,063) |
Payment of contingent consideration obligations | | | — | | | — | | | (7,670) |
Net cash provided by (used in) financing activities | |
| 208,214 | |
| (8,489) | | | 57,296 |
Effect of foreign exchange rate changes on cash, cash equivalents, and restricted cash | |
| (883) | |
| (2,444) | | | (1,337) |
Net increase (decrease) in cash, cash equivalents, and restricted cash | |
| 243,529 | |
| 17,575 | | | (6,354) |
Cash, cash equivalents, and restricted cash, at beginning of year | |
| 29,762 | |
| 12,187 | | | 18,541 |
Cash, cash equivalents, and restricted cash, at end of year | | $ | 273,291 | | $ | 29,762 | | $ | 12,187 |
Supplemental disclosures of cash flow information | |
|
| |
|
| | | |
Cash paid for interest | | $ | 27,607 | | $ | 26,428 | | $ | 25,713 |
Cash paid for taxes | | $ | 12,278 | | $ | 4,109 | | $ | 3,165 |
Supplemental schedule of noncash investing and financing activities | |
| | |
| | | | |
Liabilities assumed in connection with business acquisition | | $ | — | | $ | — | | $ | 12,805 |
Property and equipment controlled through new capital leases | | $ | 831 | | $ | — | | $ | — |
Deferred offering costs, accrued but not paid | | $ | 1,767 | | $ | — | | $ | — |
The accompanying notes are an integral part of the consolidated financial statements
83
CERTARA, INC. AND SUBSIDIARIES
NOTES TO THE CONSOLIDATED FINANCIAL STATEMENTS
(IN THOUSANDS, EXCEPT PER SHARE PERCENTAGES AND SHARE AND UNIT DATA)
1. Description of Business
Certara, Inc. and its wholly-owned subsidiaries (together, the “Company”) deliver software products and technology-enabled services to customers to efficiently carry out and realize the full benefits of biosimulation in drug discovery, preclinincal and clinical research, regulatory submissions and market access. The Company is a global leader in biosimulation, and the Company’s biosimulation software and technology-enabled services help optimize, streamline, or even waive certain clinical trials to accelerate programs, reduce costs, and increase the probability of success. The Company’s regulatory science and market access software and services are underpinned by technologies such as regulatory submissions software, natural language processing, and Bayesian analytics. When combined, these solutions allow the Company to offer customers end-to-end support across the entire product life cycle. On October 1, 2020, the Company amended the certificate of incorporation of EQT Avatar Topco, Inc. to change the name of the Company to Certara, Inc.
The Company has operations in the United States, Canada, Spain, Luxembourg, Portugal, United Kingdom, Germany, France, Netherlands, Denmark, Switzerland, Italy, Poland, Japan, Philippines, India and Australia.
2. Summary of Significant Accounting Policies
(a) Basis of Presentation and Use of Estimates
The preparation of consolidated financial statements in conformity with U.S. generally accepted accounting principles (“U.S. GAAP”) requires management to make estimates and assumptions that affect the reported amounts of assets, liabilities, disclosure of contingent assets and liabilities at the date of the consolidated financial statements and the reported amounts of revenues and expenses during the reporting period. Significant estimates include, among other estimates, the determination of fair values and useful lives of long-lived assets as well as intangible assets, goodwill, allowance for doubtful accounts receivable, recoverability of deferred tax assets, recognition of deferred revenue (including at the date of business combinations), value of interest rate swaps, determination of fair value of equity-based awards and assumptions used in testing for impairment of long-lived assets. Actual results could differ from those estimates, and such differences may be material to the consolidated financial statements.
The Company is an Emerging Growth Company, as defined in the Jumpstart Our Business Startups Act of 2012 (the “JOBS Act”). Under the JOBS Act, Emerging Growth Companies can delay adopting new or revised accounting standards issued subsequent to the enactment of the JOBS Act until such time as those standards apply to private companies. The Company has elected to use this extended transition period for complying with new or revised accounting standards that have different effective dates for public and private companies until the earlier of the date that it (i) is no longer an Emerging Growth Company or (ii) it affirmatively and irrevocably opts out of the extended transition period provided in the JOBS Act. As a result, these financial statements may not be comparable to companies that comply with the new or revised accounting pronouncements as of public company effective dates. The adoption dates discussed below reflect this election.
(b) Recently Adopted Accounting Pronouncements
In March 2020, the Financial Accounting Standards Board (“FASB”) issued Accounting Standards Update (“ASU”) 2020-04, “Reference Rate Reform (Topic 848),” which contains practical expedients for reference rate reform related activities that impact debt, leases, derivatives and other contracts. The guidance in ASU 2020-04 is optional and may be elected over time as reference rate reform activities occur. The Company adopted ASU 2020-04 upon issuance and elected to apply the hedge accounting expedients related to probability and the assessments of effectiveness for future LIBOR-indexed cash flows to assume that the index upon which future hedged transactions will be based matches the index on the corresponding derivatives. Application of these expedients preserves the presentation of derivatives
84
consistent with past presentation. The impact of adopting ASU 2020-04 did not have a material impact to the Company’s consolidated financial statements.
In August 2018, the FASB issued ASU 2018-15, “Customer’s Accounting for Implementation Costs Incurred in a Cloud Computing Arrangement that is a Service Contract,” which included updated guidance on ASC 350-40 “Intangibles — Goodwill and Other — Internal-Use Software”. The new guidance requires a customer in a cloud computing arrangement that is a service contract to follow the internal-use software guidance in ASC 350-40 to determine which implementation costs to capitalize as assets or expense as incurred. The Company adopted ASU 2018-15 on January 1, 2020. The impact of adopting ASU 2018-15 did not have a material impact to the Company’s consolidated financial statements.
In August 2018, the FASB issued ASU 2018-13, “Changes to Disclosure Requirements for Fair Value Measurements (Topic 820)”, which improved the effectiveness of disclosure requirements for recurring and nonrecurring fair value measurements. The standard removes, modifies, and adds certain disclosure requirements. The Company adopted ASU 2018-13 on January 1, 2020. The impact of adopting ASU 2018-13 did not have a material impact to the Company’s consolidated financial statements.
In May 2014, the FASB issued ASU 2014-09, “Revenue from Contracts with Customers” (“Topic 606”). Subsequent to the issuance of Topic 606, the FASB clarified the guidance through several ASUs, referred to as ASC 606. This guidance represents a comprehensive new revenue recognition model that requires a company to recognize revenue to depict the transfer of promised goods or services to customers in an amount that reflects the consideration to which that company expects to be entitled to receive in exchange for those goods or services. This update sets forth a new five-step revenue recognition model which replaces the prior revenue recognition guidance in its entirety.
On January 1, 2019, the Company adopted ASC 606, using the modified retrospective method, applied to all contracts not completed as of the date of adoption. This method requires the cumulative effect of the adoption to be recognized as an adjustment to opening retained earnings or accumulated deficit in the period of adoption. The effects of adopting ASC 606 were a decrease of $10,417, net of taxes of $3,325, to accumulated deficit as of January 1, 2019, for the cumulative effect on prior years of having adopted the new standard, a decrease in deferred revenues of $13,587, an increase in deferred taxes of $3,325, and a decrease in cumulative translation adjustment of $155. These adjustments are a result of the upfront recognition of license revenues from term licenses.
Financial results for reporting periods beginning January 1, 2019 are presented under ASC 606, while prior period amounts were not adjusted and continue to be reported in accordance with the historical accounting guidance under ASC Topic 605.
In November 2016, the FASB issued ASU 2016-18 “Statement of Cash Flows (Topic 230): Restricted Cash”. ASU 2016-18 requires entities to show the changes in the total of cash, cash equivalents, restricted cash and restricted cash equivalents in the statement of cash flows. As a result, entities will no longer present transfers between cash and cash equivalents and restricted cash and restricted cash equivalents in the statement of cash flows. The ASU requires changes in the Company’s restricted cash to be classified as either operating activities, investing activities or financing activities in the Consolidated Statements of Cash Flows, depending on the nature of the activities that gave rise to the restriction. The new standard is effective for annual reporting periods beginning after December 15, 2018. Retrospective transition method is to be applied to each period presented. The Company adopted ASU 2016-18 on January 1, 2019. The adoption of ASU 2016-18 did not have a material impact to the Company’s consolidated financial statements.
In February 2018, the FASB issued ASU No. 2018-02, “Income Statement — Reporting Comprehensive Income (Topic 220): Reclassification of Certain Tax Effects from Accumulated Other Comprehensive Income”. The amendments in this update allow a reclassification from accumulated other comprehensive income (“AOCI”) to retained earnings for adjustments to the tax effect of items in AOCI, that were originally recognized in other comprehensive income, related to the new statutory rate prescribed in the Tax Cuts and Jobs Act (“TCJA”) enacted on December 22, 2017, which reduced the US federal corporate tax rate from 35% to 21%. The amendments in this update should be applied either in the period of adoption or retrospectively to each period (or periods) in which the effect of the change in the US federal
85
corporate income tax rate in the TCJA is recognized. The adoption of this standard on January 1, 2019 had no impact to the Company’s consolidated financial statements.
(c) Accounting Pronouncements Not Yet Adopted
In December 2019, the FASB issued ASU No. 2019-12, “Simplifying the Accounting for Income Taxes” which removes certain exceptions related to the approach for intra-period tax allocation, the methodology for calculating income taxes in an interim period, the recognition of deferred tax liabilities for outside basis differences and clarifies the accounting for transactions that result in a step-up in the tax basis of goodwill. The Company will adopt ASU 2019-12 during the year beginning January 1, 2021 and is currently evaluating the impact of the new guidance on its consolidated financial statements.
In February 2016, the FASB issued ASU 2016-02, “Leases.” ASU 2016-02 establishes a right-of-use (“ROU”) model that requires a lessee to record a ROU asset and a lease liability on the balance sheet for all leases with terms longer than 12 months. Leases will be classified as either finance or operating, with classification affecting the pattern of expense recognition in the income statement. A modified retrospective transition approach is required for lessees for capital and operating leases existing at, or entered into after, the beginning of the earliest comparative period presented in the financial statements, with certain practical expedients available. In its April 2020 meeting, FASB deferred the effective date for ASC 842 for private companies to fiscal years beginning after December 15, 2021, and interim periods within fiscal years beginning after December 15, 2022. The Company will adopt ASU 2016-02 during the year beginning January 1, 2022 and is currently evaluating the impact of adopting this guidance on its consolidated financial statements.
In June 2016, the FASB issued ASU 2016-13 “Financial Instruments — Credit Losses (Topic 326): Measurement of Credit Losses on Financial Instruments” (ASU 2016-13). ASU 2016-13 changes the impairment model for most financial assets and certain other instruments. For trade and other receivables, held-to-maturity debt securities, loans, and other instruments, entities will be required to use a new forward-looking “expected loss” model that generally will result in the earlier recognition of allowances for losses. The guidance also requires increased disclosures. Per ASU 2019-10 issued in November 2019, ASU 2016-13 is effective for fiscal years beginning after December 15, 2022, including interim periods within those fiscal years for private companies. Early adoption is permitted. The Company will adopt ASU 2016-13 during the year beginning January 1, 2023 and is currently evaluating the impact of adopting this guidance on its consolidated financial statements.
In January 2017, the FASB issued ASU 2017-04, “Intangibles — Goodwill and Other (Topic 350): Simplifying the Accounting for Goodwill Impairment”. ASU 2017-04 removes Step 2 of the goodwill impairment test, which requires a hypothetical purchase price allocation. A goodwill impairment will now be the amount by which a reporting unit’s carrying value exceeds its fair value, not to exceed the carrying amount of goodwill. This standard will be effective for a private company (and thus, for those adopting exemption for Emerging Growth Companies) beginning in the first quarter of fiscal year 2022 and is required to be applied prospectively. Early adoption is permitted for interim or annual goodwill impairment tests performed on testing dates after January 1, 2017. The Company will adopt ASU 2017-04 during the year beginning January 1, 2022 and is currently evaluating the impact of adopting this guidance on its consolidated financial statements.
(d) Principles of Consolidation
The accompanying consolidated financial statements include the accounts of the Company and its wholly owned subsidiaries. All intercompany balances and transactions have been eliminated in consolidation.
(e) Fair Value Measurements
The Company follows FASB ASC 820-10, “Fair Value Measurements,” which defines fair value, establishes a framework for measuring fair value in U.S. GAAP, and requires certain disclosures about fair value measurements.
86
ASC 820-10 defines fair value as the exchange price that would be received for an asset or paid to transfer a liability (an exit price) in the most advantageous market for the asset or liability in an orderly transaction. Fair value measurement is based on a hierarchy of observable or unobservable inputs. The standard describes three levels of inputs that may be used to measure fair value.
Level 1 — Inputs to the valuation methodology are quoted prices available in active markets for identical securities as of the reporting date;
Level 2 — Inputs to the valuation methodology are other significant observable inputs, including quoted prices for similar securities, interest rates, credit risk etc. as of the reporting date, and the fair value can be determined through the use of models or other valuation methodologies; and
Level 3 — Inputs to the valuation methodology are unobservable inputs in situations where there is little, or no market activity of the securities and the reporting entity makes estimates and assumptions relating to the pricing of the securities including assumptions regarding risk.
If the inputs used to measure fair value fall in different levels of the fair value hierarchy, the hierarchy is based upon the lowest level of input that is significant to the fair value measurement. For the acquisitions noted in Note 5, the fair value measurement methods used to estimate the fair value of the assets acquired and liabilities assumed at the acquisition dates utilized a number of significant unobservable inputs of Level 3 assumptions. These assumptions included, among other things, projections of future operating results, implied fair value of assets using an income approach by preparing a discounted cash flow analysis, and other subjective assumptions.
Interest rate swaps are valued in the market using discounted cash flows techniques. These techniques incorporate Level 1 and Level 2 inputs. The market inputs are utilized in the discounted cash flows’ calculation considering the instrument’s term, notional amount, discount rate and credit risk. Significant inputs to the derivative instrument valuation model for interest rate swaps are observable in active markets and are classified as Level 2 in the hierarchy.
(f) Cash, Cash Equivalents and Restricted Cash
Cash equivalents include highly-liquid investments with maturities of three months or less from the date purchased. At times, cash balances held at financial institutions were in excess of the Federal Deposit Insurance Corporation’s (“FDIC”) insured limits; however, the Company primarily places its temporary cash with high-credit quality financial institutions. The Company has never experienced losses related to these balances and believes it is not exposed to any significant credit risk on cash.
Restricted cash represents cash that is used as collateral to support an unsecured Company credit card program through a major bank and unexpended restricted grant funds. The restricted cash balance was $1,909 and $506 at December 31, 2020 and 2019, respectively.
As of December 31, 2020 and 2019, the carrying values reflected in the Consolidated Balance Sheets reasonably approximate the fair values for cash, cash equivalents and restricted cash due to the short-term maturity of these items. The following table provides a reconciliation of cash and cash equivalents and restricted cash reported within the consolidated balance sheets to the amounts presented in the consolidated statements of cash flows:
| | DECEMBER 31, | |||||||
|
| 2020 |
| 2019 |
| 2018 | |||
Cash and cash equivalents | | $ | 271,382 | | $ | 29,256 | | $ | 11,684 |
Restricted cash, current | |
| 1,909 | |
| 506 | | | 503 |
Total cash and cash equivalents, and restricted cash | | $ | 273,291 | | $ | 29,762 | | $ | 12,187 |
87
(g) Accounts Receivable
Accounts receivable includes current outstanding invoices billed to customers. Invoices are typically issued with net 30-days to net 90-days terms upon delivery of product or upon achievement of billable events for service-based contracts. The carrying amount of accounts receivable is reduced by a valuation allowance, if necessary, which reflects management’s best estimate of the amounts that are doubtful. This allowance is estimated based on management’s knowledge of its customers’ financial condition, credit history, and existing economic conditions. Account balances are considered delinquent if payment is not received by the due date. Accounts receivable are written off when deemed uncollectible. Recovery of accounts receivable previously written off is recorded when received. Interest is not charged on accounts receivable. An allowance for doubtful accounts of $132 and $185 was provided in the accompanying consolidated financial statements as of December 31, 2020 and 2019, respectively.
| | DECEMBER 31, | ||||
|
| 2020 |
| 2019 | ||
Trade receivables | | $ | 46,395 | | $ | 43,649 |
Unbilled receivables | |
| 7,696 | |
| 5,635 |
Other receivables | |
| — | |
| 358 |
Accounts receivable, net | | $ | 54,091 | | $ | 49,642 |
As of December 31, 2020 and 2019, the carrying values reflected in the Consolidated Balance Sheets reasonably approximate the fair values for accounts receivable due to the short-term maturity of these items.
(h) Property and Equipment
Property and equipment are stated at cost, less accumulated depreciation and amortization.
Depreciation and amortization is provided using the straight-line method over the estimated useful lives of the assets, which range from three to ten years for equipment and furniture, the shorter of the useful lives of the improvement or the life of the related lease term for leasehold improvements, and one to three years for purchased software. The Company seeks to match the book useful life of assets to the expected productive lives. Assets deemed to be impaired or no longer productive are written down to their net realizable value. The Company reviews long-lived assets for impairment whenever events or changes in circumstances indicate that the carrying value of the asset may not be recoverable. If such events or changes in circumstances are present, an impairment loss would be recognized if the sum of the expected future net cash flows is less than the carrying amount of the asset. An impairment loss would be recorded for the excess of the carrying value of the asset over the estimated fair value. There was no impairment of property and equipment for the years ended December 31, 2020, 2019, and 2018.
(i) Software Development Costs
Software development costs are accounted for in accordance with FASB ASC Subtopic 985-20 if the software is to be sold, leased or otherwise marketed, or by FASB ASC Subtopic 350-40 if the software is for internal use. After the technological feasibility of the software has been established (for software to be marketed), or at the beginning of application development (for internal-use software), software development costs, which include primarily salaries and related payroll costs and costs of independent contractors incurred during development, are capitalized. Research and development (“R&D”) costs incurred prior to the establishment of technological feasibility (for software to be marketed), or prior to application development (for internal-use software), are expensed as incurred. Software development costs are amortized on a product-by-product basis commencing on the date of general release of the products (for software to be marketed) or the date placed in service (for internal-use software). During the years ended December 31, 2020, 2019 and 2018, costs of $7,074, $7,410, and $6,727, respectively, were capitalized related to software development activities. Software development costs for software to be marketed are amortized using the straight-line method over its estimated useful life, which is typically three years. The Company reviews capitalized software for impairment whenever events or changes in circumstances indicate that the carrying value of the asset may not be recoverable. If such events or changes in circumstances are present, an impairment loss would be recognized if the sum of the expected future net cash flows is less than the carrying amount of the asset. An impairment loss would be
88
recorded for the excess of the carrying value of the asset over the estimated fair value. There was no impairment of software development costs for the years ended December 31, 2020, 2019, and 2018.
(j) Debt Issuance Costs
Debt issuance costs are capitalized and amortized over the term of the related debt using the effective interest rate method. Amortization of debt issuance costs is included in interest expense within the Consolidated Statements of Operations and Comprehensive Loss. The unamortized amount is included as an offset against long-term debt on the Consolidated Balance Sheets.
(k) Goodwill and Other Intangible Assets
Goodwill is tested for impairment at the reporting unit level, which is one level below or the same as an operating segment. When testing goodwill for impairment, the Company first performs a qualitative assessment to determine whether it is necessary to perform step one of a two-step annual goodwill impairment test for each reporting unit. The Company is required to perform step one only if it concludes that it is more likely than not that a reporting unit’s fair value is less than its carrying value. Should this be the case, the first step of the two-step process is to identify whether a potential impairment exists by comparing the estimated fair values of the Company’s reporting units with their respective book values, including goodwill. If the estimated fair value of the reporting unit exceeds book value, goodwill is considered not to be impaired, and no additional steps are necessary. If, however, the fair value of the reporting unit is less than book value, then the second step is performed to determine if goodwill is impaired and to measure the amount of impairment loss, if any. The amount of the impairment loss is the excess of the carrying amount of the goodwill over its implied fair value. The estimate of implied fair value of goodwill is primarily based on an estimate of the discounted cash flows expected to result from that reporting unit but may require valuations of certain internally generated and unrecognized intangible assets such as the Company’s software, technology, patents and trademarks. If the carrying amount of goodwill exceeds the implied fair value of that goodwill, an impairment loss is recognized in an amount equal to the excess.
For the years ended December 31, 2020, 2019, and 2018, the Company performed a quantitative assessment of goodwill and determined that it is not more-likely-than-not that the fair value of its reporting units is less than the carrying amount. Accordingly, no impairment loss was recorded for the years ended December 31, 2020, 2019, and 2018.
Other identifiable intangible assets with finite lives, such as software products acquired in acquisitions, non-compete agreements, tradenames and customer relationship assets, are amortized over their estimated lives using either a straight-line method or a method based on pattern of expected economic benefit of the asset as follows: acquired software — 3 to 10 years; non-compete agreements — 2 to 5 years; tradenames — 20 years; customer relationships — 11 to 16 years; and trademarks — 10 to 17 years. The Company evaluates finite intangible assets for impairment whenever events or changes in circumstances indicate that the carrying amount of the asset might not be recoverable. An impairment loss is recognized when estimated undiscounted future cash flows expected to result from the use of the asset are less than its carrying amount.
There were no impairment charges related to intangible assets for the years ended December 31, 2020, 2019, and 2018.
(l) Foreign Currency Translation
Generally, the functional currency of the Company’s international subsidiaries is the local currency of the country in which they operate. The Company translates the assets and liabilities of its non-U.S. dollar functional currency subsidiaries into U.S. dollars using exchange rates in effect at the end of each reporting period. Revenue and expenses for these subsidiaries are translated using average exchange rates prevailing during the period. Gains and losses from these translations are recognized as a cumulative translation adjustment and included as a separate component in accumulated other comprehensive loss within stockholders’ equity.
89
For transactions that are not denominated in the local functional currency, the Company remeasures monetary assets and liabilities at exchange rates in effect at the end of each reporting period. Foreign currency transaction gains and losses are included net within comprehensive loss in the Consolidated Statements of Operations and Comprehensive Loss and resulted in foreign currency losses of $715, $431, and $23 for the years ended December 31, 2020, 2019, and 2018, respectively.
(m) Derivative Instruments
In the normal course of business, the Company is subject to risk from adverse fluctuations in interest rates. The Company has chosen to manage this risk through the use of derivative financial instruments that consist of interest rate swap contracts. Counterparties to these contracts are major financial institutions. The Company is exposed to credit loss in the event of nonperformance by these counterparties. The Company does not use derivative instruments for trading or speculative purposes. The objective in managing exposure to market risk is to limit the impact on cash flows. To qualify for hedge accounting, the interest rate swaps must effectively reduce the risk exposure that they are designed to hedge. In addition, at inception of a qualifying cash flow hedging relationship, the underlying transaction or transactions must be, and be expected to remain, probable of occurring in accordance with the related assertions.
FASB ASC 815, “Derivatives and Hedging,” requires the Company to recognize all derivatives on the balance sheet at fair value. The Company may enter into derivative contracts such as interest rate swap contracts that effectively convert portions of the Company’s floating rate debt to a fixed rate, which serves to mitigate interest rate risk. The Company’s objectives in using interest rate swaps are to add stability to interest expense and to manage its exposure to interest rate movements. Interest rate swaps designated as cash flow hedges involve the receipt of variable-rate amounts from a counterparty in exchange for the Company making fixed-rate payments over the life of the agreements without exchange of the underlying notional amount.
As of December 31, 2019, the Company had one outstanding interest rate swap that was designated as a cash flow hedge of interest rate risk for a notional amount of $217,500 that fixed the interest rate at 1.8523%, noninclusive of the fixed credit spread. This interest rate swap matured on November 30, 2020. On May 22, 2019, the Company entered into a second interest rate swap agreement, which was effective on November 30, 2020. This second interest rate swap was also designated as a cash flow hedge of interest rate risk for a notional amount of $230,000 that fixed the interest rate at 2.1284%, noninclusive of the fixed credit spread through May 31, 2022. The Company recorded the fair value of its interest rate swaps in the amount of $3,671 and $2,152, as a derivative liability as of December 31, 2020 and 2019, respectively, in its Consolidated Balance Sheets. The Company’s interest rate swaps qualify for hedge accounting. The fair values of the interest rate swaps are recognized in the Consolidated Balance Sheets and the changes in the fair value of the derivatives are recognized in other comprehensive loss. Subsequently, the gain or loss reclassified into interest expense in the same period(s) during which the hedged transaction affects earnings.
The following table sets forth the liabilities that were measured at fair value on a recurring and non-recurring basis by their levels in the fair value hierarchy at December 31, 2020:
|
| LEVEL 1 |
| LEVEL 2 |
| LEVEL 3 |
| TOTAL | ||||
Liability |
| |
|
| |
|
| |
|
| |
|
Interest rate swap liability | | $ | — | | $ | 3,671 | | $ | — | | $ | 3,671 |
Total | | $ | — | | $ | 3,671 | | $ | — | | $ | 3,671 |
The following table sets forth the liabilities that were measured at fair value on a recurring and non-recurring basis by their levels in the fair value hierarchy at December 31, 2019:
|
| LEVEL 1 |
| LEVEL 2 |
| LEVEL 3 |
| TOTAL | ||||
Liability |
| |
|
| |
|
| |
|
| |
|
Interest rate swap liability | | $ | — | | $ | 2,152 | | $ | — | | $ | 2,152 |
Total | | $ | — | | $ | 2,152 | | $ | — | | $ | 2,152 |
90
The net amount of deferred gains (losses) related to derivative instruments designated as cash flow hedges that is expected to be reclassified from accumulated other comprehensive loss into interest expense over the next 12 months is insignificant.
(n) Warranty
The Company includes an assurance commitment warranting the application software products will perform in accordance with written user documentation and the agreements negotiated with customers. Since the Company does not customize its applications software, warranty costs are insignificant and expensed as incurred.
(o) Net Loss per Share
Basic net loss per common share is computed by dividing the net loss by the weighted-average number of shares outstanding during the reporting period, without consideration for potentially dilutive securities. Diluted net loss per share is computed by dividing the net loss attributable to stockholders by the weighted-average number of shares and dilutive securities outstanding during the period.
(p) Income Taxes
The Company accounts for income taxes under the asset and liability method. Under this method, the amount of taxes currently payable or refundable is accrued, and deferred tax assets and liabilities are recognized for the estimated future tax consequences attributable to differences between the financial reporting and tax basis of existing assets and liabilities. Deferred tax assets also include realizable tax losses and tax credit carryforwards.
The deferred tax assets may be reduced by a valuation allowance, which is established when it is more likely than not that some portion or all of the deferred tax assets will not be realized. In addition, management is required to evaluate all available evidence, both positive and negative, when making its judgment to determine whether to record a valuation allowance for a portion, or all, of its deferred tax assets. Deferred tax assets and liabilities are measured using enacted income tax rates in effect for the year in which those temporary differences are expected to be recovered or settled. The effect on deferred tax assets and liabilities of a change in income tax rate is recognized in the period that includes the enactment date.
Uncertainty in Income Taxes
The Company accounts for uncertainty in income taxes using a two-step approach. The first step requires the Company to conclude that a tax position, based solely on its technical merits, is more likely than not to be sustained upon examination by a tax authority. The second step requires the Company to measure the largest amount of benefit, determined on a cumulative probability basis, that is more likely than not to be realized upon ultimate settlement with the respective tax authority. The Company recognizes the effect of income tax positions only if those positions are more likely than not of being sustained. Changes in recognition or measurement are reflected in the period in which the change in judgment occurs. Further, the benefit to be recorded in the consolidated financial statements is the amount most likely to be realized assuming a review by the tax authorities having all relevant information and applying current conventions. The Company’s policy is to recognize interest and penalties related to income tax positions taken as a component of the provision for income taxes.
The Company recorded unrecognized tax benefits of $897 and $690 as of December 31, 2020 and 2019, respectively. As of December 31, 2020 and 2019, there were no interest or penalties recorded. The Company does not anticipate any significant changes to its uncertain tax positions during the next twelve months. The audits of the federal income tax returns for the tax year ended December 31, 2016 and December 31, 2017 are closed. The Internal Revenue Service can audit the NOLs generated in respective years in the years that the NOLs are utilized. State income tax returns are generally subject to examination for a period of three to six years after the filing of the respective tax return. The state impact of any federal changes remains subject to examination by various states for a period of up to one year after formal notification to the states. Foreign income tax returns are generally subject to examination based on the tax laws of the respective jurisdictions.
91
(q) Revenue Recognition ASC 606
Revenue is recognized upon transfer of control of promised products or services to customers in an amount that reflects the consideration to which the Company expects to be entitled in exchange for promised goods or services. The Company’s revenue consists of fees for perpetual and term licenses for the Company’s software products, post-contract customer support (referred to as maintenance), software as a service (“SaaS”) and professional services including training and other revenue. For contracts with multiple performance obligations, the Company allocates the transaction price of the contract to each performance obligation on a relative standalone selling price basis. The delivery of a particular type of software and each of the user licenses would be one performance obligation. However, any training, implementation, or support and maintenance promises as part of the software license agreement would be considered separate performance obligations, as those promises are distinct and separately identifiable from the software licenses. The payment terms in these arrangements are sufficiently short such that there is no significant financing component to the transaction.
The Company typically recognizes license revenue at a point in time upon delivering the applicable license. The revenue related to the support and maintenance performance obligation will be recognized on an over-time basis using time elapsed methodology. The revenue related to software training and software implementation performance will be recognized at the completion of the service.
The following describes the nature of the Company’s primary types of revenues and the revenue recognition policies as they pertain to the types of transactions the Company enters into with its customers.
Software Licenses and Support
License revenue includes perpetual license fees and term license fees, which provide customers with the same functionality and differ mainly in the duration over which the customer benefits from the use of software. Both revenues from perpetual license and term license performance obligations are generally recognized upfront at the point in time when the software license has been delivered.
A source of software license revenue is from term and bundled licenses that are time-based arrangements for one or multiple software products sold together with maintenance and support for the term of the license arrangement. The Company has determined that post customer support and the right to unspecified enhancements and upgrades on a “when-and-if-available” basis included with term licenses is an immaterial component of the transaction price and, therefore, recognized these performance obligation components up front with the license when delivered. Software License contracts do not provide for any non-cash consideration nor is there consideration payable to a customer.
Software Services
For contracts that include multiple performance obligations, such as a software license plus software training, implementation, and/or maintenance/support, or in contracts where there are multiple software licenses, the transaction price is allocated to each of the performance obligations on a pro-rata basis based on the relative standalone selling price (“SSP”) of each performance obligation. Maintenance services agreements consist of fees for providing software updates and for providing technical support for software products for a specified term. Revenue allocated to maintenance services is recognized ratably over the contract term beginning on the delivery date of each offering. Maintenance contracts generally have a term of one year. Expenses related to maintenance and subscription are recognized as incurred. While transfer of control of the software training and implementation performance obligations are over time, the services are typically started and completed within a few days. Due to the quick nature of the performance obligation from start to finish and the immaterial amounts, the Company recognizes any software training or implementation revenue at the completion of the service. Any unrecognized portion of amounts paid in advance for licenses and services is recorded as deferred revenue. Certara’s software contracts do not typically include discounts, variable consideration, or options for future purchases that would not be similar to the original goods.
92
Consortium revenues consist of contractual agreements with customers where the customer receives multiple benefits as part of their contract with the Company, as follows: access to the latest version simulator software, which has at least one new release per year, free access to a preset number of training workshops, a block of consulting hours to be used at the customer’s discretion, as well as voting rights at the annual consortium meeting where development priorities for the upcoming year are set. The Company’s consortium contracts are generally for three years with annual termination clauses and with annual upfront billings. Consortium revenues are recognized over time as the benefits of the consortium arrangement are realized over the course of the contract. Both the training and consulting services performance obligations will utilize an output method to measure the progress at the end of each reporting period. Revenue from the Company’s performance obligation under the simulation license, which provides customers with access to the latest version of the simulation software, is recognized evenly over the contract period.
License revenue and post contract services are combined and reported as software revenue on the Consolidated Statements of Operations and Comprehensive Loss.
Subscription Revenues
Subscription revenues consists of subscription fees for access to, and related support for, our cloud-based solutions. The Company typically invoices subscription fees in advance in annual installments and recognizes subscription revenue ratably over the term of the applicable agreement, usually one to three years which is initially deferred and recognized ratably over the life of the contract. The output method that accurately depicts the transfer of control was determined to be the delivery of accessibility to the customer. Unearned maintenance and subscription revenue are recorded as deferred revenue. The Company’s subscription services arrangements are generally non-cancelable and do not contain refund-type provisions. In rare instances that subscription services arrangements are deemed cancelable, the Company will adjust the transaction price and period for revenue recognition accordingly to be reflective of the contract term. The contract transaction price is based on the fixed fee for each subscription.
Services and Other Revenues
Services primarily represent consulting services, which may be either strategic consulting services, reporting and analysis services, regulatory writing services, or any combination of the three. Strategic consulting services consists of consulting, training, and process redesign that enables customers to identify which uncertainties are greatest and matter most and then to design development programs, trial sequences, and individual trials in such a way that those trials systematically reduce the identified uncertainties, in the most rapid and cost-effective manner possible. The Company’s professional services contracts are either time-and-materials, fixed fee or prepaid. Services revenues are generally recognized over time as the services are performed. Revenues for fixed price services and prepaid are generally recognized over time applying input methods to estimate progress to completion. Accordingly, the number of resources being paid for and varying lengths of time they are being paid for, determine the measure of progress. Training revenues are recognized as the services are performed over time. However, due to short period over which the transfer of control occurs for a classroom or on-site training course, the revenue related to these performance obligations is recognized at the completion of the course for administrative feasibility purposes. The training services generally do not provide for any non-cash consideration nor is there consideration payable to a customer.
At contract inception, the Company assesses the products and services promised in its contracts with customers and identifies a performance obligation for each promise to transfer to the customer a product or service (or bundle of products or services) that is distinct — i.e., if a product or service is separately identifiable from other items in the bundled package and if a customer can benefit from it on its own or with other resources that are readily available to the customer. Determining whether products and services are considered distinct performance obligations that should be accounted for separately versus together may require significant judgment. The Company has contracts with customers that may have multiple performance obligations, including some or all of the following: software licenses, maintenance, subscriptions, professional services and/or training. For these contracts, the Company accounts for individual performance obligations separately if they are distinct within the context of the contract by allocating the contract’s total transaction price to each performance obligation in an amount based on the relative SSP, of each distinct good or service in the contract.
93
In order to determine the SSP of its promised goods or services, the Company conducts an annual analysis to determine whether its goods or services have an observable SSP. In determining SSP, the Company requires that a substantial majority of the standalone selling prices for goods or services fall within a reasonably narrow pricing range. If the Company does not have a directly observable SSP for a particular good or service, then the Company estimates a SSP by the Company’s overall pricing objectives, taking into consideration market factors, pricing practices including historical discounting, historical standalone sales of similar products, customer demographics, geographic locations, and the number and types of users within the Company’s contracts. The determination of SSP is made by the Company’s management. Selling prices are analyzed at least on an annual basis to identify if the Company has experienced significant changes in its selling prices.
The Company allocates the transaction price to each performance obligation identified in the contract on a relative SSP basis and recognizes revenue when or as it satisfies a performance obligation by transferring control of a product or service to a customer.
Taxes collected from customers and remitted to governmental authorities are not included in revenue. The Company does not incur shipping and handling for its goods as they are generally delivered to a customer electronically.
The Company does not believe that it currently has any rights to return that would result in a material impact to revenues.
Contract Balances
The timing of revenue recognition, billings and cash collections results in billed accounts receivable, unbilled receivables (contract assets), and customer advances and deposits (deferred revenue, contract liabilities) on the Consolidated Balance Sheets. Amounts are billed as work progresses in accordance with agreed-upon contractual terms, either at periodic intervals (e.g., quarterly or monthly) or upon achievement of contractual milestones.
Contract assets relate to the Company’s rights to consideration for performance obligations satisfied but not billed at the reporting date on contracts (i.e., unbilled revenue, a component of accounts receivable in the Consolidated Balance Sheets). Contract assets are billed and transferred to customer accounts receivable when the rights become unconditional. The Company typically invoices customers for term licenses, subscriptions, maintenance and support fees in advance with payment due before the start of the subscription term, ranging from one to three years. The Company records the amounts collected in advance of the satisfaction of performance obligations, usually over time, as a contract liability or deferred revenue. Invoiced amounts for non-cancelable services starting in future periods are included in contract assets and deferred revenue. The portion of deferred revenue that will be recognized within twelve months is recorded as current deferred revenue, and the remaining portion is recorded as non-current deferred revenue in the Consolidated Balance Sheets.
The unsatisfied performance obligation as of December 31, 2020 was approximately $80,559.
Deferred Contract Acquisition Costs
Under ASC 606, sales commissions paid to the sales force and the related employer payroll taxes, collectively “deferred contract acquisition costs”, are considered incremental and recoverable costs of obtaining a contract with a customer. The Company has determined that sales commissions paid are an immaterial component of obtaining a customer’s contract and has elected to expense sales commissions when paid.
Revenue Recognition Pre ASC 606
The adoption of ASC 606 changed the way the Company recognizes revenue related to term and bundled license agreements. Prior to ASC 606, the Company recognized software licenses and support revenue in accordance with FASB ASC 985, “Software.” Revenues from software license agreements are recognized when all of the following criteria are met as set forth in FASB ASC 985: (1) persuasive evidence of an arrangement exists, (2) delivery has occurred, (3) the fee is fixed or determinable, and (4) collectability is probable.
94
A source of software license revenue is from term and bundled licenses that are time-based arrangements for one or multiple software products that are sold together with maintenance and support for the term of the license arrangement. The Company does not have vendor specific objective evidence (“VSOE”) to determine fair value of the maintenance and support in term arrangements and, therefore, recognizes revenues from these bundled time-based licenses ratably over the license term, which typically ranges from one to three years.
The Company allocates revenues from perpetual software arrangements involving multiple elements to each element based on the relative fair values as determined by the VSOE for each element. The Company limits its assessment of VSOE for each element to the price charged when the same element is sold separately. The Company has analyzed all of the elements included in multiple-element arrangements and determined that the Company has sufficient VSOE to allocate revenues to maintenance and support, deployment, and training. The Company sells training separately and has established VSOE on this basis. VSOE for maintenance and support is determined based upon the renewal rates in contracts themselves, which is based on a fixed percentage of the current perpetual license list price. Deployment services are charged based on standard hourly rates. Accordingly, assuming all other revenue recognition criteria are met, revenues from perpetual licenses are recognized upon delivery of the software using the residual method in accordance with ASC 985.
Software maintenance agreements provide for technical support and the right to unspecified enhancements and upgrades on a “when-and-if-available” basis. Post-contract support (“PCS”) revenues on perpetual agreements are recognized ratably over the term of the support period (generally one year). Deployment, training, and other service revenues are recognized as the related services are provided. Any unrecognized portion of amounts paid in advance for licenses and services is recorded as deferred revenue.
For presentation in the Consolidated Statements of Operations and Comprehensive Loss, license revenues and PCS are combined as allowed under U.S. GAAP due to the immaterial amount of revenues obtained from PCS when charged separately in comparison to the total of these two sources.
Sources and Timing of Revenue
The Company’s performance obligations are satisfied either over time or at a point in time. The following table presents the Company’s revenue by timing of revenue recognition to understand the risks of timing of transfer of control and cash flows:
| | YEAR ENDED DECEMBER 31, | ||||
| | 2020 |
| 2019 | ||
Software licenses transferred at a point in time | | $ | 36,388 | | $ | 35,261 |
Software licenses transferred over time | |
| 37,075 | | | 33,080 |
Service revenues earned over time | |
| 170,067 | | | 140,170 |
Total | | $ | 243,530 | | $ | 208,511 |
(r) Equity -based compensation
The Company measures equity-based compensation at fair value and recognizes the expense over the vesting period. Compensation costs for our legacy Class B Units, issued by EQT Avatar Parent L.P. (“EQT”), that vested based on continued service requirements and the restricted stock into which they were exchanged are recognized on a straight-line basis over the requisite service period. Compensation costs for our restricted stock units are recognized on a straight-line basis over the requisite service period. Compensation costs for our restricted stock exchanged for our legacy Class B Units with performance vesting conditions are recognized using the accelerated attribution approach. Forfeitures are recognized as they occur for all awards.
95
(s) Comprehensive (Loss) Income
FASB ASC 220, “Comprehensive Income,” establishes standards for reporting of comprehensive income and its components (revenue, gains, and losses) in a full set of general-purpose financial statements. FASB ASC 220 requires that all components of comprehensive income, including net income, be reported in a financial statement that is displayed with the same prominence as other financial statements. Comprehensive loss is defined as the change in equity during a period from transactions and other events and circumstances from non-owner sources. Net loss and other comprehensive loss, including foreign currency translation adjustments, and changes in fair value of derivative instruments (interest rate swap agreements) designated as cash flow hedges, shall be reported to arrive at comprehensive loss. Comprehensive loss is displayed in the Consolidated Statements of Operations and Comprehensive Loss.
The components of other comprehensive income (loss) consisted of foreign currency translation adjustments totaling $5,045, $433 and $(16,721), respectively, and change in fair value of interest rate swap, net of tax, totaling $(1,135), $(4,283), and $1,079 for the years ended December 31, 2020, 2019, and 2018, respectively.
(t) Reclassification
Certain amounts in the 2018 and 2019 consolidated financial statements have been reclassified to conform with the current year presentation.
3. Initial Public Offering
On December 15, 2020, the Company completed its initial public offering (“IPO”), pursuant to which the Company issued and sold 14,630,000 shares of common stock and certain selling stockholders, including former controlling shareholder, EQT, sold 18,783,250 shares of our common stock (representing the full exercise of the underwriters’ option to purchase additional shares), at a public offering price of $23.00 per share. The Company received net proceeds of $316,301, after deducting underwriters' discounts and commissions. In addition, $4,408 of legal, accounting and other offering costs, net of the tax effect of $259, incurred in connection with the sale of the Company's common stock in the IPO, were capitalized and offset against the proceeds received in the IPO.
The Company is party to a registration rights agreement with EQT AB and its affiliates (“EQT AB”), Arsenal, EQT, and certain other stockholders (“Institutional Investors”). The registration rights agreement was amended and restated in connection with the IPO. It contains provisions that entitle EQT AB, Arsenal, EQT, and the other stockholder parties thereto to certain rights to have their securities registered by the Company under the Securities Act. EQT AB will be entitled to an unlimited number of “demand” registrations, subject to certain limitations. Every stockholder that holds registration rights will also be entitled to customary “piggyback” registration rights. In addition, the amended and restated registration rights agreement provides that the Company will pay certain expenses of the stockholder parties relating to such registrations and indemnify them against certain liabilities which may arise under the Securities Act of 1933 (“Securities Act”).
The registration rights agreement will terminate (i) with the prior written consent of the Institutional Investors in connection with a change of control; (ii) for those holders (other than the Institutional Investors) that beneficially own less than 5% of the Company’s outstanding shares, if all of the Registrable Securities then owned by such holder could be sold in any 90-day period pursuant to Rule 144; (iii) as to any holder, if all of the Registrable Securities held by such holder have been sold or otherwise transferred in a Registration pursuant to the Securities Act or pursuant to an exemption therefrom; or (iv) with respect to any holder that is an officer, director, employee or consultant of the Company on the date that is 90 days after the date on which such holder ceases to be an employee, director or consultant (as applicable) of the Company. The rights and obligations do not transfer without the written consent of the Company and the Institutional Investors.
96
4. Concentrations of Credit Risk
Financial instruments that potentially subject the Company to concentrations of credit risk have consisted principally of cash and cash equivalent investments and trade receivables. The Company invests available cash in bank deposits, investment-grade securities, and short-term interest-producing investments, including government obligations and other money market instruments. At December 31, 2020 and 2019, the investments were bank deposits and overnight sweep accounts. The Company has adopted credit policies and standards to evaluate the risk associated with sales that require collateral, such as letters of credit or bank guarantees, whenever deemed necessary. Management believes that any risk of loss is significantly reduced due to the nature of the customers and distributors with which the Company does business.
As of December 31, 2020 and 2019, no customer accounted for more than 10% of the Company’s accounts receivable. As of December 31, 2020, 2019, and 2018, no customer accounted for more than 10% of the Company’s revenues.
5. Business Combinations
Acquisitions have been accounted for using the acquisition method of accounting pursuant to FASB ASC 805, “Business Combinations.” Amounts allocated to the purchased assets and liabilities are based upon the total purchase price and the estimated fair values of such assets and liabilities on the effective date of the purchase as determined by an independent third party. The results of operations have been included in the Company’s results of operations prospectively from the date of acquisition.
BaseCase
BaseCase provides SaaS in the Life Sciences industry. This acquisition was made to combine its background in health economics with the Company’s background in Computer Science and exploit the gap in the market for health economics by accessing the software market in the life sciences industry. The BaseCase acquisition was funded through proceeds of $25,000 received from an additional tranche of term debt and cash on hand. The following table summarizes the estimates of the fair values of the assets acquired and liabilities assumed in the BaseCase acquisition as of the date of acquisition.
|
| JANUARY 25, | |
|
| 2018 | |
Cash | | $ | 1,151 |
Accounts receivable | |
| 2,622 |
Prepaid expenses and other assets | |
| 171 |
Property and equipment | |
| 87 |
Separately identifiable intangible assets | |
| 7,580 |
Total identifiable assets acquired | |
| 11,611 |
Accounts payable | |
| 174 |
Accrued expenses | |
| 3,617 |
Deferred revenue | |
| 830 |
Deferred tax liability | |
| 2,927 |
Total liabilities assumed | |
| 7,548 |
Net identifiable assets acquired | |
| 4,063 |
Goodwill arising in the acquisition | |
| 21,260 |
Purchase price | | $ | 25,323 |
The adjustments recorded to reflect the acquired assets at their estimated fair value and liabilities at their estimated fair value or the present value of amounts to be paid included:
| a. | $7,580 to record the estimated fair market value of the acquired intangible assets consisting of: non-compete agreements $10; non-contractual customer relationships $5,480; acquired software $1,120 and tradename $970 |
97
| b. | Reduction in deferred revenues of $2,121 |
| c. | Other miscellaneous adjustments |
The fair value of the intangible assets is based on significant inputs that are not observable in the market and, therefore, represent Level 3 measurements under FASB ASC 820-10. The fair value of the non-contractual customer relationships was determined under the income approach, specifically the multi-period excess earnings method. The fair value of the non-compete was determined using the income approach, specifically the comparative business valuation method. The fair value of the tradename and acquired software was determined using the income approach, specifically the relief from royalty method. In addition, goodwill of $21,260 was recorded to reflect the excess of the purchase price over the estimated fair value of the net identifiable assets acquired, which is not deductible for tax purposes.
The Company incurred $2,122 of acquisition costs related to this acquisition, which are included in operating expenses in the Consolidated Statement of Operations and Comprehensive Loss for the year ended December 31, 2018. The Company also incurred costs for the issuance of debt, which was capitalized as a debt issuance costs as of the acquisition date in the amount of $313.
Analytica Laser
Analytica Laser employs cutting-edge quantitative methodologies and proprietary software to study and predict real-world outcomes for drug value assessment. This acquisition was made so that the Company’s complementary approaches allow integration of Health Economics and Outcomes Research (“HEOR”) and real-world value assessments with Pharmacometrics data — delivering safety, efficacy and effectiveness insights and providing a unique market advantage for our customers. The Analytica Laser acquisition was funded through proceeds of $40,000 received from an additional tranche of term debt and cash on hand. The following table summarizes the estimates of the fair values of the assets acquired and liabilities assumed in the Analytica Laser acquisition as of the date of acquisition.
|
| APRIL 3, | |
|
| 2018 | |
Cash | | $ | 427 |
Accounts receivable | |
| 3,629 |
Prepaid expenses and other assets | |
| 721 |
Property and equipment | |
| 111 |
Separately identifiable intangible assets | |
| 17,630 |
Total identifiable assets acquired | |
| 22,518 |
Accounts payable | |
| 118 |
Accrued expenses | |
| 1,727 |
Deferred revenue | |
| 62 |
Deferred tax liability | |
| 3,350 |
Total liabilities assumed | |
| 5,257 |
Net identifiable assets acquired | |
| 17,261 |
Goodwill arising in the acquisition | |
| 22,739 |
Purchase price | | $ | 40,000 |
The adjustments recorded to reflect the acquired assets at their estimated fair value and liabilities at their estimated fair value or the present value of amounts to be paid included:
| a. | $17,630 to record the estimated fair market value of the acquired intangible assets consisting of: non-compete agreements $390 and non-contractual customer relationships $17,240 |
| b. | Reduction in deferred revenues of $135 |
| c. | Other miscellaneous adjustments |
98
The fair value of the intangible assets is based on significant inputs that are not observable in the market and, therefore, represent Level 3 measurements under FASB ASC 820-10. The fair value of the non-contractual customer relationships was determined under the income approach, specifically the multi-period excess earnings method. The fair value of the non-compete was determined using the income approach, specifically the comparative business valuation method.
In addition, goodwill of $22,739 was recorded to reflect the excess of the purchase price over the estimated fair value of the net identifiable assets acquired, which is not deductible for tax purposes.
The Company incurred $1,728 of acquisition costs related to this acquisition, which are included in operating expenses in the Consolidated Statement of Operations and Comprehensive Loss for the year ended December 31, 2018. The Company also incurred costs for the issuance of debt, which was capitalized as a debt issuance cost as of the acquisition date in the amount of $750.
6. Prepaid Expenses and Other Current Assets
Prepaid and other current assets consisted of the following:
| | DECEMBER 31, | ||||
|
| 2020 |
| 2019 | ||
Prepaid expenses | | $ | 7,372 | | $ | 4,379 |
Income tax receivable | |
| 7,098 | |
| 302 |
R&D tax credit receivable | |
| 3,610 | |
| 2,412 |
Other current assets | |
| 1,122 | |
| 1,026 |
Prepaid expenses and other current assets | | $ | 19,202 | | $ | 8,119 |
7. Property and Equipment
Property and equipment consisted of the following:
| | DECEMBER 31, | ||||
|
| 2020 |
| 2019 | ||
Computer equipment | | $ | 5,619 | | $ | 3,736 |
Furniture | |
| 3,147 | |
| 2,776 |
Purchased software for internal use | |
| 679 | |
| 212 |
Leasehold improvements | |
| 2,386 | |
| 2,254 |
Property and equipment | |
| 11,831 | |
| 8,978 |
Less: Accumulated depreciation and amortization | |
| (7,959) | |
| (4,355) |
Property and equipment, net | | $ | 3,872 | | $ | 4,623 |
Depreciation and amortization expense were $2,443, $2,596, and $2,416 for the years ended December 31, 2020, 2019, and 2018, respectively.
99
8. Goodwill and Other Intangible Assets
The following table presents the Company’s intangible assets (other than goodwill) and the related amortization:
| | | | | | | | | | | | | | | | | | | | |
|
| WEIGHTED |
| | |
| | |
| | |
| | |
| | |
| | |
| | AVERAGE | | DECEMBER 31, 2020 | | DECEMBER 31, 2019 | ||||||||||||||
| | AMORTIZATION | | GROSS | | | | | | | | GROSS | | | | | | | ||
| | PERIOD | | CARRYING | | ACCUMULATED | | | | | CARRYING | | ACCUMULATED | | | | ||||
|
| (IN YEARS) | | AMOUNT | | AMORTIZATION | | NET | | AMOUNT | | AMORTIZATION | | NET | ||||||
Acquired software |
| 10.03 | | $ | 24,275 | | $ | 8,099 | | $ | 16,176 | | $ | 23,571 | | $ | 5,307 | | $ | 18,264 |
Capitalized software development costs |
| 2.43 | |
| 24,009 | |
| 13,930 | |
| 10,079 | |
| 16,566 | |
| 6,896 | |
| 9,670 |
Non-compete agreements |
| 2.17 | |
| 1,353 | |
| 1,145 | |
| 208 | |
| 1,318 | |
| 977 | |
| 341 |
Tradename |
| 16.63 | |
| 40,683 | |
| 6,845 | |
| 33,838 | |
| 40,683 | |
| 4,810 | |
| 35,873 |
Customer relationships |
| 11.63 | |
| 433,297 | |
| 97,153 | |
| 336,144 | |
| 431,785 | |
| 67,935 | |
| 363,850 |
Total |
|
| | $ | 523,617 | | $ | 127,172 | | $ | 396,445 | | $ | 513,923 | | $ | 85,925 | | $ | 427,998 |
Amortization expense for intangible assets was $40,310, $38,964, and $34,595 for the years ended December 31, 2020, 2019, and 2018, respectively. Amortization expense of $2,896, $2,723, and $2,970 was recorded in cost of revenues for the years ended December 31, 2020, 2019, and 2018, respectively.
The remaining amortization of $37,414, $36,241, and $31,625 was recorded in operating expenses for the years ended December 31, 2020, 2019, and 2018, respectively.
Based on the current amount of intangibles subject to amortization, the estimated annual amortization expense for each of the succeeding five years and thereafter is as follows:
| | | | | CAPITALIZED | | | | | | | | | | | | | |
| | | | | SOFTWARE | | | | | | | | | | | | | |
| | ACQUIRED | | DEVELOPMENT | | NON-COMPETE | | | | | CUSTOMER | | | | ||||
|
| SOFTWARE |
| COSTS |
| AGREEMENTS |
| TRADENAMES |
| RELATIONSHIPS |
| TOTAL | ||||||
2021 |
| $ | 2,564 | | $ | 4,869 | | $ | 106 | | $ | 2,034 | | $ | 28,917 | | $ | 38,490 |
2022 | | | 2,391 | | | 3,440 | | | 80 | | | 2,034 | | | 28,904 | | | 36,849 |
2023 | | | 2,202 | | | 1,770 | | | 22 | | | 2,034 | | | 28,904 | | | 34,932 |
2024 | | | 1,819 | | | — | | | — | | | 2,034 | | | 28,904 | | | 32,757 |
2025 | | | 1,665 | | | — | | | — | | | 2,034 | | | 28,904 | | | 32,603 |
Thereafter | | | 5,535 | | | — | | | — | | | 23,668 | | | 191,611 | | | 220,814 |
Total | | $ | 16,176 | | $ | 10,079 | | $ | 208 | | $ | 33,838 | | $ | 336,144 | | $ | 396,445 |
Goodwill
The Company has not recognized any impairment charges for the years ended December 31, 2020, 2019, and 2018. A reconciliation of the change in the carrying value of goodwill is as follows:
Balance, December 31, 2018 |
| $ | 514,274 |
Foreign currency translation | |
| 722 |
Balance, December 31, 2019 | | | 514,996 |
ISB acquisition | | | 685 |
Foreign currency translation | |
| 2,911 |
Balance, December 31, 2020 | | $ | 518,592 |
100
9. Accrued Expenses
Accrued expenses consist of the following:
| | DECEMBER 31, | ||||
|
| 2020 |
| 2019 | ||
Accrued compensation |
| $ | 24,941 | | $ | 18,476 |
Accrued severance |
|
| 143 | |
| 762 |
Product distributor fees |
|
| 149 | |
| 102 |
Legal and professional accruals |
|
| 2,779 | |
| 2,461 |
Local sales and VAT taxes |
|
| 58 | |
| 51 |
Interest payable |
|
| 39 | |
| 3,871 |
Income taxes payable |
|
| 854 | |
| — |
Deferred rent |
|
| 919 | |
| 1,066 |
Contingent earn-out | | | 230 | | | — |
Other |
|
| 617 | |
| 247 |
Total accrued expenses |
| $ | 30,729 | | $ | 27,036 |
10. Long-Term Debt and Revolving Line of Credit
Effective August 14, 2017, the Company entered into a credit agreement with lenders for a $250,000 term loan (“Credit Agreement”). The Credit Agreement is a syndicated arrangement with various lenders providing the financing. The $250,000 term loan is due to mature on August 14, 2024. The Company also entered into a $20,000 revolving line of credit with lenders with a sub-commitment for issuance of letters of credit of $10,000. As of December 31, 2020 and 2019, available borrowings under the $20,000 revolving line of credit are reduced by a $120 standby letter of credit issued to a landlord in lieu of a security deposit. This agreement is collateralized by substantially all U.S. assets and stock pledges for the non-U.S. subsidiaries and contain various financial and nonfinancial covenants.
The Company and lenders entered into a restated and amended loan agreement on January 25, 2018 where an additional tranche of $25,000 was added to the Credit Agreement with respect to the loan. The amortization schedule of the new tranche was made coterminous with the rest of the agreement. There were no other changes to the terms of the agreement.
The Company and lenders entered into a second restated and amended loan agreement on April 3, 2018 where an additional tranche of $40,000 was added to the Credit Agreement with respect to the loan. The amortization schedule of the new tranche was made coterminous with the rest of the agreement.
There were no other changes to the terms of the agreement.
The Company was in compliance with all covenants as of December 31, 2020 and 2019. Borrowings under the Credit Agreement are subject to a variable interest rate at LIBOR plus a margin. The applicable margins are based on achieving certain levels of compliance with financial covenants.
The effective interest rate was 4.48% and 5.89% for the years ended December 31, 2020 and 2019, respectively, for the Credit Agreement. As discussed previously, the Company entered into interest rate swap agreements that fixed the interest rate.
Interest paid on the Credit Agreement with respect to the term loan amounted to $13,960, $18,520, and $17,827 for the years ended December 31, 2020, 2019, and 2018, respectively. Accrued interest payable on the Credit Agreement with respect to the term loan amounted to $32 and $47 at December 31, 2020 and 2019, respectively,and is included in accrued expenses. Interest paid on the Credit Agreement with respect to the revolving line of credit amounted to $457, $174, and $419 for the years ended December 31, 2020, 2019, and 2018, respectively. There was no accrued interest payable on the revolving line of credit as of December 31, 2020 and 2019.
101
Effective August 14, 2017, the Company entered into an unsecured credit agreement with another lender for a $100,000 term loan (“Loan Agreement”). The loan bears interest at 8.25% which is payable in semi-annual installments on January and July 15 through August 14, 2025, at which time all outstanding principal and interest are due. Under the Loan Agreement, the Company could voluntarily repay outstanding loans without premium or penalty. On July 15, 2020, the Company made a $20,000 prepayment on the loan, which reduced the amount outstanding to $80,000. On December 28, 2020, the Company repaid the $80,000 aggregate principal amount owed under the Loan Agreement, including $3,000 of accrued interest using a portion of the proceeds from the IPO. The Company's obligations under the Loan Agreement were discharged on that date. Interest paid on the loan amounted to $11,449, $8,365, and $7,654 for the years ended December 31, 2020, 2019, and 2018, respectively. Accrued interest payable on the loan amounting to $0 and $3,896 at December 31, 2020 and 2019, respectively, is included in accrued expenses.
Long-term debt consists of the following:
| | DECEMBER 31, | ||||
| | 2020 |
| 2019 | ||
Term loans | | $ | 304,099 | | $ | 408,170 |
Revolving line of credit | |
| — | |
| — |
Less: debt issuance costs | |
| (5,319) | |
| (6,839) |
Total | |
| 298,780 | |
| 401,331 |
Current portion of long-term debt | |
| (4,680) | |
| (4,210) |
Long-term debt, net of current portion and debt issuance costs | | $ | 294,100 | | $ | 397,121 |
The principal amount of long-term debt outstanding as of December 31, 2020, matures in the following years:
|
| 2021 |
| 2022 |
| 2023 |
| 2024 |
| TOTAL | |||||
Maturities | | $ | 4,680 | | $ | 3,153 | | $ | 3,153 | | $ | 293,113 | | $ | 304,099 |
The variable interest term loan agreement dated August 14, 2017 requires the Company to make an annual mandatory prepayment as it relates to the Company’s Excess Cash Flow calculation. For the year ended December 31, 2020, the Company was required to make a mandatory prepayment on the term loan of approximately $1,527 on or before April 30, 2021. For the year ended December 31, 2019, the Company was required to make a mandatory repayment on the term loan of approximately $1,057 on or before April 29, 2020. The prepayment is included in the current portion of long-term debt on the Consolidated Balance Sheets.
The fair values of the Company’s variable interest term loan and revolving line of credit are not significantly different than their carrying value because the interest rates on these instruments are subject to change with market interest rates.
11. Employee Benefit Plan
The Company established a defined contribution 401(k) plan covering all U.S. employees who are at least 21 years of age. Employees may contribute to the plan up to 50% of their compensation, which may be further limited by law. In addition, employees who reached the age of 50 during the calendar years 2020, 2019, and 2018 are eligible to make an additional catch up contribution of 6.0%, subject to income limitations. The Company matches employee contributions for a percentage of the employee’s deferral, limited to the first 6% of each employee’s compensation.
The Company also operates a Group Personal Pension plan covering all U.K. employees. Employees are auto-enrolled in the plan who are at least 22 years of age and paid more than £10 a year, up to the State Pension Age. However, all employees who are between the ages of 16 and 75 can elect to join the plan. Employees may contribute to their personal pension account and then convert that account into income at retirement. The Company contributes an additional 8% of salary for those employees who have registered for the plan.
In addition to the U.S. and U.K. pension plans, the Company also maintains immaterial defined pension plans in several other countries.
102
Total contributions made by the Company were $3,342, $2,864, and $2,304 for the years ended December 31, 2020, 2019, and 2018 respectively.
12. Commitments and Contingencies
Leases
The Company leases certain office facilities and equipment under non-cancelable operating and capital leases with remaining terms from one to eight years. The gross amounts of assets under capital leases were $1,501 and $663 at December 31, 2020 and 2019, respectively. The total accumulated amortization associated with equipment under capital leases was approximately $946 and $659 at December 31, 2020 and 2019, respectively. The related amortization expense is included in depreciation expense. Rent expense under the operating leases was $6,534, $6,377, and $5,587 for the years ended December 31, 2020, 2019, and 2018, respectively.
Non-cancelable future minimum lease commitments as of December 31, 2020 are:
|
| OPERATING |
| CAPITAL | ||
| | LEASES | | LEASES | ||
Year ending December 31, |
| |
|
| |
|
2021 | | $ | 6,023 | | $ | 304 |
2022 | |
| 4,698 | |
| 304 |
2023 | |
| 3,191 | |
| 25 |
2024 | |
| 2,559 | |
| — |
2025 | |
| 2,065 | |
| — |
Thereafter | |
| 2,372 | |
| — |
Non-cancelable future minimum lease payments | |
| 20,908 | |
| 633 |
Less amount representing interest | |
| — | |
| (40) |
Net non-cancelable future minimum lease payments | | $ | 20,908 | | $ | 593 |
13. Equity-Based Compensation
Class B Plan
The Company’s management, through the Company’s affiliation with its shareholder and former parent, EQT, participated in a 2017 Class B Profits Interest Unit Incentive Plan (the “Class B Plan”), whereby EQT was authorized to issue a total of 6,366,891 Profit Interest Units (“Class B Units”), representing the right to share a portion of the value appreciation in EQT.
The majority of the employee grant agreements for the Class B Units were comprised of 50% time-based vesting units (“Time-based Units”) and 50% performance-based vesting units (“Performance-based Units”). The Time-based Units generally vested over a five-year period; The Performance-based Units would vest if EQT achieved specified levels of return on investment at the time of i) a change in control, ii) a reduction in holdings of the Company by EQT to 10% or less following an IPO or iii) certain distributions to EQT. There were also certain grant agreements for the Class B Units that were entirely comprised of Time-based Units. Upon vesting, the holder of Class B Units received a right to a fractional portion of the profits and distributions of the parent in excess of a “participation threshold” determined in accordance with the EQT limited partnership agreement.
In addition to the performance conditions above, the Chief Executive Officer’s (“CEO”) performance-based Class B Units also vested if the aggregate value attributable to an IPO equaled or exceeded an amount equivalent to the return on investment performance targets.
The Class B Units were in a secondary position to the Class A units in EQT, in that in any event in which the EQT equity was valued and paid out, holders of the Class B Units would only be paid if an amount at least equal to the applicable participation threshold was first allocated to all of the outstanding classes of units under EQT’s limited
103
partnership agreement. In addition, EQT had the right, but not the obligation, to repurchase units at fair value upon certain events, such as a termination of employment. During the years ended December 31, 2020, 2019 and 2018, EQT repurchased 87,930, 241,601 and 100,000 Class B Units at their intrinsic value of $1,079, $703 and $1,100 respectively. These repurchases were funded through dividends paid by the Company to EQT. These Class B Units do not have a maximum contractual life, and as such, these Class B Units do not expire.
The fair value of the Time-based Units that vested solely upon continued employment was measured at the grant date and was recognized as cost over the employee’s requisite service period, which was generally 5 years. The expense related to the vesting of the Time-based Units was recorded on the Company’s books because the Company directly benefited from the services provided by Class B Unit holders. The grant date fair values were determined based on the pricing models and valuation assumptions noted in the following table, shown at their weighted-average values:
| | YEAR ENDED DECEMBER 31, |
| ||||
|
| 2020 |
| 2019 |
| 2018 |
|
Pricing model |
| Monte Carlo |
| Monte Carlo | | Black-Scholes | |
Expected dividend yield | | 0.0 | % | 0.0 | % | 0.0 | % |
Risk-free interest rate(1) |
| 0.3 | % | 1.6 | % | 2.2 | % |
Expected stock price volatility(2) |
| 59 | % | 55 | % | 50 | % |
Expected exercise term (in years)(3) |
| 2.3 |
| 2.0 | | 6.7 | |
| (1) | Based on the U.S. Treasury constant maturity interest rate whose term is consistent with the expected exercise term of our incentive units |
| (2) | In projecting expected stock price volatility, we consider the historical volatility of the stock prices of comparable public companies. |
| (3) | The Company estimates the expected life of incentive units based upon the timing of a potential liquidity event. |
A summary of the Class B Units activity for the period is presented below (dollar amounts are not in thousands):
|
| |
| WEIGHTED-AVERAGE |
| | | |
| | | | GRANT DATE | | WEIGHTED-AVERAGE | ||
| | | | FAIR VALUE | | EXERCISE PRICE PER | ||
| | UNITS | | PER UNIT | | UNIT | ||
Outstanding, as of December 31, 2019 |
| 5,436,299 | | $ | 3.53 | | $ | 11.43 |
Granted |
| 1,357,408 | |
| 7.39 | |
| 26.96 |
Exercised |
| (87,930) | |
| 3.55 | |
| 10.20 |
Forfeited |
| (377,626) | |
| 3.63 | |
| 10.31 |
Exchanged | | (6,328,151) | | | 4.37 | | | — |
Outstanding, December 31, 2020 |
| — | |
| — | |
| — |
Outstanding units represent the total of vested Class B Units and those expected to vest, including Time-based Units for which the requisite service period has not yet been rendered. Of those Class B Units that were vested and exercisable at December 31, 2019, the weighted-average distribution threshold was $10.16. The weighted-average grant date fair value per unit was $3.53 and $3.30 as of December 31, 2019 and 2018, respectively.
The aggregate intrinsic value of Class B Units outstanding, vested and exercisable at December 31, 2019 and 2018 was $38,440 and $5,499, respectively. There were no Class B Units outstanding as of December 31, 2020.
The total fair value of Class B Units vested and exercisable during 2019 and 2018 was $1,872 and $1,509, respectively. Equity-based compensation expense related to the Time-based Units was $2,776, $1,691, and $1,711 for the years ended December 31, 2020, 2019, and 2018, respectively. The Performance-based Units were not probable of vesting prior to the exchange of Class B Units for common shares, as described below; as such, no expense was recorded for these Units prior to the IPO. As of December 31, 2020, there were no unrecognized compensation costs related to the Units as they had been exchanged for restricted stock as discussed below.
104
Exchange
Effective as of December 10, 2020 (the “Exchange Date”), all vested Class B Units were exchanged by EQT for shares of common stock of the Company held by EQT, and unvested Class B Units were exchanged for shares of restricted common stock of the Company. On the Exchange Date, holders of unvested Time-based and Performance-based Units elected to either (1) exchange their unvested Class B Units with shares of restricted common stock of the Company that maintained the same vesting conditions (both time-based and performance-based) of such unvested Class B Units or (2) exchange their unvested Class B Units (both Time-based and Performance-based Units) with shares of restricted common stock of the Company that would be subject only to the same time-vesting conditions of such unvested Time-based Units, based on the original grant date. 53 holders of Class B Units elected the latter option. The CEO elected for the former option, based on the fact that his Performance-based Units vested upon the consummation of the offering. The number of shares of common stock exchanged by EQT for vested Class B Units and number of shares of restricted common stock exchanged by EQT for unvested Class B Units were based on their deemed value as of the date of the offering divided by the estimated per share offering price. The deemed value of Class B Units considered the overall implied value of the Company based on the offering price and considering their economic rights pursuant to the contractual waterfall and related distribution thresholds.
Based on the IPO price of $23.00 per share, the Company issued 5,941,693 shares of restricted common stock to holders of unvested Class B Units in exchange for such unvested Class B Units and holders of vested Class B Units received an aggregate of 4,211,598 shares of common stock in exchange for vested Class B Units.
Modification accounting was not required for the time-based vesting Class B Units for which the vesting conditions, classification and fair market value did not change as a result of the shares of restricted common stock that replaced them. The original grant date fair value will continue to be recognized on a straight-line basis.
Modification accounting was required for the performance-based vesting Class B Units that were exchanged for time-based vesting restricted common stock, given the vesting conditions were changed. Such performance-vesting Class B Units that were improbable of vesting were remeasured based on the modification date fair value of the shares of restricted common stock replacing such Class B Units. The total fair value of the restricted stock was $83,260. Because the service inception date preceded the grant date of the replacement awards, a catch up-adjustment of $56,487 was recorded at the modification date, based on the portion of the requisite service period that had elapsed since the original grant date for each tranche of the award. Considering the original awards contained performance conditions necessary to vest, the accelerated attribution approach was applied. The accelerated attribution approach results in cost being allocated to each of the tranches of the awards and recognized ratably over each tranche as if they were separate awards.
Separately, upon completion of the offering, $3,912 of compensation cost was recognized related to our Chief Executive Officer’s 853,001 performance-based Class B Units that automatically vested upon the IPO of the Company and were exchanged for 1,561,950 common shares of the Company.
105
Restricted Stock
As detailed above, unvested Class B Units were exchanged for restricted stock of the Company. Share based compensation for the restricted stock exchanged for the time-based Class B Units is recognized on a straight-line basis over the requisite service period of the award, which is generally 5 years. Share-based compensation for the restricted stock exchanged for the performance-based Class B Units is recognized using the accelerated attribution approach. A summary of the restricted stock is shown below:
| | | | WEIGHTED- | |
| | | | AVERAGE | |
| | | | GRANT DATE | |
|
| SHARES |
| FAIR VALUE | |
Non-vested restricted stock as of December 31, 2019 | | — | | $ | — |
Exchanged | | 5,941,693 | |
| 23.00 |
Granted | | — | | | — |
Vested | | — | |
| — |
Forfeited | | — | |
| — |
Non-vested restricted stock as of December 31, 2020 | | 5,941,693 | | $ | 23.00 |
The Company was not authorized and did not issue any restricted stock in 2018 or 2019.
Equity-based compensation expense related to the restricted stock exchanged for performance-based Class B Units was $57,421 for the year ended December 31, 2020. At December 31, 2020, the total unrecognized equity-based compensation expense related to outstanding restricted stock recognized using the accelerated attribution approach was $25,838, which is expected to be recognized over a weighted-average period of 29 months.
Equity-based compensation expense related to the restricted stock exchanged for time-based Class B Units was $167 for the year ended December 31, 2020. At December 31, 2020, the total unrecognized equity-based compensation expense related to outstanding restricted stock recognized using the straight-line attribution approach was $9,599, which is expected to be recognized over a weighted-average period of 43 months.
2020 Incentive Plan
In order to align our equity compensation program with public company practices, the Company’s Board of Directors adopted and stockholders approved the 2020 Incentive Plan. The 2020 Incentive Plan allows for grants of non-qualified stock options, incentive stock options, restricted stock, and restricted stock units (RSUs) to employees, directors and officers, and consultants or advisors of the Company. The 2020 Incentive Plan allows for 20,000,000 shares (the “plan share reserve”) of common stock to be issued. No more than the number of shares of common stock equal to the plan share reserve may be issued in the aggregate pursuant to the exercise of incentive stock options. The maximum number of shares of common stock granted during a single fiscal year to any non-employee director, taken together with any cash fees paid to such non-employee director during the fiscal year, may not exceed $1,000,000 in total value, except for certain awards made to a non-executive chair of our board of directors.
The plan share reserve will be increased on the first day of each fiscal year beginning with the 2021 fiscal year and ending after the tenth anniversary of the effective date in an amount equal to the lesser of (i) the positive difference, if any, between (x) 4.0% of the outstanding common stock on the last day of the immediately preceding fiscal year and (y) the plan share reserve on the last day of the immediately preceding fiscal year and (ii) a lower number of shares of our common stock as determined by our board of directors.
Restricted Stock Units
Restricted stock units (RSUs) represent the right to receive shares of the Company’s common stock at a specified date in the future. In December 2020, the Company granted 30,228 RSUs under the 2020 Incentive Plan that vest over a six-month period. The fair value of the RSUs is based on the fair value of the underlying shares on the date of grant.
106
A summary of the Company’s RSU activity is as follows:
| | | | WEIGHTED- | |
| | | | AVERAGE | |
| | | | GRANT DATE | |
|
| UNITS |
| FAIR VALUE | |
Non-vested RSUs as of December 31, 2019 |
| — | | $ | — |
Granted |
| 30,228 | |
| 23.00 |
Vested |
| — | |
| — |
Forfeited |
| (176) | |
| 23.00 |
Non-vested RSUs as of December 31, 2020 |
| 30,052 | | $ | 23.00 |
Equity-based compensation expense related to the RSUs was $81 for the year ended December 31, 2020. At December 31, 2020, the total unrecognized equity-based compensation expense related to outstanding RSUs was $611, which is expected to be recognized over a weighted-average period of 5 months.
2020 Employee Stock Purchase Plan
On December 10, 2020, stockholders approved the 2020 Employee Stock Purchase Plan (the “Employee Stock Purchase Plan”). Under the Employee Stock Purchase Plan, employees, and those of the Company’s subsidiaries, may purchase shares of common stock, during pre-specified offering periods. Named executive officers will be eligible to participate in the Employee Stock Purchase Plan on the same terms and conditions as all other participating employees. The maximum number of shares authorized for sale under the Employee Stock Purchase Plan is 1,700,000 shares.
Generally, all employees and those of the Company’s subsidiaries will be eligible to participate in the Employee Stock Purchase Plan, except for employees who own 5% or more of the combined voting power or value of all issued and outstanding stock. Employees may contribute through payroll deductions of 1% to 15% of such employees’ base compensation on each payroll date that falls within an offering period. Participants may not acquire rights to purchase more than $25 of common stock under the Employee Stock Purchase Plan for any calendar year. Common stock will be available for purchase for up to 27 months, with an expected period of six months, beginning in 2021.
Shares will be purchased at a discounted per-share purchase price equal to 85% of the per-share closing price of the Company’s common stock on the last day of the applicable offering period.
As of December 31, 2020, no shares of common stock have been purchased under the Employee Stock Purchase Plan and no offering has been made to eligible employees under the Plan.
Equity-based compensation expense
The following table summarizes the components of total equity-based compensation expense included in the Consolidated Statements of Operations and Comprehensive Loss for each period presented:
| | YEAR ENDED DECEMBER 31, | |||||||
|
| 2020 |
| 2019 |
| 2018 | |||
Cost of revenues | | $ | 8,805 | | $ | 156 | | $ | 138 |
Sales and marketing | |
| 7,390 | |
| 110 | |
| 95 |
Research and development | |
| 7,133 | |
| 121 | |
| 121 |
General and administrative expenses | |
| 41,179 | |
| 1,304 | |
| 1,357 |
Total | | $ | 64,507 | | $ | 1,691 | | $ | 1,711 |
107
14. Segment data
Operating segments are defined as components of an enterprise about which separate financial information is available that is evaluated regularly by the chief operating decision maker (“CODM”), in deciding how to allocate resources and in assessing performance.
The Company has determined that its chief executive officer (“CEO”) is its CODM. The Company manages its operations as a single segment for the purpose of assessing and making operating decisions. The Company’s CODM allocates resources and assesses performance based upon financial information at the consolidated level. Since the Company operates in one operating segment, all required financial segment information can be found in the consolidated financial statements.
The following table summarizes revenue by geographic area:
|
| YEAR ENDED DECEMBER 31, | |||||||
|
| 2020 |
| 2019 |
| 2018 | |||
Revenue(1): |
| |
|
| |
|
| |
|
United States | | $ | 181,049 | | $ | 152,368 | | $ | 116,765 |
EMEA | |
| 42,844 | |
| 40,299 | |
| 34,259 |
Others | |
| 19,637 | |
| 15,844 | |
| 12,695 |
Total | | $ | 243,530 | | $ | 208,511 | | $ | 163,719 |
| (1) | Revenue is attributable to the countries based on the location of the customer |
The following table summarizes property, plant and equipment, net by geographic area as of December 31, 2020 and 2019:
| | DECEMBER 31, | ||||
|
| 2020 |
| 2019 | ||
Property, plant and equipment, net: |
| |
|
| |
|
United States | | $ | 2,669 | | $ | 2,825 |
EMEA | |
| 817 | |
| 1,243 |
Others | |
| 386 | |
| 555 |
Total | | $ | 3,872 | | $ | 4,623 |
15. Income Taxes
The components of loss before income taxes were as follows:
| | YEAR ENDED DECEMBER 31, | |||||||
|
| 2020 |
| 2019 | | 2018 | |||
Domestic | | $ | (55,355) | | $ | (12,995) | | $ | (35,318) |
Foreign | |
| 5,174 | | | 3,844 | |
| 2,757 |
Total | | $ | (50,181) | | $ | (9,151) | | $ | (32,561) |
108
The components of income tax expense (benefit) were as follows:
| | YEAR ENDED DECEMBER 31, | |||||||
|
| 2020 | | 2019 |
| 2018 | |||
Current tax expense (benefit) |
| |
| | | |
| |
|
Federal | | $ | 326 | | $ | 483 | | $ | (300) |
State and local | |
| 1,659 | | | 1,692 | |
| 312 |
Foreign | |
| 4,634 | | | 4,303 | |
| 4,233 |
Total current | |
| 6,619 | | | 6,478 | |
| 4,245 |
Deferred tax expense (benefit) | |
|
| | | | |
|
|
Federal | |
| (3,620) | | | 3,137 | |
| (3,207) |
State and local | |
| 276 | | | (5,431) | |
| (603) |
Foreign | |
| (4,059) | | | (4,409) | |
| 262 |
Total deferred | |
| (7,403) | | | (6,703) | |
| (3,548) |
Total (benefit) provision | | $ | (784) | | $ | (225) | | $ | 697 |
The effective income tax rate was 1.56%, 2.46%, and (2.14%) for the years ended December 31, 2020, 2019 and 2018, respectively. The primary reconciling items between the statutory income tax rate of 21% and the effective income tax rate were as a result of the following:
| | DECEMBER 31, | | |||||||||||||
|
| 2020 |
| 2019 | | 2018 |
| |||||||||
Tax at U.S. federal statutory rate | | $ | (10,538) |
| 21.00 | % | $ | (1,919) | | 21.00 | % | $ | (6,833) |
| 21.00 | % |
State taxes, net of federal benefit | |
| 1,125 |
| (2.24) | | | (3,852) | | 42.14 | |
| (357) |
| 1.10 | |
Foreign rate differential | |
| 2,296 |
| (4.58) | | | 1,654 | | (18.09) | |
| 5,170 |
| (15.89) | |
Permanent items | |
| (139) |
| 0.28 | | | (177) | | 1.93 | |
| 457 |
| (1.42) | |
Equity compensation | | | 13,562 | | (27.03) | | | 412 | | (4.51) | | | 359 | | (1.10) | |
GILTI inclusion | | | 932 | | (1.86) | | | 570 | | (6.24) | | | 479 | | (1.47) | |
Tax credits | |
| (7,618) |
| 15.18 | | | (4,264) | | 46.65 | |
| (2,625) |
| 8.07 | |
Rate change | | | 2,076 | | (4.14) | | | (2,922) | | 31.97 | | | — | | 0.00 | |
Other adjustments | |
| 1,223 |
| (2.43) | | | 3,736 | | (40.87) | |
| 549 |
| (1.68) | |
Return to provision adjustments | |
| (103) |
| 0.21 | | | (139) | | 1.52 | |
| — |
| 0.00 | |
Valuation allowance | |
| (3,600) |
| 7.17 | | | 6,676 | | (73.04) | |
| 3,498 |
| (10.75) | |
Effective tax rate | | $ | (784) |
| 1.56 | % | $ | (225) | | 2.46 | % | $ | 697 |
| (2.14) | % |
A portion of the Company’s income was attributable to Madeira, Portugal, which qualified for special tax programs authorized by the European Union. For the period of 2008 through 2011, the Company was subject to Madeira's income tax rate of 0%, for 2012 an income tax rate of 4% applied, and for the period of 2013 through 2020 an income tax rate of 5% applied.
109
The tax effects of temporary differences that gave rise to deferred tax assets and liabilities are summarized as follows:
|
| DECEMBER 31, | ||||
|
| 2020 |
| 2019 | ||
Deferred tax assets |
| |
|
| |
|
Accounts receivable | | $ | 29 | | $ | 23 |
Accrued compensation | |
| 4,222 | |
| 2,868 |
Accrued expenses | |
| 137 | |
| 810 |
Net operating loss carryforwards | |
| 5,229 | |
| 5,807 |
R&D credit carryforward | |
| 7,054 | |
| 4,005 |
Foreign tax credits | |
| 12,485 | |
| 8,513 |
Interest rate hedge | |
| 925 | |
| 520 |
Other assets | |
| 115 | |
| 242 |
Interest expense | |
| 869 | |
| 5,406 |
Total gross deferred tax asset | |
| 31,065 | |
| 28,194 |
Less: Valuation allowance | |
| (16,715) | |
| (20,546) |
Net deferred tax asset | |
| 14,350 | |
| 7,648 |
Deferred tax liabilities | |
|
| |
|
|
Property, equipment, and other long-lived assets | |
| (359) | |
| (307) |
Goodwill and intangible assets | |
| (83,935) | |
| (85,664) |
Prepaid expenses | |
| (1,724) | |
| (786) |
Deferred revenue | |
| (1,482) | |
| (2,218) |
Total gross deferred tax liability | |
| (87,500) | |
| (88,975) |
Net deferred tax liability | | $ | (73,150) | | $ | (81,327) |
The net change in the total valuation allowance resulted in a decrease of $3,831 in 2020 compared to an increase of $7,439 in 2019. The valuation allowance was determined separately for each jurisdiction. A U.S. valuation allowance was required against the foreign tax credit carryforward. At the foreign subsidiaries, the valuation allowance was primarily related to foreign net operating losses that, in the judgment of management, are not more likely than not to be realized. The Company released the valuation allowance against certain U.S. carryforwards and foreign tax credits, as management deemed such attributes more likely than not to be realized.
In assessing the realizability of deferred tax assets, management considered whether it is more likely than not that some portion or all of the deferred tax assets will not be realized. The ultimate realization of deferred tax assets is dependent upon the generation of future taxable income during the periods in which those temporary differences become deductible and carryforward attributes can be utilized. Management considered the reversal of deferred tax liabilities in making this assessment. Management believes it is more likely than not that the Company will realize the benefits of the deferred tax assets, net of the existing valuation allowance, at December 31, 2020.
At December 31, 2020, the Company has net operating loss carryforwards for federal income tax purposes of approximately $3,350, majority of which will expire if unused in years 2024 through 2036. The Company has net operating loss carryforwards for state income tax purposes of approximately $3,021, which will expire if unused in years 2029 through 2038. The Company has foreign net operating loss carryforwards of $16,115 which will expire if unused starting in 2022.
The Company has $2,268 of federal research and development credits that will expire if unused in years 2024 through 2040, $570 of California research and development credits with indefinite carryover period, and $2,504 of foreign research and development credits that will expire if unused in years 2029 through 2030. The Company has foreign tax credits of $12,485 that will expire if unused in years 2025 through 2030, and also Canadian investment tax credits of $2,722 which will expire if unused in years 2030 through 2039.
110
The Company has net operating losses and tax credits that are subject to limitation under Internal Revenue Code Section 382 and Section 383 due to changes in ownership. The Company has analyzed the realizability of these tax attributes carried forward and have recorded deferred tax assets for the attributes that meet the more-likely-than-not realizability threshold.
Foreign undistributed earnings were considered permanently invested, therefore no provision for US income taxes was accrued as of December 31, 2020 and 2019, with the exception of the withholding tax liability of $168 on the potential repatriation from Certara Canada Corporation.
The Company assessed its uncertain tax positions and determined that a liability of $897 and $690 was required to be recorded for uncertain tax positions as of December 31, 2020 and 2019, respectively. Uncertain tax positions relate primarily to federal and state R&D credits. The Company's policy is to recognize interest and penalties as a component of the provision for income taxes. For December 31, 2020 and 2019, there were no interest or penalties recorded. The Company does not anticipate any significant changes to its uncertain tax positions during the next twelve months.
A reconciliation of the beginning and ending balance of unrecognized tax benefits is as follows:
Balance at December 31, 2018 |
| $ | 592 |
Additions for tax positions related to the current year | |
| 68 |
Additions for tax positions of prior years | |
| 30 |
Balance at December 31, 2019 | |
| 690 |
Additions for tax positions related to the current year | |
| 198 |
Additions for tax positions of prior years | |
| 9 |
Balance at December 31, 2020 | | $ | 897 |
The uncertain tax positions, exclusive of interest and penalties, were $897 and $690 as of December 31, 2020 and December 31, 2019, respectively, which also represents potential tax benefits that if recognized, would impact the effective tax rate.
The audits of the federal income tax returns for the tax year ended December 31, 2016 and December 31, 2017 are closed. The Internal Revenue Service can audit the NOLs generated in respective years in the years that the NOLs are utilized. State income tax returns are generally subject to examination for a period of three to six years after the filing of the respective return. The state impact of any federal changes remains subject to examination by various states for a period of up to one year after formal notification to the states. Foreign income tax returns are generally subject to examination based on the tax laws of the respective jurisdictions.
The Company is subject to tax on Global Intangible Low-Taxed Income (GILTI) and has elected to account for GILTI as a current period expense.
On March 27, 2020, the Coronavirus Aid, Relief, and Economic Security (CARES) Act was enacted and implemented certain tax legislation, among which temporarily increases the interest expense limitation pursuant to Section 163(j), allows for acceleration of refunds of alternative minimum tax (AMT) credits, and retroactively clarified the immediate recovery of qualified improvement property costs under 100% expensing rather than 39 year recovery period for assets placed in service after November 27, 2017. The Company was able to deduct all of its' interest expense incurred during 2020, as a result of the CARES Act.
111
16. Net Loss per Share
Basic and diluted loss per share is computed by dividing net loss by the weighted-average shares outstanding:
| |
| YEAR ENDED DECEMBER 31, | |||||||
| |
| 2020 |
| 2019 |
| 2018 | |||
Numerator: | |
| |
|
| |
|
| |
|
Net loss | | | $ | (49,397) | | $ | (8,926) | | $ | (33,258) |
Denominator: | | |
|
| |
|
| |
|
|
Weighted average common shares outstanding, basic and diluted | | |
| 133,247,212 | |
| 132,407,786 | |
| 132,407,786 |
Net loss per common share, basic and diluted | | | $ | (0.37) | | $ | (0.07) | | $ | (0.25) |
The Company had 5,941,693 restricted share awards that were excluded from the calculation of diluted EPS during the year ended December 31, 2020 that could potentially dilute EPS in the future due to being in a net loss position. During the years ended December 31, 2019 and 2018, there were no potentially dilutive securities outstanding.
112
Item 9. Changes in and Disagreements With Accountants on Accounting and Financial Disclosure.
None.
Item 9A. Controls and Procedures.
Evaluation of Disclosure Controls and Procedures
Under the supervision and with the participation of our management, including our Chief Executive Officer and Chief Financial Officer, we evaluated the effectiveness of the design and operation of our disclosure controls and procedures pursuant to Rule 13a-15(e) and 15d-15(e) under the Exchange Act as of the end of the period covered by this report. Our disclosure controls and procedures are designed to ensure that information required to be disclosed in the reports we file or submit under the Exchange Act is recorded, processed, summarized and reported within the time periods specified in the SEC’s rules and forms, and that such information is accumulated and communicated to our management, including the Chief Executive Officer and the Chief Financial Officer, to allow timely decisions regarding required disclosures. Any controls and procedures, no matter how well designed and operated, can provide only reasonable assurance of achieving the desired control objective and management necessarily applies its judgment in evaluating the cost-benefit relationship of possible controls and procedures. Based on that evaluation, our Chief Executive Officer and Chief Financial Officer have concluded that our disclosure controls and procedures were effective at a reasonable assurance level as of December 31, 2020.
Management’s Annual Report on Internal Control over Financial Reporting
This Annual Report does not include a report of management’s assessment regarding internal control over financial reporting or an attestation report of our independent registered public accounting firm due to a transition period established by the rules of the SEC for newly public companies.
Changes in Internal Control over Financial Reporting
There was not any change in our internal control over financial reporting (as such term is defined in Rules 13a-15(f) under the Exchange Act) during the year ended December 31, 2020 that has materially affected, or is reasonably likely to materially affect, our internal control over financial reporting.
None.
113
Item 10. Directors, Executive Officers and Corporate Governance.
We have adopted a Code of Conduct (the “Code of Conduct”) applicable to all employees, executive officers and directors that addresses legal and ethical issues that may be encountered in carrying out their duties and responsibilities, including the requirement to report any conduct they believe to be a violation of the Code of Conduct. The Code of Conduct is available on our website, www.certara.com. The information available on or through our website is not part of this annual report. If we ever were to amend or waive any provision of our Code of Conduct that applies to our principal executive officer, principal financial officer, principal accounting officer or any person performing similar functions, we intend to satisfy our disclosure obligations with respect to any such waiver or amendment by posting such information on our internet website set forth above rather than by filing a Form 8-K.
The remaining information required under this item is incorporated herein by reference to our definitive proxy statement (the “Proxy Statement”) pursuant to Regulation 14A under the Securities Exchange Act of 1934, as amended, which Proxy Statement is expected to be filed with Securities and Exchange Commission not later than 120 days after the close of our fiscal year ended December 31, 2020.
Item 11. Executive Compensation.
EXECUTIVE COMPENSATION
As an “emerging growth company” as defined in the JOBS Act, we have opted to comply with the executive compensation rules applicable to “smaller reporting companies,” as such term is defined under the under the Securities Act of 1933, as amended, (the “Securities Act”), which require compensation disclosure for our principal executive officer and the two most highly compensated executive officers other than our principal executive officer. The following table sets forth information concerning the compensation earned by or paid to our named executive officers (“NEOs”), during our fiscal years ended December 31, 2020 (“fiscal year 2020”) and December 31, 2019 (“fiscal year 2019”). As an “emerging growth company,” we are not required to include a Compensation Discussion and Analysis section and have elected to comply with the scaled disclosure requirements applicable to emerging growth companies.
SUMMARY COMPENSATION TABLE
|
| |
| |
| |
| |
| NON-EQUITY |
| |
| |
| | | | | | | | EQUITY | | INCENTIVE PLAN | | ALL OTHER | | |
| | | | SALARY | | BONUS | | AWARDS | | COMPENSATION | | COMPENSATION | | |
NAME AND PRINCIPAL POSITION |
| YEAR |
| ($) |
| ($)(1) |
| ($)(2) |
| ($)(3) |
| ($)(4) |
| TOTAL ($) |
William F. Feehery. |
| 2020 |
| 772,500 |
| — |
| 2,238,677 |
| 602,550 |
| 12,514 |
| 3,626,241 |
Chief Executive Officer | | 2019 | | 437,500 | | — | | 2,792,621 | | 274,838 | | 3,022 | | 3,507,981 |
Leif E. Pedersen |
| 2020 |
| 119,471 |
| 116,500 |
| 1,572,000 |
| 58,254 |
| 1,172 |
| 1,867,397 |
President, Software | | | | | | | | | | | | | | |
Andrew Schemick | | 2020 | | 362,602 | | — | | 1,199,515 | | 235,691 | | 8,919 | | 1,806,727 |
Chief Financial Officer | | | | | | | | | | | | | | |
| (1) | Amount reported in this column reflects a signing bonus granted to Mr. Pedersen upon his joining the Company on September 7, 2020. |
| (2) | Amounts reported in this column reflect the aggregate grant date fair value of Class B Units granted on August 31, 2020.] See Note [2(r)] (“Summary of Significant Accounting Policies — Equity-based compensation”) and Note [13] (“Equity-Based Compensation”) to our audited consolidated financial statements included elsewhere in this report for a discussion of the valuation of our equity-based awards. |
| (3) | Amounts shown reflect annual bonus payments under our Corporate Incentive Plan earned with respect to the fiscal year covered based on the achievement of financial and strategic performance objectives that were established by our Compensation Committee at the beginning of such fiscal year. See “— Non-Equity Incentive Plan Compensation’’ below. |
114
| (4) | Amounts in this column for (i) Dr. Feehery, reflect Company paid life insurance premiums and Company contributions to our 401 (k) Plan, (ii) Mr. Pedersen, reflect our contributions under our 401(k) Plan; and (iii) Mr. Schemick, reflect our contributions under our 401(k) Plan. For additional information on our policy on Company contributions to 401(k) Plan, see “— Retirement Benefits” below.” |
Non-Equity Incentive Plan Compensation
We maintain an annual cash-based Corporate Incentive Plan (the “CIP”) to motivate our employees to achieve short-term performance goals. For fiscal year 2020, Dr. Feehery, Mr. Pedersen, and Mr. Schemick participated in the CIP.
Incentive awards and bonus payouts under the CIP are based on the achievement of certain corporate and divisional goals established by our compensation committee at the beginning of each year. For 2020, for Dr. Feehery and Mr. Schemick, 20% of their respective bonus payouts were tied to the achievement of company-wide, EBITDA and 80% were tied to the performance of different divisions within the company (the “Blended Rate”). For Mr. Pedersen, 20% of his CIP bonus was based on company-wide EBITDA, and 80% was based on the performance of the Software division (the "Division Rate").
The 2020 target incentive opportunities under the CIP for the NEO participants were based on a percentage of base salary. The amounts paid to the NEO participants under the CIP were calculated by multiplying each NEO participant’s target incentive opportunity by a factor tied to actual EBITDA achieved versus target EBITDA. For achievement above the threshold level, the multiplying factor was based on the pre-determined scale, with the Compensation Committee retaining some discretion to adjust the final payout based on individual performance metrics or other relevant factors. For Dr. Feehery and Mr. Schemick, that factor was 130%. For Mr. Pedersen, that factor was 106%. Mr. Pedersen's bonus was also prorated based on his actual salary earned between his start date with the Company on September 7, 2020, and the end of 2020.
The following table illustrates the calculation of the non-equity incentive plan awards payable to each of the NEO participants under our CIP for fiscal 2020.
|
| | |
| |
| | |
| COMBINED |
| |
|
| | | | | | | | | | PERFORMANCE | | | |
| | | | | | | | | | FACTOR(1) | | | |
| | | | | TARGET BONUS | | BONUS PAYOUT AT | | (% OF TARGET | | TOTAL BONUS | | |
NAME |
| SALARY ($) |
| (% OF SALARY) |
| TARGET ($) |
| ACHIEVEMENT) |
| PAYOUT FOR 2020 ($) | | ||
Dr. Feehery |
| | 772,500 | | 60 | % | | 463,500 |
| 130 | % | 602,550 | |
Mr. Pedersen |
| | 119,471 | | 46 | % | | 54,957 |
| 106 | % | 58,254 | |
Mr. Schemick |
| | 362,602 |
| 50 | % | | 181,301 |
| 130 | % | 235,691 | |
Employment Arrangements
William F. Feehery
Effective as of May 14, 2019, we entered into an employment agreement with Dr. Feehery (the “Feehery Agreement”) to serve as our CEO commencing on June 3, 2019. The Feehery Agreement provides for an initial annual base salary and an annual target bonus of 60% of such base salary based upon achievement of specific individual and company performance objectives to be established by our Board of Directors or Compensation Committee. Dr. Feehery’s base salary is subject to possible increases, as approved by our Compensation Committee. Effective January 1, 2020, Dr. Feehery’s annual base salary was increased to $772,500.
Pursuant to the Feehery Agreement, in the event Dr. Feehery’s employment is terminated by us without “cause” or by Dr. Feehery for “good reason” (each as defined in the Feehery Agreement) and Dr. Feehery executes and does not revoke a general release of claims in favor of us and complies with the restrictive covenants to which he is subject following such termination, then Dr. Feehery will receive (i) any unpaid annual bonus in respect of any completed fiscal year that has ended prior to the date of such termination, payable in a lump sum at such time as annual bonuses are paid to our other senior executives, (ii) subject to satisfaction of the applicable performance objectives, a pro rata portion of the annual bonus otherwise payable to Dr. Feehery for the fiscal year in which such termination occurs, based on the
115
number of days he was employed, (iii) the sum of his base salary plus his target bonus amount, payable in substantially equal payments over 12 months following such termination, (iv) monthly payments for 12 months following such termination equal to the difference between the monthly COBRA premium cost for the health care coverage elected by Dr. Feehery under the Company’s group health plan and the monthly contribution paid by active employees for the same level of coverage (subject to mitigation, to the extent Dr. Feehery and his dependents become eligible to receive any health benefits as a result of Dr. Feehery’s subsequent employment or service) and (v) all accrued but unpaid obligations.
In the event that any payment, benefit or distribution pursuant to the terms of the Feehery Agreement or otherwise becomes subject to the excise taxes under Section 4999 of the Code, such payments will be subject to reduction to an amount equal to 2.99 times Dr. Feehery’s “base amount” (as defined in Section 280G(b)(3) of the Code) to the extent that such reduction will produce a more favorable after-tax result for Dr. Feehery.
Dr. Feehery is party to a restrictive covenants agreement that contains indefinite covenants of confidentiality of information and non-disparagement, covenants of non-competition and non-solicitation of our employees and customers during employment and for the one-year period thereafter.
Leif E. Pedersen
Effective as of July 30, 2020, we entered into an employment agreement with Mr. Pedersen (the “Pedersen Agreement”). The Pedersen Agreement provided for an initial annual base salary of $375,000 and an annual target bonus of 46% of such base salary. Mr. Pedersen’s base salary is subject to annual review and possible increases, as we may determine from time to time. Mr. Pedersen also received a one-time signing bonus of $116,500, which is subject to a repayment by Mr. Pedersen if he leaves the Company within 12 months of his start date, other than for “good reason” (as defined in the Pedersen Agreement) or is terminated for “cause” (as defined in the Pedersen Agreement), prorated by the number of months he was within the Company prior to termination.
Pursuant to the Pedersen Agreement, in the event Mr. Pedersen’s employment is terminated by us without “cause” or by Mr. Pedersen for “good reason” and Mr. Pedersen executes and does not revoke a general release of claims in favor of us and complies with the restrictive covenants to which he is subject following such termination, then Mr. Pedersen will receive (i) continuation of his base salary for 6 months following such termination and (ii) all accrued but unpaid obligations, including any unpaid annual bonus that has been authorized by us and approved by our CEO in respect of any completed fiscal year that has ended prior to the date of such termination.
The Pedersen Agreement also imposes certain restrictive covenants on Mr. Pedersen, including indefinite covenants of confidentiality of information and non-disparagement, covenants relating to intellectual property and covenants of non-competition during employment and for the one-year period thereafter and non-solicitation of our employees and customers during employment and for the two-year period thereafter.
Andrew Schemick
Effective as of July 11, 2014, we entered into an employment agreement with Mr. Schemick (the “Schemick Agreement”). The Schemick Agreement provided for an initial annual base salary and an initial discretionary bonus of up to 30% of such base salary. Mr. Schemick’s base salary is subject to annual review and possible increases, as we may determine from time to time. Effective January 1, 2020, Mr. Schemick’s 2020 base salary was increased to $360,500. The Compensation Committee further increased his salary and target bonus percentage, effective December 11, 2021, to $400,000 and 50%, respectively.
Pursuant to the Schemick Agreement, in the event Mr. Schemick’s employment is terminated by us without “cause” or by Mr. Schemick for “good reason” (each as defined in the Schemick Agreement) and Mr. Schemick executes and does not revoke a general release of claims in favor of us and complies with the restrictive covenants to which he is subject following such termination, then Mr. Schemick will receive (i) continuation of his base salary for 12 months following such termination and (ii) all accrued but unpaid obligations, including any unpaid annual bonus that has been authorized
116
by us and approved by our CEO in respect of any completed fiscal year that has ended prior to the date of such termination.
The Schemick Agreement also imposes certain restrictive covenants on Mr. Schemick, including indefinite covenants of confidentiality of information and non-disparagement, covenants relating to intellectual property and covenants of non-competition during employment and for the one-year period thereafter and non-solicitation of our employees and customers during employment and for the two-year period thereafter.
Outstanding Equity Awards at 2020 Year End
The following table includes certain information with respect to equity awards held by the Named Executive Officers as of December 31, 2020.
OUTSTANDING EQUITY AWARDS AT FISCAL YEAR END
| | | | | | MARKET | |
| | | | | | VALUE OF | |
| | | | NUMBER OF | | SHARES | |
| | | | SHARES OR | | OF UNITS | |
| | | | UNITS OF | | OF STOCK | |
| | | | STOCK THAT | | THAT HAVE | |
| | | | HAVE | | NOT | |
| | | | NOT VESTED | | VESTED | |
NAME |
| GRANT DATE (1) |
| (#)(2) |
| ($) | |
William F. Feehery |
| — |
| — |
| | — |
Restricted Stock Award |
| 6/3/2019 |
| 862,239 |
| $ | 29,074,699 |
Restricted Stock Award | | 8/31/2020 | | 182,368 | | $ | 6,149,449 |
Leif E. Pedersen |
| — |
| — |
| | — |
Restricted Stock Award |
| 9/9/2020 |
| 256,118 |
| $ | 8,636,299 |
Andrew Schemick |
| — |
| — |
| | — |
Restricted Stock Award |
| 8/15/2017 |
| 187,659 |
| $ | 6,327,861 |
Restricted Stock Award |
| 8/31/2020 |
| 195,431 |
| $ | 6,589,933 |
| (1) | Represents the original grant date of the Class B Units that were exchanged for restricted stock awards on December 10, 2020 in connection with the IPO. See “—Equity Awards”. |
| (2) | Consists of shares of time-based vesting restricted stock. See “— Equity Awards.” |
Equity Awards
On November 17, 2017, the EQT 2017 Incentive Plan was established under the terms of the Partnership Agreement of EQT Avatar Parent, L.P. (“EQT”) to provide our employees, including our executives, as well as our directors and consultants, with incentives to align their interests with the interests of our then sole shareholder, EQT. Prior to our IPO, equity awards granted to our NEOs were made by EQT pursuant to the 2017 Incentive Plan. The 2017 Incentive Plan was terminated in connection with our IPO. On August 31, 2020, under 2017 EQT Incentive Plan, Dr. Feehery was granted 284,819 Class B Units; and Mr. Schemick was granted 152,610 Class B Units. On September 9, 2020, Mr. Pedersen was granted 200,000 Class B Units. The Class B Units were “profits interests” under U.S. federal income tax law having economic characteristics similar to stock appreciation rights (i.e., representing the rights to share in any increase in the equity value of EQT that exceeds specified thresholds).
In connection with our IPO, on December 10, 2020, all outstanding unvested Class B Units, including those held by our NEOs, were exchanged for newly issued shares of our restricted common stock on the basis of a ratio that took into account the number of unvested Class B Units held, the applicable distribution threshold applicable to such Class B Units and the value of distributions that the holder would have been entitled to receive had EQT liquidated on the date of such replacement in accordance with the terms of the distribution “waterfall” set forth in the Partnership Agreement. Vested Class B Units were exchanged into shares of our common stock held by EQT using the same formula. The
117
unvested restricted shares of our common stock that the NEOs received in respect of their time-based vesting Class B Units were subject to the same time-vesting schedule that applied to such time-vesting Class B Units, provided that, with the exception of Dr. Feehery’s shares, such restricted shares will not vest upon a change of control unless such NEO's employment is terminated without cause following such change of control. For Dr. Feehery, his restricted shares will vest upon a change of control regardless of whether his employment is terminated. For Mr. Pedersen and Mr. Schemick, the unvested restricted shares of our common stock that they received in respect of their performance-based vesting Class B Units are no longer subject to any performance-based vesting conditions and such restricted shares vest as to 20% of such restricted shares on each anniversary of the grant date of such performance-based vesting Class B Units, subject to such NEO’s continued employment through each applicable vesting date, provided, that such restricted shares will vest upon the termination of such NEO's employment without cause following a change of control. For Dr. Feehery, his performance-based Class B Units fully vested upon the IPO and were replaced with shares of common stock.
As of December 31, 2020, following the completion of the exchanges of Class B Units described above, except for the restricted stock granted to Dr. Feehery, the unvested restricted shares granted to our NEOs vest as to 20% of the recipient’s time-based vesting Class B Unit award on each anniversary of the grant date of such Class B Unit award, subject to the NEO’s continued employment through each applicable vesting date. The unvested restricted shares granted to Dr. Feehery outstanding as of December 31, 2020 vest as to 25% of Dr. Feehery’s time-based vesting Class B Unit award on the first anniversary of the grant date of such Class B Unit award, and as to 2.0833% monthly thereafter, subject to his continued employment.
As a condition to receiving the grant (which was subsequently exchanged for shares of our common stock as noted above), each employee, including each NEO, entered into the Company’s standard form of restrictive covenants agreement that contains an indefinite covenant of confidentiality of information and covenants of non-competition and non-solicitation of our employees and customers during employment and for the one-year period thereafter.
Except as provided above, all vesting of shares of restricted stock will cease immediately upon an NEO’s termination of employment for any reason and all unvested shares of restricted stock will be immediately cancelled and forfeited without consideration upon such termination. With respect to the unvested shares of restricted stock granted to Dr. Feehery, upon his termination of employment without cause, for good reason or due to death or disability, such unvested shares of restricted stock that are scheduled to vest during the 12-month period following such termination will immediately vest on termination.
Retirement Benefits
U.S. 401(k) Plan
We maintain a tax-qualified defined contribution 401(k) savings plan (the “401(k) Plan”), in which all our U.S.-based employees, including our U.S.-based NEOs, are eligible to participate. The 401(k) Plan allows participants to contribute up to 100% of their compensation on a pre-tax basis (or on a post-tax basis, with respect to elective Roth deferrals) into individual retirement accounts, subject to the maximum annual limits set by the Internal Revenue Service. The 401(k) Plan also allows us to make employer matching contributions. We have historically made employer matching contributions of up to 50% of our employees’ deferral, limited to the first 6% of each employee’s compensation, except for one division for which we matched 100% of our employees’ deferral up to 6% of compensation. In 2020, we contributed $1,685,061 in total employer contributions on behalf of our U.S.-based employees. Participants are immediately fully vested in their own contributions to the 401(k) Plan. Participants vest in the matching contributions we make to their accounts after four years of service, at the rate of 25% per year, except for one division in which they fully vest after three years.
Director Compensation
In connection with our IPO and effective as of December 11, 2020, our board of directors adopted a new non-employee director compensation plan (the “new director compensation plan”). Prior to the adoption of the new director compensation plan, our previous director compensation plan for 2020 (the “prior director compensation plan”) provided
118
an annual cash retainer of $40,000 for each member of our board who was not employed by us or by Arsenal or EQT, except that effective August 26, 2020, the annual cash retainers for each of Messrs. Slaine and Cashman were increased to $50,000. Mr Walsh also was granted an annual cash retainer of $50,000 and 113,695 Class B Units of EQT, pursuant to the EQT 2017 Incentive Plan, when he joined the Board on August 26, 2020. The prior director compensation plan also provided Ms. McCoy with an additional annual cash retainer of $125,000 as Chairperson of our board.
Our new director compensation plan applies to each member of the board of directors who is not an employee of us or any of our parents or subsidiaries and provides:
| ● | an annual cash retainer of $50,000; |
| ● | an annual restricted stock unit award with respect to a number of shares of our common stock having a grant date fair market value of $175,000; |
| ● | an additional annual cash retainer of $75,000 for the chairman of the board; |
| ● | an additional annual cash retainer of $20,000 for the chairman of the Audit Committee and additional annual cash retainers of $10,000 for each other member of the Audit Committee; |
| ● | an additional annual cash retainer of $15,000 for the chairman of the Compensation Committee and additional annual cash retainers of $7,500 for each other member of the Compensation Committee; and |
| ● | an additional annual cash retainer of $10,000 for the chairman of the Nominating and Corporate Governance Committee and additional annual cash retainers of $5,000 for each other member of the Nominating and Corporate Governance Committee. |
All annual cash retainers are payable on a quarterly basis and pro-rated for any partial year of service.
The new director compensation plan permits any non-employee director to waive all or a portion of their compensation under such plan from time to time upon notice to the board. In 2020, Messrs. Liu and Waxman elected to waive their compensation under such plan. The initial equity grants under the new director compensation plan are expected to be awarded in 2021.
The following table summarizes the compensation paid to or earned by our non-employee directors in 2020:
2020 DIRECTOR COMPENSATION
| | FEES | | | | | | | | | |
| | EARNED | | | | | | | | | |
| | OR PAID | | | | ALL OTHER | | |
| ||
| | IN CASH | | Stock Awards | | COMPENSATION | | TOTAL | |||
NAME |
| ($) |
| ($) | | ($) |
| ($) | |||
Sherilyn S. McCoy |
| | 125,000 | | — |
| | — |
| | 125,000 |
James E. Cashman III |
| | 42,500 | | — |
| | — |
| | 42,500 |
William F. Feehery |
| | — | | — |
| | — |
| | — |
William E. Klitgaard(1) |
| | 30,000 | | — |
| | — |
| | 30,000 |
Eric C. Liu |
| | — | | — |
| | — |
| | — |
Stephen M. McLean |
| | — | | — |
| | — |
| | — |
Edmundo Muniz(1) (2) | | | 175,000 | | — | | | 130,552 | | | 305,552 |
Mason P. Slaine |
| | 42,500 | | — |
| | — |
| | 42,500 |
Matthew Walsh(1)(3) |
| | 17,021 | | 893,643 |
| | — |
| | 910,664 |
Ethan Waxman(1) |
| | — | | — |
| | — |
| | — |
| (1) | Mr. Klitgaard and Dr. Muniz resigned from the board of directors effective August 26, 2020. Messrs. Walsh and Waxman joined the board of directors on that date. |
119
| (2) | Dr. Muniz served as our Chief Executive Officer until his employment was terminated effective March 31, 2019. Under the terms of Dr. Muniz’s separation, we agreed to pay Dr. Muniz the severance owed to him pursuant to his employment agreement, consisting of (i) the continuation of his base salary for 12 months following his termination, (ii) payment of 100% of the health insurance premiums for Dr. Muniz and his eligible dependents under COBRA until the earlier of (A) the date that is 18 months following his termination or (B) the date he is eligible for equal or better coverage under another group health plan, and (iii) all of his accrued but unpaid obligations. Amounts in the All Other Compensation column with respect to Dr. Muniz reflect $118,750 in severance payments and $11,802 in Company payments for COBRA premiums. |
| (3) | The value in the second column represents the grant date fair value of Class B Units granted to Mr. Walsh upon his appointment to the Board. See Note 2(r) (“Summary of Significant Accounting Policies — Equity-based compensation”) and Note 13 (“Equity-Based Compensation”) to our audited consolidated financial statements included elsewhere in this report for a discussion of the valuation of our equity-based awards. In connection with the IPO, these Class B Units were exchanged for newly issued shares of our restricted common stock on the same basis as for our NEOs (see “—Equity Awards’’ above, for a description of the exchange). As of December 31, 2020, Mr. Walsh held 145,597 shares of time-based vesting restricted stock received in exchange for his Class B Units. |
Directors Deferral Plan
Our Board of Directors has adopted the Directors Deferral Plan. All directors who are not employees of the Company are eligible to participate in the Directors Deferral Plan.
Deferral Elections. Under the terms of the Directors Deferral Plan, our non-employee directors may elect to defer all or a portion of their annual cash compensation and/or all of the Company shares issued upon settlement of their annual restricted stock unit award, in each case in 25% increments, in the form of deferred stock units credited to an account maintained by the Company. The number of deferred stock units credited in respect of annual cash compensation is determined by dividing the dollar amount of the deferred cash compensation by the fair market value of a share of the Company’s common stock on the date the cash compensation would otherwise have been paid to the director. Deferred stock units will be awarded from, and subject to the terms of, the 2020 Incentive Plan.
Each deferred stock unit represents the right to receive a number of shares of our common stock equal to the number of deferred stock units initially credited to the director’s account plus the number of deferred stock units credited as a result of any dividend equivalent rights (to which deferred stock units initially credited to a director’s account are entitled).
Settlement of Deferred Stock Units. Directors may elect that settlement of deferred stock units be made or commence on (i) the first business day in a year following the year for which the deferral is made, (ii) following termination of service on our board of directors or (iii) the earlier of (i) or (ii). Directors may elect that deferred stock units be settled in a single one-time distribution or in a series of up to 15 annual installments. In addition, deferred stock unit accounts will be settled upon a Change in Control (as defined in the 2020 Incentive Plan) or upon a director’s death.
Administration; Amendment and Termination. Our Compensation Committee administers the Directors Deferral Plan. The Directors Deferral Plan or any deferral may be amended, suspended, discontinued by our Compensation Committee at any time in the Compensation Committee’s discretion; provided that no amendment, suspension or discontinuance will reduce any director’s accrued benefit, except as required to comply with applicable law. Our Compensation Committee may terminate the Plan at any time, as long as the termination complies with applicable tax and other requirements.
Item 12. Security Ownership of Certain Beneficial Owners and Management and Related Stockholder Matters.
The information required by this item will be set forth in the Proxy Statement and is incorporated herein by reference.
Item 13. Certain Relationships and Related Transactions, and Director Independence.
The information required by this item will be set forth in the Proxy Statement and is incorporated herein by reference.
Item 14. Principal Accounting Fees and Services.
The information required by this item will be set forth in the Proxy Statement and is incorporated herein by reference.
120
Item 15. Exhibits, Financial Statement Schedules.
(a) The following documents are filed as part of this Annual Report:
(1) Financial Statements
The financial statements filed as part of this Annual Report are included in Part II, Item 8 of this Annual Report.
(2) Financial Statement Schedules
Financial statement schedules have been omitted in this Annual Report because they are not applicable, not required under the instructions or the information requested is set forth in the financial statements or related notes thereto.
(3) List of Exhibits required by Item 601 of Regulation S-K
Incorporated by Reference
Exhibit |
| Exhibit Title | | Form | File No. | Exhibit | Filing Date |
3.1 | | Amended and Restated Certificate of Incorporation of Certara, Inc. | | S-8 | 333-251368 | 4.1 | 12/15/2020 |
3.2 | | | S-8 | 333-251368 | 4.2 | 12/15/2020 | |
4.1 | | | S-1/A | 333-250182 | 4.1 | 12/03/2020 | |
4.2 | | | | | | | |
10.1 | | | S-8 | 333-251368 | 4.5 | 12/15/2020 | |
10.2 | | | | | | | |
10.3 | | | S-1/A | 333-250182 | 10.3 | 11/18/2020 | |
10.4 | | | S-1/A | 333-250182 | 10.4 | 11/18/2020 | |
10.5 | | | S-1/A | 333-250182 | 10.5 | 11/18/2020 |
121
10.6 | | | S-1/A | 333-250182 | 10.6 | 11/18/2020 | |
10.7 | | | S-1/A | 333-250182 | 10.7 | 11/18/2020 | |
10.8 | | | S-1/A | 333-250182 | 10.8 | 11/18/2020 | |
10.9 | | | S-1/A | 333-250182 | 10.9 | 11/25/2020 | |
10.10 | | | S-1/A | 333-250182 | 10.10 | 11/18/2020 | |
10.11 | | Employment Agreement, dated as of July 11, 2014, between Certara USA, Inc. and M. Andrew Schmick | | | | | |
10.12 | | Employment Agreement, dated as of July 20, 2020, between Certara USA, Inc. and Leif E. Pedersen | | | | | |
10.13 | | | S-1/A | 333-250182 | 10.18 | 11/25/2020 | |
10.14 | | Form of Restricted Stock Unit Grant and Award Agreement (Certara, Inc. 2020 Incentive Plan) | | | | | |
10.15 | | | S-1/A | 333-250182 | 10.19 | 12/03/2020 | |
10.16 | | | S-1/A | 333-250182 | 10.20 | 12/03/2020 | |
10.17 | | | S-1/A | 333-250182 | 10.21 | 11/25/2020 | |
10.18 | | | | | | | |
21.1 | | | | | | | |
24.1 | | Power of Attorney (included in the signature page to this Annual Report) | | | | | |
31.1 | | | | | | | |
31.2 | | | | | | | |
32.1 | | | | | | | |
32.2 | | | | | | |
* Management contract or compensatory plan or arrangement.
+ This certification is deemed not filed for purposes of Section 18 of the Exchange Act, or otherwise subject to the liability of that section, nor shall it be deemed incorporated by reference into any filing under the Securities Act or the Exchange Act.
None.
122
Pursuant to the requirements of Section 13 or 15(d) of the Securities Exchange Act of 1934, the registrant has duly caused this report to be signed on its behalf by the undersigned, thereunto duly authorized.
| CERTARA, INC. | |
Date: March 15, 2021 | By: | /s/ William F. Feehery |
| Name: | William F. Feehery |
| Title: | Chief Executive Officer |
| | |
KNOW ALL BY THESE PRESENTS, that each person whose signature appears below hereby constitutes and appoints William F. Feehery, M. Andrew Schemick and Richard M. Traynor and each of them, his or her true and lawful agent, proxy and attorney-in-fact, with full power of substitution and resubstitution, for him or her and in his or her name, place and stead, in any and all capacities, to sign any and all amendments to this Annual Report on Form 10-K, and to file the same, with all exhibits thereto, and other documents in connection therewith, with the Securities and Exchange Commission, granting unto said attorneys-in-fact and agents, and each of them, full power and authority to do and perform each and every act and thing requisite and necessary to be done in connection therewith, as fully to all intents and purposes as he or she might or could do in person, hereby ratifying and confirming all that said attorneys-in-fact and agents, or any of them, or their or his substitutes, may lawfully do or cause to be done by virtue thereof.
Pursuant to the requirements of the Securities Exchange Act of 1934, this report has been signed below by the following persons on behalf of the registrant and in the capacities and on the dates indicated.
Signature |
| Title |
| | |
/s/ William F. Feehery | | |
William F. Feehery | | Chief Executive Officer and Director |
| | (Principal Executive Officer) |
| | |
/s/ M. Andrew Schemick | | |
M. Andrew Schemick | | Chief Financial Officer |
| | (Principal Financial Officer and Principal Accounting Officer) |
| | |
/s/ Sherilyn S. McCoy | | |
Sherilyn S. McCoy | | Chairman |
| | |
/s/ James E. Cashman III | | |
James E. Cashman III | | Director |
| | |
/s/ Eric C. Liu | | |
Eric C. Liu | | Director |
| | |
/s/ Stephen M. McLean | | |
Stephen M. McLean | | Director |
| | |
/s/ Mason P. Slaine | | |
Mason P. Slaine | | Director |
| | |
/s/ Matthew Walsh | | |
Matthew Walsh | | Director |
| | |
/s/ Ethan Waxman | | |
Ethan Waxman | | Director |
| | |
123