Attached files
| file | filename |
|---|---|
| 8-K - 8-K - CENTURY CASINOS INC /CO/ | cnty-20210311x8k.htm |
| EX-99.1 - EX-99.1 - CENTURY CASINOS INC /CO/ | cnty-20210311xex99_1.htm |
Exhibit 99.2
CENTURY CASINOS, INC. Financial Results 2020 Century Casinos 1
Forward-Looking Statements, Business Environment and Risk Factors This presentation may contain “forward-looking statements” within the meaning of Section 27A of the Securities Act of 1933, as amended, Section 21E of the Securities Exchange Act of 1934, as amended (the “Exchange Act”), and the Private Securities Litigation Reform Act of 1995. In addition, Century Casinos, Inc. (together with its subsidiaries, the “Company”, “we”, “us”, “our”) may make other written and oral communications from time to time that contain such statements. Forward-looking statements include statements as to industry trends and future expectations of the Company and other matters that do not relate strictly to historical facts and are based on certain assumptions by management at the time such statements are made. Forward-looking statements in this presentation include statements regarding future results of operations, the impact of the acquisition of MTR, CCG and CCV (each, as defined herein) (the “Acquired Casinos”), the impact of the current coronavirus (COVID-19) pandemic, the adequacy of cash flows from operations and available cash to meet our future liquidity needs, particularly if we cannot operate our casinos due to COVID-19 or their operations are restricted, operating margins, operating efficiencies, synergies and operational performance, the integration of the Acquired Casinos into our business, the prospects for and timing and costs of new projects, projects in development and other opportunities, the credit agreement with Macquarie (as defined herein) and obligations under our Master Lease (as defined herein) and the ability to repay debt and other obligations, investments in joint ventures, outcomes of legal proceedings, changes in our tax provisions or exposure to additional income tax liabilities, and plans for our casinos and our Company. These statements are often identified by the use of words such as “may,” “will,” “expect,” “believe,” “anticipate,” “intend,” “could,” “estimate,” or “continue,” and similar expressions or variations. These statements are based on the beliefs and assumptions of the management of the Company based on information currently available to management. Such forward-looking statements are subject to risks, uncertainties and other factors that could cause actual results to differ materially from future results expressed or implied by such forward-looking statements. Important factors that could cause actual results to differ materially from the forward-looking statements include, among others, the risks described in the section entitled “Risk Factors” under Item 1A in our Annual Report on Form 10-K for the year ended December 31, 2020 (the “2020 Annual Report”) and our subsequent periodic and current reports filed with the SEC. We caution the reader to carefully consider such factors. Furthermore, such forward-looking statements speak only as of the date on which such statements are made. We undertake no obligation to update any forward-looking statements to reflect events or circumstances after the date of such statements. Century Casinos 2
Notes on Presentation In this presentation the term “USD” refers to US dollars, the term “CAD” refers to Canadian dollars and the term “PLN” refers to Polish zloty. Adjusted EBITDA and Adjusted EBITDA margin are non-GAAP financial measures. See Appendix A for the definition and reconciliation of Adjusted EBITDA and Adjusted EBITDA margin. Amounts presented are rounded. As such, rounding differences could occur in period-over-period changes and percentages reported throughout this presentation. The names of the Company’s subsidiaries and certain operating segments are abbreviated on certain of the following slides. See Appendix A for a list of the subsidiaries and their abbreviations. Century Casinos 3
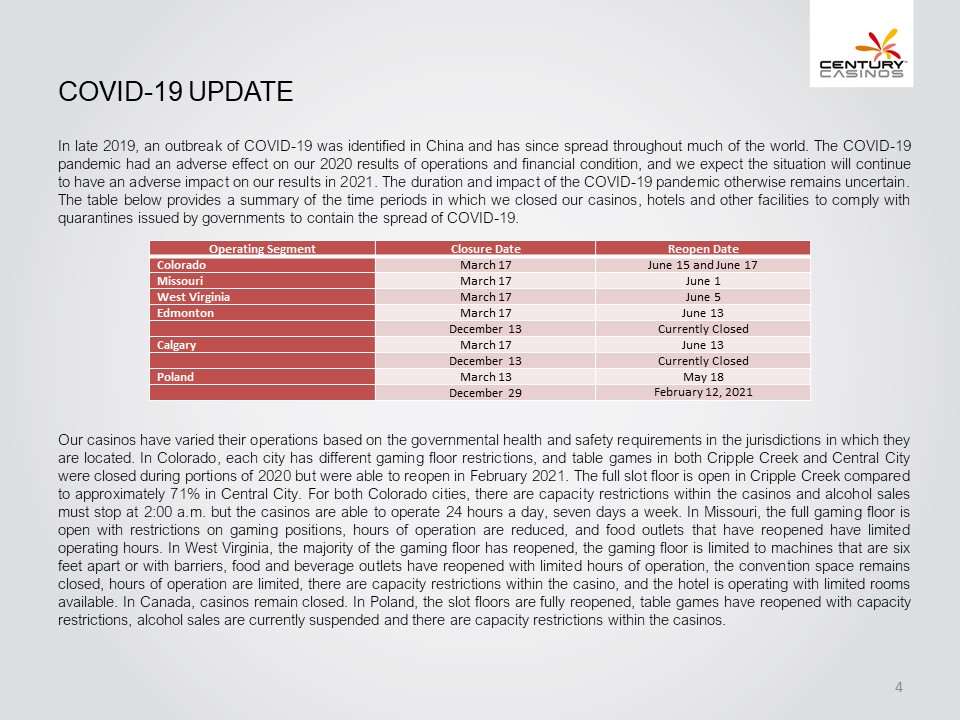
COVID-19 UPDATE In late 2019, an outbreak of COVID-19 was identified in China and has since spread throughout much of the world. The COVID-19 pandemic had an adverse effect on our 2020 results of operations and financial condition, and we expect the situation will continue to have an adverse impact on our results in 2021. The duration and impact of the COVID-19 pandemic otherwise remains uncertain. The table below provides a summary of the time periods in which we closed our casinos, hotels and other facilities to comply with quarantines issued by governments to contain the spread of COVID-19. Operating Segment Closure Date Reopen Date Colorado March 17 June 15 and June 17 Missouri March 17 June 1 West Virginia March 17 June 5 Edmonton March 17 June 13 December 13 Currently Closed Calgary March 17 June 13 December 13 Currently Closed Poland March 13 May 18 December 29 February 12, 2021 Our casinos have varied their operations based on the governmental health and safety requirements in the jurisdictions in which they are located. In Colorado, each city has different gaming floor restrictions, and table games in both Cripple Creek and Central City were closed during portions of 2020 but were able to reopen in February 2021. The full slot floor is open in Cripple Creek compared to approximately 71% in Central City. For both Colorado cities, there are capacity restrictions within the casinos and alcohol sales must stop at 2:00 a.m. but the casinos are able to operate 24 hours a day, seven days a week. In Missouri, the full gaming floor is open with restrictions on gaming positions, hours of operation are reduced, and food outlets that have reopened have limited operating hours. In West Virginia, the majority of the gaming floor has reopened, the gaming floor is limited to machines that are six feet apart or with barriers, food and beverage outlets have reopened with limited hours of operation, the convention space remains closed, hours of operation are limited, there are capacity restrictions within the casino, and the hotel is operating with limited rooms available. In Canada, casinos remain closed. In Poland, the slot floors are fully reopened, table games have reopened with capacity restrictions, alcohol sales are currently suspended and there are capacity restrictions within the casinos. Century Casinos 4
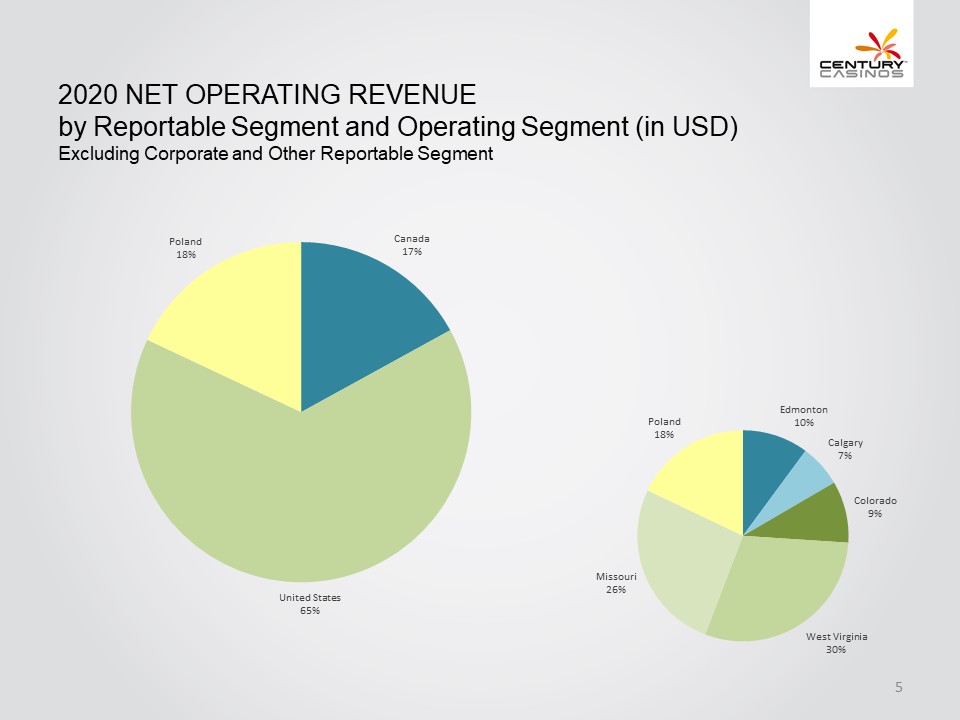
2020 Net Operating Revenue by Reportable Segment and Operating Segment (in USD) Excluding Corporate and Other Reportable Segment Poland 18% Canada 17% United States 65% Poland 18% Edmonton 10% Calgary 7% Colorado 9% West Virginia 30% Missouri 26% Century Casinos 5
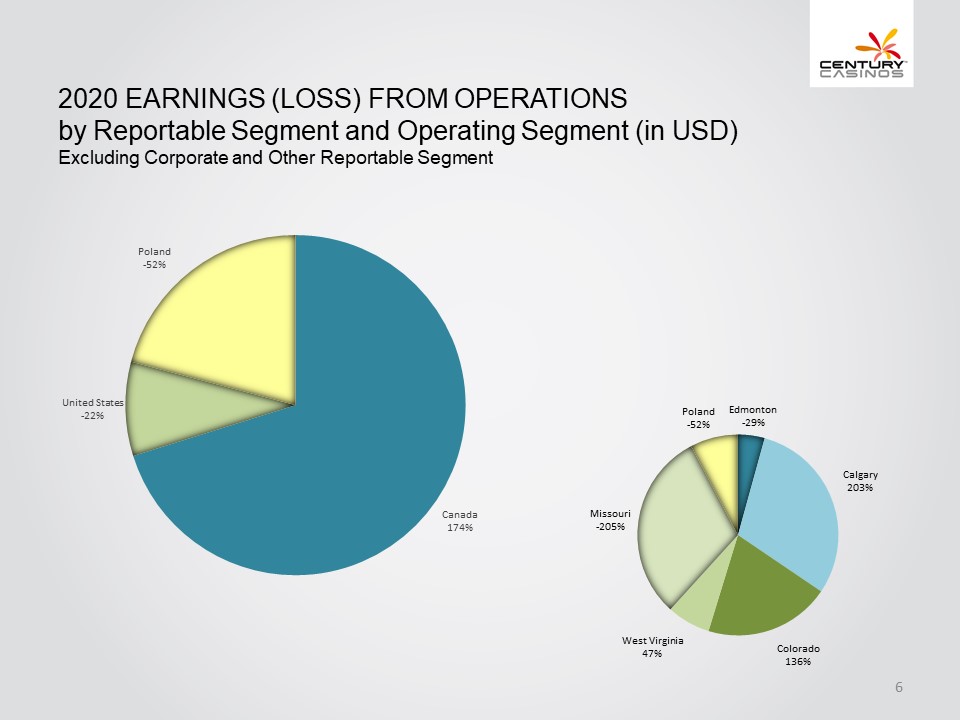
2020 Earnings (Loss) from Operations by Reportable Segment and Operating Segment (in USD) Excluding Corporate and Other Reportable Segment Poland -52% United States -22% Canada 174% Poland -52% Edmonton -29% Calgary 203% Colorado 136% West Virginia 47% Missouri -205% Century Casinos 6
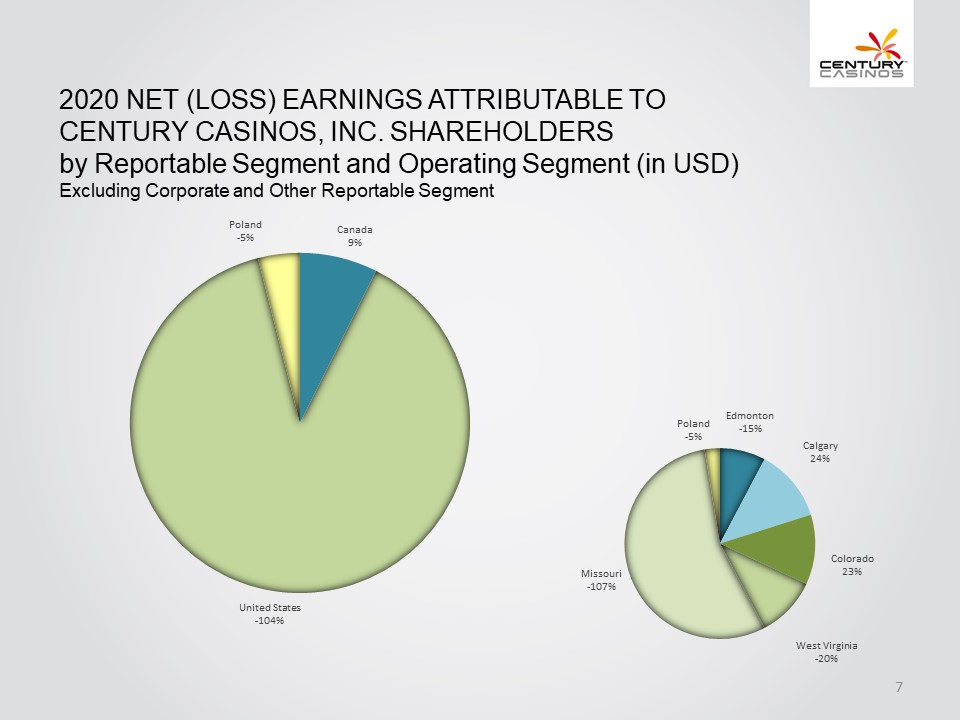
2020 Net (Loss) Earnings Attributable to Century Casinos, Inc. Shareholders by Reportable Segment and Operating Segment (in USD) Excluding Corporate and Other Reportable Segment Poland -5% Canada 9% United States -104% Missouri -107% Poland -5% Edmonton -15% Calgary 24% Colorado 23% West Virginia -20% Century Casinos 7
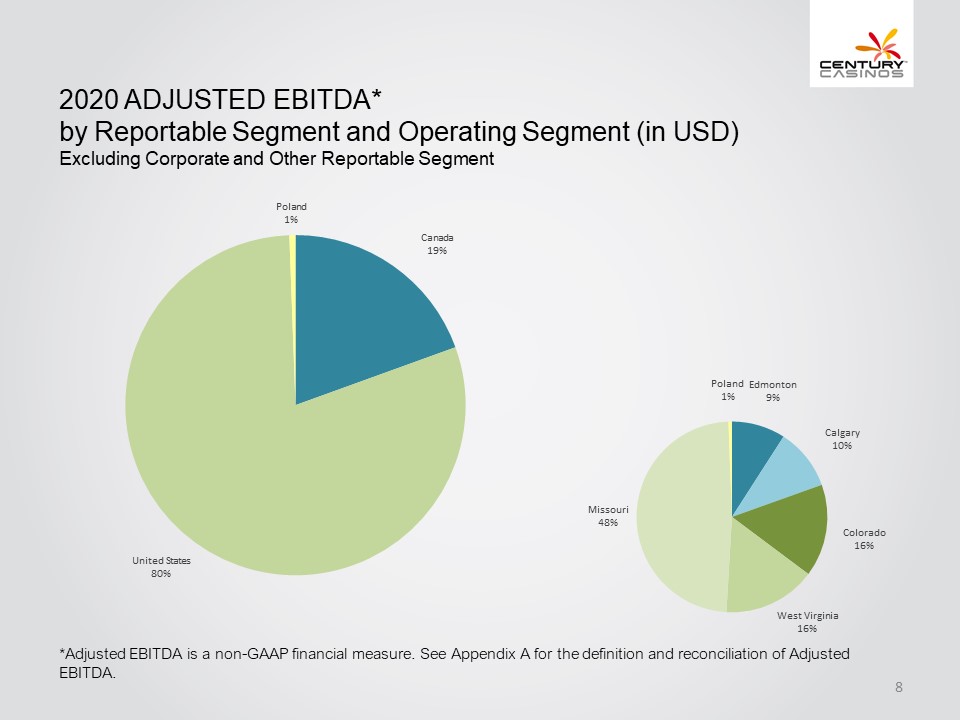
2020 Adjusted EBITDA* by Reportable Segment and Operating Segment (in USD) Excluding Corporate and Other Reportable Segment Poland 1% Canada 19% United States 80% Missouri 48% Poland 1% Edmonton 9% Calgary 10% Colorado 16% West Virginia 16% *Adjusted EBITDA is a non-GAAP financial measure. See Appendix A for the definition and reconciliation of Adjusted EBITDA. Century Casinos 8
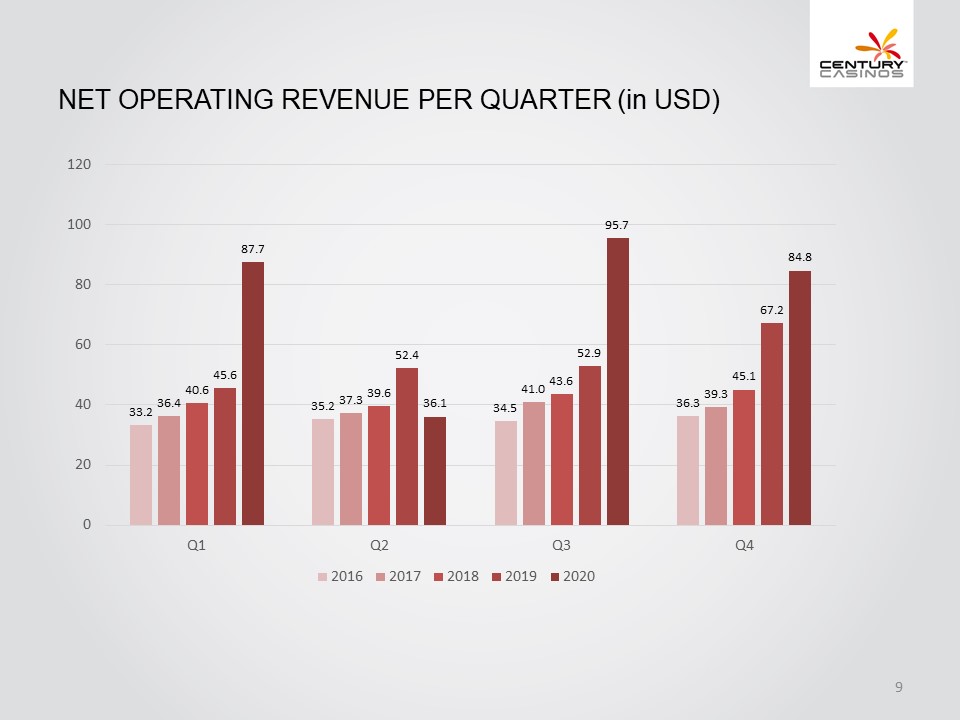
Net Operating Revenue per Quarter (in USD) 0 20 40 60 80 100 120 Q1 33.2 36.4 40.6 45.6 87.7 Q2 35.2 37.3 39.6 52.4 36.1 Q3 34.5 41.0 43.6 52.9 95.7 Q4 36.3 39.3 45.1 67.2 84.8 2016 2017 2018 2019 2020 Century Casinos 9
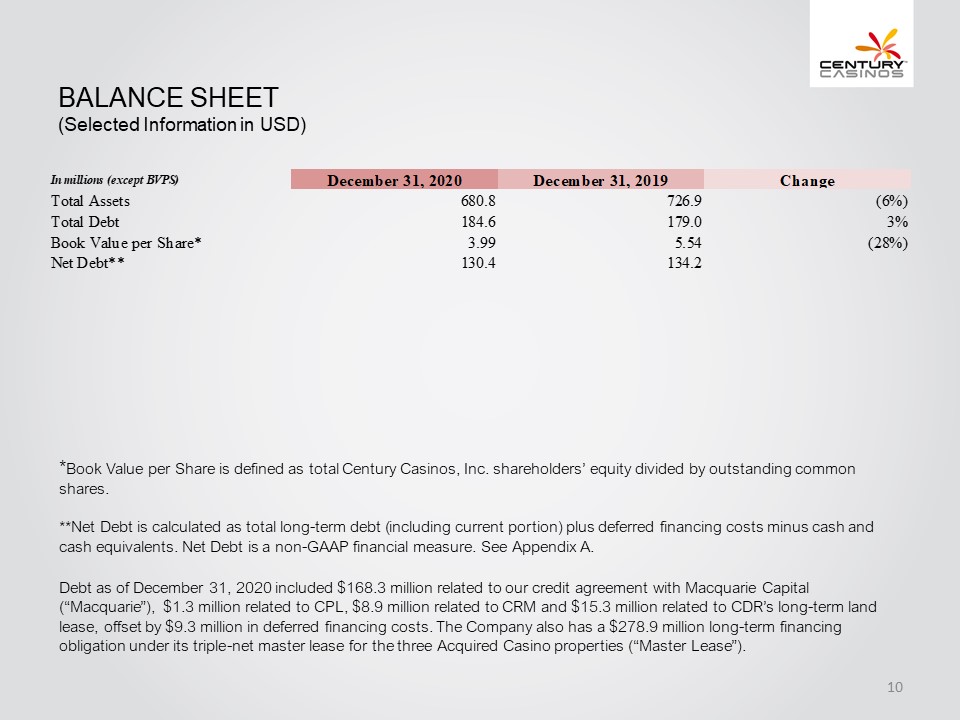
Balance Sheet (Selected Information in USD) In millions (except BVPS) December 31, 2020 December 31, 2019 Change Total Assets 680.8 726.9 (6%) Total Debt 184.6 179.0 3% Book Value per Share* 3.99 5.54 (28%) Net Debt** 130.4 134.2 *Book Value per Share is defined as total Century Casinos, Inc. shareholders’ equity divided by outstanding common shares. **Net Debt is calculated as total long-term debt (including current portion) plus deferred financing costs minus cash and cash equivalents. Net Debt is a non-GAAP financial measure. See Appendix A. Debt as of December 31, 2020 included $168.3 million related to our credit agreement with Macquarie Capital (“Macquarie”), $1.3 million related to CPL, $8.9 million related to CRM and $15.3 million related to CDR’s long-term land lease, offset by $9.3 million in deferred financing costs. The Company also has a $278.9 million long-term financing obligation under its triple-net master lease for the three Acquired Casino properties (“Master Lease”). Century Casinos 10
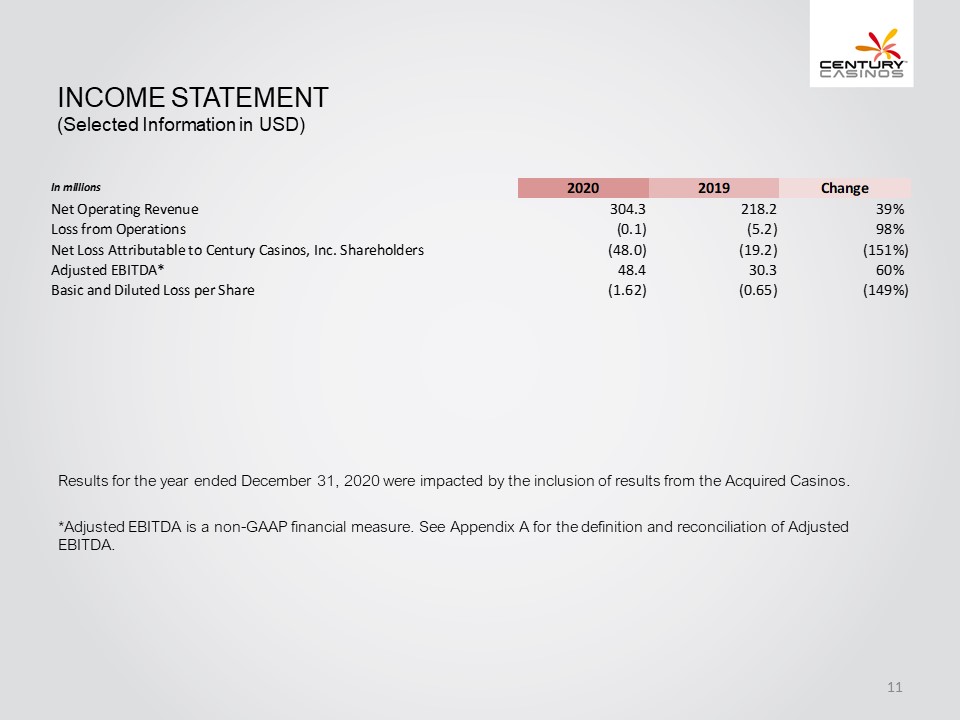
Income Statement (Selected Information in USD) In millions Net Operating Revenue Loss from Operations Net Loss Attributable to Century Casinos, Inc. Shareholders Adjusted EBITDA* Basic and Diluted Loss per Share 2020 2019 Change 304.3 218.2 39% (0.1) (5.2) 98% (48.0) (19.2) (151%) 48.4 30.3 60% (1.62) (0.65) (149%) Results for the year ended December 31, 2020 were impacted by the inclusion of results from the Acquired Casinos. *Adjusted EBITDA is a non-GAAP financial measure. See Appendix A for the definition and reconciliation of Adjusted EBITDA. Century Casinos 11
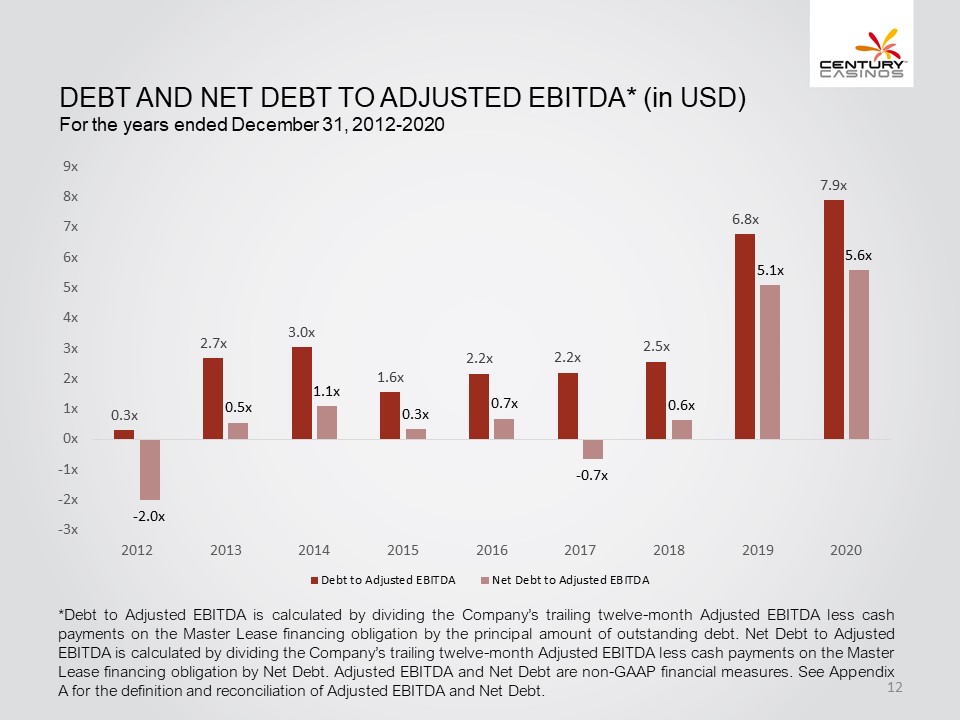
Debt and Net Debt to Adjusted EBITDA* (in USD) For the years ended December 31, 2012-2020 -3x -2x -1x 0x 1x 2x 3x 4x 5x 6x 7x 8x 9x 2012 0.3x -2.0x 2013 2.7x 0.5x 2014 3.0x 1.1x 2015 1.6x 0.3x 2016 2.2x 0.7x 2017 2.2x -0.7x 2018 2.5x 0.6x 2019 6.8x 5.1x 2020 7.9x 5.6x Debt to Adjusted EBITDA Net Debt to Adjusted EBITDA *Debt to Adjusted EBITDA is calculated by dividing the Company’s trailing twelve-month Adjusted EBITDA less cash payments on the Master Lease financing obligation by the principal amount of outstanding debt. Net Debt to Adjusted EBITDA is calculated by dividing the Company’s trailing twelve-month Adjusted EBITDA less cash payments on the Master Lease financing obligation by Net Debt. Adjusted EBITDA and Net Debt are non-GAAP financial measures. See Appendix A for the definition and reconciliation of Adjusted EBITDA and Net Debt. Century Casinos 12
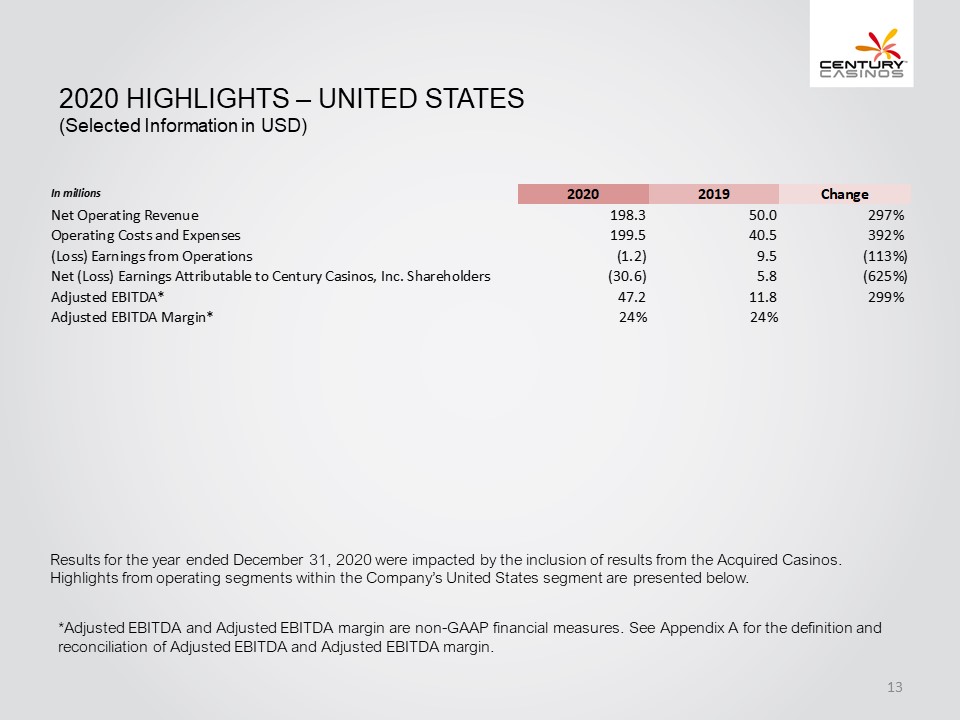
2020 Highlights – UNITED STATES (Selected Information in USD) In millions Net Operating Revenue Operating Costs and Expenses (Loss) Earnings from Operations Net (Loss) Earnings Attributable to Century Casinos, Inc. Shareholders Adjusted EBITDA* Adjusted EBITDA Margin* 2020 2019 Change 198.3 50.0 297% 199.5 40.5 392% (1.2) 9.5 (113%) (30.6) 5.8 (625%) 47.2 11.8 299% 24% 24% Results for the year ended December 31, 2020 were impacted by the inclusion of results from the Acquired Casinos. Highlights from operating segments within the Company’s United States segment are presented below. *Adjusted EBITDA and Adjusted EBITDA margin are non-GAAP financial measures. See Appendix A for the definition and reconciliation of Adjusted EBITDA and Adjusted EBITDA margin. Century Casinos 13
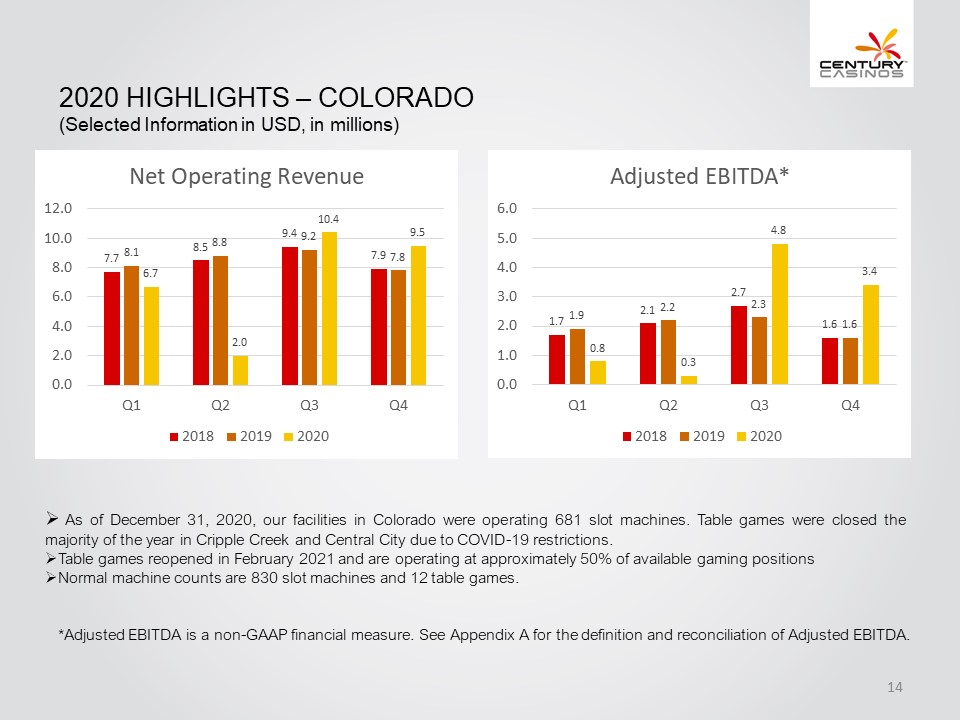
2020 Highlights – COLORADO (Selected Information in USD, in millions) Net Operating Revenue 0.0 2.0 4.0 6.0 8.0 10.0 12.0 Q1 7.7 8.1 6.7 Q2 8.5 8.8 2.0 Q3 9.4 9.2 10.4 Q4 7.9 7.8 9.5 2018 2019 2020 Adjusted EBITDA* 0.0 1.0 2.0 3.0 4.0 5.0 6.0 Q1 1.7 1.9 0.8 Q2 2.1 2.2 0.3 Q3 2.7 2.3 4.8 Q4 1.6 1.6 3.4 2018 2019 2020 As of December 31, 2020, our facilities in Colorado were operating 681 slot machines. Table games were closed the majority of the year in Cripple Creek and Central City due to COVID-19 restrictions. Table games reopened in February 2021 and are operating at approximately 50% of available gaming positions Normal machine counts are 830 slot machines and 12 table games. *Adjusted EBITDA is a non-GAAP financial measure. See Appendix A for the definition and reconciliation of Adjusted EBITDA. Century Casinos 14
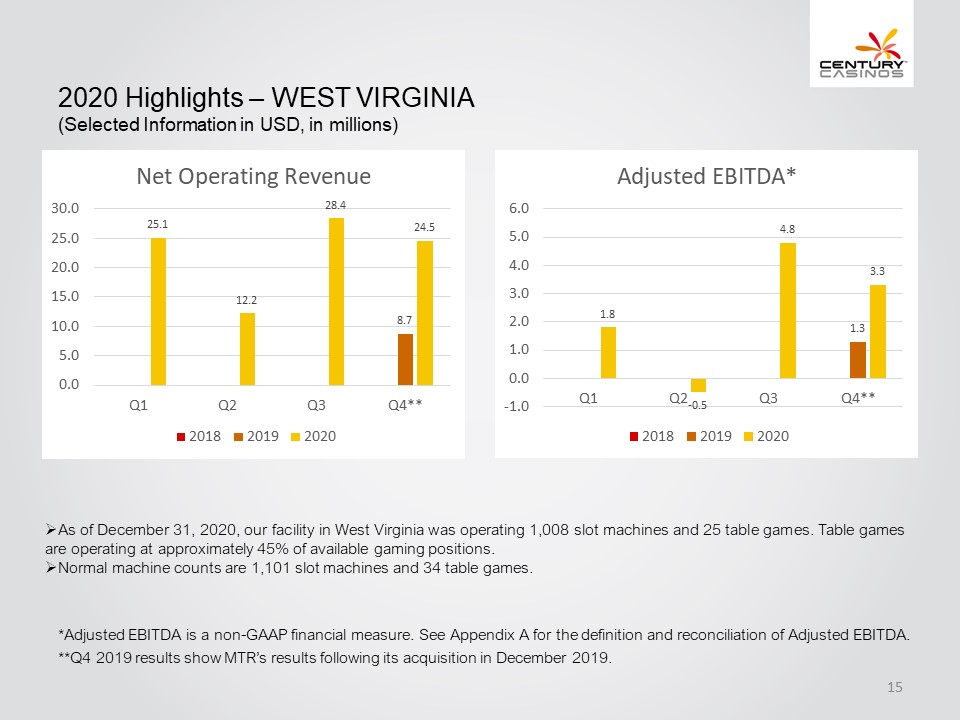
2020 Highlights – WEST VIRGINIA (Selected Information in USD, in millions) Net Operating Revenue 0.0 5.0 10.0 15.0 20.0 25.0 30.0 Q1 25.1 Q2 12.2 Q3 28.4 Q4** 8.7 24.5 2018 2019 2020 Adjusted EBITDA* -1.0 0.0 1.0 2.0 3.0 4.0 5.0 6.0 Q1 1.8 Q2 -0.5 Q3 4.8 Q4** 1.3 3.3 2018 2019 2020 As of December 31, 2020, our facility in West Virginia was operating 1,008 slot machines and 25 table games. Table games are operating at approximately 45% of available gaming positions. Normal machine counts are 1,101 slot machines and 34 table games. *Adjusted EBITDA is a non-GAAP financial measure. See Appendix A for the definition and reconciliation of Adjusted EBITDA. **Q4 2019 results show MTR’s results following its acquisition in December 2019. Century Casinos 15
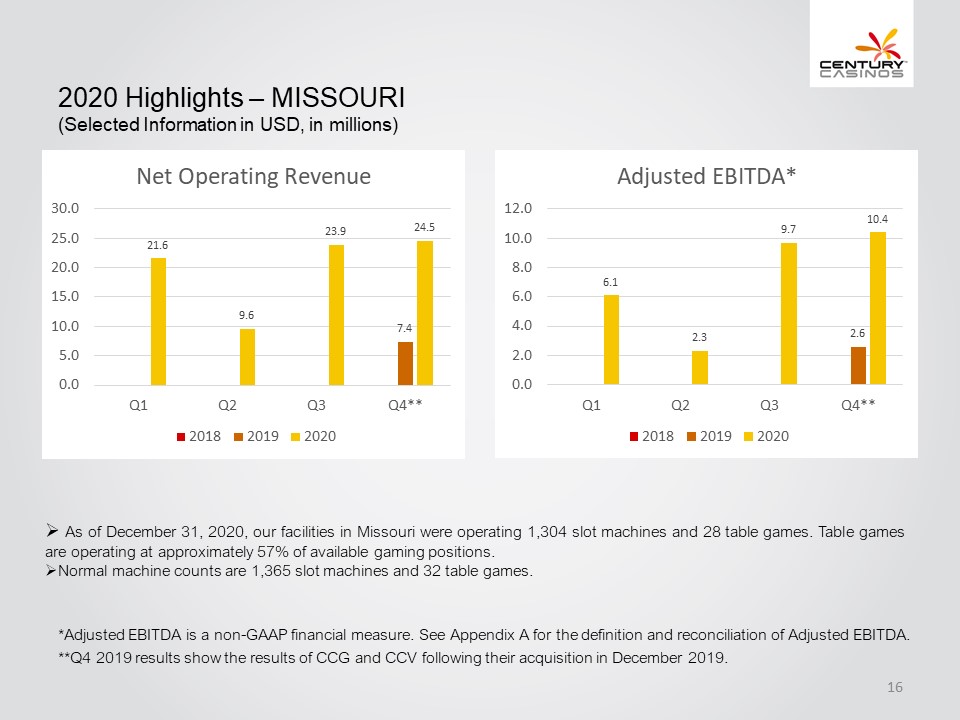
2020 Highlights – MISSOURI (Selected Information in USD, in millions) Net Operating Revenue 0.0 5.0 10.0 15.0 20.0 25.0 30.0 Q1 21.6 Q2 9.6 Q3 23.9 Q4** 7.4 24.5 2018 2019 2020 Adjusted EBITDA* 0.0 2.0 4.0 6.0 8.0 10.0 12.0 Q1 6.1 Q2 2.3 Q3 9.7 Q4** 2.6 10.4 2018 2019 2020 As of December 31, 2020, our facilities in Missouri were operating 1,304 slot machines and 28 table games. Table games are operating at approximately 57% of available gaming positions. Normal machine counts are 1,365 slot machines and 32 table games. *Adjusted EBITDA is a non-GAAP financial measure. See Appendix A for the definition and reconciliation of Adjusted EBITDA. **Q4 2019 results show the results of CCG and CCV following their acquisition in December 2019. Century Casinos 16
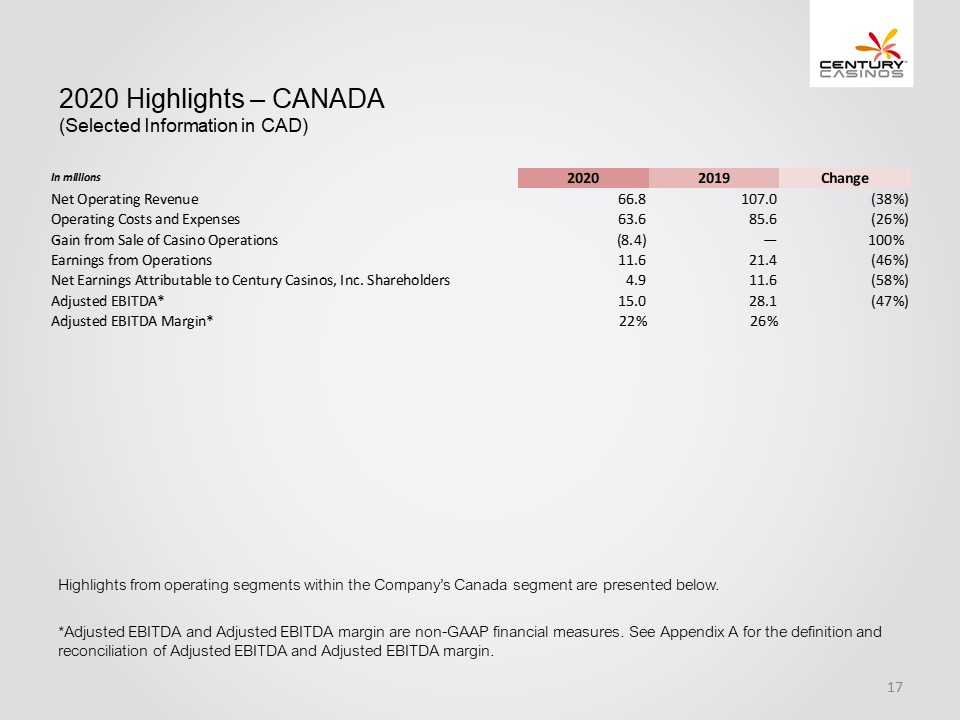
2020 Highlights – CANADA (Selected Information in CAD) In millions Net Operating Revenue Operating Costs and Expenses Gain from Sale of Casino Operations Earnings from Operations Net Earnings Attributable to Century Casinos, Inc. Shareholders Adjusted EBITDA* Adjusted EBITDA Margin* 2020 2019 Change 66.8 107.0 (38%) 63.6 85.6 (26%) (8.4) — 100% 11.6 21.4 (46%) 4.9 11.6 (58%) 15.0 28.1 (47%) 22% 26% Highlights from operating segments within the Company’s Canada segment are presented below. *Adjusted EBITDA and Adjusted EBITDA margin are non-GAAP financial measures. See Appendix A for the definition and reconciliation of Adjusted EBITDA and Adjusted EBITDA margin. Century Casinos 17
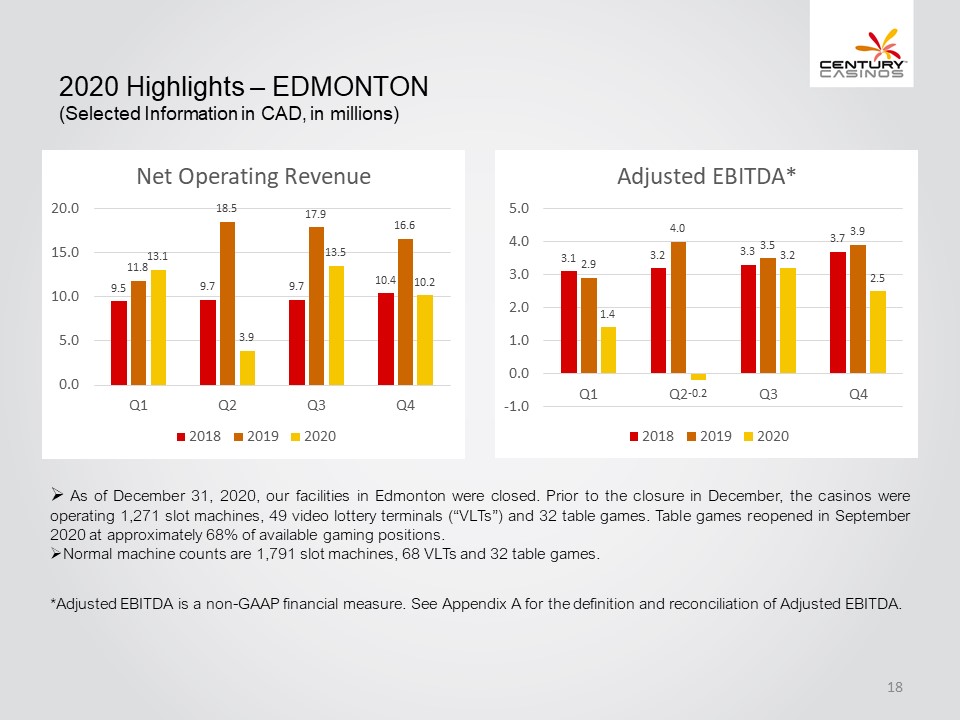
2020 Highlights – EDMONTON (Selected Information in CAD, in millions) Net Operating Revenue 0.0 5.0 10.0 15.0 20.0 Q1 9.5 11.8 13.1 Q2 9.7 18.5 3.9 Q3 9.7 17.9 13.5 Q4 10.4 16.6 10.2 2018 2019 2020 Adjusted EBITDA* -1.0 0.0 1.0 2.0 3.0 4.0 5.0 Q1 3.1 2.9 1.4 Q2 3.2 4.0 -0.2 Q3 3.3 3.5 3.2 Q4 3.7 3.9 2.5 2018 2019 2020 As of December 31, 2020, our facilities in Edmonton were closed. Prior to the closure in December, the casinos were operating 1,271 slot machines, 49 video lottery terminals (“VLTs”) and 32 table games. Table games reopened in September 2020 at approximately 68% of available gaming positions. Normal machine counts are 1,791 slot machines, 68 VLTs and 32 table games. *Adjusted EBITDA is a non-GAAP financial measure. See Appendix A for the definition and reconciliation of Adjusted EBITDA. Century Casinos 18
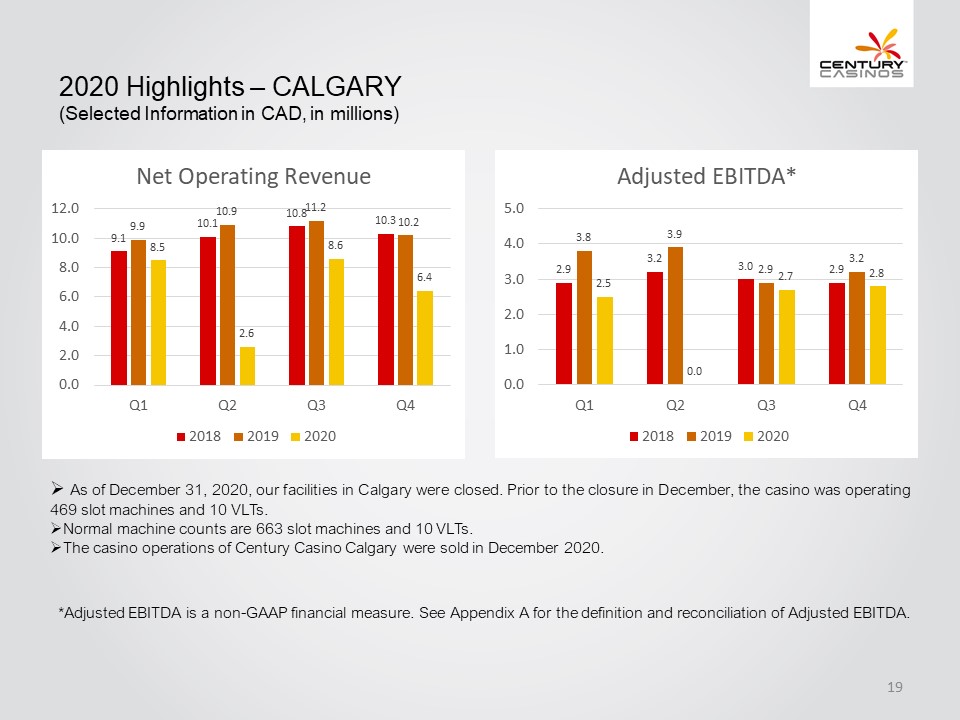
2020 Highlights – CALGARY (Selected Information in CAD, in millions) Net Operating Revenues 0.0 2.0 4.0 6.0 8.0 10.0 12.0 Q1 9.1 9.9 8.5 Q2 10.1 10.9 2.6 Q3 10.8 11.2 8.6 Q4 10.3 10.2 6.4 2018 2019 2020 Adjusted EBITDA* 0.0 1.0 2.0 3.0 4.0 5.0 Q1 2.9 3.8 2.5 Q2 3.2 3.9 0.0 Q3 3.0 2.9 2.7 Q4 2.9 3.2 2.8 2018 2019 2020 As of December 31, 2020, our facilities in Calgary were closed. Prior to the closure in December, the casino was operating 469 slot machines and 10 VLTs. Normal machine counts are 663 slot machines and 10 VLTs. The casino operations of Century Casino Calgary were sold in December 2020. *Adjusted EBITDA is a non-GAAP financial measure. See Appendix A for the definition and reconciliation of Adjusted EBITDA. Century Casinos 19
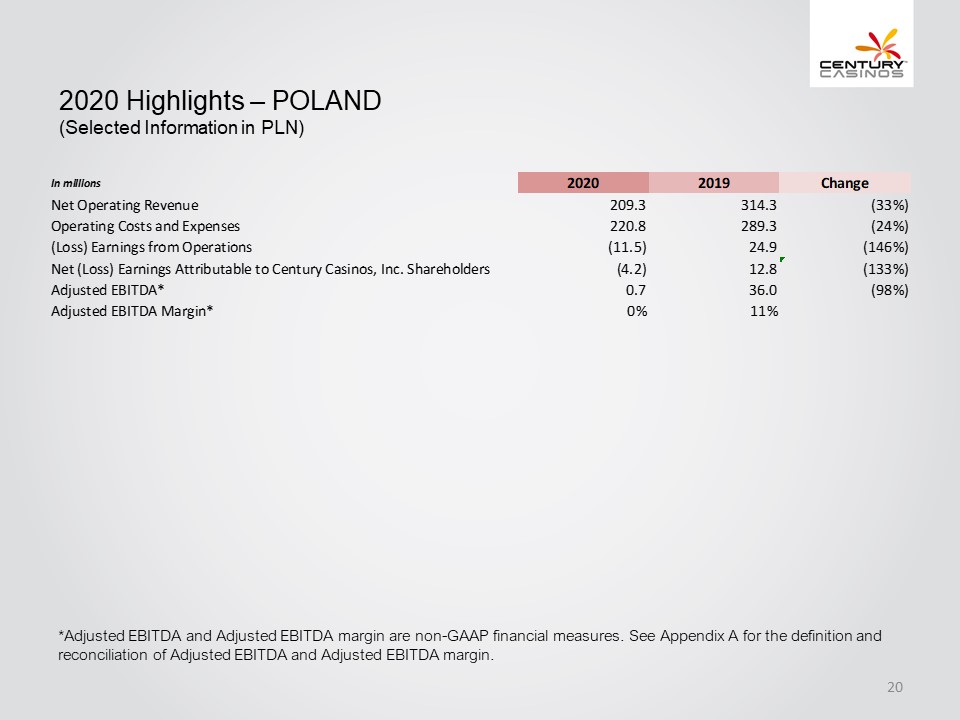
2020 Highlights – POLAND (Selected Information in PLN) In millions Net Operating Revenue Operating Costs and Expenses (Loss) Earnings from Operations Net (Loss) Earnings Attributable to Century Casinos, Inc. Shareholders Adjusted EBITDA* Adjusted EBITDA Margin* 2020 2019 Change 209.3 314.3 (33%) 220.8 289.3 (24%) (11.5) 24.9 (146%) (4.2) 12.8 (133%) 0.7 36.0 (98%) 0% 11% *Adjusted EBITDA and Adjusted EBITDA margin are non-GAAP financial measures. See Appendix A for the definition and reconciliation of Adjusted EBITDA and Adjusted EBITDA margin. Century Casinos 20
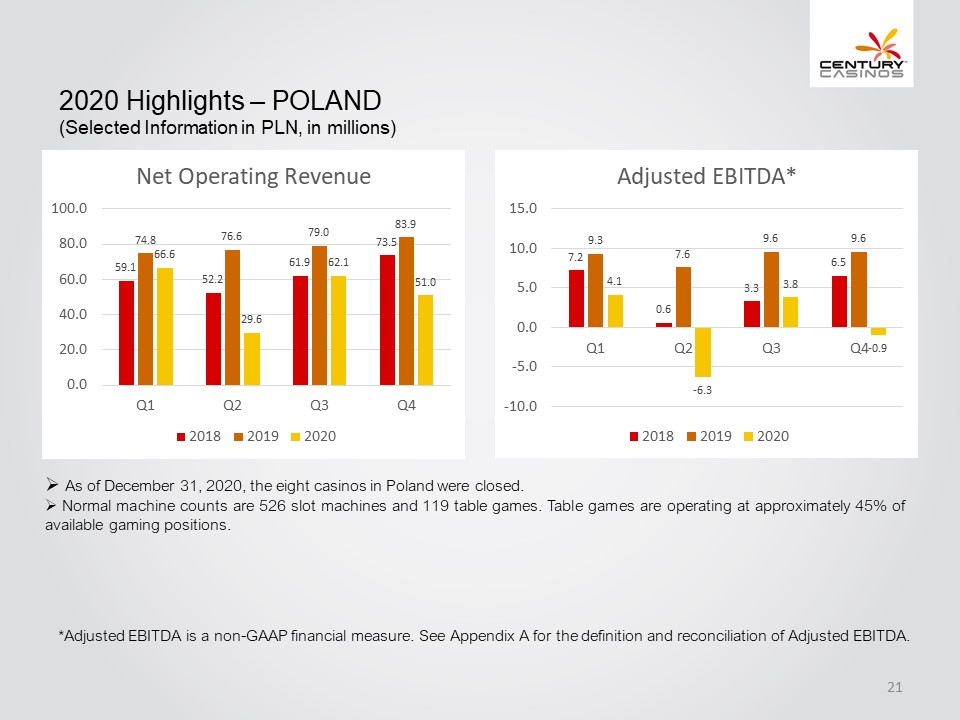
2020 Highlights – POLAND (Selected Information in PLN, in millions) Net Operating Revenue 0.0 20.0 40.0 60.0 80.0 100.0 Q1 59.1 74.8 66.6 Q2 52.2 76.6 29.6 Q3 61.9 79.0 62.1 Q4 73.5 83.9 51.0 2018 2019 2020 Adjusted EBITDA* -10.0 -5.0 0.0 5.0 10.0 15.0 Q1 7.2 9.3 4.1 Q2 0.6 7.6 -6.3 Q3 3.3 9.6 3.8 Q4 6.5 9.6 -0.9 2018 2019 2020 As of December 31, 2020, the eight casinos in Poland were closed. Normal machine counts are 526 slot machines and 119 table games. Table games are operating at approximately 45% of available gaming positions. *Adjusted EBITDA is a non-GAAP financial measure. See Appendix A for the definition and reconciliation of Adjusted EBITDA. Century Casinos 21
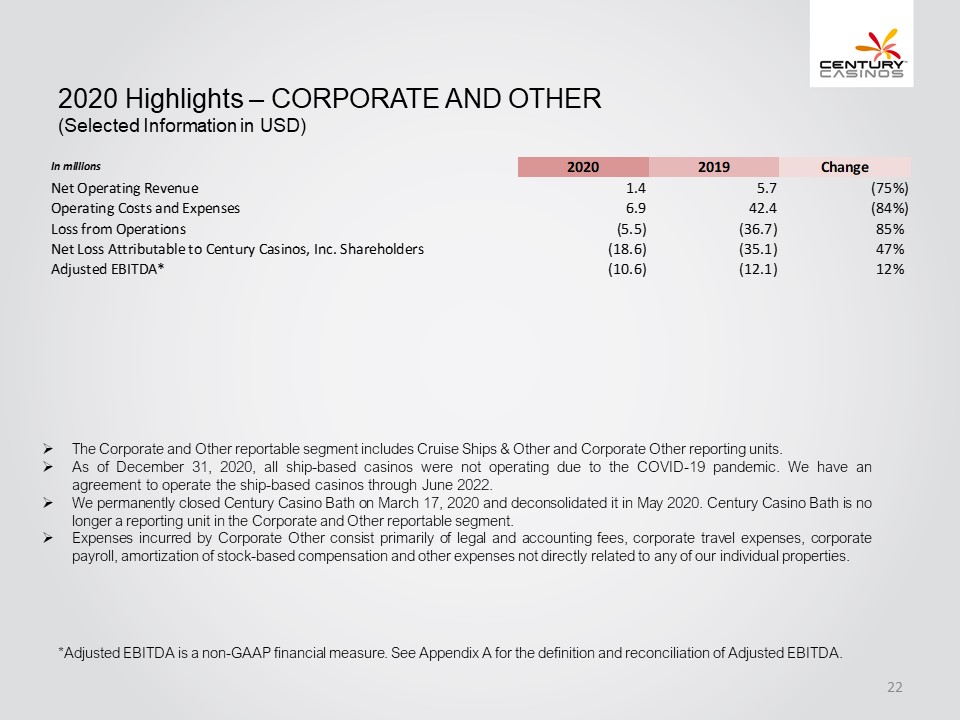
2020 Highlights – CORPORATE AND OTHER (Selected Information in USD) In millions Net Operating Revenue Operating Costs and Expenses Loss from Operations Net Loss Attributable to Century Casinos, Inc. Shareholders Adjusted EBITDA* 2020 2019 Change 1.4 5.7 (75%) 6.9 42.4 (84%) (5.5) (36.7) 85% (18.6) (35.1) 47% (10.6) (12.1) 12% The Corporate and Other reportable segment includes Cruise Ships & Other and Corporate Other reporting units. As of December 31, 2020, all ship-based casinos were not operating due to the COVID-19 pandemic. We have an agreement to operate the ship-based casinos through June 2022. We permanently closed Century Casino Bath on March 17, 2020 and deconsolidated it in May 2020. Century Casino Bath is no longer a reporting unit in the Corporate and Other reportable segment. Expenses incurred by Corporate Other consist primarily of legal and accounting fees, corporate travel expenses, corporate payroll, amortization of stock-based compensation and other expenses not directly related to any of our individual properties. *Adjusted EBITDA is a non-GAAP financial measure. See Appendix A for the definition and reconciliation of Adjusted EBITDA. Century Casinos 22
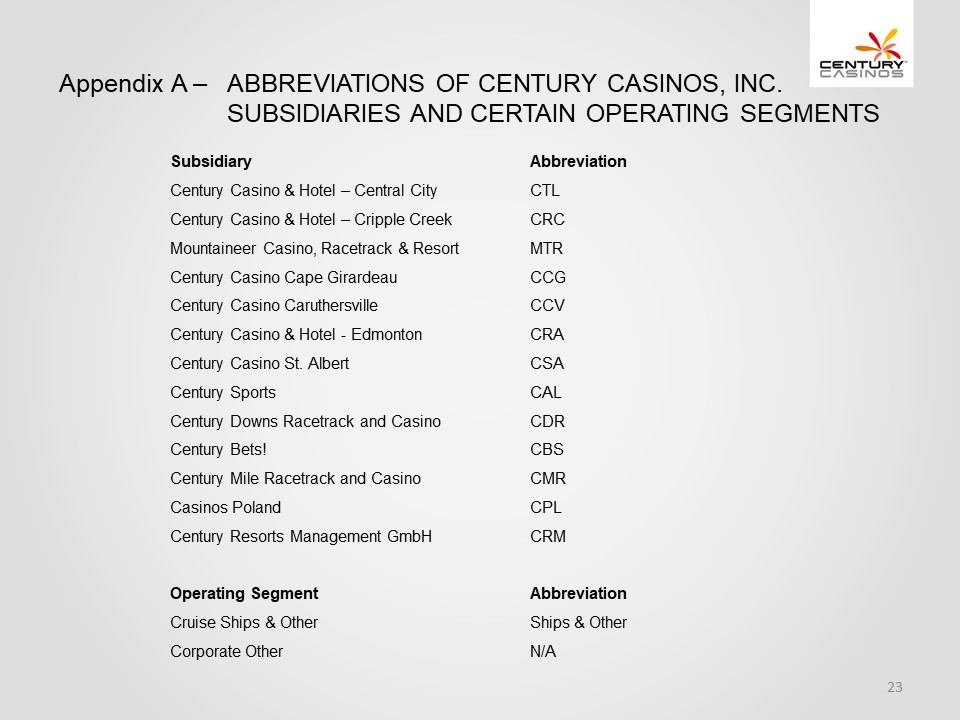
Appendix A – ABBREVIATIONS OF CENTURY CASINOS, INC. SUBSIDIARIES AND CERTAIN OPERATING SEGMENTS Subsidiary Abbreviation Century Casino & Hotel – Central City CTL Century Casino & Hotel – Cripple Creek CRC Mountaineer Casino, Racetrack & Resort MTR Century Casino Cape Girardeau CCG Century Casino Caruthersville CCV Century Casino & Hotel - Edmonton CRA Century Casino St. Albert CSA Century Sports CAL Century Downs Racetrack and Casino CDR Century Bets! CBS Century Mile Racetrack and Casino CMR Casinos Poland CPL Century Resorts Management GmbH CRM Operating Segment Abbreviation Cruise Ships & Other Ships & Other Corporate Other N/A Century Casinos 23
Appendix A – NON-GAAP FINANCIAL MEASURES The Company supplements its consolidated financial statements prepared in accordance with U.S. generally accepted accounting principles (“GAAP”) by using the following non-GAAP financial measures, which management believes are useful in properly understanding the Company’s short-term and long-term financial trends. Management uses these non-GAAP financial measures to forecast and evaluate the operational performance of the Company as well as to compare results of current periods to prior periods on a consolidated basis. Adjusted EBITDA Adjusted EBITDA margin Net Debt Management believes presenting the non-GAAP financial measures used in this presentation provides investors greater transparency to the information used by management for financial and operational decision-making and allows investors to see the Company’s results “through the eyes” of management. Management also believes providing this information better enables our investors to understand the Company’s operating performance and evaluate the methodology used by management to evaluate and measure such performance. The adjustments made to GAAP financial measures result from facts and circumstances that vary in frequency and impact on the Company’s results of operations. The following is an explanation of each of the adjustments that management excludes in calculating its non-GAAP financial measures. Century Casinos 24
Appendix A – NON-GAAP FINANCIAL MEASURES The Company defines Adjusted EBITDA as net (loss) earnings attributable to Century Casinos, Inc. shareholders before interest expense (income), net, income taxes (benefit), depreciation and amortization, non-controlling interests net earnings (loss) and transactions, pre-opening expenses, acquisition costs, non-cash stock-based compensation charges, asset impairment costs, loss (gain) on disposition of fixed assets, discontinued operations, (gain) loss on foreign currency transactions, cost recovery income and other, gain on business combination and certain other one-time transactions. Expense related to the Master Lease for the three Acquired Casino properties and CDR land lease is included in the interest expense (income), net line item. Intercompany transactions consisting primarily of management and royalty fees and interest, along with their related tax effects, are excluded from the presentation of net earnings (loss) attributable to Century Casinos, Inc. shareholders and Adjusted EBITDA reported for each segment. Not all of the aforementioned items occur in each reporting period, but have been included in the definition based on historical activity. These adjustments have no effect on the consolidated results as reported under GAAP. Adjusted EBITDA is not considered a measure of performance recognized under GAAP. Management believes that Adjusted EBITDA is a valuable measure of the relative performance of the Company and its properties. The gaming industry commonly uses Adjusted EBITDA as a method of arriving at the economic value of a casino operation. Management uses Adjusted EBITDA to compare the relative operating performance of separate operating units by eliminating the above-mentioned items associated with the varying levels of capital expenditures for infrastructure required to generate revenue and the often high cost of acquiring existing operations. Adjusted EBITDA is used by the Company’s lending institution to gauge operating performance. The Company’s computation of Adjusted EBITDA may be different from, and therefore may not be comparable to, similar measures used by other companies within the gaming industry. Please see the reconciliation of Adjusted EBITDA to net earnings (loss) attributable to Century Casinos, Inc. shareholders below. The Company defines Adjusted EBITDA margin as Adjusted EBITDA divided by net operating revenue. Management uses this margin as one of several measures to evaluate the efficiency of the Company’s casino operations. Century Casinos 25
Appendix A – NON-GAAP FINANCIAL MEASURES The Company defines Net Debt as total long-term debt (including current portion) plus deferred financing costs minus cash and cash equivalents. Net Debt is not considered a liquidity measure recognized under GAAP. Management believes that Net Debt is a valuable measure of our overall financial situation. Net Debt provides investors with an indication of our ability to pay off all of our long-term debt if it became due simultaneously. The cash payments related to the Company’s Master Lease financing obligation are deducted from Adjusted EBITDA to calculate the debt and Net Debt to Adjusted EBITDA ratios. Management believes that the ratio provides investors with an indication of the length of time it would take the Company to repay its long-term debt if Adjusted EBITDA were held constant. Century Casinos 26
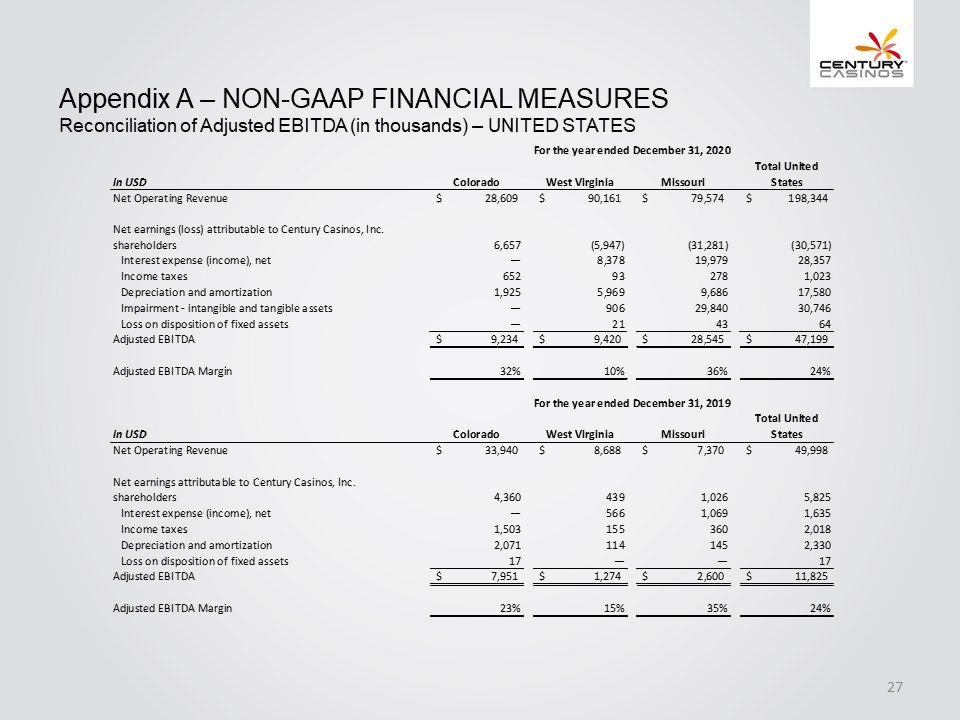
Appendix A – NON-GAAP FI NANCIAL MEASURES Reconciliation of Adjusted EBITDA (in thousands) – UNITED STATES For the year ended December 31, 2020 in USD Colorado West Virginia Missouri Total United States Net Operating Revenue $ 28,609 $ 90,161 $ 79,574 $ 198,344 Net earnings (loss) attributable to Century Casinos, Inc. shareholders 6,657 (5,947) (31,281) (30,571) Interest expense (income), net — 8,378 19,979 28,357 Income taxes 652 93 278 1,023 Depreciation and amortization 1,925 5,969 9,686 17,580 Impairment - intangible and tangible assets — 906 29,840 30,746 Loss on disposition of fixed assets — 21 43 64 Adjusted EBITDA $ 9,234 $ 9,420 $ 28,545 $ 47,199 Adjusted EBITDA Margin 32% 10% 36% 24% For the year ended December 31, 2019 in USD Colorado West Virginia Missouri Total United States Net Operating Revenue $ 33,940 $ 8,688 $ 7,370 $ 49,998 Net earnings attributable to Century Casinos, Inc. shareholders 4,360 439 1,026 5,825 Interest expense (income), net — 566 1,069 1,635 Income taxes 1,503 155 360 2,018 Depreciation and amortization 2,071 114 145 2,330 Loss on disposition of fixed assets 17 — — 17 Adjusted EBITDA $ 7,951 $ 1,274 $ 2,600 $ 11,825 Adjusted EBITDA Margin 23% 15% 35% 24% Century Casinos 27
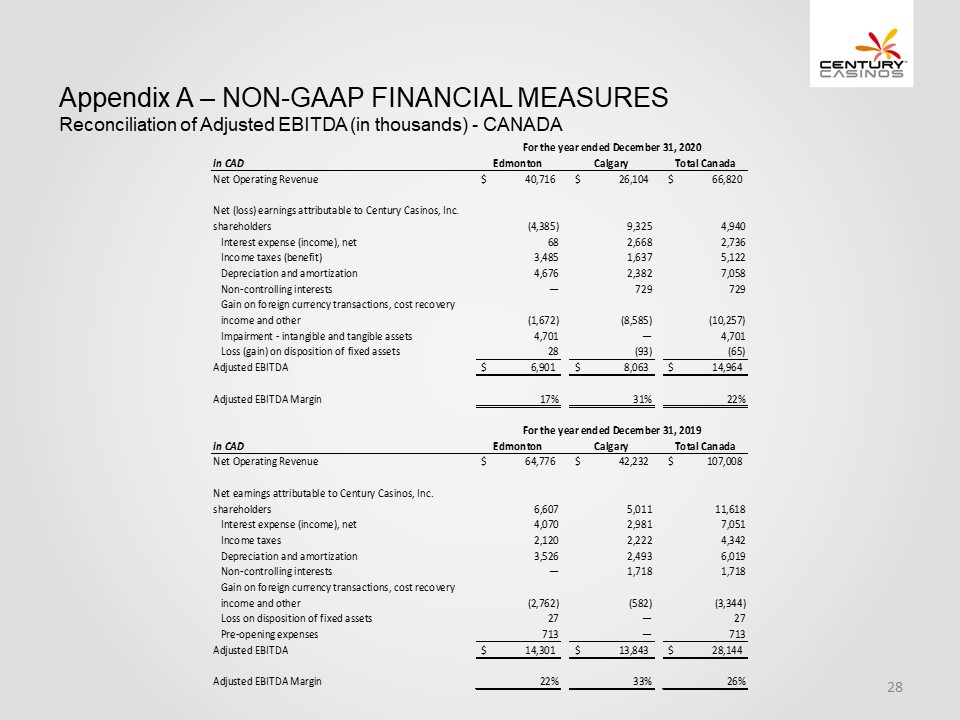
Appendix A – NON-GAAP FINANCIAL MEASURES Reconciliation of Adjusted EBITDA (in thousands) – CANADA For the year ended December 31, 2020 in CAD Edmonton Calgary Total Canada Net Operating Revenue $ 40,716 $ 26,104 $ 66,820 Net (loss) earnings attributable to Century Casinos, Inc. shareholders (4,385) 9,325 4,940 Interest expense (income), net 68 2,668 2,736 Income taxes (benefit) 3,485 1,637 5,122 Depreciation and amortization 4,676 2,382 7,058 Non-controlling interests — 729 729 Gain on foreign currency transactions, cost recovery income and other (1,672) (8,585) (10,257) Impairment - intangible and tangible assets 4,701 — 4,701 Loss (gain) on disposition of fixed assets 28 (93) (65) Adjusted EBITDA $ 6,901 $ 8,063 $ 14,964 Adjusted EBITDA Margin 17% 31% 22% For the year ended December 31, 2019 in CAD Edmonton Calgary Total Canada Net Operating Revenue $ 64,776 $ 42,232 $ 107,008 Net earnings attributable to Century Casinos, Inc. shareholders 6,607 5,011 11,618 Interest expense (income), net 4,070 2,981 7,051 Income taxes 2,120 2,222 4,342 Depreciation and amortization 3,526 2,493 6,019 Non-controlling interests — 1,718 1,718 Gain on foreign currency transactions, cost recovery income and other (2,762) (582) (3,344) Loss on disposition of fixed assets 27 — 27 Pre-opening expenses 713 — 713 Adjusted EBITDA $ 14,301 $ 13,843 $ 28,144 Adjusted EBITDA Margin 22% 33% 26% Century Casinos 28
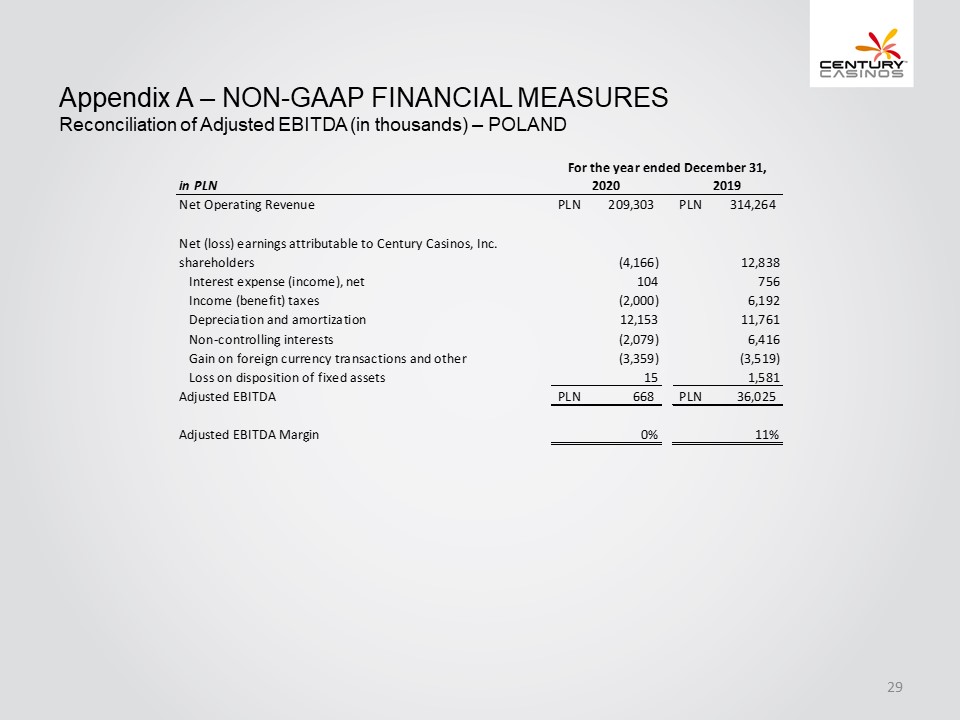
Appendix A – NON-GAAP FINANCIAL MEASURES Reconciliation of Adjusted EBITDA (in thousands) – POLAND For the year ended December 31, in PLN 2020 2019 Net Operating Revenue PLN 209,303 PLN 314,264 Net (loss) earnings attributable to Century Casinos, Inc. shareholders (4,166) 12,838 Interest expense (income), net 104 756 Income (benefit) taxes (2,000) 6,192 Depreciation and amortization 12,153 11,761 Non-controlling interests (2,079) 6,416 Gain on foreign currency transactions and other (3,359) (3,519) Loss on disposition of fixed assets 15 1,581 Adjusted EBITDA PLN 668 PLN 36,025 Adjusted EBITDA Margin 0% 11% Century Casinos 29
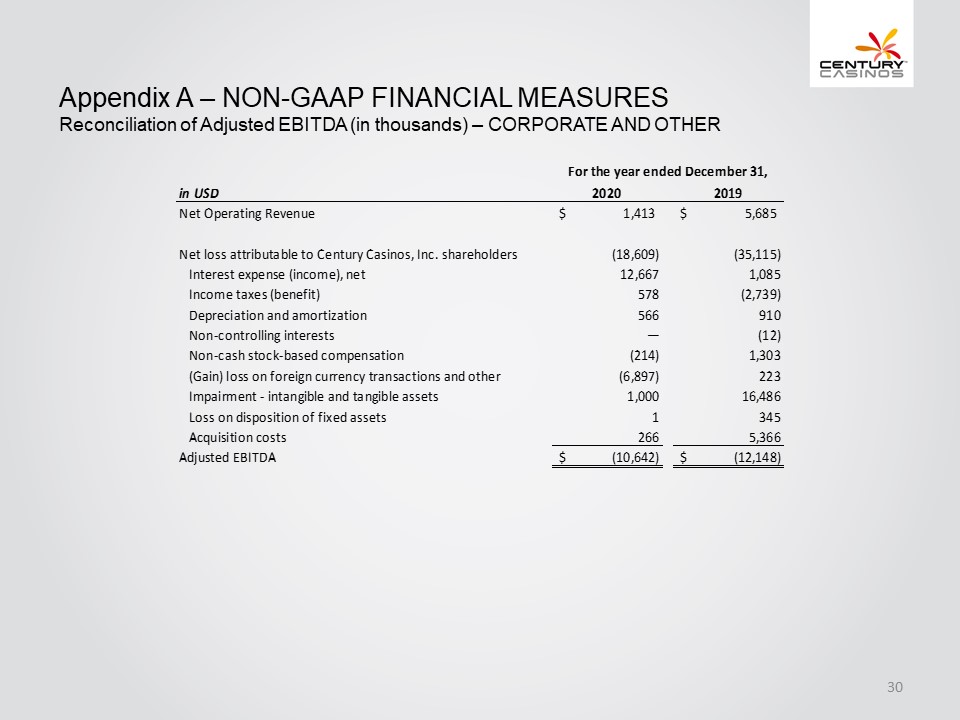
Appendix A – NON-GAAP FINANCIAL MEASURES Reconciliation of Adjusted EBITDA (in thousands) – CORPORATE AND OTHER in USD For the year ended December 31, 2020 2019 Net Operating Revenue $ 1,413 $ 5,685 Net loss attributable to Century Casinos, Inc. shareholders (18,609) (35,115) Interest expense (income), net 12,667 1,085 Income taxes (benefit) 578 (2,739) Depreciation and amortization 566 910 Non-controlling interests — (12) Non-cash stock-based compensation (214) 1,303 (Gain) loss on foreign currency transactions and other (6,897) 223 Impairment - intangible and tangible assets 1,000 16,486 Loss on disposition of fixed assets 1 345 Acquisition costs 266 5,366 Adjusted EBITDA $ (10,642) $ (12,148) Century Casinos 30
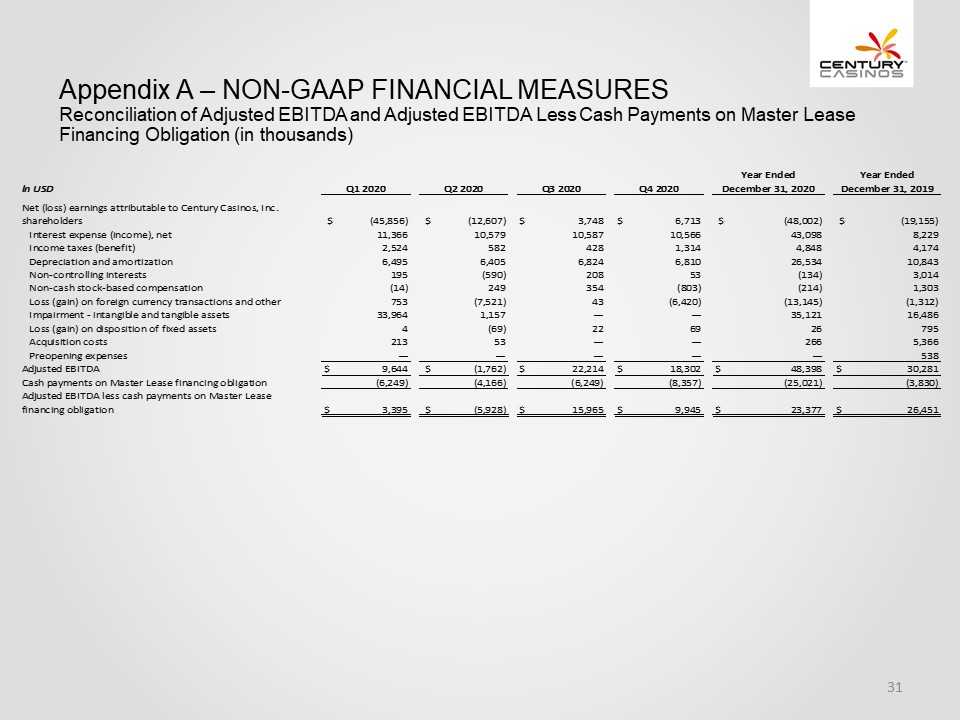
Appendix A – NON-GAAP FINANCIAL MEASURES Reconciliation of Adjusted EBITDA and Adjusted EBITDA Less Cash Payments on Master Lease Financing Obligation (in thousands) In USD Q1 2020 Q2 2020 Q3 2020 Q4 2020 Year Ended December 31, 2020 Year Ended December 31, 2019 Net (loss) earnings attributable to Century Casinos, Inc. shareholders $ (45,856) $ (12,607) $ 3,748 $ 6,713 $ (48,002) $ (19,155) Interest expense (income), net 11,366 10,579 10,587 10,566 43,098 8,229 Income taxes (benefit) 2,524 582 428 1,314 4,848 4,174 Depreciation and amortization 6,495 6,405 6,824 6,810 26,534 10,843 Non-controlling interests 195 (590) 208 53 (134) 3,014 Non-cash stock-based compensation (14) 249 354 (803) (214) 1,303 Loss (gain) on foreign currency transactions and other 753 (7,521) 43 (6,420) (13,145) (1,312) Impairment - intangible and tangible assets 33,964 1,157 — — 35,121 16,486 Loss (gain) on disposition of fixed assets 4 (69) 22 69 26 795 Acquisition costs 213 53 — — 266 5,366 Preopening expenses — — — — — 538 Adjusted EBITDA $ 9,644 $ (1,762) $ 22,214 $ 18,302 $ 48,398 $ 30,281 Cash payments on Master Lease financing obligation (6,249) (4,166) (6,249) (8,357) (25,021) (3,830) Adjusted EBITDA less cash payments on Master Lease financing obligation $ 3 395 $ (5,928) $ 15,965 $ 9,945 $ 23,377 $ 26,451 Century Casinos 31
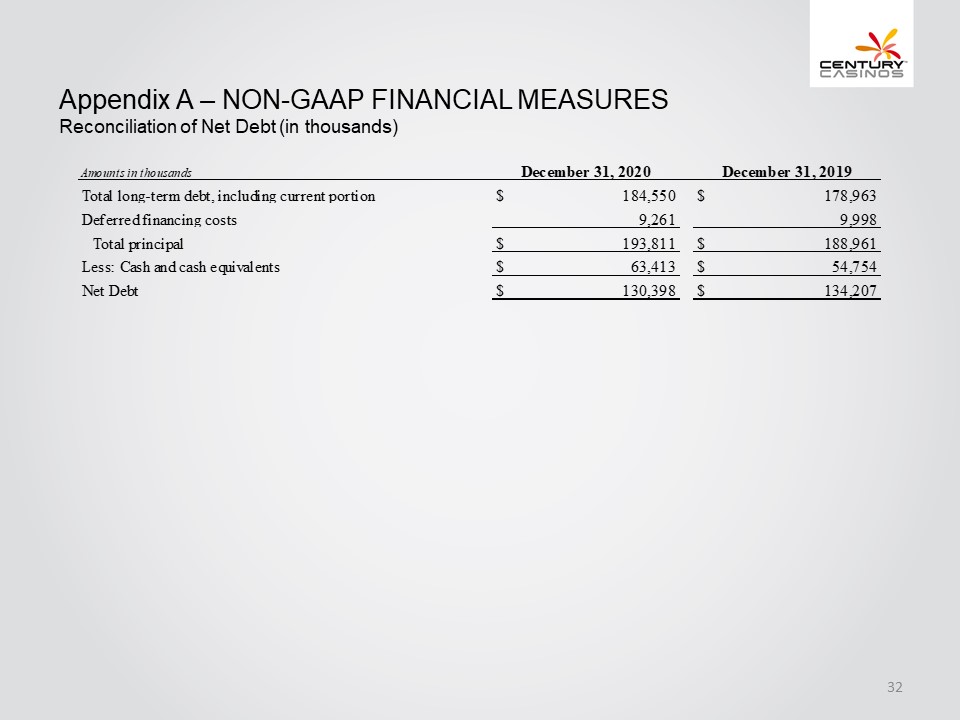
Appendix A – NON-GAAP FINANCIAL MEASURES Reconciliation of Net Debt (in thousands) Amounts in thousands December 31,2020 December 31,2019 Total long-term debt, including current portion $ 184,550 $ 178,963 Deferred financing costs 9,261 9,998 Total principal $ 193,811 $ 188,961 Less: Cash and cash equivalents $ 63,413 $ 54,754 Net Debt $ 130,398 $ 134,207 Century Casinos 32