Attached files
| file | filename |
|---|---|
| EX-99.11 - EX-99.11 - VINE ENERGY INC. | d151897dex9911.htm |
| EX-99.10 - EX-99.10 - VINE ENERGY INC. | d151897dex9910.htm |
| EX-23.4 - EX-23.4 - VINE ENERGY INC. | d151897dex234.htm |
| EX-23.3 - EX-23.3 - VINE ENERGY INC. | d151897dex233.htm |
| EX-23.2 - EX-23.2 - VINE ENERGY INC. | d151897dex232.htm |
| EX-23.1 - EX-23.1 - VINE ENERGY INC. | d151897dex231.htm |
| EX-5.1 - EX-5.1 - VINE ENERGY INC. | d151897dex51.htm |
| EX-1.1 - EX-1.1 - VINE ENERGY INC. | d151897dex11.htm |
Table of Contents
As filed with the Securities and Exchange Commission on March 9, 2021.
Registration No. 333-253366
UNITED STATES
SECURITIES AND EXCHANGE COMMISSION
Washington, D.C. 20549
Amendment No. 3
to
Form S-1
REGISTRATION STATEMENT
UNDER
THE SECURITIES ACT OF 1933
VINE ENERGY INC.
(Exact name of registrant as specified in its charter)
| Delaware | 1311 | 81-4833927 | ||
| (State or other jurisdiction of incorporation or organization) |
(Primary Standard Industrial Classification Code Number) |
(I.R.S. Employer Identification No.) |
5800 Granite Parkway, Suite 550
Plano, Texas 75024
(469) 606-0540
(Address, including zip code, and telephone number, including area code, of registrant’s principal executive offices)
Eric D. Marsh
Chairman and Chief Executive Officer
5800 Granite Parkway, Suite 550
Plano, Texas 75024
(469) 606-0540
(Name, address, including zip code, and telephone number, including area code, of agent for service)
Copies to:
| Matthew R. Pacey Michael W. Rigdon Kirkland & Ellis LLP 609 Main Street, Suite 4700 Houston, Texas 77002 (713) 836-3600 |
Alan Beck Thomas G. Zentner Vinson & Elkins L.L.P. 1001 Fannin, Suite 2500 Houston, Texas 77002 (713) 758-2222 |
Approximate date of commencement of proposed sale of the securities to the public: As soon as practicable after the effective date of this Registration Statement.
If any of the securities being registered on this Form are to be offered on a delayed or continuous basis pursuant to Rule 415 under the Securities Act of 1933, check the following box: ☐
If this Form is filed to register additional securities for an offering pursuant to Rule 462(b) under the Securities Act, check the following box and list the Securities Act registration statement number of the earlier effective registration statement for the same offering. ☐
If this Form is a post-effective amendment filed pursuant to Rule 462(c) under the Securities Act, check the following box and list the Securities Act registration statement number of the earlier effective registration statement for the same offering. ☐
If this Form is a post-effective amendment filed pursuant to Rule 462(d) under the Securities Act, check the following box and list the Securities Act registration statement number of the earlier effective registration statement for the same offering. ☐
Indicate by check mark whether the registrant is a large accelerated filer, an accelerated filer, a non-accelerated filer, a smaller reporting company, or an emerging growth company. See the definitions of “large accelerated filer,” “accelerated filer,” “smaller reporting company” and “emerging growth company” in Rule 12b-2 of the Exchange Act.
| Large accelerated filer | ☐ | Accelerated filer | ☐ | |||
| Non-accelerated filer | ☒ | Smaller reporting company | ☐ | |||
| Emerging growth company | ☒ | |||||
If an emerging growth company, indicate by check mark if the registrant has elected not to use the extended transition period for complying with any new or revised financial accounting standards provided pursuant to Section 7(a)(2)(B) of the Securities Act. ☐
CALCULATION OF REGISTRATION FEE
|
| ||||||||
| Title of Each Class of Securities to be Registered |
Amount to be Registered(1) |
Proposed Maximum Offering Price Per Share(2) |
Proposed Maximum Aggregate Offering Price(1) (2) |
Amount of Registration Fee(3) | ||||
| Class A Common Stock, par value $0.01 per share |
21,562,500 | $19.00 | 409,687,500 | $44,696.91 | ||||
|
| ||||||||
|
| ||||||||
| (1) | Estimated pursuant to Rule 457(a) under the Securities Act of 1933, as amended. Includes 2,812,500 additional shares of Class A common stock that the underwriters have the option to purchase. |
| (2) | Estimated solely for the purpose of calculating the registration fee. |
| (3) | The Registrant previously paid $10,910.00 of the total registration fee in connection with the previously filing of this Registration Statement. |
The registrant hereby amends this registration statement on such date or dates as may be necessary to delay its effective date until the registrant shall file a further amendment which specifically states that this registration statement shall thereafter become effective in accordance with Section 8(a) of the Securities Act of 1933, as amended, or until this registration statement shall become effective on such date as the Securities and Exchange Commission, acting pursuant to said Section 8(a), may determine.
Table of Contents
The information in this prospectus is not complete and may be changed. We may not sell these securities until the registration statement filed with the Securities and Exchange Commission is effective. The prospectus is not an offer to sell these securities nor a solicitation of an offer to buy these securities in any jurisdiction where the offer and sale is not permitted.
Subject to Completion, dated March 9, 2021
PROSPECTUS
18,750,000 Shares

Vine Energy Inc.
Class A Common Stock
This is the initial public offering of the common stock of Vine Energy Inc., a Delaware corporation. We are offering 18,750,000 shares of our Class A common stock. No public market currently exists for our Class A common stock.
We intend to list our Class A common stock on the New York Stock Exchange under the symbol “VEI.”
We anticipate that the initial public offering price will be between $16.00 and $19.00 per share.
Holders of shares of our Class A common stock and Class B common stock are entitled to one vote for each share of Class A common stock and Class B common stock, respectively, held of record on all matters on which stockholders are entitled to vote generally. See “Description of Capital Stock.”
After the completion of this offering, affiliates of The Blackstone Group L.P. will beneficially own approximately 73.0% of the combined voting power of our Class A and Class B common stock. As a result, we will be a “controlled company” within the meaning of the New York Stock Exchange rules. See “Management—Status as a Controlled Company.”
Investing in our Class A common stock involves risks, including those described under “Risk Factors” beginning on page 30 of this prospectus.
| Per share | Total | |||||||
| Price to the public |
$ | $ | ||||||
| Underwriting discounts and commissions(1) |
$ | $ | ||||||
| Proceeds to us (before expenses) |
$ | $ | ||||||
| (1) | The underwriters will also be reimbursed for certain expenses incurred in the offering. “Underwriting (Conflicts of Interest)” contains additional information regarding underwriter compensation. |
We are an “emerging growth company” as that term is used in the Jumpstart Our Business Startups Act of 2012, and as such, we have elected to take advantage of certain reduced public company reporting requirements for this prospectus and future filings. “Risk Factors” and “Prospectus Summary—Emerging Growth Company Status” contain additional information about our status as an emerging growth company.
We have granted the underwriters the option to purchase up to 2,812,500 additional shares of Class A common stock on the same terms and conditions set forth above if the underwriters sell more than 18,750,000 shares of Class A common stock in this offering.
Neither the Securities and Exchange Commission nor any state securities commission has approved or disapproved of these securities or passed on the adequacy or accuracy of this prospectus. Any representation to the contrary is a criminal offense.
The underwriters expect to deliver the shares on or about , 2021.
| Citigroup | Credit Suisse | Morgan Stanley |
| BofA Securities | Barclays | RBC Capital Markets |
| Blackstone | ||||
| Capital One Securities | KeyBanc Capital Markets | MUFG | ||
| CastleOak Securities, L.P. | Drexel Hamilton | Ramirez & Co., Inc. | Stern | |||
Prospectus dated , 2021
Table of Contents

Cutaway view showing co-development of the Haynesville and overlying Mid-Bossier. Multiple wells are drilled from each surface location to increase drilling efficiency and the laterals are spaced to optimize recovery.
Table of Contents
| Page | ||||
| 1 | ||||
| 30 | ||||
| 55 | ||||
| 57 | ||||
| 58 | ||||
| 59 | ||||
| 60 | ||||
| SUMMARY HISTORICAL AND UNAUDITED PRO FORMA CONDENSED COMBINED FINANCIAL INFORMATION |
61 | |||
| MANAGEMENT’S DISCUSSION AND ANALYSIS OF FINANCIAL CONDITION AND RESULTS OF OPERATIONS |
63 | |||
| 86 | ||||
| 122 | ||||
| 127 | ||||
| SECURITY OWNERSHIP OF CERTAIN BENEFICIAL OWNERS AND MANAGEMENT |
135 | |||
| 139 | ||||
| 144 | ||||
| 151 | ||||
| 159 | ||||
| MATERIAL U.S. FEDERAL INCOME TAX CONSIDERATIONS FOR NON-U.S. HOLDERS |
161 | |||
| 165 | ||||
| 172 | ||||
| 172 | ||||
| 172 | ||||
| F-1 | ||||
You should rely only on the information contained in this prospectus and any free writing prospectus prepared by us or on behalf of us or to the information which we have referred you. Neither we nor the underwriters have authorized anyone to provide you with information different from that contained in this prospectus and any free writing prospectus. We take no responsibility for, and can provide no assurance as to the reliability of, any other information that others may give you. We and the underwriters are offering to sell shares of Class A common stock and seeking offers to buy shares of Class A common stock only in jurisdictions where offers and sales are permitted. The information in this prospectus is accurate only as of the date of this prospectus, regardless of the time of delivery of this prospectus or any sale of the Class A common stock. Our business, financial condition, results of operations and prospects may have changed since that date. We will update this prospectus as required by law, including with respect to any material change affecting us or our business prior to the completion of this offering.
This prospectus contains forward-looking statements that are subject to a number of risks and uncertainties, many of which are beyond our control. “Risk Factors” and “Cautionary Statement Regarding Forward-Looking Statements” contain additional information regarding these risks.
Through and including , 2021 (the 25th day after the date of this prospectus), all dealers effecting transactions in our shares, whether or not participating in this offering, may be required to deliver a prospectus. This requirement is in addition to the dealers’ obligation to deliver a prospectus when acting as an underwriter and with respect to an unsold allotment or subscription.
i
Table of Contents
Commonly Used Defined Terms
As used in this prospectus, unless the context indicates or otherwise requires, the terms listed below have the following meanings:
| • | “8.75% Notes” means the 8.75% Senior Notes due 2023 issued by Vine Oil & Gas LP and Vine Oil & Gas Finance Corp. pursuant to that certain indenture dated as of October 18, 2017, by and among Vine Oil & Gas LP, Vine Oil & Gas Finance Corp., the subsidiary guarantors named therein and Wilmington Trust, National Association, as trustee; |
| • | “9.75% Notes” means the 9.75% Senior Notes due 2023 issued by Vine Oil & Gas LP and Vine Oil & Gas Finance Corp. pursuant to that certain indenture dated as of October 3, 2018, by and among Vine Oil & Gas LP, Vine Oil & Gas Finance Corp., the subsidiary guarantors named therein and Wilmington Trust, National Association, as trustee; |
| • | “Blackstone” refers, collectively, to investment funds affiliated with or managed by The Blackstone Group L.P.; |
| • | “Blocker Entities” refers to the entities that are taxable as corporations for U.S. federal income tax purposes through which certain of the Existing Owners indirectly hold LLC Interests; |
| • | “Brix” refers to Brix Oil & Gas Holdings LP and its consolidated subsidiaries; |
| • | “Brix Companies” refers to Brix and Harvest on a combined basis as acquired by Vine Oil & Gas prior to the IPO; |
| • | “Brix Credit Facility” refers to that certain Senior Secured Credit Agreement dated as of March 20, 2018 by and among Brix Operating LLC, the lenders from time to time party thereto, and Macquarie Investments US Inc., as administrative agent, as amended from time to time; |
| • | “Brix GP” refers to Brix Oil & Gas Holdings GP LLC; |
| • | “Brix Investment” refers to Brix Investment LLC, a Delaware limited liability company formed by certain Existing Owners of Brix to hold equity interests in us following the corporate reorganization; |
| • | “Brix Investment II” refers to Brix Investment II LLC, a Delaware limited liability company formed by certain Existing Owners of Brix to hold equity interests in us following the corporate reorganization; |
| • | “Existing Owners” refers, collectively, to Blackstone and the Management Members that directly and indirectly own equity interests in Vine Oil & Gas, Brix and Harvest prior to the completion of our corporate reorganization and in us indirectly through the Vine Energy Investment Vehicles and the Vine Energy Investment II Vehicles as of and following the completion of our corporate reorganization; |
| • | “GAAP” means generally accepted accounting principles in the United States; |
| • | “GEP” means GEP Haynesville, LLC, a subsidiary of GeoSouthern Energy Corp.; |
| • | “Harvest” means Harvest Royalties Holdings LP and its consolidated subsidiaries; |
| • | “Harvest GP” means Harvest Royalties Holdings GP LLC; |
| • | “Harvest Investment” refers to Harvest Investment LLC, a Delaware limited liability company formed by certain Existing Owners of Harvest to hold equity interests in us following the corporate reorganization; |
| • | “Harvest Investment II” refers to Harvest Investment II LLC, a Delaware limited liability company formed by certain Existing Owners of Harvest to hold equity interests in us following the corporate reorganization; |
| • | “IPO” means the initial public offering of the common stock of Vine Energy Inc.; |
ii
Table of Contents
| • | “JOA” means the Definitive Agreement for the Division of Operatorship for Blacksmith—Magnolia Area of Interest, dated November 1, 2012; |
| • | “Levered free cash flow” means a non-GAAP financial measure, defined as the amount of money the company has remaining after paying its financial obligations related to investing activities prior to considering any funds received from or paid for financing activities and calculated as net cash provided by operating activities less net cash used in investing activities; |
| • | “Management Member” refers to our individual officers and employees who, together with Blackstone, held equity in Vine Oil & Gas, Brix or Harvest immediately prior to the corporate reorganization; |
| • | “RBL” means Vine Oil & Gas LP’s revolving credit facility, dated as of November 25, 2014, by and among Vine Oil & Gas LP, HSBC Bank USA, National Association, as Administrative Agent, Collateral Agent, Swingline Lender and as Issuing Bank and the banks, financial institutions and other lending institutions from time to time party thereto, as amended; |
| • | “Second Lien Credit Agreement” means that certain credit agreement entered into in December 2020 with Morgan Stanley Senior Funding, Inc. as administrative agent and collateral agent, and certain other banks, financial institutions and other lending institutions from time to time party thereto, pursuant to which we were provided with the Second Lien Term Loan; |
| • | “Second Lien Term Loan” means Vine Oil & Gas LP’s $150 million second lien term loan facility, dated as of December 30, 2020, by and among Vine Oil & Gas LP, Morgan Stanley Senior Funding, Inc., as administrative agent and collateral agent, and the several lenders party thereto, issued at 97.25% of face value on December 30, 2020; |
| • | “Shell” means affiliates of Royal Dutch Shell plc; |
| • | “Shell Acquisition” means the acquisition of natural gas properties in the Haynesville Basin of Northwest Louisiana in November 2014 from affiliates of Shell; |
| • | “Superpriority Facility” means Vine Oil & Gas LP’s superpriority facility, dated as of February 7, 2017, by and among Vine Oil & Gas LP, HSBC Bank USA, National Association, as Administrative Agent, Swingline Lender and as Issuing Bank and the banks, financial institutions and other lending institutions from time to time party thereto, as amended; |
| • | “Tax Receivable Agreement” means that tax receivable agreement to be entered into in connection with the closing of this offering, by and among Vine Investment, Brix Investment, Harvest Investment, Vine Investment II, Brix Investment II, Harvest Investment II, Vine Holdings, Vine Energy and certain others from time to time a party thereto; |
| • | “Third Lien Credit Agreement” means that certain credit agreement entered into in December 2019 with Blackstone Holdings Finance Co LLC, as administrative agent and collateral agent and certain other banks, financial institutions and other lending institutions from time to time party thereto; |
| • | “VEH LLC Agreement” means the amended and restated limited liability company agreement of Vine Holdings; |
| • | “Vine,” “we,” “us,” “our” or the “company” or other like terms, prior to the corporate reorganization described in this prospectus (unless otherwise disclosed), refer collectively to Vine Oil & Gas, Brix and Harvest on a combined basis and together with their consolidated subsidiaries, and following the corporate reorganization described in this prospectus, to Vine Energy; |
| • | “Vine Energy” refers to Vine Energy Inc. and its consolidated subsidiaries (including, for the avoidance of doubt, the Blocker Entities following the corporate reorganization), unless otherwise required by context; |
| • | “Vine Energy Investment Vehicles” refers to Vine Investment, Brix Investment and Harvest Investment, collectively; |
iii
Table of Contents
| • | “Vine Energy Investment II Vehicles” refers to Vine Investment II, Brix Investment II and Harvest Investment II, collectively; |
| • | “Vine Holdings” refers to Vine Energy Holdings LLC; |
| • | “Vine Investment” refers to Vine Investment LLC, a Delaware limited liability company formed by certain Existing Owners to hold equity interests in us following the corporate reorganization; |
| • | “Vine Investment II” refers to Vine Investment II LLC, a Delaware limited liability company formed by certain Existing Owners to hold equity interests in us following the corporate reorganization; |
| • | “Vine Oil & Gas” refers to Vine Oil & Gas Parent LP and its consolidated subsidiaries; |
| • | “Vine Oil & Gas GP” refers to Vine Oil & Gas Parent GP LLC; |
| • | “Vine Unit Holder” means a holder of Vine Units (other than Vine Energy) and a corresponding number of shares of Class B common stock; |
| • | “Vine Units” means units representing limited liability company interests in Vine Holdings issued pursuant to the VEH LLC Agreement; and |
| • | “Von Gonten” means W.D.Von Gonten & Co., our independent reserve engineer. |
Glossary of Oil and Natural Gas Terms
The following are abbreviations and definitions of certain terms used in this document, which are commonly used in the oil and natural gas industry:
| • | “ARO” means asset retirement obligation; |
| • | “Basin” refers to a geographic area containing specific geologic intervals; |
| • | “Bcf” means one billion cubic feet of natural gas; |
| • | “Bcfd” means one billion cubic feet of natural gas per day; |
| • | “Btu” means one British thermal unit, the quantity of heat required to raise the temperature of a one- pound mass of water by one degree Fahrenheit; |
| • | “CapEx” means capital expenditures; |
| • | “Completion” means all the post-drilling and post-casing processes to allow the well to flow hydrocarbons; |
| • | “D&C” means drilling and completion costs; |
| • | “Developed acreage” means the number of acres that are allocated or assignable to productive wells or wells capable of production; |
| • | “Drilling” means any activity related to drilling pad make-ready costs, rig mobilization and creating a wellbore in order to facilitate the ultimate production of hydrocarbons; |
| • | “Estimated ultimate recovery” or “EUR” means the sum of reserves remaining as of a given date and cumulative production as of that date. As used in this prospectus, EUR includes only proved reserves and is based on our reserve estimates; |
| • | “FERC” means the Federal Energy Regulatory Commission; |
| • | “Field” means an area consisting of a single reservoir or multiple reservoirs all grouped on, or related to, the same individual geological structural feature or stratigraphic condition. The field name refers to the surface area, although it may refer to both the surface and the underground productive formations; |
iv
Table of Contents
| • | “Formation” means a layer of rock which has distinct characteristics that differs from nearby rock; |
| • | “Henry Hub” means the distribution hub on the natural gas pipeline system in Erath, Louisiana, owned by Sabine Pipe Line LLC; |
| • | “Horizontal drilling” means a drilling technique used in certain formations where a well is drilled vertically to a certain depth and then drilled horizontally within a specified interval; |
| • | “IDC” means intangible drilling cost; |
| • | “Drilling locations” means total gross locations that may be able to be drilled on our existing acreage. A portion of our drilling locations constitute estimated locations based on our acreage and spacing assumptions, as described in “Business—Our Operations—Reserve Data—Drilling Locations”; |
| • | “Invested capital” means the CapEx required to drill, complete and equip with facilities a single well; |
| • | “LNG” means liquified natural gas; |
| • | “Mcf” means one thousand cubic feet of natural gas; |
| • | “MMBtu” means one million Btu; |
| • | “MMBtud” means one MMBtu per day; |
| • | “MMcf” means one million cubic feet of natural gas; |
| • | “MMcfd” means one MMcf per day; |
| • | “MT” means one metric ton; |
| • | “NGL” means natural gas liquids; |
| • | “Net acres” means the percentage of total acres an owner owns or has leased out of a particular number of acres, or a specified tract. An owner who has 50% interest in 100 acres owns 50 net acres; |
| • | “NYMEX” means the New York Mercantile Exchange; |
| • | “Possible reserves” means those additional reserves which analysis of geoscience and engineering data suggest are less likely to be recoverable than probable reserves. The total quantities ultimately recovered from the project have a low probability to exceed the sum of proved plus probable plus possible reserves (“3P”), which is equivalent to the high estimate scenario. In this context, when probabilistic methods are used, there should be at least a 10% probability that the actual quantities recovered will equal or exceed the 3P estimate; |
| • | “Probable reserves” means those additional reserves which analysis of geoscience and engineering data indicate are less likely to be recovered than proved reserves but more certain to be recovered than possible reserves. It is equally likely that actual remaining quantities recovered will be greater than or less than the sum of the estimated proved plus probable reserves (“2P”). In this context, when probabilistic methods are used, there should be at least a 50% probability that the actual quantities recovered will equal or exceed the 2P estimate; |
| • | “Productive well” means a well that is capable of producing hydrocarbons in sufficient quantities such that proceeds from the sale of the production exceed production expenses; |
| • | “Proved developed reserves” means reserves that can be expected to be recovered through existing wells with existing equipment and operating methods, according to the SEC or Society of Petroleum Engineers definitions of proved reserves; |
| • | “Proved reserves” means the reserves which geological and engineering data demonstrate with reasonable certainty to be commercially recoverable in future years from known reservoirs under existing economic and operating conditions; |
| • | “Proved undeveloped reserves” or “PUDs” means proved reserves that are expected to be recovered from undrilled well locations on existing acreage or from existing wells where a relatively major expenditure is required for recompletion within the five year development window, according to the SEC or Society of Petroleum Engineers definition of PUD; |
v
Table of Contents
| • | “Recompletion” means the process of re-entering an existing wellbore and mechanically re- invigorating the wellbore to establish or increase existing production and reserves; |
| • | “Reservoir” means a porous and permeable underground formation containing a natural accumulation of producible oil and/or natural gas that is confined by impermeable rock and is separate from other reservoirs; |
| • | “Spacing” means the distance between wells producing from the same reservoir. Spacing is often expressed in terms of acres (e.g., 40-acre spacing) and is often established by regulatory agencies; |
| • | “Standardized measure” means discounted future net cash flows estimated by applying year-end prices to the estimated future production of year-end proved reserves. Future cash inflows are reduced by estimated future production and development costs based on period-end costs to determine pre-tax cash inflows. Future income taxes, if applicable, are computed by applying the statutory tax rate to the excess of pre-tax cash inflows over our tax basis in the natural gas and oil properties. Future net cash inflows after income taxes are discounted using a 10% annual discount rate; |
| • | “Tcf” means one trillion cubic feet; |
| • | “TWh” means terawatt hours; |
| • | “Undeveloped acreage” means acreage under lease on which wells have not been drilled or completed such that there is not production of commercial quantities of hydrocarbons; |
| • | “Unit” means the joining of all or substantially all interests in a specific reservoir or field, rather than a single tract, to provide for development and operation without regard to separate mineral interests. Also, the area covered by a unitization agreement; |
| • | “Weighted average rate of return” means the weighted average single well internal rate of returns on D&C capital realized at a noted price for our remaining core inventory. The single well return calculation is based on our reserve type curves and internal cost estimates and is weighed based on the remaining footage associated with our core drilling locations for each category of lateral lengths; |
| • | “Wellbore” or “well” means a drilled hole that is equipped for natural gas production; and |
| • | “Working interest” means the right granted to the lessee of a property to explore for and to produce and own natural gas or other minerals. The working interest owners bear the exploration, development, and operating costs on either a cash, penalty, or carried basis. |
Certain amounts and percentages included in this prospectus have been rounded. Accordingly, in certain instances, the sum of the numbers in a column of a table may not exactly equal the total figure for that column.
Presentation of Financial and Operating Data
Unless otherwise indicated, the summary historical consolidated financial information presented in this prospectus is that of our accounting predecessor, Vine Oil & Gas. The pro forma financial information presented in this prospectus treats the combination of Vine Oil & Gas, Brix and Harvest in connection with our corporate reorganization as an acquisition in a business combination of Brix and Harvest by Vine Oil & Gas. Please see “Corporate Reorganization” and “Unaudited Pro Forma Condensed Combined Financial Statements” included elsewhere in this prospectus.
In addition, unless otherwise indicated, the reserve and operational data presented in this prospectus is that of Vine Oil & Gas, Brix and Harvest on a combined basis as of the dates and for the periods presented.
vi
Table of Contents
Industry and Market Data
The market data and certain other statistical information used throughout this prospectus are based on independent industry publications, government publications and other published independent sources. Although we believe these third-party sources are reliable as of their respective dates, neither we nor the underwriters have independently verified the accuracy or completeness of this information. These sources include an article entitled Study Forecasts Gradual Haynesville Production Recovery Before Final Decline, dated December 2015, by The Oil & Gas Journal, reports entitled Haynesville Inventory, dated April 2020, and Enverus Gas Plays and Market Outlook, dated October 2020, by Enverus, reports entitled World Energy Outlook 2020, dated October 2020, and Global EV Outlook 2020, dated June 2020, by IEA (as defined below), reports entitled Annual Energy Outlook 2020, dated January 2020, and U.S. Energy-Related Carbon Dioxide Emissions, 2019, dated September 2019, by EIA (as defined below), presentations entitled North America Gas Market Outlook, dated July 2020 and North America Energy Markets, dated November 2020, by Wood Mackenzie, and Rig Count by Baker Hughes, dated November 2020. The industry in which we operate is subject to a high degree of uncertainty and risk due to a variety of factors, including those described in the section entitled “Risk Factors.” These and other factors could cause results to differ materially from those expressed in these publications.
Trademarks and Trade Names
We own or have rights to various trademarks, service marks and trade names that we use in connection with the operation of our business. This prospectus may also contain trademarks, service marks and trade names of third parties, which are the property of their respective owners. Our use or display of third parties’ trademarks, service marks, trade names or products in this prospectus is not intended to, and does not imply a relationship with, or endorsement or sponsorship by us. Solely for convenience, the trademarks, service marks and trade names referred to in this prospectus may appear without the ®, TM or SM symbols, but such references are not intended to indicate, in any way, that we will not assert, to the fullest extent under applicable law, our rights or the rights of the applicable licensor to these trademarks, service marks and trade names.
vii
Table of Contents
This summary provides a brief overview of information contained elsewhere in this prospectus. Readers should consider this entire prospectus and other referenced documents before making an investment decision. Other material information can be found under “Risk Factors,” “Cautionary Statement Regarding Forward- Looking Statements” and “Management’s Discussion and Analysis of Financial Condition and Results of Operations” and the historical financial statements and the related notes to those financial statements contained elsewhere in this prospectus. Where applicable, we have assumed an initial public offering price of $17.50 per share (the midpoint of the price range set forth on the cover page of this prospectus).
Unless otherwise indicated, the information presented in this prospectus assumes that the underwriters’ option to purchase additional shares of Class A common stock is not exercised. Unless otherwise indicated, the estimated reserve information presented in this prospectus was prepared by our independent reserve engineer as of December 31, 2020 based on the SEC’s reserve pricing rule and NYMEX forward strip pricing, as more fully described in “ —Reserve and Operating Data,” and is presented as of the dates and for the periods indicated. Certain operational terms used in this prospectus are defined in the “Glossary of Oil and Natural Gas Terms” and “Commonly Used Defined Terms.”
Our Company
We are an energy company focused on the development of natural gas properties in the stacked Haynesville and Mid-Bossier shale plays in the Haynesville Basin of Northwest Louisiana.
Natural gas demand has significantly grown as a percentage of North America’s energy mix over the last ten years, having increased 38% from 86 Bcfd to 119 Bcfd and growing from 27% to 37% of the energy mix due to ample domestic supply, reliability of supply, significant supporting in-place infrastructure, low carbon intensity and low prices. In particular, demand for exported LNG has contributed to approximately 21% of that increase, with continued growth in LNG exports anticipated according to Wood Mackenzie. We believe natural gas will continue to be instrumental as a low carbon intensity source for meeting growing energy demand.
We believe the Haynesville will be particularly critical to meeting future natural gas demand. The Haynesville and Mid-Bossier shales are among the highest quality, highest return dry gas resource plays in North America with approximately 489 Tcf of natural gas in place, according to The Oil & Gas Journal. The Haynesville is among the oldest and most delineated shale plays in North America and its well economics have continued to improve in recent years as a result of advances in enhanced drilling and completion techniques, combined with predictable production profiles and well cost reductions. These advances have driven both higher and more capital efficient reserve recoveries on a per lateral foot basis, primarily as a consequence of optimized fracture stage lengths and increased proppant and water loading.
The Mid-Bossier shale overlays the Haynesville shale and demonstrates similar characteristics and well results. Additionally, the Haynesville and Mid-Bossier shales possess high-quality petrophysical characteristics, such as being over-pressured and having high porosity, permeability and thickness. Both plays also exhibit consistent and predictable geology and high EURs relative to D&C costs. These plays are at 10,500 to 13,500 ft in depth with formation temperatures ranging from 300 to 375° F, resulting in near pipeline quality natural gas requiring little additional processing, which contributes to relatively low operating costs. Lastly, due to significant historical development activity in the Haynesville beginning in 2008, which resulted in approximately 5,700 wells drilled through December 31, 2020, production and decline rates are predictable, and low-cost and sufficient midstream infrastructure is already in place. We therefore believe the Haynesville is one of the lowest-cost, lowest-risk natural gas plays in North America. As a consequence of these factors, as well as our proximity to Henry Hub and other premium Gulf Coast markets, LNG export facilities and other end-users, the play
1
Table of Contents
benefits from low breakeven costs, higher cash margins and higher pricing netbacks relative to other North American natural gas plays, such as those in Appalachia and the Rockies.
In contrast to the Haynesville, other sources of natural gas supply, including associated gas from oil-prone drilling and natural gas from the Appalachian region, are facing headwinds in the form of reduced activity and infrastructure constraints. Associated natural gas from oil-prone drilling was the largest contributor to natural gas supply growth from 2011 to 2019. However, due to the significant oil price shock brought on by the COVID-19 pandemic, the number of rigs drilling for oil in North America fell 59% in 2020, which is expected to result in a significant decline in future natural gas supply. While the Marcellus and Utica shales in the northeast United States currently account for approximately 30% of North American natural gas supply, there is limited pipeline capacity available to transport natural gas out of the area. Additionally, the demanding regulatory environment in the Northeast has limited new gas pipeline infrastructure. As such, we believe the Haynesville will be further relied upon to meet natural gas demand growth driven by increasing electricity demand associated with the global economic recovery, coupled with the continued increase in global LNG cargoes.
We first entered the Haynesville in 2014 following the Shell Acquisition and have actively acquired additional proximate acreage. We have approximately 125,000 net surface acres centered in what we believe to be the core of the Haynesville. Over 90% of our acreage is held-by-production and we operate over 90% of our future drilling locations with an average working interest of 83%. Approximately 84% of our acreage is prospective for dual-zone development, providing us with approximately 900 drilling locations among Vine, Brix and Harvest. Utilizing an average of 4 gross rigs, which we believe is sufficient to maintain production, we have approximately 25 years of development opportunities. We are not subject to any material minimum volume commitments in our gathering agreements, and have no firm transportation commitments, which provides us with the flexibility to match an optimal development pace to the prevailing natural gas price and hedging environment at any given time. This, coupled with the extensive midstream infrastructure and low basis differentials in the Haynesville, contributes to lower break-even costs. Research from Enverus projects that the average Haynesville Basin core well generates a 31% rate of return using a NYMEX gas price of $2.75 per MMBtu, which Enverus ranks as the highest among notable shale plays in North America. Moreover, based on the location of our acreage, which is in some of the most prospective parts of the Haynesville, we believe our weighted average rate of return based on internal cost assumptions for our remaining core drilling locations is 85% at a NYMEX gas price of $2.75 per MMBtu. As of December 31, 2020, we had approximately 370 net producing wells. Our assets are located almost entirely in Red River, DeSoto and Sabine parishes of Northwest Louisiana, which, according to Enverus, have consistently demonstrated higher EURs relative to drilling and completion costs than the Haynesville in Texas and other parishes in Louisiana.
The following table provides a summary of our inventory of drilling locations as of December 31, 2020, including average lateral length and drilling location data in each play.
Drilling Locations (1) (2)
| Short Lateral |
Long Lateral |
|||||||||||
| Length | <5,300 ft | >5,300 ft | Total | |||||||||
| Haynesville |
226 | 147 | 373 | |||||||||
| Mid-Bossier |
212 | 293 | 505 | |||||||||
|
|
|
|
|
|
|
|||||||
| Total Core |
438 | 440 | 878 | |||||||||
|
|
|
|
|
|
|
|||||||
| Total Non-Core |
44 | 10 | 54 | |||||||||
|
|
|
|
|
|
|
|||||||
| Total Drilling Locations |
482 | 450 | 932 | |||||||||
|
|
|
|
|
|
|
|||||||
2
Table of Contents
| (1) | “Business—Our Operations—Reserve Data and Presentation—Drilling Locations” contains a description of our methodology used to determine gross drilling locations. We exclude drilling locations where our working interest is less than 20%. |
| (2) | 932 gross drilling locations reflecting an average working interest of approximately 83% or 776 net drilling locations. |
We describe the progression of our well completions as Vintages with our most recent wells described as Vintage 5. The characteristics of our Vintage 5 wells include 100-mesh sand completions, decreased cluster spacing, optimized proppant and water loading and refined stage lengths. We intend to continue employing longer laterals to develop certain areas within our asset base in order to increase capital efficiency. The shift to a higher concentration of longer laterals is a strategy we believe reflects our recent success in drilling long laterals of up to 10,000 ft. We expect this will increase our capital efficiency by allowing us to develop the gas in place using fewer wellbores and lower development costs, resulting in lower breakeven prices and higher returns.
Substantially all of our leasehold acreage is not subject to expiry because we have at least one developed well in each section, which, through continuous production of gas, maintains the leasehold position in that section and provides us with flexibility to conduct our remaining development. Our acreage has been delineated by over 700 gross horizontal wells drilled across our position in Sabine, Red River and DeSoto parishes, providing us with confidence that our inventory of drilling locations is low-risk and repeatable and that we can continue to generate consistent economic returns; of these 700 wells, over 280 wells have been brought online under our ownership or participation since our development program began in 2015, providing us with a significant amount of well performance data and associated learnings. In addition to the 700 wells drilled on our acreage, approximately 1,000 wells have been drilled by other operators within one mile of our position, further enhancing the delineation and confidence in our acreage. The company also holds license to almost 400 square miles of 3D and 50 miles of 2D seismic data. We are the leader of Mid-Bossier development, accounting for 36% of all Mid-Bossier wells brought online from 2017 to 2020, which is more than any other single operator.
All of the company’s acreage is underlaid by Northwest Louisiana’s extensive legacy midstream infrastructure, which includes access to sufficient gathering capacity to accommodate our future growth, including our primary third-party gatherer’s approximately 500 miles of pipeline and related treating plants. Their system is currently operating at an approximate 90% utilization rate and has multiple offload points where we can transfer volumes to other area gatherers at equivalent rates. This significant pre-existing area midstream infrastructure provides access to other area gatherers, and we utilize their capacity on both a firm and interruptible basis and expect to continue to do so in the future. We sell our gas at the tailgates of the treating plants attached to our gatherers’ systems and, as a result, incur and hold no direct firm-transportation cost or commitments. Furthermore, approximately 1.0 Bcfd of additional transportation capacity came online in mid-2020 through the DTE Energy (LEAP) project and another approximately 1.0 Bcfd is expected by mid-year 2021 with the Enterprise Product Partners (Acadian) project. Our proximity and sales to Henry Hub and other premium Gulf Coast markets, LNG export facilities and other end-users results in our netbacks reflecting low transportation costs, which is a significant competitive advantage compared to other North American dry gas plays such as those in Appalachia and the Rockies. As a result of these takeaway and sales dynamics, our basis differentials have remained tightly banded since our inception, ranging from $0.01 to $0.26 per MMBtu; over this same period, basis differentials in Appalachia and the Rockies have ranged from $0.27 to $1.54 and $0.12 to $0.96 per MMBtu, respectively. Further, in 2020, Vine Oil & Gas sold approximately 62% of its total gas production through firm sales contracts, with approximately 37% of total production being sold at specified differentials from Henry Hub, providing additional support to our realized pricing. We believe these attractive relative realizations and our long-term access to growing demand (e.g. LNG, chemical, refinery) on the Gulf Coast support our development plan and ability to generate levered free cash flow in various commodity price environments.
3
Table of Contents
A transition to cleaner sources of energy is underway across the globe as demand for renewables and natural gas is projected to increase at a more rapid pace than demand for higher emission energy sources like coal and oil. According to the International Energy Agency (“IEA”) global natural gas demand is projected to grow 15% between 2019 and 2030, resulting in an increase of approximately 17 Tcf of demand. Much of this growth, approximately 8 Tcf, is in the industrial sector, with growth in power generation, buildings, transportation and other sectors comprising the balance. Additionally, global natural gas consumed for energy and feedstock uses in industry is expected to grow 25% between 2019 and 2030, while coal and oil are projected to decline.
With respect to domestic electricity generation, the U.S. Energy Information Agency (“EIA”) projects that between 2019 and 2050, electricity generation will increase approximately 30% from 4,127 billion kilowatt hours to 5,414 billion kilowatt hours. In 2019, natural gas represented 37% of this fuel mix while renewables represented 19% with the balance comprised of coal at 24% and nuclear at 19%. By 2050, the EIA predicts that natural gas will remain a relatively constant 36% of this growing market, while renewables will increase to 38% and coal and nuclear will decrease to 13% and 12%, respectively. Renewables like wind and solar, which are intermittent by nature, require non-intermittent back up capacity such as natural gas, to provide a consistent level of electricity generation. More globally, the International Energy Agency (“IEA”) predicts that global demand from electric vehicles will increase from 69 TWh in 2019 to 551 TWh by 2030, representing a compound annual growth rate (“CAGR”) of 21%. We believe that increasing demand for electricity from lower emissions sources, like renewables and natural gas, demonstrate how natural gas will play a critical role in this transition to a cleaner energy future.
North America has become increasingly dependent on natural gas for its energy consumption needs, and the EIA credits the increasing use of natural gas in domestic power generation as the leading factor in the 15% decrease in domestic energy related CO2 emissions from 2007 to 2019. Additionally, domestic LNG exports, which began in 2016, have increased to current levels of approximately 10 Bcfd. We believe the export of LNG to global markets will allow economies in Asia, Europe and Latin America to be less dependent on higher emission fuels as has been the case in North America.
Due to the composition of our production stream, which is essentially all dry gas (i.e. methane), we do not produce any associated oil or natural gas liquids. We also produce small amounts of water, CO2 and other byproducts. Since our production is not burdened with having to separate, store or transport oil or natural gas liquids, we do not have any direct emissions related to these processes. Moreover, by utilizing industry leading technology, we seek to measure and reduce our emissions and consider doing so a core competency of our business. We measure the quantity of greenhouse gas emissions in metric tons of CO2 equivalent, or “CO2e,” and the intensity of our emissions in CO2e per Bcf of production. We also measure methane emissions as a percentage of production or methane intensity. We have adopted operational practices specifically designed to reduce our emission footprint, including installation of intermittant and no-bleed control valves, utilization of bi-fuel drilling and completion equipment, proactive Leak Detection and Repair (“LDAR”) wellsite surveys to reduce fugitive emissions, and the onsite generation of solar power to operate certain equipment. While from 2017 to 2020 our annual production increased 153.5% from 128.8 Bcf to 326.5 Bcf, our CO2e emissions rate decreased by 35% from 686 mT CO2e/Bcf to 444 mT CO2e/Bcf and our methane intensity decreased by 77% from 0.061% to 0.014% of production, below BP by comparison, an industry leader at 0.14% of production across its more diverse asset base. Given the low emissions nature of our natural gas production and the additional active mitigation measures we implement, we believe we have one of the lowest emission levels per Bcf of annual production of any domestic onshore oil and gas company.
Our management team has extensive experience in the Haynesville and Mid-Bossier and a proven track record of implementing large-scale, technically driven development programs to target best-in-class returns in some of the most prominent resource plays across North America. Many members of our management team have extensive experience working in the Haynesville since its inception as a commercial play and have directly contributed to its
4
Table of Contents
technical advancement. Since the Shell Acquisition, our management team has been at the forefront of developing the technology to enhance well EUR and economics for both Haynesville and Mid-Bossier wells, including;
| • | increasing lateral length; |
| • | optimizing fracture stage lengths; |
| • | optimizing the amount and intensity of proppant and fluid pumped per foot of lateral; |
| • | reducing cluster spacing; |
| • | managing production rates to preserve downhole pressure; |
| • | adjusting well spacing and development patterns; and |
| • | improving wellbore landing accuracy. |
Successful implementation of these measures has resulted in superior well performance relative to that of other major operators in the basin as seen in the charts below.
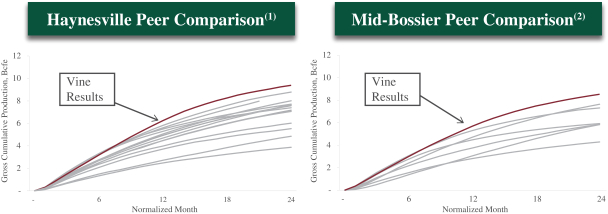
| ||
| Note: | Vine and third-party data sourced from Enverus. Includes horizontal wells targeting the Haynesville and Mid-Bossier with initial production between 2017 to 2020, normalized to a 7,500’ lateral. |
| (1) | Haynesville peers include Aethon Energy Management LLC, BPX Energy Inc., Castleton Commodities International LLC, Chesapeake Energy Corporation, EnSight IV Energy Partners, LLC, Exco Resources, Inc., Exxon Mobil Corporation, GeoSouthern Haynesville, Goodrich Petroleum Corporation, Indigo Natural Resources, LLC, Rockcliff Energy LLC, Sabine Oil & Gas Corporation. |
| (2) | Mid-Bossier peers include Aethon Energy Management LLC, BPX Energy Inc., Comstock Resources Inc., Exxon Mobil Corporation, GeoSouthern Haynesville, and Indigo Natural Resources, LLC. |
To maximize gas recovery from our wells, we manage the downhole pressure drop after initial flowback which results in a flat early-time production profile. The flat production profile is 5 to 18 months for both our Haynesville and Mid-Bossier wells. After the flat production period, our wells enter an exponential decline period followed by a hyperbolic decline and a final exponential terminal decline.
We believe that the gas price necessary to yield a 10% rate of return on invested capital (“Breakeven PV-10”) to be $1.91 per MMBtu NYMEX on average for our remaining core drilling locations. Additionally, and based on internal estimates, we believe the gas price necessary to yield a Breakeven PV-10 for our remaining Haynesville and Mid-Bossier drilling locations to be $1.90 and $1.93 per MMBtu, respectively. These results demonstrate basin leading breakevens based on estimates from Enverus, which indicate Haynesville and Mid-
5
Table of Contents
Bossier breakevens for our peers range from $2.05 to $2.54 and $1.93 to $2.74 per MMBtu, respectively. Furthermore, our wells generally achieve payout of our drilling and completion costs within 12 to 16 months, which allows for efficient recycling of cash flow and provides significant excess cash flow beyond payout and, what we believe to be, industry leading returns on investment.
History of the Haynesville and Our Acreage
The Haynesville shale and the overlying Mid-Bossier shale were deposited in a Jurassic basin that covers more than 9,000 square miles and includes eight parishes in North Louisiana and eight counties in East Texas, collectively called the Haynesville. These shales were deposited in a deep, restricted basin that preserved the rich organic content and through subsequent burial, developed strong reservoir properties, including becoming over-pressured and preserving porosity and permeability. Within our acreage position, the Haynesville ranges from 11,500 ft to over 13,500 ft deep and can be as thick as 200 ft. The Mid-Bossier overlays the Haynesville and ranges from 11,000 ft to 13,000 ft deep and can be as thick as 350 ft.
Although this area has seen almost continuous drilling since oil and gas was discovered in the early 1900s, the prospectivity of the Haynesville was not widely recognized until 2005. During this time, Encana and other operators acquired significant acreage in North Louisiana to extend the East Texas Bossier play. Encana drilled and tested Haynesville discovery wells during 2005 and 2006 and subsequently entered into a joint venture with Shell for the development of this acreage position. During this time, certain members of our management team were part of, and integral to, the Encana team. We purchased Shell’s interest in this acreage during 2014 and GEP purchased the Encana portion during 2015.
In 2010, at the height of its activity, over 200 rigs were active in the Haynesville as producers drilled wells to preserve leasehold positions, creating significant oilfield services and midstream infrastructure that remains today to accommodate the current development activity and contribute to the low basis differentials in the basin. Furthermore, the basin is well positioned to capitalize on LNG demand, growing population centers in the southern United States, expanding petrochemical capacity in the Gulf Coast region, and the retirement of selected coal-fired electricity plants.
Since peak activity in 2010, our industry has made significant advances in drilling and completion technology and techniques, including long lateral development, geo-steering techniques and changes in completion intensity and design. These trends have resulted in increased EURs per lateral foot, a trend which continues with our most recent well design. We believe our EURs per lateral foot and the resulting Breakeven PV-10 levels compare favorably with the most prolific basins in North America. At the same time, our average drilling and completion times and well costs have decreased, which have yielded enhanced economics for development of our reserves.
In January 2011, Louisiana began allowing cross-unit horizontal drilling. Prior to this rule change, lateral lengths could not exceed 5,000 feet in length. With this change in regulation, operators can now develop wells that cross section lines and more efficiently develop the acreage using long laterals. We believe our large and relatively contiguous position combined with a streamlined regulatory approval process provides us with an opportunity to capitalize on a development plan that features multi-section lateral lengths.
We believe that we have been instrumental in the revitalization of the Haynesville since entering the basin in 2014 through the purchase of Shell’s interest. Since we began our drilling program in 2015, we have participated in over 280 wells, and been at the forefront of advancements in drilling and completion optimization techniques such as increasing lateral lengths, proppant concentration, water intensity, cluster spacing and reservoir pressure drawn-down management. Enverus projects that the current number of rigs running in the Haynesville will increase from the current figure of approximately 43 rigs up to 50 rigs over the next 12 to 18 months, which compares to 2020 average rigs of 37.
6
Table of Contents
Business Strategy
Our strategy is to draw upon our management team’s experience in developing natural gas resources to generate levered free cash flow while achieving modest growth in our production and reserves and thus enhance our value. Our strategy has the following principal elements:
| • | Optimize Return-On-Capital Through Focus on Profitably Increasing Well Recoveries While Minimizing Costs. Since 2017, we have drilled, on average, longer-lateral wells and further optimized our completion design, resulting in increased EURs compared to our prior drilling programs. From our initial Vintage 1 wells drilled in 2015 to our Vintage 5 wells in 2019 and 2020, EURs have increased from 1.4 Bcf per 1,000 lateral feet to 2.1 Bcf per 1,000 lateral feet. Simultaneous with recovery improvements, D&C costs per lateral foot have declined while lateral lengths have increased, indicating both capital efficiency gains and improvements in per Mcf economics. Our capital program in 2018 was concentrated on the evaluation of well density and key elements of our completion design, and, based on successful tests, our 2019 and 2020 capital program focused on longer lateral development, completion optimization and cycle time improvements. We focus on developing the maximum recovery of gas and economic value for every section we operate by adjusting the number of wells per section as market conditions change. We look for opportunities to reduce capital costs based on market conditions and we are focused on locking in reduced costs as a result of recent industry-wide decreases in demand for oilfield services. Additionally, we continue to rely on strategic alliances with third parties to reduce lease operating expenses for items such as chemicals and self-source higher cost services like water disposal to lower our overall operating costs. |
| • | Generate Levered Free Cash Flow While Delivering Modest Production Growth. We maintain a disciplined, cash flow-focused approach to capital allocation. Based on our year-end 2020 reserves, we had a drilling inventory of approximately 900 drilling locations among Vine, Brix and Harvest, or approximately 25 years of development opportunities utilizing an average of 4 gross rigs, which we believe would be sufficient to maintain production. Our remaining drilling inventory has an average payback period of approximately 14 and 24 months at an assumed NYMEX gas price of $2.75 and $2.25 per MMBtu, respectively. The concentration, delineation and scale of our core leasehold positions, coupled with our technical understanding of the reservoirs, allows us to efficiently develop our acreage to generate levered free cash flow, increase sectional recoveries over time and enhance the value of our resource base. We believe that our extensive inventory of low-risk drilling locations, combined with our operating expertise and completion design evolution, will enable us to continue to deliver significant levered free cash flow while modestly growing production and reserves. |
| • | Leverage our Deep Experience in the Haynesville to Develop Industry-Leading Business Practices and Technology. Eric D. Marsh, our President and Chief Executive Officer, and other key members of our management participated in the early development of the Haynesville. Through their experience, they developed expertise that allows for continued advancement of industry-leading well completion techniques and drilling and development efficiencies. We continue to develop and apply industry-leading practices to manage D&C costs and maximize the recovery factor of gas in place. We have also realized significant improvements in our development efficiency over time, including a reduction in drilling and completion days, which contribute to lower well costs. We employ enhanced completion techniques through increased fracture stages, optimized proppant loading and pumping intensity and reduced cluster spacing and drilling-related efficiencies through multi-well pads and longer laterals. These measures have allowed us to lower D&C costs per lateral foot while yielding increased EURs, thereby improving our capital efficiency and returns, while also reducing the number of short laterals and associated surface equipment required to develop our resource. |
| • | Maintain a Disciplined Financial Strategy. We intend to fund our operations predominantly with internally generated cash flows while maintaining ample liquidity to weather commodity cycles. We target spending approximately 65% to 75% of our operating cash flow on CapEx to maintain or modestly increase production, with the remaining amount being available, initially, for debt repayment. We seek to protect |
7
Table of Contents
| future cash flows and liquidity levels through a multi-year commodity hedge program and through physical firm sales agreements with multiple credit-worthy counterparties. We expect that our new credit agreement that we will enter into contemporaneously with the closing of this offering will give us significant flexibility to hedge a large percentage of our total expected production. To further reduce volatility in our cash flows and returns, we will also seek to enter into contracts for oilfield services that are no longer than the periods covered by our commodity hedges. In addition, pro forma for this offering, we anticipate that our total net debt to Adjusted EBITDAX ratio for the year-ended December 31, 2020 will be approximately 2.0x, which is among the lowest for publicly traded gas-focused upstream companies. We intend to target modest financial leverage of total net debt to Adjusted EBITDAX of 1.0x to 1.5x and use levered free cash flow to further reduce outstanding debt. While we will prioritize debt paydown as the primary use of levered free cash flow until our targeted leverage ratios are met, we may evaluate potential acquisition opportunities that are highly strategic to us, but we will pursue them only to the extent they are accretive and meet our financial strategy and operational objectives. Adjusted EBITDAX is not a financial measure calculated in accordance with GAAP. We believe that Adjusted EBITDAX provides important information regarding our operating results. “—Non-GAAP Financial Measures” contains a description of this measure and a reconciliation to the most directly comparable GAAP measure. |
| • | Steward the Health and Safety of our Employees, our Community and the Environment. Since peaking in 2007 at 6,003 MMmt, the EIA reports that total domestic energy sector related CO2 emissions have declined by 14.5% (873 MMmt) by 2019 and they cite the increasing use of natural gas in power generation as a key driver of this trend. While we believe the lower carbon intensity of using natural gas as opposed to coal in electric power generation in and of itself contributes meaningfully to lower CO2 emissions, we further believe that the benefits of natural gas are enhanced by reducing production related CO2, methane and other emissions. To that end, minimizing production related emissions is a core competency of our business and we continually seek to identify, accurately measure and reduce emission related to our business. From 2017 to 2020, our CO2e per Bcf of production declined 35% from 686 mT CO2e/Bcf to 444 mT CO2e/Bcf while our methane intensity decreased 77% from 0.061% to 0.014% of production, below BP by comparison, an industry leader at 0.14% of production across its more diverse asset base. In addition, we emphasize rigorous health and safety protocols in all aspects of our business and have demonstrated strong safety performance. Our total recordable incident frequency rate averaged 0.31 from 2017 through 2020 and 0.09 for 2020, both of which are well below the American Exploration and Production Council 2019 average of 0.47 and the U.S. Bureau of Labor Statistics E&P Support Activities Benchmark of 0.60. |
Business Strengths
We have a number of strengths that we believe will help us successfully execute our business strategy and generate levered free cash flow, including:
| • | We Believe we are Among the Most Economic Natural Gas Producers in North America. We own leases across an extensive, largely contiguous and fully delineated acreage position spanning approximately 125,000 net surface acres and approximately 230,000 net effective acres centered in what we believe to be the core of the Haynesville and Mid-Bossier. Our highly concentrated acreage position promotes more efficient development through the drilling of longer laterals, the ability to utilize multi-zone bi-directional well pads and limited need for additional gathering expansion. Longer laterals are significantly more capital efficient with a 10,000 ft lateral having up to four times the PV-10 at a $2.75 NYMEX price per MMBtu, but less than two times the cost, when compared to our standard lateral. Research from Enverus projects that the average Haynesville Basin core well generates a 31% rate of return using a NYMEX gas price of $2.75 per MMBtu, which Enverus ranks as the highest among notable shale plays in North America. Moreover, based on the location of our acreage, which is in some of the most prospective parts of the Haynesville, we believe our weighted average rate of return based on internal cost assumptions for our remaining core drilling locations is 85% at a NYMEX gas price of $2.75 per MMBtu. Additionally, given the high initial |
8
Table of Contents
| productivity of our wells, we typically recover approximately 45% of a well’s EUR in the first 12 months of production. As of December 31, 2020, our drilling inventory consisted of approximately 900 drilling locations among Vine, Brix and Harvest in both the Haynesville and Mid-Bossier, which included approximately 450 drilling locations where we intend to utilize laterals 5,300 ft or greater. Utilizing an average of 4 gross rigs among Vine, Brix and Harvest, which we believe is sufficient to maintain production, we believe we have approximately 25 years of development opportunities. Our average production for the quarter ended December 31, 2020 was 944 MMcfd. We consider our drilling inventory to be low risk because it is located in areas where we (and other producers) have extensive drilling and production experience with production results exhibiting higher repeatability versus other natural gas plays. There have been over 700 gross horizontal wells drilled across our position, of which we participated in over 280 since 2015, providing us substantial well performance data. In addition to the over 700 wells drilled on our acreage, more than 1,000 wells have been drilled within one mile of our position, further supporting our economic expectations. |
| • | High-Margin, Low Operating Cost Structure that Generates Significant Levered Free Cash Flow. Our free cash flow is primarily attributable to our industry-leading operating margins and low operating costs. For the year-ended December 31, 2020 and pro forma for the reorganization transactions, we achieved a 72.2% operating margin, which we calculate by dividing our Adjusted EBITDAX by our revenues, which are inclusive of natural gas sales and realized gains and losses on commodity derivatives. In the year-ended December 31, 2020 and pro forma for the reorganization transactions, our lease operating expense of $0.20 per Mcf and our general and administrative expense of $0.05 per Mcf were among the lowest in our peer group. We have implemented several initiatives to enhance and manage our production in the region and reduce operating costs. In early 2015, we established a technologically advanced 24-hour automated command center from which we can remotely control most field-wide production operations from a single location, allowing us to remotely bring wells online and manage existing production. This level of automation reduces manpower needs and allows operators to focus on production efficiency, by, among other things, efficiently deploying labor through a centralized operating center. Moreover, we have significantly reduced our operating cost per unit by vertically integrating through the drilling and operation of our own produced water disposal wells. As we continue to bring new wells online, we expect our unit costs will continue to decline. We continue to increase margins through operational efficiencies, more effective gas treating solutions and improved maintenance programs. In drilling locations where our working interest exceeds 20%, we hold an approximate 83% working interest and operate over 90% of such wells. We believe this gives us a high degree of control over our development program, allowing us to be responsive to changes in the commodity price environment. Levered free cash flow is not a financial measure calculated in accordance with GAAP, but we believe it provides an important perspective regarding our operating cash flow. “–Non-GAAP Financial Measures” below contains a description of levered free cash flow and a reconciliation to net cash provided by operating activities. |
| • | Close Proximity to Premium Markets and Ample Available Midstream Infrastructure. Our acreage position is in close proximity to premium markets and LNG facilities along the Gulf Coast, which results in lower and less volatile basis differentials and higher netbacks compared to other plays, including gas plays such as the Marcellus, Utica and those in the Rockies. As a result of these attractive takeaway and sales dynamics, our basis differentials have remained tightly banded since our inception, ranging from $0.01 to $0.26 per MMBtu; over this same period, basis differentials in Appalachia and the Rockies have ranged from $0.27 to $1.54 and $0.12 to $0.96 per MMBtu, respectively. We believe this allows producers in our basin to benefit from better unit economics. Low-cost legacy gathering infrastructure is in place across our acreage to support our development program. Our gathering cost for the year-ended December 31, 2020 was $0.31 per Mcfe, which compares favorably to $1.20 per Mcfe reported by publicly traded Appalachian-focused natural gas producers for the comparable period. Further, we are not party to any transportation contracts or similar commitments and our small amount of minimum volume commitments in our gathering contracts are well covered by current production volumes. Because we only produce dry gas, we have |
9
Table of Contents
| minimal cost to treat our gas to meet pipeline specifications, which may give us an economic advantage over wet gas plays during periods of low pricing for NGLs, as is currently taking place. Additionally, we do not have any of the emissions related to wet gas separation, storage or transportation. |
| • | Well Capitalized Balance Sheet that Provides Flexibility to Execute our Business Plan. Pro forma for this offering, we anticipate total net debt to Adjusted EBITDAX for the year-ended December 31, 2020 of approximately 2.0x, which would be among the lowest for publicly traded gas-focused upstream companies. Contemporaneously with the closing of this offering, we expect to enter into a new reserve-based lending facility led by Citibank. This facility is expected to have a total facility size of $750 million, a borrowing base of $350 million and available capacity of $316 million (after giving effect to $25 million of letters of credit to be issued at closing) based on projected as adjusted borrowings of approximately $9 million pro forma for this offering, resulting in projected liquidity of approximately $350 million as of December 31, 2020. Finally, we maintain an active hedge program and as of December 31, 2020 have hedged an average of 819 Bbtud, 492 Bbtud and 186 Bbtud for 2021, 2022 and 2023, respectively, at weighted average swap prices of $2.56 per MMBtu, $2.55 per MMBtu and $2.49 per MMBtu, respectively. Moreover, our Second Lien Term Loan requires us to have 70% of our total expected production hedged 24 months forward. We believe our balance sheet and hedge program provide ample liquidity in the event of an adverse commodity price environment to enable us to continue to generate levered free cash flow. |
| • | High Caliber and Experienced Management and Technical Team. Our senior management team has substantial experience in the Haynesville, as well as other premier North American resource plays, and has collectively operated large development programs that helped commercialize the Haynesville, attained market-leading D&C costs, decreased operating costs and generated increased EURs. Additionally, we have assembled a strong technical supporting staff of petroleum engineers and geologists that have extensive Haynesville and Mid-Bossier experience. We believe our team’s expertise will continue to drive drilling, completion and operational improvements that result in improved recoveries and capital efficiency. Furthermore, our management team’s operational and financial discipline, as well as its extensive experience in leadership roles at public companies, gives us confidence in our ability to successfully manage a public company platform. |
| • | Leader in Environmental, Governance and Societal Responsibilities of the Natural Gas Production Sector. According to the EIA, since it began tracking CO2 emissions in 1990, the increased market share of natural gas in electrical power generation has been a leading driver in reducing energy sector CO2 emissions. Not only do we produce the fuel that is the cornerstone of this accomplishment, we invest significantly in the human capital, equipment and technology that allows us to produce natural gas safely, efficiently and with minimal related emissions. While emissions reductions is a focus for all of our employees, we have 5 employees specifically dedicated to environmental, health and safety matters, including emissions reductions. For example, our sustainability efforts include 100% green completions, 100% non-potable water usage, and 100% solar-generated wellsite electricity. Additionally, we have peer leading CO2 emissions at 2.6 mT per MBOE per well and methane intensity of only 0.014% of gas produced. Additionally, we and our employees make commitments of financial resources and time to assist underserved members in the communities where we operate and our employees live. Moreover, we value diversity in our work force, including our executive leadership team, which is relatively evenly split 60% / 40% between men and women. |
Recent Developments
The outbreak of COVID-19 has significantly decreased the demand for hydrocarbons, particularly oil. As a result of the COVID-19 pandemic or other adverse public health developments, including voluntary and mandatory quarantines, travel restrictions, and other restrictions, our operations, and those of our subcontractors and customers, have experienced, and are anticipated to continue to experience, delays or disruptions and temporary suspensions of operations.
10
Table of Contents
Reduction in oil and gas activity as a result of the COVID-19 pandemic has resulted in a decrease of associated gas production as fewer oil wells are drilled in the Permian Basin and other liquids-weighted basins, which has led to a contraction in domestic gas supply. Lower levels of supply have pushed current and forecasted gas prices higher, which has had a positive impact on our results of operations and cash flows. We expect that the reduction in drilling activity and rig counts may contribute to a shortage in the supply of natural gas in the future, which could result in higher gas prices. As a result, although gas prices were on average lower in 2020 than 2019, gas prices trended higher after the effects of the COVID-19 pandemic began to take hold and slow oil production towards the middle of 2020. As the factors described above reduced the supply of oil and gas, gas prices increased towards the end of 2020 as compared to the prices in the months prior to and during the beginning of the COVID-19 pandemic. For reference, the Henry Hub spot price for natural gas averaged $2.22 per MMBtu from August 2019 to March 2020, $1.72 per MMBtu from April 2020 to June 2020, $2.32 per MMBtu for the remaining six months of 2020 exiting the year at $2.90 per MMBtu in December 2020 and $2.69 per MMBtu from January 2021 to March 2021. However, because of our obligation to hedge 70% of our production for the next 24 months, we will be limited in the benefit we would otherwise realize from any such price increases. To the extent, however, that natural gas prices decrease, these lower prices not only reduce our revenue and cash flows, but also may limit the amount of natural gas that we can develop economically and therefore potentially lower our proved reserves. Lower commodity prices in the future could also result in impairments of our natural gas properties. The occurrence of any of the foregoing could materially and adversely affect our future business, financial condition, results of operations, operating cash flows, liquidity or ability to fund planned CapEx. Alternatively, natural gas prices may increase, which while increasing revenue and cash flows, would result in significant losses being incurred on our derivatives.
We are taking precautions as an organization to protect our employees and community during this time. Vine has undertaken a number of proactive measures to reduce the spread of the virus and maintain the safety and health of its workforce, including, among other things, implementing comprehensive screening at operational bases throughout the organization.
Concurrently, deterioration of production agreements between key global oil producers has led to an increase in supply. In addition to the effects of the COVID-19 pandemic, the confluence of these factors has caused significant volatility in oil and gas prices. In response, many producers in North America have significantly reduced drilling activity. The land rig count in North America fell from 771 in mid-March of 2020 to 244 in mid-August of 2020 and has recovered slightly to 373 by January of 2021.
The reduction in activity has resulted in a decrease of associated gas production as fewer oil wells are drilled in the Permian Basin and other liquids-weighted basins, which has led to a contraction in domestic gas supply. Lower levels of supply have pushed current and forecasted gas prices higher. We expect that the reduction in drilling activity and rig counts may contribute to a shortage in the supply of natural gas in the future, which could result in higher gas prices.
The significant reduction in drilling and completion activity has also reduced demand for oilfield services and providers of these services have reduced their pricing as a result. Coupled with the improvement in drilling and completion cycle times achieved by our operational staff of approximately 14-19% in 2020, we have seen our well costs fall approximately 20% from an average of $1,521 per lateral foot in the first half of 2019 to $1,241 per lateral foot for the second half of 2020, as illustrated in the table below. We expect, given the trajectory of demand reduction for oilfield services, along with our continued realization of operational efficiencies, that D&C costs will continue to decrease. In addition, we have undertaken several initiatives to
11
Table of Contents
optimize our operating cost structure in order to be well positioned to operate through periods of market and commodity price volatility. These actions include entering into term contracts with key vendors at attractive rates and continued operational efficiencies.
Recent Debt Transactions
On December 30, 2020, we entered into the Second Lien Term Loan and used the proceeds, along with cash on hand, to repay the aggregate principal amount of loans outstanding under the Superpriority Facility in connection with the entry into the amendment to and extension of the RBL. The Second Lien Term Loan has a total facility size of $150 million and was fully drawn at closing.
The maturity of the RBL was extended to January 15, 2023 and availability under the facility was reduced from $350 million to $300 million and will reduce further on a quarterly basis to $100 million at December 31, 2022. Other than these quarterly reductions in availability, there are no borrowing base redeterminations. The pricing grid was increased by 1.00% to LIBOR + 2.50% to 3.50% based on utilization. We intend to use the net proceeds from this offering and borrowings under the New RBL to repay in full and terminate each of the RBL and the Brix Credit Facility.
The Second Lien Term Loan bears interest at a rate equal to LIBOR, with a floor of 0.75%, plus 8.75% per annum, payable monthly, and matures on the earlier to occur of (a) December 30, 2025 and (b) 90 days prior to the maturity of the 9.75% Notes or 8.75% Notes, to the extent specified amounts of such indebtedness remain outstanding. The Second Lien Term Loan is redeemable beginning June 30, 2022 at 102% of par value, stepping down to 101% of par value on June 30, 2023 and at par value on June 30, 2024 and thereafter.
The Second Lien Term Loan is secured on a junior lien basis by all of our assets and stock and the subsidiaries that secure the RBL.
The Second Lien Term Loan provides for a quarterly Consolidated Total Net Leverage Ratio financial maintenance covenant of 4.00x, stepping down to 3.50x with the quarter ended June 30, 2021 and thereafter, similar to the RBL. The Second Lien Term Loan also contains customary incurrence-based covenants for issuances of this type, including restrictions on the incurrence of liens, indebtedness, asset dispositions, fundamental changes, transactions with affiliates, restricted payments and other customary covenants, along with the requirement to maintain liquidity of no less than $40 million, tested quarterly.
In December 2019, we entered into the Third Lien Credit Agreement with Blackstone Holdings Finance Co LLC, as administrative agent and collateral agent and certain other banks, financial institutions and other lending institutions from time to time party thereto. At that time, the Third Lien Credit Agreement was secured on a second lien basis, but was subordinated to a third lien in December 2020 in connection with the entry into the Second Lien Credit Agreement. The Third Lien Credit Agreement provides for a revolving credit facility in an amount up to $330 million, and bears interest at a rate of LIBOR plus 9.75% per annum. In addition, a commitment fee of 0.424% per annum is charged on the unutilized balance of the committed borrowing base and is included in interest expense. The Third Lien Credit Agreement matures on March 15, 2023. We expect to terminate our Third Lien Credit Facility in connection with this offering.
12
Table of Contents
New RBL
Contemporaneously with the closing of this offering, we expect to enter into a new reserve-based lending facility (the “New RBL”) led by Citibank. This facility is expected to have a total facility size of $750 million, a borrowing base of $350 million and available capacity of $316 million (after giving effect to $25 million of letters of credit to be issued at closing) based on projected as adjusted borrowings of approximately $9 million pro forma for this offering, resulting in projected liquidity of approximately $350 million as of December 31, 2020. The New RBL will contain various conditions precedent, including the requirement to terminate the Third Lien Credit Agreement.
The New RBL will bear interest at a rate equal to LIBOR plus an additional margin, based on the percentage of the revolving commitment being utilized, ranging from 3.00% to 4.00%, with a LIBOR ‘floor’ of 0.50%. The New RBL matures on the earlier to occur of (a) 45 months after the closing of this offering, (b) 91 days prior to the maturity of the Second Lien Term Loan, to the extent any of such indebtedness remains outstanding, and (c) 91 days prior to the maturity of the 9.75% Notes or 8.75% Notes, to the extent specified amounts of such indebtedness remain outstanding. There will also be a commitment fee of 0.50% on the undrawn borrowing base amounts. The New RBL will be secured on a senior basis by substantially all of our assets and stock and guaranteed by the subsidiaries that secure and guarantee the Second Lien Term Loan.
The New RBL will provide for a quarterly Consolidated Total Net Leverage Ratio financial maintenance covenant of 3.25x beginning with the quarter ended June 30, 2021, a quarterly Current Ratio maintenance covenant of 1.00x beginning with the quarter ended June 30, 2021 and a $100 million weekly minimum liquidity covenant that is applicable starting 180 days prior to the maturity of the indebtedness under the Second Lien Term Loan, the 9.75% Notes or the 8.75% Notes, to the extent any of such indebtedness is outstanding. The New RBL will also contain customary incurrence-based covenants for facilities of this type, including restrictions on the incurrence of liens, indebtedness, asset dispositions, fundamental changes, transactions with affiliates, restricted payments and other customary covenants.
The credit agreement governing the New RBL will also contain customary events of default, including non-payment, breach of covenants, materially incorrect representations, cross-default, bankruptcy and change of control.
2021 CapEx and Financing Activities
We expect our 2021 capital program to be approximately $340 to $350 million of which $310 to $320 million is allocated for D&C operations. The remaining $30 million of our capital program is designated for non-D&C items. We plan to fund our 2021 CapEx through cash flow from operations, proceeds from this offering and borrowings under our New RBL. Further, we intend to monitor conditions in the debt capital markets and may determine to issue long-term debt securities, including potentially in the near term, to fund a portion of our 2021 CapEx or refinance a portion of our existing indebtedness. We cannot predict with certainty the timing, amount and terms of any future issuances of any such debt securities.
Corporate Reorganization
Vine Energy is a Delaware corporation that was formed for the purpose of making this offering. Following this offering and the transactions related thereto, Vine Energy will be a holding company whose sole material asset will consist of membership interests in Vine Holdings. Vine Holdings will own all of the outstanding limited partnership interests in each of Vine Oil & Gas, Brix and Harvest, the operating subsidiaries through which we operate our assets, and all of the outstanding equity in each of Vine Oil & Gas GP, Brix GP and Harvest GP, the general partners of Vine Oil & Gas, Brix and Harvest, respectively. After the consummation of the transactions contemplated by this prospectus, Vine Energy will be the managing member of Vine Holdings
13
Table of Contents
and will control and be responsible for all operational, management and administrative decisions relating to Vine Holdings’ business and will consolidate the financial results of Vine Holdings and its subsidiaries.
In connection with this offering, (a) the Existing Owners who directly hold equity interests in Vine Oil & Gas, Vine Oil & Gas GP, Brix, Brix GP, Harvest and Harvest GP will contribute all of such equity interests to Vine Holdings in exchange for newly issued equity in Vine Holdings (the “LLC Interests”), (b) certain of the Existing Owners will contribute a portion of their LLC Interests directly or indirectly, by contribution of Blocker Entities holding LLC Interests, to Vine Energy in exchange for newly issued Class A common stock and will contribute such Class A common stock received to Vine Investment II, Brix Investment II, Harvest Investment II, Vine Investment, Brix Investment or Harvest Investment, as applicable, (c) certain of the Existing Owners will exchange the remaining portion of their LLC Interests for newly issued Vine Units and subscribe for newly issued Class B common stock of Vine Energy with no economic rights or value and will contribute such Vine Units and Class B common stock to Vine Investment, Brix Investment and Harvest Investment, as applicable, and (d) Vine Energy will contribute the net proceeds of this offering to Vine Holdings in exchange for newly issued Vine Units and a managing member interest in Vine Holdings. After giving effect to these transactions and the offering contemplated by this prospectus, (i) Vine Energy will own an approximate 50.5% interest in Vine Holdings (or 52.4% if the underwriters’ option to purchase additional shares is exercised in full), (ii) Vine Investment will own an approximate 25.2% interest in Vine Holdings and 0.1% interest in Vine Energy (or 24.2% and 0.1% if the underwriters’ option to purchase additional shares is exercised in full), (iii) Brix Investment will own an approximate 24.0% interest in Vine Holdings and 0.1% interest in Vine Energy (or 23.1% and 0.1% if the underwriters’ option to purchase additional shares is exercised in full), (iv) Harvest Investment will own an approximate 0.3% interest in Vine Holdings and less than 0.1% interest in Vine Energy (or 0.3% and less than 0.1% if the underwriters’ option to purchase additional shares is exercised in full), (v) Vine Investment II will own an approximate 13.7% interest in Vine Energy (or 13.1% if the underwriters’ option to purchase additional shares is exercised in full), (vi) Brix Investment II will own an approximate 9.4% interest in Vine Energy (or 9.1% if the underwriters’ option to purchase additional shares is exercised in full), and (vii) Harvest Investment II will own an approximate 0.2% interest in Vine Energy (or 0.2% if the underwriters’ option to purchase additional shares is exercised in full).
Each share of Class B common stock will entitle its holder to one vote on all matters to be voted on by shareholders. Holders of Class A common stock and Class B common stock will vote together as a single class on all matters presented to our shareholders for their vote or approval, except as otherwise required by applicable law or by our certificate of incorporation. We do not intend to list Class B common stock on any stock exchange.
We will enter into a Tax Receivable Agreement with Vine Investment, Brix Investment, Harvest Investment, Vine Investment II, Brix Investment II and Harvest Investment II. This agreement generally provides for the payment by Vine Energy to Vine Investment, Brix Investment, Harvest Investment, Vine Investment II, Brix Investment II and Harvest Investment II, respectively, of 85% of the net cash savings, if any, in U.S. federal, state and local income tax that Vine Energy (a) actually realizes with respect to taxable periods ending after December 31, 2025 or (b) is deemed to realize in the event of a change of control (as defined under the Tax Receivable Agreement, which includes certain mergers, asset sales and other forms of business combinations and certain changes to the composition of the Vine Energy board) or the Tax Receivable Agreement terminates early (at our election or as a result of our breach) with respect to any taxable periods ending on or after such change of control or early termination event, in each case, as a result of (i) the tax basis increases resulting from the exchange of Vine Units and the corresponding surrender of an equivalent number of shares of Class B common stock by Vine Investment, Brix Investment and Harvest Investment, respectively, for a number of shares of Class A common stock on a one-for-one basis or, at our option, the receipt of an equivalent amount of cash pursuant to the exchange agreement, (ii) certain existing net operating loss carryforwards, disallowed interest expense carryforwards under Section 163(j) of the Code, and tax credit carryforwards attributable to the Blocker Entities previously owned by certain of the Existing Owners, and (iii) imputed interest deemed to be paid by us as a result
14
Table of Contents
of, and additional tax basis arising from, any payments we make under the Tax Receivable Agreement. Vine Energy will retain the benefit of the remaining 15% of these cash savings, if any. If we experience a change of control or the Tax Receivable Agreement terminates early, we could be required to make a substantial, immediate lump-sum payment. Assuming no material changes in the relevant tax law, we expect that if we experienced a change of control or the Tax Receivable Agreement were terminated immediately after this offering, the estimated lump-sum payment would be approximately $211 million (calculated using a discount rate equal to a per annum rate of LIBOR plus 100 basis points, applied against an undiscounted liability of approximately $244 million). “Certain Relationships and Related Party Transactions—Tax Receivable Agreement” contains more information.
The following diagrams indicate our simplified current ownership structure and our simplified ownership structure immediately following this offering and the transactions related thereto (assuming that the underwriters’ option to purchase additional shares is not exercised):
Simplified Current Ownership Structure
| (1) | Blackstone owns 99.3% of Vine Oil & Gas GP, 97.0% of Brix GP and 94.2% of Harvest GP. Blackstone holds its ownership in Vine Oil & Gas through funds separate from the funds in which it holds its ownership in Brix and Harvest, which are not consolidated by a common parent. Therefore, Vine Oil & Gas is not considered under common control with Brix GP and Harvest GP for financial reporting purposes. |
| (2) | Certain Management Members own 0.7% of Vine Oil & Gas GP, 3.0% of Brix GP and 5.8% of Harvest GP. |
15
Table of Contents
Simplified Ownership Structure After Giving Effect to this Offering
| (1) | Includes Vine Investment, Brix Investment and Harvest Investment. |
| (2) | Includes Vine Investment II, Brix Investment II and Harvest Investment II. |
| (3) | Vine Holdings owns 100% of Brix GP, Harvest GP and Vine Oil & Gas GP. Brix GP is the general partner of Brix, Harvest GP is the general partner of Harvest and Vine Oil & Gas GP is the general partner of Vine Oil & Gas. |
Our Principal Stockholders
Following the completion of this offering and our corporate reorganization, Blackstone and Management Members will in the aggregate own 0.3% of our Class A common stock and 100% of our Class B common stock through the Vine Energy Investment Vehicles, representing approximately 49.7% of the voting power of Vine Energy (47.7% if the underwriters’ option to purchase additional shares is exercised in full), and 46.1% of our Class A common stock through the Vine Energy Investment II Vehicles, representing 23.3% of the voting power
16
Table of Contents
of Vine Energy (22.4% if the underwriters’ option to purchase additional shares is exercised in full). The Vine Energy Investment Vehicles and the Vine Energy Investment II Vehicles are controlled by Blackstone, our private equity sponsor.
Blackstone is one of the world’s leading investment firms. Blackstone seeks to create positive economic impact and long-term value for its investors, the companies it invests in, and the communities in which it works. Blackstone does this by using extraordinary people and flexible capital to help companies solve problems.
Blackstone’s asset management businesses, with $619 billion in assets under management, include investment vehicles focused on private equity, real estate, public debt and equity, non-investment grade credit, real assets and secondary funds, all on a global basis.
Blackstone Energy Partners is Blackstone’s energy-focused private equity business, with a successful record built on our industry expertise and partnerships with exceptional management teams. Blackstone private equity has invested more than $18 billion of equity globally across a broad range of sectors within the energy industry.
Emerging Growth Company Status
We are an “emerging growth company” as defined in the JOBS Act. For as long as we are an emerging growth company, unlike other public companies that do not meet those qualifications, we are not required to:
| • | provide an auditor’s attestation report on management’s assessment of the effectiveness of our system of internal control over financial reporting pursuant to Section 404(b) of SOX; |
| • | provide more than two years of audited financial statements and related management’s discussion and analysis of financial condition and results of operations in a registration statement on Form S-1; |
| • | comply with any new requirements adopted by PCAOB requiring mandatory audit firm rotation or a supplement to the auditor’s report in which the auditor would be required to provide additional information about the audit and the financial statements of the issuer; |
| • | provide certain disclosure regarding executive compensation required of larger public companies or hold shareholder advisory votes on executive compensation required by the Dodd-Frank Act; or |
| • | obtain shareholder approval of any golden parachute payments not previously approved. |
We will cease to be an “emerging growth company” upon the earliest of:
| • | the last day of the year in which we have $1.07 billion or more in annual revenue; |
| • | the date on which we become a “large accelerated filer” (which means the year-end at which the total market value of our common equity securities held by non-affiliates is $700 million or more as of June 30); |
| • | the date on which we issue more than $1 billion of non-convertible debt securities over a three-year period; and |
| • | the last day of the year following the fifth anniversary of our initial public offering. |
In addition, Section 107 of the JOBS Act provides that an emerging growth company can take advantage of the extended transition period provided in Section 7(a)(2)(B) of the Securities Act of 1933, as amended (the “Securities Act”), for complying with new or revised accounting standards. We have elected to take advantage of this extended transition period, which means that the financial statements included in this prospectus, as well as any financial statements that we file or furnish in the future, will not be subject to all new or revised accounting standards generally applicable to public companies for the transition period for so long as we remain an emerging growth company.
17
Table of Contents
Corporate Information
Our principal executive offices are located at 5800 Granite Parkway, Suite 550, Plano, Texas 75024, and our telephone number at that address is (469) 606-0540. Our website is located at www.vineog.com. We expect to make our periodic reports and other information filed with or furnished to the SEC available free of charge through our website as soon as reasonably practicable after those reports and other information are electronically filed with or furnished to the SEC. Information on, or otherwise accessible through, our website or any other website is not incorporated by reference herein and does not constitute a part of this prospectus.
18
Table of Contents
The Offering
| Class A common stock offered by us |
18,750,000 shares (or 21,562,500 shares, if the underwriters exercise in full their option to purchase additional shares). |
| Class A common stock to be outstanding after the offering |
34,995,149 shares (or 37,807,649 shares, if the underwriters exercise in full their option to purchase additional shares). |
| Option to purchase additional shares |
We have granted the underwriters a 30 day option to purchase up to an aggregate of 2,812,500 additional shares of our Class A common stock. |
| Class B common stock to be outstanding immediately after completion of this offering |
34,289,108 shares, or one share for each Vine Unit held by the Vine Unit Holders immediately following this offering. Class B shares are non-economic. When a Vine Unit is exchanged for a share of Class A common stock, a corresponding share of Class B common stock will be surrendered. |
| Use of proceeds |
We expect to receive approximately $303.3 million of net proceeds (assuming the midpoint of the price range set forth on the cover of this prospectus) from the sale of the Class A common stock offered by us (or approximately $349.5 million, if the underwriters exercise in full their option to purchase additional shares) after deducting underwriting discounts and commissions and estimated offering expenses payable by us. Each $1.00 change in the public offering price would change our net proceeds by approximately $17.6 million. |
| We intend to use the net proceeds from this offering and borrowings under our New RBL to repay in full and terminate each of the RBL and the Brix Credit Facility. “Use of Proceeds” contains additional information regarding our intended use of proceeds from this offering. |
| Conflicts of Interest |
Each of Credit Suisse Securities (USA) LLC and Morgan Stanley & Co. LLC is a lender under the RBL and, as such, is expected to receive in excess of 5% of the offering proceeds. Furthermore, affiliates of Blackstone Securities Partners L.P. will own in excess of 10% of our issued and outstanding Class A common stock. Because each of Credit Suisse Securities (USA) LLC, Morgan Stanley & Co. LLC and Blackstone Securities Partners L.P. is an underwriter in this offering, it is deemed to have a “conflict of interest” under Rule 5121 (“Rule 5121”) of the Financial Industry Regulatory Authority, Inc. (“FINRA”). Accordingly, this offering is being made in compliance with the requirements of Rule 5121. Due to certain of these conflicts of interest, Rule 5121 requires, among other things, that a “qualified independent underwriter” participate in the preparation of, and exercise the usual standards of “due diligence” with respect to, the registration statement and this prospectus. Citigroup Global Markets Inc. has agreed to act as a qualified independent underwriter for this offering. Citigroup Global Markets Inc. will not receive any |
19
Table of Contents
| additional fees for serving as a qualified independent underwriter in connection with this offering. We have agreed to indemnify Citigroup Global Markets Inc. against liabilities incurred in connection with acting as a qualified independent underwriter, including liabilities under the Securities Act. |
| Voting Power of Class A common stock after giving effect to this offering |
50.5% or (or 100% if all outstanding Vine Units held by the Vine Unit Holders are exchanged, along with a corresponding number of shares of our Class B common stock, for newly issued shares of Class A common stock on a one-for-one basis). |
| Voting Power of Class B common stock after giving effect to this offering |
49.5% or (or 0% if all outstanding Vine Units held by the Vine Unit Holders are exchanged, along with a corresponding number of shares of our Class B common stock, for newly issued shares of Class A common stock on a one-for-one basis). |
| Voting rights |
The Vine Energy Investment Vehicles, which will be owned by the Existing Owners, will hold all of the outstanding shares of our Class B common stock. Each share of Class B common stock will entitle its holder to one vote on all matters to be voted on by shareholders generally. After giving effect to the shares issued pursuant to this offering, Vine Energy Investment II Vehicles, which will be owned by the Existing Owners, will hold 46.1% (or 42.7% if the underwriters’ option is exercised in full) of the outstanding shares of our Class A common stock. The Class A common stock will be voting stock and entitle each holder to one vote per share of Class A common stock. “Description of Capital Stock” contains more information. |
| Dividend policy |
We currently do not pay a cash dividend to holders of our Class A common stock and certain of our debt agreements place certain restrictions on our ability to pay cash dividends on our Class A common stock. “Dividend Policy” includes additional information. However to the extent our free cash flow generation results in a decrease in our overall leverage in the future, we may revisit our dividend policy and declare cash dividends on our Class A common stock. |
| Listing and trading symbol |
We intend to list our Class A common stock on the New York Stock Exchange (the “NYSE”) under the symbol “VEI.” |
| Exchange rights of Vine Unit Holders |
In connection with the completion of this offering, we will enter into an exchange agreement with the entities that comprise the Vine Energy Investment Vehicles and Vine Holdings so that the Vine Energy Investment Vehicles may (subject to the terms of the exchange agreement) exchange their Vine Units, along with surrendering a corresponding number of shares of our Class B common stock, for shares of Class A common stock of Vine Energy on a one-for-one basis, subject to customary conversion rate adjustments for stock splits, stock dividends and reclassifications, or, |
20
Table of Contents
| at our option, an equivalent amount of cash (the “Exchange Right”). “Certain Relationships and Related Party Transactions—Exchange Agreement” contains more information. |
| Tax receivable agreement |
Future exchanges of Vine Units for shares of Class A common stock are expected to result in increases in the tax basis of the tangible and intangible assets of Vine Holdings. The anticipated basis adjustments are expected to increase (for tax purposes) our depreciation, depletion and amortization deductions and may also decrease our gains (or increase our losses) on future dispositions of certain capital assets to the extent tax basis is allocated to those capital assets. In addition, we have acquired certain tax attributes attributable to the Blocker Entities previously owned by certain of the Existing Owners. Such increased deductions and losses and reduced gains, as well as such tax attributes, may reduce the amount of tax that we would otherwise be required to pay in the future. Prior to the completion of this offering, we will enter into a Tax Receivable Agreement with Vine Investment, Brix Investment, Harvest Investment, Vine Investment II, Brix Investment II and Harvest Investment II. This agreement generally provides for the payment by Vine Energy to Vine Investment, Brix Investment, Harvest Investment, Vine Investment II, Brix Investment II and Harvest Investment II, respectively, of 85% of the net cash savings, if any, in U.S. federal, state and local income tax that Vine Energy (a) actually realizes with respect to taxable periods ending after December 31, 2025 or (b) is deemed to realize in the event of a change of control (as defined under the Tax Receivable Agreement, which includes certain mergers, asset sales and other forms of business combinations and certain changes to the composition of the Vine Energy board) or the Tax Receivable Agreement terminates early (at our election or as a result of our breach) with respect to any taxable periods ending on or after such change of control or early termination event, in each case, as a result of (i) the tax basis increases resulting from the exchange of Vine Units and the corresponding surrender of an equivalent number of shares of Class B common stock by Vine Investment, Brix Investment and Harvest Investment, respectively, for a number of shares of Class A common stock on a one-for-one basis or, at our option, the receipt of an equivalent amount of cash pursuant to the exchange agreement, (ii) certain existing net operating loss carryforwards, disallowed interest expense carryforwards under Section 163(j) of the Code, and tax credit carryforwards attributable to the Blocker Entities previously owned by certain of the Existing Owners, and (iii) imputed interest deemed to be paid by us as a result of, and additional tax basis arising from, any payments we make under the Tax Receivable Agreement. Vine Energy will retain the benefit of the remaining 15% of these cash savings, if any. If we experience a change of control or the Tax Receivable Agreement terminates early, we could be required to make a substantial, immediate lump-sum payment. “Certain Relationships and Related Party Transactions—Tax Receivable Agreement” contains more information. |
21
Table of Contents
The information above excludes 5,462,740 shares of Class A common stock reserved for issuance under our long-term incentive plan that we intend to adopt in connection with the completion of this offering.
Summary of Risk Factors
An investment in our securities involves a high degree of risk. The occurrence of one or more of the events or circumstances described in the section titled “Risk Factors,” alone or in combination with other events or circumstances, may materially adversely affect our business, financial condition and operating results. In that event, the trading price of our securities could decline, and you could lose all or part of your investment. Such risks include, but are not limited to:
| • | Natural gas prices are volatile. A reduction or sustained decline in prices may adversely affect our business, financial condition or results of operations and our ability to meet our financial commitments. |
| • | Past performance by our management team or their respective affiliates may not be indicative of future performance of an investment in us. |
| • | The widespread outbreak of an illness, pandemic or any other public health crisis may have material adverse effects on our business, financial position, results of operations and/or cash flows. |
| • | Our business strategy includes continued use of advancements in horizontal D&C techniques, which involve risks and uncertainties in their application. |
| • | Our revenue will ultimately depend on our ability to transport our gas to various sales points. |
| • | We may be unable to generate sufficient cash to service all of our indebtedness and financial commitments. |
| • | Reserve estimates depend on many assumptions that may turn out to be inaccurate. |
| • | Our drilling locations are scheduled out over many years, making them susceptible to uncertainties regarding the timing or likelihood of their development. In addition, we may lack sufficient capital necessary to develop our drilling locations. |
| • | Our operations are subject to stringent environmental laws and regulations that may expose us to significant costs and liabilities that could exceed current expectations. |
| • | Federal and state legislative and regulatory initiatives regarding hydraulic fracturing and related activities, as well as governmental reviews of such activities, could increase our costs of doing business, result in additional operating restrictions or delays, limit the areas in which we can operate and reduce our natural gas production, which could adversely impact our production and business. |
| • | We may incur substantial losses and be subject to substantial liability claims as a result of our operations. Additionally, we may not be insured for, or our insurance may be inadequate to protect us against, these risks. |
| • | Competition in the natural gas industry is intense, making it more difficult for us to acquire properties, market natural gas and secure trained personnel. |
| • | Our hedging activities could result in financial losses or reduce our income. |
| • | We are a holding company. Our sole material asset after completion of this offering will be our equity interest in Vine Holdings and we are accordingly dependent upon distributions from Vine Holdings to pay taxes, make payments under the Tax Receivable Agreement and cover our corporate and other overhead expenses. |
| • | We will be required to make payments under the Tax Receivable Agreement for certain tax benefits we may claim, and the amounts of such payments could be significant. |
22
Table of Contents
| • | If Vine Holdings were to become a publicly traded partnership taxable as a corporation for U.S. federal income tax purposes, we and Vine Holdings might be subject to potentially significant tax inefficiencies, and we would not be able to recover payments previously made by us under the Tax Receivable Agreement even if the corresponding tax benefits were subsequently determined to have been unavailable due to such status. |
| • | In certain circumstances, Vine Holdings will be required to make tax distributions to us and the Vine Unit Holders, and the tax distributions that Vine Holdings will be required to make may be substantial. |
| • | The Vine Energy Investment Vehicles and the Vine Energy Investment II Vehicles will collectively hold a substantial majority of our common stock. |
| • | We expect to be a “controlled company” within the meaning of the NYSE rules and, as a result, will qualify for and could rely on exemptions from certain corporate governance requirements. |
23
Table of Contents
Summary Historical and Unaudited Pro Forma Condensed Combined Financial Information
The following table shows summary historical financial information of our accounting predecessor, Vine Oil & Gas, and summary unaudited pro forma condensed combined financial information for the periods and as of the dates indicated.
The summary historical financial information as of and for the years ended December 31, 2020 and 2019 was derived from the audited historical financial statements of our predecessor, Vine Oil & Gas, included elsewhere in this prospectus.
The summary unaudited pro forma condensed combined statements of operations data for the year ended December 31, 2020 been prepared to give pro forma effect to (i) the reorganization transactions described under “Corporate Reorganization,” including the business combination of Brix and Harvest with Vine Oil & Gas, and (ii) this offering and the application of the net proceeds from this offering, as if the reorganization and offering transactions had been completed on January 1, 2020. The summary unaudited pro forma condensed combined balance sheet as of December 31, 2020 has been prepared to give pro forma effect to these transactions as if they had been completed on December 31, 2020. This information is subject to and gives effect to the assumptions and adjustments described in the notes accompanying the unaudited pro forma condensed combined financial statements included elsewhere in this prospectus. The summary unaudited pro forma condensed combined financial information is presented for informational purposes only and should not be considered indicative of actual results of operations that would have been achieved had the reorganization and this offering been consummated on the dates indicated, and do not purport to be indicative of our financial position or results of operations as of any future date or for any future period.
24
Table of Contents
“Use of Proceeds,” “Management’s Discussion and Analysis of Financial Condition and Results of Operations,” “Corporate Reorganization,” “Unaudited Pro Forma Condensed Combined Financial Statements,” and the historical financial statements included elsewhere in this prospectus contain additional information to be read in conjunction with the following information.
| Vine Oil & Gas | Vine Pro Forma | |||||||||||
| As of and for the Year Ended December 31, |
As of and for the Year Ended December 31, 2020 |
|||||||||||
| 2020 | 2019 | |||||||||||
| (in thousands, except share and per share data) |
||||||||||||
| Statements of Operations Information: |
||||||||||||
| Revenue: |
||||||||||||
| Natural gas sales |
$ | 418,877 | $ | 445,589 | $ | 571,144 | ||||||
| Realized gain on commodity derivatives |
123,875 | 39,679 | 161,918 | |||||||||
| Unrealized gain (loss) on commodity derivatives |
(164,077 | ) | 101,239 | (204,552 | ) | |||||||
|
|
|
|
|
|
|
|||||||
| Total revenue |
378,675 | 586,507 | 528,510 | |||||||||
| Operating Expenses: |
||||||||||||
| Lease operating |
47,911 | 46,247 | 65,639 | |||||||||
| Gathering and treating |
76,770 | 37,955 | 101,974 | |||||||||
| Production and ad valorem taxes |
15,620 | 18,539 | 18,335 | |||||||||
| General and administrative |
7,448 | 7,842 | 15,014 | |||||||||
| Monitoring fee |
7,541 | 7,011 | — | |||||||||
| Depletion, depreciation and accretion |
347,652 | 327,659 | 392,141 | |||||||||
| Exploration |
167 | 886 | 193 | |||||||||
| Strategic |
2,182 | 853 | 2,284 | |||||||||
| Severance |
326 | — | 447 | |||||||||
| Write-off of deferred IPO expenses |
5,787 | 2,825 | 5,787 | |||||||||
|
|
|
|
|
|
|
|||||||
| Total operating expenses |
511,404 | 449,817 | 601,814 | |||||||||
|
|
|
|
|
|
|
|||||||
| Operating Income |
(132,729 | ) | 136,690 | (73,304 | ) | |||||||
| Interest expense |
(119,248 | ) | (112,198 | ) | (121,128 | ) | ||||||
|
|
|
|
|
|
|
|||||||
| Income Before Income Taxes |
(251,977 | ) | 24,492 | (194,432 | ) | |||||||
| Income tax provision |
(217 | ) | (496 | ) | (217 | ) | ||||||
|
|
|
|
|
|
|
|||||||
| Net Income |
$ | (252,194 | ) | $ | 23,996 | $ | (194,649 | ) | ||||
|
|
|
|
|
|
|
|||||||
| Net income attributable to non-controlling interests |
(96,333 | ) | ||||||||||
|
|
|
|||||||||||
| Net Income Attributable to Vine Energy Inc. |
$ | (98,316 | ) | |||||||||
|
|
|
|||||||||||
| Net Income per Share: |
||||||||||||
| Basic |
$ | (2.81 | ) | |||||||||
|
|
|
|||||||||||
| Diluted |
$ | (2.81 | ) | |||||||||
|
|
|
|||||||||||
| Weighted Average Shares Outstanding: |
||||||||||||
| Basic |
34,995,149 | |||||||||||
|
|
|
|||||||||||
| Diluted |
34,995,149 | |||||||||||
|
|
|
|||||||||||
| Balance Sheet Information: |
||||||||||||
| Cash and cash equivalents |
$ | 15,517 | $ | 18,286 | $ | 33,177 | ||||||
| Total natural gas properties, net |
1,342,354 | 1,435,976 | 1,873,982 | |||||||||
| Total assets |
1,467,763 | 1,658,100 | 2,036,019 | |||||||||
| Total debt |
1,224,741 | 1,218,558 | 1,050,235 | |||||||||
| Total equity(1) |
10,061 | 292,255 | 717,992 | |||||||||
| Statements of Cash Flows Information: |
||||||||||||
| Net cash provided by operating activities |
$ | 295,174 | $ | 270,699 | ||||||||
| Net cash used in investing activities |
(252,378 | ) | (281,193 | ) | ||||||||
| Net cash provided by (used in) financing activities |
(45,565 | ) | 7,750 | |||||||||
| Other Financial Information: |
||||||||||||
| Adjusted EBITDAX(2) |
$ | 384,713 | $ | 338,571 | $ | 529,351 | ||||||
| Levered free cash flow(2) |
$ | 42,796 | $ | (10,494 | ) | |||||||
| (1) | Pro forma total equity as of December 31, 2020 includes $354.5 million of non-controlling interests related to the Vine Energy Investment Vehicles. |
| (2) | Adjusted EBITDAX and levered free cash flow are not financial measures calculated in accordance with GAAP. We believe these measures provide important perspective regarding our operating results and liquidity, as applicable. “Prospectus Summary—Non-GAAP Financial Measures” contains a description of each of these measures and a reconciliation to the most directly comparable GAAP measure. |
25
Table of Contents
Non-GAAP Financial Measures
Adjusted EBITDAX
We define Adjusted EBITDAX as our net income before interest expense, income taxes, depreciation, depletion and accretion, unrealized gains and losses on commodity derivatives, exploration expense, strategic expense, and other non-cash operating items.
We believe Adjusted EBITDAX is a useful performance measure because it allows for an effective evaluation of our operating performance when compared against our peers, without regard to our financing methods, corporate form or capital structure. We exclude the items listed above in arriving at Adjusted EBITDAX to reflect the substantial variance in practice from company to company within our industry depending upon accounting methods and book values of assets, capital structures and the method by which the assets were acquired. Adjusted EBITDAX should not be considered as an alternative to, or more meaningful than, net income determined in accordance with GAAP. Certain items excluded from Adjusted EBITDAX are significant components in understanding and assessing a company’s financial performance, such as a company’s cost of capital and tax burden, as well as the historic costs of depreciable assets, none of which are reflected in Adjusted EBITDAX. Our presentation of Adjusted EBITDAX should not be construed as an inference that our results will be unaffected by unusual or non-recurring items. Our computations of Adjusted EBITDAX may not be identical to other similarly titled measures of other companies.
The following table presents a reconciliation of Adjusted EBITDAX to net income, our most directly comparable financial measure calculated and presented in accordance with GAAP.
Levered Free Cash Flow
We define levered free cash flow as the amount of money we have remaining after paying our financial obligations related to investing activities prior to considering any funds received from or paid for financing activities. We calculate levered free cash flow as operating cash flow less investing cash flow.
26
Table of Contents
We believe that levered free cash flow is a useful performance measure as it provides the amount of cash we generated after capital expenditures and any proceeds received from asset sales, prior to any proceeds received from or used in financing activities. While levered free cash flow is not a GAAP measure, it is derived from two GAAP measures, operating cash flow and investing cash flow but should not be considered as an alternative to, or more meaningful than, operating cash flow or investing cash flow determined in accordance with GAAP. Our computation of levered free cash flow may not be identical to other similarly titled measures of other companies.
| Vine Oil & Gas | Vine Pro Forma |
|||||||||||
| For the Year Ended December 31, |
For the Year Ended December 31, 2020 |
|||||||||||
| 2020 | 2019 | |||||||||||
| (in thousands) | ||||||||||||
| Net income |
$ | (252,194 | ) | $ | 23,996 | $ | (194,649 | ) | ||||
| Interest expense |
119,248 | 112,198 | 121,128 | |||||||||
| Income tax provision |
217 | 496 | 217 | |||||||||
| Depletion, depreciation and accretion |
347,652 | 327,659 | 392,141 | |||||||||
| Unrealized gain (loss) on commodity derivatives |
164,077 | (101,239 | ) | 204,552 | ||||||||
| Exploration |
167 | 886 | 193 | |||||||||
| Non-cash G&A |
(182 | ) | (18 | ) | (182 | ) | ||||||
| Strategic |
2,182 | 853 | 2,284 | |||||||||
| Non-cash write-off of deferred IPO expenses |
5,787 | 2,825 | 5,787 | |||||||||
| Severance |
326 | — | 447 | |||||||||
| Non-cash volumetric and production adjustment to gas gathering liability |
(2,567 | ) | (29,085 | ) | (2,567 | ) | ||||||
|
|
|
|
|
|
|
|||||||
| Adjusted EBITDAX |
$ | 384,713 | $ | 338,571 | $ | 529,351 | ||||||
|
|
|
|
|
|
|
|||||||
| Operating cash flow |
$ | 295,174 | $ | 270,699 | ||||||||
| Investing cash flow |
(252,378 | ) | (281,193 | ) | ||||||||
|
|
|
|
|
|||||||||
| Levered free cash flow |
$ | 42,796 | $ | (10,494 | ) | |||||||
|
|
|
|
|
|||||||||
27
Table of Contents
Summary Reserve, Production and Operating Data
Summary Reserve Data
The following tables summarize estimated proved reserves based on reports prepared by Von Gonten, our independent reserve engineer. All of these reserve estimates were prepared in accordance with the SEC’s rule regarding reserve reporting currently in effect, except that the table which provides our reserves at “strip pricing” uses pricing based on NYMEX futures prices. The information in the following tables does not give any effect to or reflect our commodity hedge portfolio. “Business—Our Operations—Reserve Data” contains additional information about our reserves.
Summary of Proved Reserves as of December 31, 2020 Based on SEC Pricing
The following table provides the estimated proved reserves of Vine Oil & Gas, Brix and Harvest on a combined basis as of December 31, 2020 based on SEC pricing.
| Vine Oil & Gas | Vine Pro Forma | |||||||
| At December 31, 2020(1)(2) |
At December 31, 2020(1)(2) |
|||||||
| Natural gas (MMcf) |
1,802,118 | 2,313,499 | ||||||
| Total proved developed reserves (MMcf) |
446,243 | 590,160 | ||||||
| Percent proved developed |
25 | % | 26 | % | ||||
| Total proved undeveloped reserves (MMcf) |
1,355,875 | 1,723,339 | ||||||
| (1) | Our reserve information reflects an assumed 30-year reserve life. |
| (2) | Our estimated proved reserves were determined using average first-day-of-the-month prices for the prior 12 months in accordance with SEC guidance. As of December 31, 2020, the SEC Price Deck was $1.99 per MMBtu (Henry Hub Price) for natural gas. In determining our reserves, the SEC Price Deck was adjusted for basis differentials and other factors affecting the prices we receive, which yielded a price of $1.73 per Mcf. “Business—Our Operations—Reserve Data—Adjusted Index Prices Used in Reserves Calculations” below contains the adjusted realized prices under strip pricing. |
Sensitivity of Proved Reserves Based on Future Strip Pricing
The following table provides our estimated proved reserves of Vine Oil & Gas, Brix and Harvest on a combined basis as of December 31, 2020, using NYMEX strip prices as of market close on December 31, 2020. We have included this reserve sensitivity in order to provide a measure that is more reflective of the fair value of our assets and the cash flows that we expect to generate from those assets. The historical 12-month pricing average in our 2020 disclosures above does not reflect the prevailing gas futures. We believe that the forward-looking nature of strip pricing provides investors with a more meaningful measure of value and enhances their ability to make decisions regarding their investment in us. In addition, we believe strip pricing provides relevant and useful information because it is widely used by investors in our industry as a basis for comparing the relative size and value of our proved reserves to our peers and in particular addresses the impact of differentials compared with our peers. Our estimated net proved reserves based on NYMEX futures were otherwise prepared on the same basis as our SEC reserves for the comparable period.
28
Table of Contents
Actual future prices may vary significantly from the NYMEX prices on December 31, 2020. Actual revenue and value generated may be more or less than the amounts disclosed. “Risk Factors” contains more information regarding the uncertainty associated with price and reserve estimates.
| Vine Oil & Gas | Vine Pro Forma | |||||||
| Strip Pricing(1) | Strip Pricing(1) | |||||||
| Estimated proved reserves at NYMEX Strip Pricing |
||||||||
| Natural gas (MMcf) |
2,364,510 | 3,151,073 | ||||||
| Total proved developed reserves (MMcf) |
491,769 | 643,352 | ||||||
| Percent proved developed |
21 | % | 20 | % | ||||
| Total proved undeveloped reserves (MMcf) |
1,872,741 | 2,507,721 | ||||||
| (1) | Prices were in each case adjusted for basis differentials and other factors affecting the prices we receive. Our NYMEX futures based reserves were determined using index prices for natural gas, without giving effect to derivative transactions. “Business—Our Operations—Reserve Data—Adjusted Index Prices Used in Reserve Calculations” contains the adjusted realized prices under strip pricing. |
Select Production and Operating Statistics
The following table sets forth information regarding production, revenues and realized prices, and production costs for the years ended December 31, 2020 and 2019, for Vine Oil & Gas and on a pro forma basis giving effect to the reorganization and business combination transactions described under “Corporate Reorganization.” For additional information on price calculations, please see “Management’s Discussion and Analysis of Financial Condition and Results of Operations.”
| Vine Oil & Gas | Vine Pro Forma | |||||||||||
| Year Ended December 31, |
Year Ended December 31, |
|||||||||||
| 2020 | 2019 | 2020 | ||||||||||
| Production data: |
||||||||||||
| Natural gas (MMcf) |
240,869 | 200,214 | 326,510 | |||||||||
| Average daily production (MMcfd) |
658 | 549 | 892 | |||||||||
| Average sales prices per Mcf: |
||||||||||||
| Before effects of realized derivatives |
$ | 1.74 | $ | 2.23 | $ | 1.75 | ||||||
| After effects of realized derivatives |
$ | 2.25 | $ | 2.42 | $ | 2.25 | ||||||
| Costs per Mcf: |
||||||||||||
| Lease operating |
$ | 0.20 | $ | 0.23 | $ | 0.20 | ||||||
| Gathering and treating |
0.32 | 0.19 | 0.31 | |||||||||
| Production and ad valorem taxes |
0.06 | 0.09 | 0.06 | |||||||||
| Depreciation, depletion and accretion |
1.44 | 1.64 | 1.20 | |||||||||
| General and administrative |
0.03 | 0.04 | 0.05 | |||||||||
| Monitoring fee |
0.03 | 0.04 | — | |||||||||
| Exploration |
— | — | — | |||||||||
| Strategic |
0.01 | — | 0.01 | |||||||||
| Write-off of deferred IPO costs |
0.02 | 0.01 | 0.02 | |||||||||
|
|
|
|
|
|
|
|||||||
| Total |
$ | 2.11 | $ | 2.24 | $ | 1.85 | ||||||
|
|
|
|
|
|
|
|||||||
29
Table of Contents
Investing in our Class A common stock involves risks. The information in this prospectus should be considered carefully, including the matters addressed under “Cautionary Statement Regarding Forward-Looking Statements,” and the following risks before making an investment decision. The risks and uncertainties described below are not the only ones we face. Additional risks not presently known to us or that we currently deem immaterial may also materially affect our business. The occurrence of any of the following risks or additional risks and uncertainties that are currently immaterial or unknown could materially and adversely affect our business, financial condition, liquidity, results of operations, cash flows or prospects. The trading price of our Class A common stock could decline due to any of these risks, and you may lose all or part of your investment.
Risks Related to Our Business
Natural gas prices are volatile. A reduction or sustained decline in prices may adversely affect our business, financial condition or results of operations and our ability to meet our financial commitments.
Prevailing natural gas prices heavily influence our revenue, profitability, access to capital, growth rate and value of our properties. Further, although we do not produce oil, to the extent oil prices rise considerably, the cost of services we incur may also increase. As a commodity, gas prices are subject to wide fluctuations in response to relatively minor changes in supply and demand. Historically, the natural gas market has been volatile. Prices for domestic natural gas have been pressured. Our revenue, profitability and future growth are highly dependent on the prices we receive for our natural gas production, and the levels of our production, depend on numerous factors beyond our control. These factors include the following:
| • | worldwide and regional economic conditions impacting the global supply of and demand for natural gas, including the economic impacts of the COVID-19 virus; |
| • | the actions of OPEC, its members and other state-controlled oil companies relating to oil price and production controls; |
| • | the level of global exploration and production; |
| • | the level of global oil and gas inventories; |
| • | prevailing prices on local price indexes in the areas in which we operate and expectations about future commodity prices; |
| • | extent of natural gas production associated with increased oil production; |
| • | the proximity, capacity, cost and availability of gathering and transportation facilities; |
| • | localized and global supply and demand fundamentals and transportation availability; |
| • | weather conditions across North America and, increasingly due to LNG, across the globe; |
| • | technological advances affecting energy consumption; |
| • | speculative trading in natural gas markets; |
| • | end-user conservation trends; |
| • | petrochemical, fertilizer, ethanol, transportation supply and demand balance; |
| • | the price and availability of alternative fuels; |
| • | domestic, local and foreign governmental regulation and taxes; and |
| • | liquefied petroleum products supply and demand balances. |
If commodity prices decrease or we experience widening of basis differentials, our cash flows and refinancing ability will be reduced. We may be unable to obtain needed capital or financing on satisfactory terms,
30
Table of Contents
which could lead to a decline in our reserves as existing reserves are depleted. Lower commodity prices may also reduce the amount of natural gas that we can produce economically. Additionally, a significant portion of our projects could become uneconomic and require us to abandon or postpone our planned drilling, which could result in downward adjustments to our estimated proved reserves. As a result, a reduction or sustained decline in natural gas prices may materially and adversely affect our financial condition, results of operations, liquidity and our ability to finance CapEx.
Our business and operations have been adversely affected by, and are expected to continue to be adversely affected by, the COVID-19 pandemic, and may be adversely affected by other similar outbreaks.
As a result of the COVID-19 pandemic or other adverse public health developments, including voluntary and mandatory quarantines, travel restrictions, and other restrictions, our operations, and those of our subcontractors and customers, have and are anticipated to continue to experience delays or disruptions and temporary suspensions of operations. In addition, our financial condition and results of operations have been and are likely to continue to be adversely affected by the COVID-19 pandemic.
The rapid development and fluidity of this situation precludes any prediction as to the ultimate adverse impact of COVID-19 on our business, which will depend on numerous evolving factors and future developments that we are not able to predict, including the length of time that the pandemic continues, its effect on the demand for natural gas, the response of the overall economy and the financial markets as well as the effect of governmental actions taken in response to the pandemic.
The timeline and potential magnitude of the COVID-19 outbreak are currently unknown. The continuation or amplification of this virus could continue to more broadly affect the United States and global economy, including our business and operations, and the demand for oil and gas. For example, the outbreak of coronavirus has resulted in a widespread health crisis that will adversely affect the economies and financial markets of many countries, resulting in an economic downturn that may affect our operating results. Other contagious diseases in the human population could have similar adverse effects. In addition, the effects of COVID-19 and concerns regarding its global spread have negatively impacted the domestic and international demand for crude oil and natural gas, which has contributed to price volatility. As the potential impact from COVID-19 is difficult to predict, the extent to which it will negatively affect our operating results, or the duration of any potential business disruption is uncertain. The magnitude and duration of any impact will depend on future developments and new information that may emerge regarding the severity and duration of COVID-19 and the actions taken by authorities to contain it or treat its impact, all of which are beyond our control.
We may be unable to obtain required capital or financing on satisfactory terms, which could lead to a decline in our production and natural gas reserves.
Our industry is capital intensive, requiring substantial CapEx to develop and acquire natural gas reserves. The actual amount and timing of our future CapEx may differ materially from our estimates as a result of, among other things, natural gas prices, actual drilling results, the availability of drilling rigs and other services and equipment, and regulatory, technological and competitive developments. A reduction or sustained decline in natural gas prices from current levels may force us to reduce our CapEx, which would negatively impact our ability to grow production. We intend to finance our CapEx through cash flow from operations and through available capacity under our New RBL; however, our financing needs may require us to alter or increase our capitalization substantially through the issuance of debt or equity securities or the sale of assets. The issuance of additional indebtedness requires compliance with the terms of our existing indebtedness and would require us to incur additional interest and principal, which may affect our ability to fund working capital, CapEx and acquisitions.
Our cash flow from operations and access to capital are subject to many factors, including:
| • | our proved reserves; |
31
Table of Contents
| • | the volume of natural gas we are able to produce from existing wells; |
| • | the prices at which our production is sold; |
| • | our ability to acquire, locate and produce new reserves; |
| • | the extent and levels of our derivative activities; |
| • | the levels of our operating expenses; and |
| • | our ability to access the capital markets. |
If our cash flow decreases as a result of lower natural gas prices, operating difficulties, declines in reserves or for any other reason, we may have limited ability to fund our planned CapEx or operations. If additional capital is needed, we may not be able to obtain financing on terms acceptable to us, if at all.
Our business strategy includes continued use of advancements in horizontal D&C techniques, which involve risks and uncertainties in their application.
Our current and future operations involve utilizing some of the latest D&C techniques. While developing our wells, we face risks associated with:
| • | effectively controlling downhole pressure; |
| • | landing and maintaining our wellbore at the desired depth in the desired drilling zone; |
| • | running our casing the entire length of the wellbore; |
| • | deploying tools and other equipment consistently downhole; |
| • | stimulating the formation with the planned number of stages; and |
| • | cleaning out the wellbore after final fracture stimulation. |
In addition, some of the techniques may cause irregularities or interruptions in existing production due to offset wells being shut in. If our actual results are less than anticipated, it may trigger reduced cash flow and impairment of our properties.
Our industry requires us to navigate many uncertainties that could adversely affect our financial condition and results of operations.
Our financial condition and results of operations depend on the success of our development and acquisition activities, which are subject to numerous risks beyond our control, including the risk that development will not result in commercially viable production or uneconomic results or that various characteristics of the drilling process or the well will cause us to abandon the well prior to fully producing commercially viable quantities.
Our decisions to purchase, explore or develop properties will depend in part on the evaluation of data obtained through geophysical and geological analyses, production data and engineering studies, the results of which are often inconclusive or subject to varying interpretations. “—Reserve estimates depend on many assumptions that may turn out to be inaccurate” contains additional information regarding this risk. In addition, our actual development cost for a well could significantly exceed planned levels.
Further, many factors may curtail, disrupt, delay or cancel our scheduled drilling projects and ongoing operations, including the following:
| • | reductions or sustained declines in natural gas prices; |
| • | regulatory compliance, including limitations on wastewater disposal, discharge of greenhouse gases and hydraulic fracturing; |
32
Table of Contents
| • | geological formation irregularities and pressures; |
| • | shortages of or delays in obtaining equipment, supplies and qualified personnel; |
| • | equipment failures, accidents or other unexpected operational events; |
| • | gathering facilities’ capacity or delays in construction of new gathering facilities; |
| • | capacity on transmission pipelines or our inability to make our gas meet quality specifications for such pipeline; |
| • | environmental hazards, such as natural gas leaks, pipeline and tank ruptures and unauthorized discharges of brine and other fluids, toxic gases or other pollutants; |
| • | stockholder activism or activities by others to restrict exploration, development and production of oil and natural gas; |
| • | natural disasters including regional flooding and hurricanes; |
| • | adverse weather conditions; |
| • | compliance with environmental and other governmental or contractual requirements; |
| • | availability of financing at acceptable terms; and |
| • | title issues. |
Any of these risks can cause substantial losses, including personal injury or loss of life, damage to property, reserves and equipment, pollution, environmental contamination and regulatory penalties.
Our operations are concentrated in the Haynesville Basin of Northwest Louisiana, making us vulnerable to risks associated with operating in a limited geographic area.
All of our producing properties are geographically concentrated in the north western Haynesville Basin. As a result, we may be disproportionately exposed to various factors, including, among others: (i) the impact of regional supply and demand factors, (ii) delays or interruptions of production from wells in such areas caused by governmental regulation, (iii) processing or transportation capacity constraints, (iv) market limitations, (v) availability of equipment and personnel, (vi) water shortages or other drought related conditions or (vii) interruption of the processing or transportation natural gas. This concentration in a limited geographic area also increases our exposure to changes in local laws and regulations, certain lease stipulations designed to protect wildlife and unexpected events that may occur in the regions such as natural disasters, seismic events, industrial accidents or labor difficulties. Any one of these factors has the potential to cause producing wells to be shut-in, delay operations, decrease cash flows, increase operating and capital costs and prevent development of lease inventory before expirations. Any of the risks described above could have a material adverse effect on our business, financial condition, results of operations and cash flow.
Our revenue will ultimately depend on our ability to transport our gas to various sales points.
We do not own or control third-party transportation facilities (i.e. gas transport pipelines) and our access to them may be limited or denied, because we do not have contracts for firm transportation. We currently sell our gas at the tailgate of our gatherer’s treating plants. The purchasers of our gas are typically parties who hold firm transportation and who, after taking possession of our gas, use it to fulfill their volume commitments. Today, there is ample transportation capacity, and there are ample holders of firm transportation who are willing to engage in the types of arrangements we use. If demand for transportation surged or if parties holding firm transport satisfied volume commitments with their own or others’ gas, we may be unable to sell our gas, which would materially and adversely affect our financial condition and results of operations.
33
Table of Contents
We may be unable to generate sufficient cash to service all of our indebtedness and financial commitments.
Our ability to make scheduled payments on or to refinance our indebtedness and financial commitments depends on our financial condition and operating performance, which are subject to prevailing economic and competitive conditions including financial, business and other factors beyond our control. We may be unable to generate sufficient cash flow to permit us to pay the principal, premium, if any, and interest on our indebtedness.
If our cash flows and capital resources are insufficient to fund debt and other obligations, we may be forced to reduce or delay CapEx, sell assets, seek additional capital or restructure our indebtedness. Our ability to restructure or refinance indebtedness will depend on the condition of the capital markets and our financial condition at such time. Any refinancing of indebtedness could be at higher interest rates and may require us to comply with more onerous covenants, which could further restrict our operations. The terms of existing or future debt instruments may restrict us from adopting some of these alternatives. In addition, any failure to service our debt would likely result in a reduction of our credit rating, which could harm our ability to incur additional indebtedness. If we face substantial liquidity problems, we might be required to sell assets to meet debt and other obligations. Our debt restricts our ability to dispose of assets and dictates our use of the proceeds from such disposition. We may not be able to consummate dispositions, and the proceeds of any such disposition may be inadequate to meet obligations.
We may be unable to access adequate funding as a result of a decrease in borrowing base due to an unwillingness or inability on the part of lending counterparties to meet their funding obligations and the inability of other lenders to provide additional funding to cover a defaulting lender’s portion. As a result, we may be unable to execute our development plan, make acquisitions or otherwise conduct operations, which would have a material adverse effect on our financial condition and results of operations.
Restrictions associated with our debt agreements could limit our growth and our ability to engage in certain activities.
Our debt agreements contain a number of significant covenants that may limit our ability to, among other things:
| • | incur additional indebtedness; |
| • | sell or convey assets; |
| • | make loans to or investments in others; |
| • | enter into mergers; |
| • | make certain payments; |
| • | hedge future production or interest rates; |
| • | incur liens; |
| • | pay dividends; and |
| • | engage in certain other transactions without the prior consent of the lenders. |
In addition, our RBL and our Second Lien Credit Facility requires us and our New RBL will require us to maintain certain financial ratios. We may also be prevented from taking advantage of business opportunities that arise because of the limitations that the restrictive covenants impose on us.
If we fail to comply with the restrictions and covenants in our debt agreements, there could be an event of default under the terms of such agreements, which could result in an acceleration of payment.
A breach of any representation, warranty or covenant in any of our debt agreements would result in a default under the applicable agreement after any applicable grace periods. A default could result in acceleration of the
34
Table of Contents
indebtedness which would have a material adverse effect on us. If an acceleration occurs, it would likely accelerate all of our indebtedness through cross-default provisions and we would likely be unable to make all of the required payments to refinance such indebtedness. Even if new financing were available at that time, it may not be on terms that are acceptable to us.
Reserve estimates depend on many assumptions that may turn out to be inaccurate.
The process of estimating natural gas reserves is complex. It requires interpretations of available technical data and many assumptions, including assumptions relating to current and future economic conditions and commodity prices. Any significant inaccuracies in these interpretations or assumptions could materially affect the estimated quantities and present value of our reserves.
In order to prepare reserve estimates, we project production rates, timing and pace of development. We must also analyze available geological, geophysical, production and engineering data. The extent, quality and reliability of this data can vary. The process also requires economic assumptions about matters such as D&C costs, operating costs, and production and ad valorem taxes.
Actual future production revenue, taxes, development costs and operating expenses will vary from our estimates. In addition, we may adjust reserve estimates to reflect production history, changes in existing commodity prices and other factors, many of which are beyond our control.
We do not believe that the present value of future net revenue from our reserves calculated in accordance with the method prescribed by the SEC is the current market value of our reserves. We generally base the estimated value of our properties on prices and costs on the date of the estimate. Actual future prices and costs may differ materially from those used in current estimates.
Our drilling locations are scheduled out over many years, making them susceptible to uncertainties regarding the timing or likelihood of their development. In addition, we may lack sufficient capital necessary to develop our drilling locations.
We have a multi-year development plan. These to-be-developed drilling locations represent a significant part of our growth strategy. Our ability to develop these drilling locations depends on a number of uncertainties, including natural gas prices, the availability and cost of capital, drilling and production costs, availability of services and equipment, gathering system and pipeline transportation constraints, regulatory approvals and other factors. In addition, we will require significant capital over a prolonged period in order to develop these drilling locations, and we may not be able to raise, generate or maintain the capital required to do so. Because of these uncertainties, we cannot be certain that all drilling locations may be developed successfully.
We may incur losses as a result of title defects in the properties in which we invest.
The existence of a material title deficiency can render a lease worthless. In the course of acquiring the rights to develop natural gas, we typically execute a lease agreement with payment to the lessor subject to title verification. In many cases, we incur the expense of retaining lawyers to verify the rightful owners of the gas interests prior to payment of such lease bonus to the lessor. There is no certainty, however, that a lessor has valid title to their lease’s gas interests. In those cases, such leases are generally voided and payment is not remitted to the lessor. As such, title failures may result in fewer net acres to us. Prior to the drilling of a natural gas well, however, it is the normal practice in our industry for the person or company acting as the operator of the well to obtain a preliminary title review to ensure there are no obvious defects in title to the well. Frequently, as a result of such examinations, certain curative work must be done to correct defects in the marketability of the title, and such curative work entails expense. Our failure to cure any title defects may delay or prevent us from utilizing the associated mineral interest, which may adversely impact our ability in the future to increase production and reserves. Accordingly, undeveloped acreage has greater risk of title defects than developed acreage. If there are any title defects or defects in assignment of leasehold rights in properties in which we hold an interest, we will suffer a financial loss.
35
Table of Contents
Unless we replace our reserves with new reserves, our production will decline, which would adversely affect our future cash flows and results of operations.
Developed natural gas reservoirs generally are characterized by declining production rates that vary depending upon reservoir characteristics and other factors. We must conduct ongoing development activities to avoid declines in our proved reserves and production. Our future natural gas reserves and production, and therefore our future cash flow and results of operations, are highly dependent on our success in efficiently developing and exploiting our current reserves and economically finding or acquiring additional recoverable reserves. We may not be able to develop, find or acquire sufficient additional reserves to replace our current and future production. If we are unable to replace our current and future production, the value of our reserves will decrease, and our business, financial condition and results of operations would be adversely affected.
The credit risk of financial institutions could adversely affect us.
We have entered into transactions with counterparties in the financial services industry, including commercial banks, investment banks, insurance companies and other institutions. These transactions expose us to credit risk in the event of default of our counterparty. Deterioration in the credit markets may impact the credit ratings of our current and potential counterparties and affect their ability to fulfill their existing obligations to us and their willingness to enter into future transactions with us. If any lender under the RBL or the New RBL is unable to fund its commitment, our liquidity will be reduced by an amount up to the aggregate amount of such lender’s commitment under the RBL or the New RBL, respectively.
The failure of our hedge counterparties, significant customers or working interest holders to meet their obligations to us may adversely affect our financial results.
Our hedging transactions expose us to the risk that a counterparty fails to perform under a derivative contract. Disruptions in the financial markets could lead to sudden decreases in a counterparty’s liquidity, which could make them unable to perform under the terms of the derivative contract and we may not be able to realize the benefit of the derivative contract. Any default by the counterparty to these derivative contracts when they become due would have a material adverse effect on our financial condition and results of operations.
We also face credit risk through joint interest receivables and the sale of our natural gas production. Joint interest receivables arise from billing entities who own partial interest in the wells we operate. We are also subject to credit risk due to concentration of our natural gas receivables with several significant customers. We do not require our customers to post collateral. The inability or failure of our significant customers or working interest holders to meet their obligations to us or their insolvency or liquidation may adversely affect our financial results.
We may not be able to enter into commodity derivatives on favorable terms or at all.
We enter into financial commodity derivative contracts to mitigate financial risk caused by changes to market factors. This helps reduce potential negative effects of reductions in gas prices but also reduces our ability to benefit from increases in gas prices. Moreover, our Second Lien Term Loan requires us to have 70% of our total expected production hedged 24 months forward. However, we currently rely on fewer than ten counterparties with whom we have negotiated operative hedging documents. We have, at times, been unable to secure sufficient capacity with these counterparties, even when markets reached a level at which we would have been willing to transact. If we are unable to maintain sufficient hedging capacity with our counterparties, we could have greater exposure to changes in commodity prices and interest rates, which could have a material adverse impact on our business, financial condition and results of operations.
Increased attention to environmental, social and governance (“ESG”) matters may impact our business.
Increasing attention to climate change, increasing societal expectations on companies to address climate change, increasing investor and societal expectations regarding voluntary ESG disclosures, and potential
36
Table of Contents
increasing consumer demand for alternative forms of energy may result in increased costs, reduced demand for our products, reduced profits, increased investigations and litigation, and negative impacts on our access to capital markets. Increasing attention to climate change, for example, may result in demand shifts for oil and natural gas products and additional governmental investigations and private litigation against the company. To the extent that societal pressures or political or other factors are involved, it is possible that such liability could be imposed without regard to the company’s causation of or contribution to the asserted damage, or to other mitigating factors.
In addition, organizations that provide information to investors on corporate governance and related matters have developed ratings processes for evaluating companies on their approach to ESG matters. Such ratings are used by some investors to inform their investment and voting decisions. Unfavorable ESG ratings and recent activism directed at shifting funding away from companies with energy-related assets could lead to increased negative investor sentiment toward the company and our industry and to the diversion of investment to other industries, which could have a negative impact on our stock price and our access to and costs of capital. Also, institutional lenders may, of their own accord, elect not to provide funding for fossil fuel energy companies based on climate change related concerns, which could affect our access to capital for potential growth projects.
Our operations are subject to stringent environmental laws and regulations that may expose us to significant costs and liabilities that could exceed current expectations.
Our operations are subject to stringent and complex federal, state and local laws and regulations governing the release, disposal or discharge of materials into the environment, health and safety aspects of our operations, or otherwise relating to environmental protection. These laws and regulations may impose numerous obligations applicable to our operations including the acquisition of a permit before conducting regulated development activities; the restriction of types, quantities and concentration of materials that can be released into the environment; the limitation or prohibition of drilling activities on certain lands lying within wilderness, wetlands, habitat of protected species, and other protected areas; the application of specific health and safety criteria addressing worker protection; and the imposition of substantial liabilities for pollution resulting from the ownership or operation of our oil and gas properties. Numerous governmental authorities have the power to enforce compliance with these laws and regulations and the permits issued under them. Such enforcement actions often involve taking difficult and costly compliance measures or corrective actions. We may be required to make significant capital and operating expenditures or perform remedial or other corrective actions at our wells and properties to comply with the requirements of these environmental laws and regulations or the terms or conditions of permits issued pursuant to such requirements. Failure to comply with these laws and regulations may result in the assessment of sanctions, including administrative, civil or criminal penalties, the imposition of investigatory or remedial obligations, and the issuance of orders limiting or prohibiting some or all of our operations. In addition, we may experience delays in obtaining or be unable to obtain required permits, which may delay or interrupt our operations and limit our growth and revenue. “Business—Regulation of Environmental and Occupational Safety and Health Matters” contains further description of the laws and regulations that affect us.
There is inherent risk of incurring significant environmental costs and liabilities in the performance of our operations due to our handling of petroleum hydrocarbons and other hazardous substances and wastes, as a result of air emissions and wastewater discharges related to our operations, and because of historical operations and waste disposal practices. Spills or other releases of regulated substances, including such spills and releases that occur in the future, could expose us to material losses, expenditures and liabilities under applicable environmental laws and regulations. Under certain of such laws and regulations, we could be held strictly liable for the removal or remediation of previously released hazardous materials or property contamination, regardless of whether we were responsible for the release or contamination and even if our operations met previous standards in the industry at the time they were conducted. In connection with certain acquisitions, we could acquire, or be required to provide indemnification against, environmental liabilities that could expose us to material losses. In addition, claims for damages to persons or property, including natural resources, may result
37
Table of Contents
from the environmental, health and safety impacts of our operations. Our insurance may not cover all environmental risks and costs or may not provide sufficient coverage if an environmental claim is made against us. Moreover, public interest in the protection of the environment has increased dramatically in recent years. The trend of more expansive and stringent environmental legislation and regulations applied to the crude oil and natural gas industry could continue, resulting in increased costs of doing business and consequently affecting profitability. Changes in environmental laws and regulations occur frequently, and any changes that result in more stringent or costly well drilling, construction, completion or water management activities or waste handling, storage, transport, disposal or cleanup requirements could require us to make significant expenditures to attain and maintain compliance and may otherwise have a material adverse effect on our industry in general in addition to our own results of operations, competitive position or financial condition. To the extent laws are enacted or other governmental action is taken that restricts development or imposes more stringent and costly operating, waste handling, disposal and cleanup requirements, our business, prospects, financial condition or results of operations could be materially adversely affected.
Federal and state legislative and regulatory initiatives regarding hydraulic fracturing and related activities, as well as governmental reviews of such activities, could increase our costs of doing business, result in additional operating restrictions or delays, limit the areas in which we can operate and reduce our natural gas production, which could adversely impact our production and business.
Hydraulic fracturing is an important and common practice that we use to stimulate production of natural gas. Hydraulic fracturing involves the injection of water, sand and chemicals under pressure to fracture the surrounding rock and stimulate production. There has been increased public concern regarding an alleged potential for hydraulic fracturing to adversely affect drinking water supplies and increase seismicity, and proposals have been made to enact separate federal, state and local legislation that would increase the regulatory burden imposed on hydraulic fracturing.
At present, hydraulic fracturing is regulated primarily at the state level, typically by state agencies. Along with several other states, Louisiana (where we conduct operations) has adopted laws and proposed regulations that require oil and natural gas operators to disclose chemical ingredients and water volumes used to hydraulically fracture wells, in addition to more stringent well construction and monitoring requirements. In addition, local governments may adopt ordinances within their jurisdictions regulating the time, place and manner of drilling activities in general or hydraulic fracturing activities in particular or prohibit the performance of well drilling in general or hydraulic fracturing in particular. At the federal level, the United States Environmental Protection Agency (“EPA”) has conducted investigations that focus on potential impacts of hydraulic fracturing on drinking water resources and asserted federal regulatory authority over various activities associated with hydraulic fracturing by issuing various guidance, notices, rules and regulations.
In addition, hydraulic fracturing operations require the use of a significant amount of water. The inability to locate sufficient amounts of water, or dispose of or recycle water used in drilling and production operations, could adversely impact our operations. Moreover, new environmental initiatives and regulations could include restrictions on the ability to conduct certain operations such as hydraulic fracturing or disposal of waste, including, but not limited to, produced water, drilling fluids and other wastes associated with the development or production of natural gas.
Finally, in some instances, the operation of underground injection wells for the disposal of waste has been alleged to cause earthquakes. In Oklahoma, for example, such issues have led to orders prohibiting continued injection or the suspension of drilling in certain wells identified as possible sources of seismic activity. Such concerns also have resulted in stricter regulatory requirements in some jurisdictions relating to the location and operation of underground injection wells. Although our operations are not located in those jurisdictions, any future orders or regulations addressing concerns about seismic activity from well injection in jurisdictions where we operate could affect our operations.
38
Table of Contents
If new or more stringent federal, state, or local legal restrictions relating to the hydraulic fracturing process and disposal activities are adopted in areas where we operate, we could incur potentially significant added costs or permitting requirements to comply with such requirements, experience delays or curtailment in the pursuit of exploration, development, or production activities, and perhaps even be precluded from drilling wells. “Business—Regulation of Environmental and Occupational Safety and Health Matters—Hydraulic Fracturing” contains further description of the laws and regulations relating to hydraulic fracturing that affect us.
Federal and state legislative and regulatory initiatives relating to pipeline safety could subject us to increased operational delays and costs or reduced prices.
Pursuant to federal legislative authority governing pipeline safety matters, the Pipeline and Hazardous Materials Safety Administration (“PHMSA”) has promulgated regulations requiring pipeline operators to develop and implement integrity management programs for certain gas and hazardous liquid pipelines that may impact operators of pipelines downstream from the sales points for our product.
In addition, states have adopted regulations similar to existing PHMSA regulations for certain intrastate gas and hazardous liquid pipelines which may be more stringent than the federal requirements. These federal and state legislative and regulatory initiatives relating to pipeline safety could subject us to increased operational delays and transportation costs due to constraints on available pipeline capacity, or reduce the price purchasers are willing to pay for our product.
We are subject to risks associated with climate change.
Climate change continues to attract considerable public and scientific attention. As a result, numerous proposals have been made and are likely to continue to be made at the international, national, regional and state levels of government to monitor and limit emissions of greenhouse gases (“GHGs”). These efforts have included consideration of cap-and-trade programs, carbon taxes, GHG reporting and tracking programs, and regulations that directly limit GHG emissions from certain sources. At the federal level, no comprehensive climate change legislation has been implemented to date. The EPA has, however, adopted rules that establish permitting reviews for GHG emissions from potential major sources of certain principal pollutant emissions, which reviews could require meeting “best available control technology” standards for air emissions, as well as monitoring and annual reporting of GHG emissions from certain petroleum and natural gas system sources and, together with the National Highways Transportation Safety Administration, implement GHG emissions limits on vehicles manufactured for operation in the United States. The regulation of methane emissions from the oil and gas sector has been subject to uncertainty in recent years. Prior standards were rescinded during the Trump Administration; however, the current administration has called for the reinstatement or issuance of methane emissions standards for new, modified, and existing oil and gas facilities. On an international level, the United States was one of 175 countries to sign the Paris Agreement, which requires member countries to set their own GHG emission reduction goals beginning in 2020. Although the United States had withdrawn from the Paris Agreement, the current administration has recommitted the United States to the agreement and directed the federal government to begin formulating the United States’ nationally determined emissions reduction goal under the agreement. The impacts of this order, and any legislation or regulation promulgated to fulfill the United States’ commitments under the Paris Agreement, are uncertain.
Forced emissions reductions could increase our operating costs and CapEx. Such programs could also adversely affect the demand for natural gas by increasing the cost of consuming natural gas. Additionally, on January 27, 2021, the current administration called for substantial action on climate change, including, among other things, the increased use of zero-emissions vehicles by the federal government, the elimination of subsidies provided to the fossil fuel industry, and increased emphasis on climate-related risks across agencies and economic sectors. Incentives to conserve energy or use alternative energy sources as a means of addressing climate change could also adversely affect the demand for natural gas. Additionally, various state and local governments have brought suit against various oil and natural gas companies alleging damages related to climate
39
Table of Contents
change or failure to properly disclose adverse climate impacts to their investors and consumers. Moreover, parties concerned about the potential effects of climate change have directed their attention at sources of funding for energy companies, which has resulted in certain financial institutions, funds and other sources of capital, restricting or eliminating their investment in oil and natural gas activities. There is also a risk that financial institutions will be required to adopt policies that have the effect of gradually curtailing the funding provided to the fossil fuel sector. Recently, the Federal Reserve announced that it has joined the Network for Greening the Financial System, a consortium of financial regulators focused on addressing climate-related risks in the financial sector. Consequently, legislation, regulation, market changes, and/or future litigation related to climate change could have an adverse effect on our business. Further, most scientists have concluded that increasing concentrations of GHGs in the Earth’s atmosphere may produce climate changes that have significant physical effects, such as increased frequency and severity of hurricanes, storms, floods and other climatic events. If any such effects were to occur, they could adversely affect or delay demand for the natural gas we produce or cause us to incur significant costs in preparing for or responding to those effects. “Business— Regulation of Environmental and Occupational Safety and Health Matters—Climate Change” contains further description of the risks associated with climate change.
We may incur substantial losses and be subject to substantial liability claims as a result of our operations. Additionally, we may not be insured for, or our insurance may be inadequate to protect us against, these risks.
Our operations are subject to risks associated with the energy industry, including the possibility of:
| • | environmental hazards, such as uncontrollable releases of natural gas, brine, well fluids, toxic gas or other pollution into the environment; |
| • | abnormally pressured formations; |
| • | mechanical difficulties, such as stuck oilfield drilling and service tools and casing collapse; |
| • | fires, explosions and ruptures of pipelines; |
| • | personal injuries and death; |
| • | natural disasters; and |
| • | terrorist attacks targeting natural gas and oil related facilities and infrastructure. |
Any of these risks could adversely affect our operations and result in substantial loss to us for:
| • | injury or loss of life; |
| • | damage to and destruction of property, natural resources and equipment; |
| • | pollution and other environmental and natural resources damages; |
| • | regulatory investigations and penalties; |
| • | suspension of our operations; and |
| • | repair and remediation costs. |
In accordance with what we believe to be customary industry practice, we maintain insurance against some, but not all, of our business risks. Our insurance may not be adequate to cover any losses or liabilities we may suffer. Also, insurance may no longer be available to us or, and if it is, its availability may be at premium costs that do not justify its purchase. The occurrence of a significant uninsured claim or a claim in excess of the insurance coverage limits we maintain could have an adverse effect on our ability to conduct normal business operations and on our financial condition, results of operations or cash flows. In addition, we may not be able to secure additional insurance or bonding that might be required by new governmental regulations. This may cause us to restrict our operations, which might severely impact our financial condition. We may also be liable for environmental damage caused by previous owners of properties purchased by us that are not covered by insurance.
40
Table of Contents
We may elect not to obtain insurance for any or all of these risks if we believe that the cost of available insurance is excessive relative to the risks presented. In addition, pollution and environmental risks generally are not fully insurable. The occurrence of an event that is not fully covered by insurance could have a material adverse effect on our business, financial condition and results of operations.
Properties that we decide to drill may not yield natural gas in commercially viable quantities.
Although we believe that the vast majority of our drilling locations are technically proved, any inability to develop commercially viable quantities will adversely affect our results of operations and financial condition. The use of seismic data and other technologies and the study of producing fields in the same area will not enable us to know conclusively prior to drilling whether natural gas will be present in commercial quantities. We can provide no assurance that the analogies we draw from available data from other wells, more fully explored prospects or producing fields will be applicable to our drilling prospects.
In the future, we may make acquisitions that we believe complement or expand our current business. We may not be able to identify attractive acquisition opportunities or complete any such acquisition on commercially acceptable terms.
The success of any completed acquisition will depend on our ability to integrate effectively the acquisition into our existing operations. The process of integrating acquisitions may involve unforeseen difficulties and may require a disproportionate amount of our managerial and financial resources. In addition, possible future acquisitions may be larger and for purchase prices significantly higher than those paid for earlier acquisitions.
We can provide no assurance that we will be able to identify additional suitable acquisition opportunities, negotiate acceptable terms, obtain financing for acquisitions on acceptable terms or successfully acquire identified targets. Our failure to achieve consolidation savings, to integrate the acquisitions into our existing operations successfully or to minimize any unforeseen operational difficulties could have a material adverse effect on our financial condition and results of operations.
In addition, our debt agreements impose certain limitations on our ability to enter into mergers or combination transactions and limit our ability to incur certain indebtedness, which could indirectly limit our ability to engage in acquisitions.
The unavailability or high cost of additional drilling rigs, equipment, supplies, personnel and oilfield services could adversely affect our ability to execute our exploration and development plans within our budget and on a timely basis.
The demand for qualified and experienced field and technical personnel to conduct our operations can fluctuate significantly, often in correlation with hydrocarbon prices. We cannot predict whether periods of high demand will exist in the future or their timing and duration. Furthermore, it is possible that oil prices may increase without a corresponding increase in natural gas prices, which could lead to increased demand and prices for supplies and personnel, and necessary equipment and services may become unavailable to us at economical prices. Any shortages in available human capital could delay or cause us to incur significant expenditures that are not provided for in our capital budget, which could have a material adverse effect on our business, financial condition or results of operations.
Competition in the natural gas industry is intense, making it more difficult for us to acquire properties, market natural gas and secure trained personnel.
Our ability to acquire additional prospects and to find and develop reserves in the future will depend on our ability to evaluate and select suitable properties and to consummate transactions in a highly competitive environment for acquiring properties, marketing natural gas and securing trained personnel. Also, there is
41
Table of Contents
substantial competition for capital available for investment in our industry. Many of our competitors possess and employ financial, technical and personnel resources substantially greater than ours. Those companies may be able to pay more for productive natural gas properties and exploratory prospects and to evaluate, bid for and purchase a greater number of properties and prospects than our financial or personnel resources permit. In addition, other companies may be able to offer better compensation packages to attract and retain qualified personnel than we are able to offer. The cost to attract and retain qualified personnel has increased may increase substantially in the future. We may not be able to compete successfully in the future in acquiring prospective reserves, developing reserves, marketing hydrocarbons, attracting and retaining quality personnel and raising additional capital, which could have a material adverse effect on our business.
The loss of senior management or technical personnel could adversely affect operations.
We depend on the services of our senior management and technical personnel. We do not maintain, nor do we plan to obtain, any insurance against the loss of any of these individuals. The loss of the services of our senior management or technical personnel could have a material adverse effect on our business, financial condition and results of operations.
Events of force majeure may limit our ability to operate our business and could adversely affect our operating results.
The weather, unforeseen events, or other events of force majeure in the areas in which we operate could cause disruptions or suspension of our operations. This suspension could result from a direct impact to our properties or result from an indirect impact by a disruption or suspension of the operations of those upon whom we rely for gathering and transportation. If disruption or suspension were to persist for a long period, our results of operations would be materially impacted.
Increases in interest rates could adversely affect our business.
We require continued access to capital. Our business and operating results can be harmed by factors such as the availability, terms of and cost of capital, increases in interest rates or a reduction in credit rating. These changes could cause our cost of doing business to increase, limit our ability to pursue acquisition opportunities, reduce cash flow used for drilling and place us at a competitive disadvantage. Recent and continuing disruptions and volatility in the global energy capital markets may lead to a contraction in credit availability impacting our ability to finance our operations. A significant reduction in cash flows from operations or the availability of credit could materially and adversely affect our ability to achieve our planned growth and operating results.
If commodity prices decrease and our assets’ fair value is less than their carrying value, we will recognize impairments.
We periodically review the carrying value of our assets for possible impairment. Natural gas prices are a critical component to our fair value estimate of our natural gas properties. If these prices decline, we will record an impairment, which is a non-cash charge to earnings, if we determine that an asset’s carrying value exceeds its estimated fair value. Impairment expense may have a material adverse effect on our earnings.
The enactment of derivatives legislation and related regulations could have an adverse effect on our ability to use derivatives to hedge risks associated with our business.
Title VII of the Dodd-Frank Act established federal oversight and regulation of the derivatives market and of companies like us that participate in that market. The Dodd-Frank Act requires the Commodity Futures Trading Commission (“CFTC”) to promulgate rules and regulations implementing mandates of the Dodd-Frank Act with respect to over-the-counter derivatives of the types we use to hedge our exposure to commodity price volatility. Although the CFTC has issued final regulations in certain areas, in other areas, final regulations and the scope of relevant definitions and/or exemptions still remain to be finalized.
42
Table of Contents
The CFTC issued a final rule on October 15, 2020, imposing position limits for certain futures and option contracts in various commodities (including oil and natural gas) and for swaps that are their economic equivalents. The compliance dates for these limits are delayed until January 1, 2022 and in some cases, January 1, 2023. Under this rule, certain types of hedging transactions are exempt from these limits on the size of positions that may be held, provided that such hedging transactions satisfy the CFTC’s requirements for certain enumerated “bona fide hedging” transactions or positions.
The CFTC has also adopted a final rule regarding aggregation of positions, under which a party that controls the trading of, or owns 10% or more of the equity interests in, another party will have to aggregate the positions of the controlled or owned party with its own positions for purposes of determining compliance with position limits unless an exemption applies. The CFTC’s aggregation rules are now in effect, though CFTC staff have granted relief—until August 12, 2022—from various conditions and requirements in the final aggregation rules. With the implementation of the final aggregation rules and upon the effectiveness of the final CFTC position limits rule, our ability to execute our hedging strategies described herein could be limited.”
On January 24, 2020, U.S. banking regulators published a new approach for calculating the quantum of exposure of derivative contracts under their regulatory capital rules. This approach to measuring exposure is referred to as the standardized approach for counterparty credit risk or SA-CCR. It requires certain financial institutions to comply with significantly increased capital requirements for over-the-counter commodity derivatives beginning on January 1, 2022. In addition, on September 15, 2020, the CFTC issued a final rule regarding the capital a swap dealer or major swap participant is required to set aside with respect to its swap business, which has a compliance date of October 6, 2021. These two sets of regulations and the increased capital requirements they place on certain financial institutions may reduce the number of products and counterparties in the over-the-counter derivatives market available to us and could result in significant additional costs being passed through to end-users like us.
The Volcker Rule provisions of the Dodd-Frank Act may require banks that engage in financial derivative transactions to spin off some of their derivatives activities to separate entities that may not be as creditworthy as our current bank counterparties. Other banks may elect to cease their business as hedge providers, thereby reducing the liquidity of the financial derivatives and the ability of entities like us, as commercial end-users, to hedge or mitigate our exposure to commodity price volatility using over-the-counter financial derivatives.
The legislation and regulations specifically noted above and others yet to be introduced could increase our costs or reduce our opportunities with respect to the use of derivative transactions to hedge or mitigate our exposure to commodity price volatility and other commercial risks affecting our business, which could adversely affect our business, financial condition and results of operations.
Our hedging activities could result in financial losses or reduce our income, or if gas prices increase, we will not benefit from such increases with respect to any gas volumes we had hedged.
To achieve a more predictable cash flow and to reduce our exposure to adverse fluctuations in the prices of natural gas, as well as interest rates, we have, and may in the future, enter into derivative arrangements for a portion of our natural gas production and our debt that could result in both realized and unrealized hedging losses. We typically utilize financial instruments to hedge commodity price exposure to declining prices on our natural gas.
Our Second Lien Term Loan requires that we hedge 70% of our production for the next 24 months. By virtue of this hedging requirement, we are impacted less by gas price volatility during this time frame than future periods where a smaller percentage of our production is subject to derivative contracts. However, if gas prices increase, we will not benefit from such increases with respect to the volumes of gas that we have hedged to the extent such volumes are hedged at a price lower than the increased strip price. While such hedges reduce our exposure to downside risk, they also decrease our ability to benefit from the upside of price increases.
43
Table of Contents
Our production may be significantly higher or lower than we estimate at the time we enter into hedging transactions for such period. If the actual amount is higher than we estimate, we will have greater commodity price exposure than we intended. If the actual amount is lower than the nominal amount that is subject to our derivative financial instruments, we might be forced to satisfy all or a portion of our derivative transactions without the benefit of the cash flow from our sale or purchase of the underlying physical commodity, resulting in a substantial diminution of our liquidity. As a result of these factors, our hedging activities may not be as effective as we intend in reducing the volatility of our cash flows, and in certain circumstances may actually increase the volatility of our cash flows.
Our business could be negatively affected by security threats, including cybersecurity threats and other disruptions.
As an oil and gas producer, we face various security threats, including cybersecurity threats to gain unauthorized access to sensitive information or to render data or systems unusable; threats to the security of our facilities and infrastructure or third-party facilities and infrastructure, such as processing plants and pipelines; and threats from terrorist acts. The potential for such security threats has subjected our operations to increased risks that could have a material adverse effect on our business. In particular, our implementation of various procedures and controls to monitor and mitigate security threats and to increase security for our information facilities and infrastructure may result in increased capital and operating costs. Moreover, there can be no assurance that such procedures and controls will be sufficient to prevent security breaches from occurring. If any of these security breaches were to occur, they could lead to losses of sensitive information, critical infrastructure or capabilities essential to our operations and could have a material adverse effect on our reputation, financial position, results of operations or cash flows. Cybersecurity attacks in particular are becoming more sophisticated and include, but are not limited to, malicious software, attempts to gain unauthorized access to data and systems and other electronic security breaches that could lead to disruptions in critical systems, unauthorized release of confidential or otherwise protected information, and corruption of data. These events could lead to financial losses from remedial actions, loss of business or potential liability.
Changes to applicable U.S. tax laws and regulations or exposure to additional income tax liabilities could adversely affect our business and future profitability.
We will have no material assets other than our equity interest in Vine Holdings, which holds, directly or indirectly, all of the operating assets of our business. Vine Holdings generally will not be subject to U.S. federal income tax, but may be subject to certain U.S. state and local taxes. We are a domestic corporation that will be subject to U.S. corporate income tax on our earnings, including our allocable share of the income of Vine Holdings. Existing U.S. tax laws and regulations could be interpreted, changed or modified, including possibly with retroactive effect, in a manner that would be adverse to us. Further, new U.S. laws and policy relating to taxes could have an adverse effect on our business and future profitability.
For example, the new administration has set forth several tax proposals that would, if enacted, make significant changes to U.S. tax laws. Such proposals include, but are not limited to, (i) an increase in the U.S. income tax rate applicable to corporations (including us) from 21% to 28%, (ii) the elimination of certain subsidies current tax law grants to oil and gas producers, (iii) an increase in the maximum U.S. federal income tax rate applicable to individuals and (iv) an increase in the U.S. federal income tax rate for long term capital gain for certain taxpayers with income in excess of a threshold amount. Congress may consider, and could include, some or all of these proposals in connection with tax reform to be undertaken by the current administration. It is unclear whether these or similar changes will be enacted and, if enacted, how soon any such changes could take effect. The passage of any legislation as a result of these proposals and other similar changes in U.S. federal income tax laws could adversely affect our business and future profitability or the liquidity of our Class A common stock.
44
Table of Contents
Risks Related to the Offering and our Class A Common Stock
We are a holding company. Our sole material asset after completion of this offering will be our equity interest in Vine Holdings and we are accordingly dependent upon distributions from Vine Holdings to pay taxes, make payments under the Tax Receivable Agreement and cover our corporate and other overhead expenses.
We are a holding company and will have no material assets other than our equity interest in Vine Holdings. “Corporate Reorganization” contains more information. We have no independent means of generating revenue. To the extent Vine Holdings has available cash, we intend to cause Vine Holdings (i) to generally make pro rata distributions to its unitholders, including us, in an amount at least sufficient to allow us to pay our taxes and make payments under the Tax Receivable Agreement, and (ii) to reimburse us for our corporate and other overhead expenses through non-pro rata payments that are not treated as distributions under the VEH LLC Agreement. To the extent that we are unable to make payments under the Tax Receivable Agreement for any reason, such payments will be deferred and will accrue interest until paid. We are limited, however, in our ability to cause Vine Holdings and its subsidiaries to make these and other distributions to us due to the restrictions under our credit facilities. To the extent that we need funds and Vine Holdings or its subsidiaries are restricted from making such distributions under applicable law or regulation or under the terms of their financing arrangements, or are otherwise unable to provide such funds, it could materially adversely affect our liquidity and financial condition.
The requirements of being a public company, including compliance with the reporting requirements of the Securities Exchange Act of 1934, as amended (the “Exchange Act”), and the requirements of the Sarbanes- Oxley Act (“SOX”), may strain our resources, increase our costs and distract management, and we may be unable to comply with these requirements in a timely or cost-effective manner.
As a public company, we will need to comply with new laws, regulations and requirements, certain corporate governance provisions of SOX, related regulations of the SEC and the requirements of the NYSE, with which we were not required to comply as a private company. Complying with these statutes, regulations and requirements will occupy a significant amount of our time and will significantly increase our costs and expenses. We will need to:
| • | institute a more comprehensive compliance function to test and conclude on the sufficiency of our internal controls around financial reporting; |
| • | comply with rules promulgated by the NYSE; |
| • | prepare and distribute periodic public reports; |
| • | establish new internal policies, such as those relating to insider trading; and |
| • | involve and retain to a greater degree outside professionals in the above activities. |
Furthermore, while we generally must comply with Section 404 of the SOX, we are not required to have our independent registered public accounting firm attest to the effectiveness of our internal controls until our first annual report subsequent to our ceasing to be an “emerging growth company.” We may not be required to have our independent registered public accounting firm attest to the effectiveness of our internal controls until as late as our annual report for the year ending December 31, 2027. At any time, we may conclude that our internal controls, once tested, are not operating as designed or that the system of internal controls does not address all relevant financial statement risks. Once required to attest to control effectiveness, our independent registered public accounting firm may issue a report that concludes it does not believe our internal controls over financial reporting are effective. Compliance with SOX requirements may strain our resources, increase our costs and distract management; and we may be unable to comply with these requirements in a timely or cost-effective manner.
There is no existing market for our Class A common stock, and we do not know if one will develop.
Prior to this offering, there has not been a public market for our Class A common stock. We cannot predict the extent to which investor interest in our company will lead to the development of an active trading market on
45
Table of Contents
the stock exchange on which we list our Class A common stock or otherwise or how liquid that market might become. If an active trading market does not develop, anyone purchasing our Class A common stock may have difficulty selling it. The initial public offering price for the Class A common stock was determined by negotiations between us and the representatives of the underwriters and may not be indicative of prices that will prevail in the open market following this offering. Consequently, purchasers of our Class A common stock may be unable to sell it at prices equal to or greater than the price paid.
The stock markets in general have experienced extreme volatility that has often been unrelated to the operating performance of particular companies. These broad market fluctuations may adversely affect the trading price of our Class A common stock. Securities class action litigation has often been instituted against companies following periods of volatility in the overall market and in the market price of a company’s securities. Such litigation, if instituted against us, could result in very substantial costs, divert our management’s attention and resources and harm our business, operating results and financial condition.
The Vine Energy Investment Vehicles and the Vine Energy Investment II Vehicles will collectively hold a substantial majority of our common stock.
Holders of Class A common stock and Class B common stock will vote together as a single class on all matters presented to our shareholders for their vote or approval, except as otherwise required by applicable law or our certificate of incorporation. Upon completion of this offering (assuming no exercise of the underwriters’ option to purchase additional shares), the Vine Energy Investment Vehicles will own approximately 0.3% of our Class A common stock and 100% of our Class B common stock and the Vine Energy Investment II Vehicles will own approximately 46.1% of our Class A common stock (representing 73.0% of our combined economic interest and voting power).
Although the Existing Owners, through their ownership in the Vine Energy Investment Vehicles and the Vine Energy Investment II Vehicles, are entitled to act separately in their own respective interests with respect to their stock in us, the Existing Owners will together have the ability to elect all of the members of our board of directors, and thereby to control our management and affairs. In addition, they will be able to determine the outcome of all matters requiring shareholder approval, including mergers and other material transactions, and will be able to cause or prevent a change in the composition of our board of directors or a change of control of our company that could deprive our shareholders of an opportunity to receive a premium for their Class A common stock as part of a sale of our company. The existence of significant shareholders may also have the effect of deterring hostile takeovers, delaying or preventing changes in control or changes in management, or limiting the ability of our other shareholders to approve transactions that they may deem to be in the best interests of our company.
So long as the Existing Owners continue to control a significant amount of our common stock, the Existing Owners will, through their ownership interests in the Vine Energy Investment Vehicles and the Vine Energy Investment II Vehicles, be able to strongly influence all matters requiring stockholder approval, regardless of whether or not other stockholders believe that a potential transaction is in their own best interests. In any of these matters, the interests of the Existing Owners may differ or conflict with the interests of our other stockholders. Moreover, this concentration of stock ownership may also adversely affect the trading price of our Class A common stock to the extent investors perceive a disadvantage in owning stock of a company with a controlling stockholder.
Conflicts of interest could arise in the future between us and Blackstone and its affiliates, including their portfolio companies concerning conflicts over our operations or business opportunities.
Blackstone is a private equity investment fund, and has investments in other companies in the energy industry. As a result, Blackstone may, from time to time, acquire interests in businesses that directly or indirectly compete with our business, as well as businesses that are our customers or suppliers. As such, Blackstone or its
46
Table of Contents
portfolio companies may acquire or seek to acquire the same assets that we seek to acquire and, as a result, those acquisition opportunities may not be available to us or may be more expensive for us to pursue. Any actual or perceived conflicts of interest with respect to the foregoing could have an adverse impact on the trading price of our Class A common stock. For additional discussion of potential conflicts of interest of which our stockholders should be aware and a discussion of our related party transactions policy, see “Certain Relationships and Related Party Transactions.”
Certain of our directors have significant duties with, and spend significant time serving, entities that may compete with us in seeking acquisitions and business opportunities and, accordingly, may have conflicts of interest in allocating time or pursuing business opportunities.
Certain of our directors, who are responsible for managing the direction of our operations and acquisition activities, hold positions of responsibility with other entities (including Vine-affiliated entities) that are in the business of identifying and acquiring oil and natural gas properties. The existing positions held by these directors may give rise to fiduciary or other duties that are in conflict with the duties they owe to us. These directors may become aware of business opportunities that may be appropriate for presentation to us as well as to the other entities with which they are or may become affiliated. Due to these existing and potential future affiliations, they may present potential business opportunities to other entities prior to presenting them to us, which could cause additional conflicts of interest. They may also decide that certain opportunities are more appropriate for other entities with which they are affiliated, and as a result, they may elect not to present those opportunities to us. These conflicts may not be resolved in our favor. For additional discussion of our management’s business affiliations and the potential conflicts of interest of which our stockholders should be aware, see “Certain Relationships and Related Party Transactions.”
Our amended and restated certificate of incorporation and amended and restated bylaws, as well as Delaware law, contain provisions that could discourage acquisition bids or merger proposals, which may adversely affect the market price of our Class A common stock.
Our amended and restated certificate of incorporation authorizes our board of directors to issue preferred stock without stockholder approval. If our board of directors elects to issue preferred stock, it could be more difficult for a third party to acquire us. In addition, some provisions of our amended and restated certificate of incorporation and amended and restated bylaws could make it more difficult for a third party to acquire control of us, even if the change of control would be beneficial to our stockholders, including:
| • | providing for a classified Board of Directors; |
| • | limitations on the removal of directors; |
| • | limitations on the ability of our stockholders to call special meetings; |
| • | establishing advance notice provisions for stockholder proposals and nominations for elections to the board of directors to be acted upon at meetings of stockholders; |
| • | the requirement that the affirmative vote of holders representing at least 66 2/3% of the voting power of all outstanding shares of capital stock (or a majority of the voting power of all outstanding shares of capital stock if Blackstone beneficially owns at least 30% of the voting power of all such outstanding shares) be obtained to amend our amended and restated bylaws, to remove directors or to amend our certificate of incorporation; |
| • | providing that the Board of Directors is expressly authorized to adopt, or to alter or repeal our bylaws; and |
| • | establishing advance notice and certain information requirements for nominations for election to our Board of Directors or for proposing matters that can be acted upon by stockholders at stockholder meetings. |
47
Table of Contents
In addition, certain change of control events have the effect of accelerating the payment due under our Tax Receivable Agreement, which could be substantial and accordingly serve as a disincentive to a potential acquirer of our company. “—In certain cases, payments under the Tax Receivable Agreement may be accelerated and/or significantly exceed the actual benefits, if any, we realize in respect of the tax attributes subject to the Tax Receivable Agreement” contains more information.
Investors in this offering will experience immediate and substantial dilution of $7.14 per share.
Based on an assumed initial public offering price of $17.50 per share (the midpoint of the range set forth on the cover of this prospectus), purchasers of our Class A common stock in this offering will experience an immediate and substantial dilution of $7.14 per share in the as adjusted net tangible book value per share of Class A common stock from the initial public offering price, and our as adjusted net tangible book value as of December 31, 2020 on a pro forma basis would be $10.36 per share. This dilution is due in large part to earlier investors having paid substantially less than the initial public offering price when they purchased their shares. “Dilution” contains additional information.
We do not intend to pay dividends on our Class A common stock and our debt instruments place certain restrictions on our ability to do so.
We do not plan to declare dividends on shares of our Class A common stock in the foreseeable future.
Additionally, our debt agreements place certain restrictions on our ability to pay cash dividends. Consequently, to achieve a return on any investment in us, it might require a sale of our Class A common stock at a price greater than cost. There is no guarantee that the price of our Class A common stock that will prevail in the market will ever exceed the price paid in this offering.
Future sales of our Class A common stock in the public market could reduce our stock price, and any additional capital raised by us through the sale of equity or convertible securities may dilute your ownership in us.
Subject to certain limitations and exceptions, the Vine Unit Holders may exchange their Vine Units (together with shares of Class B common stock) for shares of Class A common stock (on a one-for-one basis, subject to conversion rate adjustments for stock splits, stock dividends and reclassification and other similar transactions) and then sell those shares of Class A common stock. Additionally, we may issue additional shares of Class A common stock or convertible securities in subsequent public offerings. After the completion of this offering, assuming the underwriters’ option to purchase additional shares is fully exercised, we will have 37,807,649 outstanding shares of Class A common stock and 34,289,108 outstanding shares of Class B common stock. This number includes 18,750,000 shares of Class A common stock that we are selling in this offering and the 2,812,500 shares of Class A common stock that we may sell in this offering if the underwriters’ option to purchase additional shares is fully exercised, which may be resold immediately in the public market. Following the completion of this offering, the Existing Owners, through the Vine Energy Investment Vehicles and the Vine Energy Investment II Vehicles, will own 16,245,149 shares of Class A common stock and 34,289,108 shares of Class B common stock, representing approximately 73.0% (or 70.1% if the underwriters’ option to purchase additional shares is exercised in full) of our total outstanding common stock. All such shares are restricted from immediate resale under the federal securities laws and are subject to the lock-up agreements between such parties and the underwriters described in “Underwriting (Conflicts of Interest)” but may be sold into the market in the future.
The Vine Energy Investment Vehicles and the Vine Energy Investment II Vehicles will be party to a registration rights agreement with us that will require us to effect the registration of their shares in certain circumstances no earlier than the expiration of the lock-up period contained in the underwriting agreement entered into in connection with this offering. “Shares Eligible for Future Sale” and “Certain Relationships and Related Party Transactions—Registration Rights Agreement” contain more information.
48
Table of Contents
We cannot predict the size of future issuances of our common stock or securities convertible into common stock or the effect, if any, that future issuances and sales of shares of our Class A common stock will have on the market price of our Class A common stock. Sales of substantial amounts of our Class A common stock (including shares issued in connection with an acquisition), or the perception that such sales could occur, may adversely affect prevailing market prices of our Class A common stock.
The representatives of the underwriters of this offering may waive or release parties to the lock-up agreements entered into in connection with this offering, which could adversely affect the price of our Class A common stock.
We, the Vine Energy Investment Vehicles, the Vine Energy Investment II Vehicles and all of our directors and executive officers have entered into lock-up agreements with respect to their Class A common stock, pursuant to which we and they are subject to certain resale restrictions for a period of 180 days following the effectiveness date of the registration statement of which this prospectus forms a part. The representatives of the underwriters, at any time and without notice, may release all or any portion of the Class A common stock subject to the foregoing lock-up agreements. If the restrictions under the lock-up agreements are waived, then Class A common stock will be available for sale into the public markets, which could cause the market price of our Class A common stock to decline and impair our ability to raise capital. “Underwriting (Conflicts of Interest)” provides additional information regarding the lock-up agreements.
We will be required to make payments under the Tax Receivable Agreement for certain tax benefits we may claim, and the amounts of such payments could be significant.
We will enter into a Tax Receivable Agreement with Vine Investment, Brix Investment, Harvest Investment, Vine Investment II, Brix Investment II and Harvest Investment II. This agreement generally provides for the payment by us to Vine Investment, Brix Investment, Harvest Investment, Vine Investment II, Brix Investment II and Harvest Investment II, respectively, of 85% of the net cash savings, if any, in U.S. federal, state and local income tax that Vine Energy (a) actually realizes with respect to taxable periods ending after December 31, 2025 or (b) is deemed to realize in the event of a change of control (as defined under the Tax Receivable Agreement, which includes certain mergers, asset sales and other forms of business combinations and certain changes to the composition of the Vine Energy board) or the Tax Receivable Agreement terminates early (at our election or as a result of our breach) with respect to any taxable periods ending on or after such change of control or early termination event, in each case, as a result of (i) the tax basis increases resulting from the exchange of Vine Units and the corresponding surrender of an equivalent number of shares of Class B common stock by Vine Investment, Brix Investment and Harvest Investment, respectively, for a number of shares of Class A common stock on a one-for-one basis or, at our option, the receipt of an equivalent amount of cash pursuant to the exchange agreement, (ii) certain existing net operating loss carryforwards, disallowed interest expense carryforwards under Section 163(j) of the Code, and tax credit carryforwards attributable to the Blocker Entities previously owned by certain of the Existing Owners, and (iii) imputed interest deemed to be paid by us as a result of, and additional tax basis arising from, any payments we make under the Tax Receivable Agreement. Vine Energy will retain the benefit of the remaining 15% of these cash savings, if any. If we experience a change of control or the Tax Receivable Agreement terminates early, we could be required to make a substantial, immediate lump-sum payment. “Certain Relationships and Related Party Transactions—Tax Receivable Agreement” contains more information.
The payment obligations under the Tax Receivable Agreement are our obligations and not obligations of Vine Holdings. For purposes of the Tax Receivable Agreement, cash savings in tax generally are calculated by comparing our actual tax liability to the amount we would have been required to pay had we not been able to utilize any of the tax benefits subject to the Tax Receivable Agreement. The amounts payable, as well as the timing of any payments, under the Tax Receivable Agreement are dependent upon future events and assumptions, including the timing of the exchanges of Vine Units along with surrendering a corresponding number of our Class B common stock, the price of our Class A common stock at the time of each exchange, the extent to which such exchanges are taxable transactions, the amount of the exchanging Vine Unit Holder’s tax
49
Table of Contents
basis in its Vine Units at the time of the relevant exchange, the depreciation, depletion and amortization periods that apply to the increase in tax basis, the amount and timing of taxable income we generate in the future, the U.S. federal income tax rate then applicable, and the portion of Vine Energy’s payments under the Tax Receivable Agreement that constitute imputed interest or give rise to depreciable, depletable or amortizable tax basis. The term of the Tax Receivable Agreement will commence upon the completion of this offering and will continue until all such tax benefits have been utilized or expired and all required payments are made, unless we exercise our right to terminate the Tax Receivable Agreement (or the Tax Receivable Agreement is terminated due to other circumstances, including our breach of a material obligation thereunder or certain mergers or other changes of control) by making the termination payment specified in the agreement. In the event that the Tax Receivable Agreement is not terminated, the payments under the Tax Receivable Agreement are not anticipated to commence until 2028 at the earliest (with respect to the tax year 2026).
The actual increase in tax basis, as well as the amount and timing of any payments under the Tax Receivable Agreement, will vary depending upon a number of factors, including the timing of the exchanges of Vine Units, the price of Class A common stock at the time of each exchange, the extent to which such exchanges are taxable, the amount and timing of the taxable income we generate in the future and the tax rate then applicable, and the portion of our payments under the Tax Receivable Agreement constituting imputed interest or depreciable, depletable or amortizable tax basis. We expect that the payments that we will be required to make under the Tax Receivable Agreement could be substantial.
The payments under the Tax Receivable Agreement will not be conditioned upon a holder of rights under the Tax Receivable Agreement having a continued ownership interest in us or Vine Holdings. In addition, certain rights under the Tax Receivable Agreement (including the right to receive payments) will be transferable in connection with transfers permitted thereunder. “Certain Relationships and Related Party Transactions—Tax Receivable Agreement” contains more information.
In certain cases, payments under the Tax Receivable Agreement may be accelerated and/or significantly exceed the actual benefits we realize, if any, in respect of the tax attributes subject to the Tax Receivable Agreement.
If we experience a change of control (as defined under the Tax Receivable Agreement, which includes certain mergers, asset sales and other forms of business combinations and certain changes to the composition of the Vine Energy board) or the Tax Receivable Agreement terminates early (at our election or as a result of our breach), we could be required to make a substantial, immediate lump-sum payment. This payment would equal the present value of hypothetical future payments that could be required under the Tax Receivable Agreement. The calculation of the hypothetical future payments will be based upon certain assumptions and deemed events set forth in the Tax Receivable Agreement, including (i) the sufficiency of taxable income to fully utilize the tax benefits, (ii) any Vine Units (other than those held by us) outstanding on the termination date are exchanged on the termination date and (iii) the utilization of certain loss carryovers. Our ability to generate net taxable income is subject to substantial uncertainty. Accordingly, as a result of the assumptions, the required lump-sum payment may be significantly in advance of, and could materially exceed, the realized future tax benefits to which the payment relates.
As a result of either an early termination or a change of control, we could be required to make payments under the Tax Receivable Agreement that exceed our actual cash tax savings under the Tax Receivable Agreement. Consequently, our obligations under the Tax Receivable Agreement could have a substantial negative impact on our liquidity and could have the effect of delaying, deferring or preventing certain mergers, asset sales, other forms of business combinations or other changes of control. For example, assuming no material changes in the relevant tax law, we expect that if we experienced a change of control or the Tax Receivable Agreement were terminated immediately after this offering, the estimated lump-sum payment would be approximately $211 million (calculated using a discount rate equal to a per annum rate of LIBOR plus 100 basis points, applied against an undiscounted liability of approximately $244 million). There can be no assurance that we will be able to finance our obligations under the Tax Receivable Agreement.
50
Table of Contents
In the event that our payment obligations under the Tax Receivable Agreement are accelerated upon certain mergers, other forms of business combinations or other changes of control, the consideration payable to holders of our Class A common stock could be substantially reduced.
If we experience a change of control (as defined under the Tax Receivable Agreement), our obligation to make a substantial, immediate lump-sum payment could result in holders of our Class A common stock receiving substantially less consideration in connection with a change of control transaction than they would receive in the absence of such obligation. Further, holders of rights under the Tax Receivable Agreement may not have an equity interest in us or Vine Holdings. Accordingly, the interests of holders of rights under the Tax Receivable Agreement may conflict with those of the holders of our Class A common stock. Please read “Risk Factors—In certain cases, payments under the Tax Receivable Agreement may be accelerated and/or significantly exceed the actual benefits we realize, if any, in respect of the tax attributes subject to the Tax Receivable Agreement” and “Certain Relationships and Related Party Transactions—Tax Receivable Agreement.”
We will not be reimbursed for any payments made under the Tax Receivable Agreement in the event that any tax benefits are subsequently disallowed.
Payments under the Tax Receivable Agreement will be based on the tax reporting positions that we will determine, and the IRS or another tax authority may challenge all or part of the tax basis increases upon which payments under the Tax Receivable Agreement are based, as well as other related tax positions that we take, and a court could sustain such challenge. The holders of rights under the Tax Receivable Agreement will not reimburse us for any payments previously made under the Tax Receivable Agreement if such basis increases or other benefits are subsequently disallowed, except that excess payments made to any such holder will be netted against payments otherwise to be made, if any, to such holder after our determination of such excess. As a result, in such circumstances, we could make payments that are greater than our actual cash tax savings, if any, and may not be able to recoup those payments, which could adversely affect our liquidity.
If Vine Holdings were to become a publicly traded partnership taxable as a corporation for U.S. federal income tax purposes, we and Vine Holdings might be subject to potentially significant tax inefficiencies, and we would not be able to recover payments previously made by us under the Tax Receivable Agreement even if the corresponding tax benefits were subsequently determined to have been unavailable due to such status.
We intend to operate such that Vine Holdings does not become a publicly traded partnership taxable as a corporation for U.S. federal income tax purposes. A “publicly traded partnership” is a partnership the interests of which are traded on an established securities market or are readily tradable on a secondary market or the substantial equivalent thereof. Under certain circumstances, exchanges of Vine Units pursuant to the Exchange Right or other transfers of Vine Units could cause Vine Holdings to be treated as a publicly traded partnership. Applicable U.S. Treasury regulations provide for certain safe harbors from treatment as a publicly traded partnership, and we intend to operate such that exchanges or other transfers of Vine Units qualify for one or more such safe harbors.
If Vine Holdings were to become a publicly traded partnership, significant tax inefficiencies might result for us and for Vine Holdings, including as a result of our inability to file a consolidated U.S. federal income tax return with Vine Holdings. In addition, we would no longer have the benefit of certain increases in tax basis covered under the Tax Receivable Agreement, and we would not be able to recover any payments previously made by us under the Tax Receivable Agreement, even if the corresponding tax benefits (including any claimed increase in the tax basis of Vine Holdings’ assets) were subsequently determined to have been unavailable.
51
Table of Contents
In certain circumstances, Vine Holdings will be required to make tax distributions to us and the Vine Unit Holders, and the tax distributions that Vine Holdings will be required to make may be substantial.
Vine Holdings will be treated as a partnership for U.S. federal income tax purposes and, as such, is not subject to U.S. federal income tax. Instead, taxable income will be allocated to the Vine Unit Holders, and us. Pursuant to the VEH LLC Agreement, Vine Holdings will generally make pro rata cash distributions, or tax distributions, to us and the Vine Unit Holders, calculated using our estimated effective tax rate and taking into account our payment obligations under the Tax Receivable Agreement.
Funds used by Vine Holdings to satisfy its tax distribution obligations will not be available for reinvestment in our business. Moreover, the tax distributions that Vine Holdings will be required to make may be substantial, and may exceed (as a percentage of Vine Holdings’ income) the overall effective tax rate applicable to a similarly situated corporate taxpayer.
We expect to be a “controlled company” within the meaning of the NYSE rules and, as a result, will qualify for and could rely on exemptions from certain corporate governance requirements.
Upon completion of this offering, the Vine Energy Investment Vehicles and the Vine Energy Investment II Vehicles will collectively beneficially control a majority of the combined voting power of all classes of our outstanding voting stock. In connection with the completion of this offering, we will enter into a stockholders’ agreement, pursuant to which Blackstone, through its ownership interests in the Vine Energy Investment Vehicles and the Vine Energy Investment II Vehicles, will have certain rights with respect to the election of directors. “Certain Relationships and Related Party Transactions—Stockholders’ Agreement” contains additional information regarding these risks. As a result, we expect to be a controlled company within the meaning of the NYSE corporate governance standards. Under the NYSE rules, a company of which more than 50% of the voting power is held by another person or group of persons acting together is a controlled company and may elect not to comply with certain NYSE corporate governance requirements, including the requirements that:
| • | a majority of the board of directors consist of independent directors; |
| • | the nominating and governance committee be composed entirely of independent directors with a written charter addressing the committee’s purpose and responsibilities; |
| • | the compensation committee be composed entirely of independent directors with a written charter addressing the committee’s purpose and responsibilities; and |
| • | there be an annual performance evaluation of the nominating and governance and compensation committees. |
These requirements will not apply to us as long as we remain a controlled company. Following this offering, we may utilize some or all of these exemptions. Accordingly, you may not have the same protections afforded to stockholders of companies that are subject to all of the corporate governance requirements of the NYSE. “Management” contains additional information regarding these risks.
For as long as we are an emerging growth company, we will not be required to comply with certain reporting requirements, including disclosure about our executive compensation, that apply to other public companies.
We are classified as an “emerging growth company” under the JOBS Act. In addition, we have reduced SOX compliance requirements, as discussed elsewhere, for as long as we are an emerging growth company, which may be up to five full fiscal years. Unlike other public companies, we will not be required to, among other things, (i) comply with any new requirements adopted by the PCAOB requiring mandatory audit firm rotation or a supplement to the auditor’s report in which the auditor would be required to provide additional information about the audit and the financial statements of the issuer, (ii) provide certain disclosure regarding executive compensation required of larger public companies or (iii) hold nonbinding advisory votes on executive compensation.
52
Table of Contents
We may issue preferred stock whose terms could adversely affect the voting power or value of our Class A common stock.
Our certificate of incorporation authorizes us to issue, without the approval of our stockholders, one or more classes or series of preferred stock having such designations, preferences, limitations and relative rights, including preferences over our common stock respecting dividends and distributions, as our board of directors may determine. The terms of one or more classes or series of preferred stock could adversely impact the voting power or value of our common stock. For example, we might grant holders of preferred stock the right to elect some number of our directors in all events or on the happening of specified events or the right to veto specified transactions. Similarly, the repurchase or redemption rights or liquidation preferences we might assign to holders of preferred stock could affect the residual value of the Class A common stock.
If securities or industry analysts do not publish research or reports about our business, if they adversely change their recommendations regarding our Class A common stock or if our operating results do not meet their expectations, our stock price could decline.
The trading market for our Class A common stock will be influenced by the research and reports that industry or securities analysts publish about us or our business. If one or more of these analysts cease coverage of our company or fail to publish reports on us regularly, we could lose visibility in the financial markets, which in turn could cause our stock price or trading volume to decline. Moreover, if one or more of the analysts who cover our company downgrades our Class A common stock or if our operating results do not meet their expectations, our stock price could decline.
Because we have elected to take advantage of the extended transition period pursuant to Section 107 of the JOBS Act, our financial statements may not be comparable to those of other public companies.
Section 107 of the JOBS Act provides that an emerging growth company can use the extended transition period provided in Section 7(a)(2)(B) of the Securities Act for complying with new or revised accounting standards. This permits an emerging growth company to delay the adoption of certain accounting standards until those standards would otherwise apply to private companies. We are choosing to take advantage of this extended transition period and, as a result, we will comply with new or revised accounting standards on the relevant dates on which adoption of such standards is required for private companies. Accordingly, our financial statements may not be comparable to companies that comply with public company effective dates, and our stockholders and potential investors may have difficulty in analyzing our operating results by comparing us to such companies.
Our amended and restated certificate of incorporation will designate the Court of Chancery of the State of Delaware as the sole and exclusive forum for certain types of actions and proceedings that may be initiated by our stockholders, which could limit our stockholders’ ability to obtain a favorable judicial forum for disputes with us or our directors, officers, employees or agents.
Our amended and restated certificate of incorporation will provide that unless we consent in writing to the selection of an alternative forum, the Court of Chancery of the State of Delaware will, to the fullest extent permitted by applicable law, be the sole and exclusive forum for (i) any derivative action or proceeding brought on our behalf, (ii) any action asserting a claim of breach of a fiduciary duty owed by any of our directors, officers, employees or agents to us or our stockholders, (iii) any action asserting a claim arising pursuant to any provision of the Delaware General Corporation Law (the “DGCL”), our amended and restated certificate of incorporation or our bylaws, or (iv) any action asserting a claim against us that is governed by the internal affairs doctrine, in each such case subject to such Court of Chancery having personal jurisdiction over the indispensable parties named as defendants therein. Notwithstanding the foregoing sentence, the federal district courts of the United States of America shall be the exclusive forum for the resolution of any complaint asserting a cause of action arising under U.S. federal securities laws, including the Securities Act and the Exchange Act. This choice of forum may limit a stockholder’s ability to bring a claim in a judicial forum that it finds favorable for disputes
53
Table of Contents
with us or our directors, officers, employees or agents, which may discourage such lawsuits against us and such persons. Alternatively, if a court were to find these provisions of our amended and restated certificate of incorporation inapplicable to, or unenforceable in respect of, one or more of the specified types of actions or proceedings, we may incur additional costs associated with resolving such matters in other jurisdictions, which could adversely affect our financial condition or results of operations.
54
Table of Contents
CAUTIONARY STATEMENT REGARDING FORWARD-LOOKING STATEMENTS
The information in this prospectus includes “forward-looking statements.” All statements, other than statements of historical fact included in this prospectus, regarding our strategy, future operations, financial position, estimated revenue and losses, projected costs, prospects, plans and objectives of management are forward-looking statements. When used in this prospectus, the words “could,” “believe,” “anticipate,” “intend,” “estimate,” “expect,” “project” and similar expressions are intended to identify forward-looking statements, although not all forward-looking statements contain such identifying words. These forward-looking statements are based on our current expectations and assumptions about future events and are based on currently available information as to the outcome and timing of future events. When considering forward-looking statements, you should keep in mind the risk factors and other cautionary statements described under “Risk Factors.” These forward-looking statements are based on management’s current belief, based on currently available information, as to the outcome and timing of future events.
Forward-looking statements may include statements about:
| • | our business strategy; |
| • | our reserves; |
| • | our financial strategy, liquidity and capital required for our development program; |
| • | our realized or expected natural gas prices; |
| • | our timing and amount of future production of natural gas; |
| • | our hedging strategy and results; |
| • | our future drilling plans and cost estimates; |
| • | our competition and government regulations; |
| • | our pending legal or environmental matters; |
| • | our ability to make business acquisitions; |
| • | the impact of the COVID-19 pandemic and its effect on our business and financial condition; |
| • | general economic conditions; |
| • | credit markets; |
| • | our future operating results; and |
| • | our future plans, objectives, expectations and intentions. |
We caution you that these forward-looking statements are subject to all of the risks and uncertainties, most of which are difficult to predict and many of which are beyond our control, incident to the exploration for and development, production and sale of natural gas. These risks include, but are not limited to, commodity price volatility, lack of availability of drilling and production equipment and services, environmental risks, drilling and other operating risks, regulatory changes, the uncertainty inherent in estimating natural gas reserves and in projecting future rates of production, cash flow and access to capital, the timing of development expenditures, and the other risks described under “Risk Factors.”
Reserve engineering is a method of estimating underground accumulations of natural gas and oil that cannot be measured in an exact way. The accuracy of any reserve estimate depends on the quality of available data, the interpretation of such data and price and cost assumptions made by reserve engineers. In addition, the results of drilling, testing and production activities may justify revisions of previous estimates. If significant, such revisions would change the schedule of any further production and development drilling. Accordingly, reserve estimates may differ significantly from the quantities of natural gas and oil that are ultimately recovered.
55
Table of Contents
Should one or more of the risks or uncertainties described in this prospectus occur, or should underlying assumptions prove incorrect, our actual results and plans could differ materially from those expressed in any forward-looking statements.
All forward-looking statements, expressed or implied, included in this prospectus are expressly qualified in their entirety by this cautionary statement. This cautionary statement should also be considered in connection with any subsequent written or oral forward-looking statements that we or persons acting on our behalf may issue.
Except as otherwise required by applicable law, we disclaim any duty to update any forward-looking statements, all of which are expressly qualified by the statements in this section, to reflect events or circumstances after the date of this prospectus.
56
Table of Contents
We expect to receive approximately $303.3 million of net proceeds (assuming the midpoint of the price range set forth on the cover of this prospectus) from the sale of the Class A common stock offered by us after deducting underwriting discounts and commissions and estimated offering expenses payable by us.
We intend to use the net proceeds from this offering and borrowings under the New RBL to repay in full and terminate each of the RBL and the Brix Credit Facility.
As of December 31, 2020, we had $190.0 million of outstanding borrowings under the RBL. The RBL was extended in December 2020 to mature in January 2023. The RBL bears interest based on LIBOR plus an additional margin, based on the percentage of the revolving commitment being utilized, ranging from 2.50% to 3.50%.
As of December 31, 2020, we had $125.0 million of outstanding borrowings under the Brix Credit Facility. The Brix Credit Facility matures in March of 2023 and bears interest based on LIBOR plus an additional margin of 7.25%.
A $1.00 change in the assumed initial public offering price of $17.50 per share would cause the net proceeds from this offering, after deducting the underwriting discounts and commissions and estimated offering expenses, received by us to change, respectively, by $17.6 million, assuming no change to the number of shares offered by us, as set forth on the cover page of this prospectus. If the proceeds increase for any reason, we would use the additional net proceeds to, first, borrow less under the New RBL and, second, provide additional liquidity for general corporate purposes. If the proceeds decrease for any reason, then we expect that we would increase borrowings under the New RBL to repay in full and terminate the RBL and the Brix Credit Facility.
57
Table of Contents
We currently do not pay a cash dividend to holders of our Class A common stock. Our future dividend policy is within the discretion of our board of directors and will depend upon then-existing conditions, including our results of operations, financial condition, capital requirements, investment opportunities, statutory restrictions on our ability to pay dividends and other factors our board of directors may deem relevant. In addition, our existing debt agreements place and are expected to place certain restrictions on our ability to pay cash dividends to the holders of our Class A common stock. However to the extent our free cash flow generation results in a decrease in our overall leverage in the future, we may revisit our dividend policy and declare cash dividends on our Class A common stock.
58
Table of Contents
The following table sets forth our cash position and capitalization as of December 31, 2020:
| • | on an actual basis for our predecessor, Vine Oil & Gas; |
| • | on an as adjusted basis to give effect to the reorganization and business combination transactions described under “Corporate Reorganization”; and |
| • | on an as further adjusted basis for this share offering at an assumed IPO price of $17.50 per share (the midpoint of the range set forth on the cover of this prospectus), including the application of the net proceeds as set forth under “Use of Proceeds,” and the entry into the New RBL. |
The information set forth in the table below is illustrative only and will be adjusted based on the actual initial public offering price and other final terms of this offering. This table should be read in conjunction with, and is qualified in its entirety by reference to, “Use of Proceeds” and our financial statements and related notes appearing elsewhere in this prospectus.
| As of December 31, 2020 | ||||||||||||
| Actual | As Adjusted | As Further Adjusted | ||||||||||
| (in thousands, except shares and par value) | ||||||||||||
| Cash and cash equivalents |
$ | 15,517 | $ | 33,177 | $ | 33,177 | ||||||
|
|
|
|
|
|
|
|||||||
| Long-term debt:(1) |
||||||||||||
| Vine Oil & Gas New RBL(2) |
$ | — | $ | — | $ | 9,063 | ||||||
| Vine Oil & Gas RBL Credit Facility(3) |
190,000 | 190,000 | — | |||||||||
| Vine Oil & Gas Second Lien Term Loan |
150,000 | 150,000 | 150,000 | |||||||||
| Vine Oil & Gas Third Lien Credit Facility |
— | — | — | |||||||||
| Vine Oil & Gas 8.75% Notes |
530,000 | 530,000 | 530,000 | |||||||||
| Vine Oil & Gas 9.75% Notes |
380,000 | 380,000 | 380,000 | |||||||||
| Brix Credit Facility(4) |
— | 125,000 | — | |||||||||
|
|
|
|
|
|
|
|||||||
| Total Indebtedness |
$ | 1,250,000 | $ | 1,375,000 | $ | 1,069,063 | ||||||
|
|
|
|
|
|
|
|||||||
| Partners’ capital/stockholders’ equity: |
||||||||||||
| Partners’ capital |
$ | 10,061 | $ | — | $ | — | ||||||
| Class A Common stock—$0.01 par value; no shares authorized, issued or outstanding, actual; 350,000,000 shares authorized, 16,245,149 shares issued and outstanding, as adjusted; 34,995,149 shares issued and outstanding, as further adjusted |
— | 162 | 350 | |||||||||
| Class B Common stock—$0.01 par value; no shares authorized, issued or outstanding, actual; 150,000,000 shares authorized, 34,289,108 shares issued and outstanding, as adjusted; 34,289,108 shares issued and outstanding, as further adjusted |
— | 343 | 343 | |||||||||
| Additional paid in capital |
— | 213,181 | 367,566 | |||||||||
| Retained earnings |
— | (300 | ) | (4,811 | ) | |||||||
|
|
|
|
|
|
|
|||||||
| Total partners’ capital/stockholders’ equity |
$ | 10,061 | $ | 213,386 | $ | 363,448 | ||||||
| Non-controlling interest |
— | 208,880 | 354,544 | |||||||||
|
|
|
|
|
|
|
|||||||
| Total equity |
$ | 10,061 | $ | 422,266 | $ | 717,992 | ||||||
|
|
|
|
|
|
|
|||||||
| Total capitalization |
$ | 1,260,061 | $ | 1,797,266 | $ | 1,787,055 | ||||||
|
|
|
|
|
|
|
|||||||
| (1) | All outstanding amounts of indebtedness shown at principal amount. |
| (2) | After giving effect to the consummation of the reorganization and business combination transactions described under “Corporate Reorganization,” and the application of the net proceeds of this offering, we expect to have available capacity of $316 million (after giving effect to approximately $25 million of letters of credit to be issued at closing) based on projected as adjusted borrowings of approximately $9 million pro forma for this offering, resulting in projected liquidity of approximately $350 million as of December 31, 2020 under the New RBL facility. |
| (3) | At March 8, 2021, Vine Oil & Gas had outstanding borrowings under the RBL of $200.0 million and $24.9 million of outstanding letters of credit, resulting in $75.1 million of remaining capacity under the RBL. |
| (4) | As of March 8, 2021, Brix had outstanding borrowings under the Brix Credit Facility of $125.0 million and no outstanding letters of credit. |
59
Table of Contents
Purchasers of our Class A common stock in this offering will experience immediate and substantial dilution in the net tangible book value per share of the Class A common stock for accounting purposes. Our net tangible book value as of December 31, 2020, after giving effect to the transactions described under “Corporate Reorganization,” was $422.3 million, or $8.36 per share. Pro forma net tangible book value per share is determined by dividing our pro forma tangible net worth (tangible assets less total liabilities) by the total number of outstanding shares of Class A common stock that will be outstanding immediately prior to the closing of this offering after giving effect to our corporate reorganization. Assuming an IPO price of $17.50 per share (the midpoint of the price range set forth on the cover page of this prospectus), after giving effect to the receipt of the estimated net proceeds (after deducting estimated underwriting discounts and commissions and estimated offering expenses), our adjusted pro forma net tangible book value as of December 31, 2020 would have been approximately $718.0 million, or $10.36 per share. This represents an immediate increase in the net tangible book value of $2.01 per share to our existing stockholders and an immediate dilution (i.e., the difference between the offering price and the adjusted pro forma net tangible book value after this offering) to new investors purchasing shares in this offering of $7.14 per share. The following table illustrates the per share dilution to new investors purchasing shares in this offering (assuming that 100% of our Class B common stock has been exchanged for Class A common stock):
| IPO price per share |
$ | 17.50 | ||||||
| Pro forma net tangible book value per share as of December 31, 2020 (after giving effect to our corporate reorganization) |
$ | 8.36 | ||||||
|
|
|
|||||||
| Increase in pro forma net tangible book value per share of Class A common stock attributable to investors in this offering |
2.01 | |||||||
| As adjusted pro forma net tangible book value per share of Class A common stock after our corporate reorganization and this offering |
10.36 | |||||||
|
|
|
|||||||
| Dilution in pro forma net tangible book value per share to new investors in this offering |
$ | 7.14 | ||||||
|
|
|
A $1.00 change in the assumed initial public offering price of $17.50 per share, which is the midpoint of the price range set forth on the cover page of this prospectus, would increase our as adjusted pro forma net tangible book value per share after the offering by $0.25 and increase the dilution to new investors in this offering by $0.75 per share, assuming the number of shares offered by us, as set forth on the cover page of this prospectus, remains the same, after deducting the estimated underwriting discounts and commissions and estimated offering expenses payable by us. The following table summarizes, on an adjusted pro forma basis as of December 31, 2020, the total number of shares of Class A common stock owned by existing stockholders (assuming that 100% of our Class B common stock has been exchanged for Class A common stock) and to be owned by new investors, the total consideration paid, and the average price per share paid by our existing stockholders and to be paid by new investors in this offering at our initial public offering price of $17.50 per share, calculated before deduction of estimated underwriting discounts and commissions:
| Shares Acquired | Total Consideration | Average Price Per Share |
||||||||||||||||||
| Number | Percent | Amount | Percent | |||||||||||||||||
| (in thousands) |
||||||||||||||||||||
| Vine Energy Investment Vehicles |
34,403,394 | 49.7 | % | $ | 401,092 | 43.7 | % | $ | 11.66 | |||||||||||
| Vine Energy Investment II Vehicles |
16,130,863 | 23.3 | % | 188,062 | 20.5 | % | $ | 11.66 | ||||||||||||
| New investors in this offering |
18,750,000 | 27.0 | % | 328,125 | 35.8 | % | $ | 17.50 | ||||||||||||
|
|
|
|
|
|
|
|
|
|
|
|||||||||||
| Total |
69,284,257 | 100 | % | $ | 917,279 | 100 | % | $ | 13.24 | |||||||||||
The above tables and discussion are based on the number of shares of our Class A common stock and Class B common stock to be outstanding as of the closing of this offering. If the underwriters’ option to purchase additional shares is exercised in full, the number of shares held by new investors will be increased to 21,562,500, or approximately 29.9% of the total number of shares of Class A common stock.
60
Table of Contents
SUMMARY HISTORICAL AND UNAUDITED PRO FORMA CONDENSED COMBINED FINANCIAL INFORMATION
The following table shows summary historical financial information of our accounting predecessor, Vine Oil & Gas, and summary unaudited pro forma condensed combined financial information for the periods and as of the dates indicated.
The summary historical financial information as of and for the years ended December 31, 2020 and 2019 was derived from the audited historical financial statements of our predecessor, Vine Oil & Gas, included elsewhere in this prospectus.
The summary unaudited pro forma condensed combined statements of operations data for the year ended December 31, 2020 been prepared to give pro forma effect to (i) the reorganization transactions described under “Corporate Reorganization,” including the acquisition by Vine Oil & Gas of the Brix Companies, and (ii) this offering and the application of the net proceeds from this offering, as if the reorganization and offering transactions had been completed on January 1, 2020. The summary unaudited pro forma condensed combined balance sheet as of December 31, 2020 has been prepared to give pro forma effect to these transactions as if they had been completed on December 31, 2020. This information is subject to and gives effect to the assumptions and adjustments described in the notes accompanying the unaudited pro forma condensed combined financial statements included elsewhere in this prospectus. The summary unaudited pro forma condensed combined financial information is presented for informational purposes only and should not be considered indicative of actual results of operations that would have been achieved had the reorganization and this offering been consummated on the dates indicated, and do not purport to be indicative of our financial position or results of operations as of any future date or for any future period.
61
Table of Contents
“Use of Proceeds,” “Management’s Discussion and Analysis of Financial Condition and Results of Operations,” “Corporate Reorganization,” “Unaudited Pro Forma Condensed Combined Financial Statements,” and the historical financial statements included elsewhere in this prospectus contain additional information to be read in conjunction with the following information.
| Vine Oil & Gas | Vine Pro Forma | |||||||||||
| As of and for the Year Ended December 31, |
As of and for the Year Ended December 31, 2020 |
|||||||||||
| 2020 | 2019 | |||||||||||
| (in thousands, except share and per share data) |
||||||||||||
| Statements of Operations Information: |
||||||||||||
| Revenue: |
||||||||||||
| Natural gas sales |
$ | 418,877 | $ | 445,589 | $ | 571,144 | ||||||
| Realized gain on commodity derivatives |
123,875 | 39,679 | 161,918 | |||||||||
| Unrealized gain (loss) on commodity derivatives |
(164,077 | ) | 101,239 | (204,552 | ) | |||||||
|
|
|
|
|
|
|
|||||||
| Total revenue |
378,675 | 586,507 | 528,510 | |||||||||
| Operating Expenses: |
||||||||||||
| Lease operating |
47,911 | 46,247 | 65,639 | |||||||||
| Gathering and treating |
76,770 | 37,955 | 101,974 | |||||||||
| Production and ad valorem taxes |
15,620 | 18,539 | 18,335 | |||||||||
| General and administrative |
7,448 | 7,842 | 15,014 | |||||||||
| Monitoring fee |
7,541 | 7,011 | — | |||||||||
| Depletion, depreciation and accretion |
347,652 | 327,659 | 392,141 | |||||||||
| Exploration |
167 | 886 | 193 | |||||||||
| Strategic |
2,182 | 853 | 2,284 | |||||||||
| Severance |
326 | — | 447 | |||||||||
| Write-off of deferred IPO expenses |
5,787 | 2,825 | 5,787 | |||||||||
|
|
|
|
|
|
|
|||||||
| Total operating expenses |
511,404 | 449,817 | 601,814 | |||||||||
|
|
|
|
|
|
|
|||||||
| Operating Income |
(132,729 | ) | 136,690 | (73,304 | ) | |||||||
| Interest expense |
(119,248 | ) | (112,198 | ) | (121,128 | ) | ||||||
|
|
|
|
|
|
|
|||||||
| Income Before Income Taxes |
(251,977 | ) | 24,492 | (194,432 | ) | |||||||
| Income tax provision |
(217 | ) | (496 | ) | (217 | ) | ||||||
|
|
|
|
|
|
|
|||||||
| Net Income |
$ | (252,194 | ) | $ | 23,996 | $ | (194,649 | ) | ||||
|
|
|
|
|
|
|
|||||||
| Net income attributable to non-controlling interests |
(96,333 | ) | ||||||||||
|
|
|
|||||||||||
| Net Income Attributable to Vine Energy Inc. |
$ | (98,316 | ) | |||||||||
|
|
|
|||||||||||
| Net Income per Share: |
||||||||||||
| Basic |
$ | (2.81 | ) | |||||||||
|
|
|
|||||||||||
| Diluted |
$ | (2.81 | ) | |||||||||
|
|
|
|||||||||||
| Weighted Average Shares Outstanding: |
||||||||||||
| Basic |
34,995,149 | |||||||||||
|
|
|
|||||||||||
| Diluted |
34,995,149 | |||||||||||
|
|
|
|||||||||||
| Balance Sheet Information: |
||||||||||||
| Cash and cash equivalents |
$ | 15,517 | $ | 18,286 | $ | 33,177 | ||||||
| Total natural gas properties, net |
1,342,354 | 1,435,976 | 1,873,982 | |||||||||
| Total assets |
1,467,763 | 1,658,100 | 2,036,019 | |||||||||
| Total debt |
1,224,741 | 1,218,558 | 1,050,235 | |||||||||
| Total equity(1) |
10,061 | 292,255 | 717,992 | |||||||||
| Statements of Cash Flows Information: |
||||||||||||
| Net cash provided by operating activities |
$ | 295,174 | $ | 270,699 | ||||||||
| Net cash used in investing activities |
(252,378 | ) | (281,193 | ) | ||||||||
| Net cash provided by (used in) financing activities |
(45,565 | ) | 7,750 | |||||||||
| Other Financial Information: |
||||||||||||
| Adjusted EBITDAX(2) |
$ | 384,713 | $ | 338,571 | $ | 529,351 | ||||||
| Levered free cash flow(2) |
$ | 42,796 | $ | (10,494 | ) | |||||||
| (1) | Pro forma total equity as of December 31, 2020 includes $354.5 million of non-controlling interests related to the Vine Energy Investment Vehicles. |
| (2) | Adjusted EBITDAX and levered free cash flow are not financial measures calculated in accordance with GAAP. We believe these measures provide important perspective regarding our operating results and liquidity, as applicable. “Prospectus Summary—Non-GAAP Financial Measures” contains a description of each of these measures and a reconciliation to the most directly comparable GAAP measure. |
62
Table of Contents
MANAGEMENT’S DISCUSSION AND ANALYSIS OF FINANCIAL CONDITION AND RESULTS OF OPERATIONS
The following should be read in conjunction with our financial statements and related notes appearing elsewhere in this prospectus. The following discussion contains “forward-looking statements” that reflect our future plans, estimates, beliefs and expectations. We caution that assumptions, expectations, projections, intentions or beliefs about future events may vary materially from actual results. Some of the key factors that could cause actual results to vary from our expectations include those factors discussed below and elsewhere in this prospectus, all of which are difficult to predict. In light of these risks, uncertainties and assumptions, the forward-looking events discussed may not occur. “Cautionary Statement Regarding Forward-Looking Statements” and “Risk Factors” (included elsewhere in this prospectus) contain important information. We do not undertake any obligation to publicly update any forward-looking statements except as otherwise required by applicable law. Unless otherwise indicated, the historical financial information presented in “Management’s Discussion and Analysis of Financial Condition and Results of Operations” speaks only with respect to our predecessor, Vine Oil & Gas, and does not give pro forma effect to our corporate reorganization described in “Corporate Reorganization.”
Overview
Vine Oil & Gas is a pure play natural gas company focused solely on the development of natural gas properties in the stacked Haynesville and Mid-Bossier shale plays in the Haynesville Basin of Northwest Louisiana. As of December 31, 2020, we have approximately 100,000 net surface acres centered in what we believe to be the core of the Haynesville and Mid-Bossier plays. Over 90% of our acreage is held by production, and we operate approximately 95% of our future drilling locations. As of December 31, 2020, we had approximately 330 net producing wells. Our assets are located almost entirely in Red River, DeSoto and Sabine parishes of Northwest Louisiana, which according to Enverus, have consistently demonstrated higher EURs relative to drilling and completion (“D&C”) costs than the Haynesville and Mid-Bossier plays in Texas and other parishes in Louisiana. Approximately 85% of our acreage is prospective for dual-zone development, providing us with approximately 800 drilling locations. Utilizing an average of 4 gross rigs, we have approximately 22 years of development opportunities.
Market Conditions and Operational Trends
The oil and gas industry is cyclical and commodity prices are highly volatile. Spot prices for Henry Hub generally ranged from $1.50 per MMBtu to $4.75 per MMBtu since 2014. We expect that this market will continue to be volatile in the future. The prices we receive for our production, and the levels of our production, depend on numerous factors beyond our control. We use our derivative portfolio and firm sales contracts to mitigate the risks of price volatility.
Our Second Lien Term Loan requires that we hedge 70% of our production for the next 24 months. By virtue of this hedging requirement, we are impacted less by gas price volatility during this time frame than future periods where a smaller percentage of our production is subject to derivative contracts. We believe our balance sheet and hedge program provide ample liquidity in the event of an adverse commodity price environment to enable us to continue to generate levered free cash flow.
Reduction in oil and gas activity has resulted in a decrease of associated gas production as fewer oil wells are drilled in the Permian Basin and other liquids-weighted basins, which has led to a contraction in domestic gas supply. Lower levels of supply have pushed current and forecasted gas prices higher. We expect that the reduction in drilling activity and rig counts may contribute to a shortage in the supply of natural gas in the future, which could result in higher gas prices.
To the extent, however, that natural gas prices decrease, these lower prices not only reduce our revenue and cash flows, but also may limit the amount of natural gas that we can develop economically and therefore
63
Table of Contents
potentially lower our proved reserves. Lower commodity prices in the future could also result in impairments of our natural gas properties. The occurrence of any of the foregoing could materially and adversely affect our future business, financial condition, results of operations, operating cash flows, liquidity or ability to fund planned CapEx. Alternatively, natural gas prices may increase, which while increasing revenue and cash flows would result in significant losses being incurred on our derivatives.
We believe domestic gas macro fundamentals are positively disposed in the near-to-intermediate term as lower oil-focused drilling activity will lead to lower associated gas production resulting in a tighter market and higher prices than current levels.
Additionally, the oil and gas industry is subject to a number of operational trends, some of which are particularly prominent in the Haynesville Basin, where companies are increasingly utilizing new techniques to lower D&C costs per lateral foot and enhance new well economics, including using more proppant and water per lateral foot, increasing use of longer laterals, and increased automation to reduced drilling time and costs.
Historically, we have seen inflationary pressure on certain service costs; however, we have been able to partially mitigate these cost increases through improved cycle times, longer laterals and other efficiencies. In 2020, we saw reduced service costs due to the recent industry downturn and expect these costs to continue for the remainder of 2021.
Evaluating Our Operations
We use the following metrics to assess the performance of our natural gas operations:
| • | reserve and production levels; |
| • | realized prices on the sale of our production, including derivative effects; |
| • | lease operating expenses; |
| • | Adjusted EBITDAX; |
| • | D&C costs per well and per lateral foot drilled and overall CapEx levels; and |
| • | levered free cash flow. |
Production Levels and Sources of Revenue
We derive our revenue from the sale of our natural gas production and sales volumes directly impact our results of operations. As reservoir pressures decline with a well’s age, production from a given well decreases. Growth in our future production and reserves will depend on our continued ability to add proved reserves in excess of our production. Accordingly, we plan to maintain our focus on adding reserves through organic drill-bit growth as well as opportunistically through acquisitions. Our ability to add reserves through development projects and acquisitions is dependent on many factors, including our gas prices, capital availability, regulatory approvals and ability to procure equipment, services, and personnel and successfully execute the development program or acquisitions.
Increases or decreases in our revenue, profitability and future production growth are highly dependent on the commodity prices we receive. Natural gas prices are market driven and have been historically volatile, and we expect that future prices will continue to fluctuate due to supply and demand factors, seasonality and geopolitical and economic factors. We believe that higher volumes of natural gas will be produced or sold in the Gulf Coast region, but we also expect that higher demand from industrial expansion and export growth will cause the Gulf Coast markets to stabilize and our differentials to NYMEX will remain close to the current range and significantly better than differentials other basins have experienced. To mitigate the variability in differentials, we have entered into multiple physical firm sales contracts at fixed differentials to NYMEX.
64
Table of Contents
The following table summarizes the changes in commodity prices:
| For the Year Ended December 31, |
||||||||
| 2020 | 2019 | |||||||
| ($ / MMBtu) | ||||||||
| NYMEX Henry Hub High |
$ | 3.00 | $ | 3.64 | ||||
| NYMEX Henry Hub Low |
$ | 1.50 | $ | 2.14 | ||||
| Differential to Average NYMEX Henry Hub(1) |
$ | (0.19 | ) | $ | (0.19 | ) | ||
| (1) | Our differential is calculated by comparing the average NYMEX Henry Hub price to our volume weighted average realized price per MMBtu. |
We utilize an unaffiliated third party to market a portion of our gas production to various purchasers, which consist of credit-worthy counterparties, including utilities, LNG producers, industrial consumers, major corporations and super majors, in our industry. This third party collects directly from the purchasers and remits to us the total of all amounts collected on our behalf less their fee for making such sales. Additionally, we sell a portion of our gas to purchasers who remit directly to us under firm sales contracts. We do not believe the loss of any customer would have a material adverse effect on our business, as other customers or markets are currently accessible to us.
Principal Components of our Cost Structure
Lease operating expense. Lease operating expenses (“LOE”) are the costs incurred in the operation of producing properties, including workover costs. Expenses for utilities, direct labor, gas treatment, water disposal, materials and supplies comprise the most significant portion of our LOE. Certain items, such as direct labor and materials and supplies, generally remain relatively fixed across broad production volume ranges, but can fluctuate depending on activities performed during a specific period. For instance, repairs to our well equipment or surface facilities result in increased LOE in periods during which they are performed. Certain of our operating cost components are variable and change in correlation to our production levels. For example, the disposal of produced water usually increases in connection with increased production. Also, we monitor our LOE in absolute dollar terms and on a per Mcf basis to assess our performance and to determine if any wells or properties should be shut in, repaired or recompleted.
Gathering and treating. These are costs incurred to gather and move our gas to third-party treating facilities and to treat the gas to meet pipeline specification. Such costs include the fees paid to third parties who operate low- and high-pressure gathering systems that gather our natural gas. These costs are generally determined on a MMBtu basis as specified in the underlying contract.
Production and ad valorem taxes. Production taxes are paid on produced natural gas based on rates established by Louisiana and the amount of gas produced. We currently benefit from a severance tax holiday program, enacted by the State of Louisiana, which provides new wells with an exemption from severance taxes for the earlier of two years from the date of first production or until the well reaches payout. In general, the production taxes we pay correlate to the changes in natural gas revenue, although Louisiana sets rates annually each July. Effective July 1, 2020 through June 30, 2021, the production tax rate on non-exempt production is $0.0934 per Mcf. We are also subject to ad valorem taxes in the parishes where our production is located. Ad valorem taxes are assessed according to formula developed by the parishes based upon well cost and value of equipment.
General and administrative. General and administrative (“G&A”) expenses are costs incurred for overhead, including payroll and benefits for our corporate staff, costs of maintaining our headquarters, IT expenses, legal, audit and other fees for professional services. G&A expenses are offset by recoveries for overhead that are billed
65
Table of Contents
to our joint-interest partners as outlined in the JOA or other similar documents. As the Vine Energy Investment Vehicles and Vine Energy Investment II Vehicles sell their ownership of common stock in the future, we will recognize non-cash compensation charges to the extent distributions are made by those investment vehicles to any Management Members.
Depreciation, depletion and accretion. Depreciation, depletion and accretion (“DD&A”) includes the systematic expensing of the capitalized costs incurred to acquire and develop natural gas. As a “successful efforts” company, we capitalize all costs associated with our acquisition and successful development efforts and allocate these costs to each unit of production using the units of production method. We recognize accretion expense for the impact of increasing the discounted gas gathering liability as time passes. We also recognize accretion expense for the impact of increasing the discounted ARO to its estimated settlement value.
Exploration expense. These costs include seismic, geologic and geophysical studies, drilling of test wells in new areas of the basin as well as the results of any unsuccessful drilling.
Interest expense. We have financed a portion of our working capital requirements and property acquisitions with borrowings under our debt instruments. As a result, we incur interest expense that is affected by fluctuations in interest rates and, in the case of the RBL, New RBL and Second Lien Term Loan, based on outstanding borrowings. Our 8.75% Notes and 9.75% Notes have fixed interest rates. We expect that we would see an immediate reduction in cash interest expense following the completion of this offering and could see further reductions in cash interest expense as we use free cash flow to lower debt.
Strategic expense. These costs include amounts paid to external parties for potential acquisitions or other projects.
IPO related costs. The costs we have incurred related to this offering have been captured on our balance sheet in prepaid and other assets. Upon completion of this offering, these costs will be offset against proceeds received.
Adjusted EBITDAX
We believe Adjusted EBITDAX is useful because it makes for easier comparison of our operating performance, without regard to our financing methods, corporate form or capital structure. We determined our adjustments from net income to arrive at Adjusted EBITDAX to reflect the substantial variance in practice from company to company within our industry depending upon accounting methods and book values of assets, capital structures and the method by which the assets were acquired. Adjusted EBITDAX should not be considered more meaningful than net income determined in accordance with GAAP. Certain items excluded from Adjusted EBITDAX are significant components in understanding and assessing a company’s financial performance, such as a company’s cost of capital and tax burden, as well as the historic costs of depreciable assets, none of which are components of Adjusted EBITDAX. Our presentation of Adjusted EBITDAX should not be construed as an inference that our results will be unaffected by unusual or non-recurring items. Our computations of Adjusted EBITDAX differ from other similarly titled measures of other companies.
Levered Free Cash Flow
We define levered free cash flow as the amount of money we have remaining after paying our financial obligations related to investing activities prior to considering any funds received from or paid for financing activities. We calculate levered free cash flow as net cash provided by operating activities less net cash used in investing activities.
We believe that levered free cash flow is a useful performance measure as it provides the amount of cash we generated after capital expenditures and any proceeds received from asset sales, prior to any proceeds received
66
Table of Contents
from or used in financing activities. While levered free cash flow is a non-GAAP measure, it is derived from two GAAP measures, operating cash flow and investing cash flow but should not be considered as an alternative to, or more meaningful than, net cash provided by operating activities or net cash used in investing activities determined in accordance with GAAP. Our computation of levered free cash flow may differ from other similarly titled measures of other companies.
| Vine Oil & Gas | Vine Pro Forma |
|||||||||||
| For the Year Ended December 31, |
For the Year Ended December 31, 2020 |
|||||||||||
| 2020 | 2019 | |||||||||||
| (in thousands) | ||||||||||||
| Net income |
$ | (252,194 | ) | $ | 23,996 | $ | (194,649 | ) | ||||
| Interest expense |
119,248 | 112,198 | 121,128 | |||||||||
| Income tax provision |
217 | 496 | 217 | |||||||||
| Depletion, depreciation and accretion |
347,652 | 327,659 | 392,141 | |||||||||
| Unrealized (gain) loss on commodity derivatives |
164,077 | (101,239 | ) | 204,552 | ||||||||
| Exploration |
167 | 886 | 193 | |||||||||
| Non-cash G&A |
(182 | ) | (18 | ) | (182 | ) | ||||||
| Strategic |
2,182 | 853 | 2,284 | |||||||||
| Non-cash write-off of deferred IPO costs |
5,787 | 2,825 | 5,787 | |||||||||
| Severance |
326 | — | 447 | |||||||||
| Non-cash volumetric and production adjustment to gas gathering liability |
(2,567 | ) | (29,085 | ) | (2,567 | ) | ||||||
|
|
|
|
|
|
|
|||||||
| Adjusted EBITDAX |
$ | 384,713 | $ | 338,571 | $ | 529,351 | ||||||
|
|
|
|
|
|
|
|||||||
| Operating cash flow |
$ | 295,174 | $ | 270,699 | ||||||||
| Investing cash flow |
(252,378 | ) | (281,193 | ) | ||||||||
|
|
|
|
|
|||||||||
| Levered free cash flow |
42,796 | (10,494 | ) | |||||||||
|
|
|
|
|
|||||||||
Drilling and Completion Costs and Capital Expenditures
We evaluate our D&C costs by considering the absolute cost to drill and complete a well, as well as the cost on a per lateral foot basis. Moreover, we evaluate the level of reserves developed per dollar spent in connection with that development to measure our capital efficiency. So long as these metrics continue to meet our expectations, we expect our overall CapEx levels to support an average 3-4 gross drilling rig program. Our capital efficiency is one of the key metrics we use to manage our business.
Factors That Significantly Affect Comparability of Our Financial Condition and Results of Operations
Our historical financial condition and results of operations for the periods presented may not be comparable, either from period to period or going forward, for the following reasons:
Public Company Expenses. Upon completion of this offering, we expect to incur direct, incremental G&A expenses as a result of being publicly traded, including costs associated with Exchange Act compliance, tax compliance, PCAOB support fees, SOX compliance costs, investor relations activities, listing fees, registrar and transfer agent fees, stock-based compensation, incremental director and officer liability insurance costs and independent director compensation. We estimate these direct, incremental G&A expenses could total approximately $10 million to $12 million per year, which are not included in our historical results of operations. We anticipate these effects will be mitigated by additional recoveries associated with our expanded operated well count and the elimination of our monitoring fee paid to our existing owners.
Corporate Reorganization. The historical consolidated financial statements included in this prospectus are based on the financial statements of our predecessor, prior to our reorganization in connection with this offering
67
Table of Contents
as described in “Corporate Reorganization.” Our historical financial data may not yield an accurate indication of what our actual results would have been if those transactions had been completed at the beginning of the periods presented or of what our future results of operations are likely to be. Most of our compensation expense for Class A Units is treated as a liability award under GAAP. If, by virtue of this offering or future events, our outstanding Class A Units vest as a result of the change of control provisions of such units and a payment to the Class A unitholders becomes probable, we could have an immediate recognition of compensation expense arising from them.
Monitoring fee. Monitoring fees are paid pursuant to a management and consulting agreement with Blackstone and our CEO, of which over 99% is attributable to Blackstone. Our monitoring fee will be eliminated upon completion of this offering.
Interest Expense. In connection with this offering, we expect to materially reduce our indebtedness. Depending on our use of proceeds, we expect an immediate reduction in cash interest expense and could see further reductions in cash interest expense as we use free cash flow to lower debt.
Income Taxes. Our predecessor is a limited partnership not subject to federal income taxes. Accordingly, no provision for federal income taxes has been provided for in our historical results of operations because taxable income was passed through to our partners. Although we are a corporation under the Internal Revenue Code, we do not expect to report any income tax benefit or expense prior to the consummation of this offering.
68
Table of Contents
Results of Operations for Vine Oil & Gas
| For the Year Ended December 31, | ||||||||||||||||
| 2020 | 2019 | |||||||||||||||
| (in thousands, except per Mcf) | ||||||||||||||||
| Production: |
||||||||||||||||
| Total (MMcf) |
240,869 | 200,214 | ||||||||||||||
| Average Daily (MMcfd) |
658 | 549 | ||||||||||||||
| Per Mcf | Per Mcf | |||||||||||||||
| Revenue: |
||||||||||||||||
| Natural gas sales |
$ | 418,877 | $ | 1.74 | $ | 445,589 | $ | 2.23 | ||||||||
| Realized gain on commodity derivatives |
123,875 | 0.51 | 39,679 | 0.20 | ||||||||||||
| Unrealized (loss) gain on commodity derivatives |
(164,077 | ) | (0.68 | ) | 101,239 | 0.51 | ||||||||||
|
|
|
|
|
|
|
|
|
|||||||||
| Total revenue |
378,675 | 1.57 | 586,507 | 2.93 | ||||||||||||
| Operating Expenses: |
||||||||||||||||
| Lease operating |
47,911 | 0.20 | 46,247 | 0.23 | ||||||||||||
| Gathering and treating |
76,770 | 0.32 | 37,955 | 0.19 | ||||||||||||
| Production and ad valorem taxes |
15,620 | 0.06 | 18,539 | 0.09 | ||||||||||||
| General and administrative |
7,448 | 0.03 | 7,842 | 0.04 | ||||||||||||
| Monitoring fee |
7,541 | 0.03 | 7,011 | 0.04 | ||||||||||||
| Depreciation, depletion and accretion |
347,652 | 1.44 | 327,659 | 1.64 | ||||||||||||
| Exploration |
167 | 0.00 | 886 | 0.00 | ||||||||||||
| Strategic |
2,182 | 0.01 | 853 | 0.00 | ||||||||||||
| Severance |
326 | 0.00 | — | — | ||||||||||||
| Write-off of deferred IPO costs |
5,787 | 0.02 | 2,825 | 0.01 | ||||||||||||
|
|
|
|
|
|
|
|
|
|||||||||
| Total operating expenses |
511,404 | 2.11 | 449,817 | 2.25 | ||||||||||||
|
|
|
|
|
|||||||||||||
| Operating income |
(132,729 | ) | 136,690 | |||||||||||||
|
|
|
|
|
|||||||||||||
| Interest expense |
(119,248 | ) | (112,198 | ) | ||||||||||||
| Income tax provision |
(217 | ) | (496 | ) | ||||||||||||
|
|
|
|
|
|||||||||||||
| Total other expenses |
(119,465 | ) | (112,694 | ) | ||||||||||||
|
|
|
|
|
|||||||||||||
| Net income |
$ | (252,194 | ) | $ | 23,996 | |||||||||||
|
|
|
|
|
|||||||||||||
| Interest expense |
119,248 | 112,198 | ||||||||||||||
| Income tax provision |
217 | 496 | ||||||||||||||
| Depreciation, depletion and accretion |
347,652 | 327,659 | ||||||||||||||
| Unrealized loss (gain) on commodity derivatives |
164,077 | (101,239 | ) | |||||||||||||
| Exploration |
167 | 886 | ||||||||||||||
| Non-cash G&A |
(182 | ) | (18 | ) | ||||||||||||
| Strategic |
2,182 | 853 | ||||||||||||||
| Severance |
326 | — | ||||||||||||||
| Non-cash write-off of deferred IPO costs |
5,787 | 2,825 | ||||||||||||||
| Non-cash volumetric and production adjustment to gas gathering liability |
(2,567 | ) | (29,085 | ) | ||||||||||||
|
|
|
|
|
|||||||||||||
| Adjusted EBITDAX |
$ | 384,713 | $ | 338,571 | ||||||||||||
|
|
|
|
|
|||||||||||||
69
Table of Contents
Revenue
Natural Gas Sales and Realized Commodity Derivatives
The following table summarizes the changes in our natural gas sales and realized derivative effects (in thousands):
| 2019 |
$ | 485,268 | ||
| Volume |
90,481 | |||
| Price |
(117,193 | ) | ||
| Realized derivative |
84,196 | |||
|
|
|
|||
| 2020 |
$ | 542,752 | ||
|
|
|
The increase in natural gas volume for 2020 was primarily the result of additional producing wells. The price decrease for 2020 was driven by the decline in the Henry Hub price upon which our sales price is generally determined.
Since commodity prices were below the weighted average floor prices of our derivative portfolio, we realized a net gain on our natural gas derivatives during 2020. The average prices of natural gas in our commodity derivative contracts for 2020 and 2019 were $2.71 and $2.86 per MMBtu, respectively. Additionally, our total volumes hedged for 2020 and 2019 were each approximately 90% of net gas produced.
As our production volumes fluctuate, we would expect our revenue to also fluctuate, depending on prevailing natural gas prices.
Unrealized Gain (Loss) On Commodity Derivatives
We had an unrealized loss on our commodity derivative contracts in 2020 and an unrealized gain in 2019. The unrealized loss in 2020 is primarily related to an increase in the NYMEX natural gas futures as well as a decline in our average hedge price from December 31, 2019 while the unrealized gain in 2019 was primarily related to the decrease in NYMEX natural gas futures relative to December 31, 2018.
Operating Expenses
Lease Operating
LOE for 2020 compared to 2019 was down $0.03 per Mcf primarily due to reduced costs for gas treatment and water disposal. After a spike in our gas treatment and water disposal costs in 2019, we started to realize gas treatment cost savings following the replacement of individual well gas treatment equipment with a more efficient, multi-well amine treating facilities that were brought online in 2020. We also developed our third saltwater disposal facility and brought online two saltwater gathering lines resulting in decreased rates on water hauling and disposal costs and direct control over the majority of our water volumes.
We expect that our LOE will increase in the future as additional wells are brought online but may decrease on a unit cost basis as production increases since a portion of our LOE is fixed.
Gathering and Treating
| For the Year Ended December 31, | ||||||||||||||||
| 2020 | 2019 | |||||||||||||||
| (in thousands) | Per Mcf | (in thousands) | Per Mcf | |||||||||||||
| Gathering — Cash |
$ | 78,578 | $ | 0.33 | $ | 66,181 | $ | 0.33 | ||||||||
| Gathering — noncash |
(2,567 | ) | (0.01 | ) | (29,085 | ) | (0.15 | ) | ||||||||
| Other |
759 | — | 859 | — | ||||||||||||
|
|
|
|
|
|
|
|
|
|||||||||
| Total |
$ | 76,770 | $ | 0.32 | $ | 37,955 | $ | 0.19 | ||||||||
|
|
|
|
|
|
|
|
|
|||||||||
70
Table of Contents
Gathering and treating expense increased in 2020 on an absolute and unit cost basis. Our cash gathering fees increased $12.4 million due to higher volumes but were flat on a per Mcf basis in 2020. On a per Mcf basis, non-cash gathering expenses decreased because we met all obligations on our gas gathering liability in the first quarter of 2020 and consequently recorded the last non-cash gains at that time with no payments required in 2019 or 2020 on our minimum volume gathering commitment.
Production and Ad Valorem Taxes
| For the Year Ended December 31, | ||||||||||||||||
| 2020 | 2019 | |||||||||||||||
| (in thousands) | Per Mcf | (in thousands) | Per Mcf | |||||||||||||
| Production taxes |
$ | 9,957 | $ | 0.04 | $ | 13,292 | $ | 0.06 | ||||||||
| Ad valorem taxes |
5,663 | 0.02 | 5,247 | 0.03 | ||||||||||||
|
|
|
|
|
|
|
|
|
|||||||||
| Total |
$ | 15,620 | $ | 0.06 | $ | 18,539 | $ | 0.09 | ||||||||
|
|
|
|
|
|
|
|
|
|||||||||
Production and ad valorem taxes decreased $2.9 million in 2020 compared to 2019. Production taxes were down $0.02 per Mcf primarily because the state of Louisiana dropped the severance tax rate from $.125 per Mcf to $.0934 per Mcf in the third quarter of 2020. Additionally, the increased production volume in 2020 is production tax exempt whereas 2019 included production volumes where more wells had met payout and no longer qualified for the production tax exemptions.
We expect our production and ad valorem tax to increase in the future as we develop our assets and increase the number of producing wells on which such taxes are levied. We expect these new wells will continue to qualify for early life production tax exemptions, and we expect our production tax costs will increase in absolute terms as wells meet payout and are no longer production tax exempt. Production taxes are paid on produced natural gas based on rates established annually by the state of Louisiana.
G&A
| For the Year Ended December 31, | ||||||||
| 2020 | 2019 | |||||||
| (in thousands) | ||||||||
| Wages and benefits |
$ | 25,091 | $ | 23,301 | ||||
| Professional services |
2,924 | 2,498 | ||||||
| Licenses, fees and other |
7,504 | 7,287 | ||||||
|
|
|
|
|
|||||
| Total gross G&A expense |
35,519 | 33,086 | ||||||
| Less: |
||||||||
| Allocations to affiliates |
(9,108 | ) | (8,722 | ) | ||||
| Recoveries |
(18,963 | ) | (16,522 | ) | ||||
|
|
|
|
|
|||||
| Net G&A expense |
$ | 7,448 | $ | 7,842 | ||||
|
|
|
|
|
|||||
The increase in gross G&A expense for 2020 was primarily due to increased headcount in the Plano office and related compensation as well as increased professional services. While net G&A expense in 2020 decreased relative to 2019, as recoveries were higher in 2020 and were attributable to increased producing well count and inflationary rate adjustments.
Write-off of Deferred IPO Costs
In conjunction with a possible initial public offering (“IPO”), costs incurred related to the IPO such as legal, audit, tax and other professional services are capitalized as deferred equity issuance costs in other non-current
71
Table of Contents
assets. In the first quarter of 2020, we wrote-off deferred IPO costs related to years that will no longer be presented in any future potential filings. In the fourth quarter of 2020, we incurred new costs related to a possible IPO and included them in prepaid and other assets.
Monitoring Fee
The increase in monitoring fee for 2020 is due to higher Adjusted EBITDAX with payments pursuant to a management and consulting agreement with Blackstone and our CEO. The monitoring fee is based on Adjusted EBITDAX, and we anticipate monitoring fees will increase in the future if we generate more Adjusted EBITDAX. The monitoring fee will cease upon completion of this offering.
Strategic
These costs include amounts paid to external parties for potential acquisitions or other projects.
DD&A
| For the Year Ended December 31, | ||||||||||||||||
| 2020 | 2019 | |||||||||||||||
| (in thousands) | Per Mcf | (in thousands) | Per Mcf | |||||||||||||
| Depletion |
$ | 340,423 | $ | 1.41 | $ | 319,456 | $ | 1.60 | ||||||||
| Depreciation |
5,351 | 0.02 | 4,405 | 0.02 | ||||||||||||
| Accretion |
1,878 | 0.01 | 3,798 | 0.02 | ||||||||||||
|
|
|
|
|
|
|
|
|
|||||||||
| Total |
$ | 347,652 | $ | 1.44 | $ | 327,659 | $ | 1.64 | ||||||||
|
|
|
|
|
|
|
|
|
|||||||||
The increase in DD&A in 2020 is due to increased production. The increase in deprecation is primarily associated with the new saltwater disposal facilities and lower allocation of depreciation to affiliates in 2020. The decrease in accretion expense is related to the extinguishment of the gas gathering liability.
The per MCF decrease in depletion expense for 2020 is attributable to a lower depletion rate primarily due to higher December 31, 2019 proved reserves. We expect our depletion rate will fluctuate in the future based on levels of CapEx incurred to develop our assets and changes in proved reserve levels.
Interest Expense
| For the Year Ended December 31, | ||||||||
| 2020 | 2019 | |||||||
| (in thousands) | ||||||||
| Cash interest: |
||||||||
| Interest costs and unutilized fees |
$ | 96,190 | $ | 98,869 | ||||
| Realized gain on interest rate swaps |
— | (1,404 | ) | |||||
| Letter of credit fees and other |
943 | 875 | ||||||
|
|
|
|
|
|||||
| Total cash interest |
97,133 | 98,340 | ||||||
| Non-cash interest: |
||||||||
| Non-cash interest |
17,606 | 12,384 | ||||||
| Non-cash loss on extinguishment of Superpriority Facility |
4,509 | — | ||||||
| Unrealized loss on interest rate swaps |
— | 1,474 | ||||||
|
|
|
|
|
|||||
| Total non-cash interest |
22,115 | 13,858 | ||||||
|
|
|
|
|
|||||
| Total interest expense |
$ | 119,248 | $ | 112,198 | ||||
|
|
|
|
|
|||||
72
Table of Contents
The decrease in cash interest costs on debt outstanding for 2020 is attributable to LIBOR decreases on the Superpriority Facility and RBL and unutilized commitment fees on the Second Lien Credit Facility and higher borrowings on the RBL. Non-cash interest on debt outstanding includes amortization of deferred financing costs and original issue discount and is higher for 2020 due to additional amortization related to the First Lien extension, addition of the Second Lien in the fourth quarter of 2020, a non-cash loss on extinguishment of $4.5 million related to the write-off of remaining deferred financing costs and discount on the Superpriority loan.
Our interest rate swap expired in June 2019.
Capital Resources and Liquidity
Our development activities require us to make significant operating and capital expenditures. Our primary use of capital has historically been for the development of natural gas properties. In addition, we regularly evaluate our capital structure and opportunities to manage our liabilities, as well as other strategic transactions that we believe to be credit accretive.
We expect the 2021 capital program of our predecessor, Vine Oil & Gas LP, to be approximately $230 to $240 million of which $210 to $220 million is allocated for D&C operations. The remaining $20 million of its capital program is designated for non-D&C items. We expect our 2021 capital program for Vine Energy Inc. and its subsidiaries following this offering and the combinations to be approximately $340 to $350 million of which $310 to $320 million is allocated for D&C operations. The remaining $30 million of its capital program is designated for non-D&C items.
We plan to fund our 2021 CapEx through cash flow from operations, excess proceeds from this offering (if any) and borrowings under our New RBL. Further, we intend to monitor conditions in the debt capital markets and may determine to issue long-term debt securities, including potentially in the near term, to fund a portion of our 2021 CapEx or refinance a portion of our existing indebtedness. We cannot predict with certainty the timing, amount and terms of any future issuances of any such debt securities.
In July 2020, a committee of independent members from Vine’s Board of Managers approved a $30 million distribution to Vine Oil & Gas Parent LP, a wholly owned subsidiary of Blackstone and certain members of management. The distribution was made immediately following such approval with funds originating from a first lien RBL draw made at the end of June 2020.
On December 30, 2020, we entered into an extension and amendment of our RBL Credit Facility and a new second lien term loan to repay the aggregate principal amount of loans under the Superpriority Facility resulting in the following:
| • | the maturity of the RBL was extended to January 15, 2023 and the borrowing base of the facility was reduced from $350 million to $300 million and will reduce further on a quarterly basis to $100 million at December 31, 2022. Other than the quarterly reductions, there are no borrowing base redeterminations. The pricing grid was increased by 1.00% to LIBOR + 2.50% to 3.50% based on utilization. |
| • | entered into the Second Lien Term Loan whereby the proceeds were used to repay the aggregate principal amount of loans of $150 million outstanding under the Superpriority Facility in connection with the entry into the amendment to and extension of the RBL. The Second Lien Term Loan was fully drawn at closing in the amount of $150 million. The Second Lien Term Loan bears interest at a rate equal to a LIBOR floor of 0.75% plus 8.75% per annum, payable monthly, and matures on the earlier to occur of (a) December 30, 2025 and (b) 90 days prior to the maturity of the 9.75% Notes or 8.75% Notes, to the extent specified amounts of such indebtedness remain outstanding. The Second Lien Term Loan is redeemable beginning June 30, 2022 at 102% of par value, stepping down to 101% of par value on June 30, 2023 and at par value on June 30, 2024 and thereafter. The Second Lien Term Loan is secured on a junior lien basis by all our assets and stock and the subsidiaries that secure the RBL and, upon closing of the offering, the New RBL. |
73
Table of Contents
| • | the Company’s existing $280 million second lien revolving credit agreement, dated December 30, 2019, was subordinated to a third lien in connection with the entry into the Second Lien Term Loan. The Third Lien Credit Agreement provides for a revolving credit facility in an amount up to $330 million, and bears interest rate of LIBOR plus 9.75% per annum. The Third Lien Credit Agreement matures on March 15, 2023 and was undrawn at December 31, 2020. |
With consideration of the executed transactions above, we believe we have sufficient liquidity to fund future operations and to meet obligations as they become due for at least one year following the date that these consolidated financial statements are issued.
Cash Flow Activity
Our financial condition and results of operations, including our liquidity and profitability, are significantly affected by the prices that we realize for our natural gas and the volumes of natural gas that we produce. Natural gas is a commodity for which established trading markets exist. Accordingly, our operating cash flow is sensitive to a number of variables, the most significant of which are the volatility of natural gas prices and production levels both regionally and across North America, the availability and price of alternative fuels, infrastructure capacity to reach markets, costs of operations and other variable factors. We monitor factors that we believe could be likely to influence price movements including new or expanded natural gas markets, gas imports, LNG and other exports and industry CapEx levels.
Our produced volumes have a high correlation to our level of CapEx and our ability to fund it through operating cash flow, borrowings and other sources may be affected by multiple factors discussed further herein.
The following summarizes our cash flow activity:
| For the Year Ended December 31, | ||||||||
| 2020 | 2019 | |||||||
| (in thousands) | ||||||||
| Operating cash flow |
$ | 295,174 | $ | 270,699 | ||||
| Investing cash flow |
(252,378 | ) | (281,193 | ) | ||||
| Financing cash flow |
(45,565 | ) | 7,750 | |||||
|
|
|
|
|
|||||
| Net change in cash |
$ | (2,769) | $ | (2,744 | ) | |||
|
|
|
|
|
|||||
2020 Compared to 2019
Operating Cash Flow
Cash flow from operating activities for 2020 was higher than 2019 primarily due to higher production levels of 658 MMcfd in 2020 as compared to 549 MMcfd in 2019 and working capital changes offset by lower natural gas prices.
Investing Cash Flow
Our cash flow used in investing activities in 2020 was lower than 2019 primarily due to a higher capital program in 2019 offset by $5.8 million in proceeds from the sale of certain pipeline assets.
Financing Cash Flow
Cash flow used in financing activities in 2020 increased as we made a $30 million distribution to Vine Oil and Gas Parent LP and paid $15.6 million of deferred financing costs compared to 2019 where we had net borrowings of $10 million on our RBL and $2.2 million of deferred financing costs.
74
Table of Contents
Derivative Activities
Natural gas prices are inherently volatile and unpredictable. Accordingly, to achieve more predictable cash flow and reduce our exposure to adverse fluctuations in commodity prices, we use commodity derivatives, such as swaps, to hedge price risk associated with our anticipated production and to underpin our development program. This helps reduce potential negative effects of reductions in gas prices but also reduces our ability to benefit from increases in gas prices. In certain circumstances, where we have unrealized gains in our derivative portfolio, we may choose to restructure existing derivative contracts or enter into new transactions to modify the terms of current contracts in order to utilize their value to further our strategic pursuits.
A swap has an established fixed price. When the settlement price is below the fixed price, the counterparty pays us an amount equal to the difference between the settlement price and the fixed price multiplied by the hedged contract volume. When the settlement price is above the fixed price, we pay our counterparty an amount equal to the difference between the settlement price and the fixed price multiplied by the hedged contract volume.
A put option has an established floor price. The buyer of that put option pays the seller a premium to enter into the put option. When the settlement price is below the floor price, the seller pays the buyer an amount equal to the difference between the settlement price and the strike price multiplied by the hedged contract volume. When the settlement price is above the floor price, the put option expires worthless.
A call option has an established ceiling price. The buyer of the call option pays the seller a premium to enter into the call option. When the settlement price is above the ceiling price, the seller pays the buyer an amount equal to the difference between the settlement price and the strike price multiplied by the hedged contract volume. When the settlement price is below the ceiling price, the call option expires worthless.
A put option and a call option may be combined to create a collar. A collar requires the seller to pay the buyer if the settlement price is above the ceiling price and requires the buyer to pay the seller if the settlement price is below the floor price. Our Second Lien Term Loan requires us to have 70% of our total expected production hedged 24 months forward.
Our commodity derivatives allow us to mitigate the potential effects of the variability in operating cash flow thereby providing increased certainty of cash flows to support our capital program and to service our debt. We believe the New RBL will afford us greater flexibility to hedge than similar agreements of our peers because it is expected to allow us to hedge a large percentage of our total expected production. Typically, credit documents limit borrowers to hedging only production from already developed reserves. Our derivatives provide only partial price protection against declines in natural gas prices and partially limit our potential gains from future increases in prices.
The following table summarizes our derivatives as of December 31, 2020:
| Natural Gas Swaps |
||||||||
| Period |
Natural Gas Volume (MMBtud) |
Weighted Average Swap Price ($ / MMBtu) |
||||||
| 2021 |
||||||||
| First Quarter |
515,000 | $ | 2.70 | |||||
| Second Quarter |
610,890 | $ | 2.53 | |||||
| Third Quarter |
637,522 | $ | 2.53 | |||||
| Fourth Quarter |
648,370 | $ | 2.54 | |||||
| 2022 |
||||||||
| First Quarter |
639,833 | $ | 2.55 | |||||
| Second Quarter |
119,780 | $ | 2.57 | |||||
| Third Quarter |
156,522 | $ | 2.56 | |||||
| Fourth Quarter |
363,109 | $ | 2.53 | |||||
75
Table of Contents
| Natural Gas Swaps |
||||||||
| Period |
Natural Gas Volume (MMBtud) |
Weighted Average Swap Price ($ / MMBtu) |
||||||
| 2023 |
||||||||
| First Quarter |
445,333 | $ | 2.50 | |||||
| Fourth Quarter |
101,087 | $ | 2.54 | |||||
| 2024 |
||||||||
| First Quarter |
300,000 | $ | 2.54 | |||||
| Fourth Quarter |
70,761 | $ | 2.58 | |||||
| 2025 |
||||||||
| First Quarter |
137,667 | $ | 2.58 | |||||
| Natural Gas Calls |
||||||||
| Period |
Natural Gas Volume (MMBtud) |
Weighted Average Swap Price ($ / MMBtu) |
||||||
| 2021 |
||||||||
| First Quarter |
(85,000 | ) | $ | 3.19 | ||||
We expect to continue to use commodity derivatives to hedge our price risk in the future, though the notional and pricing levels will be dependent upon prevailing conditions, including available capacity of our counterparties.
Our current derivative portfolio cannot protect us from the risk of a potential widening of differentials between our sales price and NYMEX. We have entered into agreements with multiple potential counterparties to also allow us to hedge our physical gas sales at fixed prices. In 2020, approximately 62% of our 2020 basis was effectively fixed at approximately $0.18 under NYMEX by virtue of our physical, firm sales agreements with multiple credit-worthy counterparties.
Debt Agreements
Vine Oil & Gas RBL Facility
In November 2014, in connection with the Shell Acquisition, we entered into the RBL with HSBC Bank USA, National Association, as Administrative Agent, Collateral Agent, Swingline Lender and an Issuing Bank and the banks, financial institutions and other lending institutions from time to time party thereto. The RBL was amended in January 2015, October 2017 and most recently in December 2020.
As amended, our RBL has a total current revolving commitment of $300 million, with such commitment being subject to periodic scheduled reductions until January 15, 2023 (the commitment as subject to these reduction from time to time, the “Loan Limit”). In addition to the periodic reductions referenced above, the Loan Limit is also subject to adjustments in connection with certain asset dispositions. The RBL requires that we provide a first priority security interest in our oil and gas properties (such that those properties subject to the security interest represent at least 85% of the total value of the proved oil and gas properties) and all of our personal property assets. The RBL is scheduled to mature in January 2023.
The RBL includes usual and customary covenants for facilities of its type and size. The covenants cover matters such as mandatory reserve reports, the responsible operation and maintenance of properties, certifications of compliance, required disclosures to the lenders, notices under other material instruments, and notices of sales of oil and gas properties. It also places limitation on the incurrence of additional indebtedness, restricted payments, distributions, investments outside of the ordinary course of business and limitations on the amount of commodity and interest rate hedges that can be put in place.
76
Table of Contents
The RBL also contains a financial maintenance covenant limiting us to a consolidated total net leverage to consolidated trailing twelve month EBITDAX ratio of 4.00:1.00 on or prior to March 31, 2021 and 3.50:1.00 thereafter, measured quarterly.
The RBL bears interest based on LIBOR plus an additional margin, based on the percentage of the revolving commitment being utilized, ranging from 2.50% to 3.50%. There is also a commitment fee that ranges between 0.375% and 0.50% on the undrawn borrowing base amounts. The RBL may be prepaid without a premium. Should the RBL remain outstanding as of January 1, 2023, we will be required to pay a ‘deferred extension fee’ of $1 million to the pro rata account of each lender.
We intend to use the net proceeds of this offering and borrowings under the New RBL to repay in full and terminate the RBL.
Second Lien Credit Agreement
In December 2020, we entered into the Second Lien Credit Agreement with Morgan Stanley Senior Funding, Inc. as administrative agent and collateral agent, and certain other banks, financial institutions and other lending institutions from time to time party thereto, pursuant to which we were provided with the Second Lien Term Loan.
The Second Lien Term Loan was fully drawn in December 2020 in an amount of $150 million, and bears interest at a rate equal to a LIBOR plus 8.75% per annum, payable quarterly, maturing on the earlier to occur of (a) December 30, 2025 and (b) 90 days prior to the maturity of the 9.75% Notes or 8.75% Notes, to the extent specified amounts of such indebtedness remain outstanding. If redeemed prior to June 30, 2022, the Second Lien Term Loan is subject to a make-whole premium of the applicable treasury rate plus 0.50% of the amount of interest and any call premium which would have otherwise been payable had the Second Lien Term Loan been redeemed on June 30, 2022. The Second Lien Term Loan is redeemable beginning June 30, 2022 at 102% of par value, stepping down to 101% of par value on June 30, 2023 and at par value on June 30, 2024 and thereafter. The Second Lien Term Loan also provides for a quarterly consolidated total net leverage ratio financial maintenance covenant of 4.00x, stepping down to 3.50x with the quarter ended June 30, 2021 and thereafter, similar to the RBL.
The Second Lien Term Loan contains customary incurrence-based covenants for facilities of this type, including restrictions on the incurrence of liens, indebtedness, asset dispositions, fundamental changes, transactions with affiliates, restricted payments and other customary covenants. For example, our Second Lien Term Loan requires us to have 70% of our total expected production hedged 24 months forward, along with the requirement to maintain liquidity of no less than $40 million, tested quarterly, and is secured on a second lien basis by all of our assets and stock and the subsidiaries that secure the RBL.
Third Lien Credit Agreement
In December 2019, we entered into the Third Lien Credit Agreement with Blackstone Holdings Finance Co LLC, as administrative agent and collateral agent and certain other banks, financial institutions and other lending institutions from time to time party thereto. At that time, the Third Lien Credit Agreement was secured on a second lien basis, but was subordinated to a third lien in December 2020 in connection with the entry into the Second Lien Credit Agreement. We expect to terminate the Third Lien Credit Facility in connection with this offering.
The Third Lien Credit Agreement provides for a revolving credit facility in an amount up to $330 million, and bears interest at a rate of LIBOR plus 9.75% per annum. The Third Lien Credit Agreement matures on March 15, 2023 and was undrawn at December 31, 2020.
77
Table of Contents
The Third Lien Credit Agreement contains customary incurrence-based covenants for facilities of this type, including restrictions on the incurrence of liens, indebtedness, asset dispositions, fundamental changes, transactions with affiliates, restricted payments and other customary covenants, and is secured on a third lien basis by all of our assets and stock and the subsidiaries that secure the RBL and will secure the New RBL, as applicable.
Vine Oil & Gas 8.75% Notes
In October 2017, we issued $530 million aggregate principal amount of the 8.75% Notes at 99% of par, and in connection therewith, we incurred discounts and upfront fees totaling $17.9 million. Aggregate net proceeds from the issuance of the 8.75% Notes of approximately $512 million were used to repay borrowings outstanding on the RBL and Term Loan B (“TLB”) in the amount of $95.0 million and $61.4 million, respectively, and to repurchase in full our $350 million Term Loan C (“TLC”) for $353.5 million. Interest is accrued and paid semi-annually on April 15 and October 15.
The 8.75% Notes are guaranteed on a senior unsecured basis by all our subsidiaries. We may redeem the 8.75% Notes at a redemption price (plus accrued and unpaid interest) equal to 106.563% of the principal amount through October 2021, 104.375% of the principal amount from October 2021 through April 2022 and 100% of the principal amount thereafter. The 8.75% Notes mature in April 2023 and bear interest at 8.75%.
Vine Oil & Gas 9.75% Notes
In October 2018, we issued $380 million aggregate principal amount of 9.75% Notes due 2023 at par, and in connection therewith, we incurred upfront fees totaling $7.8 million. Aggregate net proceeds from the issuance of the 9.75% Notes were $372.2 million and were used to repay borrowings and accrued and unpaid interest in full on the TLB in the amount of $339.0 million. Interest is accrued and paid semi-annually on April 15 and October 15.
The 9.75% Notes are guaranteed on a senior unsecured basis by all our subsidiaries. The 9.75% Notes mature in April 2023 and bear interest at 9.75%. We may redeem the 9.75% Notes at a redemption price (plus accrued and unpaid interest) equal to 107.313% of the principal amount through October 2021, 104.875% of the principal amount from October 2021 through April 2022 and 100% of the principal amount thereafter.
Summary of Outstanding Debt at December 31, 2020 (1)
| Highest Priority |
Lowest Priority | |||||||||
| RBL
|
Second Lien Term Loan |
Third Lien Credit Facility |
9.75% |
8.75% | ||||||
| Face amount |
$ 300 million | $150 million | $330 million | $380 million | $530 million | |||||
| Amount outstanding |
$ 190 million | $150 million | $0 | $380 million | $530 million | |||||
| Scheduled maturity date |
January 2023 | December 30, 2025 or 90 days prior to the maturity of the 9.75% Notes or 8.75% Notes | March 15, 2023 | April 2023 | April 2023 | |||||
| Interest rate |
LIBOR+2.5-3.5% | LIBOR + 8.75% | LIBOR + 9.75% | 9.75% | 8.75% | |||||
| Base interest rate options |
ABR and LIBOR + spread | ABR and LIBOR + spread | ABR and LIBOR + spread | N/A | N/A | |||||
| Financial maintenance covenants |
– Maximum consolidated total net leverage ratio of 4.0x | – Maximum consolidated total net leverage ratio of 4.0x | - LTM Leverage minimum of $0 | N/A | N/A | |||||
78
Table of Contents
| Highest Priority |
Lowest Priority | |||||||||
| RBL
|
Second Lien Term Loan |
Third Lien Credit |
9.75% |
8.75% | ||||||
| decreasing to 3.5x effective April 2021 | decreasing to 3.5x effective April 2021
- Minimum liquidity of $40 million tested quarterly |
-Maximum consolidated total net leverage ratio of 4.0x decreasing to 3.5x effective April 2021
- Maximum secured leverage ratios of 4.0x decreasing to 3.5x effective April 2021 |
||||||||
| Significant restrictive covenants |
– Incurrence of debt
– Incurrence of liens
– Payment of dividends
– Equity purchases
– Asset sales
– Limitations on derivatives & investments
– Affiliate transactions |
– Incurrence of debt
– Incurrence of liens
– Payment of dividends
– Equity purchases
– Asset sales
– Limitations on derivatives & investments
– Affiliate transactions
– Excess cash cap |
– Incurrence of debt
– Incurrence of liens
– Payment of dividends
– Equity purchases
– Asset sales
– Limitations on derivatives & investments
– Affiliate transactions |
– Incurrence of debt
– Incurrence of liens
– Payment of dividends
– Equity purchases
– Asset sales
– Limitations on ability to make investments
– Affiliate transactions |
– Incurrence of debt
– Incurrence of liens
– Payment of dividends
– Equity purchases
– Asset sales
–Limitations on ability to make investments
– Affiliate transactions | |||||
| Optional redemption |
Any time at par | Make-whole through June 2022; 102% through June 2023; 101% through June 2024; thereafter at par | Any time at par | After October 2020 through October 2021 at 107.313%; thereafter through April 2022 at 104.875%; thereafter at par | After October 2020 through October 2021 at 106.563%; thereafter through April 2022 at 104.375%; thereafter at par | |||||
| Change of control |
Event of default | Event of default | Event of default | If accompanied by Ratings Decline, Investor put at 101% of par | If accompanied by Ratings Decline, Investor put at 101% of par | |||||
| (1) | The information presented in this table is qualified in all respects by reference to the full text of the covenants, provisions and related definitions contained in the documents governing the various components of our debt. |
79
Table of Contents
Contractual Obligations
| As of December 31, 2020 (in thousands) | ||||||||||||||||||||||||
| 2021 | 2022 | 2023 | 2024 | 2025 | Total | |||||||||||||||||||
| RBL Principal(1) |
$ | — | $ | 90,000 | $ | 100,000 | $ | — | $ | — | $ | 190,000 | ||||||||||||
| RBL Interest(2) |
6,823 | 6,293 | 127 | — | — | 13,243 | ||||||||||||||||||
| 2nd Lien Term Loan |
— | — | — | — | 150,000 | 150,000 | ||||||||||||||||||
| 2nd Lien Interest(2) |
14,448 | 14,448 | 14,448 | 14,448 | 14,448 | 72,240 | ||||||||||||||||||
| 3rd Lien Interest(3) |
1,419 | 1,419 | 288 | — | — | 3,126 | ||||||||||||||||||
| 8.75% Notes Principal |
— | — | 530,000 | — | — | 530,000 | ||||||||||||||||||
| 8.75% Notes Interest |
46,375 | 46,375 | 13,341 | — | — | 106,091 | ||||||||||||||||||
| 9.75% Notes Principal |
— | — | 380,000 | — | — | 380,000 | ||||||||||||||||||
| 9.75% Notes Interest |
37,050 | 37,050 | 10,658 | — | — | 84,758 | ||||||||||||||||||
| LC Fees & Payments(4) |
847 | 863 | 653 | 653 | 653 | 3,669 | ||||||||||||||||||
| Drilling Rig(5) |
6,513 | 4,173 | — | — | — | 10,686 | ||||||||||||||||||
| Other |
1,054 | 1,087 | 932 | — | — | 3,073 | ||||||||||||||||||
|
|
|
|
|
|
|
|
|
|
|
|
|
|||||||||||||
| Total |
$ | 114,529 | $ | 201,708 | $ | 1,050,447 | $ | 15,101 | $ | 165,101 | $ | 1,546,886 | ||||||||||||
|
|
|
|
|
|
|
|
|
|
|
|
|
|||||||||||||
| (1) | On December 30, 2020, the maturity of the RBL was extended to January 15, 2023 and availability under the facility was reduced from $350 million to $300 million and will reduce further on a quarterly basis to $100 million at December 31, 2022. |
| (2) | This debt bears interest at LIBOR plus a borrowing spread. In determining future interest, we used outstanding amounts at December 31, 2020 and used the forward curve for LIBOR to project the interest obligations in those future periods. |
| (3) | Includes payment of the commitment fee pursuant to the Third Lien Credit Agreement. |
| (4) | Related to $24.9 million in outstanding letters of credit outstanding as of December 31, 2020. |
| (5) | We are party to four drilling rig contracts, only one of which had an original term beyond one year, and as a result, only one is reflected in this table. |
Critical Accounting Estimates
Our financial statements are prepared in accordance with GAAP. In connection with preparing of our financial statements, we are required to make assumptions and estimates about future events, and apply judgments that affect the reported amounts of assets, liabilities, revenue, expense and the related disclosures. We base our assumptions, estimates and judgments on historical experience, current trends and other factors that management believes to be relevant at the time we prepare our consolidated financial statements. On a regular basis, management reviews the accounting policies, assumptions, estimates and judgments to ensure that our financial statements are presented fairly and in accordance with GAAP. However, because future events and their effects cannot be determined with certainty, actual results could differ materially from our assumptions and estimates.
Our significant accounting policies are discussed in our audited financial statements included elsewhere in this prospectus. Management believes that the following accounting estimates are those most critical to fully understanding and evaluating our reported financial results, and they require management’s most difficult, subjective or complex judgments, resulting from the need to make estimates about the effect of matters that are inherently uncertain.
Gathering Liability
Policy Description
We are party to some gathering contracts that require delivery of minimum volumes regardless of throughput for each annual contract period. These gathering contracts require annual settlement payments for any shortfalls in the gathered volumes.
80
Table of Contents
Judgments and Assumptions
Our obligation for the gathering contracts was initially measured at fair value as of the acquisition date and represented the expected volume shortfall over the remaining contract period. The fair value was determined using estimated future development pace, future production volumes, future inflation factors, and our weighted average cost of capital. We recognize accretion expense for the impact of increasing the discounted liability as time passes. At each reporting period, the difference, if any, between the estimated payments at inception and actual current contract period payments expected to be required are recorded to gathering and treating expense. If our development plan changes or if production deviates from our initial estimation, the amount of the adjustments to the gas gathering liability recorded to gathering and treating expense could be material. For example, if our forecasted volumes were to decrease, we would need to increase the liability via additional gathering and treating expense. Conversely, if our actual production volumes were to increase, we would reduce the liability via a reduction to gathering and treating expense when the excess gas is produced. We met all obligations on our gas gathering liability in the first quarter of 2020 and consequently recorded the last non-cash gains to fully amortize the gas gathering liability.
Natural Gas Reserves
Policy Description
Proved natural gas reserves are the estimated quantities of natural gas that geological and engineering data demonstrate with reasonable certainty to be recoverable in future years from known reservoirs under existing economic and operating conditions. In calculating cash inflows for reserves, we use an unweighted average of the preceding 12-month first-day-of-the-month prices for determination of proved reserve values and for annual proved reserve disclosures. We assume continued use of technologies with demonstrated success of yielding expected results, including the use of drilling results, well performance, well logs, seismic data, geological maps, well stimulation techniques, well test data and reservoir simulation modeling.
In calculating cash outflows for reserves, we use well costs and operating costs prevailing during the preceding year, but more heavily weighted toward recent demonstration levels, which are then held constant into future periods. Our estimates of proved reserves are determined and reassessed at least annually using available geological and reservoir data as well as production performance data. Revisions may result from changes in, among other things, reservoir performance, prices, economic conditions and governmental policies.
We limit our future development program to only those wells that we expect to be developed within five years of their initial recognition. Additional information regarding our proved natural gas reserves may be found under “Reserve Data” found elsewhere in this prospectus.
Judgments and Assumptions
All of the reserve information in this prospectus is based on estimates. Estimates of natural gas reserves are prepared in accordance with guidelines established by the SEC. Reservoir engineering is a subjective process of estimating recoverable underground accumulations of natural gas. There are numerous uncertainties inherent in estimating recoverable quantities of proved natural gas reserves. Uncertainties include the projection of future production rates and the expected timing of development expenditures. The accuracy of any reserve estimate is a function of the quality of available data and of engineering and geological interpretation and judgment. As a result, proved reserve estimates may be different from the quantities of natural gas that are ultimately recovered.
The passage of time provides more qualitative information regarding estimates of reserves, and revisions are made to prior estimates to reflect updated information. If future significant revisions are necessary that reduce previously estimated reserve quantities, it could result in impairments. In addition to using estimates of proved reserves to assess for impairment, we also rely heavily on them in the calculation of depletion expense. For example, if estimates of proved reserves decline, the depletion rate and resulting expense will increase, resulting
81
Table of Contents
in a decrease in net income. A decline in estimates of proved reserves could also cause us to perform an impairment analysis to determine whether the carrying amount of oil and natural gas properties exceeds fair value, which would result in an impairment charge, reducing net income.
Successful Efforts Method of Accounting for Natural Gas Properties
Policy Description
We use the successful efforts method of accounting for natural gas activities. Costs to acquire mineral interests in natural gas properties are capitalized as unproved properties whereas costs to drill and equip wells that result in proved reserves are capitalized as proved properties. Costs to drill wells that do not identify proved reserves as well as geological and geophysical costs are expensed.
Our proved natural gas properties are recorded at cost. We evaluate our properties for impairment annually in the fourth quarter or when events or changes in circumstances indicate that a decline in the recoverability of their carrying value may have occurred. We estimate the expected future cash flows of our natural gas properties and compare these undiscounted cash flows to the carrying amount of the natural gas properties to determine if the carrying amount is recoverable. If the carrying amount exceeds the estimated undiscounted future cash flows, we will write down the carrying amount of the natural gas properties to fair value. The factors used to determine fair value include, but are not limited to, estimates of reserves, future commodity prices, future production estimates, estimated future operating and CapEx, and discount rates.
Judgments and Assumptions
Our impairment analysis requires us to apply judgment in identifying impairment indicators and estimating future cash flows of our natural gas properties. If actual results are not consistent with our assumptions and estimates or our assumptions and estimates change due to new information, we may be exposed to an impairment charge.
Key assumptions used to determine the undiscounted future cash flows include estimates of future production, timing of new wells coming on line, differentials, net estimated operating costs, anticipated CapEx, and future commodity prices. Our discussion of the judgments inherent in reserve estimation above has information with direct bearing on the judgments surrounding our depletion calculation and impairment analysis. However, in conducting our impairment analysis, we also replace pricing assumptions with future price estimates and we include values for our probable and possible reserves in determining fair value.
Lower net undiscounted cash flows can result in the carrying amount of the natural gas properties exceeding the net undiscounted cash flows, which results in an impairment expense. Changes in forward commodity prices and differentials, changes in capital and operating expenses, and changes in production among other items can result in lower net undiscounted cash flows. Forward commodity prices can change quickly and unexpectedly as, for example, a result of global supply fluctuations or warmer than anticipated weather, which can negatively impact forward commodity prices, which could significantly lower undiscounted net cash flows.
Similarly, future capital and lease operating costs are uncertain and can change quickly based on regional oil and natural gas drilling activity, steel and other raw material prices, transportation costs and regulatory requirements, among other factors. Increased capital and lease operating costs would result in lower net undiscounted cash flows. Production estimates are determined based on field activities and future drilling plans.
Drilling and field activities require significant judgments in the evaluation of all available geological, geophysical, engineering and economic data. As such, actual results may materially differ from predicted results, which could lower production and net undiscounted cash flows.
82
Table of Contents
Unproved property costs consist of costs to acquire undeveloped leases. We evaluate unproved properties for impairment based on remaining lease term, nearby drilling results, reservoir performance, seismic interpretation or future plans to develop acreage.
Derivatives
Policy Description
We enter into derivatives to mitigate risk associated with the prices received from our natural gas production. We also utilize interest rate derivatives to hedge the risk associated with interest rates on our outstanding debt.
Our derivatives are not designated as hedges for accounting purposes. Accordingly, changes in their fair value are recognized in income in the period of change. As the derivative cash flows are considered an integral part of our operations, they are classified as cash flows from operating activities. All derivative instruments are recognized as either an asset or liability on the balance sheet measured at their fair value determined by reference to published future market prices and interest rates.
Judgments and Assumptions
The estimates of the fair values of our commodity and interest rate derivatives require substantial judgment. Valuations are based upon multiple factors such as futures prices, volatility data from major natural gas trading points, length of time to maturity, credit risks and interest rates. We compare our estimates of fair value for these instruments with valuations obtained from independent third parties and counterparty valuation confirmations.
The values we report in our financial statements change as these estimates are revised to reflect actual results. Future changes to forecasted or realized commodity prices could result in significantly different values and realized cash flows for such instruments.
Asset Retirement Obligations
Policy Description
We record the fair value of the liability for ARO in the period in which it is legally or contractually incurred. Upon initial recognition of the ARO, an asset retirement cost is capitalized by increasing the carrying amount of the asset by the same amount as the liability. In periods subsequent to initial measurement, the asset retirement cost is recognized as expense through depletion or depreciation over the asset’s useful life. Changes in the liability for ARO are recognized for (i) the passage of time and (ii) revisions to either the timing or the amount of estimated cash flows. Accretion expense is recognized for the impacts of increasing the discounted liability to its estimated settlement value.
Judgments and Assumptions
The estimates of our future ARO require substantial judgment. We estimate the future costs associated with our retirement obligations, the expected remaining life of the related asset and our credit-adjusted-risk-free interest rate. As revisions to these estimates occur, we may have significant changes to the related asset and its ARO.
If future abandonment cost estimates were to exceed current estimates, or if assets had shortened lives compared to current estimates, we would expect to increase the recorded liability for ARO, which would trigger recognition of additional expense and a reduction to our net income.
JOBS Act
The JOBS Act permits us, as an “emerging growth company,” to take advantage of an extended transition period to comply with new or revised accounting standards applicable to public companies. We have elected to
83
Table of Contents
take advantage of this extended transition period, which means that the financial statements included in this prospectus, as well as any financial statements that we file or furnish in the future, will not be subject to all new or revised accounting standards generally applicable to public companies for the transition period for so long as we remain an emerging growth company.
Recent Accounting Pronouncements
Our audited financial statements found elsewhere in this prospectus contain a description of recent accounting pronouncements.
Internal Controls and Procedures
We are not currently required to comply with the SEC’s rules implementing Section 404 of SOX, and are therefore not required to make a formal assessment of the effectiveness of our internal control over financial reporting for that purpose. Upon becoming a public company, we will be required to comply with the SEC’s rules with respect to Section 302 of SOX, which will require certifications in our quarterly and annual reports and provision of an annual management report on the effectiveness of our internal control over financial reporting.
We will not be required to have our independent registered accounting firm make its first assessment of our internal control over financial reporting under Section 404 until our first annual report after we cease being an “emerging growth company”.
Quantitative and Qualitative Disclosure about Market Risk
The primary objective of the following information is to provide forward-looking quantitative and qualitative information about our potential exposure to market risk. The term “market risk” refers to the risk of loss arising from adverse changes in natural gas prices and interest rates. The disclosures are not meant to be precise indicators of expected future losses, but rather indicators of reasonably possible losses. This forward-looking information provides indicators of how we view and manage our ongoing market risk exposures. All of our market risk sensitive instruments were entered into for hedging purposes, rather than for speculative trading.
Commodity Price Risk and Hedges
Our major market risk exposure is in the pricing that we receive for our natural gas production. Natural gas is a commodity and, therefore, its price is subject to wide fluctuations in response to relatively minor changes in supply and demand. Historically, the natural gas market has been volatile. Prices for domestic natural gas began to decline during the third quarter of 2014 and have been pressured since then, despite a modest recovery in oil prices. Spot prices for Henry Hub generally ranged from $1.50 per MMBtu to $4.75 per MMBtu since 2014. Our revenue, profitability and future growth are highly dependent on the prices we receive for our natural gas production, and the levels of our production, depend on numerous factors beyond our control, some of which are discussed in “Risk Factors—Risks Related to Our Business—Natural gas prices are volatile. A reduction or sustained decline in prices may adversely affect our business, financial condition or results of operations and our ability to meet our financial commitments.”
A $0.10 per Mcf change in our realized natural gas price would have resulted in a $4.9 million change in our natural gas revenue for 2020, after giving effect to our commodity derivative contracts. Our sole sources of cash are our production of natural gas and the related hedging.
Due to natural gas volatility, we have historically used, and we expect to continue to use, derivatives, such as swaps and collars, to hedge price risk associated with our anticipated production. This helps reduce potential negative effects of reductions in gas prices but also reduces our ability to benefit from increases in gas prices. These instruments provide only partial price protection against declines in oil and natural gas prices and may partially limit our potential gains from future increases in prices. Moreover, our Second Lien Term Loan requires us to have 70% of our total expected production hedged 24 months forward.
84
Table of Contents
“Risk Factors” contains additional information regarding the volumes of our production covered by derivatives and the associated risks.
Interest Rate Risk
At December 31, 2020, Vine had $340 million of debt outstanding, which bears interest at a floating rate.
Based on the $340 million in floating rate debt we had outstanding as of December 31, 2020, a 50 basis point increase or decrease in interest rate would have resulted in an increase or decrease, respectively, of approximately $1.7 million in interest expense per year. We do not currently have any derivative arrangements to protect against fluctuations in interest rates applicable to our variable rate indebtedness but may enter into such derivative arrangements in the future. To the extent we enter into any such interest rate derivative arrangement, we would subject to risk for financial loss. For more information, please see “Risk Factors—Risks Related to Our Business—Our derivative activities could result in financial losses or reduce our income.”
Counterparty and Customer Credit Risk
Our derivatives expose us to credit risk in the event of nonperformance by counterparties. While we do not require our counterparties to our derivatives to post collateral, our counterparties have principally been lenders under the RBL, which allows for right-of-offset in the event that they do not perform. Recently, we have been utilizing other counterparties who have investment grade credit ratings and whom we will continue to evaluate creditworthiness over the terms of the derivatives.
Our principal exposures to credit risk are through receivables resulting from joint interest receivables and receivables from the sale of our natural gas production. The inability or failure of our significant customers to meet their obligations to us or their insolvency or liquidation may adversely affect our financial results. However, we believe the credit quality of our customers is high.
We sell our production to various types of customers, but generally to trading houses and large physical consumers of natural gas. We extend and monitor credit based on an evaluation of their financial conditions and publicly available credit ratings. The future availability of a ready market for natural gas depends on numerous factors outside of our control, none of which can be predicted with certainty. For 2020, we had five customers that exceeded 10% of total natural gas revenue. We do not believe the loss of any single purchaser would materially impact our operating results because of gas fungibility, the depth of Gulf Coast markets and presence of numerous purchasers.
Accounts receivable from joint interest billings arise from costs that we incur as operator that are attributable to outside working interests. We generally have the right to offset cash we receive for any production that we market on behalf of such outside working interests in the event they do not pay their portion of the costs we incur on their behalf.
Inflation
Inflation in the U.S. has been relatively low in recent years and did not have a material impact on our results of operations in 2020. Although the impact of inflation has been insignificant in recent years, it could cause upward pressure on the cost of oilfield services, equipment and G&A.
Off-Balance Sheet Arrangements
We have no off-balance sheet arrangements.
85
Table of Contents
Our Company
We are an energy company focused on the development of natural gas properties in the stacked Haynesville and Mid-Bossier shale plays in the Haynesville Basin of Northwest Louisiana.
Natural gas demand has significantly grown as a percentage of North America’s energy mix over the last ten years, having increased 38% from 86 Bcfd to 119 Bcfd and growing from 27% to 37% of the energy mix due to ample domestic supply, reliability of supply, significant supporting in-place infrastructure, low carbon intensity and low prices. In particular, demand for exported LNG has contributed to approximately 21% of that increase, with continued growth in LNG exports anticipated according to Wood Mackenzie. We believe natural gas will continue to be instrumental as a low carbon intensity source for meeting growing energy demand.
We believe the Haynesville will be particularly critical to meeting future natural gas demand. The Haynesville and Mid-Bossier shales are among the highest quality, highest return dry gas resource plays in North America with approximately 489 Tcf of natural gas in place, according to The Oil & Gas Journal. The Haynesville is among the oldest and most delineated shale plays in North America and its well economics have continued to improve in recent years as a result of advances in enhanced drilling and completion techniques, combined with predictable production profiles and well cost reductions. These advances have driven both higher and more capital efficient reserve recoveries on a per lateral foot basis, primarily as a consequence of optimized fracture stage lengths and increased proppant and water loading.
The Mid-Bossier shale overlays the Haynesville shale and demonstrates similar characteristics and well results. Additionally, the Haynesville and Mid-Bossier shales possess high-quality petrophysical characteristics, such as being over-pressured and having high porosity, permeability and thickness. Both plays also exhibit consistent and predictable geology and high EURs relative to D&C costs. These plays are at 10,500 to 13,500 ft in depth with formation temperatures ranging from 300 to 375° F, resulting in near pipeline quality natural gas requiring little additional processing, which contributes to relatively low operating costs. Lastly, due to significant historical development activity in the Haynesville beginning in 2008, which resulted in approximately 5,700 wells drilled through December 31, 2020, production and decline rates are predictable, and low-cost and sufficient midstream infrastructure is already in place. We therefore believe the Haynesville is one of the lowest-cost, lowest-risk natural gas plays in North America. As a consequence of these factors, as well as our proximity to Henry Hub and other premium Gulf Coast markets, LNG export facilities and other end-users, the play benefits from low breakeven costs, higher cash margins and higher pricing netbacks relative to other North American natural gas plays, such as those in Appalachia and the Rockies.
In contrast to the Haynesville, other sources of natural gas supply, including associated gas from oil-prone drilling and natural gas from the Appalachian region, are facing headwinds in the form of reduced activity and infrastructure constraints. Associated natural gas from oil-prone drilling was the largest contributor to natural gas supply growth from 2011 to 2019. However, due to the significant oil price shock brought on by the COVID-19 pandemic, the number of rigs drilling for oil in North America fell 59% in 2020, which is expected to result in a significant decline in future natural gas supply. While the Marcellus and Utica shales in the northeast United States currently account for approximately 30% of North American natural gas supply, there is limited pipeline capacity available to transport natural gas out of the area. Additionally, the demanding regulatory environment in the Northeast has limited new gas pipeline infrastructure. As such, we believe the Haynesville will be further relied upon to meet natural gas demand growth driven by increasing electricity demand associated with the global economic recovery, coupled with the continued increase in global LNG cargoes.
We first entered the Haynesville in 2014 following the Shell Acquisition and have actively acquired additional proximate acreage. We have approximately 125,000 net surface acres centered in what we believe to be the core of the Haynesville. Over 90% of our acreage is held-by-production and we operate over 90% of our
86
Table of Contents
future drilling locations with an average working interest of 83%. Approximately 84% of our acreage is prospective for dual-zone development, providing us with approximately 900 drilling locations among Vine, Brix and Harvest. Utilizing an average of 4 gross rigs, which we believe is sufficient to maintain production, we have approximately 25 years of development opportunities. We are not subject to any material minimum volume commitments in our gathering agreements, and have no firm transportation commitments, which provides us with the flexibility to match an optimal development pace to the prevailing natural gas price and hedging environment at any given time. This, coupled with the extensive midstream infrastructure and low basis differentials in the Haynesville, contributes to lower break-even costs. Research from Enverus projects that the average Haynesville Basin core well generates a 31% rate of return using a NYMEX gas price of $2.75 per MMBtu, which Enverus ranks as the highest among notable shale plays in North America. Moreover, based on the location of our acreage, which is in some of the most prospective parts of the Haynesville, we believe our weighted average rate of return based on internal cost assumptions for our remaining core drilling locations is 85% at a NYMEX gas price of $2.75 per MMBtu. As of December 31, 2020, we had approximately 370 net producing wells. Our assets are located almost entirely in Red River, DeSoto and Sabine parishes of Northwest Louisiana, which, according to Enverus, have consistently demonstrated higher EURs relative to drilling and completion costs than the Haynesville in Texas and other parishes in Louisiana.
The following table provides a summary of our inventory of drilling locations as of December 31, 2020, including average lateral length and drilling location data in each play.
Drilling Locations (1) (2)
| Short Lateral | Long Lateral | |||||||||||
| Length | <5,300 ft | >5,300 ft | Total | |||||||||
| Haynesville |
226 | 147 | 373 | |||||||||
| Mid-Bossier |
212 | 293 | 505 | |||||||||
|
|
|
|
|
|
|
|||||||
| Total Core |
438 | 440 | 878 | |||||||||
|
|
|
|
|
|
|
|||||||
| Total Non-Core |
44 | 10 | 54 | |||||||||
|
|
|
|
|
|
|
|||||||
| Total Drilling Locations |
482 | 450 | 932 | |||||||||
|
|
|
|
|
|
|
|||||||
| (1) | “Business—Our Operations—Reserve Data and Presentation—Drilling Locations” contains a description of our methodology used to determine gross drilling locations. We exclude drilling locations where our working interest is less than 20%. |
| (2) | 932 gross drilling locations reflecting an average working interest of approximately 83% or 776 net drilling locations. |
We describe the progression of our well completions as Vintages with our most recent wells described as Vintage 5. The characteristics of our Vintage 5 wells include 100-mesh sand completions, decreased cluster spacing, optimized proppant and water loading and refined stage lengths. We intend to continue employing longer laterals to develop certain areas within our asset base in order to increase capital efficiency. The shift to a higher concentration of longer laterals is a strategy we believe reflects our recent success in drilling long laterals of up to 10,000 ft. We expect this will increase our capital efficiency by allowing us to develop the gas in place using fewer wellbores and lower development costs, resulting in lower breakeven prices and higher returns.
Substantially all of our leasehold acreage is not subject to expiry because we have at least one developed well in each section, which, through continuous production of gas, maintains the leasehold position in that section and provides us with flexibility to conduct our remaining development. Our acreage has been delineated by over 700 gross horizontal wells drilled across our position in Sabine, Red River and DeSoto parishes, providing us with confidence that our inventory of drilling locations is low-risk and repeatable and that we can continue to generate consistent economic returns; of these 700 wells, over 280 wells have been brought online
87
Table of Contents
under our ownership or participation since our development program began in 2015, providing us with a significant amount of well performance data and associated learnings. In addition to the 700 wells drilled on our acreage, approximately 1,000 wells have been drilled by other operators within one mile of our position, further enhancing the delineation and confidence in our acreage. The company also holds license to almost 400 square miles of 3D and 50 miles of 2D seismic data. We are the leader of Mid-Bossier development, accounting for 36% of all Mid-Bossier wells brought online from 2017 to 2020, which is more than any other single operator.
All of the company’s acreage is underlaid by Northwest Louisiana’s extensive legacy midstream infrastructure, which includes access to sufficient gathering capacity to accommodate our future growth, including our primary third-party gatherer’s approximately 500 miles of pipeline and related treating plants. Their system is currently operating at an approximate 90% utilization rate and has multiple offload points where we can transfer volumes to other area gatherers at equivalent rates. This significant pre-existing area midstream infrastructure provides access to other area gatherers, and we utilize their capacity on both a firm and interruptible basis and expect to continue to do so in the future. We sell our gas at the tailgates of the treating plants attached to our gatherers’ systems and, as a result, incur and hold no direct firm-transportation cost or commitments. Furthermore, approximately 1.0 Bcfd of additional transportation capacity came online in mid-2020 through the DTE Energy (LEAP) project and another approximately 1.0 Bcfd is expected by mid-year 2021 with the Enterprise Product Partners (Acadian) project. Our proximity and sales to Henry Hub and other premium Gulf Coast markets, LNG export facilities and other end-users results in our netbacks reflecting low transportation costs, which is a significant competitive advantage compared to other North American dry gas plays such as those in Appalachia and the Rockies. As a result of these takeaway and sales dynamics, our basis differentials have remained tightly banded since our inception, ranging from $0.01 to $0.26 per MMBtu; over this same period, basis differentials in Appalachia and the Rockies have ranged from $0.27 to $1.54 and $0.12 to $0.96 per MMBtu, respectively. Further, in 2020, Vine Oil & Gas sold approximately 62% of its total gas production through firm sales contracts, with approximately 37% of total production being sold at specified differentials from Henry Hub, providing additional support to our realized pricing. We believe these attractive relative realizations and our long-term access to growing demand (e.g. LNG, chemical, refinery) on the Gulf Coast support our development plan and ability to generate levered free cash flow in various commodity price environments.
A transition to cleaner sources of energy is underway across the globe as demand for renewables and natural gas is projected to increase at a more rapid pace than demand for higher emission energy sources like coal and oil. According to the IEA global natural gas demand is projected to grow 15% between 2019 and 2030, resulting in an increase of approximately 17 Tcf of demand. Much of this growth, approximately 8 Tcf, is in the industrial sector, with growth in power generation, buildings, transportation and other sectors comprising the balance. Additionally, global natural gas consumed for energy and feedstock uses in industry is expected to grow 25% between 2019 and 2030, while coal and oil are projected to decline.
With respect to domestic electricity generation, the EIA projects that between 2019 and 2050, electricity generation will increase approximately 30% from 4,127 billion kilowatt hours to 5,414 billion kilowatt hours. In 2019, natural gas represented 37% of this fuel mix while renewables represented 19% with the balance comprised of coal at 24% and nuclear at 19%. By 2050, the EIA predicts that natural gas will remain a relatively constant 36% of this growing market, while renewables will increase to 38% and coal and nuclear will decrease to 13% and 12%, respectively. Renewables like wind and solar, which are intermittent by nature, require non-intermittent back up capacity such as natural gas, to provide a consistent level of electricity generation. More globally, the IEA predicts that global demand from electric vehicles will increase from 69 TWh in 2019 to 551 TWh by 2030, representing a CAGR of 21%. We believe that increasing demand for electricity from lower emissions sources, like renewables and natural gas, demonstrate how natural gas will play a critical role in this transition to a cleaner energy future.
North America has become increasingly dependent on natural gas for its energy consumption needs, and the EIA credits the increasing use of natural gas in domestic power generation as the leading factor in the 15%
88
Table of Contents
decrease in domestic energy related CO2 emissions from 2007 to 2019. Additionally, domestic LNG exports, which began in 2016, have increased to current levels of approximately 10 Bcfd. We believe the export of LNG to global markets will allow economies in Asia, Europe and Latin America to be less dependent on higher emission fuels as has been the case in North America.
Due to the composition of our production stream, which is essentially all dry gas (i.e. methane), we do not produce any associated oil or natural gas liquids. We also produce small amounts of water, CO2 and other byproducts. Since our production is not burdened with having to separate, store or transport oil or natural gas liquids, we do not have any direct emissions related to these processes. Moreover, by utilizing industry leading technology, we seek to measure and reduce our emissions and consider doing so a core competency of our business. We measure the quantity of greenhouse gas emissions in CO2e and the intensity of our emissions in CO2e per Bcf of production. We also measure methane emissions as a percentage of production or methane intensity. We have adopted operational practices specifically designed to reduce our emission footprint, including installation of intermittant and no-bleed control valves, utilization of bi-fuel drilling and completion equipment, proactive LDAR wellsite surveys to reduce fugitive emissions, and the onsite generation of solar power to operate certain equipment. While from 2017 to 2020 our annual production increased 153.5% from 128.8 Bcf to 326.5 Bcf, our CO2e emissions rate decreased by 35% from 686 mT CO2e/Bcf to 444 mT CO2e/Bcf and our methane intensity decreased by 77% from 0.061% to 0.014% of production, below BP by comparison, an industry leader at 0.14% of production across its more diverse asset base. Given the low emissions nature of our natural gas production and the additional active mitigation measures we implement, we believe we have one of the lowest emission levels per Bcf of annual production of any domestic onshore oil and gas company.
Our management team has extensive experience in the Haynesville and Mid-Bossier and a proven track record of implementing large-scale, technically driven development programs to target best-in-class returns in some of the most prominent resource plays across North America. Many members of our management team have extensive experience working in the Haynesville since its inception as a commercial play and have directly contributed to its technical advancement. Since the Shell Acquisition, our management team has been at the forefront of developing the technology to enhance well EURs and economics for both Haynesville and Mid-Bossier wells, including;
| • | increasing lateral length; |
| • | optimizing fracture stage lengths; |
| • | optimizing the amount and intensity of proppant and fluid pumped per foot of lateral; |
| • | reducing cluster spacing; |
| • | managing production rates to preserve downhole pressure; |
| • | adjusting well spacing and development patterns; and |
| • | improving wellbore landing accuracy. |
89
Table of Contents
Successful implementation of these measures has resulted in superior well performance relative to that of other major operators in the basin as seen in the charts below.
| Note: | Vine and third-party data sourced from Enverus. Includes horizontal wells targeting the Haynesville and Mid-Bossier with initial production between 2017 to 2020, normalized to a 7,500’ lateral. |
| (1) | Haynesville peers include Aethon Energy Management LLC, BPX Energy Inc., Castleton Commodities International LLC, Chesapeake Energy Corporation, EnSight IV Energy Partners, LLC, Exco Resources, Inc., Exxon Mobil Corporation, GeoSouthern Haynesville, Goodrich Petroleum Corporation, Indigo Natural Resources, LLC, Rockcliff Energy LLC, Sabine Oil & Gas Corporation. |
| (2) | Mid-Bossier peers include Aethon Energy Management LLC, BPX Energy Inc., Comstock Resources Inc., Exxon Mobil Corporation, GeoSouthern Haynesville, and Indigo Natural Resources, LLC. |
To maximize gas recovery from our wells, we manage the downhole pressure drop after initial flowback which results in a flat early-time production profile. The flat production profile is 5 to 18 months for both our Haynesville and Mid-Bossier wells. After the flat production period, our wells enter an exponential decline period followed by a hyperbolic decline and a final exponential terminal decline.
We believe that the gas price necessary to yield a Breakeven PV-10 to be $1.91 per MMBtu NYMEX on average for our remaining core drilling locations. Additionally, and based on internal estimates, we believe the gas price necessary to yield a Breakeven PV-10 for our remaining Haynesville and Mid-Bossier drilling locations to be $1.90 and $1.93 per MMBtu, respectively. These results demonstrate basin leading breakevens based on estimates from Enverus, which indicate Haynesville and Mid-Bossier breakevens for our peers range from $2.05 to $2.54 and $1.93 to $2.74 per MMBtu, respectively. Furthermore, our wells generally achieve payout of our drilling and completion costs within 12 to 16 months, which allows for efficient recycling of cash flow and provides significant excess cash flow beyond payout and, what we believe to be, industry leading returns on investment.
History of the Haynesville and Our Acreage
The Haynesville shale and the overlying Mid-Bossier shale were deposited in a Jurassic basin that covers more than 9,000 square miles and includes eight parishes in North Louisiana and eight counties in East Texas, collectively called the Haynesville. These shales were deposited in a deep, restricted basin that preserved the rich organic content and through subsequent burial, developed strong reservoir properties, including becoming over-pressured and preserving porosity and permeability. Within our acreage position, the Haynesville ranges from 11,500 ft to over 13,500 ft deep and can be as thick as 200 ft. The Mid-Bossier overlays the Haynesville and ranges from 11,000 ft to 13,000 ft deep and can be as thick as 350 ft.
Although this area has seen almost continuous drilling since oil and gas was discovered in the early 1900s, the prospectivity of the Haynesville was not widely recognized until 2005. During this time, Encana and other
90
Table of Contents
operators acquired significant acreage in North Louisiana to extend the East Texas Bossier play. Encana drilled and tested Haynesville discovery wells during 2005 and 2006 and subsequently entered into a joint venture with Shell for the development of this acreage position. During this time, certain members of our management team were part of, and integral to, the Encana team. We purchased Shell’s interest in this acreage during 2014 and GEP purchased the Encana portion during 2015.
In 2010, at the height of its activity, over 200 rigs were active in the Haynesville as producers drilled wells to preserve leasehold positions, creating significant oilfield services and midstream infrastructure that remains today to accommodate the current development activity and contribute to the low basis differentials in the basin. Furthermore, the basin is well positioned to capitalize on LNG demand, growing population centers in the southern United States, expanding petrochemical capacity in the Gulf Coast region, and the retirement of selected coal-fired electricity plants.
Since peak activity in 2010, our industry has made significant advances in drilling and completion technology and techniques, including long lateral development, geo-steering techniques and changes in completion intensity and design. These trends have resulted in increased EURs per lateral foot, a trend which continues with our most recent well design. We believe our EURs per lateral foot and the resulting Breakeven PV-10 levels compare favorably with the most prolific basins in North America. At the same time, our average drilling and completion times and well costs have decreased, which have yielded enhanced economics for development of our reserves.
In January 2011, Louisiana began allowing cross-unit horizontal drilling. Prior to this rule change, lateral lengths could not exceed 5,000 feet in length. With this change in regulation, operators can now develop wells that cross section lines and more efficiently develop the acreage using long laterals. We believe our large and relatively contiguous position combined with a streamlined regulatory approval process provides us with an opportunity to capitalize on a development plan that features multi-section lateral lengths.
We believe that we have been instrumental in the revitalization of the Haynesville since entering the basin in 2014 through the purchase of Shell’s interest. Since we began our drilling program in 2015, we have participated in over 280 wells, and been at the forefront of advancements in drilling and completion optimization techniques such as increasing lateral lengths, proppant concentration, water intensity, cluster spacing and reservoir pressure drawn-down management. Enverus projects that the current number of rigs running in the Haynesville will increase from the current figure of approximately 43 rigs up to 50 rigs over the next 12 to 18 months, which compares to 2020 average rigs of 37.
Business Strategy
Our strategy is to draw upon our management team’s experience in developing natural gas resources to generate levered free cash flow while achieving modest growth in our production and reserves and thus enhance our value. Our strategy has the following principal elements:
| • | Optimize Return-On-Capital Through Focus on Profitably Increasing Well Recoveries While Minimizing Costs. Since 2017, we have drilled, on average, longer-lateral wells and further optimized our completion design, resulting in increased EURs compared to our prior drilling programs. From our initial Vintage 1 wells drilled in 2015 to our Vintage 5 wells in 2019 and 2020, EURs have increased from 1.4 Bcf per 1,000 lateral feet to 2.1 Bcf per 1,000 lateral feet. Simultaneous with recovery improvements, D&C costs per lateral foot have declined while lateral lengths have increased, indicating both capital efficiency gains and improvements in per Mcf economics. Our capital program in 2018 was concentrated on the evaluation of well density and key elements of our completion design, and, based on successful tests, our 2019 and 2020 capital program focused on longer lateral development, completion optimization and cycle time improvements. We focus on developing the maximum recovery of gas and economic value for every section we operate by adjusting the number of wells per section as market conditions change. We look for opportunities to reduce capital costs based on market conditions and we are focused on locking in reduced costs as a result of recent industry-wide decreases in demand for oilfield services. Additionally, we continue to rely on strategic alliances with third |
91
Table of Contents
| parties to reduce lease operating expenses for items such as chemicals and self-source higher cost services like water disposal to lower our overall operating costs. |
| • | Generate Levered Free Cash Flow While Delivering Modest Production Growth. We maintain a disciplined, cash flow-focused approach to capital allocation. Based on our year-end 2020 reserves, we had a drilling inventory of approximately 900 drilling locations among Vine, Brix and Harvest, or approximately 25 years of development opportunities utilizing an average of 4 gross rigs, which we believe would be sufficient to maintain production. Our remaining drilling inventory has an average payback period of approximately 14 and 24 months at an assumed NYMEX gas price of $2.75 and $2.25 per MMBtu, respectively. The concentration, delineation and scale of our core leasehold positions, coupled with our technical understanding of the reservoirs, allows us to efficiently develop our acreage to generate levered free cash flow, increase sectional recoveries over time and enhance the value of our resource base. We believe that our extensive inventory of low-risk drilling locations, combined with our operating expertise and completion design evolution, will enable us to continue to deliver significant levered free cash flow while modestly growing production and reserves. |
| • | Leverage our Deep Experience in the Haynesville to Develop Industry-Leading Business Practices and Technology. Eric D. Marsh, our President and Chief Executive Officer, and other key members of our management participated in the early development of the Haynesville. Through their experience, they developed expertise that allows for continued advancement of industry-leading well completion techniques and drilling and development efficiencies. We continue to develop and apply industry-leading practices to manage D&C costs and maximize the recovery factor of gas in place. We have also realized significant improvements in our development efficiency over time, including a reduction in drilling and completion days, which contribute to lower well costs. We employ enhanced completion techniques through increased fracture stages, optimized proppant loading and pumping intensity and reduced cluster spacing and drilling-related efficiencies through multi-well pads and longer laterals. These measures have allowed us to lower D&C costs per lateral foot while yielding increased EURs, thereby improving our capital efficiency and returns, while also reducing the number of short laterals and associated surface equipment required to develop our resource. |
| • | Maintain a Disciplined Financial Strategy. We intend to fund our operations predominantly with internally generated cash flows while maintaining ample liquidity to weather commodity cycles. We target spending approximately 65% to 75% of our operating cash flow on CapEx to maintain or modestly increase production, with the remaining amount being available, initially, for debt repayment. We seek to protect future cash flows and liquidity levels through a multi-year commodity hedge program and through physical firm sales agreements with multiple credit-worthy counterparties. We expect that our new credit agreement that we will enter into contemporaneously with the closing of this offering will give us significant flexibility to hedge a large percentage of our total expected production. To further reduce volatility in our cash flows and returns, we will also seek to enter into contracts for oilfield services that are no longer than the periods covered by our commodity hedges. In addition, pro forma for this offering, we anticipate that our total net debt to Adjusted EBITDAX ratio for the year-ended December 31, 2020 will be approximately 2.0x, which is among the lowest for publicly traded gas-focused upstream companies. We intend to target modest financial leverage of total net debt to Adjusted EBITDAX of 1.0x to 1.5x and use levered free cash flow to further reduce outstanding debt. While we will prioritize debt paydown as the primary use of levered free cash flow until our targeted leverage ratios are met, we may evaluate potential acquisition opportunities that are highly strategic to us, but we will pursue them only to the extent they are accretive and meet our financial strategy and operational objectives. Adjusted EBITDAX is not a financial measure calculated in accordance with GAAP. We believe that Adjusted EBITDAX provides important information regarding our operating results. “Prospectus Summary—Non-GAAP Financial Measures” contains a description of each of this measure and a reconciliation to the most directly comparable GAAP measure. |
| • | Steward the Health and Safety of our Employees, our Community and the Environment. Since peaking in 2007 at 6,003 MMmt, the EIA reports that total domestic energy sector related CO2 emissions have declined by 14.5% (873 MMmt) by 2019 and they cite the increasing use of natural gas in power generation as a key driver of this trend. While we believe the lower carbon intensity of using natural gas as opposed to coal in |
92
Table of Contents
| electric power generation in and of itself contributes meaningfully to lower CO2 emissions, we further believe that the benefits of natural gas are enhanced by reducing production related CO2, methane and other emissions. To that end, minimizing production related emissions is a core competency of our business and we continually seek to identify, accurately measure and reduce emission related to our business. From 2017 to 2020, our CO2e per Bcf of production declined 35% from 686 mT CO2e/Bcf to 444 mT CO2e/Bcf while our methane intensity decreased 77% from 0.061% to 0.014% of production, below BP by comparison, an industry leader at 0.14% of production across its more diverse asset base. In addition, we emphasize rigorous health and safety protocols in all aspects of our business and have demonstrated strong safety performance. Our total recordable incident frequency rate averaged 0.31 from 2017 through 2020 and 0.09 for 2020, both of which are well below the American Exploration and Production Council 2019 average of 0.47 and the U.S. Bureau of Labor Statistics E&P Support Activities Benchmark of 0.60. |
Business Strengths
We have a number of strengths that we believe will help us successfully execute our business strategy and generate levered free cash flow, including:
| • | We Believe we are Among the Most Economic Natural Gas Producers in North America. We own leases across an extensive, largely contiguous and fully delineated acreage position spanning approximately 125,000 net surface acres and approximately 230,000 net effective acres centered in what we believe to be the core of the Haynesville and Mid-Bossier. Our highly concentrated acreage position promotes more efficient development through the drilling of longer laterals, the ability to utilize multi-zone bi-directional well pads and limited need for additional gathering expansion. Longer laterals are significantly more capital efficient with a 10,000 ft lateral having up to four times the PV-10 at a $2.75 NYMEX price per MMBtu, but less than two times the cost, when compared to our standard lateral. Research from Enverus projects that the average Haynesville Basin core well generates a 31% rate of return using a NYMEX gas price of $2.75 per MMBtu, which Enverus ranks as the highest among notable shale plays in North America. Moreover, based on the location of our acreage, which is in some of the most prospective parts of the Haynesville, we believe our weighted average rate of return based on internal cost assumptions for our remaining core drilling locations is 85% at a NYMEX gas price of $2.75 per MMBtu. Additionally, given the high initial productivity of our wells, we typically recover approximately 45% of a well’s EUR in the first 12 months of production. As of December 31, 2020, our drilling inventory consisted of approximately 900 drilling locations among Vine, Brix and Harvest in both the Haynesville and Mid-Bossier, which included approximately 450 drilling locations where we intend to utilize laterals 5,300 ft or greater. Utilizing an average of 4 gross rigs among Vine, Brix and Harvest, which we believe is sufficient to maintain production, we believe we have approximately 25 years of development opportunities. Our average production for the quarter ended December 31, 2020 was 944 MMcfd. We consider our drilling inventory to be low risk because it is located in areas where we (and other producers) have extensive drilling and production experience with production results exhibiting higher repeatability versus other natural gas plays. There have been over 700 gross horizontal wells drilled across our position, of which we participated in over 280 since 2015, providing us substantial well performance data. In addition to the over 700 wells drilled on our acreage, more than 1,000 wells have been drilled within one mile of our position, further supporting our economic expectations. |
| • | High-Margin, Low Operating Cost Structure that Generates Significant Levered Free Cash Flow. Our free cash flow is primarily attributable to our industry-leading operating margins and low operating costs. For the year-ended December 31, 2020 and pro forma for the reorganization transactions, we achieved a 72.2% operating margin, which we calculate by dividing our Adjusted EBITDAX by our revenues, which are inclusive of natural gas sales and realized gains and losses on commodity derivatives. In the year-ended December 31, 2020 and pro forma for the reorganization transactions, our lease operating expense of $0.20 per Mcf and our general and administrative expense of $0.05 per Mcf were among the lowest in our peer group. We have implemented several initiatives to enhance and manage our production in the region and reduce operating costs. In early 2015, we established a technologically advanced 24-hour automated command center from which we can remotely control most field-wide production operations from a single location, allowing us |
93
Table of Contents
| to remotely bring wells online and manage existing production. This level of automation reduces manpower needs and allows operators to focus on production efficiency, by, among other things, efficiently deploying labor through a centralized operating center. Moreover, we have significantly reduced our operating cost per unit by vertically integrating through the drilling and operation of our own produced water disposal wells. As we continue to bring new wells online, we expect our unit costs will continue to decline. We continue to increase margins through operational efficiencies, more effective gas treating solutions and improved maintenance programs. In drilling locations where our working interest exceeds 20%, we hold an approximate 83% working interest and operate over 90% of such wells. We believe this gives us a high degree of control over our development program, allowing us to be responsive to changes in the commodity price environment. Levered free cash flow is not a financial measure calculated in accordance with GAAP, but we believe it provides important information regarding our operating cash flow. “Prospectus Summary—Non-GAAP Financial Measures” above contains a description of levered free cash flow and a reconciliation to net cash provided by operating activities. |
| • | Close Proximity to Premium Markets and Ample Available Midstream Infrastructure. Our acreage position is in close proximity to premium markets and LNG facilities along the Gulf Coast, which results in lower and less volatile basis differentials and higher netbacks compared to other plays, including gas plays such as the Marcellus, Utica and those in the Rockies. As a result of these attractive takeaway and sales dynamics, our basis differentials have remained tightly banded since our inception, ranging from $0.01 to $0.26 per MMBtu; over this same period, basis differentials in Appalachia and the Rockies have ranged from $0.27 to $1.54 and $0.12 to $0.96 per MMBtu, respectively. We believe this allows producers in our basin to benefit from better unit economics. Low-cost legacy gathering infrastructure is in place across our acreage to support our development program. Our gathering cost for the year-ended December 31, 2020 was $0.31 per Mcfe, which compares favorably to $1.20 per Mcfe reported by publicly traded Appalachian-focused natural gas producers for the comparable period. Further, we are not party to any transportation contracts or similar commitments and our small amount of minimum volume commitments in our gathering contracts are well covered by current production volumes. Because we only produce dry gas, we have minimal cost to treat our gas to meet pipeline specifications, which may give us an economic advantage over wet gas plays during periods of low pricing for NGLs, as is currently taking place. Additionally, we do not have any of the emissions related to wet gas separation, storage or transportation. |
| • | Well Capitalized Balance Sheet that Provides Flexibility to Execute our Business Plan. Pro forma for this offering, we anticipate total net debt to Adjusted EBITDAX for the year-ended December 31, 2020 of approximately 2.0x, which would be among the lowest for publicly traded gas-focused upstream companies. Contemporaneously with the closing of this offering, we expect to enter into a new reserve-based lending facility led by Citibank. This facility is expected to have a total facility size of $750 million, a borrowing base of $350 million and available capacity of $316 million (after giving effect to $25 million of letters of credit to be issued at closing) based on projected as adjusted borrowings of approximately $9 million pro forma for this offering, resulting in projected liquidity of approximately $350 million as of December 31, 2020. Finally, we maintain an active hedge program and as of December 31, 2020 have hedged an average of 819 Bbtud, 492 Bbtud and 186 Bbtud for 2021, 2022 and 2023, respectively, at weighted average swap prices of $2.56 per MMBtu, $2.55 per MMBtu and $2.49 per MMBtu, respectively. Moreover, our Second Lien Term Loan requires us to have 70% of our total expected production hedged 24 months forward. We believe our balance sheet and hedge program provide ample liquidity in the event of an adverse commodity price environment to enable us to continue to generate levered free cash flow. |
| • | High Caliber and Experienced Management and Technical Team. Our senior management team has substantial experience in the Haynesville, as well as other premier North American resource plays, and has collectively operated large development programs that helped commercialize the Haynesville attained market-leading D&C costs, decreased operating costs and generated increased EURs. Additionally, we have assembled a strong technical supporting staff of petroleum engineers and geologists that have extensive Haynesville, and Mid-Bossier experience. We believe our team’s expertise will continue to drive drilling, completion and operational improvements that result in improved recoveries and capital efficiency. Furthermore, our |
94
Table of Contents
| management team’s operational and financial discipline, as well as its extensive experience in leadership roles at public companies, gives us confidence in our ability to successfully manage a public company platform. |
| • | Leader in Environmental, Governance and Societal Responsibilities of the Natural Gas Production Sector. According to the EIA, since it began tracking CO2 emissions in 1990, the increased market share of natural gas in electrical power generation has been a leading driver in reducing energy sector CO2 emissions. Not only do we produce the fuel that is the cornerstone of this accomplishment, we invest significantly in the human capital, equipment and technology that allows us to produce natural gas safely, efficiently and with minimal related emissions. While emissions reductions is a focus for all of our employees, we have 5 employees specifically dedicated to environmental, health and safety matters, including emissions reductions. For example, our sustainability efforts include 100% green completions, 100% non-potable water usage, and 100% solar-generated wellsite electricity. Additionally, we have peer leading CO2 emissions at 2.6 mT per MBOE per well and methane intensity of only 0.014% of gas produced. Additionally, we and our employees make commitments of financial resources and time to assist underserved members in the communities where we operate and our employees live. Moreover, we value diversity in our work force, including our executive leadership team, which is relatively evenly split 60% / 40% between men and women. |
Recent Developments
The outbreak of COVID-19 has significantly decreased the demand for hydrocarbons, particularly oil. As a result of the COVID-19 pandemic or other adverse public health developments, including voluntary and mandatory quarantines, travel restrictions, and other restrictions, our operations, and those of our subcontractors and customers, have experienced, and are anticipated to continue to experience, delays or disruptions and temporary suspensions of operations.
Reduction in oil and gas activity as a result of the COVID-19 pandemic has resulted in a decrease of associated gas production as fewer oil wells are drilled in the Permian Basin and other liquids-weighted basins, which has led to a contraction in domestic gas supply. Lower levels of supply have pushed current and forecasted gas prices higher, which has had a positive impact on our results of operations and cash flows. We expect that the reduction in drilling activity and rig counts may contribute to a shortage in the supply of natural gas in the future, which could result in higher gas prices. As a result, although gas prices were on average lower in 2020 than 2019, gas prices trended higher after the effects of the COVID-19 pandemic began to take hold and slow oil production towards the middle of 2020. As the factors described above reduced the supply of oil and gas, gas prices increased towards the end of 2020 as compared to the prices in the months prior to and during the beginning of the COVID-19 pandemic. For reference, the Henry Hub spot price for natural gas averaged $2.22 per MMBtu from August 2019 to March 2020, $1.72 per MMBtu from April 2020 to June 2020, $2.32 per MMBtu for the remaining six months of 2020 exiting the year at $2.90 per MMBtu in December 2020 and $2.69 per MMBtu from January 2021 to March 2021. However, because of our obligation to hedge 70% of our production for the next 24 months, we will be limited in the benefit we would otherwise realize from any such price increases. To the extent, however, that natural gas prices decrease, these lower prices not only reduce our revenue and cash flows, but also may limit the amount of natural gas that we can develop economically and therefore potentially lower our proved reserves. Lower commodity prices in the future could also result in impairments of our natural gas properties. The occurrence of any of the foregoing could materially and adversely affect our future business, financial condition, results of operations, operating cash flows, liquidity or ability to fund planned CapEx. Alternatively, natural gas prices may increase, which while increasing revenue and cash flows would result in significant losses being incurred on our derivatives.
We are taking precautions as an organization to protect our employees and community during this time. Vine has undertaken a number of proactive measures to reduce the spread of the virus and maintain the safety and health of its workforce, including, among other things, implementing comprehensive screening at operational bases throughout the organization.
95
Table of Contents
Concurrently, deterioration of production agreements between key global oil producers has led to an increase in supply. In addition to the effects of the COVID-19 pandemic, the confluence of these factors has caused significant volatility in oil and gas prices. In response, many producers in North America have significantly reduced drilling activity. The land rig count in North America fell from 771 in mid-March of 2020 to 244 in mid-August of 2020 and has recovered slightly to 373 by January of 2021.
The reduction in activity has resulted in a decrease of associated gas production as fewer oil wells are drilled in the Permian Basin and other liquids-weighted basins, which has led to a contraction in domestic gas supply. Lower levels of supply have pushed current and forecasted gas prices higher. We expect that the reduction in drilling activity and rig counts may contribute to a shortage in the supply of natural gas in the future, which could result in higher gas prices.
The significant reduction in drilling and completion activity has also reduced demand for oilfield services and providers of these services have reduced their pricing as a result. Coupled with the improvement in drilling and completion. cycle times achieved by our operational staff of approximately 14-19% in 2020, we have seen our well costs fall approximately 20% from an average of $1,521 per lateral foot in the first half of 2019 to $1,241 per lateral foot for the second half of, 2020, as illustrated in the table below. We expect, given the trajectory of demand reduction for oilfield services, along with our continued realization of operational efficiencies, that D&C costs will continue to decrease. In addition, we have undertaken several initiatives to optimize our operating cost structure in order to be well positioned to operate through periods of market and commodity price volatility. These actions include entering into term contracts with key vendors at attractive rates and continued operational efficiencies.
Recent Debt Transactions
On December 30, 2020, we entered into the Second Lien Term Loan and used the proceeds, along with cash on hand, to repay the aggregate principal amount of loans outstanding under the Superpriority Facility in connection with the entry into the amendment to and extension of the RBL. The Second Lien Term Loan has a total facility size of $150 million and was fully drawn at closing.
The maturity of the RBL was extended to January 15, 2023 and availability under the facility was reduced from $350 million to $300 million and will reduce further on a quarterly basis to $100 million at December 31, 2022. Other than these quarterly reductions in availability, there are no borrowing base redeterminations. The pricing grid was increased by 1.00% to LIBOR + 2.50% to 3.50% based on utilization. We intend to use the net proceeds from this offering and borrowings under the New RBL to repay in full and terminate each of the RBL and the Brix Credit Facility.
The Second Lien Term Loan bears interest at a rate equal to LIBOR, with a floor of 0.75%, plus 8.75% per annum, payable monthly, and matures on the earlier to occur of (a) December 30, 2025 and (b) 90 days prior to the maturity of the 9.75% Notes or 8.75% Notes, to the extent specified amounts of such indebtedness remain outstanding. The Second Lien Term Loan is redeemable beginning June 30, 2022 at 102% of par value, stepping down to 101% of par value on June 30, 2023 and at par value on June 30, 2024 and thereafter.
The Second Lien Term Loan is secured on a junior lien basis by all of our assets and stock and the subsidiaries that secure the RBL.
96
Table of Contents
The Second Lien Term Loan provides for a quarterly Consolidated Total Net Leverage Ratio financial maintenance covenant of 4.00x, stepping down to 3.50x with the quarter ended June 30, 2021 and thereafter, similar to the RBL. The Second Lien Term Loan also contains customary incurrence-based covenants for issuances of this type, including restrictions on the incurrence of liens, indebtedness, asset dispositions, fundamental changes, transactions with affiliates, restricted payments and other customary covenants, along with the requirement to maintain liquidity of no less than $40 million, tested quarterly.
In December 2019, we entered into the Third Lien Credit Agreement with Blackstone Holdings Finance Co LLC, as administrative agent and collateral agent and certain other banks, financial institutions and other lending institutions from time to time party thereto. At that time, the Third Lien Credit Agreement was secured on a second lien basis, but was subordinated to a third lien in December 2020 in connection with the entry into the Second Lien Credit Agreement. The Third Lien Credit Agreement provides for a revolving credit facility in an amount up to $330 million, and bears interest at a rate of LIBOR plus 9.75% per annum. In addition, a commitment fee of 0.424% per annum is charged on the unutilized balance of the committed borrowing base and is included in interest expense. The Third Lien Credit Agreement matures on March 15, 2023. We expect to terminate our Third Lien Credit Facility in connection with this offering.
New RBL
Contemporaneously with the closing of this offering, we expect to enter into the New RBL led by Citibank. This facility is expected to have a total facility size of $750 million, a borrowing base of $350 million and available capacity of $316 million (after giving effect to approximately $25 million of letters of credit to be issued at closing) based on projected as adjusted borrowings of approximately $9 million pro forma for this offering, resulting in projected liquidity of approximately $350 million as of December 31, 2020. The New RBL will contain various conditions precedent, including the requirement to terminate the Third Lien Credit Agreement.
The New RBL will bear interest at a rate equal to LIBOR plus an additional margin, based on the percentage of the revolving commitment being utilized, ranging from 3.00% to 4.00%, with a LIBOR ‘floor’ of 0.50%. The New RBL matures on the earlier to occur of (a) 45 months after the closing of this offering, (b) 91 days prior to the maturity of the Second Lien Term Loan, to the extent any of such indebtedness remains outstanding, and (c) 91 days prior to the maturity of the 9.75% Notes or 8.75% Notes, to the extent specified amounts of such indebtedness remain outstanding. There will also be a commitment fee of 0.50% on the undrawn borrowing base amounts. The New RBL will be secured on a senior basis by substantially all of our assets and stock and guaranteed by the subsidiaries that secure and guarantee the Second Lien Term Loan.
The New RBL will provide for a quarterly Consolidated Total Net Leverage Ratio financial maintenance covenant of 3.25x beginning with the quarter ended June 30, 2021, a quarterly Current Ratio maintenance covenant of 1.00x beginning with the quarter ended June 30, 2021 and a $100 million weekly minimum liquidity covenant that is applicable starting 180 days prior to the maturity of the indebtedness under the Second Lien Term Loan, the 9.75% Notes or the 8.75% Notes, to the extent any of such indebtedness is outstanding. The New RBL will also contain customary incurrence-based covenants for facilities of this type, including restrictions on the incurrence of liens, indebtedness, asset dispositions, fundamental changes, transactions with affiliates, restricted payments and other customary covenants.
The credit agreement governing the New RBL will also contain customary events of default, including non-payment, breach of covenants, materially incorrect representations, cross-default, bankruptcy and change of control.
97
Table of Contents
2021 CapEx and Financing Activities
We expect our 2021 capital program to be approximately $340 to $350 million of which $310 to $320 million is allocated for D&C operations. The remaining $30 million of our capital program is designated for non-D&C items. We plan to fund our 2021 CapEx through cash flow from operations, proceeds from this offering and borrowings under our New RBL. Further, we intend to monitor conditions in the debt capital markets and may determine to issue long-term debt securities, including potentially in the near term, to fund a portion of our 2021 CapEx or refinance a portion of our existing indebtedness. We cannot predict with certainty the timing, amount and terms of any future issuances of any such debt securities.
Our Operations
Reserve Data and Presentation
The information with respect to our estimated reserves has been prepared in accordance with the rules and regulations of the SEC, except that the table which provides our reserves at “strip pricing” uses pricing based on NYMEX futures prices for natural gas as explained below. Our estimated proved reserves as of December 31, 2020 and December 31, 2019 are based on valuations prepared by our independent reserve engineer assuming a 30-year reserve life. Copies of the summary reports of our reserve engineers as of December 31, 2020 and December 31, 2019 are filed as exhibits to the registration statement of which this prospectus forms a part. “Preparation of Reserve Estimates” contains additional definitions of proved reserves and the technologies and economic data used in their estimation. The following tables summarize estimated reserves based on reports prepared by Von Gonten, our independent reserve engineer. The information in the following tables does not give any effect to or reflect our commodity hedge portfolio.
98
Table of Contents
Summary of Reserves as of December 31, 2020 Based on SEC Pricing
The following table provides the combined historical and estimated reserves of Vine Oil & Gas, Brix and Harvest and the three entities on a combined basis at December 31, 2020 using the provisions of the SEC rule regarding reserve estimation regarding a historical twelve month pricing average applied prospectively.
| At December 31, 2020(1)(2) |
||||
| (MMcf) | ||||
| Vine Oil & Gas |
||||
| Estimated proved reserves: |
||||
| Natural gas |
1,802,118 | |||
| Total proved developed reserves |
446,243 | |||
| Percent proved developed |
25 | % | ||
| Total proved undeveloped reserves |
1,355,875 | |||
| Estimated probable undeveloped reserves: |
||||
| Natural gas |
1,878,220 | |||
| Estimated possible undeveloped reserves: |
||||
| Natural gas |
150,972 | |||
| Brix and Harvest |
||||
| Estimated proved reserves: |
||||
| Natural gas |
511,381 | |||
| Total proved developed reserves |
143,917 | |||
| Percent proved developed |
28 | % | ||
| Total proved undeveloped reserves |
367,464 | |||
| Estimated probable undeveloped reserves: |
||||
| Natural gas |
356,502 | |||
| Estimated possible undeveloped reserves: |
||||
| Natural gas |
42,695 | |||
| Combined |
||||
| Estimated proved reserves: |
||||
| Natural gas |
2,313,499 | |||
| Total proved developed reserves |
590,160 | |||
| Percent proved developed |
26 | % | ||
| Total proved undeveloped reserves |
1,723,339 | |||
| Estimated probable undeveloped reserves: |
||||
| Natural gas |
2,234,722 | |||
| Estimated possible undeveloped reserves: |
||||
| Natural gas |
193,667 | |||
| (1) | Our reserve information reflects an assumed 30-year reserve life. |
| (2) | Our estimated proved reserves were determined using average first-day-of-the-month prices for the prior 12 months in accordance with SEC guidance. As of December 31, 2020, the SEC Price Deck was $1.99 per MMBtu (Henry Hub Price) for natural gas. In determining our reserves, the SEC Price Deck was adjusted for basis differentials and other factors affecting the prices we receive, which yielded a price of $1.73 per Mcf. “Business—Our Operations—Reserve Data—Adjusted Index Prices Used in Reserves Calculations” below contains the adjusted realized prices under strip pricing. |
99
Table of Contents
Summary of Reserves as of December 31, 2019 Based on SEC Pricing
The following table provides the combined historical and estimated reserves of Vine Oil & Gas, Brix and Harvest and the three entities on a combined basis at December 31, 2019 using the provisions of the SEC rule regarding reserve estimation regarding a historical twelve month pricing average applied prospectively.
| At December 31, 2019(1)(2) |
||||
| (MMcf) | ||||
| Vine Oil & Gas |
||||
| Estimated Proved Reserves: |
||||
| Natural gas |
2,209,833 | |||
| Total proved developed reserves |
447,966 | |||
| Percent proved developed |
20 | % | ||
| Total proved undeveloped reserves |
1,761,867 | |||
| Estimated Probable undeveloped Reserves: |
||||
| Natural gas |
3,585,933 | |||
| Estimated Possible undeveloped Reserves: |
||||
| Natural gas |
455,783 | |||
| Brix and Harvest |
||||
| Estimated Proved Reserves: |
||||
| Natural gas |
652,194 | |||
| Total proved developed reserves |
138,258 | |||
| Percent proved developed |
21 | % | ||
| Total proved undeveloped reserves |
513,936 | |||
| Estimated Probable undeveloped Reserves: |
||||
| Natural gas |
729,750 | |||
| Estimated Possible undeveloped Reserves: |
||||
| Natural gas |
169,917 | |||
| Combined |
||||
| Estimated Proved Reserves: |
||||
| Natural gas |
2,862,027 | |||
| Total proved developed reserves |
586,224 | |||
| Percent proved developed |
20 | % | ||
| Total proved undeveloped reserves |
2,275,803 | |||
| Estimated Probable undeveloped Reserves: |
||||
| Natural gas |
4,315,683 | |||
| Estimated Possible undeveloped Reserves: |
||||
| Natural gas |
625,700 | |||
| (1) | Our reserve information reflects an assumed 30-year reserve life. |
| (2) | Our estimated proved reserves were determined using average first-day-of-the-month prices for the prior 12 months in accordance with SEC guidance. As of December 31, 2019, the SEC Price Deck was $2.58 per MMBtu (Henry Hub Price) for natural gas. In determining our reserves, the SEC Price Deck was adjusted for basis differentials and other factors affecting the prices we receive, which yielded a price of $2.31 per Mcf. “Business—Our Operations—Reserve Data—Adjusted Index Prices Used in Reserves Calculations” below contains the adjusted realized prices under strip pricing. |
100
Table of Contents
Proved Undeveloped Reserves (in MMcf)
The following reconciliation from 2019 to 2020 is presented to meet SEC requirements to provide material changes to proved undeveloped reserves of Vine Oil & Gas, Brix and Harvest and the three entities on a combined basis during the year.
| Vine Oil & Gas |
||||
| Proved undeveloped reserves at December 31, 2019 |
1,761,867 | |||
| Conversions into proved developed reserves(1) |
(225,659 | ) | ||
| Extensions and discoveries(2) |
630,571 | |||
| Revisions(3) |
(810,904 | ) | ||
|
|
|
|||
| Proved undeveloped reserves at December 31, 2020 |
1,355,875 | |||
|
|
|
|||
| Brix and Harvest combined |
||||
| Proved undeveloped reserves at December 31, 2019 |
513,936 | |||
| Conversions into proved developed reserves(1) |
(63,905 | ) | ||
| Extensions and discoveries(2) |
220,381 | |||
| Revisions(4) |
(302,948 | ) | ||
|
|
|
|||
| Proved undeveloped reserves at December 31, 2020 |
367,464 | |||
|
|
|
|||
| Combined |
||||
| Proved undeveloped reserves at December 31, 2019 |
2,275,803 | |||
| Conversions into proved developed reserves(1) |
(289,564 | ) | ||
| Extensions and discoveries(2) |
850,952 | |||
| Revisions(5) |
(1,113,852 | ) | ||
|
|
|
|||
| Proved undeveloped reserves at December 31, 2020 |
1,723,339 | |||
|
|
|
| (1) | Conversion of proved undeveloped drilling locations during 2020. |
| (2) | Extensions and discoveries represent extensions to reserves attributable to additional gross drilling locations to be developed by 2025 (as that year entered the 5-year development window), reflect updated future rig count and include development plan revisions and related timing adjustments. |
| (3) | Revision of previous estimates reflect changes in previous estimates attributable to negative changes in economic factors of 712,255 MMcf, combined with negative changes in non-economic factors of 98,649 MMcf, including: |
| • | Economic factors include revisions caused by commodity prices (decrease of 1,128,264 MMcf) offset by positive overall cost reductions (increase of 416,009 MMcf) |
| • | Non-economic factors include well performance improvements (increase of 293,313 MMcf), working interests revisions (increase of 15,266 MMcf), changes resulting from the removal of proved undeveloped locations (decrease of 579,598 MMcf) and other revisions due to changes in a previously adopted development plan (increase of 172,370 MMcf) |
| (4) | Revision of previous estimates reflect changes in previous estimates attributable to negative changes in economic factors of 254,540 MMcf, combined with negative changes in non-economic factors of 48,408 MMcf, including: |
| • | Economic factors include revisions caused by commodity prices (decrease of 393,640 MMcf) offset by positive overall cost reductions (increase of 139,100 MMcf) |
| • | Non-economic factors include well performance improvements (increase of 26,964 MMcf), working interests revisions (increase of 9,163 MMcf), changes resulting from the removal of proved undeveloped locations (decrease of 70,388 MMcf) and other revisions due to changes in a previously adopted development plan (decrease of 14,147 MMcf) |
101
Table of Contents
| (5) | Revision of previous estimates reflect changes attributable to negative changes in economic factors of 966,795 MMcf, combined with negative changes in non-economic factors of 147,057 MMcf, including: |
| • | Economic factors include revisions caused by commodity prices (decrease of 1,521,904 MMcf) offset by positive overall cost reductions (increase of 555,109 MMcf) |
| • | Non-economic factors include well performance improvements (increase 320,277 MMcf), working interests revisions (increase of 24,429 MMcf), changes resulting from the removal of proved undeveloped locations (decrease of 649,986 MMcf) and other revisions due to changes in a previously adopted development plan (increase of 158,223 MMcf) |
Extensions and discoveries represent extensions to reserves attributable to additional gross drilling locations to be developed by 2025 (as that year now enters the 5-year development window) and reflect updated future rig count. These locations reside within the five year development window, which permits their recognition as proved undeveloped reserves based upon their continuing satisfaction of the engineering requirements for recognition as proved reserves. Extensions and discoveries to proved undeveloped reserves included the addition of new locations associated with our drilling program, improvements to development plan to optimize for longer lateral development and additional Mid-Bossier drilling in the five year development window.
During 2020, we incurred costs of $246 million to convert 289,564 MMcf of proved undeveloped reserves to proved developed reserves. Estimated future development costs relating to the development of our proved undeveloped reserves at December 31, 2020 are approximately $2.1 billion over the next five years, which we expect to finance through operating cash flow and available capacity under our RBL. Based on our reserve report as of December 31, 2020, we had 278 and 130 identified drilling locations in the Haynesville Shale and Mid-Bossier Shale, respectively, associated with proved undeveloped reserves. The Haynesville wells are prioritized accordingly to drill the deepest target first, while we continue to optimize the development of the shallower Mid-Bossier formation jointly with the Haynesville Shale where feasible. “Risk Factors” contains additional information regarding the risks associated with development of our reserves.
Sensitivity of Reserves Based on Future Strip Pricing
The following table provides the combined historical and estimated reserves of Vine Oil & Gas, Brix and Harvest and the three entities on a combined basis at December 31, 2020, using NYMEX strip prices as of market close on December 31, 2020. We have included this reserve sensitivity in order to provide a measure that is more reflective of the fair value of our assets and the cash flows that we expect to generate from those assets. The historical 12-month pricing average in our 2020 disclosures above does not reflect the prevailing gas futures. We believe that the forward-looking nature of strip pricing provides investors with a more meaningful measure of value and enhances their ability to make decisions regarding their investment in us. In addition, we believe strip pricing provides relevant and useful information because it is widely used by investors in our industry as a basis for comparing the relative size and value of our proved reserves to our peers and in particular addresses the impact of differentials compared with our peers. Our estimated net proved reserves based on NYMEX futures were otherwise prepared on the same basis as our SEC reserves for the comparable period.
102
Table of Contents
Actual future prices may vary significantly from the NYMEX prices on December 31, 2020; therefore, actual revenue and value generated may be more or less than the amounts disclosed. “Risk Factors—Risks Related to Our Business—Natural gas prices are volatile. A reduction or sustained decline in prices may adversely affect our business, financial condition or results of operations and our ability to meet our financial commitments” and “Risk Factors—Risks Related to Our Business—Reserve estimates depend on many assumptions that may turn out to be inaccurate” contain more information regarding the uncertainty associated with price and reserve estimates.
| Strip Pricing(1)(2) | ||||
| (MMcf) | ||||
| Vine Oil & Gas |
||||
| Estimated proved reserves at NYMEX Strip Pricing: |
||||
| Natural gas |
2,364,510 | |||
| Total proved developed reserves |
491,769 | |||
| Percent proved developed |
21 | % | ||
| Total proved undeveloped reserves |
1,872,741 | |||
| Estimated probable undeveloped reserves at NYMEX Strip Pricing |
||||
| Natural gas |
3,600,975 | |||
| Estimated possible undeveloped reserves at NYMEX Strip Pricing |
||||
| Natural gas |
296,890 | |||
| Brix and Harvest |
||||
| Estimated proved reserves at NYMEX Strip Pricing: |
||||
| Natural gas |
786,563 | |||
| Total proved developed reserves |
151,583 | |||
| Percent proved developed |
19 | % | ||
| Total proved undeveloped reserves |
634,980 | |||
| Estimated probable undeveloped reserves at NYMEX Strip Pricing |
||||
| Natural gas |
906,211 | |||
| Estimated possible undeveloped reserves at NYMEX Strip Pricing |
||||
| Natural gas |
130,697 | |||
| Combined |
||||
| Estimated proved reserves at NYMEX Strip Pricing: |
||||
| Natural gas |
3,151,073 | |||
| Total proved developed reserves |
643,352 | |||
| Percent proved developed |
20 | % | ||
| Total proved undeveloped reserves |
2,507,721 | |||
| Estimated probable undeveloped reserves at NYMEX Strip Pricing |
||||
| Natural gas |
4,507,186 | |||
| Estimated possible undeveloped reserves at NYMEX Strip Pricing |
||||
| Natural gas |
427,587 | |||
| (1) | Prices were in each case adjusted for basis differentials and other factors affecting the prices we receive. Our NYMEX futures based reserves were determined using index prices for natural gas, without giving effect to derivative transactions. “Adjusted Index Prices Used in Reserve Calculations” below contains the adjusted realized prices under strip pricing. |
| (2) | In developing our 2020 reserve estimates, we assumed that we would utilize an average of 6 rigs per year for the 5-year development window. |
103
Table of Contents
Adjusted Index Prices Used in Reserve Calculations
The following tables show index prices used in the reserve calculations of each of Vine Oil & Gas, Brix and Harvest as of the dates indicated under both historical SEC pricing and NYMEX futures strip pricing. Actual future prices may vary significantly from the NYMEX prices on December 31, 2020; therefore, actual revenue and value generated may be more or less than the amounts disclosed. “Risk Factors—Risks Related to Our Business—Natural gas prices are volatile. A reduction or sustained decline in prices may adversely affect our business, financial condition or results of operations and our ability to meet our financial commitments” and “Risk Factors—Risks Related to Our Business—Reserve estimates depend on many assumptions that may turn out to be inaccurate” contain more information regarding the uncertainty associated with price and reserve estimates.
| Pricing Used for Proved Reserves as of December 31, 2020 |
||||
| Based on Historical SEC Pricing:: |
||||
| Natural gas (per MMBtu) |
$ | 1.99 | ||
| Natural gas (per Mcf)(1) |
$ | 1.73 | ||
| Pricing Used for Probable Undeveloped Reserves as of December 31, 2020: |
||||
| Based on Historical SEC Pricing: |
||||
| Natural gas (per MMBtu) |
$ | 1.99 | ||
| Natural gas (per Mcf)(1) |
$ | 1.74 | ||
| Pricing Used for Possible Undeveloped Reserves as of December 31, 2020: |
||||
| Based on Historical SEC Pricing: |
||||
| Natural gas (per MMBtu) |
$ | 1.99 | ||
| Natural gas (per Mcf)(1) |
$ | 1.73 | ||
| Pricing Used for Proved Reserves as of December 31, 2019 |
||||
| Based on Historical SEC Pricing:: |
||||
| Natural gas (per MMBtu) |
$ | 2.58 | ||
| Natural gas (per Mcf)(2) |
$ | 2.31 | ||
| Pricing Used for Probable Undeveloped Reserves as of December 31, 2019: |
||||
| Based on Historical SEC Pricing: |
||||
| Natural gas (per MMBtu) |
$ | 2.58 | ||
| Natural gas (per Mcf)(2) |
$ | 2.31 | ||
| Pricing Used for Possible Undeveloped Reserves as of December 31, 2019: |
||||
| Based on Historical SEC Pricing: |
||||
| Natural gas (per MMBtu) |
$ | 2.58 | ||
| Natural gas (per Mcf)(2) |
$ | 2.31 |
| (1) | Adjusted from $1.99 (12-month average) for basis differentials and other factors affecting the prices we receive. |
| (2) | Adjusted from $2.58 (12-month average) for basis differentials and other factors affecting the prices we receive. |
104
Table of Contents
Strip pricing is as of December 31, 2020. The following table shows the strip pricing levels of the reserve calculations for each of Vine Oil & Gas, Brix and Harvest based on NYMEX futures pricing at closing on that date, both as the unweighted arithmetic average of the strip and weighted by the production volumes forecast over the remaining lives of the properties.
| Unweighted | Weighted | |||||||
| Vine Oil & Gas |
||||||||
| Pricing Used for Proved Reserves as of December 31, 2020: |
| |||||||
| Based on NYMEX Future Strip: |
||||||||
| Natural gas (per MMBtu)(1) |
$ | 2.73 | $ | 2.61 | ||||
| Natural gas (per Mcf)(2) |
$ | 2.46 | $ | 2.34 | ||||
| Pricing Used for Probable Reserves as of December 31, 2020: |
| |||||||
| Based on NYMEX Future Strip: |
||||||||
| Natural gas (per MMBtu)(1) |
$ | 2.73 | $ | 2.74 | ||||
| Natural gas (per Mcf)(2) |
$ | 2.46 | $ | 2.47 | ||||
| Pricing Used for Possible Reserves as of December 31, 2020: |
| |||||||
| Based on NYMEX Future Strip: |
||||||||
| Natural gas (per MMBtu)(1) |
$ | 2.73 | $ | 2.74 | ||||
| Natural gas (per Mcf)(2) |
$ | 2.46 | $ | 2.47 | ||||
| Brix and Harvest |
||||||||
| Pricing Used for Proved Reserves as of December 31, 2020: |
| |||||||
| Based on NYMEX Future Strip: |
||||||||
| Natural gas (per MMBtu)(1) |
$ | 2.73 | $ | 2.61 | ||||
| Natural gas (per Mcf)(2) |
$ | 2.45 | $ | 2.33 | ||||
| Pricing Used for Probable Reserves as of December 31, 2020: |
| |||||||
| Based on NYMEX Future Strip: |
||||||||
| Natural gas (per MMBtu)(1) |
$ | 2.73 | $ | 2.75 | ||||
| Natural gas (per Mcf)(2) |
$ | 2.45 | $ | 2.47 | ||||
| Pricing Used for Possible Reserves as of December 31, 2020: |
| |||||||
| Based on NYMEX Future Strip: |
||||||||
| Natural gas (per MMBtu)(1) |
$ | 2.73 | $ | 2.75 | ||||
| Natural gas (per Mcf)(2) |
$ | 2.45 | $ | 2.47 | ||||
| Combined |
||||||||
| Pricing Used for Proved Reserves as of December 31, 2020: |
| |||||||
| Based on NYMEX Future Strip: |
||||||||
| Natural gas (per MMBtu)(1) |
$ | 2.73 | $ | 2.61 | ||||
| Natural gas (per Mcf)(2) |
$ | 2.46 | $ | 2.34 | ||||
| Pricing Used for Probable Reserves as of December 31, 2020: |
| |||||||
| Based on NYMEX Future Strip: |
||||||||
| Natural gas (per MMBtu)(1) |
$ | 2.73 | $ | 2.74 | ||||
| Natural gas (per Mcf)(2) |
$ | 2.46 | $ | 2.47 | ||||
| Pricing Used for Possible Reserves as of December 31, 2020: |
| |||||||
| Based on NYMEX Future Strip: |
||||||||
| Natural gas (per MMBtu)(1) |
$ | 2.73 | $ | 2.75 | ||||
| Natural gas (per Mcf)(2) |
$ | 2.46 | $ | 2.47 | ||||
| (1) | These price levels have not been adjusted for basis differentials and other factors affecting the prices we receive, although the summary information included elsewhere does incorporate the impact of such price differentials and other factors. The period after 2025 spans from 2026 to 2068 and assumes an average price of $2.75 each year, which is the last month strip price. |
| (2) | Adjusted for basis differentials and other factors affecting the prices we receive. |
| 2021 | 2022 | 2023 | 2024 | 2025 | Thereafter | |||||||||||||||||||
| Natural gas (per MMBtu) |
$ | 2.65 | $ | 2.58 | $ | 2.46 | $ | 2.48 | $ | 2.52 | $ | 2.75 | ||||||||||||
105
Table of Contents
Preparation of Reserve Estimates
Our reserve estimates as of December 31, 2020 and December 31, 2019 included in this prospectus are based on reports prepared by Von Gonten, our independent reserve engineer, in accordance with generally accepted petroleum engineering and evaluation principles and definitions and guidelines established by the SEC in effect at such time. Copies of the reports are included as exhibits to the registration statement containing this prospectus. Von Gonten provides a variety of services to the oil and gas industry, including field studies, oil and gas reserve estimations, appraisals of oil and gas properties and reserve reports for their clients. Von Gonten is a Texas Registered Engineering Firm.
Proved reserves are reserves which, by analysis of geoscience and engineering data, can be estimated with reasonable certainty to be economically producible from a given date forward from known reservoirs under existing economic conditions, operating methods and government regulations prior to the time at which contracts providing the right to operate expires, unless evidence indicates that renewal is reasonably certain. Our proved reserves were estimated assuming a 30-year reserve life. The term “reasonable certainty” implies a high degree of confidence that the quantities of oil or natural gas actually recovered will equal or exceed the estimate. The technical and economic data used in the estimation of our proved reserves include, but are not limited to, well logs, geologic maps, well-test data, production data (including flow rates), well data (including lateral lengths), historical price and cost information, and property ownership interests. Our independent reserve engineer uses this technical data, together with standard engineering and geoscience methods, or a combination of methods, including performance analysis, volumetric analysis, and analogy. The proved developed reserves and EURs are estimated using performance analysis and volumetric analysis. The estimates of the proved developed reserves and EURs are used to estimate the proved undeveloped reserves for each proved undeveloped location (utilizing type curves, statistical analysis, and analogy). Proved undeveloped drilling locations that are more than one offset from a proved developed well utilized reliable technologies to confirm reasonable certainty. The reliable technologies that were utilized in estimating these reserves include log data, performance data, log cross sections, seismic data, core data, and statistical analysis.
Estimates of probable and possible reserves are inherently imprecise and are more uncertain than proved reserves, but have not been adjusted for risk due to that uncertainty, and therefore they may not be comparable with each other and should not be summed either together or with estimates of proved reserves. When producing an estimate of the amount of natural gas that is recoverable from a particular reservoir, an estimated quantity of probable reserves is an estimate of those additional reserves that are less certain to be recovered than proved reserves but which, together with proved reserves, are as likely as not to be recovered. Estimates of probable reserves which may potentially be recoverable through additional drilling or recovery techniques are by nature more uncertain than estimates of proved reserves and accordingly are subject to substantially greater risk of not actually being realized by us. Possible reserves are reserves that are less certain to be recovered than probable reserves. Estimates of possible reserves are also inherently imprecise. Estimates of probable and possible reserves are also continually subject to revisions based on production history, results of additional exploration and development, price changes and other factors.
Internal Controls
Our internal staff of petroleum engineers and geoscience professionals works closely with Von Gonten to ensure the integrity, accuracy and timeliness of data furnished to Von Gonten. Periodically, our technical team meets with Von Gonten to review properties and discuss methods and assumptions used by us to prepare reserve estimates.
Von Gonten is an independent petroleum engineering and geological services firm. John M. Parker is the technical person primarily responsible for preparing our estimates. Mr. Parker has worked at Von Gonten for over 8 years as a senior reservoir engineer overseeing several unconventional resources plays including the Haynesville and Mid-Bossier, but has over 25 years of experience in all major producing basins, both domestically and internationally, while working for several private and public oil and gas companies both as a staff engineer and in senior management. Mr. Parker holds Bachelor of Science degrees in both Petroleum Geology and Petroleum Engineering from the University of Kansas. Mr. Parker meets or exceeds the education,
106
Table of Contents
training, and experience requirements set forth in the Standards Pertaining to the Estimating and Auditing Oil and Gas Reserves Information promulgated by the Society of Petroleum Engineers.
Reserve engineering is and must be recognized as a subjective process of estimating volumes of economically recoverable oil and natural gas that cannot be measured in an exact manner. The accuracy of any reserve estimate is a function of the quality of available data and of engineering and geological interpretation. As a result, the estimates of different engineers often vary. In addition, the results of drilling, testing and production may justify revisions of such estimates. Accordingly, reserve estimates often differ from the quantities of oil and natural gas that are ultimately recovered. Estimates of economically recoverable oil and natural gas and of future net revenues are based on a number of variables and assumptions, all of which may vary from actual results, including geologic interpretation, prices and future production rates and costs.
For all of our properties, our internally prepared reserve estimates and the reserve reports prepared by Von Gonten, are reviewed and approved by our Executive Vice President, Reserves & Reservoir Engineering, Phuong Le. She has been with us since our formation and has over 20 years of experience in reservoir engineering and reserve management.
Drilling Locations
We determine drilling locations based on our well spacing assumptions and upon the evaluation of our horizontal drilling results and those of other operators in our area, combined with our interpretation of available geologic and engineering data. In addition, in evaluating the prospectivity of our horizontal acreage, we have reviewed available open-hole and mud log evaluations, core analysis and drill cuttings analysis. The locations that we actually drill will depend on the review of prospectively available geologic and engineering data and on availability of capital, regulatory approvals, commodity prices, costs, results drilling other wells and other factors.
At December 31, 2020, we had 932 drilling locations compared to 1,021 at year-end 2019, after giving effect to the reorganization transactions described under “Corporate Reorganization.” During 2020, we evaluated our future development strategy with the objective to further enhance our capital efficiency. Given our well spacing tests in 2019 and enhanced per well recovery, the well spacing was adjusted across our acreage. Consequently, our drilling locations were reduced to reflect accessing the gas in place with fewer wellbores, a strategy that should lead to improved well economics and present value.
Where the geological data supports it, we plan to continue to drill wells with lateral lengths of up to 10,000 ft. Our horizontal drilling location count averages 5 wells per 640 acre section in both the primary target and secondary play targets, if applicable, based on standard lateral lengths.
Approximately 48% of our drilling locations are expected to be developed with laterals greater than 5,300 ft. With approximately 900 drilling locations among Vine, Brix and Harvest at an average operated working interest of approximately 83%, we continue to have approximately 25 years of organic growth opportunity assuming a 4 gross rig development program.
107
Table of Contents
Production, Revenue, Price and Production Costs
The following table sets forth information regarding our production, revenue and realized prices, and production costs for the years ended December 31, 2020 and 2019, for Vine Oil & Gas, Brix, Harvest and the three entities on a combined basis after giving effect to the reorganization transactions described under “Corporate Reorganization.” Our “Management’s Discussion and Analysis of Financial Condition and Results of Operations” contains additional information regarding our production, revenue, price and production cost history.
| Year Ended December 31, | ||||||||
| 2020 | 2019 | |||||||
| Vine Oil & Gas |
||||||||
| Production data: |
||||||||
| Natural gas (MMcf) |
240,869 | 200,214 | ||||||
| Average daily production (MMcfd) |
658 | 549 | ||||||
| Average sales prices per Mcf: |
||||||||
| Before effects of realized derivatives |
$ | 1.74 | $ | 2.23 | ||||
| After effects of realized derivatives |
2.25 | 2.42 | ||||||
| Costs per Mcf: |
||||||||
| Lease operating |
$ | 0.20 | $ | 0.23 | ||||
| Gathering and treating |
0.32 | 0.19 | ||||||
| Production and ad valorem taxes |
0.06 | 0.09 | ||||||
| Depreciation, depletion and accretion |
1.44 | 1.64 | ||||||
| General and administrative |
0.03 | 0.04 | ||||||
| Monitoring fee |
0.03 | 0.04 | ||||||
| Exploration |
0.00 | 0.00 | ||||||
| Strategic |
0.01 | 0.00 | ||||||
| Write-off of deferred IPO costs |
0.02 | 0.01 | ||||||
|
|
|
|
|
|||||
| Total |
$ | 2.11 | $ | 2.24 | ||||
| Brix and Harvest |
||||||||
| Production data: |
||||||||
| Natural gas (MMcf) |
85,640 | 52,503 | ||||||
| Average daily production (MMcfd) |
234 | 144 | ||||||
| Average sales prices per Mcf: |
||||||||
| Before effects of realized derivatives |
$ | 1.78 | $ | 2.19 | ||||
| After effects of realized derivatives |
2.22 | 2.38 | ||||||
| Costs per Mcf: |
||||||||
| Lease operating |
$ | 0.21 | $ | 0.13 | ||||
| Gathering and treating |
0.29 | 0.36 | ||||||
| Production and ad valorem taxes |
0.03 | 0.03 | ||||||
| Depreciation, depletion and accretion |
1.08 | 1.26 | ||||||
| General and administrative |
0.09 | 0.15 | ||||||
| Monitoring fee |
0.02 | 0.02 | ||||||
| Exploration |
0.00 | 0.01 | ||||||
| Strategic |
0.00 | — | ||||||
|
|
|
|
|
|||||
| Total |
$ | 1.72 | $ | 1.96 | ||||
| Vine Pro forma(1) |
|
Year Ended December 31, |
|
|||||
| Production data: |
||||||||
| Natural gas (MMcf) |
326,509 | |||||||
| Average daily production (MMcfd) |
892 | |||||||
| Average sales prices per Mcf: |
||||||||
| Before effects of realized derivatives |
$ | 1.75 | ||||||
| After effects of realized derivatives |
2.25 | |||||||
| Costs per Mcf: |
||||||||
| Lease operating |
$ | 0.20 | ||||||
| Gathering and treating |
0.31 | |||||||
| Production and ad valorem taxes |
|
0.06 |
|
|||||
| Depreciation, depletion and accretion |
1.20 | |||||||
| General and administrative |
0.05 | |||||||
108
Table of Contents
| Year Ended December 31, 2020 |
||||||||
| Strategic |
|
0.01 |
|
|||||
| Write-off deferred IPO expenses |
|
0.02 |
|
|||||
|
|
|
|||||||
| Total |
$ | 1.85 | ||||||
| (1) | The production and cost data are presented on a pro forma basis for the reorganization transactions presented in this prospectus. |
Productive Wells as of December 31, 2020
| Productive Wells | Average Working Interest |
|||||||||||
| Gross | Net | |||||||||||
| Vine Oil & Gas |
||||||||||||
| Natural gas wells operated by Vine |
377 | 314.59 | 83.4 | % | ||||||||
| Natural gas wells operated by Brix |
6 | 0.43 | 7.2 | % | ||||||||
| Natural gas wells operated by GEP |
51 | 9.69 | 19.0 | % | ||||||||
| Natural gas wells operated by others |
43 | 2.49 | 5.8 | % | ||||||||
|
|
|
|
|
|||||||||
| Total |
477 | 327.20 | ||||||||||
|
|
|
|
|
|||||||||
| Brix and Harvest |
||||||||||||
| Natural gas wells operated by Brix |
24 | 20.64 | 86.0 | % | ||||||||
| Natural gas wells operated by Vine |
119 | 18.94 | 15.9 | % | ||||||||
|
|
|
|
|
|||||||||
| Total |
143 | 39.58 | ||||||||||
|
|
|
|
|
|||||||||
| Combined(1) |
||||||||||||
| Natural gas wells operated by combined |
401 | 354.60 | 88.4 | % | ||||||||
| Natural gas wells operated by GEP |
51 | 9.69 | 19.0 | % | ||||||||
| Natural gas wells operated by others |
43 | 2.49 | 5.8 | % | ||||||||
|
|
|
|
|
|||||||||
| Total |
495 | 366.78 | ||||||||||
|
|
|
|
|
|||||||||
| (1) | Given that Vine, Brix and Harvest own working interests in certain of the same wells, the gross well figures appear to be understated on a combined basis as one well can be a gross well at each of Vine, Brix and Harvest, but will only represent one gross well on a combined basis. This situation does not occur when calculating net wells. |
Acreage as of December 31, 2020
| Vine Oil & Gas |
||||
| Undeveloped acres |
67,242 | |||
| Developed acres |
29,031 | |||
|
|
|
|||
| Total |
96,273 | |||
|
|
|
|||
| Brix and Harvest |
||||
| Undeveloped acres |
23,060 | |||
| Developed acres |
4,079 | |||
|
|
|
|||
| Total |
27,139 | |||
|
|
|
|||
| Combined |
||||
| Undeveloped acres(1) |
90,302 | |||
| Developed acres |
33,110 | |||
|
|
|
|||
| Total |
123,412 | |||
|
|
|
109
Table of Contents
Undeveloped Acreage Expirations as of December 31, 2020
The following table sets forth when our acreage would expire if production is not established prior to the lease expiration dates of Vine Oil & Gas, Brix and Harvest and the three entities on a combined basis. We have not recognized any reserves on acreage where expiration precedes development. In addition, we do not anticipate material delay rental or lease extension payments in connection with such acreage.
| Acres | ||||
| Vine Oil & Gas |
||||
| 2021 |
— | |||
| 2022 |
5,281 | |||
| 2023 |
193 | |||
| 2024 |
103 | |||
| 2025 and thereafter |
342 | |||
|
|
|
|||
| 5,919 | ||||
|
|
|
|||
| Brix and Harvest |
||||
| 2021 |
2,509 | |||
| 2022 |
1,441 | |||
| 2023 |
— | |||
| 2024 |
— | |||
| 2025 and thereafter |
— | |||
|
|
|
|||
| 3,950 | ||||
|
|
|
|||
| Combined |
||||
| 2021 |
2,509 | |||
| 2022 |
6,722 | |||
| 2023 |
193 | |||
| 2024 |
103 | |||
| 2025 and thereafter |
342 | |||
|
|
|
|||
| 9,869 | ||||
|
|
|
|||
Drilling Activity
| For the Year Ended December 31, 2020 |
For the Year Ended December 31, 2019 |
|||||||||||||||
| Productive Wells | Productive Wells | |||||||||||||||
| Gross | Net | Gross | Net | |||||||||||||
| Vine Oil & Gas |
||||||||||||||||
| Haynesville: |
||||||||||||||||
| Development |
26.0 | 20.0 | 23.0 | 13.6 | ||||||||||||
| Exploratory |
— | — | — | — | ||||||||||||
|
|
|
|
|
|
|
|
|
|||||||||
| Total |
26.0 | 20.0 | 23.0 | 13.6 | ||||||||||||
|
|
|
|
|
|
|
|
|
|||||||||
| Mid-Bossier: |
||||||||||||||||
| Development |
9.0 | 7.8 | 14.0 | 10.8 | ||||||||||||
| Exploratory |
— | — | — | — | ||||||||||||
|
|
|
|
|
|
|
|
|
|||||||||
| Total |
9.0 | 7.8 | 14.0 | 10.8 | ||||||||||||
|
|
|
|
|
|
|
|
|
|||||||||
| Brix and Harvest |
||||||||||||||||
| Haynesville: |
||||||||||||||||
| Development |
18.0 | 6.2 | 15.0 | 9.2 | ||||||||||||
| Exploratory |
— | — | — | — | ||||||||||||
|
|
|
|
|
|
|
|
|
|||||||||
| Total |
18.0 | 6.2 | 15.0 | 9.2 | ||||||||||||
|
|
|
|
|
|
|
|
|
|||||||||
110
Table of Contents
| For the Year Ended December 31, 2020 |
For the Year Ended December 31, 2019 |
|||||||||||||||
| Productive Wells | Productive Wells | |||||||||||||||
| Gross | Net | Gross | Net | |||||||||||||
| Mid-Bossier: |
||||||||||||||||
| Development |
11.0 | 4.7 | 6.0 | 4.6 | ||||||||||||
| Exploratory |
— | — | — | — | ||||||||||||
|
|
|
|
|
|
|
|
|
|||||||||
| Total |
11.0 | 4.7 | 6.0 | 4.6 | ||||||||||||
|
|
|
|
|
|
|
|
|
|||||||||
| Combined(1) |
||||||||||||||||
| Haynesville: |
||||||||||||||||
| Development |
28.0 | 26.2 | 27.0 | 22.8 | ||||||||||||
| Exploratory |
— | — | — | — | ||||||||||||
|
|
|
|
|
|
|
|
|
|||||||||
| Total |
28.0 | 26.2 | 27.0 | 22.8 | ||||||||||||
|
|
|
|
|
|
|
|
|
|||||||||
| Mid-Bossier: |
||||||||||||||||
| Development |
13.0 | 12.5 | 18.0 | 15.4 | ||||||||||||
| Exploratory |
— | — | — | — | ||||||||||||
|
|
|
|
|
|
|
|
|
|||||||||
| Total |
13.0 | 12.5 | 18.0 | 15.4 | ||||||||||||
|
|
|
|
|
|
|
|
|
|||||||||
| (1) | Given that Vine, Brix and Harvest own working interests in certain of the same wells, the gross well figures appear to be understated on a combined basis as one well can be a gross well at each of Vine, Brix and Harvest, but will only represent one gross well on a combined basis. This situation does not occur when calculating net wells. |
On a combined basis, as of December 31, 2020, we had three wells that were actively being drilled, two wells that had been partially drilled but not being actively drilled, one well actively completing and 11 wells that were fully drilled but awaiting completion. As of December 31, 2020, we had no dry development or exploratory wells. This table includes both operated and non-operated wells where we have a working interest.
Major Customers
In 2020, Vine Oil & Gas sold approximately 20% of natural gas production to Corpus Christi Liquefaction, LLC, approximately 19% to affiliates of Royal Dutch Shell, approximately 15% to ETC Marketing, Ltd and approximately 12% to Enterprise Products Operating LLC. During 2020, no other purchaser accounted for more than 10% of our natural gas revenue. However, we utilize an unaffiliated third party to market the majority of our gas production to various purchasers, which consist of credit-worthy counterparties, including major corporations and super majors, in our industry. This third party collects directly from the purchasers and remits to us the total of all amounts collected on our behalf less their fee for making such sales. Although a substantial portion of production is purchased by these customers, we do not believe the loss of them or any other party would have a material adverse effect on our business, as other customers or markets would be accessible to us. However, there is no guarantee that we will be able to enter into an agreement with a new customer on terms as favorable.
Title to Properties
As is customary in our industry, we conduct a review of the title to our properties in connection with acquisition of leasehold acreage. Prior to drilling, we conduct a more thorough title examination and perform curative work with respect to significant defects prior to commencement of drilling operations. To the extent title opinions or other investigations reflect title defects on those properties, we are typically responsible for curing any title defects at our expense. We generally will not drill a well until we have cured any related material title defects. We have obtained title opinions on substantially all of our producing properties and believe that we have satisfactory title to our producing properties in accordance with standards generally accepted in the oil and natural gas industry.
111
Table of Contents
Prior to acquiring leases, we perform title reviews on the most significant leases and, depending on the materiality of properties, we may obtain a title opinion, obtain an updated title review or opinion or review previously obtained title opinions. Our properties are subject to customary royalty and other interests, liens for current taxes and other burdens which we believe do not materially interfere with the use of or affect our carrying value of the properties.
We believe that we have satisfactory title to all of our material assets, and we believe that such title is not subject to liens or encumbrances that will materially detract from the value of these properties or from our interest in these properties or materially interfere with our use of these properties in the operation of our business. In addition, we believe that we have obtained sufficient rights-of-way grants and permits from public authorities and private parties for us to operate our business in all material respects as described in this prospectus.
Seasonality
Demand for natural gas generally decreases during the spring and fall months and increases during the summer and winter months. However, seasonal anomalies and consumers procurement initiatives can also lessen seasonal demand fluctuations. Seasonal anomalies can increase competition for equipment, supplies and personnel can lead to shortages and increase costs or delay our operations.
Competition
Our industry is intensely competitive, and we compete with other companies that have greater resources than we do. Many of these companies not only explore for and produce natural gas, but also carry on refining operations and market petroleum and other products on a regional, national or worldwide basis. These companies may be able to pay more for properties or define, evaluate, bid for and purchase a greater number of properties than we can.
They may also be able to expend greater resources to attract qualified personnel. In addition, these companies may have a greater ability to conduct exploration during periods of low natural gas market prices. Our larger competitors may be able to absorb the existing and evolved laws and regulations more easily than we can, which would adversely affect our competitiveness. Our ability to acquire additional properties and to discover reserves in the future will be dependent upon our ability to evaluate and select suitable properties and to consummate transactions in a competitive environment. In addition, because we have fewer financial and human resources than many companies in our industry, we may be at a disadvantage in eventually bidding or consummating transactions.
There is also competition between natural gas producers and other related and unrelated industries. Furthermore, competitive conditions may be substantially affected by energy legislation or government regulation. It is not possible to predict the nature of any such legislation or regulation which may ultimately be adopted or its effects upon our future operations. Such laws and regulations may substantially increase the costs of capitalizing on oil and gas opportunities. Our larger competitors may be able to absorb the burden of existing, and any changes to governmental regulations more easily than we can, which would adversely affect our competitive position.
Regulation of the Natural Gas Industry
Our operations are substantially affected by federal, state and local laws and regulations. In particular, natural gas production and related operations are, or have been, subject to price controls, taxes and numerous other laws and regulations. All of the jurisdictions in which we own or operate properties for natural gas production have statutory provisions regulating the exploration for development of natural gas, including provisions related to permits for the drilling of wells, bonding requirements to drill or operate wells, the location of wells, the method of drilling and casing wells, the surface use and restoration of properties upon which wells
112
Table of Contents
are drilled, sourcing and disposal of water used in the drilling and completion process, and the abandonment of wells. Our operations are also subject to various conservation laws and regulations. These include the regulation of the size of drilling and spacing units or proration units, the number of wells which may be drilled in an area, and the unitization or pooling of crude oil or natural gas wells, as well as regulations that generally prohibit the venting or flaring of natural gas, and impose certain requirements regarding the ratability or fair apportionment of production from fields and individual wells.
Failure to comply with applicable laws and regulations can result in substantial penalties. The regulatory burden on our industry increases our cost of doing business and affects profitability. Although we believe we are in substantial compliance with all applicable laws and regulations, and that continued substantial compliance with existing requirements will not have a material adverse effect on our financial position, cash flows or results of operations, such laws and regulations are frequently amended or reinterpreted. Additional proposals and proceedings that affect the natural gas industry are regularly considered by Congress, states, the Federal Energy Regulatory Commission (“FERC”) and the courts. We cannot predict when or whether any such proposals may become effective or any such proceedings might affect the natural gas industry. However, we do not believe that any action taken will affect us in a way that materially differs from the way it affects other natural gas producers.
Historically, our natural gas regulatory compliance costs have not had a material adverse effect on our results of operations; however, there can be no assurance that such costs will not be material in the future or that such future compliance with existing requirements will not have a material adverse effect on our financial position, cash flows or results of operations.
Regulation of Production
The production of natural gas is subject to regulation under a wide range of local, state and federal requirements with mandate permits for drilling operations, drilling bonds and reports concerning operations. All of the states in which we own and operate properties have regulations governing conservation matters, including provisions for the unitization or pooling of natural gas and oil properties, the establishment of maximum allowable rates of production, the regulation of well spacing or density, and plugging and abandonment of wells. The effect of these laws and regulations may limit the amount of natural gas that we can produce from our wells and to limit the number of wells we can drill, although we can apply for exceptions to such regulations or to have reductions in well spacing or density.
The failure to comply with these laws, rules and regulations can result in substantial penalties. Our competitors in the natural gas industry are subject to the same regulatory requirements and restrictions that affect our operations, but may be better equipped to comply with them.
Regulation of Transportation and Sales of Natural Gas
Historically, the transportation and sale for resale of natural gas in interstate commerce have been regulated by the FERC under the Natural Gas Act of 1938 (“NGA”), the Natural Gas Policy Act of 1978 (“NGPA”) and regulations issued under those statutes.
FERC regulates interstate natural gas transportation rates, and terms and conditions of service, which affects the marketing of natural gas that we produce, as well as the revenue we receive for sales of our natural gas. Since 1985, FERC has endeavored to make natural gas transportation more accessible to natural gas buyers and sellers on an open access, non-discriminatory basis. Beginning in 1992, FERC issued a series of orders to implement its open access policies. As a result, the interstate pipelines’ traditional role as wholesalers of natural gas has been greatly reduced and replaced by a structure under which pipelines provide transportation and storage service on an open access basis to others who buy and sell natural gas. Although such FERC’s orders do not directly regulate natural gas producers, they are intended to foster increased competition within all phases of the natural
113
Table of Contents
gas industry. The natural gas industry historically has been very heavily regulated. Therefore, we cannot provide any assurance that the less stringent regulatory approach that FERC has maintained since 1985 will continue.
However, we do not believe that any action taken by FERC will affect us in a way that materially differs from the way it affects other natural gas producers. In the past, the federal government has regulated the prices at which natural gas could be sold. While sales by producers of natural gas can currently be made at uncontrolled market prices, Congress could reenact price controls in the future. Deregulation of wellhead natural gas sales began with the enactment of the NGPA, and culminated in adoption of the Natural Gas Wellhead Decontrol Act in 1993 which removed controls affecting wellhead sales of natural gas. The price at which we sell natural gas is not currently subject to federal rate regulation and, for the most part, is not subject to state regulation. However, with regard to our physical sales of these energy commodities we are required to observe anti-market manipulation laws and related regulations enforced by the FERC.
The Energy Policy Act of 2005 (“EPAct 2005”) amended the NGA and NGPA to add an anti-market manipulation provision which makes it unlawful for any entity to engage in prohibited behavior to be prescribed by FERC and provides FERC with additional civil penalty authority of more than $1,250,000 per day for violations of the NGA, NGPA, and rules and orders thereunder. In 2006, FERC issued a rule implementing the anti-market manipulation provision of the EPAct 2005 which makes it unlawful: (i) in connection with the purchase or sale of natural gas subject to the jurisdiction of FERC, or the purchase or sale of transportation services subject to the jurisdiction of FERC, for any entity, directly or indirectly, to use or employ any device, scheme or artifice to defraud; (ii) to make any untrue statement of material fact or omit to make any such statement necessary to make the statements made not misleading; or (iii) to engage in any act or practice that operates as a fraud or deceit upon any person. The anti-market manipulation rule does not apply to activities that relate only to intrastate or other non-jurisdictional sales or gathering, but does apply to activities of gas pipelines and storage companies that provide interstate services, as well as otherwise non-jurisdictional entities to the extent the activities are conducted “in connection with” gas sales, purchases or transportation subject to FERC jurisdiction, which now includes the annual reporting requirements under Order 704.
In 2007, FERC issued a rule that requires wholesale buyers and sellers of more than 2.2 million MMBtus of physical natural gas in the previous calendar year, including natural gas gatherers and marketers, to report aggregate volumes of natural gas purchased or sold at wholesale to the extent such transactions utilize, contribute to or may contribute to the formation of price indices. It is the responsibility of the reporting entity to determine which individual transactions should be reported. Participants are required to indicate whether they report prices to any index publishers, and if so, whether their reporting complies with FERC’s policy statement on price reporting. Our sales of natural gas and financial derivative transactions (including swaps) to minimize risk are also subject to requirements under the Commodity Exchange Act (“CEA”), and regulations promulgated thereunder by the Commodity Futures Trading Commission (“CFTC”). These include the anti-manipulation provisions under the CEA, as amended by the Dodd-Frank Act, which prohibits any person from attempting to manipulate, or using or employing any manipulative or deceptive device in connection with any swap, or a contract of sale of any commodity, or for future delivery on such commodity, in contravention of the CFTC’s rules and regulations. The CEA, as amended by the Dodd-Frank Act, also prohibits certain anti-disruptive practices and knowingly delivering or causing to be delivered false or misleading or inaccurate reports concerning market information or conditions that affect or tend to affect the price of any commodity. The CFTC can impose substantial civil penalties and other remedies for violations of the CEA and the agency’s regulations.
Gathering services, which occur upstream of FERC jurisdictional transportation services, are regulated by the states onshore and in state waters. Although the FERC has set forth a general test for determining whether facilities perform a non-jurisdictional gathering function or a FERC-jurisdictional transportation function, the FERC’s determinations as to the classification of facilities is done on a case by case basis. State regulation of natural gas gathering facilities generally includes various safety, environmental and, in some circumstances, nondiscriminatory take requirements. Although such regulation has not generally been affirmatively applied by state agencies, natural gas gathering may receive greater regulatory scrutiny in the future.
114
Table of Contents
Intrastate natural gas transportation is also subject to regulation to some extent by FERC, as well as by state regulatory agencies. The basis for intrastate regulation of natural gas transportation and the degree of regulatory oversight and scrutiny given to intrastate natural gas pipeline rates and services varies from state to state. Insofar as such regulation within a particular state will generally affect all intrastate natural gas shippers within the state on a comparable basis, we believe that the regulation of similarly situated intrastate natural gas transportation will not affect our operations in any way that is of material difference from those of our competitors. Like the regulation of interstate transportation rates, the regulation of intrastate transportation rates affects the marketing of natural gas that we produce, as well as the revenue we receive for sales of our natural gas.
Changes in law and to FERC policies and regulations may adversely affect the availability and reliability of firm and/or interruptible transportation service on interstate pipelines, and we cannot predict what future action FERC will take. We do not believe, however, that any regulatory changes will affect us in a way that materially differs from the way they will affect other natural gas producers with which we compete.
Regulation of Environmental, Health and Safety Matters
General
Our operations are subject to numerous federal, regional, state, local, and other laws and regulations governing occupational health and safety, the release, discharge or disposal of materials into the environment or otherwise relating to environmental protection. Applicable U.S. federal environmental laws include, but are not limited to, the Comprehensive Environmental Response, Compensation, and Liability Act (“CERCLA”), the Clean Water Act (“CWA”) and the Clean Air Act (“CAA”). In addition, state and local laws and regulations set forth specific standards for drilling wells, the maintenance of bonding requirements in order to drill or operate wells, the spacing and location of wells, the method of drilling and casing wells, the surface use and restoration of properties upon which wells are drilled, the plugging and abandoning of wells, and the prevention and cleanup of pollution and other matters. These laws and regulations may, among other things, require the acquisition of permits to conduct exploration, drilling and production operations; govern the amounts and types of substances that may be released into the environment in connection with oil and gas drilling and production; limit or prohibit construction or drilling activities in sensitive areas such as wetlands, wilderness areas or areas inhabited by endangered or threatened species; impose specific health and safety criteria addressing worker protection requirements; require investigatory and remedial actions to mitigate pollution conditions caused by our operations or attributable to former operations; and impose obligations to reclaim abandoned well sites and pits. We maintain insurance against costs of clean-up operations, but we are not fully insured against all such risks. Additionally, Congress and federal and state agencies frequently revise environmental laws and regulations, and any changes that result in delay or more stringent and costly permitting, waste handling, disposal, clean-up, or other requirements for the oil and gas industry could have a significant impact on our operating costs. Although future environmental obligations are not expected to have a material impact on the results of our operations or financial condition, there can be no assurance that future developments, such as increasingly stringent environmental laws or enforcement thereof, will not cause us to incur material environmental liabilities or costs.
Failure to comply with these laws and regulations may result in the assessment of administrative, civil and criminal fines and penalties, loss of leases, the imposition of investigatory or remedial obligations and the issuance of orders enjoining some or all of our operations in affected areas. These laws and regulations may also restrict the rate of natural gas production below the rate that would otherwise be possible. The regulatory burden on the oil and gas industry increases the cost of doing business in the industry and consequently affects profitability. The long-term trend in environmental regulation is to place more restrictions and limitations on activities that may affect the environment, and thus, any changes in environmental laws and regulations or re-interpretation of enforcement policies that result in more stringent and costly well drilling, construction, completion or water management activities or waste handling, storage, transport, disposal, or remediation requirements could require us to make significant expenditures to attain and maintain compliance and may otherwise have a material adverse effect on our results of operations and financial position. We may be unable to
115
Table of Contents
pass on such increased compliance costs to our customers. Moreover, accidental releases or spills may occur in the course of our operations, and we cannot be sure that we will not incur significant costs and liabilities as a result of such releases or spills, including any third-party claims for damage to property, natural resources or persons. Historically, our environmental compliance costs have not had a material adverse effect on our results of operations; however, there can be no assurance that such costs will not be material in the future or that future compliance with existing requirements will not have a material adverse impact on us. Our board of directors continually monitors and reviews compliance with these laws and regulations. Additionally, in connection with this offering, we will establish an environmental, safety and governance committee of our board of directors to monitor, among other things, compliance with environmental, health and safety rules and regulations.
The following is a summary of the more significant existing environmental and occupational health and safety laws and regulations to which our business operations are subject and for which compliance may have a material adverse impact on our CapEx, results of operations or financial position.
Hazardous Substances and Wastes
CERCLA imposes cleanup obligations, without regard to fault or the legality of the original conduct, on certain classes of persons that are considered to be responsible for the release of a “hazardous substance” into the environment. These persons include the owner or operator of the disposal site or sites where the release occurred and companies that transported or disposed or arranged for the transport or disposal of the hazardous substances found at the site. Persons who are or were responsible for releases of hazardous substances under CERCLA and any state analogs may be subject to joint and several liability for the costs of cleaning up the hazardous substances that have been released into the environment and for damages to natural resources, and it is not uncommon for neighboring landowners and other third parties to file corresponding common law claims for personal injury and property damage allegedly caused by the hazardous substances released into the environment. While petroleum and crude oil fractions are not considered hazardous substances under CERCLA and its analog because of the so-called “petroleum exclusion,” adulterated petroleum products containing other hazardous substances have been treated as hazardous substances in the past.
We also generate solid and hazardous wastes that may be subject to the requirements of the Resource Conservation and Recovery Act, as amended (“RCRA”), and comparable state statutes. RCRA regulates the generation, storage, treatment, transport and disposal of wastes. RCRA specifically excludes from the definition of hazardous waste “drilling fluids, produced waters and other wastes associated with the exploration, development or production of crude oil, natural gas or geothermal energy.” However, legislation has been proposed from time to time and environmental groups have filed lawsuits seeking the reclassification of certain natural gas exploration and production wastes as “hazardous wastes,” which would make such wastes subject to much more stringent handling, disposal and clean-up requirements. For example, in May 2016, several environmental groups filed a lawsuit in the U.S. District Court for the District of Columbia that seeks to compel the EPA to review and, if necessary, revise its regulations regarding existing exemptions for exploration and production related wastes. On December 28, 2016, the EPA entered into a consent decree with those environmental groups to settle the lawsuit, which required the EPA by March 15, 2019 to either propose new regulations regarding exploration and production related wastes or sign a determination that revision of such regulations is not necessary. In April 2019, the EPA made the determination that revisions to the regulations were not necessary at that time, concluding that any adverse effects related to natural gas and oil waste were more appropriately and readily addressed within the framework of existing state regulatory programs. Any future changes in applicable laws and regulations could have a material adverse effect on our CapEx and operating expenses. Moreover, some ordinary industrial wastes which we generate, such as paint wastes, waste solvents, laboratory wastes and waste oils, may be regulated as hazardous wastes if they are determined to have hazardous characteristics. Any such changes in applicable laws and regulations could have a material adverse effect on our CapEx and operating expenses. Moreover, some ordinary industrial wastes which we generate, such as paint wastes, waste solvents, laboratory wastes and waste oils, may be regulated as hazardous wastes if they are determined to have hazardous characteristics.
116
Table of Contents
Some of our leases may have had prior owners who commenced exploration and production of natural gas operations on these sites. Although such prior owners may have utilized operating and disposal practices that were standard in the industry at the time, hydrocarbons or other wastes may have been disposed of or released on or under the properties owned or leased by us or on or under other locations where such wastes have been taken for disposal. In addition, a portion of these properties may have been operated by third parties whose treatment and disposal or release of wastes was not under our control. These properties and the wastes disposed thereon may be subject to CERCLA, RCRA, and/or analogous state laws. Under such laws, we could be required to remove or remediate previously disposed wastes (including waste disposed of or released by prior owners or operators) or property contamination (including groundwater contamination by prior owners or operators), or to perform remedial well plugging or closure operations to prevent future contamination.
Water Discharges
The Federal Water Pollution Control Act, as amended, also known as the CWA and its state analogues impose restrictions and strict controls with respect to the discharge of pollutants, including spills and leaks of certain substances, into waters of the United States. The discharge of pollutants into regulated waters is prohibited, except in accordance with the terms of a permit issued by the EPA, the Army Corps of Engineers (the “Corps”) or an analogous state agency. The CWA and its implementing regulations prohibit the discharge of dredge and fill material into regulated waters, including jurisdictional wetlands, unless authorized by an appropriately issued permit. In June 2015, the EPA and the Corps issued a final rule defining the scope of the EPA’s and the Corps’ jurisdiction over waters of the United States (“WOTUS”), which was stayed nationwide in October 2015 pending resolution of several legal challenges. The EPA and the Corps proposed a rule in July 2017 to repeal the WOTUS rule and announced their intent to issue a new rule defining the CWA’s jurisdiction. In October 2019, the EPA issued a final rule repealing the WOTUS rule and the repeal rule became effective in December 2019. The repeal rule has already been challenged in federal district courts in New Mexico, New York, and South Carolina. In April 2020, the EPA and the Corps published the Navigable Waters Protection Rule (“NWPR”), which narrows the definition of WOTUS to four categories of jurisdictional waters and includes twelve categories of exclusions, including groundwater. A coalition of states and cities, environmental groups, and agricultural groups have challenged the NWPR in several federal district courts and many of those cases remain pending. In addition, in an April 2020 decision defining the scope of the CWA that was handed down just days after the NWPR was published, the U.S. Supreme Court held that, in certain cases, discharges from a point source to groundwater could fall within the scope of the CWA and require a permit. The Court rejected the EPA and Corps assertion that groundwater should be totally excluded from the CWA. The Court’s decision is expected to bolster challenges to the NWPR. As a result, future implementation is uncertain at this time. To the extent the existing rule is implemented in jurisdictions where we operate or a revised rule expands the scope of the CWA’s jurisdiction, we could face increased costs and delays with respect to obtaining permits for dredge and fill activities in wetland areas.
The process for obtaining permits has the potential to delay our operations. Spill prevention, control and countermeasure requirements of federal laws require appropriate containment berms and similar structures to help prevent the contamination of navigable waters by a petroleum hydrocarbon tank spill, rupture or leak. In addition, the CWA and analogous state laws require individual permits or coverage under general permits for discharges of storm water runoff from certain types of facilities. Federal and state regulatory agencies can impose administrative, civil and criminal penalties as well as other enforcement mechanisms for non-compliance with discharge permits or other requirements of the CWA and analogous state laws and regulations.
The Oil Pollution Act of 1990, as amended, or the OPA, which amends portions of the CWA, establishes strict liability for owners and operators of facilities that are the site of a release of oil into waters of the United States. The OPA and its associated regulations impose a variety of requirements on responsible parties related to the prevention of oil spills and liability for damages resulting from such spills. A “responsible party” under the OPA includes owners and operators of certain onshore facilities from which a release may affect waters of the United States.
117
Table of Contents
The OPA assigns joint and several, strict liability, without regard to fault, to each liable party for all containment and oil removal costs and a variety of public and private damages including, but not limited to, the costs of responding to a release of oil, natural resource damages, and economic damages suffered by persons adversely affected by an oil spill.
Hydraulic Fracturing
Hydraulic fracturing is an essential and common practice in the natural gas industry used to stimulate production of natural gas and/or oil from low permeability subsurface rock formations. Hydraulic fracturing involves using water, sand, and certain chemicals to fracture the hydrocarbon-bearing rock formation to allow flow of hydrocarbons into the wellbore. We regularly perform hydraulic fracturing as part of our operations. While hydraulic fracturing has historically been regulated by state oil and natural gas commissions, the practice has become increasingly controversial in certain parts of the country, resulting in increased scrutiny and regulation. For example, the EPA has asserted federal regulatory authority over certain hydraulic-fracturing activities under the Safe Drinking Water Act involving the use of diesel fuels and published permitting guidance. Further, the EPA published final regulations under the CWA in June 2016 prohibiting wastewater discharges from hydraulic fracturing and certain other natural gas operations to publicly owned wastewater treatment plants. Also, in December 2016, the EPA released its final report on the potential impacts of hydraulic fracturing on drinking water resources, concluding that “water cycle” activities associated with hydraulic fracturing may impact drinking water resources under certain circumstances.
Along with several other states, Louisiana has adopted laws and proposed regulations that require oil and natural gas operators to disclose chemical ingredients and water volumes used to hydraulically fracture wells, in addition to more stringent well construction and monitoring requirements. In addition, local governments may also adopt ordinances within their jurisdictions regulating the time, place and manner of drilling activities in general or hydraulic fracturing activities in particular or prohibit the performance of well drilling in general or hydraulic fracturing in particular. If new or more stringent federal, state, or local legal restrictions relating to the hydraulic fracturing process are adopted in areas where we operate, we could incur potentially significant added costs to comply with such requirements, experience delays or curtailment in the pursuit of exploration, development, or production activities, and perhaps even be precluded from drilling wells.
If hydraulic fracturing is further regulated at the federal, state, or local level, our fracturing activities could become subject to additional permitting and financial assurance requirements, more stringent construction specifications, increased monitoring, reporting and recordkeeping obligations, plugging and abandonment requirements and also to attendant permitting delays and potential increases in costs. Such changes could cause us to incur substantial compliance costs, and compliance or the consequences of any failure to comply by us could have a material adverse effect on our financial condition and results of operations. At this time, it is not possible to estimate the impact on our business of newly enacted or potential legislation or regulation governing hydraulic fracturing, and any of the above risks could impair our ability to manage our business and have a material adverse effect on our operations, cash flows and financial position.
In addition, hydraulic fracturing operations require the use of a significant amount of water. The inability to locate sufficient amounts of water, or dispose of or recycle water used in drilling and production operations, could adversely impact our operations. Moreover, new environmental initiatives and regulations could include restrictions on the ability to conduct certain operations such as hydraulic fracturing or disposal of waste, including, but not limited to, produced water, drilling fluids and other wastes associated with the development or production of natural gas.
Finally, in some instances, the operation of underground injection wells for the disposal of waste has been alleged to cause earthquakes. In Oklahoma, for example, such issues have led to orders prohibiting continued injection or the suspension of drilling in certain wells identified as possible sources of seismic activity. Such concerns also have resulted in stricter regulatory requirements in some jurisdictions relating to the location and
118
Table of Contents
operation of underground injection wells. Although our operations are not located in those jurisdictions, any future orders or regulations addressing concerns about seismic activity from well injection in jurisdictions where we operate could affect our operations.
Air Emissions
The CAA and comparable state laws restrict the emission of air pollutants from many sources, including compressor stations, through the issuance of permits and the imposition of other requirements. These laws and regulations may require us to obtain pre-approval for the construction or modification of certain projects or facilities expected to produce or significantly increase air emissions, obtain and strictly comply with stringent air permit requirements or utilize specific equipment or technologies to control emissions of certain pollutants. The need to obtain permits has the potential to delay the development of natural gas projects. Over the next several years, we may be required to incur certain CapEx for air pollution control equipment or other air emissions-related issues. For example, in June 2016, the EPA published final rules regarding criteria for aggregating multiple small surface sites into a single source for air-quality permitting purposes applicable to the oil and gas industry. This rule could cause small facilities, on an aggregate basis, to be deemed a major source, thereby triggering more stringent air permitting requirements. In addition, in October 2015, the EPA lowered the National Ambient Air Quality Standard (“NAAQS”) for ozone from 75 to 70 parts per billion. Pursuant to an order issued by the U.S. District Court for the Northern District of California in lawsuits brought by a coalition of states and environmental groups against the EPA for failing to complete initial area designations under the standard by the October 2017 statutory deadline, the EPA completed all remaining initial area designations on April 30, 2018, except for designations for certain areas in Texas, which were finalized on July 17, 2018. State implementation of the revised NAAQS could result in stricter permitting requirements, delay or prohibit the ability to obtain such permits, and result in increased expenditures for pollution control equipment, the costs of which could be significant. The EPA also published final rules under the CAA in June 2016 that require the reduction of volatile organic compound emissions from certain fractured and refractured natural gas wells for which well completion operations are conducted and further require that most wells use reduced emission completions, also known as “green completions.” These regulations also establish specific new requirements regarding emissions from production-related wet seal and reciprocating compressors, and from pneumatic controllers and storage vessels. Compliance with these and other air pollution control and permitting requirements has the potential to delay the development of oil and natural gas projects and increase our costs of development, which costs could be significant.
Climate Change
In response to findings that emissions of carbon dioxide, methane and other greenhouse gases (“GHGs”) present an endangerment to public health and the environment, the EPA has adopted regulations under existing provisions of the CAA that, among other things, establish prevention of significant deterioration (“PSD”) pre-construction and Title V operating permit reviews for certain large stationary sources, as well as monitoring and annual reporting of GHG emissions from certain petroleum and natural gas system sources and, together with the National Highway Transportation Safety Administration, implement GHG emissions limits on vehicles manufactured for operation in the United States. EPA rulemakings related to GHG emissions could adversely affect our operations and restrict or delay our ability to obtain air permits for new or modified sources. Given the long-term trend towards increasing regulation, future federal GHG regulations of the oil and gas industry remain a possibility. In addition, several states, including Louisiana, are pursuing measures to regulate emissions of methane from new and existing sources within the oil and natural gas source category. Compliance with these rules will require enhanced record-keeping practices, the purchase of new equipment, such as optical gas imaging instruments to detect leaks, and increased frequency of maintenance and repair activities to address emissions leakage. These rules will also likely require additional personnel time to support these activities or the engagement of third party contractors to assist with and verify compliance. These rules could result in increased compliance costs on our operations.
119
Table of Contents
Federal agencies also have begun directly regulating emissions of methane, a GHG, from oil and natural gas operations. In June 2016, the EPA published New Source Performance Standards, known as Subpart OOOOa, that require certain new, modified or reconstructed facilities in the oil and natural gas sector to reduce methane and volatile organic compound emissions. In September 2020, the EPA published revisions to this standard that removed the transmission and storage segments from the oil and gas sector and rescinded methane-specific requirements for the production and processing segments. However, litigation is ongoing and the current administration has called for the suspension, revision, or rescission of the September 2020 rule and the reinstatement or issuance of methane emissions standards for new, modified, and existing oil and gas facilities.
While Congress has from time to time considered legislation to reduce emissions of GHGs, there has not been significant activity in the form of adopted legislation to reduce GHG emissions at the federal level in recent years. However, on January 27, 2020, the current administration called for substantial action on climate change, including, among other things, the increased use of zero-emissions vehicles by the federal government, the elimination of subsidies provided to the fossil fuel industry, and increased emphasis on climate-related risks across agencies and economic sectors. Additionally, a number of state and regional efforts have emerged that are aimed at tracking and/or reducing GHG emissions by means of cap and trade programs that typically require major sources of GHG emissions, such as electric power plants, to acquire and surrender emission allowances in return for emitting those GHGs. In addition, the U.S., under the administration of President Obama, was actively involved in the United Nations Conference on Climate Change in Paris, which led to the creation of the Paris Agreement in 2015. The Paris Agreement, which went into effect in November 2016, requires countries to review and “represent a progression” in their nationally determined contributions, which set emissions reduction goals, every five years. On June 1, 2017, President Trump announced that the U.S. would withdraw from the Paris Agreement and that it would potentially seek to renegotiate the Agreement on more favorable terms. The withdrawal from the Paris Agreement became effective on November 4, 2020; however, the current administration has recommitted the United States to the Paris Agreement and directing the federal government to begin formulating the United States’ nationally determined emissions reduction goal under the agreement.
National Environmental Policy Act
Oil and natural gas exploration and production activities on federal lands are typically subject to the National Environmental Policy Act (“NEPA”). NEPA requires federal agencies, including the Department of Interior, to evaluate major agency actions having the potential to significantly impact the environment. The environmental review process involves the preparation of either an environmental assessment or environmental impact statement depending on whether the specific circumstances surrounding the proposed federal action will have a significant impact on the human environment. The NEPA process involves public input through comments which can alter the nature of a proposed project either by limiting the scope of the project or requiring resource-specific mitigation. NEPA decisions can be appealed through the court system by process participants. This process may result in delaying the permitting and development of projects, increase the costs of permitting and developing some facilities and could result in certain instances in the cancellation of existing leases. In July 2020, the White House’s Council on Environmental Quality issued a rule amending the NEPA implementing regulations intended to streamline the environmental review process. The revised rule shortens the time for review as well as eliminates the requirement to evaluate cumulative impacts. The rule was challenged by states and environmental and health advocacy groups and the litigation remains ongoing. The potential impacts of this rule on our business are uncertain at this time.
Endangered Species Act and Migratory Bird Treaty Act
The Endangered Species Act (“ESA”) restricts activities that may affect endangered or threatened species of their habitats. Similar protections are offered to migratory birds under the Migratory Bird Treaty Act. While some of our operations may be located in areas that are designated as habitats for endangered or threatened species or that may attract migratory birds, we are not aware of any proposed ESA listings that will materially affect our operations. In February 2016, the U.S. Fish and Wildlife Service published a final policy that altered
120
Table of Contents
how it identified critical habitat for endangered and threatened species. In August 2020, the U.S. Fish and Wildlife Service and National Marine Fisheries Service issue three rules amending implementation of the ESA regulations revising, among other things, the process for listing species and designating critical habitat. A coalition of states and environmental groups have challenged the three rules and the litigation remains pending. A critical habitat designation could result in further material restrictions to federal and private land use and could delay or prohibit land access or development. Moreover, as a result of one or more settlements approved by the federal government, the FWS must make determinations on the listing of numerous specified species as endangered or threatened under the ESA under specific timelines. The designation of previously unidentified endangered or threatened species could cause us to incur additional costs or become subject to operating restrictions or bans in the affected states.
The Migratory Bird Treaty Act (“MBTA”) makes it illegal to among other things hunt, capture, kill, possess, sell, or purchase migratory birds, nests, or eggs without a permit. This prohibition covers most bird species in the U.S. The MBTA regulations encourage use of best practices to avoid such activities. In January 2017, the Department of the Interior withdrew a longstanding Solicitor’s Opinion Memorandum that had taken the position that the agency could pursue enforcement actions against incidental takes of birds under the MBTA. The Department of the Interior issued a memorandum reinterpreting the Opinion and guidance relaxing the enforcement standards, which was challenged by environmental groups and eight states including New York and California. The Southern District of New York struck down the memorandum and guidance and the Department of the Interior’s appeal of that decision is pending. The potential impacts of this rule on our business are uncertain at this time.
Worker Health and Safety
We are subject to a number of federal and state laws and regulations, including the federal Occupational Safety and Health Act, as amended, and comparable state statutes, whose purpose is to protect the safety and health of workers. The U.S. Occupational Safety and Health Administration (“OSHA”) hazard communication standard, the EPA community right-to-know regulations under Title III of the federal Superfund Amendment and Reauthorization Act and comparable state statutes require maintenance of information about hazardous materials used or produced in operations and provision of this information to employees, state and local government authorities and citizens. Other OSHA standards regulate specific worker safety aspects of our operations. For example, under a 2018 OSHA standard limiting respirable silica exposure, the oil and gas industry must implement engineering controls and work practices to limit exposures below the new limits by June 2021. Failure to comply with OSHA requirements can lead to the imposition of penalties. In December 2015, the U.S. Departments of Justice and Labor announced a plan to more frequently and effectively prosecute worker health and safety violations, including enhanced penalties.
Employees
As of December 31, 2020, we had 113 full-time employees.
Legal Proceedings
We are party to various legal proceedings and claims in the ordinary course of our business. We believe these matters will not have a material adverse effect on our consolidated financial position, results of operations or liquidity.
121
Table of Contents
Directors and Executive Officers
The following table sets forth the names, ages and titles of our directors and executive officers:
| Name |
Age | Title | ||||
| Eric D. Marsh |
61 | President, Chief Executive Officer and Chairman of the Board | ||||
| David M. Elkin |
55 | Executive Vice President and Chief Operating Officer | ||||
| Wayne B. Stoltenberg |
53 | Executive Vice President and Chief Financial Officer | ||||
| Jonathan C. Curth |
38 | Executive Vice President, General Counsel and Corporate Secretary | ||||
| Angelo G. Acconcia |
41 | Director | ||||
| Murat T. Konuk |
31 | Director | ||||
| Charles M. Sledge |
55 | Director | ||||
| H. Paulett Eberhart |
67 | Director Nominee | ||||
| David I. Foley |
53 | Director Nominee | ||||
Eric D. Marsh became our President and Chief Executive Officer in May 2014. Previously, Mr. Marsh served as Senior Vice President of Encana’s USA Division after being promoted to that position in 2011. From November 2009 to October 2013, Mr. Marsh also served as an Executive Vice President at Encana. Prior to 2009, Mr. Marsh led various business units including Encana’s Bighorn Business Unit, Encana’s South Rockies Business Unit and Mid Continent Business Unit. Mr. Marsh currently serves as a director of Olympus Energy LLC. Mr. Marsh served on the Governor’s Task Force for the State of Wyoming Engineering Development and has served on both the University of Wyoming Foundation and the University of Wyoming Engineering Accreditation Board.
David M. Elkin became our Executive Vice President and Chief Operating Officer of Vine in January 2019. Mr. Elkin joined EQT Production Company in 2009 as Vice President, Engineering. He went on to serve as Senior Vice President, Drilling & Completions from 2014 to 2017 and Senior Vice President, Asset Optimization from 2017 to 2018. Prior to his time with EQT, Mr. Elkin spent six years with EnerVest Operating, LLC as Vice President Engineering & Drilling, and the previous 15 years in various engineering and leadership capacities with Energy Corporation of America, Inc. Mr. Elkin holds a B.S., Petroleum and Natural Gas Engineering degree from The Pennsylvania State University.
Wayne B. Stoltenberg became our Executive Vice President and Chief Financial Officer in September 2018. From 2008 to 2018, Mr. Stoltenberg served as Senior Vice President, Chief Financial Officer and Corporate Secretary at Cinco Oil and Gas, LLC and Cinco Resources, Inc. Prior to his time at Cinco, Mr. Stoltenberg spent over 10 years with the Natural Resources Investment Banking Group of Bear, Sterns & Co. Inc., most recently as Senior Managing Director with a primary focus on the E&P sector. He began his career at Credit Suisse. He holds an MBA from the University of Texas at Austin and a B.A. from Columbia University.
Jonathan C. Curth became our Executive Vice President, General Counsel and Corporate Secretary in November 2020. Prior to joining Vine, Mr. Curth was Senior Counsel at the international law firm of Willkie Farr & Gallagher LLP from May to November 2020 after having served as Interim President and CEO, and as an executive consultant to the board of directors, for a private exploration and production company. From December 2017 to December 2019, Mr. Curth served as General Counsel, Chief Compliance Officer, Corporate Secretary and Vice President of Land of Vanguard Natural Resources, Inc. (now Grizzly Energy, LLC). From August 2013 through December 2017, Mr. Curth served as the Assistant General Counsel at Newfield Exploration Company (now Ovintiv Inc.). Mr. Curth concentrated on domestic and international oil and gas transactions and operational matters at Baker & McKenzie LLP from 2011 through 2013 and at Brown & Fortunato, P.C. from August 2007 through January 2011. Mr. Curth is Board Certified in Oil, Gas and Mineral Law by the Texas Board of Legal Specialization. Mr. Curth received his B.A. from Baylor University and his J.D. from The University of Texas School of Law at Austin.
122
Table of Contents
Angelo G. Acconcia has served on our board since May 2014. Mr. Acconcia is a Senior Managing Director in the Private Equity Group at Blackstone. Mr. Acconcia is responsible for overseeing Blackstone’s private equity investment activities in the oil & gas sector. Since joining Blackstone in August 2004, Mr. Acconcia has been involved in the execution of numerous Blackstone investments, including Graham Packaging, Ondeo Nalco, TRW Automotive and Texas Genco. Mr. Acconcia has either led or played a critical role in every one of Blackstone’s North American oil and gas investments, including Alta Energy, Beacon Offshore Energy, GeoSouthern Energy, Guidon Energy, Olympus, Kosmos Energy, LLOG Bluewater, OSUM, PGE, Primexx, Rockridge Royalties, Royal Resources, Swallowtail Royalties, Gavilan and Vine Energy, among others. From August 2002 until August 2004, Mr. Acconcia worked at Morgan Stanley & Company’s Investment Banking Division in the Global Energy and Mergers and Acquisitions departments in both the United States and Canada. Because of his broad knowledge of the industry and oil and gas investments, we believe Mr. Acconcia is well qualified to serve on our board of directors.
Murat T. Konuk has served as a member of our board of directors since November 2019. Mr. Konuk is a Principal in the Private Equity Group at Blackstone. Since joining Blackstone in June 2018, Mr. Konuk has been involved with Blackstone’s investments in Vine Oil & Gas, Brix, Harvest, Ulterra, and GridLiance. From June 2017 until June 2018, Mr. Konuk served as a Vice President at Castle Harlan where he was involved in the evaluation and execution of investments in energy and other industries. Mr. Konuk served as a Senior Associate at Castle Harlan from November 2015 to May 2017 after having joined as an Associate in July 2013. From July 2011 to June 2013, Mr. Konuk worked at Goldman Sachs’ Investment Banking Division in the Global Natural Resources group.
Charles M. Sledge has served as a member of our board of directors since July 1, 2017. Mr. Sledge previously served as Senior Vice President and Chief Financial Officer of Cameron International Corporation, an oilfield services company, from November 2008 until its acquisition by Schlumberger in April 2016 after previously having been its Vice President and Corporate Controller. Mr. Sledge also served as Senior Vice President of Finance and Treasurer of Stage Stores, Inc. from 1999 to 2001 after having served as its Vice President, Controller from 1996 to 1999. Mr. Sledge serves on the board of directors of Talos Energy Inc., Expro International, Weatherford International and Noble Corporation. Additionally, Mr. Sledge serves on the audit committee and nominating committee of Talos Energy Inc. and the audit committee and health, safety and environment committee of Weatherford International. Because of his broad financial knowledge as well as knowledge of the industry and oil and gas investments, we believe Mr. Sledge is well qualified to serve on our board of directors.
H. Paulett Eberhart, is Chairman and Chief Executive Officer of HMS Ventures, a privately-held business involved with technology services and the acquisition and management of real estate, since 2014. Previously, she was President and Chief Executive Officer of CDI Corp., a provider of engineering and information technology outsourcing and professional staffing services, from 2011 through 2014; Chairman and Chief Executive Officers of HMS Ventures from 2009 to 2011; and President and Chief Executive Officer from Invensys Process Systems, Inc., a process automation company, from 2007 to 2009. Ms. Eberhart is also a director of LPL Financial Holdings Inc., Valero Energy Corporation and Fluor Corporation. She is a former director of Anadarko Petroleum Corporation, serving as head director, and Cameron International Corporation. Because of her many years of service as a Chief Executive Officer at both private and public companies, in addition to her many years of service as an executive at technology services corporations, we believe Ms. Eberhart is well qualified to serve on our board of directors and will bring valuable operational, financial and accounting expertise to the Board.
David I. Foley is a Senior Managing Director in the Private Equity Group at Blackstone and Global Head of Blackstone Energy Partners. Mr. Foley is based in New York and is responsible for overseeing Blackstone’s private equity investment activities in the energy and natural resource sector on a global basis. Since joining Blackstone in 1995, Mr. Foley has been responsible for building the Blackstone energy & natural resources practice and has played an integral role in every energy-sector private equity deal that the firm has made. Mr. Foley actively leads Blackstone’s investment activities in the midstream sector and provides guidance and
123
Table of Contents
support to the other Blackstone Energy Partners senior investment professionals, who each have primary responsibility for specific sectors. Before joining Blackstone, Mr. Foley worked with AEA Investors, and prior to that he worked as a management consultant for Monitor Company. Mr. Foley serves as a Director of several energy companies and joint ventures, including: Beacon Offshore Energy, EagleClaw Midstream, ET Rover, Grand Prix Pipeline LLC, Permian Highway Pipeline LLC and Siccar Point Energy Limited. Mr. Foley also previously served as a Director of Kosmos Energy Ltd., Falcon Minerals Corp and Cheniere Energy, Inc. Because of his broad knowledge of the energy industry and many years of experience investing in the sector, we believe Mr. Foley is well qualified to serve on our board of directors.
Board of Directors
Upon the closing of this offering, it is anticipated that we will have six directors. We currently have four directors, and we plan to add two additional independent directors prior to or upon the closing of this offering. Within 90 days of closing, we plan to add one additional independent director and have a seven member board of directors.
Our board of directors has determined that Messrs. Acconcia, Konuk, Sledge and Foley and Mrs. Eberhart are independent under NYSE listing standards.
In connection with this offering, we will enter into a stockholders’ agreement with Blackstone, which will provide Blackstone with the right to designate up to four nominees to our board of directors so long as it and its affiliates collectively beneficially own more than 50% of the outstanding shares of our common stock. Under the stockholders’ agreement, Blackstone will also have the right to designate a certain number of nominees to our board of directors depending on its ownership until it and its affiliates no longer collectively beneficially own more than 5% of the outstanding shares of our common stock. The Blackstone nominees are Messrs. Acconcia, Konuk and Foley. Our board of directors will be divided into three classes of directors, with each class as equal in number as possible, serving staggered three-year terms. The term of office of the first class of directors, consisting of Mr. Sledge, will expire at our 2022 annual meeting of stockholders. The term of office of the second class of directors, consisting of Mrs. Eberhart and Mr. Konuk, will expire at our 2023 annual meeting of stockholders. The term of office of the third class of directors, consisting of Messrs. Marsh, Foley and Acconcia, will expire at our 2024 annual meeting of stockholders.
In evaluating director candidate’s qualifications, we will assess whether a candidate possesses the integrity, judgment, knowledge, experience, skills and expertise that are likely to enhance our ability to manage and direct our affairs and business, including the ability of our board’s committees. Our directors hold office until the earlier of their death, resignation, retirement, disqualification or removal or until their successors have been duly elected and qualified.
Status as a Controlled Company
Because the Vine Energy Investment Vehicles and the Vine Energy Investment II Vehicles will collectively own a majority of our outstanding common stock following the completion of this offering, we expect to be a controlled company under NYSE corporate governance standards. A controlled company need not comply with the applicable corporate governance rules that its board of directors have a majority of independent directors and independent compensation and nominating and governance committees. Notwithstanding our status as a controlled company, we will remain subject to the applicable corporate governance standard that requires us to have an audit committee composed entirely of independent directors. As a result, our audit committee must have at least one independent director by the date our Class A common stock is listed on the NYSE, as applicable, at least two independent directors within 90 days of the listing date and at least three independent directors within one year of the listing date.
While these exemptions will apply to us as long as we remain a controlled company, we expect that our board of directors will nonetheless consist of a majority of independent directors within the meaning of the NYSE listing standards currently in effect.
124
Table of Contents
Committees of the Board of Directors
Upon the conclusion of this offering, we intend to have an audit committee, a compensation committee, a nominating and corporate governance committee and an environmental, safety and governance committee of our board of directors, and may have such other committees as the board of directors shall determine from time to time. We anticipate that each of the standing committees of the board of directors will have the composition and responsibilities described below.
Audit Committee
We will establish an audit committee prior to the completion of this offering. Following completion of this offering, our audit committee will consist of Messrs. Sledge and Konuk and Mrs. Eberhart, and Mr. Sledge will serve as the chairman. As required by the rules of the SEC and listing standards of the NYSE, the audit committee will consist solely of independent directors, subject to the phase-in exceptions. Those rules permit us to have an audit committee that has one independent member at the date our common stock is first listed on the NYSE, a majority of independent members within 90 days thereafter and all independent members within one year thereafter. SEC rules also require that a public company disclose whether or not its audit committee has an “audit committee financial expert” which is defined as a person whose experience yields the attributes outlined in such rules. Mr. Sledge will satisfy this requirement.
This committee will oversee, review, act on and report on various auditing and accounting matters to our board of directors, including: the selection of our independent accountants, the scope of our annual audits, fees to be paid to them, their performance and our accounting practices. In addition, the audit committee will oversee our compliance programs relating to legal and regulatory requirements. We expect to adopt an audit committee charter defining the committee’s primary duties in a manner consistent with the rules of the SEC and applicable stock exchange or market standards, including SOX.
Compensation Committee
We will establish a compensation committee prior to the completion of this offering. Following completion of this offering, our compensation committee will consist of Messrs. Foley, Acconcia and Sledge, and Mr. Foley will serve as the chairman. As required by the rules of the SEC and listing standards of the NYSE, the compensation committee will consist solely of independent directors, subject to the phase-in exceptions. Those rules permit us to have a compensation committee that has one independent member at the date our common stock is first listed on the NYSE, a majority of independent members within 90 days thereafter and all independent members within one year thereafter.
This committee establishes salaries, incentives and other forms of compensation for officers and other employees. Our compensation committee also administers our incentive compensation and benefit plans. See “Executive Compensation” for a brief description of how we intend to make grants following this offering. We have adopted a compensation committee charter defining the committee’s primary duties in a manner consistent with the rules of the SEC, the PCAOB and applicable NYSE standards.
Nominating and Corporate Governance Committee
We will establish a nominating and corporate governance committee prior to the completion of this offering. Following the completion of this offering, our nominating and corporate governance will consist of Messrs. Acconcia, Sledge and Konuk, and Mr. Acconcia will serve as the chairman. As required by the rules of the SEC and listing standards of NYSE, the nominating and corporate governance committee will consist solely of independent directors, subject to the phase-in exceptions. Those rules permit us to have a nominating and corporate governance committee that has one independent member at the date our common stock is first listed on the NYSE, a majority of independent members within 90 days thereafter and all independent members within one year thereafter.
125
Table of Contents
Environmental, Safety and Governance Committee
We will establish an environmental, safety and governance committee prior to the completion of this offering. Following completion of this offering, our environmental, safety and governance committee will consist of Mrs. Eberhart and Messrs. Acconcia and Marsh, and Mrs. Eberhart will serve as the chairman. This committee will assist the board of directors with its responsibilities relating to oversight of our environmental, health, safety and governance practices and to monitor management’s efforts in creating a culture of safety and environmental protection. The environmental, safety and governance committee will primarily fulfill this responsibility by carrying out the activities enumerated in the environmental, safety and governance committee charter, and will perform such other functions as the board of directors may assign from time to time.
Compensation Committee Interlocks and Insider Participation
None of our executive officers serve on the board of directors or compensation committee of another public company that has an executive officer that serves on our board or compensation committee. No member of our board is an executive officer of another public company in which one of our executive officers serves as a member of the board of directors or compensation committee of that company.
Code of Business Conduct and Ethics
Prior to the completion of this offering, our board of directors will adopt amendments to our existing code of business conduct and ethics applicable to our employees, directors and officers, that will comply with applicable U.S. federal securities laws and the corporate governance rules of the NYSE. Any waiver of this code may be made only by our board of directors and will be promptly disclosed as required by applicable U.S. federal securities laws and the corporate governance rules of the NYSE.
Corporate Governance Guidelines
Prior to the completion of this offering, our board of directors will adopt corporate governance guidelines in accordance with the corporate governance rules of the NYSE.
126
Table of Contents
We are an “emerging growth company,” within the meaning of the Securities Act. As such, we are providing our Summary Compensation Table, Outstanding Equity Awards at Fiscal Year-End and limited narrative disclosures regarding executive compensation for only the last completed fiscal year. For 2020, our named executive officers (“Named Executive Officers” or “NEOs”) were:
| Name |
Principal Position | |
| Eric D. Marsh |
President, Chief Executive Officer & Chairman of the Board | |
| David M. Elkin |
Executive Vice President and Chief Operating Officer | |
| Wayne B. Stoltenberg |
Executive Vice President and Chief Financial Officer |
Summary Compensation Table
The following table summarizes information relating to compensation earned and accrued for employment during the 2020 fiscal year:
| Name |
Year | Salary ($)(1) | Non-Equity Incentive Plan Compensation ($)(2) |
All Other Compensation ($)(3) |
Total($) | |||||||||||||||
| Eric D. Marsh President, Chief Executive Officer & Chairman of the Board |
2020 | 752,473 | (4) | 869,526 | 14,250 | 1,636,249 | ||||||||||||||
| David M. Elkin Executive Vice President & Chief Operating Officer |
2020 | 412,024 | 356,895 | 14,250 | 783,169 | |||||||||||||||
| Wayne B. Stoltenberg Executive Vice President & Chief Financial Officer |
2020 | 365,006 | (5) | 237,255 | 14,250 | 616,511 | ||||||||||||||
| (1) | A portion of these amounts are charged to Brix Oil & Gas Holdings LP and Harvest Royalties Holdings LP as general and administrative expenses based on time spent by our NEOs providing services to such entities pursuant to separate management services agreements. All our executive officers are employed by Vine Management Services LLC. |
| (2) | The amounts reported reflect amounts earned for company performance for 2020 under our annual cash bonus program which have been approved by the Board and we expect will be paid during the first week of March 2021. See “Additional Narrative Disclosure—Cash Incentive Awards,” for additional information. |
| (3) | Amounts reported include company contributions under our 401(k) plan. See “Additional Narrative Disclosure—Retirement Benefits,” for additional information. |
| (4) | Amounts reported include $27,868 of unused vacation payout. |
| (5) | Amounts reported include $13,518 of unused vacation payout. |
127
Table of Contents
Outstanding Equity Awards at 2020 Year-End
The following table reflects information regarding outstanding Class A units, the only incentive awards held by our NEOs, as of December 31, 2020. See “—Additional Narrative Disclosure—Class A Units” for additional information regarding such units.
| Number of Securities Unexercised, Exercisable (#)(1) |
Number of Securities Unexercised, Unexercisable (#)(1) |
Exercise Price ($) |
Expiration Date |
|||||||||||||||
| Eric D. Marsh |
Class A Units (Vine)(2) | 40 | — | N/A | N/A | |||||||||||||
| Class A Units (Brix)(3) | 32 | 8 | N/A | N/A | ||||||||||||||
| Class A Units (Harvest)(4) | 24 | 6 | N/A | N/A | ||||||||||||||
| David M. Elkin |
Class A Units (Vine)(2) | 2.4 | 9.6 | N/A | N/A | |||||||||||||
| Class A Units (Brix)(3) | 1.8 | 7.2 | N/A | N/A | ||||||||||||||
| Class A Units (Harvest)(4) | 2.4 | 9.6 | N/A | N/A | ||||||||||||||
| Wayne B. Stoltenberg |
Class A Units (Vine)(2) | 3.2 | 4.8 | N/A | N/A | |||||||||||||
| Class A Units (Brix)(3) | 3.2 | 4.8 | N/A | N/A | ||||||||||||||
| Class A Units (Harvest)(4) | 2 | 3 | N/A | N/A | ||||||||||||||
| (1) | We believe that these awards are most similar economically to stock options, and as such we report them as “options” under the definition provided in Item 402(a)(6)(i) of Regulation S-K as an instrument with an “option-like feature.” Awards reflected as “Unexercisable” are Class A units that have not yet vested or are not yet probable to vest. Awards reflected as “Exercisable” are Class A units that have vested, but remain outstanding. See “Additional Narrative Disclosure—Class A Units” for more information. |
| (2) | Represents Class A units in Vine Oil & Gas Parent LP granted on the following dates: to Mr. Marsh on May 28, 2014, to Mr. Elkin on January 21, 2019 and to Mr. Stoltenberg on September 10, 2018. These units vest in five equal annual installments beginning on the later of the first anniversary of the Named Executive Officer’s hire date and the Shell Acquisition. |
| (3) | Represents Class A units in Brix Oil & Gas Holdings LP granted on the following dates: to Mr. Marsh on March 15, 2016, to Mr. Elkin on January 21, 2019 and to Mr. Stoltenberg on September 10, 2018. These units vest in five equal annual installments beginning on the later of the first anniversary of the Named Executive Officer’s hire date and March 15, 2017. |
| (4) | Represents Class A units in Harvest Royalties Holdings LP granted on the following dates: to Mr. Marsh on March 15, 2016, to Mr. Elkin on January 21, 2019 and to Mr. Stoltenberg on September 10, 2018. These units vest in five equal annual installments beginning on the later of the first anniversary of the Named Executive Officer’s hire date and March 15, 2017. |
Additional Narrative Disclosure
Retirement Benefits
We have not maintained, and do not currently maintain, a defined benefit pension plan or nonqualified deferred compensation plan. We currently make available a retirement plan intended to provide benefits under Section 401(k) of the Code, pursuant to which employees (including our NEOs) may elect to defer a portion of their compensation on a pre-tax basis and have it contributed to the plan. Pre-tax contributions are allocated to each participant’s individual account and are then invested in selected investment alternatives according to the participants’ directions. We match 100% of elective deferrals up to a maximum per participant per calendar year equal to 5% of the participant’s eligible compensation. All contributions to our 401(k) plan are 100% vested at all times. All contributions under our 401(k) plan are subject to certain annual dollar limitations in accordance with applicable laws, which are periodically adjusted for changes in the cost of living.
128
Table of Contents
Employment Agreements
We have entered into employment agreements with Messrs. Marsh, Elkin and Stoltenberg. The description of the employment agreements set forth below is a summary of the material features of the agreements regarding potential payments upon a termination of employment or a change of control. This summary, however, does not purport to be a complete description of all the provisions of the agreements that we have entered into with the executives. This summary is qualified in its entirety by reference to the employment agreements, which have been filed as exhibits to this registration statement.
In May 2014, we entered into an employment agreement with Mr. Marsh. The agreement had an initial two-year term, and, upon the consummation of the Shell Acquisition, an indefinite extension until otherwise terminated. The agreement provided Mr. Marsh with an annual base salary of $350,000 during the term and eligibility to earn a targeted annual bonus of two times his base salary. Effective January 1, 2017, Mr. Marsh’s agreement was amended to increase his base salary to $570,000 with an annual bonus target of 100% of his base salary. Mr. Marsh’s employment agreement now has an indefinite term that continues until his employment is otherwise terminated.
Effective January 2, 2018, Mr. Marsh’s base salary was adjusted to $670,000 while his annual target bonus remains 100% of his base salary. Effective January 1, 2019, Mr. Marsh’s base salary was adjusted to $703,500 while his annual bonus target remains 100% of his base salary. Effective June 11, 2020, Mr. Marsh’s agreement was again amended to increase his base salary to $724,605 while his annual bonus target remains 100% of his base salary.
In January 2019, we entered into an employment agreement with Mr. Elkin. The agreement initially has a two-year term that automatically renews for successive one-year periods unless notice of non-renewal is provided by either party at least 60 days prior to a renewal date. The agreement provided Mr. Elkin with an annual base salary of $385,000 during the term and eligibility to earn an annual target bonus of 75% of his base salary. Effective June 11, 2020, Mr. Elkin’s agreement was amended to increase his base salary to $396,550 while his annual bonus target remains 75% of his base salary.
In September 2018, we entered into an employment agreement with Mr. Stoltenberg. The agreement initially had a two-year term that automatically renewed for successive one-year periods unless notice of non-renewal is provided by either party at least 60 days prior to a renewal date. The agreement provided Mr. Stoltenberg with an annual base salary of $325,000 during the term and eligibility to earn an annual target bonus of 50% of his base salary. Effective January 1, 2019 Mr. Stoltenberg’s base salary was adjusted to $341,250 while his annual bonus target remains 50% of his base salary. Effective June 11, 2020, Mr. Stoltenberg’s agreement was amended to increase his base salary to $351,488 while his annual bonus target remains 50% of his base salary.
Under the terms of the employment agreements with Messrs. Marsh, Elkin and Stoltenberg, each will be entitled to receive the following amounts upon a termination by the company for “cause,” upon voluntary termination without “good reason,” or, in the case of Messrs. Elkin and Stoltenberg, if the termination is due to death or disability: (a) payment of all accrued and unpaid base salary to the date of termination, (b) reimbursement of all incurred but unreimbursed business expenses and (c) benefits entitled under the terms of any applicable benefit plan or program (together, the “Accrued Obligations”). If the termination is by the company without cause or by the executive with good reason or, in the case of Mr. Marsh, due to death or disability, each will also be entitled to a severance payment equal to 12 months’ worth of their annualized base salary, payable in ratable installments in accordance with regular payroll practices, as well as continued coverage, at the same cost as if the executive had remained employed, under the company’s group health plan for the executive and his or her eligible dependents for a period of 12 months. In addition, upon such a termination, Mr. Marsh will also be entitled to a pro-rated annual bonus, payable at the same time and manner as if Mr. Marsh had remained employed through such payment date.
129
Table of Contents
For purposes of the NEOs’ employment agreements: “Cause” means (a) act(s) of gross negligence or willful misconduct by the executive in the course of employment, (b) willful failure or refusal to perform in any material respect the executive’s duties or responsibilities, (c) misappropriation (or attempted misappropriation) by the executive of any assets or business opportunities of us, (d) embezzlement or fraud committed (or attempted) by the executive, or at his direction, (e) conviction of, or the plea of guilty or nolo contendere or the equivalent in respect to, any felony or a misdemeanor involving an act of dishonesty, moral turpitude, deceit, or fraud, (f) material breach by the executive of the employment agreement or other specified agreements or (g) breach by the executive of the non-interference agreement or other applicable restrictive covenants;
“Disability” means any physical or mental disability or infirmity of the executive that prevents, or would be reasonably likely to prevent, the performance of executive’s duties for either 180 consecutive days or 270 non-consecutive days during any 12-month period; and
“Good Reason” means, without the NEO’s consent, (a) a material diminution in the executive’s title, duties, or responsibilities; (b) the involuntary relocation of the geographic location of the executive’s principal place of employment by more than 50 miles from the location of the executive’s principal place of employment as of the effective date of the employment agreement; (c) a material breach by us of the employment agreement; or (d) in the case of Mr. Marsh, a diminution in his base salary.
Base Salary
Each NEO’s base salary is a fixed component of compensation for each year for performing specific job duties and functions. Historically, the board of managers of Vine Oil & Gas GP LLC established the annualized base salary for each of the NEOs at a level necessary to retain their services and reviewed such annualized base salary at the end of each year, with adjustments implemented at the beginning of the next year. The establishment and adjustment of the annualized base salary for each NEO has generally been based on factors including but not limited to: (a) any increase or decrease in responsibility, (b) job performance and (c) the level of compensation paid to executives of other peer companies, as estimated based on publicly available information and the experience of the board of managers of our predecessor.
Annual Bonus
Historically, we have maintained an annual performance-based cash bonus program. Our board of managers has previously determined the amount, if any, of the annual bonuses awarded to each of our NEOs after careful review of our performance over the course of the preceding year. Principal determinants in this subjective assessment have included, but were not limited to, natural gas production, EUR improvements, capital efficiency, operating expenses and Adjusted EBITDAX. Other qualitative factors such as advancement of strategic objectives also influence the results of the bonus program.
For 2020, based on company performance, our board of managers approved a payout for Messrs. Marsh, Elkin and Stoltenberg of 120%, 120% and 135%, respectively, of their bonus targets.
Cash Retention Awards
On September 10, 2019, we entered into cash incentive award agreements with Messrs. Marsh and Stoltenberg that provide for cash payments upon vesting in the amount of $4,221,000 and $511,875, respectively. The actual amount of the cash payment made to each NEO on vesting is reduced by any distributions, if any, the NEO receives on Class A units of Vine Oil & Gas Parent LP between the date of grant of the cash incentive award and the date of payment. The cash awards generally vest on the earlier of (a) the fourth anniversary of the grant and (b) a “Change in Control,” in each case, subject to the NEO’s continued employment with us. If, prior to vesting, the NEO’s employment is terminated by the company for Cause or by the NEO without Good Reason (each as defined in the NEO’s employment agreement) or if the NEO violates any of the restrictive covenants
130
Table of Contents
applicable to the NEO, then the cash award will automatically be forfeited for no consideration. If the NEO’s employment is terminated by the company without Cause or the NEO resigns for Good Reason prior to the vesting of the cash award, a prorated portion of the cash award will vest based on the percentage of the four-year period that has elapsed from the date of grant to the termination of the NEO’s employment. The cash award will be paid in a lump sum within 30 days of vesting.
For purposes of the cash incentive award agreements, a Change in Control generally means that (a) more than 50% of the Class B units of Vine Oil & Gas Parent LP are acquired by an unaffiliated entity; or (b) substantially all of the outstanding interests of Vine Oil & Gas Parent LP are sold or exchanged in a single transaction, or a series of related transactions, to any unaffiliated entity. We do not expect that this offering will result in a Change in Control for purposes of the cash award agreements.
Class A Units
Upon commencing employment, Messrs. Marsh, Elkin and Stoltenberg each received an award of Class A units in each of Brix Oil & Gas Holdings LP, Harvest Royalties Holdings LP and Vine Oil & Gas Parent LP (each, a “Partnership Grantor”) pursuant to each Partnership Grantor’s respective Class A Unit Incentive Plans. The Class A units are profits interests that represent actual (non-voting) equity interests in the respective Partnership Grantor meant to enable certain employees to share in Blackstone’s financial success after Blackstone and other employee co-investors receive a certain level of return on their investment. The Class A units entitle unitholders to an increasing percentage of future distributions, but only after all invested capital has received cumulative cash distributions of a certain multiple return.
The Class A units vest in five equal annual installments beginning on the later of the first anniversary of the NEO’s hire date and March 15, 2017 (or, in the case of the Class A Units of Vine Oil & Gas Parent LP, the later of the first anniversary of the Named Executive Officer’s hire date and the Shell Acquisition), although such vesting will be fully accelerated upon the occurrence of an “Exit Event” (as defined below). If a Named Executive Officer’s employment is terminated due to death or disability, any Class A units that would have become vested on the next vesting date automatically vest. If a Named Executive Officer’s employment is terminated for any other reason, all unvested Class A units are forfeited at the time of termination (except with respect to Mr. Marsh, whose unvested Class A units will fully vest in the event his employment is terminated without cause or if he resigns with good reason, in each case, within one year of this offering). If a Named Executive Officer’s employment is terminated due to death or disability, or by us without cause or by the NEO with good reason, the Class A units will be subject to repurchase.
We do not expect that this offering will result in an Exit Event for the Class A units. An “Exit Event” occurs if, other than as a result of a public offering:
| a) | more than 50% of the Class B units of the applicable Partnership Grantor are acquired by an unaffiliated entity; or |
| b) | substantially all of the applicable Partnership Grantor’s outstanding interests are sold or exchanged in a single transaction, or a series of related transactions, to any unaffiliated entity. |
For treatment of the Class A units in connection with this offering, see “Corporate Reorganization.” Following the closing of this offering, we expect that our NEOs will no longer receive awards of Class A units or other equity based compensation from any of the Partnership Grantors. Our compensation consultant has been directed to prepare a market study of incentive equity award grants for directors and executive officers of our peer-companies and to prepare recommendations for grants. The board intends to make grants under our long-term incentive plan (see “2021 Long Term Incentive Plan”) within 90 days from the closing of this offering at levels consistent with the 50th percentile of our peer group, taking into consideration the study completed by the compensation consultant and their recommendation.
131
Table of Contents
Future Compensation Arrangements
We are undertaking a review of our executive compensation arrangements and, under the direction of our Compensation Committee in consultation with our compensation consultant, we intend to enter into new employment agreements and comprehensive compensation arrangements with our management team, including each of our NEOs. Our compensation consultant has been directed to prepare a market study of compensation arrangements (including incentive equity award grants as described above) of our peer companies and to prepare recommendations to our Compensation Committee. It is currently anticipated that these arrangements and grants will be entered into within approximately 90 days of the completion of this offering. The terms of these new employment agreements and compensation arrangements have not yet been determined, but it is anticipated that the compensation of our management team under these new arrangements will reflect levels consistent with the 50th percentile of our peer group.
Director Compensation
The following table presents the total compensation for each person who served as a non-employee member of our board of managers during 2020. Other than as set forth in the table and described more fully below, we did not pay any compensation, reimburse any expense of, make any equity awards or non-equity awards to, or pay any other compensation to, any of the other non-employee members of the board of managers in 2020.
| Name |
Fees Earned or Paid in Cash ($) |
Total ($) | ||||||
| Alan J. Carr(1) |
262,500 | 262,500 | ||||||
| Charles M. Sledge |
262,500 | 262,500 | ||||||
| (1) | Mr. Carr is a director of our predecessor and will not be continuing as a director following the IPO. |
The fees for each of our non-employee directors in 2020 consisted of a cash retainer equal to $25,000 per month from January through September 2020 which was then reduced to $12,500 per month from October through December. We are undertaking a review of our non-employee director compensation arrangements and intend to implement a non-employee director compensation program in connection with this offering. The terms of the non-employee director compensation program have not yet been determined. Directors who are also our employees will not receive any additional compensation for their service on our board of directors.
2021 Long-Term Incentive Plan
In order to incentivize our employees following the completion of this offering, we anticipate that our board of directors will adopt a new long-term incentive plan (the “LTIP”) for employees, consultants and directors prior to the completion of this offering. Our NEOs will be eligible to participate in the LTIP, which we expect will become effective upon the consummation of this offering. We anticipate that the LTIP will provide for the grant of options, stock appreciation rights, restricted stock, restricted stock units, stock awards, dividend equivalents, other stock-based awards, cash awards, and substitute awards intended to align the interests of service providers, including our Named Executive Officers, with those of our stockholders.
Securities to be Offered
Subject to adjustment in the event of certain transactions or changes of capitalization in accordance with the LTIP, a number of shares of Class A common stock equal to 8% of the number shares of Class A common stock and Class B common stock outstanding at the closing of this offering (on a fully diluted basis) will initially be reserved for issuance pursuant to awards under the LTIP. The total number of shares reserved for issuance under
132
Table of Contents
lesser of (i) a number of shares of Class A common stock equal to 3% of the total number of shares of Class A common stock and Class B common stock outstanding on each December 31 immediately prior to the date of increase or (ii) such number of shares of the company’s Class A common stock determined by our board of directors or compensation committee. The total number of initial shares reserved for issuance under the LTIP may be issued pursuant to incentive options. Shares of Class A common stock subject to an award that expires or is canceled, forfeited, exchanged, settled in cash or otherwise terminated without delivery of shares and shares withheld to pay the exercise price of, or to satisfy the withholding obligations with respect to, an award will again be available for delivery pursuant to other awards under the LTIP.
Administration
The LTIP will be administered by our board of directors, except to the extent our board of directors elects a committee of directors to administer the LTIP (as applicable, the “Administrator”). The Administrator has broad discretion to administer the LTIP, including the power to determine the eligible individuals to whom awards will be granted, the number and type of awards to be granted and the terms and conditions of awards. The Administrator may also accelerate the vesting or exercise of any award and make all other determinations and to take all other actions necessary or advisable for the administration of the LTIP. To the extent the Administrator is not our board of directors, our board of directors will retain the authority to take all actions permitted by the Administrator under the LTIP.
Eligibility
Our employees, consultants and nonemployee directors, and employees and consultants of our affiliates, will be eligible to receive awards under the LTIP.
Nonemployee Director Compensation Limits
Under the LTIP, in a single fiscal year, a nonemployee director may not be granted awards for such individual’s service on our board of directors having a value in excess of $750,000.
Types of Awards
Options. We may grant options to eligible persons, except that incentive options may only be granted to persons who are our employees or employees of one of our subsidiaries, in accordance with Section 422 of the Code. The exercise price of an option generally cannot be less than 100% of the fair market value of a share of Class A common stock on the date on which the option is granted and the option must not be exercisable for longer than 10 years following the date of grant. In the case of an incentive option granted to an individual who owns (or is deemed to own) at least 10% of the total combined voting power of all classes of our equity securities, the exercise price of the option must be at least 110% of the fair market value of a share of Class A common stock on the date of grant, and the option must not be exercisable more than five years from the date of grant.
SARs. A SAR is the right to receive an amount equal to the excess of the fair market value of one share of Class A common stock on the date of exercise over the grant price of the SAR. The grant price of an SAR generally cannot be less than 100% of the fair market value of a share of Class A common stock on the date on which the SAR is granted. The term of a SAR may not exceed ten years. SARs may be granted in connection with, or independent of, other awards. The Administrator will have the discretion to determine other terms and conditions of an SAR award.
Restricted Share Awards. A restricted share award is a grant of shares of Class A common stock subject to the restrictions on transferability and risk of forfeiture imposed by the Administrator. Unless otherwise determined by the Administrator and specified in the applicable award agreement, the holder of a restricted share
133
Table of Contents
award will have rights as a stockholder, including the right to vote the shares of Class A common stock subject to the restricted share award or to receive dividends on the shares of Class A common stock subject to the restricted share award during the restriction period. In the discretion of the Administrator, dividends distributed prior to vesting may be subject to the same restrictions and risk of forfeiture as the restricted shares with respect to which the distribution was made.
Restricted Share Units. An RSU is a right to receive cash, shares of Class A common stock or a combination of cash and shares of Class A common stock at the end of a specified period equal to the fair market value of one share of common stock on the date of vesting. RSUs may be subject to the restrictions, including a risk of forfeiture, imposed by the Administrator.
Share Awards. A share award is a transfer of unrestricted shares of Class A common stock on terms and conditions, if any, determined by the Administrator.
Dividend Equivalents. Dividend equivalents entitle a participant to receive cash, shares of Class A common stock, other awards or other property equal in value to dividends or other distributions paid with respect to a specified number of shares of Class A common stock. Dividend equivalents may be granted on a free-standing basis or in connection with another award (other than a restricted share award or a share award).
Other Share-Based Awards. Other share-based awards are awards denominated or payable in, valued in whole or in part by reference to, or otherwise based on or related to, the value of our shares of Class A common stock.
Cash Awards. Cash awards may be granted on a free-standing basis or as an element of, a supplement to, or in lieu of any other award.
Substitute Awards. Awards may be granted in substitution or exchange for any other award granted under the LTIP or under another equity incentive plan or any other right of an eligible person to receive payment from us. Awards may also be granted under the LTIP in substitution for similar awards held for individuals who become participants as a result of a merger, consolidation or acquisition of another entity by or with the company or one of our affiliates.
Certain Transactions
If any change is made to our capitalization, such as a share split, share combination, share dividend, exchange of shares or other recapitalization, merger or otherwise, that results in an increase or decrease in the number of outstanding shares of common stock, appropriate adjustments will be made by the Administrator in the shares subject to an award under the LTIP. The Administrator will also have the discretion to make certain adjustments to awards in the event of a change in control, such as accelerating the vesting or exercisability of awards; requiring the surrender of an award, with or without consideration, or making any other adjustment or modification to the award that the Administrator determines is appropriate; in light of such transaction.
Clawback
All awards granted under the LTIP will be subject to reduction, cancelation or recoupment under any written clawback policy that we may adopt and that we determine should apply to awards under the LTIP.
Plan Amendment and Termination
Our Administrator may amend or terminate any award, award agreement or the LTIP at any time; however, stockholder approval will be required for any amendment to the extent necessary to comply with applicable law or exchange listing standards. The Administrator will not have the authority, without the approval of stockholders, to amend any outstanding option or share appreciation right to reduce its exercise price per share. The LTIP will remain in effect for a period of 10 years (unless earlier terminated by our board of directors).
134
Table of Contents
SECURITY OWNERSHIP OF CERTAIN BENEFICIAL OWNERS AND MANAGEMENT
The following table sets forth the beneficial ownership of our Class A common stock and Class B common stock (assuming the underwriters do not exercise their option to purchase additional common stock) that, upon the consummation of our corporate reorganization in connection with the completion of this offering, will be owned by:
| • | each person known to us to beneficially own more than 5% of any class of our outstanding common stock; |
| • | each of our Named Executive Officers; |
| • | each member of our board of directors and each director nominee; and |
| • | all of our directors, director nominees and executive officers as a group. |
Except as otherwise noted, the person or entities listed below have sole voting and investment power with respect to all shares of our Class A common stock beneficially owned by them, except to the extent this power may be shared with a spouse. All information with respect to beneficial ownership has been furnished by the directors or Named Executive Officers, as the case may be. Unless otherwise noted, the mailing address of each listed beneficial owner is c/o Vine Energy Inc., 5800 Granite Parkway, Suite 550, Plano, Texas 75024.
Prior to the completion of our corporate reorganization (which will occur in connection with the completion of this offering), the ownership interests of our directors and executive officers are represented by limited partnership interests in Vine Oil & Gas LP.
To the extent that the underwriters sell more than 18,750,000 shares of Class A common stock, the underwriters have the option to purchase up to an additional 2,812,500 shares from us.
| Shares of Class A Common Stock Beneficially Owned |
Shares of Class B Common Stock Beneficially Owned |
Total Common Stock Beneficially Owned |
||||||||||||||||||
| Name of Beneficial Owner(1) |
Number | Percentage | Number | Percentage | Percentage | |||||||||||||||
| 5% Shareholders: |
||||||||||||||||||||
| Vine Investment LLC(2) |
57,143 | 0.2 | % | 17,437,592 | 50.8 | % | 25.3 | % | ||||||||||||
| Vine Investment II LLC(3) |
9,467,767 | 27.1 | % | — | — | 13.7 | % | |||||||||||||
| Brix Investment LLC(4) |
56,462 | 0.2 | % | 16,649,664 | 48.6 | % | 24.1 | % | ||||||||||||
| Brix Investment II LLC(5) |
6,525,534 | 18.6 | % | — | — | 9.4 | % | |||||||||||||
| Harvest Investment LLC(6) |
681 | 0.0 | % | 201,852 | 0.6 | % | 0.3 | % | ||||||||||||
| Harvest Investment II LLC(7) |
137,563 | 0.4 | % | — | — | 0.2 | % | |||||||||||||
| Named Executive Officers, Directors and Director Nominees: |
||||||||||||||||||||
| Eric D. Marsh |
— | — | — | — | — | |||||||||||||||
| Wayne B. Stoltenberg |
— | — | — | — | — | |||||||||||||||
| David M. Elkin |
— | — | — | — | — | |||||||||||||||
| Angelo G. Acconcia(8) |
— | — | — | — | — | |||||||||||||||
| Murat T. Konuk(9) |
— | — | — | — | — | |||||||||||||||
| Charles M. Sledge |
— | — | — | — | — | |||||||||||||||
| H. Paulett Eberhart |
— | — | — | — | — | |||||||||||||||
| David I. Foley(10) |
— | — | — | — | — | |||||||||||||||
| Executive Officers, Directors and Director Nominees as a Group (8 persons) |
— | — | — | — | — | |||||||||||||||
| * | Less than 1%. |
135
Table of Contents
| (1) | Certain members of management will have ownership interests in the Vine Investment Vehicles and the Vine Investment II Vehicles, and, as a result, will have an indirect interest in the shares of common stock owned by the Vine Investment Vehicles and the Vine Investment II Vehicles. See “Corporate Reorganization—Simplified Ownership Structure After Giving Effect to this Offering,” which shows management’s expected aggregate economic interest in the Vine Investment Vehicles and Vine Investment II Vehicles at the closing of this offering. |
| (2) | Vine Investment LLC is owned by Vine Oil & Gas Holdings LLC (“Holdings”) and Vintner Resources, LLC, which is controlled by Eric D. Marsh, our Chief Executive Officer, and certain members of management. Certain members of our management team and certain of our employees also own incentive units in Vine Investment. “Executive Compensation—Outstanding Equity Awards at 2016 Fiscal Year-End” contains additional information on the incentive units. Holdings is owned by Blackstone Capital Partners VI-Q L.P. (“BCP VI-Q”), Blackstone Energy Partners Q L.P. (“BEP Q”), Blackstone Family Investment Partnership VI-ESC L.P. (“BFIP VI”), Blackstone Energy Family Investment Partnership ESC L.P. (“BEFIP ESC”) and Blackstone Energy Family Investment Partnership SMD L.P. (“BEFIP SMD”). The general partner of BCP VI-Q is Blackstone Management Associates VI L.L.C. The sole member of Blackstone Management Associates VI L.L.C. is BMA VI L.L.C. The general partner of BEP Q is Blackstone Energy Management Associates L.L.C. The sole member of Blackstone Energy Management Associates L.L.C. is Blackstone EMA L.L.C. The general partner of BFIP VI is BCP VI Side-by-Side GP L.L.C. The general partner of BEFIP ESC is BEP Side-by-Side GP L.L.C. The general partner of BEFIP SMD is Blackstone Family GP L.L.C., which is in turn wholly-owned by Blackstone’s senior managing directors and controlled by its founder, Stephen A. Schwarzman. Blackstone Holdings III L.P. is the managing member of each of BMA VI L.L.C. and Blackstone EMA L.L.C. and the sole member of each of BCP VI Side-by-Side GP L.L.C. and BEP Side-by-Side GP L.L.C. The general partner of Blackstone Holdings III L.P. is Blackstone Holdings III GP L.P. The general partner of Blackstone Holdings III GP L.P. is Blackstone Holdings III GP Management L.L.C. The sole member of Blackstone Holdings III GP Management L.L.C. is The Blackstone Group Inc. The sole holder of the Class C common stock of The Blackstone Group Inc. is Blackstone Group Management L.L.C. Blackstone Group Management L.L.C. is wholly-owned by Blackstone’s senior managing directors and controlled by its founder, Stephen A. Schwarzman. Each of the Blackstone entities described in this footnote and Stephen A. Schwarzman may be deemed to beneficially own the shares directly or indirectly controlled by such Blackstone entities or him, but each disclaims beneficial ownership of such shares. The address of each of the foregoing entities is 345 Park Avenue, 31st Floor, New York, New York 10154, provided that the address for Vintner Resources is 5800 Granite Parkway, Suite 550, Plano, Texas 75024. |
| (3) | Vine Investment II LLC will be owned by an alternative investment vehicle of BCP VI-Q (“BCP VI AIV”), an alternative vehicle of BEP Q (“BEP AIV”) and Vintner Resources, LLC, which is controlled by Eric D. Marsh, our Chief Executive Officer, and certain members of management. The general partner of BEP AIV will be Blackstone Energy Management Associates L.L.C. The sole member of Blackstone Energy Management Associates L.L.C. is Blackstone EMA L.L.C. The general partner of BCP VI AIV will be Blackstone Management Associates VI L.L.C. The sole member of Blackstone Management Associates VI L.L.C. is BMA VI L.L.C. Blackstone Holdings III L.P. is the managing member of each of BMA VI L.L.C. and Blackstone EMA L.L.C. The general partner of Blackstone Holdings III L.P. is Blackstone Holdings III GP L.P. The general partner of Blackstone Holdings III GP L.P. is Blackstone Holdings III GP Management L.L.C. The sole member of Blackstone Holdings III GP Management L.L.C. is The Blackstone Group Inc. The sole holder of the Class C common stock of The Blackstone Group Inc. is Blackstone Group Management L.L.C. Blackstone Group Management L.L.C. is wholly-owned by Blackstone’s senior managing directors and controlled by its founder, Stephen A. Schwarzman. Each of the Blackstone entities described in this footnote and Stephen A. Schwarzman may be deemed to beneficially own the shares directly or indirectly controlled by such Blackstone entities or him, but each disclaims beneficial ownership of such shares. The address of each of the foregoing entities is 345 Park Avenue, 31st Floor, New York, New York 10154 provided that the address for Vintner Resources is 5800 Granite Parkway, Suite 550, Plano, Texas 75024. |
136
Table of Contents
| (4) | Brix Investment LLC is owned by B&H Oil and Gas L.L.C (“B&H Oil & Gas”). B&H Oil and Gas is owned by BCP VI-Q, BFIP VI, BCP VI SBS Holdings L.L.C. (“BCP VI SBS Holdings”), Blackstone Energy Partners II Q L.P. (“BEP II Q”), Blackstone Energy Partners II.F Q L.P. (“BEP II.F Q”), Blackstone Energy Family Investment Partnership II-ESC L.P. (“BEFIP II-ESC”), Blackstone Energy Family Investment Partnership II SMD L.P. (“BEFIP II SMD”), BEP II SBS Holdings L.L.C. (“BEP II SBS Holdings”) and BTAS Q Holdings L.L.C. (“BTAS Q Holdings”). The general partner of BCP VI-Q is Blackstone Management Associates VI L.L.C. The sole member of Blackstone Management Associates VI L.L.C. is BMA VI L.L.C. The general partner of BFIP VI is BCP VI Side-by-Side GP L.L.C. The general partner of each of BEP II Q and BEP II.F Q is Blackstone Energy Management Associates II L.L.C. The sole member of Blackstone Energy Management Associates II L.L.C. is Blackstone EMA II L.L.C. The general partner of BEFIP II-ESC is BEP II Side-by-Side GP L.L.C. The general partner of BEFIP II SMD is Blackstone Family GP L.L.C., which is in turn wholly-owned by Blackstone’s senior managing directors and controlled by its founder, Stephen A. Schwarzman. The general partner of each of BEP II SBS Holdings and BCP VI SBS Holdings is Blackstone Side-by-Side Umbrella Partnership L.P. The general partner of Blackstone Side-by-Side Umbrella Partnership L.P. is Blackstone Side-by-Side Umbrella GP L.L.C. The managing member of BTAS Q Holdings is BTAS Associates L.L.C. Blackstone Holdings III L.P. is the managing member of each of BMA VI L.L.C., Blackstone EMA II L.L.C. and BTAS Associates L.L.C. and the sole member of each of BCP VI Side-by-Side GP L.L.C., BEP II Side-by-Side GP L.L.C. and Blackstone Side-by-Side Umbrella GP L.L.C. The general partner of Blackstone Holdings III L.P. is Blackstone Holdings III GP L.P. The general partner of Blackstone Holdings III GP L.P. is Blackstone Holdings III GP Management L.L.C. The sole member of Blackstone Holdings III GP Management L.L.C. is The Blackstone Group Inc. The sole holder of the Class C common stock of The Blackstone Group Inc. is Blackstone Group Management L.L.C. Blackstone Group Management L.L.C. is wholly-owned by Blackstone’s senior managing directors and controlled by its founder, Stephen A. Schwarzman. Each of the Blackstone entities described in this footnote and Stephen A. Schwarzman may be deemed to beneficially own the shares directly or indirectly controlled by such Blackstone entities or him, but each disclaims beneficial ownership of such shares. The address of each of the foregoing entities is 345 Park Avenue, 31st Floor, New York, New York 10154. |
| (5) | Brix Investment II LLC will be owned by an alternative investment vehicle of BEP II Q (“BEP II AIV”), an alternative investment vehicle of BEP II.F Q (“BEP II.F AIV”) and BCP VI AIV. The general partner of BCP VI AIV will be Blackstone Management Associates VI L.L.C. The sole member of Blackstone Management Associates VI L.L.C. is BMA VI L.L.C. The general partner of each of BEP II AIV and BEP II.F AIV will be Blackstone Energy Management Associates II L.L.C. The sole member of Blackstone Energy Management Associates II L.L.C. is Blackstone EMA II L.L.C. Blackstone Holdings III L.P. is the managing member of each of BMA VI L.L.C. and Blackstone EMA II L.L.C. The general partner of Blackstone Holdings III L.P. is Blackstone Holdings III GP L.P. The general partner of Blackstone Holdings III GP L.P. is Blackstone Holdings III GP Management L.L.C. The sole member of Blackstone Holdings III GP Management L.L.C. is The Blackstone Group Inc. The sole holder of the Class C common stock of The Blackstone Group Inc. is Blackstone Group Management L.L.C. Blackstone Group Management L.L.C. is wholly-owned by Blackstone’s senior managing directors and controlled by its founder, Stephen A. Schwarzman. Each of the Blackstone entities described in this footnote and Stephen A. Schwarzman may be deemed to beneficially own the shares directly or indirectly controlled by such Blackstone entities or him, but each disclaims beneficial ownership of such shares. The address of each of the foregoing entities is 345 Park Avenue, 31st Floor, New York, New York 10154. |
| (6) | Harvest Investment LLC is owned by B&H Oil and Gas L.L.C (“B&H Oil & Gas”). B&H Oil and Gas is owned by BCP VI-Q, BFIP VI, BCP VI SBS Holdings L.L.C. (“BCP VI SBS Holdings”), Blackstone Energy Partners II Q L.P. (“BEP II Q”), Blackstone Energy Partners II.F Q L.P. (“BEP II.F Q”), Blackstone Energy Family Investment Partnership II-ESC L.P. (“BEFIP II-ESC”), Blackstone Energy Family Investment Partnership II SMD L.P. (“BEFIP II SMD”), BEP II SBS Holdings L.L.C. (“BEP II SBS Holdings”) and BTAS Q Holdings L.L.C. (“BTAS Q Holdings”). The general partner of BCP VI-Q is Blackstone Management Associates VI L.L.C. The sole member of Blackstone Management Associates VI L.L.C. is BMA VI L.L.C. The general partner of BFIP VI is BCP VI Side-by-Side GP L.L.C. The general |
137
Table of Contents
| partner of each of BEP II Q and BEP II.F Q is Blackstone Energy Management Associates II L.L.C. The sole member of Blackstone Energy Management Associates II L.L.C. is Blackstone EMA II L.L.C. The general partner of BEFIP II-ESC is BEP II Side-by-Side GP L.L.C. The general partner of BEFIP II SMD is Blackstone Family GP L.L.C., which is in turn wholly-owned by Blackstone’s senior managing directors and controlled by its founder, Stephen A. Schwarzman. The general partner of each of BEP II SBS Holdings and BCP VI SBS Holdings is Blackstone Side-by-Side Umbrella Partnership L.P. The general partner of Blackstone Side-by-Side Umbrella Partnership L.P. is Blackstone Side-by-Side Umbrella GP L.L.C. The managing member of BTAS Q Holdings is BTAS Associates L.L.C. Blackstone Holdings III L.P. is the managing member of each of BMA VI L.L.C., Blackstone EMA II L.L.C. and BTAS Associates L.L.C. and the sole member of each of BCP VI Side-by-Side GP L.L.C., BEP II Side-by-Side GP L.L.C. and Blackstone Side-by-Side Umbrella GP L.L.C. The general partner of Blackstone Holdings III L.P. is Blackstone Holdings III GP L.P. The general partner of Blackstone Holdings III GP L.P. is Blackstone Holdings III GP Management L.L.C. The sole member of Blackstone Holdings III GP Management L.L.C. is The Blackstone Group Inc. The sole holder of the Class C common stock of The Blackstone Group Inc. is Blackstone Group Management L.L.C. Blackstone Group Management L.L.C. is wholly-owned by Blackstone’s senior managing directors and controlled by its founder, Stephen A. Schwarzman. Each of the Blackstone entities described in this footnote and Stephen A. Schwarzman may be deemed to beneficially own the shares directly or indirectly controlled by such Blackstone entities or him, but each disclaims beneficial ownership of such shares. The address of each of the foregoing entities is 345 Park Avenue, 31st Floor, New York, New York 10154. |
| (7) | Harvest Investment II LLC will be owned by an alternative investment vehicle of BEP II Q (“BEP II AIV”), an alternative investment vehicle of BEP II.F Q (“BEP II.F AIV”) and BCP VI AIV. The general partner of BCP VI AIV will be Blackstone Management Associates VI L.L.C. The sole member of Blackstone Management Associates VI L.L.C. is BMA VI L.L.C. The general partner of each of BEP II AIV and BEP II.F AIV will be Blackstone Energy Management Associates II L.L.C. The sole member of Blackstone Energy Management Associates II L.L.C. is Blackstone EMA II L.L.C. Blackstone Holdings III L.P. is the managing member of each of BMA VI L.L.C. and Blackstone EMA II L.L.C. The general partner of Blackstone Holdings III L.P. is Blackstone Holdings III GP L.P. The general partner of Blackstone Holdings III GP L.P. is Blackstone Holdings III GP Management L.L.C. The sole member of Blackstone Holdings III GP Management L.L.C. is The Blackstone Group Inc. The sole holder of the Class C common stock of The Blackstone Group Inc. is Blackstone Group Management L.L.C. Blackstone Group Management L.L.C. is wholly-owned by Blackstone’s senior managing directors and controlled by its founder, Stephen A. Schwarzman. Each of the Blackstone entities described in this footnote and Stephen A. Schwarzman may be deemed to beneficially own the shares directly or indirectly controlled by such Blackstone entities or him, but each disclaims beneficial ownership of such shares. The address of each of the foregoing entities is 345 Park Avenue, 31st Floor, New York, New York 10154. |
| (8) | Mr. Acconcia is an employee of Blackstone, but he disclaims beneficial ownership of the shares beneficially owned by Blackstone. The address for Mr. Acconcia is c/o The Blackstone Group Inc., 345 Park Avenue, 31st Floor, New York, New York 10154. |
| (9) | Mr. Konuk is an employee of Blackstone, but he disclaims beneficial ownership of the shares beneficially owned by Blackstone. The address for Mr. Konuk is c/o The Blackstone Group Inc., 345 Park Avenue, 31st Floor, New York, New York 10154. |
| (10) | Mr. Foley is an employee of Blackstone, but he disclaims beneficial ownership of the shares beneficially owned by Blackstone. The address for Mr. Foley is c/o The Blackstone Group Inc., 345 Park Avenue, 31st Floor, New York, New York 10154. |
138
Table of Contents
Vine Energy is a Delaware corporation that was formed for the purpose of making this offering. Following this offering and the transactions related thereto, Vine Energy will be a holding company whose sole material asset will consist of membership interests in Vine Holdings. Vine Holdings will own all of the outstanding limited partnership interests in each of Vine Oil & Gas, Brix and Harvest, the operating subsidiaries through which we operate our assets, and all of the outstanding equity in each of Vine Oil & Gas GP, Brix GP and Harvest GP, the general partners of Vine Oil & Gas, Brix and Harvest, respectively. After the consummation of the transactions contemplated by this prospectus, Vine Energy will be the managing member of Vine Holdings and will control and be responsible for all operational, management and administrative decisions relating to Vine Holdings business and will consolidate the financial results of Vine Holdings and its subsidiaries.
In connection with this offering, (a) the Existing Owners who directly hold equity interests in Vine Oil & Gas, Vine Oil & Gas GP, Brix, Brix GP, Harvest and Harvest GP will contribute such equity interests to Vine Holdings in exchange for newly issued equity in Vine Holdings (the “LLC Interests”), (b) certain of the Existing Owners will contribute a portion of their LLC Interests directly, or indirectly by contribution of Blocker Entities holding LLC Interests, to Vine Energy in exchange for newly issued Class A common stock and will contribute such Class A common stock received to Vine Investment II, Brix Investment II, Harvest Investment II, Vine Investment, Brix Investment or Harvest Investment, as applicable, (c) certain of the Existing Owners will exchange the remaining portion of their LLC Interests for newly issued Vine Units and subscribe for newly issued Class B common stock of Vine Energy with no economic rights or value and will contribute such Vine Units and Class B common stock to Vine Investment, Brix Investment and Harvest Investment, as applicable, and (d) Vine Energy will contribute the net proceeds of this offering to Vine Holdings in exchange for newly issued Vine Units and a managing member interest in Vine Holdings. After giving effect to these transactions and the offering contemplated by this prospectus, (i) Vine Energy will own an approximate 50.5% interest in Vine Holdings (or 52.4% if the underwriters’ option to purchase additional shares is exercised in full), (ii) Vine Investment will own an approximate 25.2% interest in Vine Holdings and 0.1% interest in Vine Energy (or 24.2% or 0.1% if the underwriters’ option to purchase additional shares is exercised in full), (iii) Brix Investment will own an approximate 24.0% interest in Vine Holdings and 0.1% interest in Vine Energy (or 23.1% or 0.1% if the underwriters’ option to purchase additional shares is exercised in full), (iv) Harvest Investment will own an approximate 0.3% interest in Vine Holdings and less than 0.1% interest in Vine Energy (or 0.3% or less than 0.1% if the underwriters’ option to purchase additional shares is exercised in full), (v) Vine Investment II will own an approximate 13.7% interest in Vine Energy (or 13.1% if the underwriters’ option to purchase additional shares is exercised in full), (vi) Brix Investment II will own an approximate 9.4% interest in Vine Energy (or 9.1% if the underwriters’ option to purchase additional shares is exercised in full), and (vii) Harvest Investment II will own an approximate 0.2% interest in Vine Energy (or 0.2% if the underwriters’ option to purchase additional shares is exercised in full).
Each share of Class B common stock will entitle its holder to one vote on all matters to be voted on by shareholders. Holders of Class A common stock and Class B common stock will vote together as a single class on all matters presented to our shareholders for their vote or approval, except as otherwise required by applicable law or by our certificate of incorporation. We do not intend to list Class B common stock on any stock exchange.
We will enter into a Tax Receivable Agreement with Vine Investment, Brix Investment, Harvest Investment, Vine Investment II, Brix Investment II and Harvest Investment II. This agreement generally provides for the payment by Vine Energy to Vine Investment, Brix Investment, Harvest Investment, Vine Investment II, Brix Investment II and Harvest Investment II, respectively, of 85% of the net cash savings, if any, in U.S. federal, state and local income tax that Vine Energy (a) actually realizes with respect to taxable periods ending after December 31, 2025 or (b) is deemed to realize in the event of a change of control (as defined under the Tax Receivable Agreement, which includes certain mergers, asset sales and other forms of business combinations and certain changes to the composition of the Vine Energy board) or the Tax Receivable Agreement terminates early (at our election or as a result of our breach) with respect to any taxable periods ending on or after such change of
139
Table of Contents
control or early termination event, in each case, as a result of (i) the tax basis increases resulting from the exchange of Vine Units and the corresponding surrender of an equivalent number of shares of Class B common stock by Vine Investment, Brix Investment and Harvest Investment, respectively, for a number of shares of Class A common stock on a one-for-one basis or, at our option, the receipt of an equivalent amount of cash pursuant to the exchange agreement, (ii) certain existing net operating loss carryforwards, disallowed interest expense carryforwards under Section 163(j) of the Code, and tax credit carryforwards attributable to the Blocker Entities previously owned by certain of the Existing Owners, and (iii) imputed interest deemed to be paid by us as a result of, and additional tax basis arising from, any payments we make under the Tax Receivable Agreement. Vine Energy will retain the benefit of the remaining 15% of these cash savings, if any. If we experience a change of control or the Tax Receivable Agreement terminates early, we could be required to make a substantial, immediate lump-sum payment. “Certain Relationships and Related Party Transactions—Tax Receivable Agreement” contains more information.
The following diagrams indicate our simplified current ownership structure and our simplified ownership structure immediately following this offering and the transactions related thereto (assuming that the underwriters’ option to purchase additional shares is not exercised):
Simplified Current Ownership Structure
| (1) | Blackstone owns 99.3% of Vine Oil & Gas GP, 97.0% of Brix GP and 94.2% of Harvest GP. Blackstone holds its ownership in Vine Oil & Gas through funds separate from the funds in which it holds its ownership in Brix and Harvest, which are not consolidated by a common parent. Therefore, Vine Oil & Gas is not considered under common control with Brix GP and Harvest GP for financial reporting purposes. |
| (2) | Certain Management Members own 0.7% of Vine Oil & Gas GP, 3.0% of Brix GP and 5.8% of Harvest GP. |
140
Table of Contents
Simplified Ownership Structure After Giving Effect to this Offering
| (1) | Includes Vine Investment, Brix Investment and Harvest Investment. |
| (2) | Includes Vine Investment II, Brix Investment II and Harvest Investment II. |
| (3) | Vine Holdings owns 100% of Brix GP, Harvest GP and Vine Oil & Gas GP. Brix GP is the general partner of Brix, Harvest GP is the general partner of Harvest and Vine Oil & Gas GP is the general partner of Vine Oil & Gas. |
Offering
Only Class A common stock will be sold to investors pursuant to this offering. Immediately following this offering, there will be 34,995,149 shares of Class A common stock issued and outstanding and 34,289,108 shares of Class A common stock reserved for exchanges of Vine Units and shares of Class B common stock pursuant to the VEH LLC Agreement. We estimate that our net proceeds from this offering, after deducting estimated underwriting discounts and commissions and other offering related expenses, will be approximately $303.3 million. We intend to contribute all of the net proceeds of this offering to Vine Holdings in exchange for Vine Units. Vine Holdings will use approximately $303.3 million to repay our indebtedness. “Use of Proceeds” contains more information.
141
Table of Contents
As a result of the corporate reorganization and the offering described above (and prior to any exchanges of Vine Units):
| • | the investors in this offering will collectively own 18,750,000 shares of Class A common stock (or 21,562,500 shares of Class A common stock if the underwriters exercise in full their option to purchase additional shares of Class A common stock); |
| • | Vine Investment will hold 57,143 shares of Class A common stock, 17,437,592 shares of Class B common stock and a corresponding number of Vine Units; |
| • | Brix Investment will hold 56,462 shares of Class A common stock, 16,649,664 shares of Class B common stock and a corresponding number of Vine Units; |
| • | Harvest Investment will hold 681 shares of Class A common stock, 201,852 shares of Class B common stock and a corresponding number of Vine Units; |
| • | Vine Investment II will hold 9,467,767 shares of Class A common stock; |
| • | Brix Investment II will hold 6,525,534 shares of Class A common stock; |
| • | Harvest Investment II will hold 137,563 shares of Class A common stock; |
| • | the investors in this offering will collectively hold 27.0% of the voting power in us; and |
| • | assuming no exercise of the underwriters’ option to purchase additional shares, (i) Vine Investment will hold 25.3% of the voting power in us (or 24.3% if the underwriters exercise in full their option to purchase additional shares of Class A common stock), (ii) Brix Investment will hold 24.1% of the voting power in us (or 23.2% if the underwriters exercise in full their option to purchase additional shares of Class A common stock), (iii) Harvest Investment will hold 0.3% of the voting power in us (or 0.3% if the underwriters exercise in full their option to purchase additional shares of Class A common stock), (iv) Vine Investment II will hold 13.7% of the voting power in us (or 13.1% if the underwriters exercise in full their option to purchase additional shares of Class A common stock), (v) Brix Investment II will hold 9.4% of the voting power in us (or 9.1% if the underwriters exercise in full their option to purchase additional shares of Class A common stock), and (vi) Harvest Investment II will hold 0.2% of the voting power in us (or 0.2% if the underwriters exercise in full their option to purchase additional shares of Class A common stock). |
Holding Company Structure
Our post-offering organizational structure will allow the Vine Unit Holders to retain their equity ownership in Vine Holdings, a partnership for U.S. federal income tax purposes. Investors in this offering will, by contrast, hold their equity ownership in the form of shares of Class A common stock in us, and we are classified as a corporation for U.S. federal income tax purposes. The holders of Vine Units will generally incur U.S. federal, state and local income taxes on their proportionate share of any taxable income of Vine Holdings.
In addition, pursuant to our certificate of incorporation and the VEH LLC Agreement, our capital structure and the capital structure of Vine Holdings will generally replicate one another and will provide for customary antidilution mechanisms in order to maintain the one-for-one exchange ratio between the Vine Units (and a corresponding number of shares of Class B common stock) and our Class A common stock, among other things.
We and the Vine Unit Holders will generally incur U.S. federal, state and local income taxes on our proportionate share of any taxable income of Vine Holdings and will be allocated our proportionate share of any taxable loss of Vine Holdings. The VEH LLC Agreement will provide, to the extent cash is available, for distributions pro rata to us and the Vine Unit Holders in an amount at least sufficient to allow us to pay our taxes and make payments under the Tax Receivable Agreement.
142
Table of Contents
We do not expect to declare or pay cash dividends to holders of our Class A common stock for the foreseeable future. However, to the extent our free cash flow generation results in a decrease in our overall leverage in the future, we may revisit our dividend policy.
We will enter into a Tax Receivable Agreement with Vine Investment, Brix Investment, Harvest Investment, Vine Investment II, Brix Investment II and Harvest Investment II. This agreement generally provides for the payment by Vine Energy to Vine Investment, Brix Investment, Harvest Investment, Vine Investment II, Brix Investment II and Harvest Investment II, respectively, of 85% of the net cash savings, if any, in U.S. federal, state and local income tax that Vine Energy (a) actually realizes with respect to taxable periods ending after December 31, 2025 or (b) is deemed to realize in the event of a change of control (as defined under the Tax Receivable Agreement, which includes certain mergers, asset sales and other forms of business combinations and certain changes to the composition of the Vine Energy board) or the Tax Receivable Agreement terminates early (at our election or as a result of our breach) with respect to any taxable periods ending on or after such change of control or early termination event, in each case, as a result of (i) the tax basis increases resulting from the exchange of Vine Units and the corresponding surrender of an equivalent number of shares of Class B common stock by Vine Investment, Brix Investment and Harvest Investment, respectively, for a number of shares of Class A common stock on a one-for-one basis or, at our option, the receipt of an equivalent amount of cash pursuant to the exchange agreement, (ii) certain existing net operating loss carryforwards, disallowed interest expense carryforwards under Section 163(j) of the Code, and tax credit carryforwards attributable to the Blocker Entities previously owned by certain of the Existing Owners, and (iii) imputed interest deemed to be paid by us as a result of, and additional tax basis arising from, any payments we make under the Tax Receivable Agreement. Vine Energy will retain the benefit of the remaining 15% of these cash savings, if any. If we experience a change of control or the Tax Receivable Agreement terminates early, we could be required to make a substantial, immediate lump-sum payment. “Certain Relationships and Related Party Transactions—Tax Receivable Agreement” contains more information.
143
Table of Contents
CERTAIN RELATIONSHIPS AND RELATED PARTY TRANSACTIONS
Corporate Reorganization
In connection with our corporate reorganization, we will engage in transactions with certain affiliates and our existing equity holders. “Corporate Reorganization” contains a description of these transactions.
VEH LLC Agreement
Under the VEH LLC Agreement, we will have the right to determine when distributions will be made to us and the Vine Unit Holders and the amount of any such distributions. Following this offering, if we authorize a distribution, such distribution will be made to the Vine Unit Holders and us on a pro rata basis in accordance with our respective percentage ownership of Vine Units.
We and the Vine Unit Holders will generally incur U.S. federal, state and local income taxes on our proportionate share of any taxable income of Vine Holdings and will be allocated our proportionate share of any taxable loss of Vine Holdings. Net profits and net losses of Vine Holdings generally will be allocated to us and the Vine Unit Holders on a pro rata basis in accordance with our respective percentage ownership of Vine Units, except that certain non-pro rata adjustments will be required to be made to reflect built-in gains and losses and tax depreciation, depletion and amortization with respect to such built-in gains and losses. The VEH LLC Agreement will provide, to the extent cash is available, for pro rata tax distributions to us and the Vine Unit Holders in an amount at least sufficient to allow us to pay our taxes and make payments under the Tax Receivable Agreement.
The VEH LLC Agreement will provide that, except as otherwise determined by us, at any time we issue a share of our Class A common stock or any other equity security other than pursuant to an incentive plan, the net proceeds received by us with respect to such issuance, if any, shall be concurrently contributed to Vine Holdings, and Vine Holdings shall issue to us one Vine Unit or other economically equivalent equity interest. Conversely, if at any time, any shares of our Class A common stock are redeemed, repurchased or otherwise acquired, Vine Holdings shall redeem, repurchase or otherwise acquire an equal number of Vine Units held by us, upon the same terms and for the same price, as the shares of our Class A common stock are redeemed, repurchased or otherwise acquired.
Under the VEH LLC Agreement, the members have agreed that Blackstone and/or one or more of its affiliates will be permitted to engage in business activities or invest in or acquire businesses which may compete with our business or do business with any client of ours.
Vine Holdings will be dissolved only upon the first to occur of (i) the sale of substantially all of its assets, (ii) approval of its dissolution by the managing member, and a vote in favor of dissolution by at least two-thirds of the holders of its Class B units or (iii) entry of a judicial order to dissolve the company. Upon dissolution, Vine Holdings will be liquidated and the proceeds from any liquidation will be applied and distributed in the following manner: (a) first, to creditors (including to the extent permitted by law, creditors who are members) in satisfaction of the liabilities of Vine Holdings, (b) second, to establish cash reserves for contingent or unforeseen liabilities and (c) third, to the members in proportion to the number of Vine Units owned by each of them.
Exchange Agreement
We will enter into an exchange agreement with Vine Investment, Brix Investment, Harvest Investment and Vine Holdings pursuant to which each Vine Unit Holder signatory thereto (and certain permitted transferees thereof) may, subject to the terms of the exchange agreement, exchange their Vine Units, along with a corresponding number of our Class B common stock, for shares of Class A common stock on a one-for-one basis, subject to customary conversion rate adjustments for stock splits, stock dividends and reclassifications. At
144
Table of Contents
our election we may give the exchanging Vine Unit Holders cash in an amount equal to the value of such Class A common stock instead of shares of Class A common stock. The exchange agreement also provides that Vine Unit Holders will not have the right to exchange Vine Units if Vine Energy determines that such exchange would be prohibited by law or regulation or would violate other agreements with Vine Energy or its subsidiaries to which such holder may be subject. Vine Energy may impose additional restrictions on any exchange that it determines to be necessary or advisable so that Vine Holdings is not treated as a “publicly traded partnership” for U.S. federal income tax purposes. As a holder exchanges Vine Units, along with a corresponding number of shares of Class B common stock, for shares of Class A common stock, the number of Vine Units held by Vine Energy is correspondingly increased as it acquires the exchanged Vine Units. In accordance with the exchange agreement, any holder who surrenders all of its Vine Units for exchange must concurrently surrender all shares of Class B common stock held by it (including fractions thereof) to Vine Energy.
Tax Receivable Agreement
As described in “—Exchange Agreement” above, the Vine Unit Holders (and their permitted transferees) may exchange their Vine Units, along with a corresponding number of shares of Class B common stock, for shares of Class A common stock on a one-for-one basis, subject to conversion rate adjustments for stock splits, stock dividends and reclassification and other similar transactions or, at our election, an equivalent amount of cash. Vine Holdings intends to make an election under Section 754 of the Code that will be effective for the taxable year that includes this offering and each taxable year in which an exchange of Vine Units, along with a corresponding number of our Class B common stock, for, on a one-for-one basis, shares of Class A common stock or, at our election, an equivalent amount of cash pursuant to the Exchange Right occurs.
Pursuant to the Section 754 election, each future exchange of Vine Units, along with a corresponding number of our Class B common stock, for Class A common stock (as well as any exchange of Vine Units, along with a corresponding number of our Class B common stock, for cash) is expected to result in increases in the tax basis of the tangible and intangible assets of Vine Holdings, and these adjustments will be allocated to us. Adjustments to the tax basis of the tangible and intangible assets of Vine Holdings described above would not have been available absent these exchanges of Vine Units, along with a corresponding number of our Class B common stock. The anticipated basis adjustments are expected to increase (for tax purposes) our depreciation, depletion and amortization deductions and may also decrease our gains (or increase our losses) on future dispositions of certain capital assets to the extent tax basis is allocated to those capital assets In addition, we have acquired certain tax attributes attributable to the Blocker Entities previously owned by certain of the Existing Owners. Such increased deductions and losses and reduced gains, as well as such tax attributes, may reduce the amount of tax that we would otherwise be required to pay in the future.
Prior to the completion of this offering, we will enter into a Tax Receivable Agreement with Vine Investment, Brix Investment, Harvest Investment, Vine Investment II, Brix Investment II and Harvest Investment II. This agreement generally provides for the payment by Vine Energy to Vine Investment, Brix Investment, Harvest Investment, Vine Investment II, Brix Investment II and Harvest Investment II, respectively, of 85% of the net cash savings, if any, in U.S. federal, state and local income tax that Vine Energy (a) actually realizes with respect to taxable periods ending after December 31, 2025 or (b) is deemed to realize in the event of a change of control (as defined under the Tax Receivable Agreement, which includes certain mergers, asset sales and other forms of business combinations and certain changes to the composition of the Vine Energy board) or the Tax Receivable Agreement terminates early (at our election or as a result of our breach) with respect to any taxable periods ending on or after such change of control or early termination event, in each case, as a result of (i) the tax basis increases resulting from the exchange of Vine Units and the corresponding surrender of an equivalent number of shares of Class B common stock by Vine Investment, Brix Investment and Harvest Investment, respectively, for a number of shares of Class A common stock on a one-for-one basis or, at our option, the receipt of an equivalent amount of cash pursuant to the exchange agreement, (ii) certain existing net operating loss carryforwards, disallowed interest expense carryforwards under Section 163(j) of the Code, and tax credit carryforwards attributable to the Blocker Entities previously owned by certain of the Existing Owners, and
145
Table of Contents
(iii) imputed interest deemed to be paid by us as a result of, and additional tax basis arising from, any payments we make under the Tax Receivable Agreement. Vine Energy will retain the benefit of the remaining 15% of these cash savings, if any. If we experience a change of control or the Tax Receivable Agreement terminates early, we could be required to make a substantial, immediate lump-sum payment.
The payment obligations under the Tax Receivable Agreement are our obligations and not obligations of Vine Holdings, and we expect that the payments we will make under the Tax Receivable Agreement will be substantial. For purposes of the Tax Receivable Agreement, cash savings in tax generally will be calculated by comparing our actual tax liability to the amount we would have been required to pay had we not been able to utilize any of the tax benefits subject to the Tax Receivable Agreement. The amounts payable, as well as the timing of any payments, under the Tax Receivable Agreement are dependent upon future events and assumptions, including the timing of the exchanges of Vine Units, along with a corresponding number of our Class B common stock, the price of our Class A common stock at the time of each exchange, the extent to which such exchanges are taxable transactions, the amount of the exchanging Vine Unit Holder’s tax basis in its Vine Units at the time of the relevant exchange, the depreciation, depletion and amortization periods that apply to the increase in tax basis, the amount and timing of taxable income we generate in the future, the U.S. federal income tax rate then applicable, and the portion of Vine Energy’s payments under the Tax Receivable Agreement that constitute imputed interest or give rise to depreciable, depletable or amortizable tax basis. The term of the Tax Receivable Agreement will commence upon the completion of this offering and will continue until all such tax benefits have been utilized or have expired, and all required payments have been made, unless the Tax Receivable Agreement is terminated early (including upon a change of control or if we exercise our right to terminate the Tax Receivable Agreement). In the event that the Tax Receivable Agreement is not terminated, the payments under the Tax Receivable Agreement are anticipated to commence until 2028 at the earliest (with respect to the tax year 2026).
Estimating the amount of payments that may be made under the Tax Receivable Agreement is by its nature imprecise, insofar as the calculation of amounts payable depends on a variety of factors. The actual increase in tax basis, as well as the amount and timing of any payments under the Tax Receivable Agreement, will vary depending upon a number of factors, including the timing of the exchanges, the price of Class A common stock at the time of each exchange, the extent to which such exchanges are taxable, the amount and timing of the taxable income we generate in the future and the tax rate then applicable, and the portion of our payments under the Tax Receivable Agreement constituting imputed interest or depreciable, depletable or amortizable tax basis. We expect that the payments that we will be required to make under the Tax Receivable Agreement could be substantial.
Assuming no material changes in the relevant tax law, we expect that if we experienced a change of control or the Tax Receivable Agreement were terminated immediately after this offering, the estimated lump-sum payment would be approximately $211 million (calculated using a discount rate equal to a per annum rate of LIBOR plus 100 basis points, applied against an undiscounted liability of approximately $244 million). The foregoing amounts are merely estimates and the actual payments could differ materially. It is possible that future transactions or events could increase or decrease the actual tax benefits realized and the corresponding Tax Receivable Agreement payments as compared to these estimates. Moreover, there may be a negative impact on our liquidity if, as a result of timing discrepancies or otherwise, (i) the payments under the Tax Receivable Agreement exceed the actual benefits we realize in respect of the tax attributes subject to the Tax Receivable Agreement and/or (ii) distributions to us by Vine Holdings are not sufficient to permit us to make payments under the Tax Receivable Agreement after we have paid our taxes and other obligations. The payments under the Tax Receivable Agreement will not be conditioned upon a holder of rights under the Tax Receivable Agreement having a continued ownership interest in either Vine Holdings or us.
In addition, although we are not aware of any issue that would cause the Internal Revenue Service (“IRS”) to challenge potential tax basis increases or other tax benefits covered under the Tax Receivable Agreement, the holders of rights under the Tax Receivable Agreement will not reimburse us for any payments previously made
146
Table of Contents
under the Tax Receivable Agreement if such basis increases or other benefits are subsequently disallowed, except that excess payments made to any such holder will be netted against payments otherwise to be made, if any, to such holder after our determination of such excess. As a result, in such circumstances, we could make payments that are greater than our actual cash tax savings, if any, and may not be able to recoup those payments, which could adversely affect our liquidity.
The Tax Receivable Agreement will provide that in the event that we breach any of our material obligations under it, whether as a result of our failure to make any payment when due (including in cases where we elect to terminate the Tax Receivable Agreement early, the Tax Receivable Agreement is terminated early due to certain mergers or other changes of control or we have available cash but fail to make payments when due under circumstances where we do not have the right to elect to defer the payment, as described below), failure to honor any other material obligation under it or by operation of law as a result of the rejection of the Tax Receivable Agreement in a case commenced under the United States Bankruptcy Code or otherwise, then all of our payment and other obligations under the Tax Receivable Agreement will be accelerated and will become due and payable applying the same assumptions described above. Such payments could be substantial and could exceed our actual cash tax savings under the Tax Receivable Agreement.
Additionally, if we experience a change of control (as defined under the Tax Receivable Agreement, which includes certain mergers, asset sales and other forms of business combinations and certain changes to the composition of the Vine Energy board) or the Tax Receivable Agreement terminates early (at our election or as a result of our breach), we could be required to make a substantial, immediate lump-sum payment. This payment would equal the present value of hypothetical future payments that could be required to be paid under the Tax Receivable Agreement (calculated using a discount rate equal to a per annum rate of LIBOR plus 100 basis points). The calculation of the hypothetical future payments will be based upon certain assumptions and deemed events set forth in the Tax Receivable Agreement, including (i) the sufficiency of taxable income to fully utilize the tax benefits, (ii) any Vine Units (other than those held by us) outstanding on the termination date are exchanged on the termination date and (iii) the utilization of certain loss carryovers.
Any payment upon a change of control or early termination may be made significantly in advance of the actual realization of the future tax benefits to which the payment obligation relates. Accordingly, our ability to use the tax benefits covered by the Tax Receivable Agreement may be significantly delayed, and such tax benefits may expire before we are able to utilize them. Except in the event of a change of control transaction or an early termination, we will not be obligated to make a payment under the Tax Receivable Agreement with respect to any tax benefits that we are unable to utilize. However, if we experience a change of control or the Tax Receivable Agreement is terminated early, the assumptions required to be made under the Tax Receivable Agreement in calculating our obligation include the sufficiency of taxable income to fully utilize the tax benefits covered by the Tax Receivable Agreement. As a result, in these circumstances, we could be required to make an immediate lump-sum payment under the Tax Receivable Agreement even though our ability to recognize any related realized cash tax savings is uncertain. Accordingly, the immediate lump-sum payment could significantly exceed our actual cash tax savings to which such payment relates. The holders of rights under the Tax Receivable Agreement will not reimburse us for any portion of such payment if we are unable to utilize any of the tax benefits that give rise to such payment.
In these situations, our obligations under the Tax Receivable Agreement could have a substantial negative impact on our liquidity and could have the effect of delaying, deferring or preventing certain mergers, asset sales, or other forms of business combinations or changes of control. For example, as discussed above, if we experienced a change of control or the Tax Receivable Agreement were terminated immediately after this offering, the estimated lump-sum payment would be approximately $211 million. There can be no assurance that we will be able to finance our obligations under the Tax Receivable Agreement.
Decisions we make in the course of running our business, such as with respect to mergers, asset sales, other forms of business combinations or other changes in control, may influence the timing and amount of payments
147
Table of Contents
that are received by the Vine Energy Investment Vehicles and the Vine Energy Investment II Vehicles under the Tax Receivable Agreement. For example, the earlier disposition of assets following an exchange of Vine Units, along with a corresponding number of shares of our Class B common stock, may accelerate payments under the Tax Receivable Agreement and increase the present value of such payments, and the disposition of assets before an exchange of Vine Units, along with a corresponding number of shares of our Class B common stock, may increase the Vine Energy Investment Vehicles’ tax liability without giving rise to any rights of the Vine Energy Investment Vehicles to receive payments under the Tax Receivable Agreement.
Payments generally will be due under the Tax Receivable Agreement within 5 days following the finalization of the schedule with respect to which the payment obligation is calculated, although interest on such payments will begin to accrue from the due date (without extensions) of such tax return. To the extent that we are unable to make payments under the Tax Receivable Agreement when due, such deferred payments under the Tax Receivable Agreement generally will accrue interest from the due date for such payment until the payment date at a rate of LIBOR plus 500 basis points. However, interest will accrue from the due date for such payment until the payment date at a rate of LIBOR plus 100 basis points if we are unable to make such payment as a result of limitations imposed by existing credit agreements.
Because we are a holding company with no operations of our own, our ability to make payments under the Tax Receivable Agreement is dependent on the ability of Vine Holdings to make distributions to us in an amount sufficient to cover our obligations under the Tax Receivable Agreement; this ability, in turn, may depend on the ability of Vine Holdings’ subsidiaries to make distributions to it. The ability of Vine Holdings, its subsidiaries and equity investees to make such distributions will be subject to, among other things, the applicable provisions of Delaware law that may limit the amount of funds available for distribution and restrictions in relevant debt instruments issued by Vine Holdings and/or its subsidiaries and equity investees.
The form of the Tax Receivable Agreement is filed as an exhibit to the registration statement of which this prospectus forms a part, and the foregoing description of the Tax Receivable Agreement is qualified by reference thereto.
Historical Transactions with Affiliates
Management Services Agreement
Each of Vine Oil & Gas, Brix and Harvest entered into a separate management services agreement (each a “MSA”, and together, the “MSAs”) with its wholly owned subsidiary, Vine Management Services LLC (“VMS”), pursuant to which VMS agreed to provide personnel to manage and develop Vine Oil & Gas’s, Brix’s and Harvest’s assets and conduct certain operational, technical and administrative services. The MSAs have indefinite terms but may be terminated under certain circumstances, including upon Vine Oil & Gas’s, Brix’s or Harvest’s failure to perform any of their material obligations. The management fee under the MSAs is determined based on the direct and allocable portion of VMS’ actual out-of-pocket expenses attributable to Vine Oil & Gas (plus 2%), Brix (plus 2%) or Harvest (plus 2%), as applicable, and is paid monthly. The management fee for both 2020 and 2019 for Vine Oil & Gas was $0.4 million and for Brix and Harvest was $0.2 million, which each of is included within general and administrative expenses in the respective audited consolidated statements of operations. VMS also provides management services to other entities, as described in “—Other Historical Arrangements” below.
Advisory Agreements
Each of Vine Oil & Gas, Brix and Harvest entered into a separate advisory agreement (each an “Advisory Agreement”, and together, the “Advisory Agreements”) with Vintner Resources, LLC (“Vintner Resources”) and Blackstone Management Partners L.L.C. (“BMP,” and together with Vintner Resources, the “Advisors”) pursuant to which the Advisors and their affiliates agreed to provide advisory and consulting services to Vine Oil
148
Table of Contents
& Gas, Brix and Harvest. Vintner Resources is indirectly controlled by Eric D. Marsh, our president and chief executive officer. The advisory and consulting services may include advice regarding financings and relationships with lenders and bankers; advice regarding the selection, retention and supervision of independent auditors, outside legal counsel, investment bankers and other advisors or consultants; advice regarding environmental, social and governance issues; advice regarding general business strategy and activities; and such other advice as may be reasonably requested by Vine Oil & Gas, Brix or Harvest. The monitoring fee earned by the Advisors under the Advisory Agreements is based on 2% of Vine Oil & Gas, and 1% of Brix and Harvest’s Adjusted EBITDAX, as applicable , as defined in the Advisory Agreements. The monitoring fees for 2020 and 2019 for Vine Oil & Gas were $7.5 million and $7.0 million, respectively, and for Brix and Harvest were $1.4 million and $1.0 million, respectively, and were each included in monitoring fees in the respective audited consolidated statements of operations. The Advisory Agreements will terminate upon the consummation of this offering.
Blackstone
Our predecessor was formed in 2014 in connection with an equity contribution by Blackstone. The limited partnership agreement of our predecessor provides for a number of different classes of units, which are owned by Blackstone and certain members of management.
Pursuant to Vine Oil & Gas Parent LP’s limited partnership agreement, Vine Oil & Gas Parent LP, Vintner Resources and Blackstone entered into an area of mutual interest agreement (the “AMI Agreement”) pursuant to which the limited partners agreed to refrain from pursuing investments in unconventional shale opportunities and other related rights, assets and interests in the Haynesville and Mid-Bossier formations in northern Louisiana, subject to certain exceptions. The AMI Agreement terminated in accordance with its terms on November 28, 2019.
As of December 31, 2020, Blackstone owned $50.0 million aggregate principal amount of the 8.75% Notes.
Additionally, Blackstone Advisory Partners L.P., an affiliate of Blackstone, acted as an initial purchaser in the offering of our 8.75% Notes and earned $0.7 million from the proceeds of the offering. As part of the issuance of the 9.75% Notes in October 2018, we paid Blackstone $63.8 million aggregate TLB principal plus accrued and unpaid interest. We paid $0.5 million to Blackstone for advisory services in connection with the placement of the 9.75% Notes.
In July 2020, a committee of independent members from our Board approved a $30 million distribution to Vine Oil & Gas Parent LP, a wholly owned subsidiary of Blackstone and certain members of management. The distribution was made immediately following such approval with funds originating from an RBL draw made at the end of June 2020.
In December 2020, we entered into the Second Lien Term Loan and used the proceeds to repay the aggregate principal amount of loans outstanding under the Superpriority Facility in connection with the entry into the amendment to and extension of the RBL. In conjunction with the issuance of the Second Lien Term Loan we paid Blackstone $0.9 million in financing fees.
Stockholders’ Agreement
In connection with this offering, we will enter into a stockholders’ agreement with Blackstone, which will provide Blackstone with the right to designate or nominate a majority of the members of our board of directors so long as it and its affiliates collectively beneficially own more than 50% of the outstanding shares of our common stock. When Blackstone and its affiliates collectively beneficially own less than 50% of the outstanding shares of our common stock, Blackstone will have the right to generally designate or nominate a proportional number of directors to our board of directors until it and its affiliates collectively beneficially own less than 5% of the outstanding shares of our common stock.
149
Table of Contents
Registration Rights Agreement
In connection with the closing of this offering, we will enter into a registration rights agreement with Vine Investment, Vine Investment II, Brix Investment, Brix Investment II, Harvest Investment and Harvest Investment II granting registration rights to certain of the Existing Owners, through their ownership in Vine Investment, Vine Investment II, Brix Investment, Brix Investment II, Harvest Investment and Harvest Investment II. Under the registration rights agreement, we will agree to register the sale of shares of our Class A common stock held by Vine Investment, Vine Investment II, Brix Investment, Brix Investment II, Harvest Investment and Harvest Investment II under certain circumstances and to provide such stockholders with certain customary demand, piggyback and block trade rights.
Procedures for Approval of Related Party Transactions
Prior to the closing of this offering, we have not maintained a policy for approval of Related Party Transactions. A “Related Party Transaction” is a transaction, arrangement or relationship in which we or any of our subsidiaries was, is or will be a participant, the amount of which involved exceeds $120,000, and in which any Related Person had, has or will have a direct or indirect material interest. A “Related Person” means:
| • | any person who is, or at any time during the applicable period was, one of our executive officers or one of our directors; |
| • | any person who is known by us to be the beneficial owner of more than 5% of our common stock; |
| • | any immediate family member of any of the foregoing persons, which means any child, stepchild, parent, stepparent, spouse, sibling, mother-in-law, father-in-law, son-in-law, daughter-in-law, brother-in-law or sister-in-law of a director, executive officer or a beneficial owner of more than 5% of our common stock, and any person (other than a tenant or employee) sharing the household of such director, executive officer or beneficial owner of more than 5% of our common stock; and |
| • | any firm, corporation or other entity in which any of the foregoing persons is a partner or principal or in a similar position or in which such person has a 10% or greater beneficial ownership interest. |
We anticipate that our board of directors will adopt a written related party transactions policy prior to the completion of this offering. Pursuant to this policy, we expect that our audit committee will review all material facts of all Related Party Transactions.
150
Table of Contents
Upon completion of this offering the authorized capital stock of Vine Energy will consist of 350,000,000 shares of Class A common stock, $0.01 par value per share, of which 34,995,149 shares will be issued and outstanding, 150,000,000 shares of Class B common stock, $0.01 par value per share, of which 34,289,108 shares will be issued and outstanding and 50,000,000 shares of preferred stock, $0.01 par value per share, of which no shares will be issued and outstanding.
The following summary of the capital stock and amended and restated certificate of incorporation and amended and restated bylaws of Vine Energy does not purport to be complete and is qualified in its entirety by reference to the provisions of applicable law and to our amended and restated certificate of incorporation and amended and restated bylaws, which are filed as exhibits to the registration statement of which this prospectus is a part.
Class A Common Stock
Holders of shares of our Class A common stock are entitled to one vote for each share held of record on all matters on which stockholders are entitled to vote generally, including the election or removal of directors elected by our stockholders generally. The holders of our Class A common stock do not have cumulative voting rights in the election of directors.
Holders of shares of our Class A common stock are entitled to receive dividends when, as and if declared by our board of directors out of funds legally available therefor, subject to any statutory or contractual restrictions on the payment of dividends and to any restrictions on the payment of dividends imposed by the terms of any outstanding preferred stock.
Upon our liquidation, dissolution or winding up and after payment in full of all amounts required to be paid to creditors and to the holders of preferred stock having liquidation preferences, if any, the holders of shares of our Class A common stock will be entitled to receive pro rata our remaining assets available for distribution.
All shares of our Class A common stock that will be outstanding at the time of the completion of the offering will be fully paid and non-assessable. The Class A common stock will not be subject to further calls or assessments by us. Holders of shares of our Class A common stock do not have preemptive, subscription, redemption or conversion rights. There will be no redemption or sinking fund provisions applicable to the Class A common stock. The rights powers, preferences and privileges of our Class A common stock will be subject to those of the holders of any shares of our preferred stock or any other series or class of stock we may authorize and issue in the future.
Class B Common Stock
Each share of Class B common stock will entitle its holder to one vote on all matters to be voted on by shareholders generally. If at any time the ratio at which Vine Units are exchangeable for shares of our Class A common stock changes from one-for-one as described under “Certain Relationships and Related Person Transactions—Exchange Agreement,” for example, as a result of a conversion rate adjustment for stock splits, stock dividends or reclassifications, the number of votes to which Class B common stockholders are entitled will be adjusted accordingly. The holders of our Class B common stock do not have cumulative voting rights in the election of directors.
Holders of shares of our Class B common stock will vote together with holders of our Class A common stock as a single class on all matters on which stockholders are entitled to vote generally, except as otherwise required by law.
151
Table of Contents
Holders of our Class B common stock do not have any right to receive dividends or to receive a distribution upon a liquidation, dissolution or winding up of Vine Energy.
Any holder of Class B common stock that does not also hold Vine Units is required to surrender any such shares of Class B common stock (including fractions thereof) to Vine Energy.
Preferred Stock
No shares of preferred stock will be issued or outstanding immediately after the offering contemplated by this prospectus. Our amended and restated certificate of incorporation authorizes our board of directors to establish one or more series of preferred stock (including convertible preferred stock). Unless required by law or any stock exchange, the authorized shares of preferred stock will be available for issuance without further action by the holders of our Class A or Class B common stock. Our board of directors is able to determine, with respect to any series of preferred stock, the powers (including voting powers), preferences and relative, participating, optional or other special rights, and the qualifications, limitations or restrictions thereof, including, without limitation:
| • | the designation of the series |
| • | the number of shares of the series, which our board of directors may, except where otherwise provided in the preferred stock designation, increase (but not above the total number of authorized shares of the class) or decrease (but not below the number of shares then outstanding); |
| • | whether dividends, if any, will be cumulative or non-cumulative and the dividend rate of the series; |
| • | the dates at which dividends, if any, will be payable; |
| • | the redemption or repurchase rights and price or prices, if any, for shares of the series; |
| • | the terms and amounts of any sinking fund provided for the purchase or redemption of shares of the series; |
| • | the amounts payable on shares of the series in the event of any voluntary or involuntary liquidation, dissolution or winding-up of our affairs; |
| • | whether the shares of the series will be convertible into shares of any other class or series, or any other security, of us or any other entity, and, if so, the specification of the other class or series or other security, the conversion price or prices or rate or rates, any rate adjustments, the date or dates as of which the shares will be convertible and all other terms and conditions upon which the conversion may be made; |
| • | restrictions on the issuance of shares of the same series or of any other class or series; and |
| • | the voting rights, if any, of the holders of the series. |
Dividends
The DGCL permits a corporation to declare and pay dividends out of “surplus” or, if there is no “surplus,” out of its net profits for the fiscal year in which the dividend is declared and/or the preceding fiscal year. “Surplus” is defined as the excess of the net assets of the corporation over the amount determined to be the capital of the corporation by its board of directors. The capital of the corporation is typically calculated to be (and cannot be less than) the aggregate par value of all issued shares of capital stock. Net assets equals the fair value of the total assets minus total liabilities. The DGCL also provides that dividends may not be paid out of net profits if, after the payment of the dividend, remaining capital would be less than the capital represented by the outstanding stock of all classes having a preference upon the distribution of assets. Declaration and payment of any dividend will be subject to the discretion of our board of directors.
152
Table of Contents
We currently do not pay a cash dividend to holders of our Class A common stock and certain of our debt agreements place certain restrictions on our ability to pay cash dividends on our Class A common stock. “Dividend Policy” includes additional information. However to the extent our free cash flow generation results in a decrease in our overall leverage in the future, we may revisit our dividend policy and declare cash dividends on our Class A common stock. Any decision to declare and pay dividends in the future will be made at the sole discretion of our board of directors and will depend on, among other things, our results of operations, cash requirements, financial condition, contractual restrictions and other factors that our board of directors may deem relevant. Because we are a holding company and have no direct operations, we will only be able to pay dividends from funds we receive from our subsidiaries. In addition, our ability to pay dividends will be limited by covenants in our existing indebtedness and may be limited by the agreements governing other indebtedness we or our subsidiaries incur in the future. “Dividend Policy” contains more information.
Annual Stockholder Meetings
Our amended and restated bylaws provide that annual stockholder meetings will be held at a date, time and place, if any, as exclusively selected by our board of directors. To the extent permitted under applicable law, we may conduct meetings by remote communications, including by webcast.
Anti-Takeover Effects of Our Amended and Restated Certificate of Incorporation and Amended and Restated Bylaws and Certain Provisions of Delaware Law
Our amended and restated certificate of incorporation, amended and restated bylaws and the DGCL contain provisions, which are summarized in the following paragraphs, that are intended to enhance the likelihood of continuity and stability in the composition of our board of directors. These provisions are intended to avoid costly takeover battles, reduce our vulnerability to a hostile or abusive change of control and enhance the ability of our board of directors to maximize stockholder value in connection with any unsolicited offer to acquire us. However, these provisions may have an anti-takeover effect and may delay, deter or prevent a merger or acquisition of the company by means of a tender offer, a proxy contest or other takeover attempt that a stockholder might consider in its best interest, including those attempts that might result in a premium over the prevailing market price for the shares of common stock held by stockholders.
Authorized but Unissued Capital Stock
Delaware law does not require stockholder approval for any issuance of shares that are authorized and available for issuance. However, the listing requirements of the NYSE, which would apply so long as our Class A common stock remains listed on the NYSE, require stockholder approval of certain issuances equal to or exceeding 20% of the then outstanding voting power of our capital stock or then outstanding number of shares of Class A common stock. These additional shares may be used for a variety of corporate purposes, including future public offerings, to raise additional capital or to facilitate acquisitions.
Our board of directors may generally issue shares of one or more series of preferred stock on terms calculated to discourage, delay or prevent a change of control of the company or the removal of our management. Moreover, our authorized but unissued shares of preferred stock will be available for future issuances in one or more series without stockholder approval and could be utilized for a variety of corporate purposes, including future offerings to raise additional capital, to facilitate acquisitions and employee benefit plans.
One of the effects of the existence of authorized and unissued and unreserved Class A common stock or preferred stock may be to enable our board of directors to issue shares to persons friendly to current management, which issuance could render more difficult or discourage an attempt to obtain control of our company by means of a merger, tender offer, proxy contest or otherwise, and thereby protect the continuity of our management and possibly deprive our stockholders of opportunities to sell their shares of Class A common stock at prices higher than prevailing market prices.
153
Table of Contents
Classified Board of Directors
Our amended and restated certificate of incorporation provides that our board of directors will be divided into three classes of directors, with the classes to be as nearly equal in number as possible, and with the directors serving three-year terms. As a result, approximately one-third of our board of directors will be elected each year. The classification of directors will have the effect of making it more difficult for stockholders to change the composition of our board of directors. Our amended and restated certificate of incorporation and amended and restated bylaws provide that, subject to any rights of holders of preferred stock to elect additional directors under specified circumstances, the number of directors will be fixed from time to time exclusively pursuant to a resolution adopted by the board of directors.
Delaware Law
We will not be subject to the provisions of Section 203 of the DGCL, regulating corporate takeovers. In general, those provisions prohibit a Delaware corporation, including those whose securities are listed for trading on the NYSE, from engaging in any business combination with any interested shareholder for a period of three years following the date that the shareholder became an interested shareholder, unless:
| • | the transaction is approved by the board of directors before the date the interested shareholder attained that status; |
| • | upon consummation of the transaction that resulted in the shareholder becoming an interested shareholder, the interested shareholder owned at least 85% of the voting stock of the corporation outstanding at the time the transaction commenced; or |
| • | on or after such time the business combination is approved by the board of directors and authorized at a meeting of shareholders by at least two-thirds of the outstanding voting stock that is not owned by the interested shareholder. |
Removal of Directors; Vacancies and Newly Created Directorships
Under the DGCL, unless otherwise provided in our amended and restated certificate of incorporation, directors serving on a classified board may be removed by the stockholders only for cause. Our amended and restated certificate of incorporation provides that directors may be removed with or without cause upon the affirmative vote of a majority in voting power of all outstanding shares of stock entitled to vote generally in the election of directors, voting together as a single class; provided, however, at any time when Blackstone and its affiliates beneficially own in the aggregate, less than 30% of the voting power of all outstanding shares of our stock entitled to vote generally in the election of directors, directors may only be removed for cause, and only upon the affirmative vote of holders of at least 662⁄3% of the voting power of all the then outstanding shares of stock entitled to vote generally in the election of directors, voting together as a single class. In addition, our amended and restated certificate of incorporation also provides that, subject to the rights granted to one or more series of preferred stock then outstanding or the rights granted under the stockholders’ agreement with Blackstone, any vacancies on our board of directors, and any newly created directorships, will be filled only by the affirmative vote of a majority of the directors then in office, even if less than a quorum, by a sole remaining director or by the stockholders; provided, however, at any time when Blackstone and its affiliates beneficially own, in the aggregate, less than 30% of voting power of the stock of the company entitled to vote generally in the election of directors, any newly-created directorship on the board of directors that results from an increase in the number of directors and any vacancy occurring in the board of directors may only be filled by a majority of the directors then in office, although less than a quorum, or by a sole remaining director (and not by the stockholders).
No Cumulative Voting
Under Delaware law, the right to vote cumulatively does not exist unless the certificate of incorporation specifically authorizes cumulative voting. Our amended and restated certificate of incorporation does not
154
Table of Contents
authorize cumulative voting. Therefore, stockholders holding a majority in voting power of the shares of our stock entitled to vote generally in the election of directors will be able to elect all our directors.
Special Stockholder Meetings
Our amended and restated certificate of incorporation provides that special meetings of our stockholders may be called at any time only by or at the direction of the board of directors or the chairman of the board of directors; provided, however, at any time when Blackstone and its affiliates beneficially own, in the aggregate, at least 30% in voting power of the stock entitled to vote generally in the election of directors, special meetings of our stockholders shall also be called by the board of directors or the chairman of the board of directors at the request of Blackstone and its affiliates. Our amended and restated bylaws prohibit the conduct of any business at a special meeting other than as specified in the notice for such meeting. These provisions may have the effect of deterring, delaying or discouraging hostile takeovers, or changes in control or management of the company.
Director Nominations and Stockholder Proposals
Our amended and restated bylaws establish advance notice procedures with respect to stockholder proposals and the nomination of candidates for election as directors, other than nominations made by or at the direction of the board of directors or a committee of the board of directors. In order for any matter to be “properly brought” before a meeting, a stockholder will have to comply with advance notice requirements and provide us with certain information. Generally, to be timely, a stockholder’s notice must be received at our principal executive offices not less than 90 days nor more than 120 days prior to the first anniversary date of the immediately preceding annual meeting of stockholders. Our amended and restated bylaws also specify requirements as to the form and content of a stockholder’s notice. These provisions will not apply to Blackstone and its affiliates so long as the stockholders’ agreement remains in effect. Our amended and restated bylaws allow the chairman of the meeting at a meeting of the stockholders to adopt rules and regulations for the conduct of meetings which may have the effect of precluding the conduct of certain business at a meeting if the rules and regulations are not followed. These provisions may also defer, delay or discourage a potential acquirer from conducting a solicitation of proxies to elect the acquirer’s own slate of directors or otherwise attempting to influence or obtain control of the company.
Stockholder Action by Written Consent
Pursuant to Section 228 of the DGCL, any action required to be taken at any annual or special meeting of the stockholders may be taken without a meeting, without prior notice and without a vote if a consent or consents in writing, setting forth the action so taken, is or are signed by the holders of outstanding stock having not less than the minimum number of votes that would be necessary to authorize or take such action at a meeting at which all shares of our stock entitled to vote thereon were present and voted, unless our amended and restated certificate of incorporation provides otherwise. Our amended and restated certificate of incorporation will preclude stockholder action by written consent at any time when Blackstone and its affiliates own, in the aggregate, less than 30% in voting power of our stock entitled to vote generally in the election of directors.
Supermajority Provisions
Our amended and restated certificate of incorporation and amended and restated bylaws provide that the board of directors is expressly authorized to make, alter, amend, change, add to, rescind or repeal, in whole or in part, our bylaws without a stockholder vote in any matter not inconsistent with the laws of the State of Delaware or our amended and restated certificate of incorporation. For as long as Blackstone and its affiliates beneficially own, in the aggregate, at least 30% in voting power of our stock entitled to vote generally in the election of directors, any amendment, alteration, change, addition or repeal of our bylaws by our stockholders requires the affirmative vote of a majority in voting power of the outstanding shares of our stock present in person or represented by proxy at the meeting and entitled to vote on such amendment, alteration, rescission or repeal. At
155
Table of Contents
any time when Blackstone and its affiliates beneficially own, in the aggregate, less than 30% in voting power of our stock entitled to vote generally in the election of directors, any amendment, alteration, rescission or repeal of our bylaws by our stockholders requires the affirmative vote of the holders of at least 66 2/3% in voting power of all the then outstanding shares of stock entitled to vote thereon, voting together as a single class.
The DGCL provides generally that the affirmative vote of a majority of the outstanding shares entitled to vote thereon, voting together as a single class, is required to amend a corporation’s certificate of incorporation, unless the certificate of incorporation requires a greater percentage.
Our amended and restated certificate of incorporation provides that at any time when Blackstone and its affiliates beneficially own, in the aggregate, less than 30% in voting power of our stock entitled to vote generally in the election of directors, the following provisions in our amended and restated certificate of incorporation may be amended, altered, repealed or rescinded only by the affirmative vote of the holders of at least 66 2/3% in voting power all the then outstanding shares of our stock entitled to vote thereon, voting together as a single class:
| • | the provision requiring a 66 2/3% supermajority vote for stockholders to amend our amended and restated bylaws; |
| • | the provisions providing for a classified board of directors (the election and term of our directors); |
| • | the provisions regarding resignation and removal of directors; |
| • | the provisions regarding competition and corporate opportunities; |
| • | the provisions regarding entering into business combinations with interested stockholders; |
| • | the provisions regarding stockholder action by written consent; |
| • | the provisions regarding calling special meetings of stockholders; |
| • | the provisions regarding filling vacancies on our board of directors and newly-created directorships; |
| • | the provisions eliminating monetary damages for breaches of fiduciary duty by a director; and |
| • | the amendment provision requiring that the above provisions be amended only with a 66 2/3% supermajority vote. |
The combination of the classification of our board of directors, the lack of cumulative voting and the supermajority voting requirements will make it more difficult for our existing stockholders to replace our board of directors as well as for another party to obtain control of us by replacing our board of directors. Because our board of directors has the power to retain and discharge our officers, these provisions could also make it more difficult for existing stockholders or another party to effect a change in management.
These provisions may have the effect of deterring hostile takeovers or delaying or preventing changes in control of us or our management, such as a merger, reorganization or tender offer. These provisions are intended to enhance the likelihood of continued stability in the composition of our board of directors and its policies and to discourage certain types of transactions that may involve an actual or threatened acquisition of our company. These provisions are designed to reduce our vulnerability to an unsolicited acquisition proposal. The provisions are also intended to discourage certain tactics that may be used in proxy fights. However, such provisions could have the effect of discouraging others from making tender offers for our shares and, as a consequence, they also may inhibit fluctuations in the market price of our shares that could result from actual or rumored takeover attempts. Such provisions may also have the effect of preventing changes in management.
Dissenters’ Rights of Appraisal and Payment
Under the DGCL, with certain exceptions, our stockholders will have appraisal rights in connection with a merger or consolidation of our company. Pursuant to the DGCL, stockholders who properly request and perfect
156
Table of Contents
appraisal rights in connection with such merger or consolidation will have the right to receive payment of the fair value of their shares as determined by the Delaware Court of Chancery.
Stockholders’ Derivative Actions
Under the DGCL, any of our stockholders may bring an action in our name to procure a judgment in our favor, also known as a derivative action, provided that the stockholder bringing the action is a holder of our shares at the time of the transaction to which the action relates or such stockholder’s stock thereafter devolved by operation of law.
Exclusive Forum
Our amended and restated certificate of incorporation provides that unless we consent to the selection of an alternative forum, the Court of Chancery of the State of Delaware shall, to the fullest extent permitted by law, be the sole and exclusive forum for any (i) derivative action or proceeding brought on behalf of our company, (ii) action asserting a claim of breach of a fiduciary duty owed by any director, officer or employee of our company to our company or our company’s stockholders, (iii) action asserting a claim against our company or any director or officer of our company arising pursuant to any provision of the DGCL or our amended and restated certificate of incorporation or our amended and restated bylaws, or (iv) action asserting a claim against our company governed by the internal affairs doctrine. Notwithstanding the foregoing sentence, the federal district courts of the United States of America shall be the exclusive forum for the resolution of any complaint asserting a cause of action arising under U.S. federal securities laws, including the Securities Act and the Exchange Act. Any person or entity purchasing or otherwise acquiring any interest in shares of capital stock of our company shall be deemed to have notice of and consented to the forum provisions in our amended and restated certificate of incorporation. Any person or entity purchasing or otherwise acquiring any interest in shares of capital stock of our company shall be deemed to have notice of and consented to the forum provisions in our amended and restated certificate of incorporation. However, the enforceability of similar forum provisions in other companies’ certificates of incorporation has been challenged in legal proceedings, and it is possible that a court could find these types of provisions to be unenforceable.
Conflicts of Interest
Delaware law permits corporations to adopt provisions renouncing any interest or expectancy in certain opportunities that are presented to the corporation or its officers, directors or stockholders. Our amended and restated certificate of incorporation, to the maximum extent permitted from time to time by Delaware law, renounces any interest or expectancy that we have in, or right to be offered an opportunity to participate in, specified business opportunities that are from time to time presented to our officers, directors or stockholders or their respective affiliates, other than those officers, directors, stockholders or affiliates who are our or our subsidiaries’ employees. Our amended and restated certificate of incorporation provides that, to the fullest extent permitted by law, neither Blackstone nor its respective affiliates or any director who is not employed by us (including any non-employee director who serves as one of our officers in both his director and officer capacities) or his or her affiliates will have any duty to refrain from (i) engaging in a corporate opportunity in the same or similar lines of business in which we or our affiliates now engage or propose to engage or (ii) otherwise competing with us or our affiliates. In addition, to the fullest extent permitted by law, in the event that Blackstone or any non-employee director acquires knowledge of a potential transaction or other business opportunity which may be a corporate opportunity for itself or himself or its or his affiliates or for us or our affiliates, such person will have no duty to communicate or offer such transaction or business opportunity to us or any of our affiliates and they may take any such opportunity for themselves or offer it to another person or entity. Our amended and restated certificate of incorporation does not renounce our interest in any business opportunity that is expressly offered to a non-employee director solely in his or her capacity as a director or officer of the company. To the fullest extent permitted by law, no business opportunity will be deemed to be a potential corporate opportunity for us unless we would be permitted to undertake the opportunity under our amended and restated certificate of
157
Table of Contents
incorporation, we have sufficient financial resources to undertake the opportunity and the opportunity would be in line with our business.
Limitations on Liability and Indemnification of Officers and Directors
The DGCL authorizes corporations to limit or eliminate the personal liability of directors and officers to corporations and their stockholders for monetary damages for breaches of directors’ and officers’ fiduciary duties, subject to certain exceptions. Our amended and restated certificate of incorporation includes a provision that eliminates the personal liability of directors and officers for monetary damages to the corporation or its stockholders for any breach of fiduciary duty as a director or an officer, except to the extent such exemption from liability or limitation thereof is not permitted under the DGCL. The effect of these provisions is to eliminate the rights of us and our stockholders, through stockholders’ derivative suits on our behalf, to recover monetary damages from a director or an officer for breach of fiduciary duty as a director or an officer, including breaches resulting from grossly negligent behavior. However, exculpation does not apply to any breaches of the director’s or officer’s duty of loyalty, any acts or omissions not in good faith or that involve intentional misconduct or knowing violation of law, any authorization of dividends or stock redemptions or repurchases paid or made in violation of the DGCL, or for any transaction from which the director derived an improper personal benefit.
Our amended and restated bylaws generally provide that we must defend, indemnify and advance expenses to our directors and officers to the fullest extent authorized by the DGCL. We also are expressly authorized to carry directors’ and officers’ liability insurance providing indemnification for our directors, officers and certain employees for some liabilities. We believe that these indemnification and advancement provisions and insurance are useful to attract and retain qualified directors and executive officers.
The limitation of liability, indemnification and advancement provisions in our amended and restated certificate of incorporation and amended and restated bylaws may discourage stockholders from bringing a lawsuit against directors or officers for breach of their fiduciary duty. These provisions also may have the effect of reducing the likelihood of derivative litigation against directors and officers, even though such an action, if successful, might otherwise benefit us and our stockholders. In addition, your investment may be adversely affected to the extent we pay the costs of settlement and damage awards against directors and officers pursuant to these indemnification provisions.
There is currently no pending material litigation or proceeding involving any of our directors, officers or employees for which indemnification is sought.
Indemnification Agreements
We intend to enter into an indemnification agreement with each of our directors and executive officers as described in “Certain Relationships and Related Person Transactions—Indemnification Agreements.” Insofar as indemnification for liabilities arising under the Securities Act may be permitted to directors or executive officers, we have been informed that in the opinion of the SEC such indemnification is against public policy and is therefore unenforceable.
Transfer Agent and Registrar
The transfer agent and registrar for our Class A common stock will be American Stock Transfer & Trust Company, LLC.
Listing
We intend to apply to list our Class A common stock on the NYSE under the symbol “VEI.”
158
Table of Contents
SHARES ELIGIBLE FOR FUTURE SALE
Prior to this offering, there has been no public market for our Class A common stock. Future sales of our Class A common stock in the public market, or the availability of such shares for sale in the public market, could adversely affect the market price of our Class A common stock prevailing from time to time. As described below, only a limited number of shares will be available for sale shortly after this offering due to contractual and legal restrictions on resale. Nevertheless, sales of a substantial number of shares of our Class A common stock in the public market after such restrictions lapse, or the perception that those sales may occur, could adversely affect the prevailing market price of our Class A common stock at such time and our ability to raise equity-related capital at a time and price we deem appropriate.
Sales of Restricted Shares
Upon completion of this offering, we will have outstanding an aggregate of 34,995,149 shares of Class A common stock. Of these shares, all of the 18,750,000 shares of Class A common stock to be sold in this offering (or 21,562,500 shares assuming the underwriters exercise the option to purchase additional shares in full) will be freely tradable without restriction or further registration under the Securities Act, unless the shares are held by any of our “affiliates” as such term is defined in Rule 144 under the Securities Act. All remaining shares of Class A common stock will be deemed “restricted securities” as such term is defined under Rule 144. The restricted securities were, or will be, issued and sold by us in private transactions and are eligible for public sale only if registered under the Securities Act or if they qualify for an exemption from registration under Rule 144 or Rule 701 under the Securities Act, which rules are summarized below.
In addition, subject to certain limitations and exceptions, pursuant to the terms of the exchange agreement, the Vine Unit Holders will each have the right to exchange all or a portion of their Vine Units, along with a corresponding number of shares of Class B common stock, for Class A common stock at an exchange ratio of one share of Class A common stock for each Vine Unit (and corresponding share of Class B common stock) exchanged, subject to conversion rate adjustments for stock splits, stock dividends and reclassifications or, at our election, an equivalent amount of cash. “Certain Relationships and Related Party Transactions—Exchange Agreement” contains additional information. The shares of Class A common stock we issue upon such exchanges would be “restricted securities” as defined in Rule 144 described below. However, upon the closing of this offering, we intend to enter into a registration rights agreement with the entities that comprise the Vine Energy Investment Vehicles and the Vine Energy Investment II Vehicles that will require us to register under the Securities Act shares of Class A common stock owned by the entities that comprise the Vine Energy Investment Vehicles and the Vine Energy Investment II Vehicles. “Certain Relationships and Related Party Transactions—Registration Rights Agreement” contains additional information.
As a result of the lock-up agreements described below and the provisions of Rule 144 and Rule 701 under the Securities Act, the shares of our Class A common stock (excluding the shares to be sold in this offering) that will be available for sale in the public market are as follows:
| • | no shares will be eligible for sale on the date of this prospectus or prior to 180 days after the date of this prospectus; and |
| • | 50,534,257 shares will be eligible for sale upon the expiration of the lock-up agreements beginning 180 days after the date of this prospectus and when permitted under Rule 144 or Rule 701. |
Lock-up Agreements
We, the entities that comprise the Vine Energy Investment Vehicles, the Vine Energy Investment II Vehicles and all of our directors and executive officers have agreed not to sell any Class A common stock or securities convertible into or exchangeable for shares of Class A common stock for a period of 180 days from the date of this prospectus, subject to certain exceptions. “Underwriting (Conflicts of Interest)” contains a description of these lock-up agreements.
159
Table of Contents
Rule 144
In general, under Rule 144 under the Securities Act as currently in effect, a person (or persons whose shares are aggregated) who is not deemed to have been an affiliate of ours at any time during the three months preceding a sale, and who has beneficially owned restricted securities within the meaning of Rule 144 for a least six months (including any period of consecutive ownership of preceding non-affiliated holders) would be entitled to sell those shares, subject only to the availability of current public information about us. A non- affiliated person who has beneficially owned restricted securities within the meaning of Rule 144 for at least one year would be entitled to sell those shares without regard to the provisions of Rule 144.
A person (or persons whose shares are aggregated) who is deemed to be an affiliate of ours and who has beneficially owned restricted securities within the meaning of Rule 144 for at least six months would be entitled to sell within any three-month period a number of shares that does not exceed the greater of one percent of the then outstanding shares of our Class A common stock or the average weekly trading volume of our Class A common stock reported through the NYSE, as applicable, during the four calendar weeks preceding the filing of notice of the sale. Such sales are also subject to certain manner of sale provisions, notice requirements and the availability of current public information about us.
Rule 701
In general, under Rule 701 under the Securities Act, any of our employees, directors, officers, consultants or advisors who purchases shares from us in connection with a compensatory stock or option plan or other written agreement before the effective date of this offering is entitled to sell such shares 90 days after the effective date of this offering in reliance on Rule 144, without having to comply with the holding period requirement of Rule 144 and, in the case of non-affiliates, without having to comply with the public information, volume limitation or notice filing provisions of Rule 144. The SEC has indicated that Rule 701 will apply to typical stock options granted by an issuer before it becomes subject to the reporting requirements of the Exchange Act, along with the shares acquired upon exercise of such options, including exercises after the date of this prospectus.
Stock Issued Under Employee Plans
We intend to file a registration statement on Form S-8 under the Securities Act to register shares of Class A common stock issuable under our long-term incentive plan. This registration statement on Form S-8 is expected to be filed following the effective date of the registration statement of which this prospectus is a part and will be effective upon filing. Accordingly, shares registered under such registration statement will be available for sale in the open market following the effective date, unless such shares are subject to vesting restrictions with us, Rule 144 restrictions applicable to our affiliates or the lock-up restrictions described above.
Registration Rights
We expect to enter into a registration rights agreement with the entities that comprise the Vine Energy Investment Vehicles and the Vine Energy Investment II Vehicles, which will require us to file and effect the registration of our Class A common stock held thereby (and by certain of their affiliates) in certain circumstances no earlier than the expiration of the lock-up period contained in the underwriting agreement entered into in connection with this offering. “Certain Relationships and Related Party Transactions—Registration Rights” contains additional information regarding the registration rights agreement.
160
Table of Contents
MATERIAL U.S. FEDERAL INCOME TAX CONSIDERATIONS FOR NON-U.S. HOLDERS
The following is a summary of the material U.S. federal income tax considerations related to the purchase, ownership and disposition of our Class A common stock by a non-U.S. holder (as defined below) that acquires such Class A common stock pursuant to this offering and that holds such Class A common stock as a “capital asset” (generally property held for investment). This summary is based on the provisions of the Internal Revenue Code of 1986, as amended (the “Code”), U.S. Treasury regulations, administrative rulings and judicial decisions, all as in effect on the date hereof, and all of which are subject to change, possibly with retroactive effect. We cannot assure you that a change in law will not significantly alter the tax considerations that we describe in this summary. We have not sought any ruling from the IRS with respect to the statements made and the conclusions reached in the following summary, and there can be no assurance that the IRS or a court will agree with such statements and conclusions.
This summary does not address all aspects of U.S. federal income taxation that may be relevant to non-U.S. holders in light of their personal circumstances. In addition, this summary does not address the Medicare tax on certain investment income, U.S. federal estate or gift tax laws, any state, local or non-U.S. tax laws or any tax treaties. This summary also does not address tax considerations applicable to investors that may be subject to special treatment under the U.S. federal income tax laws, such as:
| • | banks, insurance companies or other financial institutions; |
| • | tax-exempt or governmental organizations; |
| • | qualified foreign pension funds (or any entities all of the interests of which are held by a qualified foreign pension fund) or any other person that is subject to special rules or exemptions under the Foreign Investment in Real Property Tax Act; |
| • | dealers in securities or foreign currencies; |
| • | persons whose functional currency is not the U.S. dollar; |
| • | “controlled foreign corporations,” “passive foreign investment companies,” and corporations that accumulate earnings to avoid U.S. federal income tax; |
| • | traders in securities that use the mark-to-market method of accounting for U.S. federal income tax purposes; |
| • | persons subject to the alternative minimum tax; |
| • | partnerships or other pass-through entities for U.S. federal income tax purposes or holders of interests therein; |
| • | persons deemed to sell our Class A common stock under the constructive sale provisions of the Code; |
| • | persons that acquired our Class A common stock through the exercise of employee stock options or otherwise as compensation or through a tax-qualified retirement plan; |
| • | certain former citizens or long-term residents of the United States; and |
| • | persons that hold our Class A common stock as part of a straddle, appreciated financial position, synthetic security, hedge, conversion transaction, wash sale or other integrated investment or risk reduction transaction. |
PROSPECTIVE INVESTORS ARE ENCOURAGED TO CONSULT THEIR TAX ADVISORS WITH RESPECT TO THE APPLICATION OF THE U.S. FEDERAL INCOME TAX LAWS TO THEIR PARTICULAR SITUATION, AS WELL AS ANY TAX CONSEQUENCES OF THE PURCHASE, OWNERSHIP AND DISPOSITION OF OUR CLASS A COMMON STOCK ARISING UNDER THE U.S. FEDERAL ESTATE OR GIFT TAX LAWS OR UNDER THE LAWS OF ANY STATE, LOCAL, NON-U.S. OR OTHER TAXING JURISDICTION OR UNDER ANY APPLICABLE INCOME TAX TREATY.
161
Table of Contents
Non-U.S. Holder Defined
For purposes of this discussion, a “non-U.S. holder” is a beneficial owner of our Class A common stock that is not for U.S. federal income tax purposes a partnership or any of the following:
| • | an individual who is a citizen or resident of the United States; |
| • | a corporation (or other entity treated as a corporation for U.S. federal income tax purposes) created or organized in or under the laws of the United States, any state thereof or the District of Columbia; |
| • | an estate the income of which is subject to U.S. federal income tax regardless of its source; or |
| • | a trust (i) the administration of which is subject to the primary supervision of a U.S. court and which has one or more United States persons who have the authority to control all substantial decisions of the trust or (ii) which has made a valid election under applicable U.S. Treasury regulations to be treated as a United States person. |
If a partnership (including an entity or arrangement treated as a partnership for U.S. federal income tax purposes) holds our Class A common stock, the tax treatment of a partner in the partnership generally will depend upon the status of the partner, upon the activities of the partnership and upon certain determinations made at the partner level. Accordingly, we urge partners in partnerships (including entities or arrangements treated as partnerships for U.S. federal income tax purposes) considering the purchase of our Class A common stock to consult their tax advisors regarding the U.S. federal income tax considerations of the purchase, ownership and disposition of our Class A common stock by such partnership.
Distributions
As described in the section entitled “Dividend Policy,” we currently do not pay a cash dividend to holders of our Class A common stock and certain of our debt agreements place certain restrictions on our ability to pay cash dividends on our Class A common stock. “Dividend Policy” includes additional information. However to the extent our free cash flow generation results in a decrease in our overall leverage in the future, we may revisit our dividend policy and declare cash dividends on our Class A common stock. In the event we do make distributions of cash or other property on our Class A common stock, those distributions will constitute dividends for U.S. federal income tax purposes to the extent paid from our current or accumulated earnings and profits, as determined under U.S. federal income tax principles. To the extent those distributions exceed our current and accumulated earnings and profits, the distributions will be treated as a non-taxable return of capital, which will reduce the non-U.S. holder’s tax basis in our Class A common stock, until such basis equals zero, and thereafter as capital gain from the sale or exchange of such Class A common stock. “—Gain on Disposition of Class A Common Stock” contains additional information. Subject to the withholding requirements under FATCA (as defined below) and with respect to effectively connected dividends, each of which is discussed below, any distribution made to a non-U.S. holder on our Class A common stock generally will be subject to U.S. withholding tax at a rate of 30% of the gross amount of the distribution unless an applicable income tax treaty provides for a lower rate. To receive the benefit of a reduced treaty rate, a non-U.S. holder must generally provide the applicable withholding agent with an IRS Form W-8BEN or IRS Form W-8BEN-E (or other applicable or successor form) certifying qualification for the reduced rate.
Dividends paid to a non-U.S. holder that are effectively connected with a trade or business conducted by the non-U.S. holder in the United States (and, if required by an applicable income tax treaty, are treated as attributable to a permanent establishment maintained by the non-U.S. holder in the United States) generally will be taxed on a net income basis at the rates and in the manner generally applicable to United States persons (as defined under the Code). Such effectively connected dividends will not be subject to U.S. withholding tax if the non-U.S. holder satisfies certain certification requirements by providing the applicable withholding agent with a properly executed IRS Form W-8ECI certifying eligibility for exemption. If the non-U.S. holder is a corporation for U.S. federal income tax purposes, it may also be subject to a branch profits tax (at a 30% rate or such lower rate as specified by an applicable income tax treaty) on its effectively connected earnings and profits (as adjusted for certain items), which will include effectively connected dividends.
162
Table of Contents
Gain on Disposition of Class A Common Stock
Subject to the discussion below under “—Backup Withholding and Information Reporting,” a non-U.S. holder generally will not be subject to U.S. federal income tax on any gain realized upon the sale or other disposition of our Class A common stock unless:
| • | the non-U.S. holder is an individual who is present in the United States for a period or periods aggregating 183 days or more during the calendar year in which the sale or disposition occurs and certain other conditions are met; |
| • | the gain is effectively connected with a trade or business conducted by the non-U.S. holder in the United States (and, if required by an applicable income tax treaty, is attributable to a permanent establishment maintained by the non-U.S. holder in the United States); or |
| • | our Class A common stock constitutes a United States real property interest by reason of our status as a United States real property holding corporation (“USRPHC”) for U.S. federal income tax purposes during the shorter of the five-year period ending on the date of the disposition or the non-U.S. holders’ holding period for our Class A common stock. |
A non-U.S. holder described in the first bullet point above will be subject to U.S. federal income tax at a rate of 30% (or such lower rate as specified by an applicable income tax treaty) on the amount of such gain, which generally may be offset by U.S. source capital losses.
A non-U.S. holder whose gain is described in the second bullet point above or, subject to the exceptions described in the next paragraph, the third bullet point above generally will be taxed on a net income basis at the rates and in the manner generally applicable to United States persons (as defined under the Code) unless an applicable income tax treaty provides otherwise. If such non-U.S. holder is a corporation for U.S. federal income tax purposes, it may also be subject to a branch profits tax (at a 30% rate or such lower rate specified by an applicable income tax treaty) on its effectively connected earnings and profits (as adjusted for certain items), which will include any effectively connected gain described in the second bullet point above.
Generally, a corporation is a USRPHC if the fair value of its United States real property interests equals or exceeds 50% of the sum of the fair value of its worldwide real property interests and its other assets used or held for use in a trade or business. We believe that we currently are, and expect to remain for the foreseeable future, a USRPHC for U.S. federal income tax purposes. However, provided that our common stock is and continues to be regularly traded on an established securities market, only a non-U.S. holder that actually or constructively owns or owned more than 5% of our Class A common stock at any time during the shorter of the five-year period ending on the date of the disposition or the non-U.S. holder’s holding period for the Class A common stock will be taxable on gain realized on the disposition of our Class A common stock as a result of our status as a USRPHC. If our Class A common stock were not considered to be regularly traded on an established securities market, such non-U.S. holder (regardless of the percentage of stock owned) would be subject to U.S. federal income tax on a taxable disposition of our Class A common stock (as described in the preceding paragraph), and a 15% withholding tax would apply to the gross proceeds from such disposition.
Non-U.S. holders should consult their tax advisors with respect to the application of the foregoing rules to their ownership and disposition of our Class A common stock.
Backup Withholding and Information Reporting
Any dividends paid to a non-U.S. holder must be reported annually to the IRS and to the non-U.S. holder.
Copies of these information returns may be made available to the tax authorities in the country in which the non-U.S. holder resides or is established. Payments of dividends to a non-U.S. holder generally will not be subject to backup withholding if the non-U.S. holder establishes an exemption by properly certifying its non-U.S. status on an IRS Form W-8BEN or IRS Form W-8BEN-E (or other applicable or successor form).
163
Table of Contents
Payments of the proceeds from a sale or other disposition by a non-U.S. holder of our Class A common stock effected by or through a U.S. office of a broker generally will be subject to information reporting and backup withholding (at the applicable rate) unless the non-U.S. holder establishes an exemption by properly certifying its non-U.S. status on an IRS Form W-8BEN or IRS Form W-8BEN-E (or other applicable or successor form) and certain other conditions are met. Information reporting and backup withholding generally will not apply to any payment of the proceeds from a sale or other disposition of our Class A common stock effected outside the United States by a non-U.S. office of a broker. However, unless such broker has documentary evidence in its records that the non-U.S. holder is not a United States person and certain other conditions are met, or the non-U.S. holder otherwise establishes an exemption, information reporting will apply to a payment of the proceeds of the disposition of our Class A common stock effected outside the United States by such a broker if it has certain relationships within the United States.
Backup withholding is not an additional tax. Rather, the federal income tax liability (if any) of persons subject to backup withholding will be reduced by the amount of tax withheld. If backup withholding results in an overpayment of taxes, a refund may be obtained, provided that the required information is timely furnished to the IRS.
Additional Withholding Requirements under FATCA
Sections 1471 through 1474 of the Code, and the U.S. Treasury regulations and administrative guidance issued thereunder (“FATCA”), impose a 30% withholding tax on any dividends paid on our Class A common stock if paid to a “foreign financial institution” or a “non-financial foreign entity” (each as defined in the Code) (including, in some cases, when such foreign financial institution or non-financial foreign entity is acting as an intermediary), and subject to the discussion of certain proposed Treasury Regulations below, on the gross proceeds from a sale or other disposition of our Class A common stock, unless (i) in the case of a foreign financial institution, such institution enters into an agreement with the U.S. government to withhold on certain payments, and to collect and provide to the U.S. tax authorities substantial information regarding U.S. account holders of such institution (which includes certain equity and debt holders of such institution, as well as certain account holders that are non-U.S. entities with U.S. owners); (ii) in the case of a non-financial foreign entity, such entity certifies that it does not have any “substantial United States owners” (as defined in the Code) or provides the applicable withholding agent with a certification identifying the direct and indirect substantial United States owners of the entity (in either case, generally on an IRS Form W-8BEN-E); or (iii) the foreign financial institution or non-financial foreign entity otherwise qualifies for an exemption from these rules and provides appropriate documentation (such as an IRS Form W-8BEN-E). Foreign financial institutions located in jurisdictions that have an intergovernmental agreement with the United States governing these rules may be subject to different rules. Under certain circumstances, a non-U.S. holder might be eligible for refunds or credits of such taxes. Non-U.S. holders are encouraged to consult their own tax advisors regarding the effects of FATCA on their investment in our Class A common stock.
The U.S. Treasury has released proposed Treasury Regulations which, if finalized, would eliminate the federal withholding tax of 30% applicable to the gross proceeds of a sale or other disposition of our Class A common stock. Taxpayers may generally rely on the proposed regulations until final regulations are issued.
INVESTORS CONSIDERING THE PURCHASE OF OUR CLASS A COMMON STOCK ARE URGED TO CONSULT THEIR OWN TAX ADVISORS REGARDING THE APPLICATION OF THE U.S. FEDERAL INCOME TAX LAWS TO THEIR PARTICULAR SITUATIONS AND THE APPLICABILITY AND EFFECT OF U.S. FEDERAL ESTATE AND GIFT TAX LAWS AND ANY STATE, LOCAL OR NON-U.S. TAX LAWS AND TAX TREATIES.
164
Table of Contents
UNDERWRITING (CONFLICTS OF INTEREST)
Under the terms and subject to the conditions contained in an underwriting agreement dated the date of this prospectus, the underwriters named below, for whom Citigroup Global Markets Inc., Credit Suisse Securities (USA) LLC and Morgan Stanley & Co. LLC are acting as representatives, have agreed to purchase, and we have agreed to sell, the number of shares of Class A common stock indicated below:
| Name |
Number of Shares | |||
| Citigroup Global Markets Inc. |
||||
| Credit Suisse Securities (USA) LLC |
||||
| Morgan Stanley & Co. LLC |
||||
| Barclays Capital Inc. |
||||
| BofA Securities, Inc. |
||||
| RBC Capital Markets, LLC |
||||
| Blackstone Securities Partners L.P. |
||||
| Capital One Securities, Inc. |
||||
| KeyBanc Capital Markets Inc. |
||||
| MUFG Securities Americas Inc. |
||||
| CastleOak Securities, L.P. |
||||
| Drexel Hamilton, LLC |
||||
| Samuel A. Ramirez & Company, Inc. |
||||
| Stern Brothers & Co. |
||||
|
|
|
|||
| Total |
18,750,000 | |||
|
|
|
|||
The underwriters and the representatives are collectively referred to as the “underwriters” and the “representatives,” respectively. The underwriters are offering the shares of Class A common stock subject to their acceptance of the shares of Class A common stock from us and subject to prior sale. The underwriting agreement provides that the obligations of the several underwriters to pay for and accept delivery of the shares of Class A common stock offered by this prospectus are subject to certain conditions contained in the underwriting agreement including:
| • | the obligation to purchase all of the shares of Class A common stock offered hereby (other than those shares of Class A common stock covered by their option to purchase additional shares of Class A common stock as described below), if any of the shares of Class A common stock are purchased; |
| • | the representations and warranties made by us to the underwriters are true; |
| • | there is no material change in our business or the financial markets; and |
| • | we deliver customary closing documents to the underwriters. |
The per share price of any shares of Class A common stock sold by the underwriters shall be the public offering price listed on the cover page of this prospectus, in United States dollars, less an amount not greater than the per share amount of the concession to dealers described below.
The underwriters initially propose to offer part of the shares of Class A common stock directly to the public at the public offering price listed on the cover page of this prospectus and part to certain dealers at a price that represents a concession not in excess of $ a share under the public offering price. Any underwriter may allow, and such dealers may reallow, a concession not in excess of $ a share to other underwriters or to certain dealers. After the initial offering of the shares of Class A common stock, the offering price and other selling terms may from time to time be varied by the representatives.
We have granted to the underwriters an option, exercisable for 30 days from the date of this prospectus, to purchase up to an aggregate of 2,812,500 additional shares of Class A common stock at the public offering price
165
Table of Contents
listed on the cover page of this prospectus, less underwriting discounts and commissions. The underwriters may exercise this option solely for the purpose of covering over-allotments, if any, made in connection with the offering of the shares of Class A common stock offered by this prospectus. To the extent the option is exercised, each underwriter will become obligated, subject to certain conditions, to purchase the same percentage of the additional shares of Class A common stock as the number listed next to the underwriter’s name in the preceding table bears to the total number of shares of Class A common stock listed next to the names of all underwriters in the preceding table. If the underwriters’ option is exercised in full based upon an assumed initial offering price of $17.50 per share, the total price to the public would be approximately $377 million, the total underwriters’ discounts and commissions would be approximately $23 million, other offering related expenses payable by Vine of $5.2 million, and the total proceeds to us would be approximately $350 million.
The following table shows the per share and total underwriting discounts and commissions to be paid to the underwriters by us. These amounts are shown assuming no exercise and full exercise of the underwriters’ option to purchase additional shares.
| Paid by Us | ||||||||
| No Exercise | Full Exercise | |||||||
| Per Share |
$ | $ | ||||||
| Total |
$ | $ | ||||||
We estimate that the expenses of the offering, not including underwriting discounts and commissions, will be approximately $5.2 million.
In addition to the underwriting discounts and commissions to be paid by us, we have agreed to reimburse the underwriters for certain of their out-of-pocket expenses incurred in connection with this offering, including, among other things, the reasonable fees and disbursements of counsel for the underwriters in connection with (a) the registration and delivery of the Class A common stock in this offering and (b) any required review of the offering by FINRA (including any filing fees in connection therewith), in an amount not greater than $30,000.
We intend to list our Class A common stock on the NYSE under the symbol “VEI.”
We, all of our directors and officers and each of the Vine Energy Investment Vehicles and the Vine Energy Investment II Vehicles have agreed that, without the prior written consent of Citigroup Global Markets Inc., Credit Suisse Securities (USA) LLC and Morgan Stanley & Co. LLC, and subject to certain exceptions, on behalf of the underwriters, we and they will not, during the period ending 180 days after the date of this prospectus:
| • | offer, pledge, sell, contract to sell, sell any option or contract to purchase, purchase any option or contract to sell, grant any option, right or warrant to purchase, lend or otherwise transfer or dispose of, directly or indirectly, any shares of our capital stock beneficially owned or any securities so owned that are convertible into or exercisable or exchangeable for our capital stock; |
| • | enter into any swap or other arrangement that transfers to another, in whole or in part, any of the economic consequences of ownership of the our capital stock; |
| • | establish or increase a put equivalent position or liquidate or decrease a call equivalent position in shares of our capital stock; |
| • | file any registration statement with the SEC relating to the offering of any shares of capital stock or any securities convertible into or exercisable or exchangeable for our capital stock; or |
| • | publicly disclose the intention to do any of the foregoing, |
whether any such transaction described above is to be settled by delivery of our capital stock or such other securities, in cash or otherwise. The restrictions described in this paragraph shall not apply to, among others, the sale of shares to the underwriters pursuant to the underwriting agreement.
166
Table of Contents
In order to facilitate the offering of the Class A common stock, the underwriters may engage in transactions that stabilize, maintain or otherwise affect the price of the Class A common stock. Specifically, the underwriters may over-allot in connection with the offering, creating a short position in the Class A common stock for their own account. In addition, to cover over-allotments or to stabilize the price of the Class A common stock, the underwriters may bid for, and purchase, shares of Class A common stock in the open market. Finally, the underwriting syndicate may reclaim selling concessions allowed to an underwriter or a dealer for distributing the Class A common stock in the offering, if the syndicate repurchases previously distributed Class A common stock in transactions to cover syndicate short positions, in stabilization transactions or otherwise. Any of these activities may stabilize or maintain the market price of the Class A common stock above independent market levels. The underwriters are not required to engage in these activities, and may end any of these activities at any time.
We and the underwriters have agreed to indemnify each other against certain liabilities, including liabilities under the Securities Act.
The offering of the Class A common stock by the underwriters is subject to receipt and acceptance and subject to the underwriters’ right to reject any order in whole or in part.
Pricing of the Offering
Prior to this offering, there has been no public market for our Class A common stock. The initial public offering price is determined by negotiations between us and the representatives. Among the factors to be considered in determining the initial public offering price will be the information set forth in this prospectus, our history and prospects, the history of and prospects for our industry in general, our sales, earnings and certain other financial and operating information in recent periods, and the price-earnings ratios, price-sales ratios, market prices of securities, certain financial and operating information of companies engaged in activities similar to ours and other factors deemed relevant by the underwriters and us. The estimated initial public offering price range set forth on the cover page of the preliminary prospectus is subject to change as a result of market conditions and other factors.
Conflicts of Interest
Each of Credit Suisse Securities (USA) LLC and Morgan Stanley & Co. LLC is a lender under the RBL and, as such, is expected to receive in excess of 5% of the offering proceeds. Furthermore, affiliates of Blackstone Securities Partners L.P. will own in excess of 10% of our issued and outstanding Class A common stock. Because each of Credit Suisse Securities (USA) LLC, Morgan Stanley & Co. LLC and Blackstone Securities Partners L.P. is an underwriter in this offering, it is deemed to have a “conflict of interest” under Rule 5121. Accordingly, this offering is being made in compliance with the requirements of Rule 5121. Due to certain of these conflicts of interest, Rule 5121 requires, among other things, that a “qualified independent underwriter” participate in the preparation of, and exercise the usual standards of “due diligence” with respect to, the registration statement and this prospectus. Citigroup Global Markets Inc. has agreed to act as a qualified independent underwriter for this offering. Citigroup Global Markets Inc. will not receive any additional fees for serving as a qualified independent underwriter in connection with this offering. We have agreed to indemnify Citigroup Global Markets Inc. against liabilities incurred in connection with acting as a qualified independent underwriter, including liabilities under the Securities Act.
In addition, the underwriters and their respective affiliates are full service financial institutions engaged in various activities, which may include securities trading, commercial and investment banking, financial advisory, investment management, principal investment, hedging, financing and brokerage activities. One or more of the underwriters and their respective affiliates has in the past performed commercial banking, investment banking and/or advisory services for us or our affiliates from time to time for which they may have received customary
167
Table of Contents
fees and reimbursement of expenses and may, from time to time, engage in transactions with and perform services for us or our affiliates in the ordinary course of their business for which they may receive customary fees and reimbursement of expenses.
In the ordinary course of their various business activities, the underwriters and their respective affiliates may make or hold a broad array of investments and actively trade debt and equity securities (or related derivative securities) and financial instruments (which may include bank loans and/or credit default swaps) for their own account and for the accounts of their customers and may at any time hold long and short positions in such securities and instruments. Such investment and securities activities may involve our securities and instruments or those of our affiliates.
Selling Restrictions
Canada
The securities may be sold only to purchasers purchasing, or deemed to be purchasing, as principal that are accredited investors, as defined in National Instrument 45-106 Prospectus Exemptions or subsection 73.3(1) of the Securities Act (Ontario), and are permitted clients, as defined in National Instrument 31-103 Registration Requirements, Exemptions and Ongoing Registrant Obligations. Any resale of the securities must be made in accordance with an exemption from, or in a transaction not subject to, the prospectus requirements of applicable securities laws.
Securities legislation in certain provinces or territories of Canada may provide a purchaser with remedies for rescission or damages if this prospectus (including any amendment thereto) contains a misrepresentation, provided that the remedies for rescission or damages are exercised by the purchaser within the time limit prescribed by the securities legislation of the purchaser’s province or territory. The purchaser should refer to any applicable provisions of the securities legislation of the purchaser’s province or territory for particulars of these rights or consult with a legal advisor.
Pursuant to section 3A.3 (or, in the case of securities issued or guaranteed by the government of a non- Canadian jurisdiction, section 3A.4) of National Instrument 33-105 Underwriting Conflicts (“NI 33-105”), the underwriters are not required to comply with the disclosure requirements of NI 33-105 regarding underwriter conflicts of interest in connection with this offering.
European Economic Area
In relation to each Member State of the European Economic Area which has implemented the Prospectus Directive (each, a “Relevant Member State”) an offer to the public of any shares of our Class A common stock may not be made in that Relevant Member State, except that an offer to the public in that Relevant Member State of any shares of our Class A common stock may be made at any time under the following exemptions under the Prospectus Directive, if they have been implemented in that Relevant Member State:
| • | to any legal entity which is a qualified investor as defined in the Prospectus Directive; |
| • | to fewer than 100 or, if the Relevant Member State has implemented the relevant provision of the 2010 PD Amending Directive, 150, natural or legal persons (other than qualified investors as defined in the Prospectus Directive), as permitted under the Prospectus Directive, subject to obtaining the prior consent of the representatives for any such offer; or |
| • | in any other circumstances falling within Article 3(2) of the Prospectus Directive, provided that no such offer of shares of our Class A common stock shall result in a requirement for the publication by us or any underwriter of a prospectus pursuant to Article 3 of the Prospectus Directive. |
For the purposes of this provision, the expression an “offer to the public” in relation to any shares of our Class A common stock in any Relevant Member State means the communication in any form and by any means
168
Table of Contents
of sufficient information on the terms of the offer and any shares of our Class A common stock to be offered so as to enable an investor to decide to purchase any shares of our Class A common stock, as the same may be varied in that Member State by any measure implementing the Prospectus Directive in that Member State, the expression “Prospectus Directive” means Directive 2003/71/EC (and amendments thereto, including the 2010 PD Amending Directive, to the extent implemented in the Relevant Member State), and includes any relevant implementing measure in the Relevant Member State, and the expression “2010 PD Amending Directive” means Directive 2010/73/EU.
United Kingdom
Each underwriter has represented and agreed that:
| • | it has only communicated or caused to be communicated and will only communicate or cause to be communicated an invitation or inducement to engage in investment activity (within the meaning of Section 21 of the Financial Services and Markets Act 2000 (“FSMA”) received by it in connection with the issue or sale of the shares of our Class A common stock in circumstances in which Section 21(1) of the FSMA does not apply to us; and |
| • | it has complied and will comply with all applicable provisions of the FSMA with respect to anything done by it in relation to the shares of our Class A common stock in, from or otherwise involving the United Kingdom. |
Switzerland
The shares of Class A common stock may not be publicly offered in Switzerland and will not be listed on the SIX Swiss Exchange, or SIX, or on any other stock exchange or regulated trading facility in Switzerland. This document has been prepared without regard to the disclosure standards for issuance prospectuses under art. 652a or art. 1156 of the Swiss Code of Obligations or the disclosure standards for listing prospectuses under art. 27 ff. of the SIX Listing Rules or the listing rules of any other stock exchange or regulated trading facility in Switzerland. Neither this document nor any other offering or marketing material relating to the shares or the offering may be publicly distributed or otherwise made publicly available in Switzerland. Neither this document nor any other offering or marketing material relating to the offering, us, or the shares of Class A common stock have been or will be filed with or approved by any Swiss regulatory authority. In particular, this document will not be filed with, and the offer of shares of Class A common stock will not be supervised by, the Swiss Financial Market Supervisory Authority FINMA, or FINMA, and the offer of shares of Class A common stock has not been and will not be authorized under the Swiss Federal Act on Collective Investment Schemes, or CISA. The investor protection afforded to acquirers of interests in collective investment schemes under the CISA does not extend to acquirers of shares of Class A common stock.
Dubai International Financial Centre
This prospectus relates to an Exempt Offer in accordance with the Offered Securities Rules of the Dubai Financial Services Authority, or DFSA. This prospectus is intended for distribution only to persons of a type specified in the Offered Securities Rules of the DFSA. It must not be delivered to, or relied on by, any other person. The DFSA has no responsibility for reviewing or verifying any documents in connection with Exempt Offers. The DFSA has not approved this prospectus nor taken steps to verify the information set forth herein and has no responsibility for the prospectus. The shares of Class A common stock to which this prospectus relates may be illiquid and/or subject to restrictions on their resale. Prospective purchasers of the shares of Class A common stock offered should conduct their own due diligence on the shares of Class A common stock. If you do not understand the contents of this prospectus you should consult an authorized financial advisor.
Australia
No placement document, prospectus, product disclosure statement or other disclosure document has been lodged with the Australian Securities and Investments Commission, or ASIC, in relation to the offering. This
169
Table of Contents
prospectus does not constitute a prospectus, product disclosure statement or other disclosure document under the Corporations Act 2001, or the Corporations Act, and does not purport to include the information required for a prospectus, product disclosure statement or other disclosure document under the Corporations Act.
Any offer in Australia of the shares of Class A common stock may only be made to persons, or the Exempt Investors, who are “sophisticated investors” (within the meaning of section 708(8) of the Corporations Act), “professional investors” (within the meaning of section 708(11) of the Corporations Act) or otherwise pursuant to one or more exemptions contained in section 708 of the Corporations Act so that it is lawful to offer the shares of Class A common stock without disclosure to investors under Chapter 6D of the Corporations Act.
The shares of Class A common stock applied for by Exempt Investors in Australia must not be offered for sale in Australia in the period of 12 months after the date of allotment under the offering, except in circumstances where disclosure to investors under Chapter 6D of the Corporations Act would not be required pursuant to an exemption under section 708 of the Corporations Act or otherwise or where the offer is pursuant to a disclosure document which complies with Chapter 6D of the Corporations Act. Any person acquiring shares of Class A common stock must observe such Australian on-sale restrictions.
This prospectus contains general information only and does not take into account the investment objectives, financial situation or particular needs of any particular person. It does not contain any securities recommendations or financial product advice. Before making an investment decision, investors need to consider whether the information in this prospectus is appropriate for their needs, objectives and circumstances, and, if necessary, seek expert advice on those matters.
New Zealand
The shares of Class A common stock offered hereby have not been offered or sold, and will not be offered or sold, directly or indirectly in New Zealand and no offering materials or advertisements have been or will be distributed in relation to any offer of shares of Class A common stock in New Zealand, in each case other than:
| • | to persons whose principal business is the investment of money or who, in the course of and for the purposes of their business, habitually invest money; or |
| • | to persons who in all the circumstances can properly be regarded as having been selected otherwise than as members of the public; or |
| • | to persons who are each required to pay a minimum subscription price of at least NZ$500,000 for the shares of Class A common stock before the allotment of those shares (disregarding any amounts payable, or paid, out of money lent by the issuer or any associated person of the issuer); or |
| • | in other circumstances where there is no contravention of the Securities Act 1978 of New Zealand (or any statutory modification or re-enactment of, or statutory substitution for, the Securities Act 1978 of New Zealand). |
Hong Kong
The shares of Class A common stock have not been offered or sold and will not be offered or sold in Hong Kong, by means of any document, other than (i) to “professional investors” as defined in the Securities and Futures Ordinance (Cap. 571) of Hong Kong and any rules made under that Ordinance; or (ii) in other circumstances which do not result in the document being a “prospectus” as defined in the Companies (Winding Up and Miscellaneous Provisions) Ordinance (Cap. 32) of Hong Kong or which do not constitute an offer to the public within the meaning of that Ordinance. No advertisement, invitation or document relating to the shares of Class A common stock has been or may be issued or has been or may be in the possession of any person for the purposes of issuance, whether in Hong Kong or elsewhere, which is directed at, or the contents of which are likely to be accessed or read by, the public of Hong Kong (except if permitted to do so under the securities laws
170
Table of Contents
of Hong Kong) other than with respect to shares of Class A common stock which are or are intended to be disposed of only to persons outside Hong Kong or only to “professional investors” as defined in the Securities and Futures Ordinance and any rules made under that Ordinance.
Japan
No registration pursuant to Article 4, paragraph 1 of the Financial Instruments and Exchange Law of Japan (Law No. 25 of 1948, as amended), or the FIEL, has been made or will be made with respect to the solicitation of the application for the acquisition of the shares of Class A common stock.
Accordingly, the shares of Class A common stock have not been, directly or indirectly, offered or sold and will not be, directly or indirectly, offered or sold in Japan or to, or for the benefit of, any resident of Japan (which term as used herein means any person).
Singapore
This prospectus has not been registered as a prospectus with the Monetary Authority of Singapore. Accordingly, this prospectus and any other document or material in connection with the offer or sale, or invitation for subscription or purchase, of the shares of Class A common stock may not be circulated or distributed, nor may the shares of Class A common stock be offered or sold, or be made the subject of an invitation for subscription or purchase, whether directly or indirectly, to persons in Singapore other than (i) to an institutional investor (as defined under Section 4A of the Securities and Futures Act, Chapter 289 of Singapore (the “SFA”)) under Section 274 of the SFA, (ii) to a relevant person (as defined in Section 275(2) of the SFA) pursuant to Section 275(1) of the SFA, or any person pursuant to Section 275(1A) of the SFA, and in accordance with the conditions specified in Section 275 of the SFA or (iii) otherwise pursuant to, and in accordance with the conditions of, any other applicable provision of the SFA, in each case subject to conditions set forth in the SFA.
Where the shares of Class A common stock are subscribed or purchased under Section 275 of the SFA by a relevant person which is a corporation (which is not an accredited investor (as defined in Section 4A of the SFA)) the sole business of which is to hold investments and the entire share capital of which is owned by one or more individuals, each of whom is an accredited investor, the securities (as defined in Section 239(1) of the SFA) of that corporation shall not be transferable for 6 months after that corporation has acquired the shares of Class A common stock under Section 275 of the SFA except: (1) to an institutional investor under Section 274 of the SFA or to a relevant person (as defined in Section 275(2) of the SFA), (2) where such transfer arises from an offer in that corporation’s securities pursuant to Section 275(1A) of the SFA, (3) where no consideration is or will be given for the transfer, (4) where the transfer is by operation of law, (5) as specified in Section 276(7) of the SFA, or (6) as specified in Regulation 32 of the Securities and Futures (Offers of Investments) (Shares and Debentures) Regulations 2005 of Singapore (“Regulation 32”)
Where the shares of Class A common stock are subscribed or purchased under Section 275 of the SFA by a relevant person which is a trust (where the trustee is not an accredited investor (as defined in Section 4A of the SFA)) whose sole purpose is to hold investments and each beneficiary of the trust is an accredited investor, the beneficiaries’ rights and interest (howsoever described) in that trust shall not be transferable for 6 months after that trust has acquired the shares of Class A common stock under Section 275 of the SFA except: (1) to an institutional investor under Section 274 of the SFA or to a relevant person (as defined in Section 275(2) of the SFA), (2) where such transfer arises from an offer that is made on terms that such rights or interest are acquired at a consideration of not less than S$200,000 (or its equivalent in a foreign currency) for each transaction (whether such amount is to be paid for in cash or by exchange of securities or other assets), (3) where no consideration is or will be given for the transfer, (4) where the transfer is by operation of law, (5) as specified in Section 276(7) of the SFA, or (6) as specified in Regulation 32.
171
Table of Contents
The validity of our Class A common stock offered by this prospectus will be passed upon for us by Kirkland & Ellis LLP, Houston, Texas. Certain legal matters in connection with this offering will be passed upon for the underwriters by Vinson & Elkins L.L.P., Houston, Texas.
The consolidated financial statements of our predecessor, Vine Oil & Gas LP, as of and for the years ended December 31, 2020 and 2019 included in this prospectus, have been audited by Deloitte & Touche LLP, an independent registered public accounting firm, as stated in their report appearing herein and elsewhere in the Registration statement. Such financial statements have been so included in reliance upon the report of such firm given upon their authority as experts in accounting and auditing.
The financial statements of Vine Energy as of December 31, 2020 and 2019, included in this prospectus, have been audited by Deloitte & Touche LLP, an independent registered public accounting firm, as stated in their report appearing herein and elsewhere in the Registration statement. Such financial statements have been so included in reliance upon the report of such firm given upon their authority as experts in accounting and auditing.
The combined financial statements of Brix Oil & Gas LP and Harvest Royalties Holdings LP as of and for the years ended December 31, 2020 and 2019, included in this Prospectus have been audited by Deloitte & Touche LLP, independent auditors, as stated in their report appearing herein, and are included in reliance upon the report of such firm given upon their authority as experts in accounting and auditing.
Estimates of our natural gas reserves, related future net cash flows and the present values thereof related to our properties as of December 31, 2020 and 2019 included elsewhere in this prospectus were based upon reserve reports prepared by independent petroleum engineers W.D. Von Gonten & Co. We have included these estimates in reliance on the authority of such firms as experts in such matters.
WHERE YOU CAN FIND MORE INFORMATION
We have filed with the SEC a registration statement on Form S-1 (including the exhibits, schedules and amendments thereto) under the Securities Act, with respect to the shares of our Class A common stock offered hereby. This prospectus does not contain all of the information set forth in the registration statement and the exhibits and schedules thereto and we refer potential investors to the registration statement and the exhibits and schedules filed therewith for further information. Statements contained in this prospectus as to the contents of any contract, agreement or any other document are summaries of the material terms of such contract, agreement or other document and are not necessarily complete. With respect to each of these contracts, agreements or other documents filed as an exhibit to the registration statement, reference is made to the exhibits for a more complete description of the matter involved. A copy of our registration statement, and the exhibits and schedules thereto, may be inspected without charge at the public reference facilities maintained by the SEC at 100 F Street NE, Washington, D.C. 20549. Further information on the operation of the Public Reference Room is available by calling the SEC at 1-800-SEC-0330. The SEC maintains a website that contains reports, proxy and information statements and other information regarding registrants that file electronically with the SEC. The address of the SEC’s website is www.sec.gov.
As a result of the offering, we will become subject to full information requirements of the Exchange Act. We will fulfill our obligations with respect to such requirements by filing periodic reports and other information with the SEC. We intend to furnish our stockholders with annual reports containing financial statements certified by an independent public accounting firm.
172
Table of Contents
| Vine Energy Inc. |
||||
| F-2 | ||||
| Vine Oil & Gas LP |
||||
| Audited Financial Statements as of and for the Years Ended December 31, 2020 and 2019 |
F-15 | |||
| Brix Oil & Gas Holdings LP and Harvest Royalties Holdings LP |
||||
| Audited Combined Financial Statements as of and for the Years Ended December 31, 2020 and 2019 |
F-36 | |||
| Vine Energy Inc. |
||||
| F-54 | ||||
F-1
Table of Contents
UNAUDITED PRO FORMA CONDENSED COMBINED FINANCIAL STATEMENTS
Vine Energy Inc., the issuer in this offering (together with its consolidated subsidiaries following the corporate reorganization and the offering described in this prospectus, “Vine” or the “Company”), is a holding company formed to own an interest in, and act as the sole managing member of, Vine Energy Holdings LLC (“Vine Holdings”). Following this offering and the transactions related thereto, Vine Holdings will own all of the outstanding limited partnership interests in each of Vine Oil & Gas LP and its consolidated subsidiaries (“Vine Oil & Gas”), Brix Oil & Gas Holdings LP and its consolidated subsidiaries (“Brix”) and Harvest Royalties Holdings LP and its consolidated subsidiaries (“Harvest”), the operating subsidiaries through which Vine will operate its assets, and all of the outstanding equity in each of Vine Oil & Gas GP LLC (‘Vine Oil & Gas GP”), Brix Oil & Gas Holdings GP LLC (“Brix GP”) and Harvest Royalties Holdings GP LLC (“Harvest GP”), the general partners of Vine Oil & Gas, Brix and Harvest, respectively.
The unaudited pro forma condensed combined balance sheet as of December 31, 2020 (the “pro forma balance sheet”), and the unaudited pro forma condensed combined statement of operations for the year ended December 31, 2020 (the “pro forma statement of operations,” together with the pro forma balance sheet and the corresponding notes hereto, the “pro forma financial statements”) present the pro forma financial statements of the Company after giving effect to the following transactions (collectively, the “Transactions”):
| • | the corporate reorganization transactions as described under “Corporate Reorganization;” and |
| • | the sale by Vine of shares of its Class A common stock pursuant to this offering, based on an assumed midpoint of the price range set forth on the cover of this prospectus, and the application of the net proceeds as described under “Use of Proceeds” after deducting estimated underwriting discounts and commissions and other offering related expenses payable by Vine in connection with the offering (for purposes of the pro forma financial statements, the “Offering Transactions”). |
The pro forma financial statements have been prepared in accordance with Article 11 of Regulation S-X as amended by the final rule, Release No. 33-10786, “Amendments to Financial Disclosures about Acquired and Disposed Businesses,” using the assumptions set forth in the notes to the pro forma financial statements. The pro forma financial statements have been adjusted to include transaction accounting adjustments in accordance with GAAP, linking the effects of the Transactions to the historical consolidated financial statements of Vine Oil & Gas, the accounting predecessor to the Company, and the historical combined financial statements of Brix and Harvest (collectively, the “Brix Companies”), the entities acquired by Vine Oil & Gas in the merger as described below.
As part of the corporate reorganization transactions described under “Corporate Reorganization,” the Existing Owners who prior to the completion of the corporate reorganization (as defined elsewhere in this prospectus) directly hold equity interests in Vine Oil & Gas, Vine Oil & Gas GP, Brix, Brix GP, Harvest and Harvest GP will contribute such equity interests to Vine Holdings in exchange for newly issued equity in Vine Holdings (the “LLC Interests”) (for purposes of the pro forma financial statements, the “merger”). For purposes of effecting the merger, Vine Oil & Gas and Brix were not considered to be entities under common control for financial reporting purposes, whereas Brix and Harvest were considered to be entities under common management for reporting purposes. Accordingly, Vine Oil & Gas has been identified as the accounting acquirer of the Brix Companies. The merger will be accounted for as a business combination under the acquisition method in accordance with Accounting Standards Codification 805, Business Combinations (“ASC 805”). Under the acquisition method, Vine Oil & Gas will record the assets acquired and liabilities assumed from the Brix Companies at their respective fair values at the acquisition date.
As of the date of this prospectus, management has used currently available information to determine preliminary fair value estimates for the consideration to be received by the Brix Companies upon the consummation of the merger (the “merger consideration”) and the preliminary allocation to the assets acquired and liabilities assumed from the Brix Companies. The merger consideration will be determined based on the closing price of Vine’s common stock on the closing date of the offering.
F-2
Table of Contents
The assumptions and estimates used to determine the preliminary purchase price allocation and fair value adjustments are described in the notes to the pro forma financial statements. The final determination of the fair value of the Brix Companies’ assets and liabilities will be based on the actual net tangible and intangible assets and liabilities of the Brix Companies that exist as of the closing date of the merger and, therefore, cannot be made prior to its completion.
The pro forma financial statements have been prepared from the respective historical consolidated financial statements of Vine Oil & Gas and the historical combined financial statements of the Brix Companies, adjusted to give pro forma effect to the Transactions. The pro forma statement of operations for the year ended December 31, 2020, combine the historical consolidated statements of operations of Vine Oil & Gas and the historical combined statements of operations of the Brix Companies, giving effect to the Transactions as if they had been consummated on January 1, 2020. The pro forma balance sheet combines the historical consolidated balance sheet of Vine Oil & Gas and the historical combined balance sheet of the Brix Companies as of December 31, 2020, giving effect to the Transactions as if they had been consummated on December 31, 2020.
The pro forma financial statements are presented to reflect the Transactions and do not represent what Vine’s financial position or results of operations would have been had the Transactions occurred on the dates noted above, nor do they project the financial position or results of operations of the Company following the Transactions. The transaction accounting adjustments are based on available information and certain assumptions that management believes are factually supportable and are expected to have a continuing impact on Vine’s results of operations with the exception of certain non-recurring charges to be incurred in connection with the Transactions, as further described below. In the opinion of management, all adjustments necessary to present fairly the pro forma financial statements have been made.
Vine anticipates that certain non-recurring charges will be incurred in connection with the Corporate Reorganization. Any such charge could affect the future results of the Company in the period in which such charges are incurred; however, these costs are not expected to be incurred in any period beyond 12 months from the effective date of the merger, which is expected to close the same day as the effective date of the Offering Transactions. Accordingly, the pro forma statement of operations for the year ended December 31, 2020 reflects the effects of these non-recurring charges, $0.1 million of which is included in the historical balance sheet of Vine Oil & Gas as of December 31, 2020, and none of which is included in the historical balance sheet of the Brix Companies as of December 31, 2020.
As a result of the foregoing, the Transaction Accounting Adjustments are preliminary and subject to change as additional information becomes available and additional analysis is performed. The transaction accounting adjustments have been made solely for the purpose of providing the pro forma financial statements presented below. Any increases or decreases in the fair values of assets acquired and liabilities assumed upon completion of the final valuation related to the merger and/or the initial public offering price of the Company’s Class A common stock will result in adjustments to the pro forma balance sheet and if applicable, the pro forma statement of operations. The final purchase price allocation and the transaction accounting adjustments described herein may be materially different than the preliminary amounts reflected in the pro forma financial statements herein.
The pro forma financial statements should be read together with “Corporate Reorganization,” “Use of Proceeds,” “Capitalization,” “Selected Historical and Unaudited Pro Forma Financial Information,” “Management’s Discussion and Analysis of Financial Condition and Results of Operations,” “Certain Relationships and Related Party Transactions,” and the historical financial statements and related notes thereto of Vine Oil & Gas and the Brix Companies included elsewhere in this prospectus.
F-3
Table of Contents
UNAUDITED PRO FORMA CONDENSED COMBINED BALANCE SHEET
As of December 31, 2020
| Historical | Transaction Accounting Adjustments |
Vine Pro Forma | ||||||||||||||||||
| Vine Oil & Gas |
Brix Companies |
Corporate Reorganization |
Offering Transactions |
|||||||||||||||||
| (in thousands) | ||||||||||||||||||||
| Assets |
||||||||||||||||||||
| Current assets: |
||||||||||||||||||||
| Cash and cash equivalents |
$ | 15,517 | $ | 17,660 | $ | — | $ | — | (h) | $ | 33,177 | |||||||||
| Accounts receivable |
77,129 | 15,968 | (4,301 | )(a) | — | 88,796 | ||||||||||||||
| Accounts receivable from affiliates |
— | 21,581 | (21,581 | )(a) | — | — | ||||||||||||||
| Joint interest billing receivables |
18,280 | 6,831 | (7,480 | )(a) | — | 17,631 | ||||||||||||||
| Prepaid and other |
3,626 | 39 | (39 | )(a) | — | 3,626 | ||||||||||||||
|
|
|
|
|
|
|
|
|
|
|
|||||||||||
| Total current assets |
114,552 | 62,079 | (33,401 | ) | — | 143,230 | ||||||||||||||
| Natural gas properties (successful efforts): |
||||||||||||||||||||
| Proved |
2,722,419 | 463,045 | (108,908 | )(a)(b)(c)(d) | — | 3,076,556 | ||||||||||||||
| Unproved |
— | — | 177,491 | (b) | — | 177,491 | ||||||||||||||
| Accumulated depletion |
(1,380,065 | ) | (191,837 | ) | 191,837 | (b) | (1,380,065 | ) | ||||||||||||
|
|
|
|
|
|
|
|
|
|
|
|||||||||||
| Total natural gas properties, net |
1,342,354 | 271,208 | 260,420 | — | 1,873,982 | |||||||||||||||
| Other property and equipment, net |
7,936 | — | — | 7,936 | ||||||||||||||||
| Deferred tax assets, net |
— | — | — | — | (i)(j) | — | ||||||||||||||
| Other |
2,921 | — | — | 7,950 | (h) | 10,871 | ||||||||||||||
|
|
|
|
|
|
|
|
|
|
|
|||||||||||
| Total assets |
$ | 1,467,763 | $ | 333,287 | $ | 227,019 | $ | 7,950 | $ | 2,036,019 | ||||||||||
|
|
|
|
|
|
|
|
|
|
|
|||||||||||
| Liabilities and Equity |
||||||||||||||||||||
| Current liabilities: |
||||||||||||||||||||
| Accounts payable |
$ | 20,986 | $ | 2,658 | $ | (350 | )(a) | $ | — | $ | 23,294 | |||||||||
| Accrued expenses |
90,004 | 12,579 | (599 | )(a)(e) | 11,730 | (h)(k) | 113,714 | |||||||||||||
| Accrued expenses to affiliate |
— | 11,820 | (11,820 | )(a) | — | — | ||||||||||||||
| Revenue payable |
37,552 | 11,786 | (20,382 | )(a) | — | 28,956 | ||||||||||||||
| Derivatives |
19,948 | 8,284 | — | — | 28,232 | |||||||||||||||
|
|
|
|
|
|
|
|
|
|
|
|||||||||||
| Total current liabilities |
168,490 | 47,127 | (33,151 | ) | 11,730 | 194,196 | ||||||||||||||
| Long-term liabilities: |
||||||||||||||||||||
| New RBL |
— | — | — | 9,063 | (h) | 9,063 | ||||||||||||||
| First lien credit facility |
183,569 | — | (183,569 | )(h) | — | |||||||||||||||
| Second lien term loan |
142,947 | — | — | — | 142,947 | |||||||||||||||
| Brix credit facility |
— | 121,760 | 3,240 | (c) | (125,000 | )(h) | — | |||||||||||||
| Long-term debt |
898,225 | — | — | — | 898,225 | |||||||||||||||
| Asset retirement obligations |
21,889 | 888 | — | — | 22,777 | |||||||||||||||
| Derivatives |
38,341 | 5,453 | — | — | 43,794 | |||||||||||||||
| Other |
4,241 | — | — | — | 4,241 | |||||||||||||||
| Refundable deposits |
— | 2,784 | — | — | 2,784 | |||||||||||||||
|
|
|
|
|
|
|
|
|
|
|
|||||||||||
| Total liabilities |
1,457,702 | 178,012 | (29,911 | ) | (287,776 | ) | 1,318,027 | |||||||||||||
| Partners’ capital / stockholders’ equity |
||||||||||||||||||||
| Partners’ capital |
10,061 | 155,275 | (165,336 | )(d)(f) | — | — | ||||||||||||||
| Class A common stock |
— | — | 162 | (b)(f) | 188 | (h) | 350 | |||||||||||||
| Class B common stock |
— | — | 343 | (b)(f) | — | 343 | ||||||||||||||
| Additional paid in capital |
— | — | 213,181 | (b)(f) | 154,385 | (h)(i)(k) | 367,566 | |||||||||||||
| Retained earnings |
— | — | (300 | )(e) | (4,511 | )(h) | (4,811 | ) | ||||||||||||
|
|
|
|
|
|
|
|
|
|
|
|||||||||||
| Total partners’ capital / stockholders equity |
10,061 | 155,275 | 48,050 | 150,062 | 363,448 | |||||||||||||||
|
|
|
|
|
|
|
|
|
|
|
|||||||||||
| Non-controlling interest |
— | — | 208,880 | (f) | 145,664 | (h) | 354,544 | |||||||||||||
|
|
|
|
|
|
|
|
|
|
|
|||||||||||
| Total equity |
10,061 | 155,275 | 256,930 | 295,726 | 717,992 | |||||||||||||||
|
|
|
|
|
|
|
|
|
|
|
|||||||||||
| Total liabilities and equity |
$ | 1,467,763 | $ | 333,287 | $ | 227,019 | $ | 7,950 | $ | 2,036,019 | ||||||||||
|
|
|
|
|
|
|
|
|
|
|
|||||||||||
See accompanying “Notes to the Unaudited Pro Forma Condensed Combined Financial Statements”
F-4
Table of Contents
VINE ENERGY INC.
UNAUDITED PRO FORMA CONDENSED COMBINED STATEMENT OF OPERATIONS
For the Year Ended December 31, 2020
| Historical | Transaction Accounting Adjustments |
Pro Forma Combined Vine |
||||||||||||||||||
| Vine Oil & Gas |
Brix Companies |
Corporate Reorganization |
Offering Transactions |
|||||||||||||||||
| (in thousands, except share and per share amounts) | ||||||||||||||||||||
| Revenue: |
||||||||||||||||||||
| Natural gas sales |
$ | 418,877 | $ | 152,267 | $ | — | $ | — | $ | 571,144 | ||||||||||
| Realized gain on commodity derivatives |
123,875 | 38,043 | — | — | 161,918 | |||||||||||||||
| Unrealized (loss) gain on commodity derivatives |
(164,077 | ) | (40,475 | ) | — | — | (204,552 | ) | ||||||||||||
|
|
|
|
|
|
|
|
|
|
|
|||||||||||
| Total revenue |
378,675 | 149,835 | — | — | 528,510 | |||||||||||||||
| Operating Expenses: |
||||||||||||||||||||
| Lease operating |
47,911 | 17,728 | — | — | 65,639 | |||||||||||||||
| Gathering and treating |
76,770 | 25,204 | — | — | 101,974 | |||||||||||||||
| Production and ad valorem taxes |
15,620 | 2,715 | — | — | 18,335 | |||||||||||||||
| General and administrative |
7,448 | 7,266 | 300 | (e) | — | 15,014 | ||||||||||||||
| Monitoring fee |
7,541 | 1,371 | — | (8,912 | )(l) | — | ||||||||||||||
| Depletion, depreciation and accretion |
347,652 | 92,177 | (47,688 | )(g) | — | 392,141 | ||||||||||||||
| Exploration |
167 | 26 | — | — | 193 | |||||||||||||||
| Strategic |
2,182 | 102 | — | — | 2,284 | |||||||||||||||
| Severance |
326 | 121 | — | — | 447 | |||||||||||||||
| Write-off of deferred IPO expenses |
5,787 | — | — | — | 5,787 | |||||||||||||||
|
|
|
|
|
|
|
|
|
|
|
|||||||||||
| Total operating expenses |
511,404 | 146,710 | (47,388 | ) | (8,912 | ) | 601,814 | |||||||||||||
|
|
|
|
|
|
|
|
|
|
|
|||||||||||
| Operating Income |
(132,729 | ) | 3,125 | 47,388 | 8,912 | (73,304 | ) | |||||||||||||
|
|
|
|
|
|
|
|
|
|
|
|||||||||||
| Interest expense |
(119,248 | ) | (11,928 | ) | 1,412 | (c) | 8,636 | (h) | (121,128 | ) | ||||||||||
| Income Before Income Taxes |
(251,977 | ) | (8,803 | ) | 48,800 | 17,548 | (194,432 | ) | ||||||||||||
|
|
|
|
|
|
|
|
|
|
|
|||||||||||
| Income tax provision |
(217 | ) | — | — | — | (i) | (217 | ) | ||||||||||||
|
|
|
|
|
|
|
|
|
|
|
|||||||||||
| Net Income |
$ | (252,194 | ) | $ | (8,803 | ) | $ | 48,800 | $ | 17,548 | $ | (194,649 | ) | |||||||
|
|
|
|
|
|
|
|
|
|
|
|||||||||||
| Net income attributable to non-controlling interests |
(96,333 | ) | ||||||||||||||||||
|
|
|
|||||||||||||||||||
| Net Income Attributable to Vine Energy Inc. |
$ | (98,316 | ) | |||||||||||||||||
|
|
|
|||||||||||||||||||
| Net Income per Share: |
||||||||||||||||||||
| Basic |
$ | (2.81 | )(m) | |||||||||||||||||
|
|
|
|||||||||||||||||||
| Diluted |
$ | (2.81 | )(m) | |||||||||||||||||
|
|
|
|||||||||||||||||||
| Weighted Average Shares Outstanding: |
||||||||||||||||||||
| Basic |
34,995,149 | (m) | ||||||||||||||||||
|
|
|
|||||||||||||||||||
| Diluted |
34,995,149 | (m) | ||||||||||||||||||
|
|
|
|||||||||||||||||||
See accompanying “Notes to the Unaudited Pro Forma Condensed Combined Financial Statements”
F-5
Table of Contents
NOTES TO UNAUDITED PRO FORMA CONDENSED COMBINED FINANCIAL STATEMENTS
NOTE 1 – BASIS OF PRESENTATION AND DESCRIPTION OF TRANSACTIONS
In connection with the corporate reorganization as described under “Corporate Reorganization,” the Existing Owners prior to the Offering Transactions (as defined elsewhere in this prospectus) will contribute all of their equity interests in Vine Oil & Gas, Vine Oil & Gas GP, Brix, Brix GP, Harvest and Harvest GP to Vine Holdings in exchange for LLC Interests in Vine Holdings to effectuate the merger. For purposes of effecting the merger, Vine Oil & Gas has been identified as the accounting acquirer of the Brix Companies. Vine Oil & Gas is also the accounting predecessor to the Company.
Contemporaneously with the merger as part of the Corporate Reorganization transactions, certain of the Existing Owners will contribute a portion of their LLC Interests, directly or indirectly by contribution of Blocker Entities (as defined elsewhere in this prospectus) holding LLC Interests, to Vine in exchange for newly issued Class A common stock and will contribute such Class A common stock received to Vine Investment II LLC, Brix Investment II LLC and Harvest Investment II LLC, as applicable (collectively, the “Vine Energy Investment II Vehicles”). Additionally, certain of the Existing Owners will exchange the remaining portion of their LLC Interests for a new class of equity in Vine Holdings (the “Vine Units”) and receive newly issued Class B common stock of Vine with no economic rights or value and will contribute such Vine Units and Class B common stock to Vine Investment I, Brix Investment I and Harvest Investment I, as applicable (collectively, the “Vine Energy Investment Vehicles”).The foregoing transactions as described, including the merger, are referred to as the Corporate Reorganization for purposes of the pro forma financial statements.
In connection with the Corporate Reorganization, the Company will also issue shares of its Class A common stock to the public pursuant to this offering, based on an assumed midpoint of the price range set forth on the cover of this prospectus, and the application of the net proceeds as described under “Use of Proceeds” after deducting estimated underwriting discounts and commissions and other offering related expenses payable by Vine (for purposes of the pro forma financial statements, the “Offering Transactions”).
The pro forma financial statements have been prepared in accordance with Article 11 of Regulation S-X as amended by the final rule, Release No. 33-10786, “Amendments to Financial Disclosures about Acquired and Disposed Businesses,” and present the pro forma financial condition and results of operations of the Company based upon the historical financial information of Vine Oil & Gas and the Brix Companies after giving effect to the Transactions and related adjustments set forth in the notes to the pro forma financial statements.
The pro forma balance sheet as of December 31, 2020 gives effect to the Transactions as if they had been completed on December 31, 2020. The pro forma statement of operations for the year ended December 31, 2020, gives effect to the Transactions as if they had been completed on January 1, 2020.
The pro forma financial statements assume no exercise by the underwriters of their option to purchase additional shares of Class A common stock. In addition, the pro forma financial statements do not reflect any cost savings, operating synergies or revenue enhancements that the combined company may achieve as a result of the Transactions.
The pro forma financial statements do not purport to be indicative of the financial position or results of operations of the combined company that would have occurred if the Transactions had occurred on the dates indicated, nor are they indicative of Vine’s future financial position or results of operations. In addition, future results may vary significantly from those reflected in such statements due to factors discussed under “Risk Factors.”
NOTE 2 – PRELIMINARY ACQUISITION ACCOUNTING
The Company currently expects the merger to close in conjunction with this offering for an estimated closing price of approximately $412.5 million, assuming the midpoint of the price range set forth on the
F-6
Table of Contents
cover of this prospectus for the Class A common stock of Vine, for which the LLC Interests will be exchanged. The closing of the merger is subject to the satisfaction of certain regulatory approvals and other customary closing conditions.
Vine Oil & Gas has determined it is the accounting acquirer to the merger which will be accounted for as a business combination under the acquisition method of accounting in accordance with ASC 805. The allocation of the preliminary estimated purchase price with respect to the business combination is based upon management’s estimates of and assumptions related to the fair values of assets to be acquired and liabilities to be assumed as of December 31, 2020, using currently available information. Due to the fact the pro forma financial statements have been prepared based on these preliminary estimates, the final purchase price allocation and the resulting effect on Vine’s financial position and results of operations may differ significantly from the pro forma amounts included herein.
The final purchase price allocation for the business combination will be performed subsequent to closing and adjustments to estimated amounts or recognition of additional assets acquired or liabilities assumed may occur as more detailed analyses are completed and additional information is obtained about the facts and circumstances that existed as of the closing date of the business combination. Vine expects to finalize the purchase price allocation as soon as practicable after completing the business combination.
The preliminary purchase price allocation is subject to change due to several factors, including, but not limited to:
| • | changes in the estimated initial public offering price of the Class A common stock of Vine exchanged as merger consideration; |
| • | changes in the estimated fair value of the Brix Companies’ assets acquired and liabilities assumed as of the closing date of the merger, which could result from additional valuation analysis, changes in future natural gas commodity prices, reserves estimates, discount rates and other factors; and |
| • | the factors described under “Risk Factors”. |
F-7
Table of Contents
The following table presents the preliminary merger consideration and preliminary purchase price allocation of the assets acquired and the liabilities assumed in the business combination:
| Preliminary Merger Consideration |
||||
| (in thousands, except share and per share data) |
||||
| Brix - Corporate Reorganization merger consideration |
23,231,659 | |||
| Harvest - Corporate Reorganization merger consideration |
340,096 | |||
|
|
|
|||
| 23,571,755 | ||||
| IPO price per share of Vine Class A common stock(1) |
$ | 17.50 | ||
|
|
|
|||
| Total merger consideration |
$ | 412,506 | ||
|
(1) Based on an assumed midpoint of the price range set forth on the cover of this prospectus. |
||||
| Preliminary Purchase Price Allocation |
||||
| (in thousands) | ||||
| Assets Acquired |
||||
| Cash and cash equivalents |
$ | 17,660 | ||
| Accounts receivable |
15,968 | |||
| Joint interest billing receivables |
6,831 | |||
| Proved properties |
363,988 | |||
| Unproved |
177,491 | |||
|
|
|
|||
| Total assets to be acquired |
$ | 581,938 | ||
|
|
|
|||
| Liabilities Assumed |
||||
| Accounts payable |
$ | 2,658 | ||
| Accrued expenses |
12,579 | |||
| Revenue payable |
11,786 | |||
| Derivatives |
8,284 | |||
| Brix credit facility |
125,000 | |||
| Asset retirement obligations |
888 | |||
| Derivatives |
5,453 | |||
| Refundable deposits |
2,784 | |||
|
|
|
|||
| Total liabilities to be assumed |
169,432 | |||
|
|
|
|||
| Net assets to be acquired |
$ | 412,506 | ||
|
|
|
|||
NOTE 3 – TRANSACTION ACCOUNTING ADJUSTMENTS
The pro forma financial statements have been adjusted to reflect the Corporate Reorganization and the Offering Transactions as follows:
Corporate Reorganization
| (a) | Reflects the adjustments to eliminate $33.4 million of accounts receivable and prepaid expenses and $33.4 million of accounts payable, accrued expenses and revenue payable due to and from Vine Oil & Gas and the Brix Companies. |
| (b) | Reflects the adjustments related to the exchanges of the equity interests in Brix and Harvest for LLC Interests in Vine Holdings, which represents the merger consideration of $412.5 million allocated to the estimated fair values of the assets acquired and liabilities assumed by Vine Oil & Gas from the Brix Companies. As of the acquisition date, the unproved properties primarily relate to future drilling |
F-8
Table of Contents
| locations that were not included in proved undeveloped reserves. These future drilling locations are located on acreage where the reservoir is known to be productive but have been excluded from proved reserves due to uncertainty on whether the wells will be drilled within the next five years as required by SEC rules in order to be included in proved reserves. |
| (c) | Reflects the adjustments to write-off $3.2 million of historical debt issuance costs as of December 31, 2020, and the elimination of $1.4 million for the year ended December 31, 2020, related to the amortization expense of such costs related to the Brix Credit Facility for which repayment is required upon the completion of an IPO. |
| (d) | Reflects the elimination of the Brix Companies’ historical equity balances in accordance with the acquisition method of accounting. |
| (e) | Reflects the accrual of non-recurring costs of $0.3 million related to the merger, which are not reflected in the historical balance sheets as of December 31, 2020, of Vine Oil & Gas and the Brix Companies. As $0.1 million is reflected in the historical balance sheet of Vine Oil & Gas as of December 31, 2020, the $0.3 million is reflected in the pro forma balance sheet as of December 31, 2020, as a decrease to Retained earnings and an increase to Accrued expenses, and in the pro forma statement of operations for the year ended December 31, 2020, within General and administrative as they will be expensed as incurred by Vine Oil & Gas and the Brix Companies with respect to the merger. These costs are not expected to be incurred in any period beyond 12 months from the closing date of the merger. |
| (f) | Reflects $10.1 million related to the exchange of the equity interests in Vine Oil & Gas for LLC Interests as of December 31, 2020, and the subsequent exchange of a portion of these LLC Interests for shares of Class A common stock of Vine, with the remaining portion exchanged for Vine Units, reflected as the elimination of the historical Partners’ capital of Vine Oil & Gas and a corresponding decrease to Additional paid-in-capital and a reclass to Non-controlling interest with respect to the amount attributable to the Vine Units. |
| (g) | Reflects the pro forma adjustment to depreciation, depletion and amortization expense, which was based on the preliminary purchase price allocation of the estimated fair value of the proved natural gas properties acquired by Vine Oil & Gas. |
Offering Transactions
| (h) | Reflects the issuance by Vine of Class A common stock to the public pursuant to this offering for net proceeds of $303.3 million, based on an assumed midpoint of the price range set forth on the cover of this prospectus, and the application of the net proceeds as described under “Use of Proceeds” after deducting estimated underwriting discounts and commissions and other offering related expenses of $5.2 million payable by Vine as reflected within Accrued expenses on the pro forma balance sheet as of December 31, 2020. As part of the Corporate Reorganization and upon closing of the offering, Vine will contribute the net proceeds of the public offering to Vine Holdings in exchange for newly issued managing units in Vine Holdings. |
Additionally, the Existing Owners will exchange the remaining portion of their LLC Interests for the Vine Units, which together with the Class B common shares will be contributed to the Vine Energy Investment Vehicles, which is reflected as Non-controlling interest on the pro forma balance sheet as of December 31, 2020.
As it relates to the application of the net proceeds, following the offering, Vine intends to direct the net proceeds from this offering to repay in full the Brix Credit Facility assumed in the merger followed by the Vine Oil & Gas RBL, to the extent of the remaining net proceeds available. As the net proceeds of this offering will not be sufficient to repay the Vine Oil & Gas RBL in full, Vine intends to draw $9.1 million on the Vine Oil & Gas New RBL, which will be entered into contemporaneously with this offering.
F-9
Table of Contents
As such, the pro forma balance sheet as of December 31, 2020, reflects the repayment of the Brix Credit Facility (including a call premium) and the Vine Oil & Gas RBL Credit Facility in full (including the write-off of historical debt issuance costs), as well as $9.1 million of borrowings on the Vine Oil & Gas New RBL and $8.0 million of related debt issuance costs.
The pro forma statement of operations for the year ended December 31, 2020, reflects the corresponding net impact to Interest expense, which consists of (i) a decrease related to the historical interest expense associated with the Brix Credit Facility and the Vine Oil & Gas RBL, including the historical amortization of debt issuance costs and unutilized loan commitment fees, (ii) an increase related to the interest expense associated with the Vine Oil & Gas New RBL, including the pro forma amortization of debt issuance costs, and (iii) an increase related to the write-off of the historical debt issuance costs associated with the Vine Oil & Gas RBL.
| (i) | Subsequent to the Transactions, Vine will have no material assets other than its indirect interest in Vine Holdings, which holds, directly or indirectly, all of the operating assets of Vine. Vine Holdings generally will not be subject to U.S. federal income tax, but may be subject to certain U.S. state and local taxes. Vine is a domestic corporation that will be subject to U.S. corporate income tax on its earnings, including its allocable share of the income of Vine Holdings. Accordingly, for purposes of the pro forma financial statements, Vine’s estimated blended statutory U.S. federal and state tax rate was calculated as 25.62%. |
Upon completion of the Offering Transactions, Vine will recognize deferred tax assets and liabilities for the future tax consequences attributable to temporary differences between historical cost basis and tax basis of its assets and liabilities in accordance with ASC 740, Income Taxes (“ASC 740”). For purposes of the pro forma financial statements, Vine has estimated that it has U.S. federal and state net operating loss carryforwards (“NOLs”) of approximately $330.1 million available to offset future taxable income. These NOLs expire beginning in 2035. Based on estimates of the temporary differences, a net deferred tax asset of approximately $39.4 million, offset by a full valuation allowance, is reflected in the pro forma balance sheet, with a corresponding charge to Additional paid-in capital. The full valuation allowance was established based on the Company’s assessment of the significant uncertainty that exists with respect to the future realization of the deferred tax asset in accordance with ASC 740, and as a result, there are no deferred tax assets or deferred tax liabilities reflected in the pro forma balance sheet as of December 31, 2020, and there is no pro forma income tax provision reflected in the pro forma statement of operations for the year ended December 31, 2020.
The amounts to be recorded for the net deferred tax asset have been estimated. The impacts of changes in any of these estimates after the date of purchase will be included in net income. Similarly, the effect of subsequent changes in the enacted tax rates will be included in net income.
| (j) | Prior to the completion of the Offering Transactions, Vine will enter into a tax receivable agreement with Vine Investment, Brix Investment, Harvest Investment, Vine Investment II, Brix Investment II and Harvest Investment II. This agreement generally provides for the payment by Vine Energy to Vine Investment, Brix Investment, Harvest Investment, Vine Investment II, Brix Investment II and Harvest Investment II, respectively, of 85% of the net cash savings, if any, in U.S. federal, state and local income tax that Vine Energy (a) actually realizes with respect to taxable periods ending after December 31, 2025 or (b) is deemed to realize in the event of a change of control (as defined under the Tax Receivable Agreement, which includes certain mergers, asset sales and other forms of business combinations and certain changes to the composition of the Vine Energy board) or the Tax Receivable Agreement terminates early (at our election or as a result of our breach) with respect to any taxable periods ending on or after such change of control or early termination event, in each case, as a result of (i) the tax basis increases resulting from the exchange of Vine Units and the corresponding surrender of an equivalent number of shares of Class B common stock by the Vine Energy Investment Vehicles, Brix Investment and Harvest Investment, respectively, for a number of shares of Class A common stock on a one-for-one basis or, at our option, the receipt of an equivalent amount of cash pursuant to |
F-10
Table of Contents
| the exchange agreement, (ii) certain existing net operating loss carryforwards, disallowed interest expense carryforwards under Section 163(j) of the Code, and tax credit carryforwards attributable to the Blocker Entities previously owned by certain of the Existing Owners, and (iii) imputed interest deemed to be paid by us as a result of, and additional tax basis arising from, any payments we make under the Tax Receivable Agreement. Assuming no material changes in the relevant tax law, we expect that if all of the Vine Units held by the Vine Unit Holders are exchanged, along with a corresponding number of shares of our Class B Common Stock, for newly issued shares of Class A Common Stock and we experienced a change of control or the Tax Receivable Agreement were terminated immediately after this offering, the estimated payment pursuant to the Tax Receivable Agreement would be approximately $211 million (calculated using a discount rate equal to a per annum rate of LIBOR plus 100 basis points, applied against an undiscounted liability of approximately $244 million). The tax receivable agreement will be accounted for as a contingent liability, with amounts accrued when considered probable and reasonably estimable. |
Due to the uncertainty as to the amount and timing of future exchanges of Vine Units by the pre-IPO owners and as to the price per share of our Class A common stock at the time of any such exchanges, the unaudited pro forma financial statements does not assume that exchanges of Vine Units have occurred. Therefore, no increases in tax basis in Vine’s assets or other tax benefits that may be realized as a result of any such future exchanges have been reflected in the unaudited pro forma financial statements.
| (k) | Reflects the accrual of non-recurring costs of $3.8 million related to the Offering Transactions, which primarily represent legal, accounting and other direct costs. Approximately $1.4 million of these costs are reflected in the historical balance sheet as of December 31, 2020, of Vine Oil & Gas with a decrease to Additional paid in capital, with no amounts reflected in the historical balance sheet as of December 31, 2020, of the Brix Companies. Accordingly, $3.8 million is reflected in the pro forma balance sheet as of December 31, 2020, as a decrease to Additional paid in capital. |
| (l) | Reflects the pro forma adjustment to Monitoring fee for the year ended December 31, 2020 as these fees represent a contractual obligation under an Advisory Agreement, which stipulates termination upon the occurrence of a qualifying IPO. |
| (m) | Reflects the basic and diluted pro forma net income (loss) per share for the issuance of shares of Class A common stock in the offering as shown below: |
| Vine Pro Forma | ||||
| For the Year Ended December 31, 2020 |
||||
| (in thousands, |
||||
| Numerator |
||||
| Net income |
$ | (194,649 | ) | |
| Net income attributable to non-controlling interests |
(96,333 | ) | ||
|
|
|
|||
| Net income attributable to Vine Energy Inc. |
$ | (98,316 | ) | |
|
|
|
|||
| Denominator |
||||
| Weighted average shares outstanding (basic) |
34,995,149 | |||
| Effect of dilutive shares(1) |
— | |||
|
|
|
|||
| Weighted average shares outstanding (diluted) |
34,995,149 | |||
| Pro forma net income per share - basic |
$ | (2.81 | ) | |
|
|
|
|||
| Pro forma net income per share - diluted |
$ | (2.81 | ) | |
|
|
|
|||
| (1) | The non-controlling interest owners, which we refer to as the Existing Owners of the Vine Energy Investment Vehicles, have exchange rights which enable the non-controlling interest owners to exchange |
F-11
Table of Contents
| Vine Units, along with surrendering a corresponding number of Class B common stock, for shares of Class A common stock on a one for one basis. The noncontrolling interest owners exchange rights cause the Vine Units, along with surrendering a corresponding number of Class B common stock, to be considered potentially dilutive shares for purposes of dilutive loss per share calculations. For the year ended December 31, 2020, these exchange rights were not included in the computation of diluted loss per share because the effect would have been anti-dilutive. |
NOTE 4 — Supplemental Pro Forma Natural Gas Reserve Information
The following tables present the estimated pro forma combined net proved developed and undeveloped natural gas reserve information as of December 31, 2020, along with a summary of changes in quantities of net remaining proved reserves during the year ended December 31, 2020.
The following estimated pro forma natural gas reserve information is not necessarily indicative of the results that might have occurred had the merger been completed on December 31, 2020 and is not intended to be a projection of future results. Future results may vary significantly from the results reflected because of various factors, including those described under “Risk Factors.”
| Historical | ||||||||||||
| Vine Oil & Gas | Brix Companies | Vine Pro Forma | ||||||||||
| (in MMcf) | ||||||||||||
| Balance at December 31, 2019 |
2,209,833 | 652,194 | 2,862,027 | |||||||||
| Production |
(240,869 | ) | (85,641 | ) | (326,510 | ) | ||||||
| Revision of previous estimates |
(847,273 | ) | (287,359 | ) | (1,134,632 | ) | ||||||
| Acquisitions of reserves |
46,516 | 51,224 | 97,740 | |||||||||
| Extensions and discoveries |
633,911 | 180,963 | 814,874 | |||||||||
|
|
|
|
|
|
|
|||||||
| Balance at December 31, 2020 |
1,802,118 | 511,381 | 2,313,499 | |||||||||
|
|
|
|
|
|
|
|||||||
| Proved developed reserves at: |
||||||||||||
| December 31, 2019 |
447,966 | 138,258 | 586,224 | |||||||||
| December 31, 2020 |
446,243 | 143,917 | 590,160 | |||||||||
| Proved undeveloped reserves at: |
||||||||||||
| December 31, 2019 |
1,761,867 | 513,936 | 2,275,803 | |||||||||
| December 31, 2020 |
1,355,875 | 367,464 | 1,723,339 | |||||||||
Standardized Measure of Discounted Future Net Cash Flows
The following tables present the estimated pro forma discounted future net cash flows at December 31, 2020. The pro forma standardized measure information set forth below gives effect to the merger as if the merger had been completed on December 31, 2020. The disclosures below were determined by referencing the “Standardized Measure of Discounted Future Net Cash Flows” reported in Vine Oil & Gas’ and the Brix Companies’ respective historical financial statements for the year ended December 31, 2020; an explanation of the underlying methodology applied, as required by SEC regulations, can be found within the respective historical financial statements included elsewhere in this prospectus. The calculations assume the continuation of existing economic, operating and contractual conditions at December 31, 2020.
Therefore, the following estimated pro forma standardized measure is not necessarily indicative of the results that might have occurred had the merger been completed on December 31, 2020 and is not intended to be a projection of future results. Future results may vary significantly from the results reflected because of various factors, including those described under “Risk Factors.”
F-12
Table of Contents
Discounted Future Net Cash Flows
The following table sets forth the standardized measure of discounted future net cash flows relating to proved natural gas reserves as of December 31, 2020:
| Historical | ||||||||||||
| Vine Oil & Gas | Brix Companies | Vine Pro Forma | ||||||||||
| (in thousands) | ||||||||||||
| Future natural gas sales |
$ | 3,130,277 | $ | 882,384 | $ | 4,012,661 | ||||||
| Future production costs |
(1,173,122 | ) | (322,655 | ) | (1,495,777 | ) | ||||||
| Future development costs |
(1,103,333 | ) | (303,403 | ) | (1,406,736 | ) | ||||||
| Future income tax expense |
(7,772 | ) | (43,373 | ) | (51,145 | ) | ||||||
|
|
|
|
|
|
|
|||||||
| Future net cash flows |
$ | 846,050 | $ | 212,953 | $ | 1,059,003 | ||||||
| 10% annual discount |
(288,642 | ) | (66,864 | ) | (355,506 | ) | ||||||
|
|
|
|
|
|
|
|||||||
| Standardized measure of discounted future net cash flows |
$ | 557,408 | $ | 146,089 | $ | 703,497 | ||||||
|
|
|
|
|
|
|
|||||||
Sources of Change in Discounted Future Net Cash Flows
The principal changes in the pro forma standardized measure of discounted future net cash flows relating to proved natural gas reserves for the year ended December 31, 2020 are as follows:
| Historical | ||||||||||||
| Vine Oil & Gas | Brix Companies | Vine Pro Forma | ||||||||||
| (in thousands) | ||||||||||||
| Balance at beginning of period |
$ | 988,168 | $ | 299,471 | $ | 1,287,639 | ||||||
| Sales of natural gas, net |
(278,716 | ) | (106,633 | ) | (385,349 | ) | ||||||
| Revision of previous quantity estimates and extensions |
(76,715 | ) | (6,968 | ) | (83,683 | ) | ||||||
| Acquisitions of reserves |
4,297 | 10,965 | 15,262 | |||||||||
| Previously estimated development costs incurred |
187,952 | 57,863 | 245,815 | |||||||||
| Net changes in future development costs |
44,210 | 14,020 | 58,230 | |||||||||
| Net changes in prices |
(388,308 | ) | (126,299 | ) | (514,607 | ) | ||||||
| Accretion of discount |
98,816 | 29,947 | 128,763 | |||||||||
| Net change in income taxes |
(5,228 | ) | (31,493 | ) | (36,721 | ) | ||||||
| Changes in timing and other differences |
(17,068 | ) | 5,216 | (11,852 | ) | |||||||
|
|
|
|
|
|
|
|||||||
| Balance at end of period |
$ | 557,408 | $ | 146,089 | $ | 703,497 | ||||||
|
|
|
|
|
|
|
|||||||
F-13
Table of Contents
REPORT OF INDEPENDENT REGISTERED PUBLIC ACCOUNTING FIRM
To the Board of Managers and Partners of Vine Oil & Gas LP
Opinion on the Financial Statements
We have audited the accompanying consolidated balance sheets of Vine Oil & Gas LP and subsidiaries (the “Partnership”) as of December 31, 2020 and 2019, the related consolidated statements of operations, partners’ capital, and cash flow for each of the two years in the period ended December 31, 2020, and the related notes (collectively referred to as the “financial statements”). In our opinion, the financial statements present fairly, in all material respects, the financial position of the Partnership as of December 31, 2020 and 2019, and the results of its operations and its cash flows for each of the two years in the period ended December 31, 2020, in conformity with accounting principles generally accepted in the United States of America.
Basis for Opinion
These financial statements are the responsibility of the Partnership’s management. Our responsibility is to express an opinion on the Partnership’s financial statements based on our audits. We are a public accounting firm registered with the Public Company Accounting Oversight Board (United States) (PCAOB) and are required to be independent with respect to the Partnership in accordance with the U.S. federal securities laws and the applicable rules and regulations of the Securities and Exchange Commission and the PCAOB.
We conducted our audits in accordance with the standards of the PCAOB. Those standards require that we plan and perform the audit to obtain reasonable assurance about whether the financial statements are free of material misstatement, whether due to error or fraud. The Partnership is not required to have, nor were we engaged to perform, an audit of its internal control over financial reporting. As part of our audits, we are required to obtain an understanding of internal control over financial reporting but not for the purpose of expressing an opinion on the effectiveness of the Partnership’s internal control over financial reporting. Accordingly, we express no such opinion.
Our audits included performing procedures to assess the risks of material misstatement of the financial statements, whether due to error or fraud, and performing procedures that respond to those risks. Such procedures included examining, on a test basis, evidence regarding the amounts and disclosures in the financial statements. Our audits also included evaluating the accounting principles used and significant estimates made by management, as well as evaluating the overall presentation of the financial statements. We believe that our audits provide a reasonable basis for our opinion.
/s/ DELOITTE & TOUCHE LLP
Dallas, Texas
February 17, 2021
We have served as the Partnership’s auditor since 2015.
F-14
Table of Contents
VINE OIL & GAS LP
CONSOLIDATED STATEMENTS OF OPERATIONS
(Amounts in thousands)
| For the Year Ended December 31, |
||||||||
| 2020 | 2019 | |||||||
| Revenue: |
||||||||
| Natural gas sales |
$ | 418,877 | $ | 445,589 | ||||
| Realized gain on commodity derivatives |
123,875 | 39,679 | ||||||
| Unrealized (loss) gain on commodity derivatives |
(164,077 | ) | 101,239 | |||||
|
|
|
|
|
|||||
| Total revenue |
378,675 | 586,507 | ||||||
| Operating Expenses: |
||||||||
| Lease operating |
47,911 | 46,247 | ||||||
| Gathering and treating |
76,770 | 37,955 | ||||||
| Production and ad valorem taxes |
15,620 | 18,539 | ||||||
| General and administrative |
7,448 | 7,842 | ||||||
| Monitoring fee |
7,541 | 7,011 | ||||||
| Depletion, depreciation and accretion |
347,652 | 327,659 | ||||||
| Exploration |
167 | 886 | ||||||
| Strategic |
2,182 | 853 | ||||||
| Severance |
326 | — | ||||||
| Write-off of deferred IPO costs |
5,787 | 2,825 | ||||||
|
|
|
|
|
|||||
| Total operating expenses |
511,404 | 449,817 | ||||||
|
|
|
|
|
|||||
| Operating income |
(132,729 | ) | 136,690 | |||||
|
|
|
|
|
|||||
| Interest expense |
(119,248 | ) | (112,198 | ) | ||||
|
|
|
|
|
|||||
| Income before income taxes |
(251,977 | ) | 24,492 | |||||
|
|
|
|
|
|||||
| Income tax provision |
(217 | ) | (496 | ) | ||||
|
|
|
|
|
|||||
| Net income |
$ | (252,194 | ) | $ | 23,996 | |||
|
|
|
|
|
|||||
The accompanying notes are integral to the financial statements.
F-15
Table of Contents
VINE OIL & GAS LP
(Amounts in thousands)
| December 31, 2020 | December 31, 2019 | |||||||
| Assets |
||||||||
| Current assets: |
||||||||
| Cash and cash equivalents |
$ | 15,517 | $ | 18,286 | ||||
| Accounts receivable |
77,129 | 56,316 | ||||||
| Joint interest billing receivables |
18,280 | 23,174 | ||||||
| Derivatives |
— | 83,951 | ||||||
| Prepaid and other |
3,626 | 890 | ||||||
|
|
|
|
|
|||||
| Total current assets |
114,552 | 182,617 | ||||||
| Natural gas properties (successful efforts): |
||||||||
| Proved |
2,722,419 | 2,475,619 | ||||||
| Accumulated depletion |
(1,380,065 | ) | (1,039,643 | ) | ||||
|
|
|
|
|
|||||
| Total natural gas properties, net |
1,342,354 | 1,435,976 | ||||||
| Other property and equipment, net |
7,936 | 4,550 | ||||||
| Derivatives |
— | 21,837 | ||||||
| Other |
2,921 | 13,120 | ||||||
|
|
|
|
|
|||||
| Total assets |
$ | 1,467,763 | $ | 1,658,100 | ||||
|
|
|
|
|
|||||
| Liabilities and Partners’ Capital |
||||||||
| Current liabilities: |
||||||||
| Accounts payable |
$ | 20,986 | $ | 10,493 | ||||
| Accrued expenses |
90,004 | 86,246 | ||||||
| Revenue payable |
37,552 | 24,709 | ||||||
| Gas gathering liability |
— | 2,043 | ||||||
| Derivatives |
19,948 | — | ||||||
|
|
|
|
|
|||||
| Total current liabilities |
168,490 | 123,491 | ||||||
| Long-term liabilities: |
||||||||
| First lien credit facility |
183,569 | 325,319 | ||||||
| Second lien term loan |
142,947 | — | ||||||
| Unsecured debt |
898,225 | 893,239 | ||||||
| Asset retirement obligations |
21,889 | 19,504 | ||||||
| Derivatives |
38,341 | — | ||||||
| Other |
4,241 | 4,292 | ||||||
|
|
|
|
|
|||||
| Total liabilities |
1,457,702 | 1,365,845 | ||||||
| Commitments and contingencies |
||||||||
| Partners’ capital |
10,061 | 292,255 | ||||||
|
|
|
|
|
|||||
| Total liabilities and partners’ capital |
$ | 1,467,763 | $ | 1,658,100 | ||||
|
|
|
|
|
|||||
The accompanying notes are integral to the financial statements.
F-16
Table of Contents
VINE OIL & GAS LP
CONSOLIDATED STATEMENTS OF PARTNERS’ CAPITAL
(Amounts in thousands)
| Balance at December 31, 2018 |
$ | 268,259 | ||
| Net income |
23,996 | |||
|
|
|
|||
| Balance at December 31, 2019 |
$ | 292,255 | ||
|
|
|
|||
| Distribution to parent |
(30,000 | ) | ||
| Net income |
(252,194 | ) | ||
|
|
|
|||
| Balance at December 31, 2020 |
$ | 10,061 | ||
|
|
|
The accompanying notes are integral to the financial statements.
F-17
Table of Contents
VINE OIL & GAS LP
CONSOLIDATED STATEMENTS OF CASH FLOW
(Amounts in thousands)
| For the Year Ended December 31, | ||||||||
| 2020 | 2019 | |||||||
| Operating Activities |
||||||||
| Net income |
$ | (252,194 | ) | $ | 23,996 | |||
| Adjustments to reconcile net income to operating cash flow: |
||||||||
| Depletion, depreciation and accretion |
347,652 | 327,659 | ||||||
| Amortization of financing costs |
16,652 | 11,513 | ||||||
| Amortization of debt discount |
954 | 871 | ||||||
| Non-cash loss on extinguishment of Superpriority |
4,509 | — | ||||||
| Non-cash write-off of deferred IPO costs |
5,787 | 2,825 | ||||||
| Unrealized loss (gain) on commodity derivatives |
164,077 | (101,239 | ) | |||||
| Unrealized loss on interest rate derivatives |
— | 1,474 | ||||||
| Volumetric and production adjustment to gas gathering liability |
(2,567 | ) | (29,085 | ) | ||||
| Other |
(182 | ) | (18 | ) | ||||
| Changes in assets and liabilities: |
||||||||
| Accounts receivable |
(20,813 | ) | 37,243 | |||||
| Joint interest billing receivables |
4,894 | 2,236 | ||||||
| Accounts payable and accrued expenses |
14,343 | 7,946 | ||||||
| Revenue payable |
12,843 | (15,493 | ) | |||||
| Other |
(781 | ) | 771 | |||||
|
|
|
|
|
|||||
| Operating cash flow |
295,174 | 270,699 | ||||||
| Investing Activities |
||||||||
| Proceeds from asset sales |
230 | 5,839 | ||||||
| Capital expenditures |
(252,608 | ) | (287,032 | ) | ||||
|
|
|
|
|
|||||
| Investing cash flow |
(252,378 | ) | (281,193 | ) | ||||
| Financing Activities |
||||||||
| Proceeds from first lien credit facility |
100,000 | 160,000 | ||||||
| Payments on first lien credit facility |
(250,000 | ) | (150,000 | ) | ||||
| Proceeds from second lien term loan |
150,000 | — | ||||||
| Deferred financing costs paid |
(15,565 | ) | (2,250 | ) | ||||
| Distribution to parent |
(30,000 | ) | — | |||||
|
|
|
|
|
|||||
| Financing cash flow |
(45,565 | ) | 7,750 | |||||
| Net decrease in cash and cash equivalents |
(2,769 | ) | (2,744 | ) | ||||
| Cash and cash equivalents at beginning of period |
18,286 | 21,030 | ||||||
|
|
|
|
|
|||||
| Cash and cash equivalents at end of period |
$ | 15,517 | $ | 18,286 | ||||
|
|
|
|
|
|||||
| Supplemental information: |
||||||||
| Cash paid for interest |
$ | 97,096 | $ | 99,601 | ||||
| Cash paid for taxes |
$ | 273 | $ | 600 | ||||
| Non-cash transactions: |
||||||||
| Accrued capital expenditures |
$ | 24,552 | $ | 22,604 | ||||
| Accrued financing activities |
$ | 540 | $ | 3,843 | ||||
The accompanying notes are integral to the financial statements.
F-18
Table of Contents
VINE OIL & GAS LP
NOTES TO FINANCIAL STATEMENTS
(Amounts in thousands)
| 1. | Nature of Business and Organization |
We are engaged in the development, production and sale of natural gas in the Haynesville and Mid-Bossier plays of the Haynesville Basin in Northern Louisiana. Our executive offices are located in Plano, Texas.
We were organized as a Delaware partnership in 2014. We are wholly owned by Vine Oil & Gas Parent LP and Vine Oil & Gas GP LLC with ultimate principal ownership being funds managed by The Blackstone Group Inc. (collectively “Blackstone”), which own 99% of the outstanding partner units of Vine Oil & Gas Parent LP and Vine Oil & Gas GP LLC. The accompanying financial statements consolidate our subsidiaries, including Vine Management Services LLC (“VMS”), which provides management services to us and certain other managed entities, and Vine Minerals LLC, which owns producing and nonproducing mineral, royalty, and overriding royalty interests. We have eliminated intercompany balances and transactions in consolidation.
| 2. | Summary of Significant Accounting Policies |
Basis of Accounting and Presentation
These financial statements have been prepared in accordance with accounting principles generally accepted in the United States (“GAAP”). We had no items of other comprehensive income for 2020 or 2019. We operate only one reportable segment. We have evaluated subsequent events through February 17, 2021, the date on which these financial statements were available for issuance.
Use of Estimates
Preparation of financial statements in conformity with GAAP requires us to make estimates and assumptions that affect the reported amount of assets and liabilities, the disclosure of contingent assets and liabilities at the date of the financial statements and reported revenue and expenses during the reporting period. Estimates of reserves are used to determine depletion and to conduct impairment analysis. Estimating reserves is inherently uncertain, including the projection of future rates of production and the timing of development expenditures.
Further, the COVID-19 outbreak has significantly decreased the demand for hydrocarbons, particularly oil. Concurrently, deterioration of production agreements between key global oil producers has led to an increase in supply. The confluence of these factors has caused significant volatility in oil and gas prices and has increased the inherent uncertainty in the estimate of reserves.
Cash and Cash Equivalents
We consider all highly liquid investments with an original maturity of three months or less to be cash equivalents. We had no cash equivalents as of December 31, 2020 or 2019.
Receivables
Accounts receivable from joint interest billings sent to our working interest partners are generally collected within 30 to 60 days after they are billed, which usually occurs within 10 days after each month’s end. Other accounts receivable principally consists of amounts due from purchasers of our gas and settled, but not yet paid, derivative receivables. We review our accounts receivable periodically, and if necessary, reduce the carrying amount by a valuation allowance that reflects our best estimate of all potentially uncollectible amounts. We have no allowances for uncollectible accounts receivable as of December 31, 2020 or 2019.
F-19
Table of Contents
Natural Gas Properties
We utilize the successful efforts method of accounting for our natural gas producing activities, through which, we capitalize all property acquisition costs and costs of development wells. Costs for exploratory wells are capitalized until we complete an evaluation of whether the wells yield proved reserves. If an exploratory well does not yield proved reserves, we expense those costs.
We recognize geological and geophysical costs, including seismic studies, as exploration expense when incurred. We recognize expenditures for maintenance, repairs and minor renewals necessary to maintain properties in operating condition as workover expense when incurred. We capitalize major betterments, replacements and renewals as additions to property and equipment.
We deplete proved natural gas properties on a units-of-production basis based on production and estimates of proved reserves. Because all of our natural gas properties are located in a single basin, we assess depletion on a single cost center. We deplete capitalized costs of proved mineral interests over total estimated proved reserves and capitalized costs of wells and related equipment and facilities over estimated proved developed reserves. If applicable, we capitalize interest expense related to significant investments in unproved properties that are not being depleted.
We review our proved properties for impairment annually in the fourth quarter, or whenever events and circumstances indicate that a decline in the recoverability of their carrying values may have occurred. We estimate the expected undiscounted future cash flows of our properties and compare such undiscounted future cash flows to the carrying amount of the properties. If the carrying amount exceeds the estimated undiscounted future cash flows, we adjust the carrying amount of the properties to estimated fair value. Our impairment analysis for natural gas properties does not include value associated with our derivative portfolio. There were no impairments on proved natural gas properties for either 2020 or 2019.
We review our unproved properties, if any, for impairment annually in the fourth quarter, or whenever events and circumstances indicate that a decline in the recoverability of their carrying values may have occurred.
Other Property and Equipment
We record other property and equipment at cost and depreciate them on a straight-line basis over the individual asset’s useful life, which ranges from 5-25 years, once placed into service.
We evaluate other property and equipment for potential impairment annually in the fourth quarter, or whenever indicators of impairment are present. Circumstances that could indicate potential impairment include significant adverse changes in industry trends and the economic outlook, legal actions, regulatory changes and significant declines in utilization rates.
If we determine that other property and equipment are potentially impaired, we estimate the future undiscounted net cash flow from the use and eventual disposition of the assets grouped at the lowest level at which cash flows can be identified. If that estimate is less than the carrying value of the assets, we recognize an impairment loss equal to the assets’ carrying values in excess of their estimated fair values. There were no impairments on such assets for either 2020 or 2019.
Other Assets
In conjunction with a possible initial public offering (“IPO”), costs incurred related to the IPO such as legal, audit, tax and other professional services are capitalized as deferred equity issuance costs in other non-current assets. In the first quarter of 2020, we wrote-off deferred IPO costs related to years that will no longer be presented in any future potential filings. In the fourth quarter of 2020, we incurred new costs related to a possible IPO and included them in prepaid and other assets.
F-20
Table of Contents
We also have prepaid fees related to the use of gathering lines that have been installed and are owned by our
third-party gatherer. These costs are amortized to gathering expense over the estimated useful life of the
gathering lines.
Additionally, we have deferred finance costs associated with our undrawn Third Lien Revolving Credit Facility (as defined below) in other non-current assets. These costs are amortized to interest expense over the term of the facility.
Gathering Liability
In connection with the Shell Acquisition, we became party to two gathering contracts that required delivery of minimum volumes of natural gas for each annual contract period. These gathering contracts required annual settlement payments for any shortfalls in the gathered volumes. Our obligation for the gathering contracts was initially measured at fair value on the acquisition date and represented the expected volume shortfall over the remaining contract period. The fair value was determined using estimated future production volumes, future inflation factors and our weighted average cost of capital. We recognized accretion expense for the impact of increasing the discounted liability to its estimated settlement value. The difference, if any, between the estimated payments recognized at inception and actual current contract period payments required was recorded as a volumetric and production adjustment to gathering and treating expense. In January 2020, we fulfilled our commitment under these gathering contracts.
Asset Retirement Obligations
Asset retirement obligations (“ARO”) consist of future abandonment costs on our natural gas properties. We record the fair value of the ARO in the period in which it is legally or contractually incurred. Upon initial recognition of the ARO, we capitalize an asset retirement cost by increasing the carrying amount of natural gas properties by the same amount as the liability. In periods subsequent to initial measurement, we recognize the ARO expense through depletion. Changes in the ARO are recognized for both the passage of time and revisions to either the timing or the amount of estimated cash flows. We recognize accretion expense for the impact of increasing the discounted liability to its estimated settlement value.
Revenue Recognition
Sales under our natural gas contracts are generally considered performed when title transfers to the purchaser at the tailgate of our gatherer’s plant. We recognize revenue when control transfers to the purchasers and we receive an agreed-upon index price, net of any price differentials.
Derivatives
To mitigate risks associated with market volatility, we enter into derivative financial instruments, including commodity swaps, to reduce the effects of natural gas price fluctuations on our production and interest rate swaps to stabilize LIBOR fluctuations.
We recognize our derivatives as an asset or liability measured at fair value, with their changes in fair value recognized in earnings. Our derivatives feature monthly settlements with the counterparties, the impact of which is reflected as an operating cash flow. We have not designated any derivative instruments as hedges and do not enter into such instruments for speculative purposes.
The fair value of our commodity swaps is determined by references to published future market prices and interest rates. We estimate the fair value of our interest rate swaps primarily by using internal discounted cash flow calculations based upon forward interest rates. The most significant variable to our cash flow calculations is our estimate of future interest rates. We base these estimates on our own internal model that utilizes forward curves such as LIBOR or the Federal Funds Rate provided by third parties. The resulting estimated future cash inflows or outflows over the lives of the contracts are discounted using LIBOR and money market futures rates.
F-21
Table of Contents
Income Taxes
As a limited partnership, we are not a taxpaying entity for federal income tax purposes. As such, we have not recorded federal income tax expense. Our limited partners are responsible for federal income taxes on their respective share of taxable income. We file federal income tax returns in the United States. We incurred de minimis state taxes, and the accompanying financial statements reflect such taxes.
VMS is taxed as a C-corporation, recognizing income taxes using the asset and liability method. Deferred tax assets and liabilities are recognized for the future tax consequences attributable to differences between the financial statement carrying values and tax bases of assets and liabilities. Deferred tax assets and liabilities are measured using enacted tax rates expected to apply to taxable income in the years in which these temporary differences are expected to be recovered or settled. We recognize the effect of changes in tax rates in income in the period when enacted. In addition, we establish a valuation allowance if it is determined that it is more likely than not that some portion of the deferred tax asset will not be realized. There were no deferred tax assets, liabilities or valuation allowances as of December 31, 2020 or 2019.
As of December 31, 2020, our 2019, 2018 and 2017 tax returns remained open to possible examination by the tax authorities, and none are currently under examination by any tax authorities. We have incurred no penalties or interest related to tax matters, and we have no uncertain tax positions.
Concentrations of Credit Risk
Financial instruments that potentially subject us to a concentration of credit risk consist principally of cash, joint interest receivables, accounts receivable and derivative financial instruments. We maintain cash deposits primarily in one financial institution, the total of which regularly exceeds the amount covered by insurance provided by the U.S. Federal Deposit Insurance Corporation. We have not experienced any losses related to amounts in excess of such limits.
We utilize an unaffiliated third party to market a portion of our gas production to various purchasers, which
consist of credit-worthy counterparties, including major corporations and super majors, in our industry. This third party collects directly from the purchasers and remits to us the total of all amounts collected on our behalf less their fee for making such sales. Additionally, we sell a portion of our gas to purchasers who remit directly to us under firm sales contracts. Our receivables from purchasers are generally unsecured; however, we have not experienced any credit losses to date.
The counterparties to our derivatives are financial institutions that participate in our first lien credit facility and that we believe have acceptable credit ratings.
Generally, we have the right to offset future revenue against unpaid joint interest billing charges for parties
whose gas we market on their behalf.
Strategic
Strategic costs include amounts paid to external parties for potential acquisitions or other non-recurring projects.
Recently Issued and Applicable Accounting Standards
Not Yet Adopted
The FASB issued ASU No. 2016-13, “Financial Instruments — Credit Losses (Topic 326): Measurement of Credit Losses on Financial Instruments” which introduces guidance for estimating credit losses on certain types of financial instruments based on expected losses and the timing of the recognition of such losses. We expect to adopt this guidance January 1, 2023, however, the impact is not expected to be material.
The FASB issued ASU No. 2016-02, Leases (Topic 842) which requires all leases greater than one year to be recognized as assets and liabilities. This ASU becomes effective for us beginning January 1, 2022 and we
F-22
Table of Contents
expect to adopt using a modified retrospective approach with certain available practical expedients. Oil and gas leases are excluded from the guidance. We are currently reviewing the contracts to which this new guidance applies and evaluating the new guidance to determine the impact it will have on our consolidated financial statements. We expect the adoption of this guidance will increase the assets and liabilities recorded on our Balance Sheet and are continuing to evaluate the impact of this standard on our statement of operations and cash flow. We also expect to elect the practical expedient to retain our existing accounting for land easements which were not previously accounted for as leases.
| 3. | Property and Equipment |
Natural Gas Properties
| December 31, | ||||||||
| 2020 | 2019 | |||||||
| Proved natural gas properties subject to depletion |
$ | 2,722,419 | $ | 2,475,619 | ||||
| Less: Accumulated depletion |
(1,380,065 | ) | (1,039,643 | ) | ||||
|
|
|
|
|
|||||
| Natural gas properties, net |
$ | 1,342,354 | $ | 1,435,976 | ||||
|
|
|
|
|
|||||
We recognized depletion expense for 2020 and 2019 of $340.4 million and $319.5 million, respectively.
Other Property and Equipment
| December 31, | ||||||||
| 2020 | 2019 | |||||||
| Software development costs |
$ | 1,710 | $ | 8,253 | ||||
| Saltwater disposal wells |
14,262 | 6,601 | ||||||
| Other |
4,948 | 4,836 | ||||||
|
|
|
|
|
|||||
| Total cost |
20,920 | 19,690 | ||||||
| Accumulated depreciation |
(12,984 | ) | (15,140 | ) | ||||
|
|
|
|
|
|||||
| Other property and equipment, net |
$ | 7,936 | $ | 4,550 | ||||
|
|
|
|
|
|||||
We recognized depreciation expense for 2020 and 2019 of $5.4 million and $4.4 million, respectively.
| 4. | ARO |
| December 31, | ||||||||
| 2020 | 2019 | |||||||
| Balance, beginning of period |
$ | 19,504 | $ | 17,680 | ||||
| Accretion expense |
1,354 | 1,196 | ||||||
| Liabilities incurred |
1,078 | 628 | ||||||
| Liabilities settled and divested |
(47 | ) | — | |||||
|
|
|
|
|
|||||
| Balance, end of period |
$ | 21,889 | $ | 19,504 | ||||
|
|
|
|
|
|||||
F-23
Table of Contents
| 5. | Gathering Liability |
| December 31, | ||||||||
| 2020 | 2019 | |||||||
| Balance, beginning of period |
$ | 2,043 | $ | 28,526 | ||||
| Accretion expense |
524 | 2,602 | ||||||
| Volumetric and production adjustment to gas gathering liability |
(2,567 | ) | (29,085 | ) | ||||
|
|
|
|
|
|||||
| Balance, end of period |
$ | — | $ | 2,043 | ||||
|
|
|
|
|
|||||
| 6. | Accrued Expenses |
| December 31, | ||||||||
| 2020 | 2019 | |||||||
| Capital expenditures |
$ | 20,808 | $ | 21,795 | ||||
| Operating expenses |
30,554 | 27,022 | ||||||
| Royalty owner suspense |
7,891 | 7,569 | ||||||
| Compensation-related |
9,432 | 7,823 | ||||||
| Interest expense |
18,388 | 17,811 | ||||||
| Other |
2,931 | 4,226 | ||||||
|
|
|
|
|
|||||
| Accrued expenses |
$ | 90,004 | $ | 86,246 | ||||
|
|
|
|
|
|||||
| 7. | Long-Term Debt |
First Lien Credit Facility
RBL
Our RBL, as amended in December 2020, matures on January 15, 2023. As of December 31, 2020, the RBL had a borrowing base of $300 million, with $190 million outstanding. Borrowings under the RBL bear interest at LIBOR plus an applicable margin, which ranges from 2.50% to 3.50% based on the ratio of outstanding revolving credit to the borrowing base. In addition, a commitment fee between 0.375% and 0.5% per annum is charged on the unutilized balance of the committed borrowing base and is included in interest expense.
There are no prepayment premiums or penalties associated with the RBL. The borrowing base is subject to mandatory quarterly reductions to $100 million at December 31, 2022 through maturity. Other than these quarterly reductions in availability, there are no borrowing base redeterminations.
As of December 31, 2020, we had outstanding letters of credit of $24.9 million and $85.1 million of available borrowing capacity under the RBL. As of December 31, 2020, borrowings under the RBL had an interest rate of 3.15%. Total interest expense relating to the RBL, including amortization of deferred debt issuance costs and unutilized commitment fees, for 2020 and 2019, was $11.2 million and $12.4 million, respectively. As of December 31, 2020, the fair value of the RBL approximates carrying value as it bears interest at variable rates over the term of the loan.
Superpriority Facility
In February 2017, we entered into an incremental agreement evidencing the Superpriority facility. Upon the execution of the Superpriority agreement, we drew $150 million aggregate principal, incurring discounts and up-front fees totaling $19.5 million. We used the proceeds to reduce our outstanding RBL borrowings by $105 million, retaining the remainder for working capital purposes. Total interest expense relating to the Superpriority, including amortization and write off of debt issuance costs and unutilized commitment fees, for 2020 and 2019 was $12.9 million and $10.8 million, respectively.
F-24
Table of Contents
On December 30, 2020, using proceeds from the issuance of the Second Lien Term Loan, along with cash on hand, we repaid and retired the aggregate $150 million principal outstanding on the Superpriority.
Second Lien Term Loan
On December 30, 2020, we entered into the $150 million Second Lien Term Loan and used the proceeds, along with cash on hand, to repay the aggregate principal amount of loans outstanding under the Superpriority in connection with the entry into the amendment to and extension of the RBL.
The Second Lien Term Loan was fully drawn at closing. The Second Lien Term Loan bears interest at a rate equal to LIBOR, with a floor of 0.75%, plus 8.75% per annum, payable monthly, and matures on the earlier to occur of (a) December 30, 2025 and (b) 90 days prior to the maturity of the 9.75% Notes or 8.75% Notes, to the extent specified amounts of such indebtedness remain outstanding. The Second Lien Term Loan is redeemable beginning June 30, 2022 at par plus 2%, stepping down to par plus 1% on June 30, 2023 and at par on June 30, 2024 and thereafter.
The Second Lien Term Loan is secured on a junior lien basis by all our assets and stock and the subsidiaries that secure the RBL. As of December 31, 2020, the fair value of the Second Lien Term Loans approximates carrying value as it bears interest at variable rates over the term of the loan.
Third Lien Revolving Credit Facility
On December 30, 2020, the Company’s $280 million Second Lien Revolving Credit Agreement, dated December 30, 2019, was subordinated to a Third Lien Revolving Credit Facility (the “Third Lien Facility”), and its size increased to $330 million. Additionally, the interest rate was increased to a rate equal to LIBOR plus 9.75% per annum, payable quarterly. The Third Lien Facility matures on March 15, 2023. In addition, a commitment fee of 0.424% per annum is charged on the unutilized balance of the committed borrowing base and is included in interest expense. Proceeds of the loans under the Third Lien Facility may be used to make open market purchase of the 8.75% Notes or 9.75% Notes and, subject to Lender approval, other general corporate purposes. The Third Lien Facility is undrawn as of December 31, 2020. Total interest expense relating to the Third Lien Facility, including amortization of deferred debt issuance costs and unutilized commitment fees for 2020 was $6.1 million.
Unsecured debt
8.75% Notes
In October 2017, we issued $530 million aggregate principal amount of 8.75% Senior Notes due 2023 (8.75% Notes) at 99% of par, and in connection therewith, we incurred discounts and upfront fees totaling
$17.9 million. Interest is accrued and paid semi-annually on April 15 and October 15. Total interest expense related to the 8.75% Notes, including amortization of original issue discount and deferred finance costs was $49.6 million for both 2020 and 2019. As of December 31, 2020, the fair value of the 8.75% Notes was approximately $427.6 million.
The 8.75% Notes are guaranteed on a senior unsecured basis by all our subsidiaries. Subsequent to October 15, 2020, we may redeem the 8.75% Notes at a redemption price (plus accrued and unpaid interest) equal to par plus 6.563% for October 2020 through October 2021, 4.375% from October 2021 through April 2022 and 0% thereafter.
9.75% Notes
In October 2018, we issued $380 million aggregate principal amount of 9.75% Senior Notes due 2023 (9.75% Notes) at par, and in connection therewith, we incurred upfront fees totaling $7.8 million. Aggregate
F-25
Table of Contents
net proceeds from the issuance of the 9.75% Notes were $372.2 million and were used to repay borrowings and accrued and unpaid interest in full on the TLB in the amount of $339.0 million. Interest is accrued and paid semi-annually on April 15 and October 15. Total interest expense related to the 9.75% Notes, including amortization of original issue discount and deferred finance costs was $38.8 million for both 2020 and 2019. As of December 31, 2020, the fair value of the 9.75% Notes was approximately $307.8 million.
The 9.75% Notes are guaranteed on a senior unsecured basis by all our subsidiaries. Subsequent to October 15, 2020, we may redeem the 9.75% Notes at a redemption price (plus accrued and unpaid interest) equal to par plus 7.313% for October 2020 through October 2021, 4.875% from October 2021 through April 2022 and 0% thereafter.
Long-term debt consisted of the following:
| December 31, | ||||||||
| Face amount: | 2020 | 2019 | ||||||
| Superpriority |
$ | — | $ | 150,000 | ||||
| RBL |
190,000 | 190,000 | ||||||
| Second lien term loan |
150,000 | — | ||||||
| 8.75% Senior Notes |
530,000 | 530,000 | ||||||
| 9.75% Senior Notes |
380,000 | 380,000 | ||||||
|
|
|
|
|
|||||
| Total face amount |
1,250,000 | 1,250,000 | ||||||
| Deferred finance costs: |
||||||||
| Superpriority |
— | (8,345 | ) | |||||
| RBL |
(6,431 | ) | (6,336 | ) | ||||
| Second lien term loan |
(7,053 | ) | — | |||||
| 8.75% Senior Notes |
(5,293 | ) | (7,602 | ) | ||||
| 9.75% Senior Notes |
(3,954 | ) | (5,680 | ) | ||||
|
|
|
|
|
|||||
| Total deferred finance costs |
(22,731 | ) | (27,963 | ) | ||||
| 8.75% Senior Notes, discount |
(2,528 | ) | (3,479 | ) | ||||
|
|
|
|
|
|||||
| Total discount |
(2,528 | ) | (3,479 | ) | ||||
|
|
|
|
|
|||||
| Total debt |
1,224,741 | 1,218,558 | ||||||
| Less: short-term portion |
— | — | ||||||
|
|
|
|
|
|||||
| Total long-term debt |
$ | 1,224,741 | $ | 1,218,558 | ||||
|
|
|
|
|
|||||
Other Information
Principal maturities of long-term debt outstanding at December 31, 2020 were as follows:
| 2020 | 2021 | 2022 | 2023 | 2024 | Thereafter | |||||||||||||||||||
| RBL |
$ | — | $ | — | $ | — | $ | 190,000 | $ | — | $ | — | ||||||||||||
| Second lien term loan |
— | — | — | — | — | 150,000 | ||||||||||||||||||
| 8.75% Notes |
— | — | — | 530,000 | — | — | ||||||||||||||||||
| 9.75% Notes |
— | — | — | 380,000 | — | — | ||||||||||||||||||
|
|
|
|
|
|
|
|
|
|
|
|
|
|||||||||||||
| Total indebtedness |
$ | — | $ | — | $ | — | $ | 1,100,000 | $ | — | $ | 150,000 | ||||||||||||
|
|
|
|
|
|
|
|
|
|
|
|
|
|||||||||||||
F-26
Table of Contents
All debt agreements include the usual and customary covenants for facilities of its type and size. The covenants cover matters such as mandatory reserve reports, the responsible operation and maintenance of properties, certifications of compliance, required disclosures to the lenders, notices under other material instruments, notices of sales of oil and gas properties, incurrence of additional indebtedness, restricted payments and distributions, certain investments outside of the ordinary course of business, limits on the amount of commodity and interest rate hedges that can be put in place and events of default.
| 8. | Fair Value Measurements |
Certain of our assets and liabilities are measured at fair value. Fair value is the price that would be received to sell an asset or paid to transfer a liability in an orderly transaction between market participants at the measurement date. We use market data or assumptions that market participants would use in pricing the asset or liability, including assumptions about risk and the risks inherent in the inputs to the valuation technique. These inputs can be readily observable, market corroborated or generally unobservable. GAAP establishes a fair value hierarchy that prioritizes the inputs used to measure fair value.
The three levels of fair value hierarchy are as follows:
| • | Level 1 — Quoted prices are available in active markets for identical assets or liabilities as of the reporting date. |
| • | Level 2 — Pricing inputs are other than quoted prices in active markets, which are either directly or indirectly observable as of the reporting date. Level 2 includes those financial instruments that are valued using models or other valuation methodologies. |
| • | Level 3 — Pricing inputs include significant inputs that are generally less observable from objective sources. These inputs may be used with internally developed methodologies that result in management’s best estimate of fair value. |
We classify financial assets and liabilities based on the lowest level of input that is significant to the fair value measurement. Assessment of the significance of a particular input requires judgment that may affect the valuation and its placement within the hierarchy levels.
The carrying values of financial instruments, including accounts receivable and accounts payable, approximate fair value due to the short maturity of these instruments. None of our financial instruments are held for trading purposes.
All derivative financial instruments are Level 2 measurements as independent quoted market prices are not available in active markets.
Certain assets are measured at fair value on a non-recurring basis. These assets can include long-lived assets that have been reduced to fair value when they are held for sale, the initial recognition of ARO and proved and unproved properties that are written down to fair value when they are impaired. The fair value of our natural gas properties is determined using valuation techniques consistent with the income and market approach.
| 9. | Derivative Instruments |
Derivative assets and liabilities are presented as gross assets and liabilities, without regard to master netting arrangements, which are considered in the presentation of derivative assets and liabilities in the accompanying balance sheets.
F-27
Table of Contents
The following table summarizes the gross fair value of our derivative assets and liabilities and the effect of netting:
| Balance Sheet |
Gross Amounts |
Netting Adjustment |
Net Amounts Presented on the Balance Sheet |
|||||||||||
| December 31, 2020 |
||||||||||||||
| Assets: |
||||||||||||||
| Commodity Derivatives |
Current assets | $ | 9,095 | (9,095 | ) | $ | — | |||||||
| Commodity Derivatives |
Noncurrent assets | 2,742 | (2,742 | ) | — | |||||||||
|
|
|
|
|
|
|
|||||||||
| Total assets |
$ | 11,837 | $ | (11,837 | ) | $ | — | |||||||
|
|
|
|
|
|
|
|||||||||
| Liabilities: |
||||||||||||||
| Commodity Derivatives |
Current liabilities | $ | 29,043 | $ | (9,095 | ) | $ | 19,948 | ||||||
| Commodity Derivatives |
Noncurrent liabilities | 41,083 | (2,742 | ) | 38,341 | |||||||||
|
|
|
|
|
|
|
|||||||||
| Total liabilities |
$ | 70,126 | $ | (11,837 | ) | $ | 58,289 | |||||||
|
|
|
|
|
|
|
|||||||||
| December 31, 2019 |
||||||||||||||
| Assets: |
||||||||||||||
| Commodity Derivatives |
Current assets | $ | 83,951 | $ | — | $ | 83,951 | |||||||
| Commodity Derivatives |
Noncurrent assets | 23,451 | (1,614 | ) | 21,837 | |||||||||
|
|
|
|
|
|
|
|||||||||
| Total assets |
$ | 107,402 | $ | (1,614 | ) | $ | 105,788 | |||||||
|
|
|
|
|
|
|
|||||||||
| Liabilities: |
||||||||||||||
| Commodity Derivatives |
Current liabilities | $ | — | $ | — | $ | — | |||||||
| Commodity Derivatives |
Noncurrent liabilities | 1,614 | (1,614 | ) | — | |||||||||
|
|
|
|
|
|
|
|||||||||
| Total liabilities |
$ | 1,614 | $ | (1,614 | ) | $ | — | |||||||
|
|
|
|
|
|
|
|||||||||
Commodity Derivatives
The following summarizes our commodity derivative positions as of December 31, 2020:
| Natural Gas Swaps |
||||||||
| Production Year |
Average Daily Volumes (MMBtu) |
Weighted Average Swap Price ($ / MMBtu) |
||||||
| 2021 |
603,405 | $ | 2.57 | |||||
| 2022 |
318,605 | $ | 2.55 | |||||
| 2023 |
135,288 | $ | 2.51 | |||||
| 2024 |
92,377 | $ | 2.54 | |||||
| 2025 |
33,945 | $ | 2.58 | |||||
| Sold Natural Gas Calls |
||||||||
| Production Year |
Average Daily Volumes (MMBtu) |
Weighted Average Call Price ($ / MMBtu) |
||||||
| 2021 |
20,959 | $ | 3.19 | |||||
Interest Rate Derivatives
Our interest rate derivative expired on June 30, 2019. For 2019, we recognized an unrealized loss of $1.5 million which is reflected in interest expense.
F-28
Table of Contents
| 10. | Partners’ Capital and Profit Interests Awards |
Background
The Partnership Agreement (the “Agreement”) authorizes the issuance of two classes of equity interests: General Partner Interests and Limited Partnership Interests. The Limited Partnership Interests are divided into three series: Class A Units, Class B Units and Class C Units, each with the rights, privileges, preferences, restrictions and obligations as provided in the Agreement.
A total of 100 General Partner interests are authorized for issuance, 100 Class A Units, 2,000,000 Class B Units and 5,000 Class C Units. Each Class B Unit and Class C Unit has a fixed price of $1,000.
In general, cash distributions follow a waterfall set out in the Agreement whereby the Class B and Class C Unit Holders (collectively, the “Common Unit Holders”) receive payment until they have received distributions equal to the amount of their respective capital contributed. Once the capital is returned and certain rate of returns are achieved, distributions will be made to Class A Unit Holders in accordance with the Agreement. The distributions to Class A Holders increase based on stated return thresholds to the Common Unit Holders.
Class A Units
The Class A Units are Partnership interests that provide economic incentives to our employees who receive them. The Class A Units are intended to be “profits interests.” The Class A Units vest over a five-year period and may be forfeited or repurchased by the Company under certain circumstances as set forth in the plan governing the Class A Units and individual Class A Unit grant agreements.
The Company has granted Class A Units to select members of the Company’s management. Most of the Class A Units are treated as conditionally vesting equity but are deemed to be a profit sharing arrangement due to certain forfeiture or repurchase features of the plan. Award recipients may derive economic value in the instrument through profit sharing distributions. As such, we treat these Class A Units as profit-sharing arrangements that will trigger no compensation expense until amounts payable under such awards become probable and estimable. Holders of Class A Units generally must be employed at the time of distributions in order to receive any payments.
The remainder of the Class A Units are deemed to be equity due to their distinct forfeiture and repurchase features. As such, the units, which were all issued in 2014, are accounted for as equity-based compensation.
The following table summarizes the Class A Unit activity:
| Class A Units | ||||||||||||
| Equity-based Compensation Awards |
Profit-Sharing Arrangement |
Total | ||||||||||
| Outstanding at December 31, 2018 |
40 | 42.5 | 82.5 | |||||||||
| Granted |
— | 17.5 | 17.5 | |||||||||
| Forfeited |
— | — | — | |||||||||
|
|
|
|
|
|
|
|||||||
| Outstanding at December 31, 2019 |
40 | 60 | 100 | |||||||||
|
|
|
|
|
|
|
|||||||
| Granted |
— | 2 | 2 | |||||||||
| Forfeited |
— | (6 | ) | (6 | ) | |||||||
|
|
|
|
|
|
|
|||||||
| Outstanding at December 31, 2020 |
40 | 56 | 96 | |||||||||
|
|
|
|
|
|
|
|||||||
We utilized the Black Scholes option pricing method to estimate grant date fair value of the Class A equity- based compensation awards, which included probability of various outcomes. Expected volatilities are based on historical volatilities of the stock of comparable companies in our industry. The risk-free rate for periods within the contractual life of the option is based on the U.S. Treasury yield curve in effect at the time of grant. Actual results may vary depending on the assumptions applied within the model.
F-29
Table of Contents
The grant date fair value of the Class A equity-based compensation awards in 2014 was $3.0 million.
Compensation expense was recognized on a straight-line basis over the requisite service period which was met in 2019. There was no unrecognized compensation costs related to unvested awards at December 31, 2020 or 2019. No distributions were made during 2020 or 2019.
Class B Units
As of December 31, 2020 and 2019, there were 462,517 Class B Units to Blackstone issued and outstanding in exchange for capital contributions.
Class C Units
As of December 31, 2020 and 2019, there were 4,241 and 4,292, respectively, Class C Units issued and outstanding in exchange for capital contributions. Due to their redemption attributes, the capital contributed for Class C Units is included in other long-term liabilities.
| 11. | Commitments and Contingencies |
Litigation
Occasionally, we are subject to legal proceedings and claims that arise in the ordinary course of business. Like other natural gas producers, our operations are subject to extensive and rapidly changing federal and state environmental, health and safety and other laws and regulations governing air emissions, wastewater discharges and solid and hazardous waste management activities. We are not currently a party to any material legal proceedings and are not aware of any material legal proceedings threatened to be brought against us.
Environmental Remediation
We may become subject to certain liabilities as they relate to environmental remediation of well sites related to their development or operation. In connection with our acquisition of existing or previously drilled wells, we may not be aware of the environmental safeguards that were taken at the time such wells were drilled or operated by others. Should we determine that a liability exists with respect to any environmental cleanup or restoration, we would be responsible for curing such a violation. No claim has been made, nor are we aware of any liability that exists, as it relates to any environmental cleanup or restoration or the violation of any rules or regulations relating thereto.
Leases
The lease for our office space in Plano, Texas extends into 2023 with lease commitments of less than $1.1 million each year.
| 12. | Related Party Transactions |
The monitoring fee that we recognized on our statements of operations is paid under a management and consulting agreement with Blackstone and our CEO, of which, over 99% was attributable to Blackstone.
As of December 31, 2020, Blackstone owned $50.0 million aggregate principal of the 8.75% Notes.
During 2020, we recorded $1.4 million in interest expense for unused commitment fees on the Third Lien Revolving Credit Facility, for which certain affiliates of Blackstone are the lenders.
In December 2019, we paid $1.1 million in attorney fees on behalf of Blackstone associated with the placement of the Third Lien Revolving Credit Facility.
F-30
Table of Contents
In July 2020, a committee of independent members from Vine’s Board of Managers approved a $30 million
distribution to Vine Oil & Gas Parent LP, a wholly owned subsidiary of Blackstone and certain members of management. The distribution was made immediately following such approval with funds originating from a first lien RBL draw made at the end of June 2020.
In December 2020, we entered into the Second Lien Term Loan and used the proceeds to repay the aggregate principal amount of loans outstanding under the Superpriority in connection with the entry into the amendment to and extension of the RBL. In conjunction with the issuance of the Second Lien Term Loan we paid Blackstone $0.9 million in financing fees.
During 2020 and 2019, VMS billed two of our affiliates, Brix Oil & Gas Holdings LP (“Brix”) and Harvest Royalties Holdings LP (“Harvest”), $8.5 million and $9.0 million, respectively, for services rendered and administrative costs incurred. As of December 31, 2020 and 2019, we have a net receivable from these affiliates for such services of $0.9 million and $1.1 million, respectively, which is included in accounts receivable.
Additionally, in 2020 and 2019, Vine issued joint interest bills to Brix totaling $48.2 million and $54.7 million, respectively, for their share of capital expenditures and operating expenses on wells that we have drilled. As of December 31, 2020 and 2019, the total related receivable is $4.4 million and $9.9 million, respectively, which is included in joint interest billing receivables.
In 2020 and 2019, Vine received joint interest bills from one of its affiliates totaling $1.2 million and $0.7 million, respectively, for our share of capital expenditures and operating expenses on a well they operate. As of December 31, 2020 and 2019, the total related payable is $0.3 million and $0.1 million, respectively, which is included in accounts payable.
Vine paid $57.7 million and $67.4 million in 2020 and 2019, respectively, to Brix and Harvest for revenue in wells in which they participate. As of December 31, 2020 and 2019, Vine has $20.4 million and $13.1 million, respectively, included in revenue payable due to these affiliates.
In 2020 and 2019, Vine received $6.1 million and $0.1 million, respectively, in revenue from Brix for revenue in a well in which we participate. As of December 31, 2020, we have a receivable from Brix of $2.9 million which is included in accounts receivable.
During 2020 and 2019, Vine billed Brix $3.5 million and $4.1 million, respectively, in assets used in drilling and operating costs and recognized gains of $0.5 million and $0.3 million, respectively. In 2020 and 2019, Vine purchased $0.4 million and $0.2 million, respectively, in assets from Brix.
| 13. | Supplemental Natural Gas Reserve Information (Unaudited) |
Natural Gas Quantities and Property Summary
Our reserves were prepared by the independent engineering firm W.D. Von Gonten & Co. All our reserves are located within the stacked Haynesville and Mid-Bossier shale plays in the Haynesville Basin of Northwest Louisiana. Proved natural gas reserves are the estimated quantities of natural gas which geological and engineering data demonstrate, with reasonable certainty, to be recoverable in the future from known reservoirs under existing economic and operating conditions. Proved developed natural gas reserves are proved reserves expected to be recovered through existing wells and equipment in place and under operating methods being utilized at the time the estimates were made. A variety of methodologies are used to determine our proved reserve estimates. The principal methodologies employed, often in combination, are decline curve analysis, advance production type curve matching, petro physics/log analysis and analogy. Reserve estimates are inherently imprecise and estimates of new discoveries and undeveloped locations are more imprecise than estimates of established producing natural gas properties. Accordingly, these estimates are expected to change as future information becomes available.
F-31
Table of Contents
The following summarizes the changes in our proved reserves (in MMcf):
| Balance at December 31, 2018 |
1,868,794 | |||
| Production |
(200,214 | ) | ||
| Revision of previous estimates(1) |
(226,510 | ) | ||
| Acquisitions of reserves(2) |
5,731 | |||
| Extensions and discoveries(3) |
762,032 | |||
|
|
|
|||
| Balance at December 31, 2019 |
2,209,833 | |||
|
|
|
|||
| Production |
(240,869 | ) | ||
| Revision of previous estimates(4) |
(847,273 | ) | ||
| Acquisitions of reserves(2) |
46,516 | |||
| Extensions and discoveries(5) |
633,911 | |||
|
|
|
|||
| Balance at December 31, 2020 |
1,802,118 | |||
|
|
|
|||
| Proved developed reserves at: |
||||
| December 31, 2018 |
400,194 | |||
| December 31, 2019 |
447,966 | |||
| December 31, 2020 |
446,243 | |||
| Proved undeveloped reserves at: |
||||
| December 31, 2018 |
1,468,600 | |||
| December 31, 2019 |
1,761,867 | |||
| December 31, 2020 |
1,355,875 | |||
| (1) | Revision of previous estimates include changes to development plan resulting in reclassifying 37 PUD locations as they now reside outside of the 5-year development window. These negative revisions are somewhat offset by working and mineral interests adjustments, improved well performance of producing new wells and PUD type curve revisions. Revision of previous estimates reflect changes in previous estimates attributable to negative changes in economic factors of 106,192 MMcf, combined with negative changes in non-economic factors of 120,318 MMcf, including: |
| • | Economic factors include revisions caused by commodity prices (decrease of 120,999 MMcf) offset by positive overall cost reductions (increase of 14,807 MMcf); and |
| • | Non-economic factors include well performance improvements (increase 101,483 MMcf), working interests revisions (increase of 12,332 MMcf), changes resulting from the removal of proved undeveloped locations (decrease of 251,622 MMcf) and other revisions due to changes in a previously adopted development plan (increase of 17,489 MMcf). |
| (2) | Acquisitions of reserves represent additional lease acquisitions that increased our working interest. |
| (3) | Extensions and discoveries represent extensions to reserves attributable to additional 83 gross drilling locations to be developed by 2024 (as that year entered the 5-year development window) and include development plan revisions to incorporate longer laterals and conversion of 6 non-proved locations to producing in 2019. |
| (4) | Revision of previous estimates include changes to development plan resulting in reclassifying 115 PUD locations as they now reside outside of the 5-year development window. These negative revisions are somewhat offset by working and mineral interests adjustments, improved well performance of producing new wells and PUD type curve revisions. Revision of previous estimates reflect changes in previous estimates attributable to negative changes in economic factors of 750,337 MMcf, combined with negative changes in non-economic factors of 96,936 MMcf, including: |
| • | Economic factors include revisions caused by commodity prices (decrease of 1,161,042 MMcf) offset by positive overall cost reductions (increase of 410,705 MMcf); and |
| • | Non-economic factors include well performance improvements (increase of 281,939 MMcf), working interests revisions (increase of 186 MMcf), changes resulting from the removal of proved undeveloped |
F-32
Table of Contents
| locations (decrease of 579,598 MMcf) and other revisions due to changes in a previously adopted development plan (increase of 200,537 MMcf). |
| (5) | Extensions and discoveries represent extensions to reserves attributable to additional 129 gross drilling locations to be developed by 2025 (as that year entered the 5-year development window) and include development plan revisions to incorporate longer laterals and conversion of 14 non-proved locations to producing in 2020. |
Our estimated proved reserves were determined using average first-day-of-the-month prices for the prior 12 months in accordance with SEC guidance. As of December 31, 2020, the SEC Price Deck was $1.99/MMBtu (Henry Hub Price) for natural gas. In determining our reserves, the SEC Price Deck was adjusted for basis differentials and other factors affecting the prices we receive. The average resulting price used as of December 31, 2020 was $1.73 per Mcf.
The carrying value of our natural gas assets was:
| December 31, | ||||||||
| 2020 | 2019 | |||||||
| Proved natural gas properties subject to depletion |
$ | 2,722,419 | $ | 2,475,619 | ||||
| Less: Accumulated depletion |
(1,380,065 | ) | (1,039,643 | ) | ||||
|
|
|
|
|
|||||
| Natural gas properties, net |
$ | 1,342,354 | $ | 1,435,976 | ||||
|
|
|
|
|
|||||
Our capital costs incurred for acquisition and development activities were:
| December 31, | ||||||||
| 2020 | 2019 | |||||||
| Proved acreage |
$ | 1,460 | $ | 6,022 | ||||
| Development costs |
242,437 | 278,793 | ||||||
|
|
|
|
|
|||||
| Total |
$ | 243,897 | $ | 284,815 | ||||
|
|
|
|
|
|||||
Standardized Measure of Discounted Future Net Cash Flows Relating to Proved Natural Gas Reserves
We develop the standardized measure of discounted future net cash flows from production of proved reserves by: estimating quantities of proved reserves and future periods during which they are expected to be produced based on year-end economic conditions, calculating estimated future cash flows by multiplying production by the twelve-month average of the first of the month prices, determining the future production and development costs based on year-end economic conditions and discounting future net cash flows by applying a rate of 10%.
The assumptions used to compute the standardized measure are those prescribed by the FASB and the SEC
and do not reflect the expected undiscounted or discounted cash flows or the estimated fair value. The limitations inherent in the reserve quantity estimation process, as previously discussed, are equally applicable to the standardized measure computations, since these reserve quantity estimates are the basis for the valuation process.
F-33
Table of Contents
The Standardized Measure was:
| December 31, | ||||||||
| 2020 | 2019 | |||||||
| Future natural gas sales |
$ | 3,130,277 | $ | 5,113,708 | ||||
| Future production costs |
(1,173,122 | ) | (1,670,411 | ) | ||||
| Future development costs(1) |
(1,103,333 | ) | (1,787,256 | ) | ||||
| Future income tax expense(2) |
— | — | ||||||
|
|
|
|
|
|||||
| Future net cash flows |
$ | 853,822 | $ | 1,656,041 | ||||
| 10% annual discount |
(291,186 | ) | (667,873 | ) | ||||
|
|
|
|
|
|||||
| Standardized measure of discounted future net cash flows |
$ | 562,636 | $ | 988,168 | ||||
|
|
|
|
|
|||||
The primary changes in the standardized measure were:
| December 31, | ||||||||
| 2020 | 2019 | |||||||
| Balance at beginning of period |
$ | 988,168 | $ | 1,244,628 | ||||
| Sales of natural gas, net(3) |
(278,716 | ) | (342,848 | ) | ||||
| Revision of previous quantity estimates and extensions |
(76,715 | ) | 174,884 | |||||
| Acquisitions of reserves |
4,297 | 2,589 | ||||||
| Previously estimated development costs incurred |
187,952 | 185,584 | ||||||
| Net changes in future development costs |
44,210 | 37,611 | ||||||
| Net changes in prices |
(388,308 | ) | (452,332 | ) | ||||
| Accretion of discount |
98,816 | 124,463 | ||||||
| Net change in income taxes(2) |
— | — | ||||||
| Changes in timing and other differences |
(17,068 | ) | 13,589 | |||||
|
|
|
|
|
|||||
| Balance at end of period(1) |
$ | 562,636 | $ | 988,168 | ||||
|
|
|
|
|
|||||
| (1) | Our calculations of future development costs include costs associated with the abandonment of the proved properties, including the costs related to undrilled proved locations. |
| (2) | Future net cash flows do not include the effects of income taxes on future revenues because we were a limited partnership not subject to entity-level income taxation as of December 31, 2020 and 2019. Accordingly, no provision for federal or state corporate income taxes has been provided because taxable income was passed through to the partners. If we had been subject to entity-level income taxation, the unaudited future income tax expense at December 31, 2020 and 2019 would have been $5.2 million and $102.7 million, respectively, which is calculated based on an estimated 25.62% blended statutory U.S. federal and state tax rate. The unaudited standardized measure at December 31, 2020 and 2019 would have been $557.4 million and $885.5 million, respectively. |
| (3) | Net gas volumes and the related revenues included in our standardized measure include all wellhead volumes. |
F-34
Table of Contents
INDEPENDENT AUDITORS’ REPORT
To the Partners of Brix Oil & Gas Holdings LP and Harvest Royalties Holdings LP
We have audited the accompanying combined financial statements of Brix Oil & Gas LP and Harvest Royalties Holdings LP, both of which are under common management, which comprise the combined balance sheets as of December 31, 2020 and 2019, and the related combined statements of operations, partners’ capital, and cash flows for the years then ended, and the related notes to the combined financial statements.
Management’s Responsibility for the Combined Financial Statements
Management is responsible for the preparation and fair presentation of these combined financial statements in accordance with accounting principles generally accepted in the United States of America; this includes the design, implementation, and maintenance of internal control relevant to the preparation and fair presentation of combined financial statements that are free from material misstatement, whether due to fraud or error.
Auditors’ Responsibility
Our responsibility is to express an opinion on these combined financial statements based on our audits. We conducted our audits in accordance with auditing standards generally accepted in the United States of America. Those standards require that we plan and perform the audit to obtain reasonable assurance about whether the combined financial statements are free from material misstatement.
An audit involves performing procedures to obtain audit evidence about the amounts and disclosures in the combined financial statements. The procedures selected depend on the auditor’s judgment, including the assessment of the risks of material misstatement of the combined financial statements, whether due to fraud or error. In making those risk assessments, the auditor considers internal control relevant to the companies’ preparation and fair presentation of the combined financial statements in order to design audit procedures that are appropriate in the circumstances, but not for the purpose of expressing an opinion on the effectiveness of the companies’ internal control. Accordingly, we express no such opinion. An audit also includes evaluating the appropriateness of accounting policies used and the reasonableness of significant accounting estimates made by management, as well as evaluating the overall presentation of the combined financial statements.
We believe that the audit evidence we have obtained is sufficient and appropriate to provide a basis for our audit opinion.
Opinion
In our opinion, the combined financial statements referred to above present fairly, in all material respects, the financial position of Brix Oil & Gas LP and Harvest Royalties Holdings LP as of December 31, 2020 and 2019, and the results of their operations and their cash flows for the years then ended in accordance with accounting principles generally accepted in the United States of America.
/s/ DELOITTE & TOUCHE LLP
February 22, 2021
F-35
Table of Contents
BRIX OIL & GAS – ACQUIRED ENTITIES
COMBINED STATEMENTS OF OPERATIONS
(Amounts in Thousands)
| For the Year Ended December 31, | ||||||||
| 2020 | 2019 | |||||||
| Revenue: |
||||||||
| Natural gas sales |
$ | 152,267 | $ | 114,782 | ||||
| Realized gain on commodity derivatives |
38,043 | 9,923 | ||||||
| Unrealized (loss) gain on commodity derivatives |
(40,475 | ) | 25,610 | |||||
|
|
|
|
|
|||||
| Total revenue |
149,835 | 150,315 | ||||||
| Operating Expenses: |
||||||||
| Lease operating |
17,728 | 7,014 | ||||||
| Gathering and treating |
25,204 | 18,928 | ||||||
| Production and ad valorem taxes |
2,715 | 1,550 | ||||||
| General and administrative |
7,368 | 7,763 | ||||||
| Monitoring fee |
1,371 | 906 | ||||||
| Depletion, depreciation and accretion |
92,177 | 65,901 | ||||||
| Exploration |
26 | 546 | ||||||
| Severance |
121 | — | ||||||
|
|
|
|
|
|||||
| Total operating expenses |
146,710 | 102,608 | ||||||
|
|
|
|
|
|||||
| Operating Income |
3,125 | 47,707 | ||||||
| Interest expense |
(11,928 | ) | (9,693 | ) | ||||
|
|
|
|
|
|||||
| Net Income |
$ | (8,803 | ) | $ | 38,014 | |||
|
|
|
|
|
|||||
The accompanying notes are integral to the financial statements.
F-36
Table of Contents
BRIX OIL & GAS – ACQUIRED ENTITIES
COMBINED BALANCE SHEETS
(Amounts in Thousands)
| December 31, 2020 | December 31, 2019 | |||||||
| Assets |
||||||||
| Current assets: |
||||||||
| Cash and cash equivalents |
$ | 17,660 | $ | 4,011 | ||||
| Accounts receivable |
15,968 | 13,114 | ||||||
| Accounts receivable from affiliates |
21,581 | 13,646 | ||||||
| Joint interest billing receivables |
6,831 | 5,498 | ||||||
| Derivatives |
— | 25,307 | ||||||
| Prepaid and other |
39 | 8 | ||||||
|
|
|
|
|
|||||
| Total current assets |
62,079 | 61,584 | ||||||
| Natural gas properties (successful efforts): |
||||||||
| Proved |
463,045 | 353,492 | ||||||
| Unproved |
— | 1,061 | ||||||
| Accumulated depletion |
(191,837 | ) | (99,727 | ) | ||||
|
|
|
|
|
|||||
| Total natural gas properties, net |
271,208 | 254,826 | ||||||
| Derivatives |
— | 1,431 | ||||||
|
|
|
|
|
|||||
| Total assets |
$ | 333,287 | $ | 317,841 | ||||
|
|
|
|
|
|||||
| Liabilities and Partners’ Capital |
||||||||
| Current liabilities: |
||||||||
| Accounts payable |
$ | 2,658 | $ | 1,146 | ||||
| Accrued expenses to affiliate |
11,820 | 15,577 | ||||||
| Accrued expenses |
12,579 | 6,877 | ||||||
| Revenue payable |
11,786 | 7,974 | ||||||
| Derivatives |
8,284 | — | ||||||
|
|
|
|
|
|||||
| Total current liabilities |
47,127 | 31,574 | ||||||
| Long-term liabilities: |
||||||||
| Brix credit facility |
121,760 | 120,470 | ||||||
| Asset retirement obligations |
888 | 627 | ||||||
| Derivatives |
5,453 | — | ||||||
| Refundable deposits |
2,784 | 2,727 | ||||||
|
|
|
|
|
|||||
| Total liabilities |
178,012 | 155,398 | ||||||
| Commitments and contingencies |
||||||||
| Partners’ capital |
155,275 | 162,443 | ||||||
|
|
|
|
|
|||||
| Total liabilities and partners’ capital |
$ | 333,287 | $ | 317,841 | ||||
|
|
|
|
|
|||||
The accompanying notes are integral to the financial statements
F-37
Table of Contents
BRIX OIL & GAS – ACQUIRED ENTITIES
COMBINED STATEMENTS OF PARTNERS’ CAPITAL
(Amounts in Thousands)
| Balance at December 31, 2018 |
$ | 123,540 | ||
| Equity-based compensation |
889 | |||
| Net income |
38,014 | |||
|
|
|
|||
| Balance at December 31, 2019 |
$ | 162,443 | ||
|
|
|
|||
| Equity-based compensation |
1,635 | |||
| Net income |
(8,803 | ) | ||
|
|
|
|||
| Balance at December 31, 2020 |
$ | 155,275 | ||
|
|
|
The accompanying notes are integral to the financial statements.
F-38
Table of Contents
BRIX OIL & GAS – ACQUIRED ENTITIES
COMBINED STATEMENTS OF CASH FLOWS
(Amounts in Thousands)
| For the Year Ended December 31, | ||||||||
| 2020 | 2019 | |||||||
| Operating Activities |
||||||||
| Net income |
$ | (8,803 | ) | $ | 38,014 | |||
| Adjustments to reconcile net income to operating cash flow: |
||||||||
| Depletion, depreciation and accretion |
92,177 | 65,901 | ||||||
| Amortization of financing costs |
1,412 | 1,191 | ||||||
| Equity-based compensation |
1,635 | 889 | ||||||
| Unrealized loss (gain) on commodity derivatives |
40,475 | (25,610 | ) | |||||
| Changes in assets and liabilities: |
||||||||
| Accounts receivable |
(10,783 | ) | (7,842 | ) | ||||
| Joint interest billing receivables |
(1,333 | ) | (2,327 | ) | ||||
| Accounts payable and accrued expenses |
6,492 | 2,816 | ||||||
| Revenue payable |
5,962 | 3,358 | ||||||
| Other |
27 | 150 | ||||||
|
|
|
|
|
|||||
| Operating cash flow |
127,261 | 76,540 | ||||||
| Investing Activities |
||||||||
| Proceeds from asset sales |
— | 1,832 | ||||||
| Capital expenditures |
(113,479 | ) | (150,956 | ) | ||||
|
|
|
|
|
|||||
| Investing cash flow |
(113,479 | ) | (149,124 | ) | ||||
| Financing Activities |
||||||||
| Proceeds from Brix credit facility |
— | 76,000 | ||||||
| Deferred financing costs paid |
(133 | ) | (3,698 | ) | ||||
|
|
|
|
|
|||||
| Financing cash flow |
(133 | ) | 72,302 | |||||
| Net increase (decrease) in cash and cash equivalents |
13,649 | (282 | ) | |||||
| Cash and cash equivalents at beginning of period |
4,011 | 4,293 | ||||||
|
|
|
|
|
|||||
| Cash and cash equivalents at end of period |
$ | 17,660 | $ | 4,011 | ||||
|
|
|
|
|
|||||
| Supplemental information |
||||||||
| Cash paid for interest |
$ | 10,516 | $ | 8,502 | ||||
| Non-cash transactions |
||||||||
| Accrued capital expenditures |
$ | 10,456 | $ | 15,637 | ||||
The accompanying notes are integral to the financial statements.
F-39
Table of Contents
BRIX OIL & GAS – ACQUIRED ENTITIES
NOTES TO COMBINED FINANCIAL STATEMENTS
(Amounts in Thousands)
| 1. | Nature of Business and Organization |
The combined financial statements of Brix Oil & Gas—Acquired Entities (the “Company,” “Brix and Harvest” “Acquired Entities” “we,” “our,” or “us”) presented herein include the accounts of Brix Oil & Gas Holdings LP (“Brix”) and Harvest Royalties Holdings LP (“Harvest”, and collectively “the Brix Companies”).
The Brix Companies are engaged in the development, production and sale of natural gas and in the acquisition, ownership and administration of producing and nonproducing mineral and royalty interests located exclusively in the Haynesville and Mid-Bossier plays of the Haynesville Basin in Northern Louisiana. Our executive offices are located in Plano, Texas.
| 2. | Basis of Presentation and Summary of Significant Accounting Policies |
Basis of Presentation
These combined financial statements have been prepared in accordance with accounting principles generally accepted in the United States of America (“GAAP”). We had no items of other comprehensive income for 2020 or 2019. We operate only one reportable segment. We have evaluated subsequent events through February 22, 2021, the date on which these financial statements were issued. The following entities were determined to be under common management and represent the operations of the Company:
| • | Brix is a Delaware Limited Partnership formed in 2016. Brix is majority owned by Blackstone and members of management and is engaged in the exploration, development, production and sale of natural gas in the Haynesville play in Northern Louisiana, with executive offices in Plano, Texas. Brix has two wholly owned subsidiaries (Brix Operating LLC and Brix Federal Leasing Corporation) that are consolidated. |
| • | Harvest is a Delaware Limited Partnership formed in 2016. Harvest is majority owned by Blackstone and a member of management and is focused on the acquisition, ownership and administration of producing and nonproducing mineral, royalty, overriding royalty, net profits, and leasehold interests located exclusively in the Haynesville play in Northern Louisiana. Harvest has one wholly owned subsidiary (Harvest Operating LLC) that is consolidated. |
Use of Estimates
Preparation of the financial statements in conformity with GAAP requires management to make estimates and assumptions that affect the reported amount of assets and liabilities, the disclosure of contingent assets and liabilities at the date of the financial statements and reported revenue and expenses during the reporting period. Estimates of reserves are used to determine depletion and to conduct impairment analysis. Estimating reserves has inherent uncertainty, including the projection of future rates of production and the timing of development. Further, the COVID-19 outbreak has significantly decreased the demand for hydrocarbons, particularly oil. Concurrently, deterioration of production agreements between key global oil producers has led to an increase in supply. The confluence of these factors has caused significant volatility in oil and gas prices and has increased the inherent uncertainty in the estimate of reserves.
Cash and Cash Equivalents
We consider all highly liquid investments with an original maturity of three months or less to be cash equivalents. We had no cash equivalents as of December 31, 2020 or 2019.
F-40
Table of Contents
Accounts Receivable
Accounts receivable principally consists of amounts due for sold but unpaid gas production. Accounts receivable from joint interest billings sent to our working interest partners are generally collected within 30 to 60 days after they are billed, which usually occurs within 10 days after each month’s end. We review our accounts receivable periodically, and if necessary, reduce the carrying amount by a valuation allowance that reflects our best estimate of potentially uncollectible amounts. We have made no allowances for uncollectible accounts receivable as of December 31, 2020 or 2019.
Natural Gas Properties
We utilize the successful efforts method of accounting for our natural gas producing activities, through which we capitalize all property acquisition costs and costs of development wells. Costs for exploratory wells are capitalized until we complete an evaluation of whether the wells yield proved reserves. If an exploratory well does not yield proved reserves, those costs are expensed as exploration expense.
We recognize geological and geophysical costs, including seismic studies, as exploration expense when incurred. We recognize expenditures for maintenance, repairs and minor renewals necessary to maintain properties in operating condition as lease operating expense when incurred. We capitalize major betterments, replacements and renewals as additions to property and equipment.
We account for acquisitions using the acquisition method which requires that assets acquired and liabilities assumed be recorded at fair value on the date of acquisition. In determining the fair value of the natural gas properties, we prepare estimates of natural gas reserves, using estimated future prices to apply to the estimated reserve quantities acquired and estimate future operating and development costs to arrive at the estimates of future cash flows. The valuations to derive the purchase price include proved categories of reserves, expectations for timing and amount of future development and operating costs, projections of future rates of production, expected recovery rates, reserve adjustment factors and a discount rate.
We deplete proved natural gas properties using the unit-of-production basis based on production and estimates of proved reserves. Because all of our natural gas properties are located in a single basin, we assess depletion on a single cost center. We deplete capitalized costs of proved mineral interests over total estimated proved reserves and capitalized costs of wells and related equipment and facilities over estimated proved developed reserves.
We review our proved properties for impairment annually in the fourth quarter, or whenever events and circumstances indicate that a decline in the recoverability of their carrying values may have occurred. We estimate the expected undiscounted future cash flows of our properties and compare such undiscounted future cash flows to the carrying amount of the properties. If the carrying amount exceeds the estimated undiscounted future cash flows, we adjust the carrying amount of the properties to estimated fair value. Our impairment analysis for natural gas properties does not include value associated with our derivative portfolio. There were no impairments on proved natural gas properties for either 2020 or 2019.
We review our unproved properties, if any, for impairment annually in the fourth quarter, or whenever events and circumstances indicate that a decline in the recoverability of their carrying values may have occurred. There were no impairments on unproved natural gas properties for either 2020 or 2019.
Asset Retirement Obligations
Asset retirement obligations (“ARO”) consist of our portion of future plugging and abandonment costs on our natural gas properties. We record the fair value of the liability for ARO in the period in which it is legally or contractually incurred. Upon initial recognition of the ARO, we capitalize an asset retirement cost by increasing the carrying amount of the natural gas properties by the same amount as the liability. In periods subsequent to initial measurement, the ARO is recognized as expense through depletion. Changes in the ARO are recognized for both the passage of time and revisions to either the timing or the amount of
F-41
Table of Contents
estimated cash flows. We recognize accretion expense for the impact of increasing the discounted liability to its estimated settlement value.
Revenue Recognition
Sales under our natural gas contracts are generally considered performed when title transfers to the purchaser at the tailgate of our gatherer’s plant. We recognize revenue when control transfers to the purchasers and we receive an agreed-upon index price, net of any price differentials.
Derivatives
To mitigate risks associated with market volatility, we enter into derivative financial instruments, including commodity swaps, to reduce the effects of natural gas price fluctuations on our production.
We recognize our derivatives as an asset or liability measured at fair value, with their changes in fair value recognized in earnings. The fair value of our commodity swaps is determined by references to published future market prices and interest rates. Our derivatives feature monthly settlements with the counterparties, the impact of which is reflected as an operating cash flow. We have not designated any derivative instruments as hedges and do not enter into such instruments for speculative purposes.
The fair value of our commodity swaps is determined by references to published future market prices and interest rates.
Strategic
Strategic costs include amounts paid to external parties for potential acquisitions or other non-recurring projects.
Income Taxes
As a limited partnership, we are not a taxpaying entity for federal income tax purposes. As such, we have not recorded federal income tax expense. Our limited partners are responsible for federal income taxes on their respective share of taxable income. We file federal income tax returns in the United States. We incurred de minimis state taxes, and the accompanying financial statements reflect such taxes.
As of December 31, 2020, our 2019, 2018 and 2017 tax returns remained open to possible examination by the tax authorities, and none are currently under examination by any tax authorities. We have incurred no penalties or interest related to tax matters, and we have no uncertain tax positions.
Concentrations of Credit Risk
Financial instruments that potentially subject us to a concentration of credit risk consist principally of cash, accounts receivable and derivatives. We maintain deposits primarily in one financial institution, the total of which regularly exceeds the amount covered by insurance provided by the U.S. Federal Deposit Insurance Corporation (“FDIC”). We have not experienced any losses related to this practice.
Vine Oil & Gas LP (“VOG”), an affiliate, markets the majority of our non-operated gas production to various purchasers. VOG remits to us the total of all amounts collected on our behalf. Our operated gas production utilizes an unaffiliated third party to market our operated gas production to various purchasers, which consist of credit-worthy counterparties, including major corporations and super majors, in our industry. This third party collects directly from the purchasers and remits to us the total of all amounts collected on our behalf less their fee for making such sales. Additionally, we sell a portion of our gas under fixed-term contracts with third-party purchasers who remit directly to us. Our receivables from purchasers are generally unsecured; however, we typically require purchasers that do not have investment grade credit ratings to post letters of credit. We have not experienced any credit losses to date.
F-42
Table of Contents
The counterparties to our derivatives are financial institutions that we believe have acceptable credit ratings.
Generally, we have the right to offset future revenue disbursements against unpaid joint interest billing charges.
Recently Issued and Applicable Accounting Standards
Not Yet Adopted
The FASB issued ASU No. 2016-13, “Financial Instruments — Credit Losses (Topic 326): Measurement of Credit Losses on Financial Instruments” which introduces guidance for estimating credit losses on certain types of financial instruments based on expected losses and the timing of the recognition of such losses. We expect to adopt this guidance January 1, 2023, however, the impact is not expected to be material.
The FASB issued ASU No. 2016-02, Leases (Topic 842) which requires all leases greater than one year to be recognized as assets and liabilities. This ASU becomes effective for us beginning January 1, 2022 and we expect to adopt using a modified retrospective approach with certain available practical expedients. Oil and gas leases are excluded from the guidance. We are currently reviewing the contracts to which this new guidance applies and evaluating the new guidance to determine the impact it will have on our combined financial statements. We expect the adoption of this guidance will increase the assets and liabilities recorded on our Balance Sheet and are continuing to evaluate the impact of this standard on our statement of operations and cash flow. We also expect to elect the practical expedient to retain our existing accounting for land easements which were not previously accounted for as leases.
| 3. | Property and Equipment |
| December 31, | ||||||||
| 2020 | 2019 | |||||||
| Proved natural gas properties subject to depletion |
$ | 463,045 | $ | 353,492 | ||||
| Unproved natural gas properties |
— | 1,061 | ||||||
|
|
|
|
|
|||||
| Total capitalized costs |
463,045 | 354,553 | ||||||
| Less: Accumulated depletion |
(191,837 | ) | (99,727 | ) | ||||
|
|
|
|
|
|||||
| Natural gas properties, net |
$ | 271,208 | $ | 254,826 | ||||
|
|
|
|
|
|||||
We recognized depletion expense for 2020 and 2019 of $92.1 million and $65.9 million, respectively.
| 4. | Asset Retirement Obligations |
| December 31, | ||||||||
| 2020 | 2019 | |||||||
| Balance, beginning of period |
$ | 627 | $ | 397 | ||||
| Liabilities incurred |
185 | 154 | ||||||
| Acquired liabilities |
— | 33 | ||||||
| Accretion expense |
76 | 43 | ||||||
|
|
|
|
|
|||||
| Balance, end of period |
$ | 888 | $ | 627 | ||||
|
|
|
|
|
|||||
| 5. | Brix Credit Facility |
As amended, the Brix Credit Facility had a fully committed face amount of $150 million at December 31, 2020 decreasing to $137.5 million on January 1, 2021 through maturity in March 2023. As of December 31, 2020, $25 million was available subject to an approved plan of development.
F-43
Table of Contents
The Brix Credit Facility requires that we provide a first priority security interest in Brix oil and gas properties and substantially all of our personal property assets. The Brix Credit Facility has a 2% prepayment penalty of the amount outstanding from July 1, 2020 through June 30, 2021 and 1% of amounts outstanding from July 1, 2021 through June 30, 2022. There is no prepayment penalty from July 1, 2022 through maturity on March 31, 2023. Mandatory cash sweeps occur on a quarterly basis if Brix’ cash exceeds current liabilities by more than $7.5 million. Swept and repaid amounts cannot be redrawn after being paid are not subject to prepayment penalties. There were no sweeps in 2020 or 2019.
The Brix Credit Facility includes covenants typical for facilities of this type. The covenants cover matters such as mandatory reserve reports, the responsible operation and maintenance of properties, certifications of compliance, required disclosures to the lender, notices under other material instruments, notices of sales of oil and gas properties, and changes to the development program outlined in the agreement. It also places limitation on the incurrence of additional indebtedness, retaining excessive cash, restricted payments, distributions, investments outside of the ordinary course of business and limitations on the amount of commodity and interest rate hedges that can be put in place. Under the Brix Credit Facility, an initial public offering would trigger immediate repayment of the outstanding balance.
The Brix Credit Facility bears an interest rate of LIBOR plus an additional margin of 7.25%. As of December 31, 2020, borrowings under the Brix Credit Facility had an interest rate of 7.4%. Total 2020 and 2019 interest expense, including amortization of deferred debt issuance costs, was $11.9 million and $9.7 million, respectively.
Brix credit facility consisted of the following:
| December 31, | ||||||||
| 2020 | 2019 | |||||||
| Brix Credit facility, face amount |
$ | 125,000 | 125,000 | |||||
| Net deferred finance costs |
(3,240 | ) | (4,530 | ) | ||||
|
|
|
|
|
|||||
| Total Brix Credit facility |
121,760 | 120,470 | ||||||
| Less: short-term portion |
— | — | ||||||
|
|
|
|
|
|||||
| Total Brix Credit facility |
$ | 121,760 | $ | 120,470 | ||||
|
|
|
|
|
|||||
| 6. | Fair Value Measurements |
Certain of our assets and liabilities are measured at fair value. Fair value is the price that would be received to sell an asset or paid to transfer a liability in an orderly transaction between market participants at the measurement date. We use market data or assumptions that market participants would use in pricing the asset or liability, including assumptions about risk and the risks inherent in the inputs to the valuation technique. These inputs can be readily observable, market corroborated or generally unobservable. GAAP establishes a fair value hierarchy that prioritizes the inputs used to measure fair value. The hierarchy gives the highest priority to unadjusted quoted prices in active markets for identical assets or liabilities (Level 1 measurement) and lowest priority to unobservable inputs (Level 3 measurement).
The three levels of fair value hierarchy are as follows:
| • | Level 1—Quoted prices are available in active markets for identical assets or liabilities as of the reporting date. |
| • | Level 2—Pricing inputs are other than quoted prices in active markets, which are either directly or indirectly observable as of the reporting date. Level 2 includes those financial instruments that are valued using models or other valuation methodologies. |
| • | Level 3 — Pricing inputs include significant inputs that are generally less observable from objective sources. These inputs may be used with internally developed methodologies that result in management’s best estimate of fair value. |
F-44
Table of Contents
We classify financial assets and liabilities based on the lowest level of input that is significant to the fair value measurement. Assessment of the significance of a particular input to the fair value measurement requires judgment and may affect the valuation of the fair values of assets and liabilities and their placement within the fair value hierarchy levels.
The carrying values of financial instruments, including accounts receivable and accounts payable, approximate fair value due to the short maturity of these instruments. None of our financial instruments are held for trading purposes.
Certain assets are measured at fair value on a non-recurring basis. These assets can include long-lived assets that have been reduced to fair value when they are held for sale, the initial recognition of ARO and proved and unproved properties that are written down to fair value when they are impaired. The fair value of our natural gas properties is determined using valuation techniques consistent with the income and market approach.
Assets acquired in business combinations are recorded at their fair value as of the date of acquisition. The inputs used to determine such fair value are primarily based upon internally developed cash flow models and would generally be considered as Level 3.
The factors used to determine fair value are subject to management’s judgment and expertise and include, but are not limited to, recent sales prices of comparable properties; the present value of future cash flows, net of estimated operating and development costs using estimates of proved reserves; future commodity pricing; future production estimates; anticipated capital expenditures; and various discount rates commensurate with the risk and current market conditions associated with the expected cash flow projected. These assumptions represent Level 3 inputs.
| 7. | Derivative Instruments |
Derivative assets and liabilities are presented below as gross assets and liabilities, without regard to master netting arrangements, which are considered in the presentation of derivative assets and liabilities in the accompanying balance sheets.
F-45
Table of Contents
The following table summarizes the gross fair value of our derivative assets and liabilities and the effect of netting:
| Balance Sheet |
Gross Amounts |
Netting Adjustment | Net Amounts Presented on the Balance Sheet |
|||||||||
| December 31, 2020 |
||||||||||||
| Assets: |
||||||||||||
| Current assets |
$ | 3,125 | (3,125 | ) | $ | — | ||||||
| Noncurrent assets |
1,001 | (1,001 | ) | — | ||||||||
|
|
|
|
|
|
|
|||||||
| Total assets |
$ | 4,126 | $ | (4,126 | ) | $ | — | |||||
|
|
|
|
|
|
|
|||||||
| Liabilities: |
||||||||||||
| Current liabilities |
$ | 11,409 | $ | (3,125 | ) | $ | 8,284 | |||||
| Noncurrent liabilities |
6,454 | (1,001 | ) | 5,453 | ||||||||
|
|
|
|
|
|
|
|||||||
| Total liabilities |
$ | 17,863 | $ | (4,126 | ) | $ | 13,737 | |||||
|
|
|
|
|
|
|
|||||||
| December 31, 2019 |
||||||||||||
| Assets: |
||||||||||||
| Current assets |
$ | 25,307 | $ | — | $ | 25,307 | ||||||
| Noncurrent assets |
3,325 | (1,894 | ) | 1,431 | ||||||||
|
|
|
|
|
|
|
|||||||
| Total assets |
$ | 28,632 | $ | (1,894 | ) | $ | 26,738 | |||||
|
|
|
|
|
|
|
|||||||
| Liabilities: |
||||||||||||
| Current liabilities |
$ | — | $ | — | $ | — | ||||||
| Noncurrent liabilities |
1,894 | (1,894 | ) | — | ||||||||
|
|
|
|
|
|
|
|||||||
| Total liabilities |
$ | 1,894 | $ | (1.894 | ) | $ | — | |||||
|
|
|
|
|
|
|
|||||||
Commodity Derivatives
The following summarizes our commodity derivative positions as of December 31, 2020:
| Natural Gas Swaps |
||||||||
| Production Year |
Average Daily Volumes (MMBtu) |
Weighted Average Swap Price ($/MMBtu) |
||||||
| 2021 |
216,019 | $ | 2.54 | |||||
| 2022 |
173,582 | $ | 2.54 | |||||
| 2023 |
51,140 | $ | 2.43 | |||||
| 2024 |
3,357 | $ | 2.43 | |||||
| Sold Natural Gas Calls |
||||||||
| Production Year |
Average Daily Volumes (MMBtu) |
Weighted Average Call Price ($/MMBtu) |
||||||
| 2021 |
2,041 | $ | 3.20 | |||||
F-46
Table of Contents
| 8. | Partners’ Capital and Profit Interests Awards |
Background
Our Limited Partnership Agreement (the “Agreement”) authorizes us to issue two classes of equity interests: General Partner Interests and Limited Partnership Interests. The Limited Partnership Interests are divided into three series: Class A Units, Class B Units and Class C Units, each with the rights, privileges, preferences, restrictions and obligations as provided in the Agreement.
A total of 100 General Partner Interests are authorized for issuance for each Partnership, 100 Class A Units, 2,000,000 Class B Units and 5,000 Class C Units. Each Class B Unit and Class C Unit has a fixed price of $1,000.
In general, cash distributions follow a waterfall set out in the Agreements whereby the Class B and Class C Unit Holders (collectively, the “Common Unit Holders”) receive payment until they have received distributions equal to the amount of their respective capital contributed. Once the capital is returned and certain rate of returns are achieved, distributions will be made to Class A Unit Holders in accordance with the Agreements. The distributions to Class A Holders increase based on stated return thresholds to the Common Unit Holders.
Class A Units
The Class A Units are Partnership interests that provide economic incentives to our employees who receive them. The Class A Units are intended to be “profits interests.” The Class A Units vest over a five-year period and may be forfeited or repurchased by the Company under certain circumstances as set forth in the plan governing the Class A Units and individual Class A Unit grant agreements.
The Company has granted Class A Units to select members of the Company’s management. Most of the Class A Units are treated as conditionally vesting equity but are deemed to be a profit sharing arrangement due to certain forfeiture or repurchase features of the plan. Award recipients may derive economic value in the instrument through profit sharing distributions. As such, we treat these Class A Units as profit-sharing arrangements that will trigger no compensation expense until amounts payable under such awards become probable and estimable. Holders of Class A Units generally must be employed at the time of distributions in order to receive any payments. No distributions were made or accrued during 2020 or 2019.
The remainder of the Class A Units are deemed to be equity due to their distinct forfeiture and repurchase features. As such, the units, are accounted for as equity-based compensation and are subject to remeasurement at fair value at each reporting period. We utilized the Black Scholes option pricing method to estimate fair value of the Class A equity-based compensation awards, which included probability of various outcomes. Expected volatilities are based on historical volatilities of the stock of comparable companies in our industry. The risk-free rate for periods within the contractual life of the option is based on the U.S. Treasury yield curve in effect at the time of grant. Actual results may vary depending on the
assumptions applied within the model.
Brix Class A Units
The Brix Class A Units treated as equity-based compensation awards were all issued in 2015. The fair value of the Brix Class A Units treated as equity-based compensation was approximately $7.0 million as of December 31, 2020 and 2019. The Brix Class A Units vest ratably over a five-year period conditioned upon continued service. Compensation expense recognized during 2020 and 2019 was $1.6 million and $0.9 million, respectively.
F-47
Table of Contents
The following table summarizes the Brix Class A Unit Activity:
| Brix Class A Units | ||||||||||||
| Equity-based Compensation Awards |
Profit-Sharing Arrangement |
Total | ||||||||||
| Outstanding at December 31, 2018 |
40.0 | 51.0 | 91.0 | |||||||||
| Granted |
— | 9.0 | 9.0 | |||||||||
| Forfeited |
— | — | — | |||||||||
|
|
|
|
|
|
|
|||||||
| Outstanding at December 31, 2019 |
40.0 | 60.0 | 100.0 | |||||||||
|
|
|
|
|
|
|
|||||||
| Granted |
— | 2.0 | 2.0 | |||||||||
| Forfeited |
— | (6.0 | ) | (6.0 | ) | |||||||
|
|
|
|
|
|
|
|||||||
| Outstanding at December 31, 2020 |
40.0 | 56.0 | 96.0 | |||||||||
|
|
|
|
|
|
|
|||||||
Harvest Class A Units
As of December 31, 2020 and 2019, Harvest had 54.5 Class A Units outstanding, including those granted to the CEO.
The grant date fair value of the Harvest Class A equity-based compensation awards are de minimis.
Brix Class B Units
As of December 31, 2020 and 2019, 121,678 Class B Units were issued and outstanding to Blackstone in consideration for their capital contributions.
Harvest Class B Units
As of December 31, 2020 and 2019, 2,746 Class B Units were issued and outstanding to Blackstone in consideration for their capital contributions.
Brix Class C Units
As of December 31, 2020 and 2019, 2,615 and 2,558 Class C Units, respectively, were issued and outstanding to members of management in consideration for their capital contributions.
Harvest Class C Units
As of December 31, 2020 and 2019, 169 Class C Units were issued and outstanding to members of management in consideration for their capital contributions.
| 9. | Commitments and Contingencies |
Litigation
Occasionally, we are subject to legal proceedings and claims that arise in the ordinary course of business. Like other natural gas producers, our operations are subject to extensive and rapidly changing federal and state environmental, health and safety and other laws and regulations governing air emissions, wastewater discharges and solid and hazardous waste management activities. We are not currently a party to a material legal proceeding and are not aware of any material legal or governmental proceedings against us or contemplated to be brought against us.
F-48
Table of Contents
Environmental Remediation
We are engaged in natural gas exploration and production and may become subject to certain liabilities as they relate to environmental cleanup of well sites or other environmental restoration procedures as they relate to the drilling of gas wells and the operation thereof. In connection with our acquisition of existing or previously drilled wells, we may not be aware of the environmental safeguards that were taken at the time such wells were drilled or operated. Should we determine that a liability exists with respect to any environmental cleanup or restoration, we would be responsible for curing such a violation. No material claim has been made, nor are we aware of any liability that exists, as it relates to any material environmental cleanup or restoration or the violation of any rules or regulations relating thereto.
| 10. | Related Party Transactions |
The monitoring fee that we recognized on our statements of operations is paid under a management and consulting agreement with Blackstone and our CEO, via Vintner Resources LLC, of which approximately 99% was attributable to Blackstone.
VOG and its wholly owned subsidiary, Vine Management Services LLC (“VMS”), provide certain operational, technical and administrative services to us. During 2020 and 2019, VMS billed us $8.6 million and $8.9 million, respectively, for services rendered, and administrative, LOE and exploration costs incurred, including a service fee totaling $0.2 million in both 2020 and 2019.
During 2020 and 2019, VOG issued joint interest bills to us totaling $48.2 million and $54.7 million, respectively, for our share of capital and operating expenditures on wells that VOG operates and in which we have a working interest.
During 2020 and 2019, we received $57.7 million and $67.2 million, respectively, from VOG for revenue in wells in which we participate.
During 2020 and 2019, we issued joint interest bills to VOG totaling $1.2 million and $0.7 million, respectively, for their share of capital and operating expenditures on wells that we operate and in which VOG has a working interest.
During 2020 and 2019, we paid $6.1 million and $0.1 million, respectively, to VOG for revenue in wells in which they participate.
In 2020 and 2019, we purchased $3.5 million and $4.1 million, respectively, in assets used in drilling and operating costs from VOG. In 2020 and 2019, we sold $0.4 million and $0.2 million, respectively, in assets to VOG.
| 11. | Supplemental Natural Gas Reserve Information |
Natural Gas Quantities and Property Summary
Our reserves were prepared by the independent engineering firm W.D. Von Gonten & Co. All our reserves are located within the stacked Haynesville and Mid-Bossier shale plays in the Haynesville Basin of Northwest Louisiana. Proved natural gas reserves are the estimated quantities of natural gas which geological and engineering data demonstrate, with reasonable certainty, to be recoverable in the future from known reservoirs under existing economic and operating conditions. Proved developed natural gas reserves are proved reserves expected to be recovered through existing wells and equipment in place and under operating methods being utilized at the time the estimates were made. A variety of methodologies are used to determine our proved reserve estimates. The principal methodologies employed, often in combination, are decline curve analysis, advance production type curve matching, petro physics/log analysis and analogy. Reserve estimates are inherently imprecise and estimates of new discoveries and undeveloped locations are more imprecise than estimates of established producing natural gas properties. Accordingly, these estimates are expected to change as future information becomes available.
F-49
Table of Contents
The following summarizes the changes in our proved reserves (in MMcf):
| Balance at December 31, 2018 |
402,175 | |||
| Production |
(52,503 | ) | ||
| Revision of previous estimates(1) |
(75,082 | ) | ||
| Acquisitions of reserves(2) |
862 | |||
| Extensions and discoveries(3) |
376,742 | |||
|
|
|
|||
| Balance at December 31, 2019 |
652,194 | |||
|
|
|
|||
| Production |
(85,641 | ) | ||
| Revision of previous estimates(4) |
(287,359 | ) | ||
| Acquisitions of reserves(5) |
51,224 | |||
| Extensions and discoveries(6) |
180,963 | |||
|
|
|
|||
| Balance at December 31, 2020 |
511,381 | |||
|
|
|
|||
| Proved developed reserves at: |
||||
| December 31, 2018 |
63,715 | |||
| December 31, 2019 |
138,258 | |||
| December 31, 2020 |
143,917 | |||
| Proved undeveloped reserves at: |
||||
| December 31, 2018 |
338,460 | |||
| December 31, 2019 |
513,936 | |||
| December 31, 2020 |
367,464 |
| (1) | Revision of previous estimates include changes to development plan resulting in reclassifying 26 PUD locations as they now reside outside of the 5-year development window and working interest adjustments. These negative revisions are somewhat offset by improved well performance of producing wells and resulting PUD type curve revisions, along with revisions associated with lateral length extensions. Revision of previous estimates reflect changes in previous estimates attributable to negative changes in economic factors of 78,582 MMcf, combined with positive changes in non-economic factors of 3,500 MMcf, including: |
| • | Economic factors include revisions caused by commodity prices (decrease of 122,916 MMcf) offset by positive overall cost reductions (increase of 44,334 MMcf); and |
| • | Non-economic factors include well performance improvements (increase of 36,729 MMcf), working interests revisions (decrease of 6,104 MMcf), changes resulting from the removal of proved undeveloped locations (decrease of 49,031 MMcf) and other revisions due to changes in a previously adopted development plan (increase of 21,906 MMcf). |
| (2) | Acquisitions of reserves represent acquisition of some additional leases resulting in 6 new PUD locations. |
| (3) | Extensions and discoveries represent extensions to reserves attributable to additional 93 gross drilling Locations to be developed by 2024 (as that year entered the 5-year development window), reflect updated rig count and include development plan revisions to incorporate longer laterals and conversion of 4 non-proved locations to producing in 2019. |
| (4) | Revision of previous estimates include changes to development plan resulting in reclassifying 101 PUD locations as they now reside outside of the 5-year development window. These negative revisions are somewhat offset by working and mineral interests adjustments, improved well performance of producing new wells and PUD type curve revisions. Revision of previous estimates reflect changes in previous estimates attributable to negative changes in economic factors of 256,765 MMcf, combined with negative changes in non-economic factors of 30,594 MMcf, including: |
| • | Economic factors include revisions caused by commodity prices (decrease of 396,978 MMcf) offset by positive overall cost reductions (increase of 140,213 MMcf); and |
| • | Non-economic factors include well performance improvements (increase of 31,600 MMcf), working interests revisions (increase of 6,434 MMcf), changes resulting from the removal of proved undeveloped locations (decrease of 70,388 MMcf) and other revisions due to changes in a previously adopted development plan (increase of 1,760 MMcf). |
F-50
Table of Contents
| (5) | Acquisitions of reserves represent some additional lease acquisitions in certain sections that increased our working interest. |
| (6) | Extensions and discoveries represent extensions to reserves attributable to additional 64 gross drilling locations to be developed by 2025 (as that year entered the 5-year development window) and include development plan revisions to incorporate longer laterals and conversion of 8 non-proved locations to producing in 2020. |
Our estimated proved reserves were determined using average first-day-of-the-month prices for the prior 12 months in accordance with SEC guidance. As of December 31, 2020, the SEC Price Deck was $1.99/MMBtu (Henry Hub Price) for natural gas. In determining our reserves, the SEC Price Deck was adjusted for basis differentials and other factors affecting the prices we receive. The average resulting price used was as of December 31, 2020 was $1.73 per Mcf.
The carrying value of our natural gas assets was:
| December 31, | ||||||||
| 2020 | 2019 | |||||||
| Proved natural gas properties subject to depletion |
$ | 463,045 | $ | 353,492 | ||||
| Unproved natural gas properties |
— | 1,061 | ||||||
|
|
|
|
|
|||||
| Total capitalized costs |
463,045 | 354,553 | ||||||
| Less: Accumulated depletion |
(191,837 | ) | (99,727 | ) | ||||
|
|
|
|
|
|||||
| Natural gas properties, net |
$ | 271,208 | $ | 254,826 | ||||
|
|
|
|
|
|||||
Our capital costs incurred for acquisition and development activities were:
| December 31, | ||||||||
| 2020 | 2019 | |||||||
| Proved acreage |
$ | 2,545 | $ | 2,748 | ||||
| Unproved acreage |
— | 3,229 | ||||||
| Development costs |
105,701 | 141,429 | ||||||
|
|
|
|
|
|||||
| Total |
$ | 108,246 | $ | 147,406 | ||||
|
|
|
|
|
|||||
Standardized Measure of Discounted Future Net Cash Flows Relating to Proved Natural Gas Reserves
We develop the standardized measure of discounted future net cash flows from production of proved reserves by: estimating quantities of proved reserves and future periods during which they are expected to be produced based on year-end economic conditions, calculating estimated future cash flows by multiplying production by the twelve-month average of the first of the month prices, determining the future production and development costs based on year-end economic conditions and discounting future net cash flows by applying a rate of 10%.
The assumptions used to compute the standardized measure are those prescribed by the FASB and the SEC and do not reflect the expected undiscounted or discounted cash flows or the estimated fair value. The limitations inherent in the reserve quantity estimation process, as previously discussed, are equally applicable to the standardized measure computations, since these reserve quantity estimates are the basis for the valuation process.
F-51
Table of Contents
The standardized measure was:
| December 31, | ||||||||
| 2020 | 2019 | |||||||
| Future natural gas sales |
$ | 882,384 | $ | 1,509,782 | ||||
| Future production costs |
(322,655 | ) | (453,796 | ) | ||||
| Future development costs(1) |
(303,403 | ) | (591,976 | ) | ||||
| Future income tax expense(2) |
— | — | ||||||
|
|
|
|
|
|||||
| Future net cash flows |
$ | 256,326 | $ | 464,010 | ||||
| 10% annual discount |
(78,744 | ) | (164,539 | ) | ||||
|
|
|
|
|
|||||
| Standardized measure of discounted future net cash flows |
$ | 177,582 | $ | 299,471 | ||||
|
|
|
|
|
|||||
The primary changes in the standardized measure were:
| December 31, | ||||||||
| 2020 | 2019 | |||||||
| Balance at beginning of period(2) |
$ | 299,471 | $ | 214,405 | ||||
| Sales of natural gas, net(3) |
(106,633 | ) | (87,167 | ) | ||||
| Revision of previous quantity estimates and extensions |
(6,968 | ) | 87,554 | |||||
| Acquisitions of reserves |
10,965 | 1,293 | ||||||
| Previously estimated development costs incurred |
57,863 | 81,841 | ||||||
| Net changes in future development costs |
14,020 | 60,882 | ||||||
| Net changes in prices |
(126,299 | ) | (78,163 | ) | ||||
| Accretion of discount |
29,947 | 21,440 | ||||||
| Net change in income taxes(2) |
— | — | ||||||
| Changes in timing and other differences |
5,216 | (2,614 | ) | |||||
|
|
|
|
|
|||||
| Balance at end of period(1) |
$ | 177,582 | $ | 299,471 | ||||
|
|
|
|
|
|||||
| (1) | Our calculations of future development costs include costs associated with the abandonment of the proved properties, including the costs related to undrilled proved locations. |
| (2) | Future net cash flows do not include the effects of income taxes on future revenues because we were a limited partnership not subject to entity-level income taxation as of December 31, 2020 and 2019. Accordingly, no provision for federal or state corporate income taxes has been provided because taxable income was passed through to the partners. If we had been subject to entity-level income taxation, the unaudited future income tax expense at December 31, 2020 and 2019 would have been $31.5 million and $63.8 million, respectively, which is calculated based on an estimated 25.62% blended statutory U.S. federal and state tax rate. The unaudited standardized measure at December 31, 2020 and 2019 would have been $146.1 million and $235.7 million, respectively. |
| (3) | Net gas volumes and the related revenues included in our standardized measure include all wellhead volumes. |
F-52
Table of Contents
REPORT OF INDEPENDENT REGISTERED PUBLIC ACCOUNTING FIRM
To the Board of Directors and Stockholder of
Vine Energy Inc.
Opinion on the Financial Statements
We have audited the accompanying balance sheets of Vine Energy Inc. (the “Company”) as of December 31, 2020 and 2019, and the related notes (collectively referred to as the “financial statements”). In our opinion, the financial statements present fairly, in all material respects, the financial position of the Company as of December 31, 2020 and 2019, in conformity with accounting principles generally accepted in the United States of America.
Basis for Opinion
These financial statements are the responsibility of the Company’s management. Our responsibility is to express an opinion on the Company’s financial statements based on our audits. We are a public accounting firm registered with the Public Company Accounting Oversight Board (United States) (PCAOB) and are required to be independent with respect to the Company in accordance with the U.S. federal securities laws and the applicable rules and regulations of the Securities and Exchange Commission and the PCAOB.
We conducted our audits in accordance with the standards of the PCAOB. Those standards require that we plan and perform the audit to obtain reasonable assurance about whether the financial statements are free of material misstatement, whether due to error or fraud. The Company is not required to have, nor were we engaged to perform, an audit of its internal control over financial reporting. As part of our audits, we are required to obtain an understanding of internal control over financial reporting but not for the purpose of expressing an opinion on the effectiveness of the Company’s internal control over financial reporting. Accordingly, we express no such opinion.
Our audits included performing procedures to assess the risks of material misstatement of the financial statements, whether due to error or fraud, and performing procedures that respond to those risks. Such procedures included examining, on a test basis, evidence regarding the amounts and disclosures in the financial statements. Our audits also included evaluating the accounting principles used and significant estimates made by management, as well as evaluating the overall presentation of the financial statements. We believe that our audits provide a reasonable basis for our opinion.
/s/ DELOITTE & TOUCHE LLP
Dallas, Texas
February 22, 2021
We have served as the Company’s auditor since 2016.
F-53
Table of Contents
BALANCE SHEETS
| December 31, 2020 |
December 31, 2019 |
|||||||
| Assets |
||||||||
| Total assets |
$ | — | $ | — | ||||
|
|
|
|
|
|||||
| Stockholders’ equity |
||||||||
| Notes receivable from Vine Investment LLC |
$ | (10 | ) | $ | (10 | ) | ||
|
|
|
|
|
|||||
| Common stock, $0.01 par value; authorized 1,000 shares; 1,000 issued and outstanding at December 31, 2020 and December 31, 2019 |
$ | 10 | $ | 10 | ||||
|
|
|
|
|
|||||
| Total stockholders’ equity |
$ | — | $ | — | ||||
|
|
|
|
|
|||||
The accompanying notes are integral to the balance sheets.
F-54
Table of Contents
VINE ENERGY INC.
NOTES TO BALANCE SHEETS
1. Nature of Operations
Vine Energy Inc. (“Vine”) was formed on December 30, 2016, pursuant to the laws of the State of Delaware to become a holding company for Vine Oil & Gas LP.
2. Summary of Significant Accounting Policies
Basis of Accounting and Presentation
These balance sheets have been prepared in accordance with accounting principles generally accepted in the United States of America (“GAAP”). Separate statements of income, changes in stockholder’s equity and of cash flows have not been presented because Vine has had no business transactions or activities to date. We have evaluated subsequent events through February 22, 2021 the date on which the balance sheets were available for issuance.
F-55
Table of Contents
18,750,000 Shares
Vine Energy Inc.
Class A Common Stock
Prospectus
| Citigroup | Credit Suisse | Morgan Stanley |
| BofA Securities | Barclays | RBC Capital Markets |
| Blackstone | ||||
| Capital One Securities | KeyBanc Capital Markets | MUFG | ||
| CastleOak Securities, L.P. | Drexel Hamilton | Ramirez & Co., Inc. | Stern | |||
March 9, 2021
Through and including , 2021 (the 25th day after the date of this prospectus), all dealers effecting transactions in these securities, whether or not participating in this offering, may be required to deliver a prospectus. This is in addition to a dealer’s obligation to deliver a prospectus when acting as underwriters and with respect to an unsold allotment or subscription.
Table of Contents
PART II
INFORMATION NOT REQUIRED IN PROSPECTUS
Item 13. Other expenses of issuance and distribution
The following table sets forth an itemized statement of the amounts of all expenses (excluding underwriting discounts and commissions) payable by us in connection with the registration of the common stock offered hereby. With the exception of the Registration Fee, FINRA Filing Fee and NYSE listing fee, the amounts set forth below are estimates.
| SEC Registration Fee |
$ | 44,697 | ||
| FINRA Filing Fee |
61,954 | |||
| NYSE listing fee |
150,000 | |||
| Accountants’ fees and expenses |
2,300,000 | |||
| Legal fees and expenses |
2,000,000 | |||
| Printing and engraving expenses |
400,000 | |||
| Transfer agent and registrar fees |
15,000 | |||
| Miscellaneous |
228,349 | |||
|
|
|
|||
| Total |
$ | 5,200,000 | ||
|
|
|
Item 14. Indemnification of Directors and Officers
Our amended and restated certificate of incorporation will provide that directors and officers will not be liable to the corporation or its stockholders for monetary damages to the fullest extent permitted by the DGCL. In addition, if the DGCL is amended to authorize the further elimination or limitation of the liability of directors and officers, then the liability of a director or officer of the corporation, in addition to the limitation on personal liability provided for in our certificate of incorporation, will be limited to the fullest extent permitted by the amended DGCL. Our amended and restated bylaws will provide that the corporation will indemnify, and advance expenses to, any officer or director to the fullest extent authorized by the DGCL.
Section 145 of the DGCL provides that a corporation may indemnify directors and officers as well as other employees and individuals against expenses, including attorneys’ fees, judgments, fines and amounts paid in settlement in connection with specified actions, suits and proceedings whether civil, criminal, administrative, or investigative, other than a derivative action by or in the right of the corporation, if they acted in good faith and in a manner they reasonably believed to be in or not opposed to the best interests of the corporation and, with respect to any criminal action or proceeding, had no reasonable cause to believe their conduct was unlawful. A similar standard is applicable in the case of derivative actions, except that indemnification extends only to expenses, including attorneys’ fees, incurred in connection with the defense or settlement of such action and the statute requires court approval before there can be any indemnification where the person seeking indemnification has been found liable to the corporation. The statute provides that it is not exclusive of other indemnification that may be granted by a corporation’s certificate of incorporation, bylaws, disinterested director vote, stockholder vote, agreement or otherwise.
Our amended and restated certificate of incorporation will also contain indemnification rights for our directors and our officers. Specifically, our amended and restated certificate of incorporation will provide that we shall defend, indemnify and advance expenses to our officers and directors to the fullest extent authorized by the DGCL. Further, we may maintain insurance on behalf of our officers and directors against expense, liability or loss asserted incurred by them in their capacities as officers and directors.
II-1
Table of Contents
In addition, we intend to enter into indemnification agreements with our current directors and officers containing provisions that are in some respects broader than the specific indemnification provisions contained in the DGCL. The indemnification agreements will require us, among other things, to indemnify our directors and officers against certain liabilities that may arise by reason of their status or service as directors or officers and to advance their expenses incurred as a result of any proceeding against them as to which they could be indemnified. We also intend to enter into indemnification agreements with our future directors and officers.
We intend to maintain liability insurance policies that indemnify our directors and officers against various liabilities, including certain liabilities arising under the Securities Act or the Exchange Act that may be incurred by them in their capacity as such.
The proposed form of Underwriting Agreement to be filed as Exhibit 1.1 to this registration statement provides for indemnification of our directors and officers by the underwriters against certain liabilities arising under the Securities Act or otherwise in connection with this offering.
Insofar as indemnification for liabilities arising under the Securities Act may be permitted to directors, officers or persons controlling us pursuant to the foregoing provisions, we have been informed that in the opinion of the SEC, such indemnification is against public policy as expressed in the Securities Act and is therefore unenforceable.
Item 15. Recent Sales of Unregistered Securities
Prior to the closing of this offering, based on the assumed initial public offering price of $17.50 per share of common stock (the midpoint of the price range set forth on the cover of this prospectus), we will issue shares of our common stock to the entities that comprise the Vine Energy Investment Vehicles and the Vine Energy Investment II Vehicles in connection with the Corporate Reorganization. The shares of our common stock described in this Item 15 will be issued in reliance upon the exemption from the registration requirements of the Securities Act provided by Section 4(a)(2) of the Securities Act as sales by an issuer not involving any public offering.
Item 16. Exhibits and financial statement schedules
II-2
Table of Contents
II-3
Table of Contents
| * | Previously filed. |
Item 17. Undertakings
The undersigned registrant hereby undertakes to provide to the underwriters at the closing specified in the underwriting agreement certificates in such denominations and registered in such names as required by the underwriters to permit prompt delivery to each purchaser.
Insofar as indemnification for liabilities arising under the Securities Act may be permitted to directors, officers and controlling persons of the registrant pursuant to the foregoing provisions, or otherwise, the registrant has been advised that in the opinion of the Securities and Exchange Commission such indemnification is against public policy as expressed in the Securities Act and is, therefore, unenforceable. In the event that a claim for indemnification against such liabilities (other than the payment by the registrant of expenses incurred or paid by a director, officer or controlling person of the registrant in the successful defense of any action, suit or proceeding) is asserted by such director, officer or controlling person in connection with the securities being
II-4
Table of Contents
registered, the registrant will, unless in the opinion of its counsel the matter has been settled by controlling precedent, submit to a court of appropriate jurisdiction the question whether such indemnification by it is against public policy as expressed in the Securities Act and will be governed by the final adjudication of such issue.
The undersigned registrant hereby undertakes:
| (1) | That, for purposes of determining any liability under the Securities Act, the information omitted from the form of prospectus filed as part of this registration statement in reliance upon Rule 430A and contained in a form of prospectus filed by the registrant pursuant to Rule 424(b)(1) or (4) or 497(h) under the Securities Act shall be deemed to be part of this registration statement as of the time it was declared effective. |
| (2) | That, for the purpose of determining any liability under the Securities Act, each post-effective amendment that contains a form of prospectus shall be deemed to be a new registration statement relating to the securities offered therein, and the offering of such securities at that time shall be deemed to be the initial bona fide offering thereof. |
| (3) | To provide to the underwriter at the closing specified in the underwriting agreements, certificates in such denominations and registered in such names as required by the underwriter to permit prompt delivery to each purchaser. |
II-5
Table of Contents
Pursuant to the requirements of the Securities Act of 1933, the registrant has duly caused this registration statement to be signed on its behalf by the undersigned, thereunto duly authorized, in the City of Plano, State of Texas, on March 9, 2021.
| By: | /s/ Eric D. Marsh | |
| Eric D. Marsh | ||
| President, Chief Executive Officer and Chairman of the Board |
Pursuant to the requirements of the Securities Act of 1933, as amended, this Registration Statement has been signed below by the following persons in the capacities and the dates indicated.
| Signature |
Title |
Date | ||
| /s/ Eric D. Marsh Eric D. Marsh |
President, Chief Executive Officer and Chairman of the
Board |
March 9, 2021 | ||
| * Wayne Stoltenberg |
Chief Financial Officer |
March 9, 2021 | ||
| * Brian D. Dutton |
Chief Accounting Officer |
March 9, 2021 | ||
| * Angelo G. Acconcia |
Director |
March 9, 2021 | ||
| * Murat T. Konuk |
Director |
March 9, 2021 | ||
| * Charles M. Sledge |
Director |
March 9, 2021 | ||
| *By: |
/s/ Eric D. Marsh Eric D. Marsh Attorney-in-fact |
II-6