Attached files
| file | filename |
|---|---|
| EX-99.1 - EX-99.1 - Sotera Health Co | march92021-ex991.htm |
| 8-K - 8-K - Sotera Health Co | march92021-8k.htm |
Fourth-Quarter and Full-Year 2020 Earnings Results March 9, 2021 Exhibit 99.2
Forward Looking Statements and Non-GAAP Financial Measures 2 This presentation contains forward-looking statements that reflect management’s expectations about future events and the Company’s operating plans and performance and speak only as of the date hereof. You can identify these forward-looking statements by the use of forward-looking words such as “will,” “may,” “plan,” “estimate,” “project,” “believe,” “anticipate,” “expect,” “intend,” “should,” “would,” “could,” “target,” “goal,” “continue to,” “positioned to,” “are confident” or the negative version of those words or other comparable words. In addition, any statements that refer to expectations, projections or other characterizations of future events or circumstances, including our 2021 guidance, are forward-looking statements. Any forward-looking statements contained in this presentation are based upon our historical performance and on our current plans, estimates and expectations in light of information currently available to us. The inclusion of this forward-looking information should not be regarded as a representation by us that the future plans, estimates or expectations contemplated by us will be achieved. These forward-looking statements are subject to various risks, uncertainties and assumptions relating to our operations, financial results, financial condition, business, prospects, growth strategy and liquidity. These risks and uncertainties include, without limitation, any disruption in the availability or supply of ethylene oxide (EO) or Cobalt-60; changes in industry trends, environmental, health and safety regulations or preferences; the impact of current and future legal proceedings and liability claims, including litigation related to purported exposure to emissions of EO from our facilities in Illinois, Georgia and New Mexico and the possibility that other claims will be made in the future relating to these or other facilities; our ability to increase capacity at existing facilities, renew leases for our facilities and build new facilities in a timely and cost-effective manner; the risks of doing business internationally; and any inability to pursue strategic transactions or find suitable acquisition targets. For additional discussion of these forward-looking statements, please refer to Company’s filings with the SEC, such as its annual and quarterly reports. We do not undertake any obligation to publicly update or revise these forward-looking statements, except as otherwise required by law. This presentation includes Adjusted EBITDA, Adjusted Net Income, Adjusted EPS, Net Debt and Net Leverage Ratio, which are unaudited financial measures not based on any standardized methodology prescribed by GAAP. Adjusted EBITDA, Adjusted Net Income, Adjusted EPS, Net Debt and Net Leverage Ratio may be calculated differently from, and therefore may not be comparable to, similarly titled measures used by other companies. Adjusted EBITDA, Adjusted Net Income, Adjusted EPS, Net Debt and Net Leverage Ratio should not be considered in isolation from, or as a substitute for, financial information prepared in accordance with GAAP. See the Appendix for a reconciliation of net income (loss), the most directly comparable financial measure calculated and presented in accordance with GAAP, to Adjusted Net Income and Adjusted EBITDA, a reconciliation of GAAP EPS, the most directly comparable financial measure calculated in accordance with GAAP, to Adjusted EPS, and a reconciliation of total debt, the most directly comparable financial measure calculated and presented in accordance with GAAP, to Total Net Debt and Net Leverage. This presentation also contains estimates and other statistical data made by independent parties and by the Company relating to market size and growth and other data about the Company’s industry and estimated total addressable market. This data involves a number of assumptions and limitations, and you are cautioned not to give undue weight to such estimates. We have not independently verified this market data. While we are not aware of any misstatements regarding any industry or similar data presented herein, such data involve risks and uncertainties and are subject to change based on various factors, including those described under the headings of “Risk Factors” and “Cautionary Note Regarding Forward-Looking Statements” in the Company’s prospectus dated November 19, 2020 and Form 10- K for the year ended December 31, 2020. In addition, projections, assumptions and estimates of the Company’s future performance and the future performance of the markets in which the Company operates are necessarily subject to a high degree of uncertainty and risk. The Sotera Health name, our logo and other trademarks mentioned in this presentation are the property of their respective owners. All company data and financial information included in this presentation is as of December 31, 2020, unless otherwise stated.
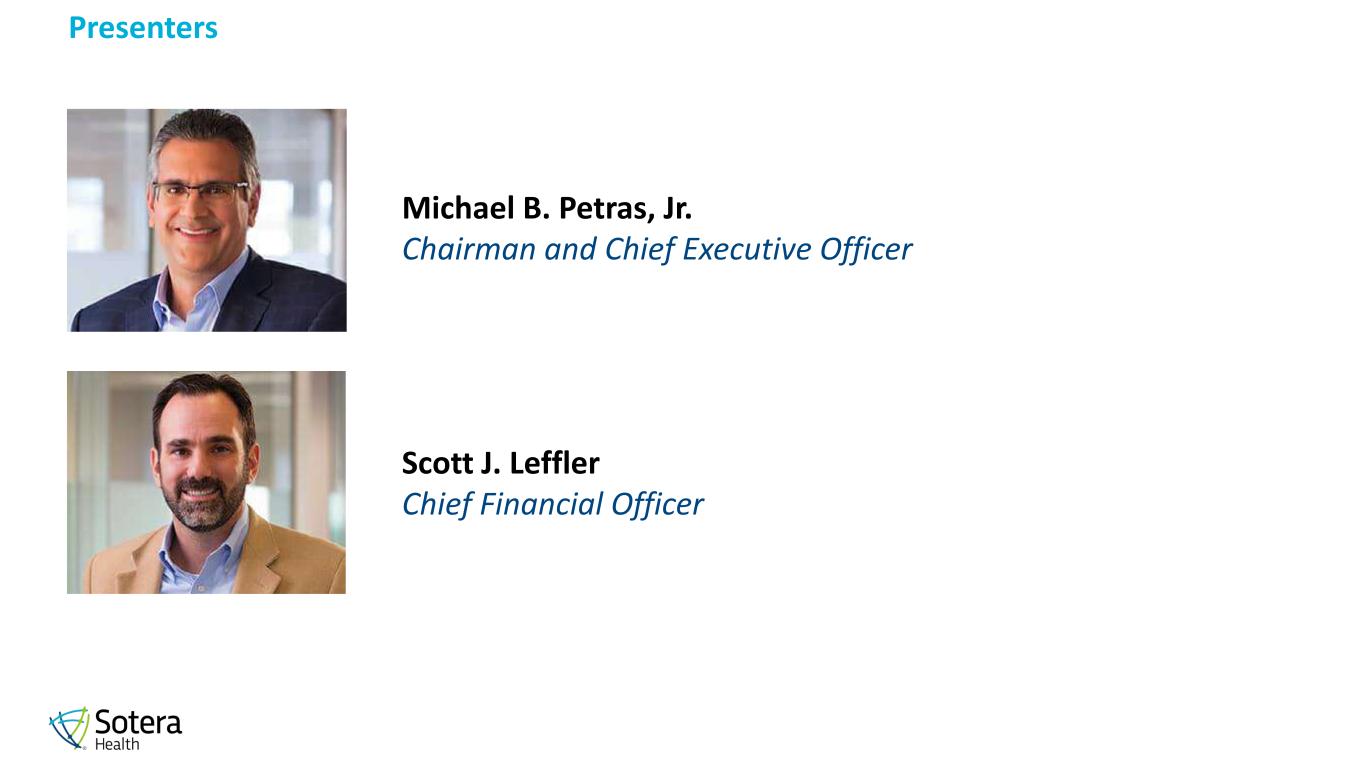
Presenters 3 Michael B. Petras, Jr. Chairman and Chief Executive Officer Scott J. Leffler Chief Financial Officer

Sotera Health at a Glance 4 About: Leading global provider of mission-critical end-to-end sterilization solutions and lab testing and advisory services for the healthcare industry History: With a combined tenure of over 200 years dating back to the 1930’s, Sotera Health goes to market through three best-in-class businesses – Sterigenics, Nordion and Nelson Labs Leader in sterilization services Leader in lab testing and advisory services

Highlights 5 • Completed IPO and began trading in November 2020 • Approximately 19% of total outstanding shares were issued • IPO generated ~$1.2B of net proceeds • Revenue: Q4 2020 increased 12% to $217M, full-year 2020 increased 5% to $818M • Adjusted EBITDA(1): Q4 2020 increased 20% to $113M, full-year 2020 increased nearly 11% to $420M • Adjusted EPS(1): Q4 2020 and full-year 2020 of $0.09 and $0.42, respectively • Nearly all IPO proceeds used to reduce debt in Q4 2020 • Net leverage(1) reduced to 4.3x as of December 31, 2020 • Upsized Revolver and repriced Term Loan in December 2020 and January 2021, respectively • Reduced anticipated annual interest expense of approximately $130M(2) Initial Public Offering Year-Over-Year Performance Capital Structure • Nelson Labs investing in European microbiological center of excellence; completion by year end 2021 • Nordion advancing Co-60 supply projects • Sterigenics investing in 9 capacity expansions, 7 of which are scheduled for go-live in 2021 Strategic Initiatives (1) For a reconciliation of GAAP to non-GAAP results, please refer to Non-GAAP Financial Measures provided in the Appendix. (2) At current LIBOR levels. Includes the impact of the Q4 2020 debt paydown and the Q1 2021 Term Loan repricing. See slide 11.
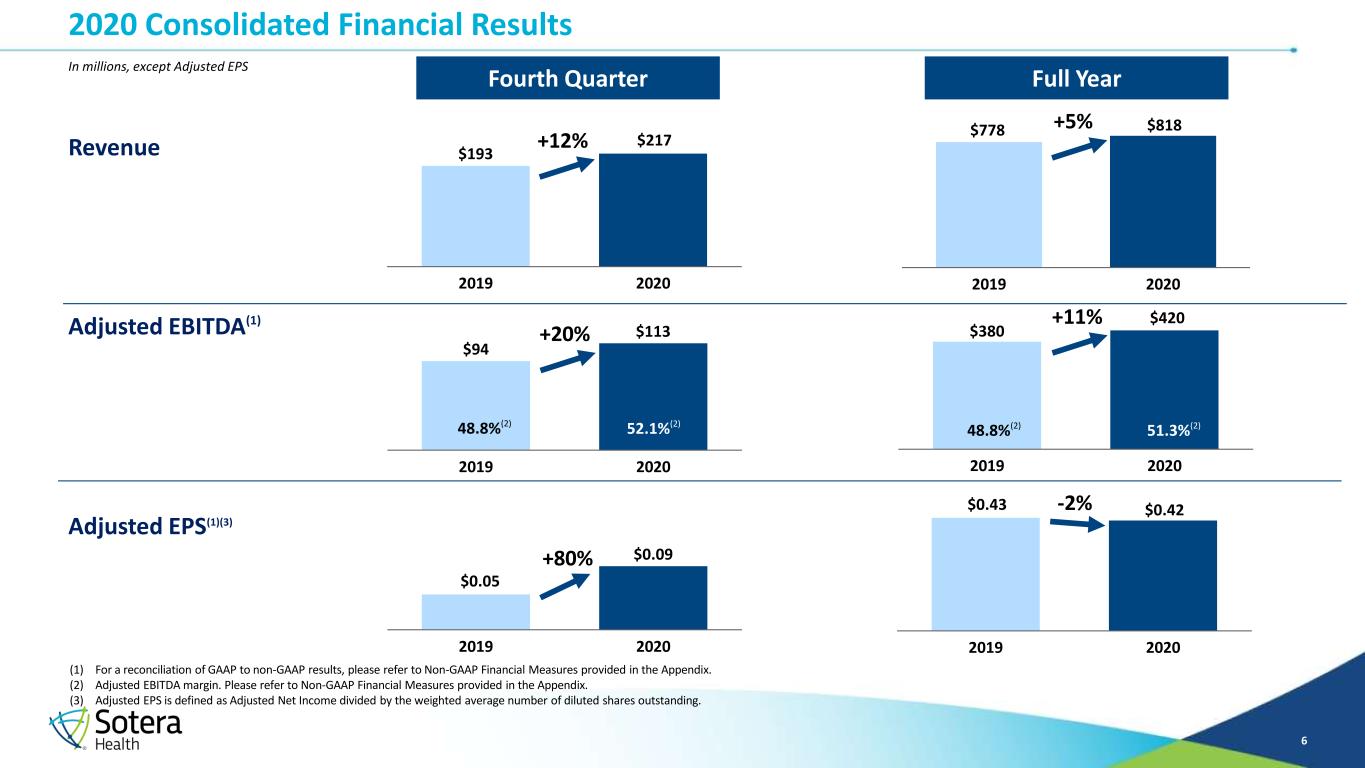
2020 Consolidated Financial Results 6 (1) For a reconciliation of GAAP to non-GAAP results, please refer to Non-GAAP Financial Measures provided in the Appendix. (2) Adjusted EBITDA margin. Please refer to Non-GAAP Financial Measures provided in the Appendix. (3) Adjusted EPS is defined as Adjusted Net Income divided by the weighted average number of diluted shares outstanding. % margin Full Year $778 $818 2019 2020 $193 $217 2019 2020 Fourth Quarter Revenue Adjusted EBITDA(1) $94 $113 2019 2020 $380 $420 2019 2020 Adjusted EPS(1)(3) $0.05 $0.09 2019 2020 $0.43 $0.42 2019 2020 48.8%(2) 52.1%(2) 48.8%(2) 51.3%(2) +12% +5% +20% +11% +80% -2% In millions, except Adjusted EPS
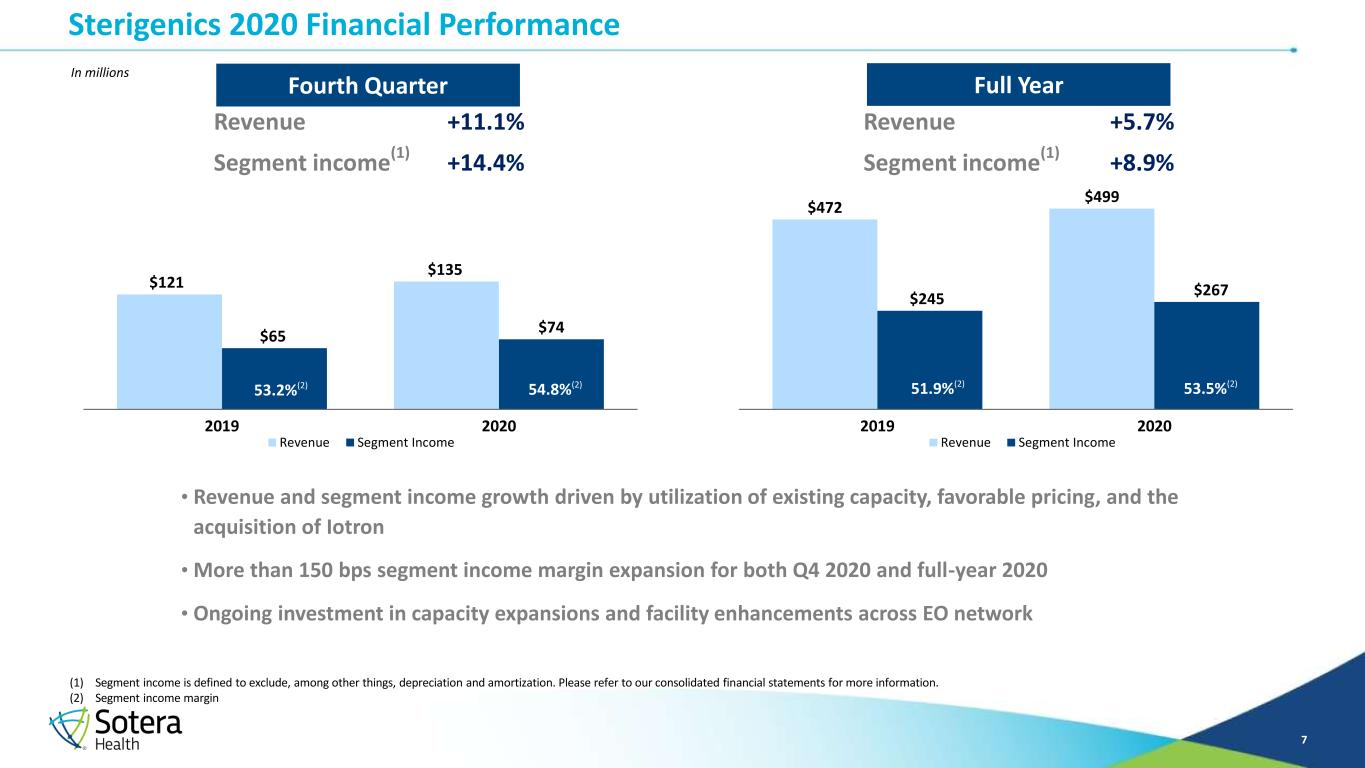
Revenue +11.1% Segment income (1) +14.4% Revenue +5.7% Segment income (1) +8.9% Sterigenics 2020 Financial Performance 7 $121 $135 $65 $74 2019 2020 Revenue Segment Income $472 $499 $245 $267 2019 2020 Revenue Segment Income • Revenue and segment income growth driven by utilization of existing capacity, favorable pricing, and the acquisition of Iotron • More than 150 bps segment income margin expansion for both Q4 2020 and full-year 2020 • Ongoing investment in capacity expansions and facility enhancements across EO network Fourth Quarter Full Year 53.2%(2) 54.8% (2) 51.9%(2) 53.5%(2) (1) Segment income is defined to exclude, among other things, depreciation and amortization. Please refer to our consolidated financial statements for more information. (2) Segment income margin In millions

Revenue +18.2% Segment income (1) +28.9% Revenue -1.2% Segment income (1) +7.4% Nordion 2020 Financial Performance 8 $24 $29 $12 $16 2019 2020 Revenue Segment Income $116 $115 $62 $67 2019 2020 Revenue Segment Income • Q4 2020 revenue growth driven by favorable pricing and Co-60 harvesting schedule, which resulted in higher sales volumes of industrial-use Co-60 • Full-year 2020 revenue decline driven by lower volumes of medical-use Co-60 impacted by COVID-19 • More than 450 bps segment income margin expansion for both Q4 and full-year 2020 driven by favorable price and Co-60 mix Fourth Quarter Full Year 51.4%(2) 56.1%(2) 53.5%(2) 58.2%(2) (1) Segment income is defined to exclude, among other things, depreciation and amortization. Please refer to our consolidated financial statements for more information. (2) Segment income margin In millions

Revenue +11.4% Segment income (1) +32.6% Revenue +7.4% Segment income (1) +18.7% Nelson Labs 2020 Financial Performance 9 $48 $53 $17 $23 2019 2020 Revenue Segment Income $190 $205 $73 $86 2019 2020 Revenue Segment Income • Top line driven by increased demand for services related to personal protective equipment • Favorable mix and ramp-up of OpEx initiatives drove segment income margin expansion of almost 700bps for Q4 2020 and 400bps for full-year 2020 Fourth Quarter Full Year 36.4%(2) 43.4%(2) 38.2% (2) 42.2%(2) (1) Segment income is defined to exclude, among other things, depreciation and amortization. Please refer to our consolidated financial statements for more information. (2) Segment income margin In millions

10 (1) Excludes any Capital Expenditures included in accounts payable or accruals at the end of the period. The amount in accounts payable or accruals as of 12/31/20 and 12/31/19 were $14M and $5M, respectively. (2) Revolving availability is calculated as maximum facility size less letters of credit. (3) Maximum facility size was $190M and $347.5M as of 12/31/19 and 12/31/20, respectively. % margin Capital Expenditures(1) $127 $284 $63 $102 12/31/2019 12/31/2020 Revolver Availability Cash $190 $386 (2)(3) $21 $57 $20 $54 Q4 Full Year 2019 2020 Capital Expenditures and Liquidity • Recovered pace of CapEx investment in Q4 2020, but overall levels for full-year 2020 depressed by pandemic- related challenges • Continued commitment to facility investments in across our global footprint • Upsized revolver by more than $150M • Finished 2020 in solid cash position • More than doubled liquidity to $386M Liquidity In millions (1) (1)

Deleveraging and Capital Markets 11 (1) For a reconciliation of GAAP to non-GAAP results, please refer to Non-GAAP Financial Measures provided in the Appendix. (2) Sotera Health expects interest savings will be partially offset by cash and non-cash charges associated with the repricing of its Term Loan. (3) Long-term-target is forward-looking and reflects expectations as of March 9, 2021. Sotera Health assumes no obligation to update this statement. Results may be materially different and are affected by many factors detailed in Sotera Health’s SEC filings, including Sotera Health’s 2020 Form 10-K. (4) At current LIBOR levels. Current run rate includes impact of Q4 2020 debt paydown and Q1 2021 Term Loan repricing. % margin Actual Q3 2020 Pro Forma Q3 2020 Actual Q4 2020 $215 $80 FY 2020 Interest Expense Current Run Rate 7.2x 4.5x 4.3x Long-term target net leverage range of 2.0x – 4.0x(3) (1) Reduction of approximately $135M of annual interest expense In millions Expected Annual Interest Expense Reduction(2)Net Leverage Reduction(1) (4)

12 2021 Guidance On the following slides, Sotera Health presents an overview of its full-year 2021 Guidance, including certain non-GAAP measures. As outlined in the company’s March 9, 2021 press release, Sotera Health does not provide a reconciliation of the forward-looking Adjusted EBITDA and Adjusted EPS guidance to the most directly comparable GAAP measure, as this cannot be done without unreasonable effort due to the variability and low visibility with respect to certain costs.
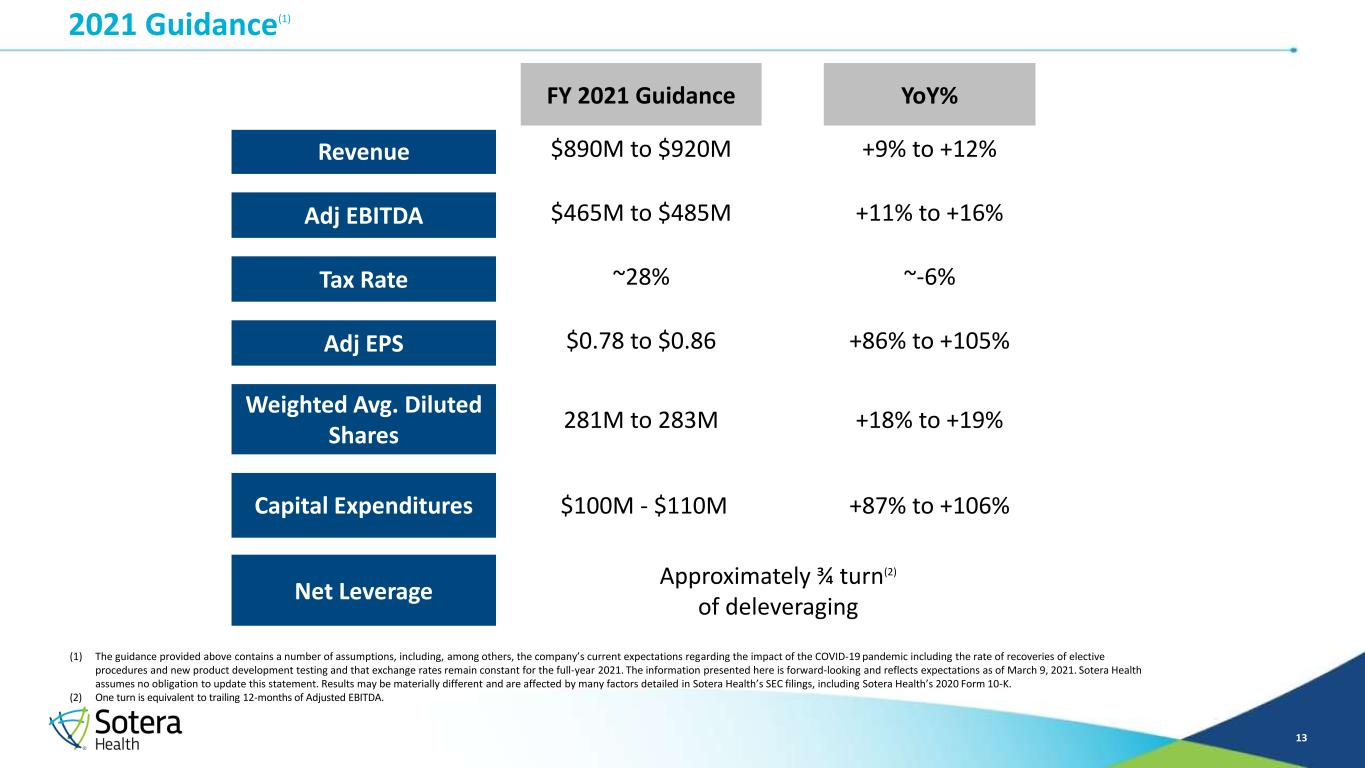
2021 Guidance(1) 13 (1) The guidance provided above contains a number of assumptions, including, among others, the company’s current expectations regarding the impact of the COVID-19 pandemic including the rate of recoveries of elective procedures and new product development testing and that exchange rates remain constant for the full-year 2021. The information presented here is forward-looking and reflects expectations as of March 9, 2021. Sotera Health assumes no obligation to update this statement. Results may be materially different and are affected by many factors detailed in Sotera Health’s SEC filings, including Sotera Health’s 2020 Form 10-K. (2) One turn is equivalent to trailing 12-months of Adjusted EBITDA. FY 2021 Guidance YoY% Revenue $890M to $920M +9% to +12% Adj EBITDA $465M to $485M +11% to +16% Tax Rate ~28% ~-6% Adj EPS $0.78 to $0.86 +86% to +105% Weighted Avg. Diluted Shares 281M to 283M +18% to +19% Capital Expenditures $100M - $110M +87% to +106% Net Leverage Approximately ¾ turn(2) of deleveraging

2021 Qualitative Guidance(1) 14 • Q1 2021 revenue expectation of $205M to $210M • Nordion sales expectations fairly balanced between 1st and 2nd half of 2021, but sales can be impacted by changes in Co-60 harvest schedules Quarterly Rhythm Guidance based on current rates as of December 31, 2020FX Impact Prioritizing business investment and debt reduction, with potential for opportunistic acquisitions Capital Deployment Expecting gradual normalization of volumes throughout 2021COVID-19 (1) The guidance provided above contains a number of assumptions, including, among others, the company’s current expectations regarding the impact of the COVID-19 pandemic including the rate of recoveries of elective procedures and new product development testing and that exchange rates remain constant for the full-year 2021. The information presented here is forward-looking and reflects expectations as of March 9, 2021. Sotera Health assumes no obligation to update this statement. Results may be materially different and are affected by many factors detailed in Sotera Health’s SEC filings, including Sotera Health’s 2020 Form 10-K.

15 Appendix

Non-GAAP Financial Measures 16 (a) Represents impairment charges related to the decision to not reopen the Willowbrook, Illinois facility in September 2019. (b) Includes non-cash share-based compensation expense. 2019 also includes $10.0 million of one-time cash share-based compensation expense related to the pre-IPO Class C Units, which vested in the third quarter of 2019. (c) Represents cash bonuses for members of management relating to the November 2020 IPO and the December 2019 refinancing. (d) Represents the effects of (i) fluctuations in foreign currency exchange rates, primarily related to remeasurement of intercompany loans denominated in currencies other than subsidiaries’ functional currencies, and (ii) non-cash mark-to-fair value of embedded derivatives relating to certain customer and supply contracts at Nordion. (e) Represents (i) certain direct and incremental costs related to the acquisitions of Gibraltar Laboratories, Inc. (“Nelson Fairfield”) in 2018 and Iotron Industries Canada, Inc. in July 2020, and certain related integration efforts as a result of those acquisitions, (ii) the earnings impact of fair value adjustments (excluding those recognized within amortization expense) resulting from the businesses acquired, and (iii) transition services income and non-cash deferred lease income associated with the terms of the divestiture of the Medical Isotopes business in 2018. (f) Represents professional fees, contract termination and exit costs, severance and other payroll costs, and other costs associated with business optimization and cost savings projects relating to the integration of Nelson Labs, the Sotera Health rebranding, operating structure realignment and other process enhancement projects. (g) Represents professional fees, severance and other payroll costs, and other costs including ongoing lease and utility expenses associated with the closure of the Willowbrook, Illinois facility. (h) Represents expenses incurred in connection with the refinancing of our debt capital structure in December 2019 and paydown of debt following the November 2020 IPO, including accelerated amortization of prior debt issuance and discount costs, premiums paid in connection with early extinguishment and debt issuance and discount costs incurred for the new debt. (i) Represents professional fees related to litigation associated with our EO sterilization facilities and other related professional fees. (j) Represents non-cash accretion of asset retirement obligations related to Co-60 and gamma processing facilities, which are based on estimated site remediation costs for any future decommissioning of these facilities (without regard for whether the decommissioning services would be performed by employees of Nordion, instead of by a third party) and are accreted over the life of the asset. (k) Represents non-recurring costs associated with COVID-19 pandemic, including donations to related charitable causes and special bonuses for front-line personnel working on-site during lockdown periods. (l) Represents the tax benefit or provision associated with the reconciling items between net loss and Adjusted Net Income. To determine the aggregate tax effect of the reconciling items, we utilized statutory income tax rates ranging from 0% to 35%, depending upon the applicable jurisdictions of each adjustment. (m) Includes depreciation of Co-60 held at gamma irradiation sites. (n) Represents the difference between income tax expense or benefit as determined under U.S. GAAP and the income tax benefit associated with pre-tax adjustments described in footnote (l). (unaudited) ($’s in thousands, except per share amounts)

IPO Pro Forma September 30, 2020 Adjustments September 30, 2020 December 31, 2020 Current portion of long-term debt 21,200$ -$ 21,200$ -$ Long-term debt less current portion (1) 2,888,780 (1,082,138) 1,806,642 1,824,789 Current portion of finance leases 1,044 - 1,044 1,173 Finance lease less current portion 30,743 - 30,743 34,939 Total Debt 2,941,767 (1,082,138) 1,859,629 1,860,901 Add: unamortized debt issuance costs and debt discounts 69,870 (28,862) 41,008 38,761 Less: cash and cash equivalents (2) (108,446) 17,400 (91,046) (102,454) Total Net Debt 2,903,191$ (1,093,600)$ 1,809,591$ 1,797,208$ Trailing 12-month Adjusted EBITDA 401,267$ 401,267$ 419,859$ Net Leverage 7.2x 4.5x 4.3x Non-GAAP Financial Measures 17 (1) Long-term debt less current portion reduction of $1,082M is comprised of $1,111M principal paydown and $29M write off of unamortized debt issuance costs and debt discounts. (2) Cash IPO Adjustment represents the payment of accrued interest on our Term Loan and 2nd Lien Notes. (unaudited) ($’s in thousands)
