Attached files
| file | filename |
|---|---|
| 8-K - FORM 8-K - Inotiv, Inc. | tm219034d1_8k.htm |
Exhibit 99.1

Company Presentation March 2021
| 1 |
Forward - Looking Statements This presentation includes forward - looking statements within the meaning of the Private Securities Litigation Reform Act of 1995 that are subject to risks and uncertainties that could cause actual results to differ materially from those projected. Forward - looking statements can often be identified by words such as: "anticipate," "intend," "plan," "goal," "seek," "believe," "project," "estimate," "expect," "strategy," "future," "likely," " may ," "should," "will" and similar references to future periods. Forward - looking statements may include, but are not limited to, statements regarding our intent, belief or curre nt expectations with respect to ( i ) our strategic plans; (ii) trends in the demand for our products and services; (iii) trends in the industries that consume our pro duc ts and services; (iv) our ability to develop new products and services; (v) our ability to make capital expenditures and finance operations; (vi) global economic conditio ns, especially as they impact our markets; (vii) our cash position; (viii) our ability to successfully integrate the operations and personnel associated with recent acq uis itions; (ix) our ability to effectively manage current expansion efforts and any future expansion or acquisition initiatives undertaken by the Company; (x) our ability to d eve lop and build infrastructure and teams to manage growth and projects; (xi) our ability to continue to retain and hire key talent; (xii) our ability to market our se rvi ces and products under relevant brand names; (xiii) our ability to service our outstanding indebtedness, (xiv) our expectations regarding the volume of new booking s, pricing, gross profit margins and liquidity, (xv) the impact of COVID - 19 on the economy, demand for our services and products and our operations, including the me asures taken by governmental authorities to address the pandemic, which may precipitate or exacerbate other risks and/or uncertainties, and (xvi) addition al risks set forth in the Company’s filings with the Securities and Exchange Commission. Actual results may differ materially from those in the forward - looking statements a s a result of various factors, including but not limited to the risk factors disclosed in our reports with the SEC, many of which are beyond our control. You should not rely upon forward - looking statements as predictions of future events. Although the Company believes that the expe ctations reflected in the forward - looking statements are reasonable, the Company cannot guarantee that the future results, levels of activity, performance or eve nts and circumstances reflected in the forward - looking statements will be achieved or occur. Any forward - looking statement made by us during the course of our pres entation or in these slides is based only on information currently available to us and speaks only as of the date on which it is made. We undertake no obligation to publicly update any forward - looking statement, whether written or oral, that may be made from time to time, whether as a result of new information, future develo pme nts or otherwise. 2
| 2 |

Company Overview • Bioanalytical Systems, Inc., doing business as Inotiv, is a growing contract research organization (“CRO”) focused on delivering superior client service to the world’s leading drug development companies and medical research organizations. • We provide a comprehensive suite of high quality nonclinical and analytical contract research services in support of our clients’ discovery and development objectives. • We reduce the cost and time to bring new drugs to market. • We were founded in 1974 and reinvented in 2017 , when current leadership launched a new strategic plan and vision for the Company. 3 Headquarters West Lafayette, IN Year Formed 1974 Employees ~430 Exchange/Ticker NASDAQ/BASI* Recent Price (3/2/21) $20.14 Shares Out. (2/5/21) 11 mm Market Cap. (3/2/21) ~$222 mm Total Cash (12/31/20) ~$1 mm Total Debt (12/31/20) ~$24 mm Enterprise Value (3/2/21) ~$245 mm Insider Ownership ~23% *To be changed to “NOTV” or similar symbol if shareholders approve the name change at annual meeting on March 18, 2021
| 3 |

Inotiv’s Comprehensive CRO Service Offering 4 Optimization Lead Se l ect i on Preclinical Devel o pm e n t I I I III Drug Discovery Clinical Development • Toxicology • Med Device Toxicology/Surgical Models • Drug Metabolism & Pharmacokinetics (+ GLP TK & PK Analysis) • Mechanistic Pharmacology & Toxicology/ Biomarker Discovery • Contemporary Bioanalysis • Safety Pharmacology • Histopathology (GLP) • Pathology (GLP) • Formulation Chemistry • Genetic Toxicology • General Toxicology (GLP) • Developmental & Repro Tox (GLP) • Medical Device Toxicology (GLP) • Regulated Bioanalysis (GLP/GCLP) • Safety Pharmacology Battery (GLP) • Clinical Biomarker Development (GLP) • Genetic Toxicology (GLP) • Biotherapeutics (GLP) • Program Management/IND • Clinical Bioanalysis (GC L P) • Clinical Pharmacology/Biomarker (GC L P) • Bioequivalence (GXP) • Biotherapeutics (GC L P) • Center of Excellence (COE) • Internal Investment in COE • External Partnership
| 4 |
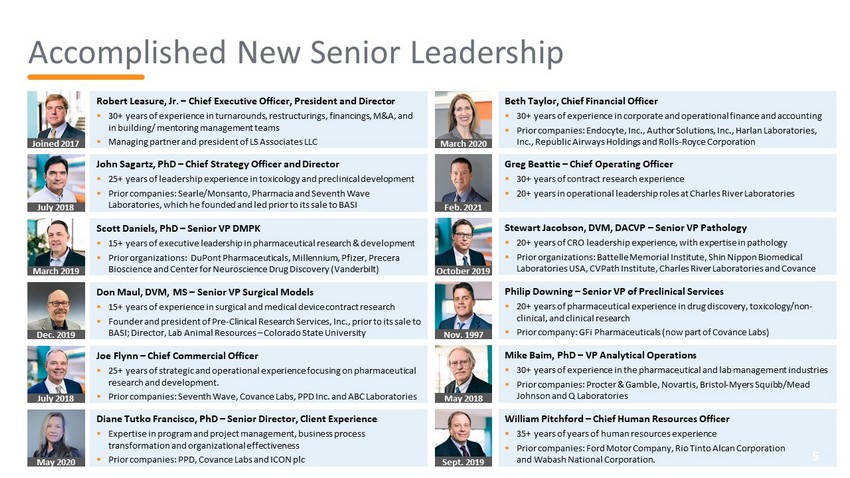
William Pitchford – Chief Human Resources Officer ▪ 35+ years of years of human resources experience ▪ Prior companies: Ford Motor Company, Rio Tinto Alcan Corporation and Wabash National Corporation. Accomplished New Senior Leadership 5 Beth Taylor, Chief Financial Officer ▪ 30+ years of experience in corporate and operational finance and accounting ▪ Prior companies: Endocyte , Inc., Author Solutions, Inc., Harlan Laboratories, Inc., Republic Airways Holdings and Rolls - Royce Corporation John Sagartz, PhD – Chief Strategy Officer and Director ▪ 25+ years of leadership experience in toxicology and preclinical development ▪ Prior companies: Searle/Monsanto, Pharmacia and Seventh Wave Laboratories, which he founded and led prior to its sale to BASI Stewart Jacobson, DVM, DACVP – Senior VP Pathology ▪ 20+ years of CRO leadership experience, with expertise in pathology ▪ Prior organizations: Battelle Memorial Institute, Shin Nippon Biomedical Laboratories USA, CVPath Institute, Charles River Laboratories and Covance Scott Daniels, PhD – Senior VP DMPK ▪ 15+ years of executive leadership in pharmaceutical research & development ▪ Prior organizations: DuPont Pharmaceuticals, Millennium, Pfizer, Precera Bioscience and Center for Neuroscience Drug Discovery (Vanderbilt) Philip Downing – Senior VP of Preclinical Services ▪ 20+ years of pharmaceutical experience in drug discovery, toxicology/non - clinical, and clinical research ▪ Prior company: GFi Pharmaceuticals (now part of Covance Labs) Don Maul, DVM, MS – Senior VP Surgical Models ▪ 15+ years of experience in surgical and medical device contract research ▪ Founder and president of Pre - Clinical Research Services, Inc., prior to its sale to BASI; Director, Lab Animal Resources – Colorado State University Mike Baim , PhD – VP Analytical Operations ▪ 30+ years of experience in the pharmaceutical and lab management industries ▪ Prior companies: Procter & Gamble, Novartis, Bristol - Myers Squibb/Mead Johnson and Q Laboratories March 2020 July 2018 October 2019 Joe Flynn – Chief Commercial Officer ▪ 25+ years of strategic and operational experience focusing on pharmaceutical research and development. ▪ Prior companies: Seventh Wave, Covance Labs, PPD Inc. and ABC Laboratories March 2019 Dec. 2019 July 2018 Nov. 1997 May 2018 Sept. 2019 Diane Tutko Francisco, PhD – Senior Director, Client Experience ▪ Expertise in program and project management, business process transformation and organizational effectiveness ▪ Prior companies: PPD, Covance Labs and ICON plc May 2020 Robert Leasure, Jr. – Chief Executive Officer, President and Director ▪ 30+ years of experience in turnarounds, restructurings, financings, M&A, and in building/ mentoring management teams ▪ Managing partner and president of LS Associates LLC Joined 2017 Greg Beattie – Chief Operating Officer ▪ 30+ years of contract research experience ▪ 20+ years in operational leadership roles at Charles River Laboratories Feb. 2021
| 5 |
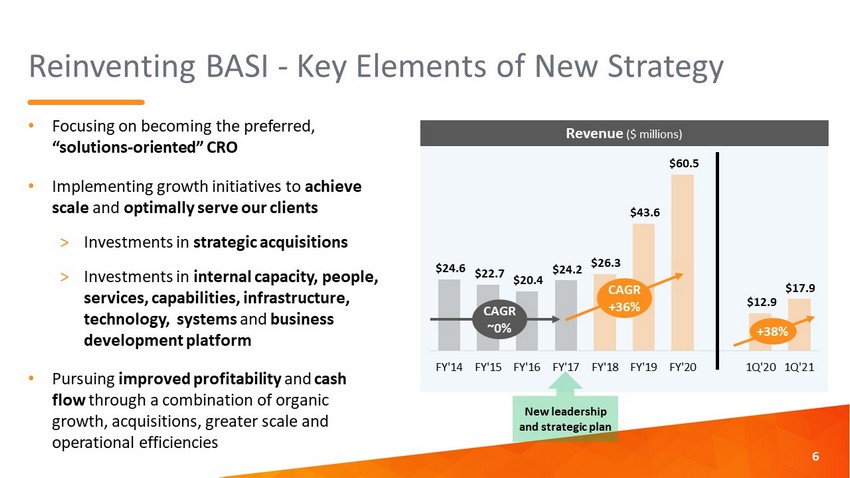
Reinventing BASI - Key Elements of New Strategy • Focusing on becoming the preferred, “solutions - oriented” CRO • Implementing growth initiatives to achieve scale and optimally serve our clients > Investments in strategic acquisitions > Investments in internal capacity, people, services, capabilities, infrastructure, technology, systems and business development platform • Pursuing improved profitability and cash flow through a combination of organic growth, acquisitions, greater scale and operational efficiencies 6 $24.6 $22.7 $20.4 $24.2 $26.3 $43.6 $60.5 $12.9 $17.9 FY'14 FY'15 FY'16 FY'17 FY'18 FY'19 FY'20 1Q'20 1Q'21 Revenue ($ millions) CAGR ~0% CAGR +36% +38% New leadership and strategic plan
| 6 |

Becoming the Preferred, “Solutions - Oriented” CRO • Many biopharma firms and clients are seeking solutions - oriented, full - service partners to assist in research and product development • Cultural alignment with our emerging biopharma entrepreneurial client base • By expanding our expertise and services across the complete drug discovery & development continuum through internal initiatives and acquisitions, we intend to: > Enhance project management skills, client services and communication thereby providing a superlative client experience > Continue to attract, retain and elevate world - class professional talent and scientific & commercial leaders > Establish a platform for growth > Set a new standard for partnered research in order to differentiate ourselves from competitors > Generate the best data for the best decision 7
| 7 |

8 Development and Reproduction • Juvenile Assessments • Fertility • Embryonic Development Surgical Models • Invasive Approaches • Wound Healing • Medical Devices • Imaging 2017 Base July 2018 May 2019 Dec. 2019 Discovery In Vivo and In Vitro • Pharmacology • Toxicology • Drug Metabolism • Pathology GLP Toxicology • Rodents • Canines • Swine • Non - Human Primates • Pharmacokinetics GLP Bioanalysis • Method Development • Method Validation • Sample Analysis We brought together a group of niche service providers to fill a void created by consolidation within the contract research industry Acquisition Building Blocks – Bringing Additional Capacity and Services
| 8 |

9 Inotiv’s Centers of Excellence Gaithersburg, MD Leased property 2 Buildings 40,000 Sq. Ft. Fort Collins, CO Owned property 1 building + Unoccupied Lot 24,000 Sq. Ft. Lease additional 13,000 Sq. Ft. Maryland Heights, MO Leased property 1 building 50,000 Sq. Ft. 20,000 Sq. Ft. unoccupied West Lafayette, IN Owned property 1 building - Headquarters 120,000 Sq. Ft. Sub - lease 50,000 Sq. Ft. Evansville, IN Owned property 10 Buildings 96,000 Sq. Ft. 52 Acres
| 9 |

Internal Investments to Drive Organic Growth • Increased internal capacity and upgraded facilities – > Capital investments of $14.7 million from FY 2017 through FY 2020 > Evansville facility - annual capacity expanded from $13 million to $27 million • Infrastructure – enhancements to client services and building program management functions to enhance client communication and the overall client experience • Systems – new ERP system throughout the company, new client relationship system with metric reporting, design and implement enterprise technology solution for study management, design of laboratory information management system and creating one common IT platform • People – recruiting top scientific talent and enhancing work environment by focusing on career development and a professional, gratifying work environment (driving lower employee turnover) • Services – developing internal capabilities for additional service offerings to meet client needs and to reduce outsourcing • Rebranding – unified our services businesses under our new trade name, Inotiv, and our philosophy of “ expect more” 10 Inotiv’s expanded Evansville facility
| 10 |

Levers to Improve Profitability • Accretive and scalable investments • Internal growth plans to leverage existing direct fixed cost • Take advantage of purchasing opportunities • Reduce business development expenses and lower client - acquisition costs as a percentage of revenue • Reduce corporate overhead as a percentage of revenue • Develop additional in - house capabilities to reduce reliance on outsourcing services to third parties 11
| 11 |
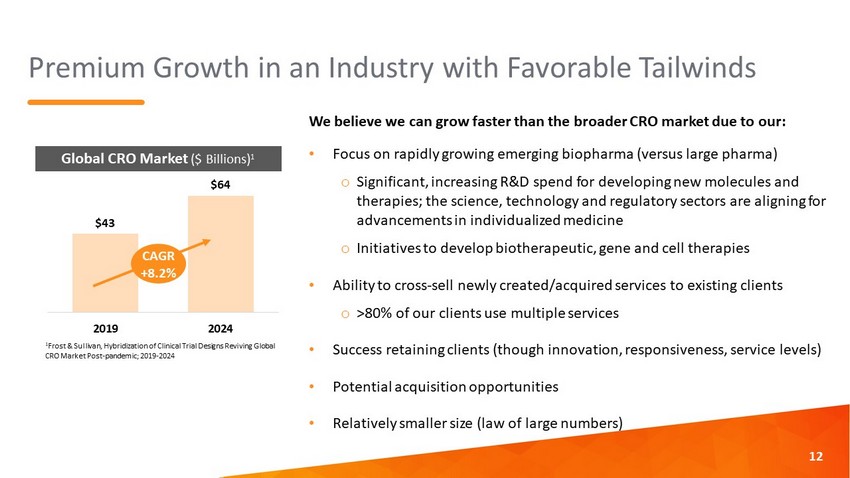
Premium Growth in an Industry with Favorable Tailwinds We believe we can grow faster than the broader CRO market due to our: • Focus on rapidly growing emerging biopharma (versus large pharma) o Significant, increasing R&D spend for developing new molecules and therapies; the science, technology and regulatory sectors are aligning for advancements in individualized medicine o Initiatives to develop biotherapeutic, gene and cell therapies • Ability to cross - sell newly created/acquired services to existing clients o >80% of our clients use multiple services • Success retaining clients (though innovation, responsiveness, service levels) • Potential acquisition opportunities • Relatively smaller size (law of large numbers) 12 $43 $64 2019 2024 CAGR +8.2% Global CRO Market ($ Billions) 1 1 Frost & Sullivan, Hybridization of Clinical Trial Designs Reviving Global CRO Market Post - pandemic; 2019 - 2024
| 12 |

Diverse Client Base and Significant Exposure to High Growth Emerging Biopharma 13 96% 4% Emerging Biopharma Traditional Big Pharma FY’20 Awards – Emerging Biopharma 44% 56% Top 15 Clients All Other Clients FY’20 Awards - Top 15 Clients None of our clients contribute >10% of revenue Of our top 100 clients, >25% are developing cell/gene therapies
| 13 |
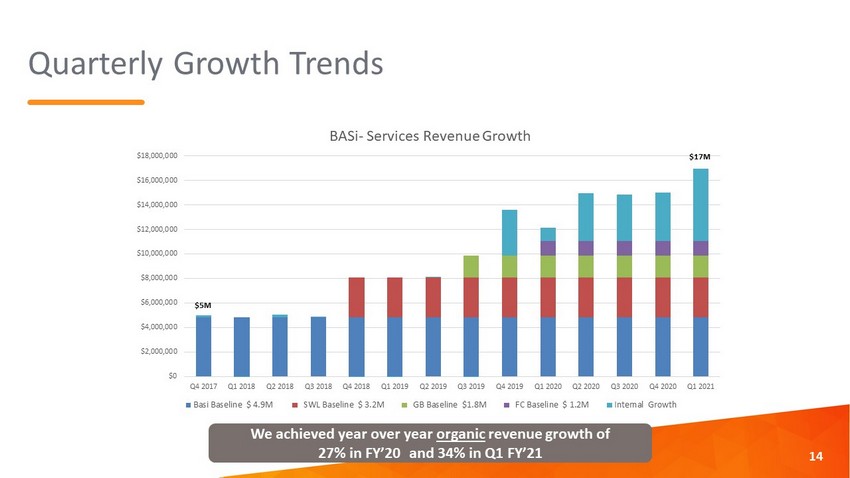
Quarterly Growth Trends $0 $2,000,000 $4,000,000 $6,000,000 $8,000,000 $10,000,000 $12,000,000 $14,000,000 $16,000,000 $18,000,000 Q4 2017 Q1 2018 Q2 2018 Q3 2018 Q4 2018 Q1 2019 Q2 2019 Q3 2019 Q4 2019 Q1 2020 Q2 2020 Q3 2020 Q4 2020 Q1 2021 BASi - Services Revenue Growth Basi Baseline $ 4.9M SWL Baseline $ 3.2M GB Baseline $1.8M FC Baseline $ 1.2M Internal Growth $5M $17M 14 We achieved year over year organic revenue growth of 27% in FY’20 and 34% in Q1 FY’21
| 14 |

15 Book to Bill Ratio and Backlog Trends by Period $17.1 $27.4 $43.8 $35.7 $45.3 FY'18 FY'19 FY'20 1Q'20 1Q'21 Backlog ($ millions) +27% CAGR +60% 0.79x 0.94x 1.07x 1.26x 1.16x FY'17 FY'18 FY'19 FY'20 1Q'21 Book to Bill Ratio (services only) Engaged business development team Focused on enhancing client experience Developed infrastructure for internal growth
| 15 |

Summary of Investment Thesis • New leadership team aligned with shareholders , successfully implementing a strategy to transform the business • Building a comprehensive suite of CRO solutions , ranging from small to large molecule therapies to medical devices • Delivering a superior client experience (client - centric focus) • Driving value and growth through acquisitions and internal investments • Significant operating leverage and margin expansion potential with increasing revenues • Benefiting from favorable industry tailwinds and participation in premium growth segments , such as emerging biopharma 16
| 16 |

Ten Recent Accomplishments 1. Managing through coronavirus pandemic and maintaining contracted services 2. Name change and branding strategy implemented 3. Growing client base and backlog 4. Recruiting, building team and maintaining low employee turnover 5. Internally developing and investing in discovery stage services strategy and growth plan 6. Investments in services to reduce outsourcing (safety pharmacology service, SEND reporting and clinical pathology service) 7. Significant upgrades in all facilities, including major expansion in Evansville completed in March 2020 8. Integration and improvements of recent acquisitions 9. Focus on building project management team for multi - site projects and client experience team (service) 10. Implemented new accounting systems throughout the company and creating one common IT platform 17
| 17 |

Appendix
| 18 |

Year over Year Quarter over Quarter 19 Financial Results Overview FY 2018 FY 2019 FY 2020 Q1 2020 Q1 2021 Revenues 26,346,000$ 43,616,000$ 60,469,000$ 12,918,000$ 17,885,000$ Net Income * (193)$ (790,000)$ (4,685,000)$ (1,426,000)$ (366,000)$ Adjusted EBITDA 2,424,000$ 2,834,000$ 2,548,000$ 481,000$ 1,296,000$ Adj EBITDA as a % of Revenue 9.2% 6.5% 4.2% 3.7% 7.2% % Growth Revenues Period over Period 8.7% 65.6% 38.6% 38.5% Number of Sites 3 4 5 5 5 Number of Employees at end of Period 240 327 421 381 429 * Includes acquisition costs in 2018, 2019 and 2020
| 19 |
Growth Financed with Debt, Stock and Seller Financing • Acquisitions have met specific needs for opportunities for future financial and operational improvements and accretive sales growth • New services and capacity improvements have been added with capital expenditure investments of $14.7 million from FY 2017 through FY 2020, to support internal growth • Investments in new systems and infrastructure to support growth and scalability • Recruiting, acquiring, developing and retaining scientific talent 20
| 20 |

Internal Timeline of Strategic Plan since Change in Leadership in 2017 21 FY 2018 FY 2019 FY 2020 FY 2021 *Develop longer term strategy *Growth in toxicology business model *Opened new capacity in Evansville and Gaithersburg *Initiating additional internal facility expansion projects *Understand market opportunities & potential acquisitions *Evansville expansion initiated *New name and branding *Introducing additional new technology as we further develop our Centers of Excellence *Focus on creating a superior employee experience to reduce turnover and support recruiting efforts *Investments to address deferred maintenance at all locations *St. Louis drug discovery center expansion initiated (DMPK, cell & molecular biology, histology) *Developing services internally that are currently outsourced to reduce reliance on third parties *Strategic thought *Investments to create superior client experience foundation in all aspects of business *New accounting system implemented company wide *Continuing to develop and introduce new service offerings which will benefits our clients *Additional scientific leadership *Initiated a contemporary drug discovery strategy & growth plan, including an expansion of discovery DMPK, pharmacology and toxicology to support lead optimization through candidate selection studies *Initiated program management function to manage the growing multi-site and - discipline projects *Continuing to develop our internal systems and infrastrucure, and ability to communicate and manage *Business development team *Additional toxicology capacity *Further upgrades to labs and services *Continuing to enhance security and safety in all phases of our business *World class pathology services *Reproductive toxicology expertise *Adding surgical capabilities and medical device development *Continuing to recruit superior talent, develop an excellent team and create the best place to work in our industry *Initiated a safety pharmacology offering *Continuing to maintain significant internal growth trends *Continue evaluating potential acquisitions *Evaluating acquisitions to support our business growth and enhance our service offerings
| 21 |
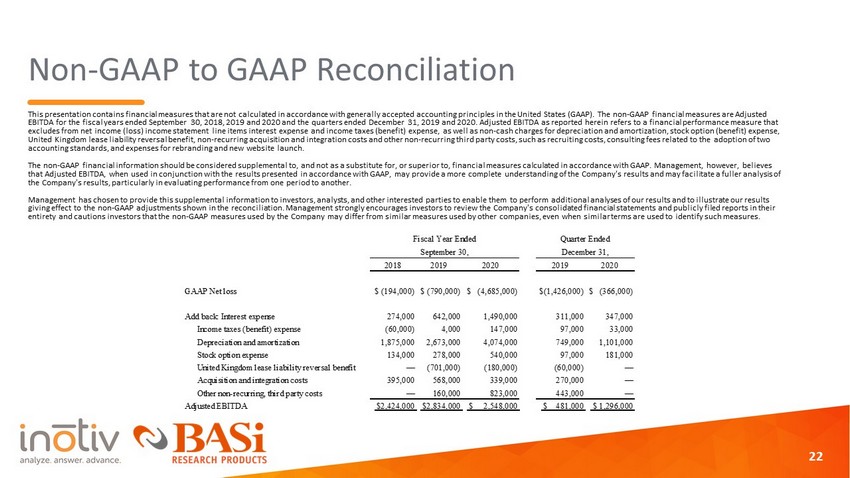
Non - GAAP to GAAP Reconciliation This presentation contains financial measures that are not calculated in accordance with generally accepted accounting princi ple s in the United States (GAAP). The non - GAAP financial measures are Adjusted EBITDA for the fiscal years ended September 30, 2018, 2019 and 2020 and the quarters ended December 31, 2019 and 2020. Adjust ed EBITDA as reported herein refers to a financial performance measure that excludes from net income (loss) income statement line items interest expense and income taxes (benefit) expense, as well as n on - cash charges for depreciation and amortization, stock option (benefit) expense, United Kingdom lease liability reversal benefit, non - recurring acquisition and integration costs and other non - recurring third p arty costs, such as recruiting costs, consulting fees related to the adoption of two accounting standards, and expenses for rebranding and new website launch. The non - GAAP financial information should be considered supplemental to, and not as a substitute for, or superior to, financial measures calculated in accordance with GAAP. Management, however, believes that Adjusted EBITDA, when used in conjunction with the results presented in accordance with GAAP, may provide a more complet e u nderstanding of the Company's results and may facilitate a fuller analysis of the Company's results, particularly in evaluating performance from one period to another. Management has chosen to provide this supplemental information to investors, analysts, and other interested parties to enable th em to perform additional analyses of our results and to illustrate our results giving effect to the non - GAAP adjustments shown in the reconciliation. Management strongly encourages investors to review the Co mpany's consolidated financial statements and publicly filed reports in their entirety and cautions investors that the non - GAAP measures used by the Company may differ from similar measures used by other co mpanies, even when similar terms are used to identify such measures. 22 2018 2019 2020 2019 2020 GAAP Net loss $ (194,000) $ (790,000) $ (4,685,000) $(1,426,000) $ (366,000) Add back: Interest expense 274,000 642,000 1,490,000 311,000 347,000 Income taxes (benefit) expense (60,000) 4,000 147,000 97,000 33,000 Depreciation and amortization 1,875,000 2,673,000 4,074,000 749,000 1,101,000 Stock option expense 134,000 278,000 540,000 97,000 181,000 United Kingdom lease liability reversal benefit — (701,000) (180,000) (60,000) — Acquisition and integration costs 395,000 568,000 339,000 270,000 — Other non-recurring, third party costs — 160,000 823,000 443,000 — Adjusted EBITDA $2,424,000 $2,834,000 $ 2,548,000 $ 481,000 $ 1,296,000 Fiscal Year Ended Quarter Ended September 30, December 31,
| 22 |