Attached files
| file | filename |
|---|---|
| EX-99.1 - EX-99.1 - ASSURANT, INC. | d347932dex991.htm |
| EX-2.1 - EX-2.1 - ASSURANT, INC. | d347932dex21.htm |
| 8-K - 8-K - ASSURANT, INC. | d347932d8k.htm |

Exhibit 99.2 Sale of Global Preneed to CUNA Mutual Group and 2021 Assurant Outlook March 9, 2021 © © 20 2021 21 A Ass ssu ura ran nt t, , IIn nc. c. A Allll ri rig gh ht ts s re res se er rv ve ed d. . 1 1Exhibit 99.2 Sale of Global Preneed to CUNA Mutual Group and 2021 Assurant Outlook March 9, 2021 © © 20 2021 21 A Ass ssu ura ran nt t, , IIn nc. c. A Allll ri rig gh ht ts s re res se er rv ve ed d. . 1 1

Presenters Alan Colberg President & Chief Executive Officer Richard Dziadzio Executive Vice President, Chief Financial Officer © 2021 Assurant, Inc. All rights reserved. 2Presenters Alan Colberg President & Chief Executive Officer Richard Dziadzio Executive Vice President, Chief Financial Officer © 2021 Assurant, Inc. All rights reserved. 2

Cautionary Statement Some of the statements included in this presentation, particularly those with respect to the closing of the Global Preneed transaction, including any statements regarding the company’s anticipated future financial performance, business prospects, growth, operating strategies and similar matters, may constitute forward-looking statements within the meaning of the U.S. Private Securities Litigation Reform Act of 1995. Refer to Exhibit 1 for information on where you can find a more detailed discussion of factors that could cause our actual results to differ materially from those currently estimated by management. Assurant uses non-GAAP financial measures to analyze the company’s operating performance. Because Assurant’s calculation of these measures may differ from similar measures used by other companies, investors should be careful when comparing Assurant’s non-GAAP financial measures to those of other companies. Refer to Exhibit 2 for a reconciliation of non-GAAP financial measures to the most comparable GAAP financial measures. © 2021 Assurant, Inc. All rights reserved. 3Cautionary Statement Some of the statements included in this presentation, particularly those with respect to the closing of the Global Preneed transaction, including any statements regarding the company’s anticipated future financial performance, business prospects, growth, operating strategies and similar matters, may constitute forward-looking statements within the meaning of the U.S. Private Securities Litigation Reform Act of 1995. Refer to Exhibit 1 for information on where you can find a more detailed discussion of factors that could cause our actual results to differ materially from those currently estimated by management. Assurant uses non-GAAP financial measures to analyze the company’s operating performance. Because Assurant’s calculation of these measures may differ from similar measures used by other companies, investors should be careful when comparing Assurant’s non-GAAP financial measures to those of other companies. Refer to Exhibit 2 for a reconciliation of non-GAAP financial measures to the most comparable GAAP financial measures. © 2021 Assurant, Inc. All rights reserved. 3

Agenda for Today’s Call Sale of Global Preneed to CUNA Mutual Group Expectations for use of transaction proceeds 2021 Assurant outlook © 2021 Assurant, Inc. All rights reserved. 4Agenda for Today’s Call Sale of Global Preneed to CUNA Mutual Group Expectations for use of transaction proceeds 2021 Assurant outlook © 2021 Assurant, Inc. All rights reserved. 4

Sale of Global Preneed to CUNA Mutual Group is a Successful Outcome for All Stakeholders • Definitive agreement to sell Global Preneed to CUNA Mutual Group for approximately $1.3 billion in cash Transaction • Sale includes Global Preneed’s assets and related legal entities, including American Memorial Life Insurance Company, Union Security Insurance Company and Assurant Life of Canada • Robust process with strong interest from multiple parties (1) Valuation • Price-to-adjusted-book: 1.2x (including AOCI) / 2.8x (excluding AOCI) (2) • Price-to-earnings: 27x 2020 GAAP earnings • Transaction builds on 20+ year history with CUNA Mutual Group Deal • Given financial strength and ratings, believe overall low execution risk to close Benefits • Agreed to a multi-year extension of our existing vehicle service contract business • Expect to close the transaction by the end of the third quarter of 2021, subject to regulatory Approvals approvals and other customary closing conditions & Timing • Upon close, expect all employees directly supporting Global Preneed to join CUNA Mutual Group (1) Price-to-adjusted-book is an illustrative multiple and is calculated by taking the purchase price of $1.3 billion divided by $467.9 million, which is the adjusted book value of the Global Preneed segment and related legal entities and assets being sold as part of the transaction, as of December 31, 2020. The $467.9 million includes $299.0 million of GAAP equity for the Global Preneed segment as of December 31, 2020, as well as $101.4 million of related Corporate segment assets, $49.5 million of related IT software and the Rapid City office building, and $11.8 million of net unrealized gains on equity securities that are being sold as part of the transaction. Accumulated other comprehensive income (AOCI) of Global Preneed, which includes AOCI associated with related legal entities and assets of $14.4 million, was $639.5 million as of December 31, 2020. (2) Price-to-earnings is an illustrative multiple and is calculated by taking the purchase price of $1.3 billion divided by Global Preneed’s full-year 2020 segment net operating income (which is equal to GAAP segment net income) of $48.0 million. © 2021 Assurant, Inc. All rights reserved. 5Sale of Global Preneed to CUNA Mutual Group is a Successful Outcome for All Stakeholders • Definitive agreement to sell Global Preneed to CUNA Mutual Group for approximately $1.3 billion in cash Transaction • Sale includes Global Preneed’s assets and related legal entities, including American Memorial Life Insurance Company, Union Security Insurance Company and Assurant Life of Canada • Robust process with strong interest from multiple parties (1) Valuation • Price-to-adjusted-book: 1.2x (including AOCI) / 2.8x (excluding AOCI) (2) • Price-to-earnings: 27x 2020 GAAP earnings • Transaction builds on 20+ year history with CUNA Mutual Group Deal • Given financial strength and ratings, believe overall low execution risk to close Benefits • Agreed to a multi-year extension of our existing vehicle service contract business • Expect to close the transaction by the end of the third quarter of 2021, subject to regulatory Approvals approvals and other customary closing conditions & Timing • Upon close, expect all employees directly supporting Global Preneed to join CUNA Mutual Group (1) Price-to-adjusted-book is an illustrative multiple and is calculated by taking the purchase price of $1.3 billion divided by $467.9 million, which is the adjusted book value of the Global Preneed segment and related legal entities and assets being sold as part of the transaction, as of December 31, 2020. The $467.9 million includes $299.0 million of GAAP equity for the Global Preneed segment as of December 31, 2020, as well as $101.4 million of related Corporate segment assets, $49.5 million of related IT software and the Rapid City office building, and $11.8 million of net unrealized gains on equity securities that are being sold as part of the transaction. Accumulated other comprehensive income (AOCI) of Global Preneed, which includes AOCI associated with related legal entities and assets of $14.4 million, was $639.5 million as of December 31, 2020. (2) Price-to-earnings is an illustrative multiple and is calculated by taking the purchase price of $1.3 billion divided by Global Preneed’s full-year 2020 segment net operating income (which is equal to GAAP segment net income) of $48.0 million. © 2021 Assurant, Inc. All rights reserved. 5

Fully-Transformed to Focus on Connected World Businesses and Specialty P&C Offerings Sale of Global Preneed is a significant Adjusted Global Lifestyle and Global Housing (1) milestone in the transformation journey Segment Net Operating Income that began in 2015 13% 19% More cohesive portfolio to further focus on 19% market-leading businesses, especially in Connected 20% Connected World, which is expected to 2020 World 14% have the greatest long-term growth $808M 14% businesses opportunities 1% Connected World businesses represented 33% approximately 66% of 2020 adjusted Global Lifestyle and Global Housing (1) segment NOI , approximately double the Global Connected Global Global Financial amount in 2015 Living Automotive Services Lifestyle Accelerates Assurant as a low-risk, Multifamily Lender-placed Global Specialty & Housing Insurance service-oriented, fee-driven company; Other Housing less interest rate sensitivity (1) Segment net operating income of the Global Lifestyle operating segment is equal to GAAP segment net income of $437.2 million. Segment net operating income of the Global Housing operating segment is equal to GAAP segment net income of $233.8 million and also excludes reportable catastrophes of $137.2 million. © 2021 Assurant, Inc. All rights reserved. 6Fully-Transformed to Focus on Connected World Businesses and Specialty P&C Offerings Sale of Global Preneed is a significant Adjusted Global Lifestyle and Global Housing (1) milestone in the transformation journey Segment Net Operating Income that began in 2015 13% 19% More cohesive portfolio to further focus on 19% market-leading businesses, especially in Connected 20% Connected World, which is expected to 2020 World 14% have the greatest long-term growth $808M 14% businesses opportunities 1% Connected World businesses represented 33% approximately 66% of 2020 adjusted Global Lifestyle and Global Housing (1) segment NOI , approximately double the Global Connected Global Global Financial amount in 2015 Living Automotive Services Lifestyle Accelerates Assurant as a low-risk, Multifamily Lender-placed Global Specialty & Housing Insurance service-oriented, fee-driven company; Other Housing less interest rate sensitivity (1) Segment net operating income of the Global Lifestyle operating segment is equal to GAAP segment net income of $437.2 million. Segment net operating income of the Global Housing operating segment is equal to GAAP segment net income of $233.8 million and also excludes reportable catastrophes of $137.2 million. © 2021 Assurant, Inc. All rights reserved. 6

Building on Track Record of Strong Capital Return; 75% of Net Proceeds to be Returned $1.2 Billion Net • Expect ~ $1.2 billion in net transaction proceeds: Transaction Proceeds (1) - Approximately 75% via share repurchases completed within one year of closing - Remaining 25% deployed for disciplined 25% investments primarily in Connected World businesses to support organic growth and acquisitions 75% • Share repurchases will be in addition to expected completion of $1.35 billion capital return objective from 2019 to 2021 Share repurchases Organic investments + acquisitions (1) Share repurchases are subject to Board approval. © 2021 Assurant, Inc. All rights reserved. 7Building on Track Record of Strong Capital Return; 75% of Net Proceeds to be Returned $1.2 Billion Net • Expect ~ $1.2 billion in net transaction proceeds: Transaction Proceeds (1) - Approximately 75% via share repurchases completed within one year of closing - Remaining 25% deployed for disciplined 25% investments primarily in Connected World businesses to support organic growth and acquisitions 75% • Share repurchases will be in addition to expected completion of $1.35 billion capital return objective from 2019 to 2021 Share repurchases Organic investments + acquisitions (1) Share repurchases are subject to Board approval. © 2021 Assurant, Inc. All rights reserved. 7
Assurant Positioned for Long-term Profitable Growth 2021 Assurant Outlook • Excluding Global Preneed and catastrophe losses, expect 2021 net (1) operating income per diluted share to increase approximately 9% (1) from adjusted 2020 net operating income per diluted share – Driven by underlying business expansion from earnings growth in Global Lifestyle, improved Corporate loss and share repurchases, including enhanced capital deployment plan – Growth partially offset by lower Global Housing earnings compared to very strong 2020 results • Evolving financial disclosure and metrics to align with business mix and view of value drivers • Expect strength and growth of core business, robust cash flow and disciplined capital management to continue to create significant shareholder value over the long term (1) Refer to Exhibit 2 for information regarding non-GAAP financial measures, including reconciliations to the most directly comparable GAAP measures. © 2021 Assurant, Inc. All rights reserved. 8Assurant Positioned for Long-term Profitable Growth 2021 Assurant Outlook • Excluding Global Preneed and catastrophe losses, expect 2021 net (1) operating income per diluted share to increase approximately 9% (1) from adjusted 2020 net operating income per diluted share – Driven by underlying business expansion from earnings growth in Global Lifestyle, improved Corporate loss and share repurchases, including enhanced capital deployment plan – Growth partially offset by lower Global Housing earnings compared to very strong 2020 results • Evolving financial disclosure and metrics to align with business mix and view of value drivers • Expect strength and growth of core business, robust cash flow and disciplined capital management to continue to create significant shareholder value over the long term (1) Refer to Exhibit 2 for information regarding non-GAAP financial measures, including reconciliations to the most directly comparable GAAP measures. © 2021 Assurant, Inc. All rights reserved. 8

2021 Outlook: (1) Expect 9% Growth in Net Operating EPS Net operating income Net operating income, 2021 outlook per diluted share, (1) excluding catastrophes (1) excluding catastrophes 2021 net operating income per diluted $10.80 $664M (1) $9.88 share to approximate $605M 2020 reported results of $10.80 Represents 9% growth from adjusted 2020 net operating income per (1) diluted share of 2020 2020 $9.88, driven by NOI 2020 2020 Reported Adjusted Reported Adjusted growth and share Global Preneed Global Preneed repurchases (1) All net operating income and net operating income per diluted share references exclude reportable catastrophe losses. Assurant’s 2020 adjusted net operating income per diluted share reflects adjusted net operating income of $605.4 million which has been revised to reflect Global Preneed as discontinued operations. Results for Corporate and Other have been adjusted to include $6.3 million of indirect enterprise support costs and a $3.8 million reduction in net investment income from the invested assets of certain legal entities included in the sale. Refer to Exhibit 2 for information regarding non- GAAP financial measures, including reconciliations to the most directly comparable GAAP measures. © 2021 Assurant, Inc. All rights reserved. 92021 Outlook: (1) Expect 9% Growth in Net Operating EPS Net operating income Net operating income, 2021 outlook per diluted share, (1) excluding catastrophes (1) excluding catastrophes 2021 net operating income per diluted $10.80 $664M (1) $9.88 share to approximate $605M 2020 reported results of $10.80 Represents 9% growth from adjusted 2020 net operating income per (1) diluted share of 2020 2020 $9.88, driven by NOI 2020 2020 Reported Adjusted Reported Adjusted growth and share Global Preneed Global Preneed repurchases (1) All net operating income and net operating income per diluted share references exclude reportable catastrophe losses. Assurant’s 2020 adjusted net operating income per diluted share reflects adjusted net operating income of $605.4 million which has been revised to reflect Global Preneed as discontinued operations. Results for Corporate and Other have been adjusted to include $6.3 million of indirect enterprise support costs and a $3.8 million reduction in net investment income from the invested assets of certain legal entities included in the sale. Refer to Exhibit 2 for information regarding non- GAAP financial measures, including reconciliations to the most directly comparable GAAP measures. © 2021 Assurant, Inc. All rights reserved. 9

Global Lifestyle NOI Growth, Led by Mobile (1) Net operating income Global Lifestyle 2021 Outlook High single- digit growth (1) • Expect to grow net operating income by high $437M single-digits from 2020 • Growth expected to be led by mobile from new and expanded programs as well as improved profitability within Global Financial Services 2020 Reported 2021 Outlook • Global Automotive earnings to be down modestly due to non-recurrence of one-time items and lower Revenue investment income In-line with • Global Lifestyle revenue expected to be in-line with 2020 $7.3B 2020, reflecting evolving mix of business toward fee-for-service as well as the mobile contract change, which will decrease revenue by approximately $175 million 2020 Reported 2021 Outlook (1) Segment net operating income of the Global Lifestyle operating segment is equal to GAAP segment net income. © 2021 Assurant, Inc. All rights reserved. 10Global Lifestyle NOI Growth, Led by Mobile (1) Net operating income Global Lifestyle 2021 Outlook High single- digit growth (1) • Expect to grow net operating income by high $437M single-digits from 2020 • Growth expected to be led by mobile from new and expanded programs as well as improved profitability within Global Financial Services 2020 Reported 2021 Outlook • Global Automotive earnings to be down modestly due to non-recurrence of one-time items and lower Revenue investment income In-line with • Global Lifestyle revenue expected to be in-line with 2020 $7.3B 2020, reflecting evolving mix of business toward fee-for-service as well as the mobile contract change, which will decrease revenue by approximately $175 million 2020 Reported 2021 Outlook (1) Segment net operating income of the Global Lifestyle operating segment is equal to GAAP segment net income. © 2021 Assurant, Inc. All rights reserved. 10
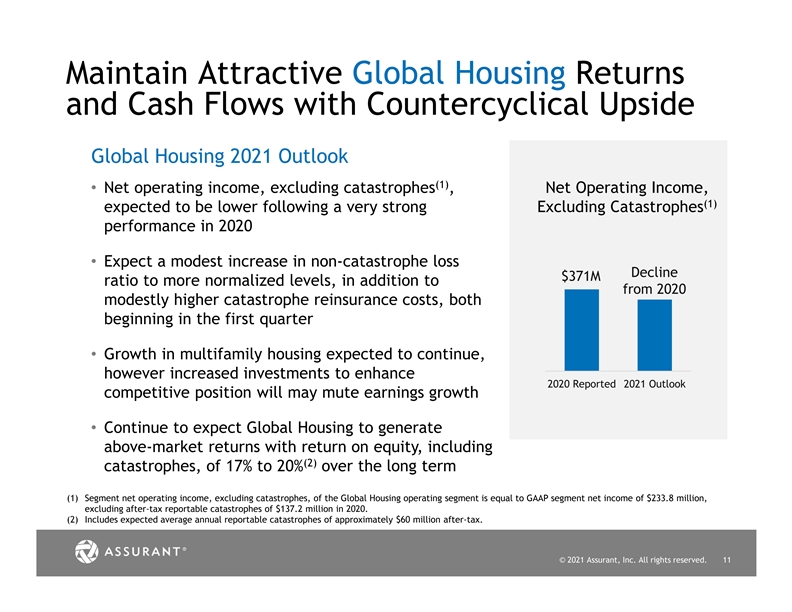
Maintain Attractive Global Housing Returns and Cash Flows with Countercyclical Upside Global Housing 2021 Outlook (1) • Net operating income, excluding catastrophes , Net Operating Income, (1) expected to be lower following a very strong Excluding Catastrophes performance in 2020 • Expect a modest increase in non-catastrophe loss Decline $371M ratio to more normalized levels, in addition to from 2020 modestly higher catastrophe reinsurance costs, both beginning in the first quarter • Growth in multifamily housing expected to continue, however increased investments to enhance 2020 Reported 2021 Outlook competitive position will may mute earnings growth • Continue to expect Global Housing to generate above-market returns with return on equity, including (2) catastrophes, of 17% to 20% over the long term (1) Segment net operating income, excluding catastrophes, of the Global Housing operating segment is equal to GAAP segment net income of $233.8 million, excluding after-tax reportable catastrophes of $137.2 million in 2020. (2) Includes expected average annual reportable catastrophes of approximately $60 million after-tax. © 2021 Assurant, Inc. All rights reserved. 11Maintain Attractive Global Housing Returns and Cash Flows with Countercyclical Upside Global Housing 2021 Outlook (1) • Net operating income, excluding catastrophes , Net Operating Income, (1) expected to be lower following a very strong Excluding Catastrophes performance in 2020 • Expect a modest increase in non-catastrophe loss Decline $371M ratio to more normalized levels, in addition to from 2020 modestly higher catastrophe reinsurance costs, both beginning in the first quarter • Growth in multifamily housing expected to continue, however increased investments to enhance 2020 Reported 2021 Outlook competitive position will may mute earnings growth • Continue to expect Global Housing to generate above-market returns with return on equity, including (2) catastrophes, of 17% to 20% over the long term (1) Segment net operating income, excluding catastrophes, of the Global Housing operating segment is equal to GAAP segment net income of $233.8 million, excluding after-tax reportable catastrophes of $137.2 million in 2020. (2) Includes expected average annual reportable catastrophes of approximately $60 million after-tax. © 2021 Assurant, Inc. All rights reserved. 11

Continued Expense Discipline within Corporate Corporate & Other (1) • Expect 2021 net operating loss to approximate $90 million Corporate & Other compared to 2020 adjusted net operating loss of $103 million (2) Net Operating Loss - 2020 adjusted net operating loss reflects additional enterprise (2) support costs related to sale of Global Preneed ($103M) ~($90M) ($93M) - These costs are expected to be lower in 2021 and to be eliminated by year end Additional Items • 2021 interest expense to increase to approximately $90 million due to financing related to HYLA acquisition 2020 2020 2021 • Preferred dividends to be $5 million for first quarter 2021; (2) Reported Adjusted Outlook all outstanding mandatory convertible shares will convert to th common shares on March 15 Enterprise support costs related to Global Preneed sale • Expect 2021 segment dividends to approximate segment earnings for the full year (1) Refer to Exhibit 2 for information regarding non-GAAP financial measures, including reconciliations to the most directly comparable GAAP measures. (2) 2020 results for Corporate and Other have been adjusted to include $6.3 million of indirect enterprise support costs and a $3.8 million reduction in net investment income from the invested assets of certain legal entities included in the sale. © 2021 Assurant, Inc. All rights reserved. 12Continued Expense Discipline within Corporate Corporate & Other (1) • Expect 2021 net operating loss to approximate $90 million Corporate & Other compared to 2020 adjusted net operating loss of $103 million (2) Net Operating Loss - 2020 adjusted net operating loss reflects additional enterprise (2) support costs related to sale of Global Preneed ($103M) ~($90M) ($93M) - These costs are expected to be lower in 2021 and to be eliminated by year end Additional Items • 2021 interest expense to increase to approximately $90 million due to financing related to HYLA acquisition 2020 2020 2021 • Preferred dividends to be $5 million for first quarter 2021; (2) Reported Adjusted Outlook all outstanding mandatory convertible shares will convert to th common shares on March 15 Enterprise support costs related to Global Preneed sale • Expect 2021 segment dividends to approximate segment earnings for the full year (1) Refer to Exhibit 2 for information regarding non-GAAP financial measures, including reconciliations to the most directly comparable GAAP measures. (2) 2020 results for Corporate and Other have been adjusted to include $6.3 million of indirect enterprise support costs and a $3.8 million reduction in net investment income from the invested assets of certain legal entities included in the sale. © 2021 Assurant, Inc. All rights reserved. 12

Positioned for Long-term Value Creation Connected World businesses combined with our differentiated P&C offerings are expected to sustain above-market growth and deliver superior cash flow over time More service-oriented, fee-based model with several recurring revenue streams Fully-transformed company out of legacy health and life businesses with no significant net life insurance liabilities remaining or mortality risk Earnings growth and balanced capital deployment to continue to create long-term shareholder value © 2021 Assurant, Inc. All rights reserved. 13Positioned for Long-term Value Creation Connected World businesses combined with our differentiated P&C offerings are expected to sustain above-market growth and deliver superior cash flow over time More service-oriented, fee-based model with several recurring revenue streams Fully-transformed company out of legacy health and life businesses with no significant net life insurance liabilities remaining or mortality risk Earnings growth and balanced capital deployment to continue to create long-term shareholder value © 2021 Assurant, Inc. All rights reserved. 13

Exhibits © © 20 2021 21 A Ass ssu ura ran nt t, , IIn nc. c. A Allll ri rig gh ht ts s re res se er rv ve ed d. . 14 14Exhibits © © 20 2021 21 A Ass ssu ura ran nt t, , IIn nc. c. A Allll ri rig gh ht ts s re res se er rv ve ed d. . 14 14
Exhibit 1: Safe Harbor Statement Some of the statements included in this presentation, particularly those with respect to the closing of the Global Preneed transaction, including any statements regarding the company’s anticipated future financial performance, business prospects, growth, operating strategies and similar matters, may constitute forward-looking statements within the meaning of the U.S. Private Securities Litigation Reform Act of 1995. You can identify forward-looking statements by the use of words such as “outlook,” “will,” “may,” “can,” “anticipates,” “expects,” “estimates,” “projects,” “intends,” “plans,” “believes,” “targets,” “forecasts,” “potential,” “approximately,” and the negative version of those words and other words and terms with a similar meaning. Any forward-looking statements contained in this presentation are based upon our historical performance and on current plans, estimates and expectations. The inclusion of this forward-looking information should not be regarded as a representation by us or any other person that our future plans, estimates or expectations will be achieved. Our actual results might differ materially from those projected in the forward-looking statements. We undertake no obligation to update or review any forward-looking statement, whether as a result of new information, future events or other developments. For a detailed discussion of the factors that could affect our results, please refer to the factors identified in the reports we file with the U.S. Securities and Exchange Commission, including the risk factors identified in our most recent Annual Report on Form 10-K and Quarterly Reports on Form 10-Q. © 2021 Assurant, Inc. All rights reserved. 15Exhibit 1: Safe Harbor Statement Some of the statements included in this presentation, particularly those with respect to the closing of the Global Preneed transaction, including any statements regarding the company’s anticipated future financial performance, business prospects, growth, operating strategies and similar matters, may constitute forward-looking statements within the meaning of the U.S. Private Securities Litigation Reform Act of 1995. You can identify forward-looking statements by the use of words such as “outlook,” “will,” “may,” “can,” “anticipates,” “expects,” “estimates,” “projects,” “intends,” “plans,” “believes,” “targets,” “forecasts,” “potential,” “approximately,” and the negative version of those words and other words and terms with a similar meaning. Any forward-looking statements contained in this presentation are based upon our historical performance and on current plans, estimates and expectations. The inclusion of this forward-looking information should not be regarded as a representation by us or any other person that our future plans, estimates or expectations will be achieved. Our actual results might differ materially from those projected in the forward-looking statements. We undertake no obligation to update or review any forward-looking statement, whether as a result of new information, future events or other developments. For a detailed discussion of the factors that could affect our results, please refer to the factors identified in the reports we file with the U.S. Securities and Exchange Commission, including the risk factors identified in our most recent Annual Report on Form 10-K and Quarterly Reports on Form 10-Q. © 2021 Assurant, Inc. All rights reserved. 15

Exhibit 2: Non-GAAP Financial Measures Assurant uses the following non-GAAP financial measures to analyze the company’s operating performance for the periods presented in this presentation. Because Assurant’s calculation of these measures may differ from similar measures used by other companies, investors should be careful when comparing Assurant’s non-GAAP financial measures to those of other companies. 1. Assurant uses net operating income, which excludes reportable catastrophes (which represents catastrophe losses net of reinsurance and client profit sharing adjustments and including reinstatement and other premiums), and adjusted net operating income, which excludes reportable catastrophes and the impact of discontinued operations, as important measures of the company’s operating performance. Net operating income equals net income attributable to common stockholders, excluding reportable catastrophes, the Global Preneed goodwill impairment, the CARES Act tax benefit, COVID-19 direct and incremental expenses, net realized gains (losses) on investments (which includes unrealized gains (losses) on equity securities and changes in fair value of direct investments in collateralized loan obligations), foreign exchange gains (losses) from remeasurement of monetary assets and liabilities, the net charge related to Iké, as well as other highly variable or unusual items. The company believes these metrics provide investors with a valuable measure of the performance of the company’s ongoing business because they exclude reportable catastrophes, which can be volatile, and other items which do not represent the ongoing operations of the company, and adjusted net operating income excludes the impact of discontinued operations. The comparable GAAP measure is net income attributable to common stockholders. (1) Segment net operating income of the Global Lifestyle and Global Preneed operating segments is equal to GAAP segment net income. Segment net operating income of the Global Housing operating segment is equal to GAAP segment net income of $233.8 million and also excludes reportable catastrophes of $137.2 million. (2) Additional details about the components of Other adjustments are included in the Financial Supplement as of December 31, 2020 located on Assurant’s Investor Relations website: https://ir.assurant.com/investor/default.aspx. © 2021 Assurant, Inc. All rights reserved. 16Exhibit 2: Non-GAAP Financial Measures Assurant uses the following non-GAAP financial measures to analyze the company’s operating performance for the periods presented in this presentation. Because Assurant’s calculation of these measures may differ from similar measures used by other companies, investors should be careful when comparing Assurant’s non-GAAP financial measures to those of other companies. 1. Assurant uses net operating income, which excludes reportable catastrophes (which represents catastrophe losses net of reinsurance and client profit sharing adjustments and including reinstatement and other premiums), and adjusted net operating income, which excludes reportable catastrophes and the impact of discontinued operations, as important measures of the company’s operating performance. Net operating income equals net income attributable to common stockholders, excluding reportable catastrophes, the Global Preneed goodwill impairment, the CARES Act tax benefit, COVID-19 direct and incremental expenses, net realized gains (losses) on investments (which includes unrealized gains (losses) on equity securities and changes in fair value of direct investments in collateralized loan obligations), foreign exchange gains (losses) from remeasurement of monetary assets and liabilities, the net charge related to Iké, as well as other highly variable or unusual items. The company believes these metrics provide investors with a valuable measure of the performance of the company’s ongoing business because they exclude reportable catastrophes, which can be volatile, and other items which do not represent the ongoing operations of the company, and adjusted net operating income excludes the impact of discontinued operations. The comparable GAAP measure is net income attributable to common stockholders. (1) Segment net operating income of the Global Lifestyle and Global Preneed operating segments is equal to GAAP segment net income. Segment net operating income of the Global Housing operating segment is equal to GAAP segment net income of $233.8 million and also excludes reportable catastrophes of $137.2 million. (2) Additional details about the components of Other adjustments are included in the Financial Supplement as of December 31, 2020 located on Assurant’s Investor Relations website: https://ir.assurant.com/investor/default.aspx. © 2021 Assurant, Inc. All rights reserved. 16

Exhibit 2: Non-GAAP Financial Measures (continued) Assurant uses the following non-GAAP financial measures to analyze the company’s operating performance for the periods presented in this presentation. Because Assurant’s calculation of these measures may differ from similar measures used by other companies, investors should be careful when comparing Assurant’s non-GAAP financial measures to those of other companies. (1) Segment net operating income of the Global Preneed operating segment is equal to GAAP segment net income. Segment net operating income of the Global Lifestyle operating segment is equal to GAAP segment net income, and 1Q’20 and 2Q’20 exclude reportable catastrophes of $0.1 million and ($0.1) million, respectively. Segment net operating income of the Global Housing operating segment for 1Q’20, 2Q’20, 3Q’20 and 4Q’20 is equal to GAAP segment net income of $74.2 million, $85.4 million, $13.1 million and $61.1 million, and also exclude reportable catastrophes of $12.8 million, $10.1 million, $87.0 million and $27.3 million, respectively. (2) Additional details about the components of Other adjustments are included in the Financial Supplement as of December 31, 2020 located on Assurant’s Investor Relations website: https://ir.assurant.com/investor/default.aspx. © 2021 Assurant, Inc. All rights reserved. 17Exhibit 2: Non-GAAP Financial Measures (continued) Assurant uses the following non-GAAP financial measures to analyze the company’s operating performance for the periods presented in this presentation. Because Assurant’s calculation of these measures may differ from similar measures used by other companies, investors should be careful when comparing Assurant’s non-GAAP financial measures to those of other companies. (1) Segment net operating income of the Global Preneed operating segment is equal to GAAP segment net income. Segment net operating income of the Global Lifestyle operating segment is equal to GAAP segment net income, and 1Q’20 and 2Q’20 exclude reportable catastrophes of $0.1 million and ($0.1) million, respectively. Segment net operating income of the Global Housing operating segment for 1Q’20, 2Q’20, 3Q’20 and 4Q’20 is equal to GAAP segment net income of $74.2 million, $85.4 million, $13.1 million and $61.1 million, and also exclude reportable catastrophes of $12.8 million, $10.1 million, $87.0 million and $27.3 million, respectively. (2) Additional details about the components of Other adjustments are included in the Financial Supplement as of December 31, 2020 located on Assurant’s Investor Relations website: https://ir.assurant.com/investor/default.aspx. © 2021 Assurant, Inc. All rights reserved. 17

Exhibit 2: Non-GAAP Financial Measures (continued) Assurant uses the following non-GAAP financial measures to analyze the company’s operating performance for the periods presented in this presentation. Because Assurant’s calculation of these measures may differ from similar measures used by other companies, investors should be careful when comparing Assurant’s non- GAAP financial measures to those of other companies. 2. Assurant uses net operating income per diluted share, which excludes reportable catastrophes, and adjusted net operating income per diluted share, which excludes reportable catastrophes and the impact of discontinued operations, as important measures of the company's stockholder value. Net operating income per diluted share equals net operating income (defined above) plus any dilutive preferred stock dividends divided by the weighted average number of diluted shares outstanding. The company believes these metrics provide investors with a valuable measure of stockholder value because they exclude reportable catastrophes, which can be volatile, and other items which do not represent the ongoing operations of the company, and adjusted net operating income per diluted share excludes the impact of discontinued operations. The comparable GAAP measure is net income attributable to common stockholders per diluted share, defined as net income attributable to common stockholders plus any dilutive preferred stock dividends divided by the weighted average number of diluted shares outstanding. (1) Information on share counts used in the per share calculations are included in the Financial Supplement as of December 31, 2020 located on Assurant’s Investor Relations website: https://ir.assurant.com/investor/default.aspx. (2) Additional details about the components of Other adjustments are included in the Financial Supplement as of December 31, 2020 located on Assurant’s Investor Relations website: https://ir.assurant.com/investor/default.aspx. © 2021 Assurant, Inc. All rights reserved. 18Exhibit 2: Non-GAAP Financial Measures (continued) Assurant uses the following non-GAAP financial measures to analyze the company’s operating performance for the periods presented in this presentation. Because Assurant’s calculation of these measures may differ from similar measures used by other companies, investors should be careful when comparing Assurant’s non- GAAP financial measures to those of other companies. 2. Assurant uses net operating income per diluted share, which excludes reportable catastrophes, and adjusted net operating income per diluted share, which excludes reportable catastrophes and the impact of discontinued operations, as important measures of the company's stockholder value. Net operating income per diluted share equals net operating income (defined above) plus any dilutive preferred stock dividends divided by the weighted average number of diluted shares outstanding. The company believes these metrics provide investors with a valuable measure of stockholder value because they exclude reportable catastrophes, which can be volatile, and other items which do not represent the ongoing operations of the company, and adjusted net operating income per diluted share excludes the impact of discontinued operations. The comparable GAAP measure is net income attributable to common stockholders per diluted share, defined as net income attributable to common stockholders plus any dilutive preferred stock dividends divided by the weighted average number of diluted shares outstanding. (1) Information on share counts used in the per share calculations are included in the Financial Supplement as of December 31, 2020 located on Assurant’s Investor Relations website: https://ir.assurant.com/investor/default.aspx. (2) Additional details about the components of Other adjustments are included in the Financial Supplement as of December 31, 2020 located on Assurant’s Investor Relations website: https://ir.assurant.com/investor/default.aspx. © 2021 Assurant, Inc. All rights reserved. 18

Exhibit 2: Non-GAAP Financial Measures (continued) Assurant uses the following non-GAAP financial measures to analyze the company’s operating performance for the periods presented in this presentation. Because Assurant’s calculation of these measures may differ from similar measures used by other companies, investors should be careful when comparing Assurant’s non- GAAP financial measures to those of other companies. (1) Information on share counts used in the per share calculations are included in the Financial Supplement as of December 31, 2020 located on Assurant’s Investor Relations website: https://ir.assurant.com/investor/default.aspx. More information on the 3Q’20 share count can be found on slide 23. (2) Additional details about the components of Other adjustments are included in the Financial Supplement as of December 31, 2020 located on Assurant’s Investor Relations website: https://ir.assurant.com/investor/default.aspx. © 2021 Assurant, Inc. All rights reserved. 19Exhibit 2: Non-GAAP Financial Measures (continued) Assurant uses the following non-GAAP financial measures to analyze the company’s operating performance for the periods presented in this presentation. Because Assurant’s calculation of these measures may differ from similar measures used by other companies, investors should be careful when comparing Assurant’s non- GAAP financial measures to those of other companies. (1) Information on share counts used in the per share calculations are included in the Financial Supplement as of December 31, 2020 located on Assurant’s Investor Relations website: https://ir.assurant.com/investor/default.aspx. More information on the 3Q’20 share count can be found on slide 23. (2) Additional details about the components of Other adjustments are included in the Financial Supplement as of December 31, 2020 located on Assurant’s Investor Relations website: https://ir.assurant.com/investor/default.aspx. © 2021 Assurant, Inc. All rights reserved. 19

Exhibit 2: Non-GAAP Financial Measures (continued) Assurant uses the following non-GAAP financial measures to analyze the company’s operating performance for the periods presented in this presentation. Because Assurant’s calculation of these measures may differ from similar measures used by other companies, investors should be careful when comparing Assurant’s non-GAAP financial measures to those of other companies. 3. Assurant uses Corporate and Other net operating loss, and adjusted Corporate and Other net operating loss, which excludes the impact of discontinued operations, as important measures of the Corporate and Other segment’s performance. Corporate and Other net operating loss equals Corporate and Other segment net loss attributable to common stockholders, excluding the Global Preneed goodwill impairment, interest expense, the CARES Act tax benefit, net realized gains (losses) on investments (which includes unrealized gains (losses) on equity securities and changes in fair value of direct investments in collateralized loan obligations), COVID-19 direct and incremental expenses, the net charge related to Iké, foreign exchange gains (losses) from remeasurement of monetary assets and liabilities, as well as other highly variable or unusual items other than reportable catastrophes. The company believes these metrics provide investors with a valuable measure of the performance of the company’s corporate segment because they exclude highly variable items that do not represent the ongoing results of the company’s corporate segment. The comparable GAAP measure is Corporate and Other segment net loss attributable to common stockholders. (1) Additional details about the components of Other adjustments are included in the Financial Supplement as of December 31, 2020 located on Assurant’s Investor Relations website: https://ir.assurant.com/investor/default.aspx. © 2021 Assurant, Inc. All rights reserved. 20Exhibit 2: Non-GAAP Financial Measures (continued) Assurant uses the following non-GAAP financial measures to analyze the company’s operating performance for the periods presented in this presentation. Because Assurant’s calculation of these measures may differ from similar measures used by other companies, investors should be careful when comparing Assurant’s non-GAAP financial measures to those of other companies. 3. Assurant uses Corporate and Other net operating loss, and adjusted Corporate and Other net operating loss, which excludes the impact of discontinued operations, as important measures of the Corporate and Other segment’s performance. Corporate and Other net operating loss equals Corporate and Other segment net loss attributable to common stockholders, excluding the Global Preneed goodwill impairment, interest expense, the CARES Act tax benefit, net realized gains (losses) on investments (which includes unrealized gains (losses) on equity securities and changes in fair value of direct investments in collateralized loan obligations), COVID-19 direct and incremental expenses, the net charge related to Iké, foreign exchange gains (losses) from remeasurement of monetary assets and liabilities, as well as other highly variable or unusual items other than reportable catastrophes. The company believes these metrics provide investors with a valuable measure of the performance of the company’s corporate segment because they exclude highly variable items that do not represent the ongoing results of the company’s corporate segment. The comparable GAAP measure is Corporate and Other segment net loss attributable to common stockholders. (1) Additional details about the components of Other adjustments are included in the Financial Supplement as of December 31, 2020 located on Assurant’s Investor Relations website: https://ir.assurant.com/investor/default.aspx. © 2021 Assurant, Inc. All rights reserved. 20

Exhibit 2: Non-GAAP Financial Measures (continued) Assurant uses the following non-GAAP financial measures to analyze the company’s operating performance for the periods presented in this presentation. Because Assurant’s calculation of these measures may differ from similar measures used by other companies, investors should be careful when comparing Assurant’s non-GAAP financial measures to those of other companies. (1) Additional details about the components of Other adjustments are included in the Financial Supplement as of December 31, 2020 located on Assurant’s Investor Relations website: https://ir.assurant.com/investor/default.aspx. © 2021 Assurant, Inc. All rights reserved. 21Exhibit 2: Non-GAAP Financial Measures (continued) Assurant uses the following non-GAAP financial measures to analyze the company’s operating performance for the periods presented in this presentation. Because Assurant’s calculation of these measures may differ from similar measures used by other companies, investors should be careful when comparing Assurant’s non-GAAP financial measures to those of other companies. (1) Additional details about the components of Other adjustments are included in the Financial Supplement as of December 31, 2020 located on Assurant’s Investor Relations website: https://ir.assurant.com/investor/default.aspx. © 2021 Assurant, Inc. All rights reserved. 21
Exhibit 2: Non-GAAP Financial Measures (continued) Assurant uses the following non-GAAP financial measures to analyze the company’s operating performance for the periods presented in this presentation. Because Assurant’s calculation of these measures may differ from similar measures used by other companies, investors should be careful when comparing Assurant’s non-GAAP financial measures to those of other companies. 4. The company outlook for net operating income per diluted share, excluding reportable catastrophe losses and Global Preneed, and Corporate and Other net operating loss each constitute forward-looking information and the company believes that it cannot reconcile such forward-looking information to the most comparable GAAP measure without unreasonable efforts. Many of the GAAP components cannot be reliably quantified due to the combination of variability and volatility of such components and may, depending on the size of the components, have a significant impact on the reconciliation. The company is able to quantify a full-year estimate of interest expense and preferred stock dividends, which are expected to be approximately $90 million and $5 million, respectively. The interest expense estimate assumes no additional debt is incurred or extinguished in the forecast period and excludes after-tax interest expenses included in debt extinguishment and other related costs. © 2021 Assurant, Inc. All rights reserved. 22Exhibit 2: Non-GAAP Financial Measures (continued) Assurant uses the following non-GAAP financial measures to analyze the company’s operating performance for the periods presented in this presentation. Because Assurant’s calculation of these measures may differ from similar measures used by other companies, investors should be careful when comparing Assurant’s non-GAAP financial measures to those of other companies. 4. The company outlook for net operating income per diluted share, excluding reportable catastrophe losses and Global Preneed, and Corporate and Other net operating loss each constitute forward-looking information and the company believes that it cannot reconcile such forward-looking information to the most comparable GAAP measure without unreasonable efforts. Many of the GAAP components cannot be reliably quantified due to the combination of variability and volatility of such components and may, depending on the size of the components, have a significant impact on the reconciliation. The company is able to quantify a full-year estimate of interest expense and preferred stock dividends, which are expected to be approximately $90 million and $5 million, respectively. The interest expense estimate assumes no additional debt is incurred or extinguished in the forecast period and excludes after-tax interest expenses included in debt extinguishment and other related costs. © 2021 Assurant, Inc. All rights reserved. 22
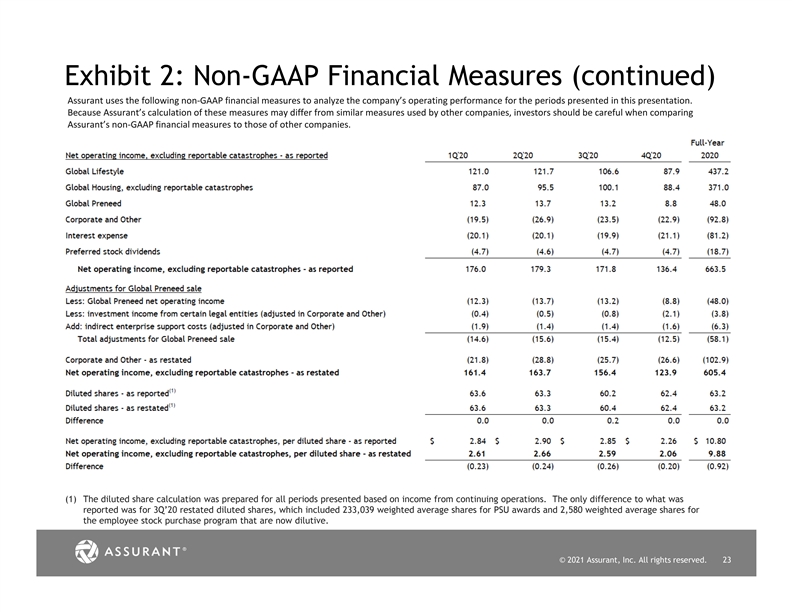
Exhibit 2: Non-GAAP Financial Measures (continued) Assurant uses the following non-GAAP financial measures to analyze the company’s operating performance for the periods presented in this presentation. Because Assurant’s calculation of these measures may differ from similar measures used by other companies, investors should be careful when comparing Assurant’s non-GAAP financial measures to those of other companies. (1) The diluted share calculation was prepared for all periods presented based on income from continuing operations. The only difference to what was reported was for 3Q’20 restated diluted shares, which included 233,039 weighted average shares for PSU awards and 2,580 weighted average shares for the employee stock purchase program that are now dilutive. © 2021 Assurant, Inc. All rights reserved. 23Exhibit 2: Non-GAAP Financial Measures (continued) Assurant uses the following non-GAAP financial measures to analyze the company’s operating performance for the periods presented in this presentation. Because Assurant’s calculation of these measures may differ from similar measures used by other companies, investors should be careful when comparing Assurant’s non-GAAP financial measures to those of other companies. (1) The diluted share calculation was prepared for all periods presented based on income from continuing operations. The only difference to what was reported was for 3Q’20 restated diluted shares, which included 233,039 weighted average shares for PSU awards and 2,580 weighted average shares for the employee stock purchase program that are now dilutive. © 2021 Assurant, Inc. All rights reserved. 23