Attached files
| file | filename |
|---|---|
| EX-32 - EXHIBIT 32 - HMN FINANCIAL INC | ex_230680.htm |
| EX-31.2 - EXHIBIT 31.2 - HMN FINANCIAL INC | ex_230679.htm |
| EX-31.1 - EXHIBIT 31.1 - HMN FINANCIAL INC | ex_230678.htm |
| EX-23.1 - EXHIBIT 23.1 - HMN FINANCIAL INC | ex_231806.htm |
| 10-K - FORM 10-K - HMN FINANCIAL INC | hmnf20201231_10k.htm |
Exhibit 13
Table of Contents
| Financial Highlights | 1 |
| Letter to Shareholders and Clients | 2 |
| Board of Directors | 4 |
| Five-year Consolidated Financial Highlights | 5 |
| Management Discussion and Analysis | 6 |
| Consolidated Financial Statements | 21 |
| Notes to Consolidated Financial Statements | 25 |
| Report of Independent Registered Public Accounting Firm | 57 |
| Other Financial Data | 60 |
| Selected Quarterly Financial Data | 61 |
| Common Stock Information | 63 |
| Corporate and Shareholder Information | Inside Back Cover |
| Directors and Officers | Inside Back Cover |
HMN Financial, Inc. and Home Federal Savings Bank are headquartered in Rochester, Minnesota. Home Federal Savings Bank operates twelve full service offices in Minnesota located in Albert Lea, Austin, Eagan, Kasson, La Crescent, Owatonna, Rochester (4), Spring Valley and Winona, one full service office in Marshalltown, Iowa, and one full service office in Pewaukee, Wisconsin. The Bank also operates a loan origination office in Sartell, Minnesota.
Financial Highlights
|
At or For the Year Ended |
||||||||||||
|
Operating Results: |
December 31, |
Percentage |
||||||||||
|
(Dollars in thousands, except per share data) |
2020 |
2019 |
Change |
|||||||||
|
Total interest income |
$ | 31,959 | 31,890 | 0.2 |
% |
|||||||
|
Total interest expense |
2,851 | 3,339 | (14.6 | ) | ||||||||
|
Net interest income |
29,108 | 28,551 | 2.0 | |||||||||
|
Provision for loan losses |
2,699 | (1,216 | ) | 322.0 | ||||||||
|
Net interest income after provision for loan losses |
26,409 | 29,767 | (11.3 | ) | ||||||||
|
Fees and service charges |
2,877 | 3,100 | (7.2 | ) | ||||||||
|
Loan servicing fees |
1,356 | 1,278 | 6.1 | |||||||||
|
Gain on sales of loans |
9,531 | 2,941 | 224.1 | |||||||||
|
Other non-interest income |
1,190 | 1,136 | 4.8 | |||||||||
|
Total non-interest income |
14,954 | 8,455 | 76.9 | |||||||||
|
Total non-interest expense |
26,993 | 27,105 | (0.4 | ) | ||||||||
|
Income before income tax expense |
14,370 | 11,117 | 29.3 | |||||||||
|
Income tax expense |
4,068 | 3,324 | 22.4 | |||||||||
|
Net income |
$ | 10,302 | 7,793 | 32.2 | ||||||||
|
Per Common Share Information: |
||||||||||||
|
Earnings per common share and common share equivalents: |
||||||||||||
|
Basic |
$ | 2.23 | 1.69 | |||||||||
|
Diluted |
2.22 | 1.68 | ||||||||||
|
Stock price (for the year): |
||||||||||||
|
High |
$ | 21.76 | 23.34 | |||||||||
|
Low |
13.06 | 19.01 | ||||||||||
|
Close |
17.20 | 21.01 | ||||||||||
|
Book value per common share |
21.65 | 19.13 | ||||||||||
|
Closing price to book value |
79.45 |
% |
109.83 |
% |
||||||||
|
Financial Ratios: |
||||||||||||
|
Return on average assets |
1.21 |
% |
1.05 |
% |
15.2 |
% |
||||||
|
Return on average stockholders’ equity |
10.56 | 8.74 | 20.8 | |||||||||
|
Net interest margin |
3.55 | 4.04 | (12.1 | ) | ||||||||
|
Operating expenses to average assets |
3.16 | 3.67 | (13.9 | ) | ||||||||
|
Average stockholders’ equity to average assets |
11.43 | 12.06 | (5.2 | ) | ||||||||
|
Stockholders’ equity to total assets at year end |
11.35 | 11.91 | (4.7 | ) | ||||||||
|
Non-performing assets to total assets |
0.37 | 0.34 | 8.8 | |||||||||
|
Efficiency ratio |
61.26 | 73.25 | (16.4 | ) | ||||||||
|
Balance Sheet Data: |
December 31, |
Percentage |
||||||||||
|
(Dollars in thousands) |
2020 |
2019 |
Change |
|||||||||
|
Total assets |
$ | 909,580 | 777,639 | 17.0 |
% |
|||||||
|
Securities available for sale |
148,090 | 107,592 | 37.6 | |||||||||
|
Loans held for sale |
6,186 | 3,606 | 71.5 | |||||||||
|
Loans receivable, net |
642,630 | 596,392 | 7.8 | |||||||||
|
Deposits |
795,204 | 673,870 | 18.0 | |||||||||
|
Stockholders’ equity |
103,252 | 92,648 | 11.4 | |||||||||
|
Home Federal Savings Bank regulatory capital ratios: |
||||||||||||
|
Common equity Tier 1 capital |
13.62 |
% |
13.21 |
% |
3.1 |
% |
||||||
|
Tier 1 leverage |
9.85 | 10.89 | (9.5 | ) | ||||||||
|
Tier 1 risk-based capital |
13.62 | 13.21 | 3.1 | |||||||||
|
Total risk-based capital |
14.87 | 14.46 | 2.8 | |||||||||
Letter to Shareholders and Clients
I am proud to present you with our 2020 Annual Report. The past year was marked by many unexpected challenges and opportunities.
We began the year by closely monitoring the news from China of a novel respiratory virus, and the discovery of what we now know as COVID-19. We are fortunate to have a retired Mayo Clinic physician on our Board of Directors as well as numerous contacts within the Mayo Clinic, who recognized how serious the situation in China was, and encouraged us to take important early steps to prepare for the impact the virus would unfortunately have on our organization, our clients and our communities.
During the year, we closely monitored and complied with numerous health directives and executive orders in the three states where we operate. Our branch lobbies were closed and reopened several times during the year as state and local government agencies adjusted restrictions to flatten spikes in the virus transmission levels. Approximately 80% of our production and support staff worked remotely during the year. Some employees, whose duties required them to work on site, were divided into teams and placed on rotating schedules to reduce the chance of department wide outbreaks of the virus. Our information technology staff worked tirelessly throughout the year to ensure connectivity for our remote employees and the seamless delivery of our products and services to our clients. Our Human Resources and Operations departments developed and amended workplace policies and procedures to ensure continued regulatory compliance and employee safety.
We were fortunate that we entered the year in a strong asset quality position, with only 0.34% of our assets classified as non-performing at the beginning of 2020. This was made possible by a strong economy, prudent underwriting, and a well-timed decision to move our weakest credits out of the Bank during 2019. Our strong asset quality position enabled us to offer our commercial clients the flexibility they would need to deal with the impact that COVID-19 would have on their businesses.
We also began the year with a very strong capital position, no wholesale funding, and no corporate debt. These factors, combined with our strong core deposit base and liquidity levels, allowed us to generate positive financial results in 2020 despite the effects of the pandemic.
Declines in mortgage rates during the year fueled a significant increase in demand for loans to purchase and construct new homes and to refinance existing home loans. Our Home Mortgage department originated over $310 million in new loans during the year and we realized $9.5 million in gains on the loans that were sold into the secondary market, both of which were record highs for the Bank.
Our Business Banking and Small Business Administration (SBA) Loan departments worked together to originate over $53 million in loans under the Paycheck Protection Program (PPP), a federal program to help businesses keep employees on their payrolls as businesses were forced to shut down due to the pandemic. By year end, approximately 36% of these loans had been forgiven by the SBA, a testament to our prudent review and underwriting of the PPP loan applications and our ability to assist our clients in navigating the SBA forgiveness application process. By year end, $1.1 million of the net fees generated by these loans had been recognized into income. Our business banking staff also underwrote and approved deferral agreements covering over $123 million in commercial and consumer loans during the year to help our clients deal with COVID-19 related disruptions in cash flow. Fortunately, by year end most of these loans had resumed making their scheduled payments and there remained only $35 million in loans with modified payment terms as of December 31, 2020.
Our wealth management area, Home Federal Investment Services, also posted strong results in terms of assets under management and total recurring revenue. We are proud to have been ahead of the curve in moving from a transaction fee based delivery model to one more based on advisory fees. This advisory fee model is designed to assure our clients that they are investing in the most appropriate products to meet their individual investment goals and objectives.
During the year, deposits grew to over $795 million, up 18% from the previous year, while total assets increased to nearly $910 million. This growth, combined with the increased production mentioned earlier, resulted in net income for the year of $10.3 million, or $2.22 per share, compared to $7.8 million, or $1.68 per share in 2019.
As I write this letter, new daily positive test results, as well as daily deaths attributed to the virus have fallen considerably. We are optimistic that the rate of vaccinations to prevent COVID-19 will increase substantially during the first half of 2021, encourage herd resistance and enable our economy to gradually reopen. We will remain vigilant and do our part to ensure the safety of our employees, our valued clients and the communities we serve.
I am very proud of the commitment our employees have demonstrated to the success of our company, and thank them for the flexibility they have shown our organization this past year in balancing the demands that the pandemic has had on their lives both at home and at work.
I wish you all the best of health this coming year and thank you for your continued support of HMN Financial Inc. and Home Federal Savings Bank. Together we can build a stronger, more profitable Company.
Best Regards,

Bradley Krehbiel
President and Chief Executive Officer
Board of Directors
 |
 |
|
Dr. Wendy Shannon Board Chair |
Bradley Krehbiel President and CEO |
 |
 |
 |
 |
|
Allen Berning |
Sequoya Borgman |
Michael Bue |
Bernard Nigon |
 |
 |
 |
|
Dr. Hugh Smith |
Mark Utz |
Hans Zietlow |
Five-Year Consolidated Financial Highlights
|
Selected Operations Data: |
Year Ended December 31, |
|||||||||||||||||||
|
(Dollars in thousands, except per share data) |
2020 |
2019 |
2018 |
2017 |
2016 |
|||||||||||||||
|
Total interest income |
$ | 31,959 | 31,890 | 30,381 | 27,680 | 27,349 | ||||||||||||||
|
Total interest expense |
2,851 | 3,339 | 2,233 | 1,797 | 1,593 | |||||||||||||||
|
Net interest income |
29,108 | 28,551 | 28,148 | 25,883 | 25,756 | |||||||||||||||
|
Provision for loan losses |
2,699 | (1,216 | ) | (649 | ) | (523 | ) | (645 | ) | |||||||||||
|
Net interest income after provision for loan losses |
26,409 | 29,767 | 28,797 | 26,406 | 26,401 | |||||||||||||||
|
Fees and service charges |
2,877 | 3,100 | 3,330 | 3,354 | 3,427 | |||||||||||||||
|
Loan servicing fees |
1,356 | 1,278 | 1,255 | 1,202 | 1,108 | |||||||||||||||
|
Gain on sales of loans |
9,531 | 2,941 | 2,095 | 2,138 | 2,618 | |||||||||||||||
|
Other non-interest income |
1,190 | 1,136 | 1,034 | 960 | 1,048 | |||||||||||||||
|
Total non-interest income |
14,954 | 8,455 | 7,714 | 7,654 | 8,201 | |||||||||||||||
|
Total non-interest expense |
26,993 | 27,105 | 25,387 | 25,254 | 24,130 | |||||||||||||||
|
Income before income tax expense |
14,370 | 11,117 | 11,124 | 8,806 | 10,472 | |||||||||||||||
|
Income tax expense |
4,068 | 3,324 | 2,888 | 4,402 | (1) | 4,122 | ||||||||||||||
|
Net income |
$ | 10,302 | 7,793 | 8,236 | 4,404 | 6,350 | ||||||||||||||
|
Basic earnings per common share |
$ | 2.23 | 1.69 | 1.89 | 1.04 | 1.52 | ||||||||||||||
|
Diluted earnings per common share |
2.22 | 1.68 | 1.71 | 0.90 | 1.34 | |||||||||||||||
|
(1) Relates to the decrease in the Company’s net deferred tax asset as a result of the reduction in the corporate federal tax rate from 34% to 21% in the fourth quarter of 2017. |
|
Selected Financial Condition Data: |
At December 31, |
|||||||||||||||||||
|
(Dollars in thousands, except per share data) |
2020 |
2019 |
2018 |
2017 |
2016 |
|||||||||||||||
|
Total assets |
$ | 909,580 | 777,639 | 712,315 | 722,685 | 682,023 | ||||||||||||||
|
Securities available for sale |
148,090 | 107,592 | 79,859 | 77,472 | 78,477 | |||||||||||||||
|
Loans held for sale |
6,186 | 3,606 | 3,444 | 1,837 | 2,009 | |||||||||||||||
|
Loans receivable, net |
642,630 | 596,392 | 586,688 | 585,931 | 551,171 | |||||||||||||||
|
Deposits |
795,204 | 673,870 | 623,352 | 635,601 | 592,811 | |||||||||||||||
|
Federal Home Loan Bank advances and other borrowings |
0 | 0 | 0 | 0 | 7,000 | |||||||||||||||
|
Stockholders’ equity |
103,252 | 92,648 | 83,147 | 80,818 | 75,919 | |||||||||||||||
|
Book value per common share |
21.65 | 19.13 | 17.19 | 17.97 | 16.91 | |||||||||||||||
|
Number of full service offices |
14 | 14 | (2) | 14 | 13 | 13 | ||||||||||||||
|
Number of loan origination offices |
1 | 1 | (2) | 2 | 3 | 3 | ||||||||||||||
|
Key Ratios: (3) |
||||||||||||||||||||
|
Stockholders’ equity to total assets at year end |
11.35 |
% |
11.91 |
% |
11.67 |
% |
11.18 |
% |
11.13 |
% |
||||||||||
|
Average stockholders’ equity to average assets |
11.43 | 12.06 | 11.52 | 11.43 | 11.07 | |||||||||||||||
|
Return on stockholders’ equity (ratio of net income to average equity) |
10.56 | 8.74 | 9.88 | 5.52 | 8.71 | |||||||||||||||
|
Return on assets (ratio of net income to average assets) |
1.21 | 1.05 | 1.14 | 0.63 | 0.96 | |||||||||||||||
|
(2) In 2019, converted Wisconsin loan origination office to a full service office and consolidated the two Kasson offices into one location. |
|
(3) Average balances were calculated based upon amortized cost without the market value impact of ASC 320. |
See accompanying notes to consolidated financial statements.
Management Discussion and Analysis
This Annual Report, other reports filed by HMN Financial, Inc. (HMN or the Company) with the Securities and Exchange Commission (SEC), and the Company’s proxy statement may contain forward-looking statements within the meaning of the safe harbor provisions of the Private Securities Litigation Reform Act of 1995. These statements are often identified by such forward-looking terminology as “expect,” “estimate,” “intend,” “look,” “believe,” “anticipate,” “project,” “continue,” “may,” “will,” “would,” “could,” “target,” “goal,” “should,” and “trend,” or similar statements or variations of such terms and include, but are not limited to, those relating to growing our core deposit relationships and loan balances; enhancing the financial performance of our core banking operations; maintaining credit quality; maintaining net interest margins; reducing non-performing assets and generating improved financial results (including profitability); the adequacy and amount of available liquidity and capital resources to Home Federal Savings Bank (the Bank); the Company’s liquidity and capital requirements; the anticipated impacts of the COVID-19 pandemic and efforts to mitigate the same on the general economy, our clients, and the allowance for loan losses; the anticipated benefits that will be realized by our clients from government assistance programs related to the COVID-19 pandemic; the amount of anticipated loans to be originated under the second round of the Paycheck Protection Plan (PPP), the amount of the Bank’s non-performing assets in future periods and the appropriateness of the allowances therefor; anticipated future levels of the provision for loan losses; future losses on non-performing assets; the amount and composition of interest earning assets; the amount of yield enhancements relating to non-accruing and purchased loans; the amount and compositions of non-interest and interest-bearing liabilities; the availability of alternate funding sources; the payment of dividends or repurchases of stock by HMN; the amount of deposits that will be withdrawn from checking and money market accounts and how the withdrawn deposits will be replaced; the projected changes in net interest income based on rate shocks; the range that interest rates may fluctuate over the next twelve months; the net market risk of interest rate shocks; the future outlook for the issuer of the trust preferred securities held by the Bank; the anticipated results of litigation and our assessment of the impact on our financial statements; the ability of the Bank to pay dividends to HMN; the ability to remain well capitalized; the impact of new accounting pronouncements; and compliance by the Bank with regulatory standards generally (including the Bank’s status as “well-capitalized”) and other supervisory directives or requirements to which the Company or the Bank are or may become expressly subject.
A number of factors, many of which may be amplified by the COVID-19 pandemic and efforts to mitigate the same, could cause actual results to differ materially from the Company’s assumptions and expectations. These include but are not limited to the adequacy and marketability of real estate and other collateral securing loans to borrowers; federal and state regulation and enforcement; possible legislative and regulatory changes, including changes to regulatory capital rules; the ability of the Bank to comply with other applicable regulatory capital requirements; enforcement activity of the Office of the Comptroller of the Currency (OCC) and the Federal Reserve Bank of Minneapolis in the event of our non-compliance with any applicable regulatory standard or requirement; adverse economic, business and competitive developments such as continued shrinking interest margins, reduced collateral values, deposit outflows, changes in credit or other risks posed by the Company’s loan and investment portfolios; changes in costs associated with traditional and alternate funding sources, including changes in collateral advance rates and policies of the Federal Home Loan Bank (FHLB) and the Federal Reserve Bank; technological, computer-related or operational difficulties including those from any third party cyberattack; results of litigation; reduced demand for financial services and loan products; changes in accounting policies and guidelines, or monetary and fiscal policies of the federal government or tax laws; domestic and international economic developments; the Company’s access to and adverse changes in securities markets; the market for credit related assets; the future operating results, financial condition, cash flow requirements and capital spending priorities of the Company and the Bank; the availability of internal and, as required, external sources of funding; our ability to attract and retain employees; or other significant uncertainties. Additional factors that may cause actual results to differ from the Company’s assumptions and expectations include those set forth in the “Risk Factors” section of the Company’s Annual Report on Form 10-K for the year ended December 31, 2020. All forward-looking statements are qualified by, and should be considered in conjunction with, such cautionary statements.
All statements in this Annual Report, including forward-looking statements, speak only as of the date hereof, and we undertake no duty to update any of the forward-looking statements after the date of this Annual Report.
Overview
HMN is the stock savings bank holding company for the Bank, which operates community banking and loan production offices in Minnesota, Iowa and Wisconsin. The earnings of the Company are primarily dependent on the Bank's net interest income, which is the difference between interest earned on loans and investments, and the interest paid on interest-bearing liabilities such as deposits and other borrowings. The difference between the average rate of interest earned on assets and the average rate paid on liabilities is the "interest rate spread". Net interest income is produced when interest-earning assets equal or exceed interest-bearing liabilities and there is a positive interest rate spread. Net interest income and net interest rate spread are affected by changes in interest rates, the volume and composition of interest-earning assets and interest-bearing liabilities, and the level of non-performing assets. The Company's net earnings are also affected by the generation of non-interest income, which consists primarily of gains from the sale of loans and real estate owned, fees for servicing loans, commissions on the sale of uninsured investment products, and service charges on deposit accounts. The Bank incurs expenses in addition to interest expense in the form of compensation and benefits, occupancy and equipment expenses, provisions for loan losses, data processing costs, professional services, deposit insurance, amortization expense on mortgage servicing assets, advertising expenses, and income taxes. The earnings of financial institutions, such as the Bank, are also significantly affected by prevailing economic and competitive conditions, particularly changes in interest rates, government monetary and fiscal policies, and regulations of various regulatory authorities. Lending activities are influenced by the demand for and supply of business credit, single family and commercial properties, competition among lenders, the level of interest rates and the availability of funds. Deposit flows and costs of deposits are influenced by prevailing market rates of interest on competing investments, account maturities and the levels of personal income and savings.
Critical Accounting Estimates
Critical accounting policies are those policies that the Company's management believes are the most important to understanding the Company’s financial condition and operating results. These critical accounting policies often involve estimates and assumptions that could have a material impact on the Company’s financial statements. The Company has identified the following critical accounting policies that management believes involve the most difficult, subjective, and/or complex judgments that are inherently uncertain. Therefore, actual financial results could differ significantly depending upon the estimates, assumptions and other factors used.
Allowance for Loan Losses and Related Provision
The allowance for loan losses is based on periodic analysis of the loan portfolio and is maintained at an amount considered to be appropriate by management to provide for probable losses inherent in the loan portfolio as of the balance sheet dates. In this analysis, management considers factors including, but not limited to, specific occurrences of loan impairment, actual and anticipated changes in the size of the portfolios, national and regional economic conditions such as unemployment data, loan delinquencies, local economic conditions, demand for single family homes, demand for commercial real estate and building lots, loan portfolio composition, historical loss experience and observations made by the Company's ongoing internal audit and regulatory exam processes. Loans are charged off to the extent they are deemed to be uncollectible. The Company has established separate processes to determine the appropriateness of the loan loss allowance for its homogeneous and non-homogeneous loan portfolios. The determination of the allowance on the homogeneous single family and consumer loan portfolios is calculated on a pooled basis with individual determination of the allowance for all non-performing loans. The determination of the allowance for the non-homogeneous commercial, commercial real estate and multi-family loan portfolios involves assigning standardized risk ratings and loss factors that are periodically reviewed. The loss factors are estimated based on the Company's own loss experience and other qualitative factors and are assigned to all loans without identified credit weaknesses. For each non-performing loan, the Company also performs an individual analysis of impairment that is based on the expected cash flows or the value of the assets collateralizing the loans and establishes any necessary reserves or charges off all loans, or portions thereof, that are deemed uncollectible.
The appropriateness of the allowance for loan losses is dependent upon management’s estimates of variables affecting valuation, appraisals of collateral, evaluations of performance and status and the amounts and timing of future cash flows expected to be received on impaired loans. Such estimates, appraisals, evaluations and cash flows may be subject to adjustments due to changing economic prospects of borrowers or properties. The fair market value of collateral dependent loans is typically based on the appraised value of the property less estimated selling costs. The estimates are reviewed periodically and any adjustments are recorded in the provision for loan losses in the periods in which the adjustments become known. Because of the size of some loans, changes in estimates can have a significant impact on the loan loss provision. The allowance is allocated to individual loan categories based upon the relative risk characteristics of the loan portfolios, the actual loss experience and other qualitative factors. The Company increases its allowance for loan losses by charging the provision for loan losses against income and by receiving recoveries of previously charged off loans. The Company decreases its allowance by crediting the provision for loan losses and recording loan charge-offs. The current year activity resulted in an increase in the allowance and a charge to the loan loss provision. The methodology for establishing the allowance for loan losses takes into consideration probable losses that have been identified in connection with specific loans as well as losses in the loan portfolio that have not been specifically identified. Although management believes that based on current conditions the allowance for loan losses is maintained at an appropriate amount to provide for probable loan losses inherent in the portfolio as of the balance sheet dates, future conditions may differ substantially from those anticipated in determining the allowance for loan losses and adjustments may be required in the future.
Income Taxes
Deferred tax assets and liabilities are recognized for the future tax consequences attributable to temporary differences between the financial statement carrying amounts of existing assets and liabilities and their respective tax basis. Deferred tax assets and liabilities are measured using enacted tax rates expected to apply to taxable income in the years in which those temporary differences are expected to be recovered or settled. The effect on deferred tax assets and liabilities of a change in tax rates is recognized in income in the period that includes the enactment date. These calculations are based on many complex factors including estimates of the timing of reversals of temporary differences, the interpretation of federal and state income tax laws, and a determination of the differences between the tax and the financial reporting basis of assets and liabilities. Actual results could differ significantly from the estimates and interpretations used in determining the current and deferred income tax assets and liabilities.
The Company maintains significant net deferred tax assets for deductible temporary differences, the largest of which relates to the allowance for loan losses. For tax purposes only the net charge-offs are deductible while the entire provision for loan losses is used to determine book income. A deferred tax asset is created because of the timing difference of when the expense is recognized for book and tax purposes. Under U.S. generally accepted accounting principles (GAAP), a valuation allowance is required to be recognized if it is “more likely than not” that the deferred tax asset will not be realized. The determination of the realizability of the deferred tax assets is highly subjective and dependent upon management’s judgment and evaluation of both positive and negative evidence, including the forecasts of future income, tax planning strategies, and assessments of the current and future economic and business conditions. The positive evidence considered includes the Company’s cumulative net income in the prior three year period, the ability to implement tax planning strategies to accelerate taxable income recognition, and the probability that taxable income will be generated in future periods. The Company could not currently identify any negative evidence. It is possible that future conditions may differ substantially from those anticipated in determining that no valuation allowance was required on deferred tax assets and adjustments may be required in the future.
Determining the ultimate settlement of any tax position requires significant estimates and judgments in arriving at the amount of tax benefits to be recognized in the financial statements. It is possible that the tax benefits realized upon the ultimate resolution of a tax position may result in tax benefits that are significantly different from those estimated.
Litigation
Estimates related to litigation are inherently subjective and the ultimate resolution of any litigation may be different than current management estimates. See “Note 18 Commitments and Contingencies” in the Notes to Consolidated Financial Statements for further information on outstanding litigation matters.
COVID-19 Pandemic
In 2020, the spread of COVID-19 slowed economic activity in many countries, including the United States. Millions of Americans were at some point ordered to stay home, including those residing in the states of Minnesota and Wisconsin, and many businesses were ordered to be closed for a period of time or to operate at reduced capacities in order to reduce the spread of COVID-19. These orders have severely reduced the flow of commerce which has reduced, or entirely eliminated, the revenue streams for many small businesses. This reduction in income has forced many small businesses to close temporarily, furlough employees, or terminate operations entirely.
The Bank has also been impacted by the disruption in economic activity that has occurred. During 2020, it temporarily closed the lobbies in all of its locations and for a period of time conducted business entirely through the drive-ups at the branches that have that capability. Branches without drive-up facilities were closed for a period of time in order to meet the social distancing guidelines recommended by health officials. Beginning on January 11, 2021 the Bank re-opened all of its lobbies to walk-in services during limited hours while continuing to offer drive-up service during normal business hours. The Bank continues to encourage its customers to conduct business through its on-line loan and deposit account services, as well as through ATM and night drop facilities available at its branches.
As of the date of this report, none of the Bank’s market areas were under a stay-at-home order. However, Bank employees who are able to perform their duties remotely are encouraged to do so.
The Coronavirus Aid, Relief, and Economic Security (CARES) Act was signed into law on March 27, 2020 and the Bank’s regulators issued the Interagency Statement on Loan Modification and Reporting for Financial Institutions Working with Customers Affected by the Coronavirus on April 7, 2020. In accordance with regulatory guidance, the Bank offered loan payment accommodations to certain customers by deferring the loan payments on their outstanding loans with the Bank for up to six months. After the initial deferral period was over, the Bank granted additional accommodations on certain loans to borrowers in accordance with Section 4013 of the CARES Act on a case-by-case basis. See “Note 6 Allowance for Loan Losses and Credit Quality Information” in the Notes to Consolidated Financial Statements for further information.
The extent of the impact of COVID-19 on the Company is difficult to determine as it is not clear how long the reduced economic activity will persist, how long it will take to administer the COVID-19 vaccines, how many people will take the vaccines, the effectiveness of the vaccine, if businesses will re-hire workers displaced by the pandemic, or what the long-term implications will be on customer behavior as a result of the pandemic, among other factors. The impact on the Bank’s loan portfolio is also unclear for many of the same reasons. At this time, the Company has not seen a negative impact on its deposit relationships as many of its clients have been able to conduct their business with the Bank through the drive-ups, ATMs, night drop, on-line banking website, or by using its mobile banking application.
Paycheck Protection Program
The Bank actively participated in helping businesses that applied for forgivable loans under the PPP as part of the CARES Act. The CARES Act allocated $349 billion in funding to help small businesses that were negatively impacted by the COVID-19 pandemic. The Bank had the following PPP loan activity during 2020:
|
Dollars in thousands |
Number of Loans |
Amount |
Net Deferred Fees |
|||||||||
|
Originated |
413 | $ | 53,153 | $ | 1,837 | |||||||
|
Repaid |
(130 | ) | (19,484 | ) | - | |||||||
|
Net deferred fees recognized |
- | - | (1,097 | ) | ||||||||
|
Balance, December 31, 2020 |
283 | $ | 33,669 | $ | 740 | |||||||
The Bank continues to submit applications for forgiveness on the PPP loans that were still outstanding at December 31, 2020 and, based on our experience with previously submitted applications, it is anticipated that the majority of these loans will be forgiven by the Small Business Administration (SBA). To the extent a portion of the loans are not forgiven or repaid in full, the remaining net deferred fees will be recognized into income over the remaining lives of the loans.
The Consolidated Appropriations Act of 2021, which was signed into law on December 27, 2020, allocated $284 billion to the SBA to fund a second round of the PPP and extended the application period for the program to March 31, 2021. The Bank is actively participating in the second round of the program and began submitting applications for borrowers on January 15, 2021 when the application window officially opened for financial institutions with under $1 billion in assets. The second round of the program allows applications from first time borrowers as well as those that obtained loans during the first round of the program. The revised program, among other things, requires that borrowers demonstrate or certify that they experienced a 25% or greater reduction in gross receipts from a quarter in 2020 compared to the same quarter in 2019 and certify that current economic uncertainty makes the loan request necessary to support their ongoing operations. For various reasons, including the increased requirements to qualify for a second loan, it is anticipated that the Bank will originate fewer loans in the second round of the program.
Results of Operations
Comparison of 2020 with 2019
Net income was $10.3 million for 2020, an increase of $2.5 million, or 32.2%, compared to net income of $7.8 million for 2019. Diluted earnings per share for the year ended December 31, 2020 was $2.22, an increase of $0.54 per share compared to diluted earnings per share of $1.68 for the year ended December 31, 2019. The increase in net income between the periods was primarily because of a $6.6 million increase in the gain on sales of loans due to the increase in mortgage loan originations and sales between the periods, a $0.5 million increase in net interest income due primarily to an increase in the earning assets between the periods and a $0.1 million decrease in non-interest expenses primarily related to a decrease in legal expenses. These increases in net income were partially offset by a $3.9 million increase in the provision for loan losses due primarily to the increase in qualitative reserves that were established as a result of the stressed economic environment caused by the COVID-19 pandemic. Income tax expense increased $0.7 million as a result of the increase in pre-tax income between the periods.
Net Interest Income
Net interest income was $29.1 million for 2020, an increase of $0.5 million, or 2.0%, from $28.6 million for 2019. Interest income was $32.0 million for 2020, an increase of $0.1 million, or 0.2%, from $31.9 million for 2019. Interest income increased primarily because of the $112.8 million increase in the average interest-earning assets between the periods. However, the majority of that increase was offset by a decrease in the average yield earned on interest-earning assets. The average yield earned on interest-earning assets was 3.90% for 2020, a decrease of 61 basis points from 4.51% for 2019. The decrease in the average yield is primarily related to the decrease in loan yields as a result of the decrease in the average prime rate between the periods.
Interest expense was $2.9 million for 2020, a decrease of $0.4 million, or 14.6%, from $3.3 million for 2019. Interest expense decreased despite the $105.9 million increase in the average interest-bearing liabilities and non-interest bearing deposits between the periods primarily because of the decrease in the average interest rate paid on deposits. The average interest rate paid on interest-bearing liabilities and non-interest bearing deposits was 0.38% for 2020, a decrease of 14 basis points from 0.52% for 2019. The decrease in the average interest rate paid on interest-bearing liabilities was primarily because of the decrease in deposit rates as a result of the decrease in the average federal funds rate between the periods.
The following table presents the total dollar amount of interest income from average interest-earning assets and the resultant yields, as well as the interest expense on average interest-bearing liabilities, expressed both in dollars and rates. Non-accruing loans have been included in the average outstanding loan balance in the table as loans carrying a zero yield.
|
Year Ended December 31, |
||||||||||||||||||||||||||||||||||||
|
2020 |
2019 |
2018 |
||||||||||||||||||||||||||||||||||
|
(Dollars in thousands) |
Average Outstanding Balance |
Interest Earned/ Paid |
Average Yield/ Rate |
Average Outstanding Balance |
Interest Earned/ Paid |
Average Yield/ Rate |
Average Outstanding Balance |
Interest Earned/ Paid |
Average Yield/ Rate |
|||||||||||||||||||||||||||
|
Interest-earning assets: |
||||||||||||||||||||||||||||||||||||
|
Securities available for sale: |
||||||||||||||||||||||||||||||||||||
|
Mortgage-backed and related securities |
$ | 61,364 | 1,155 | 1.88 |
% |
$ | 15,308 | 343 | 2.24 |
% |
$ | 8,550 | 197 | 2.30 |
% |
|||||||||||||||||||||
|
Other marketable securities |
46,407 | 702 | 1.51 | 67,075 | 1,157 | 1.72 | 70,827 | 1,138 | 1.61 | |||||||||||||||||||||||||||
|
Loans held for sale |
7,292 | 215 | 2.95 | 2,959 | 125 | 4.22 | 1,765 | 89 | 5.04 | |||||||||||||||||||||||||||
|
Loans receivable, net(1) (2) |
644,912 | 29,709 | 4.61 | 589,521 | 29,662 | 5.03 | 586,664 | 28,446 | 4.85 | |||||||||||||||||||||||||||
|
FHLB stock and other earning assets including cash equivalents |
59,321 | 178 | 0.30 | 31,679 | 603 | 1.90 | 30,567 | 511 | 1.67 | |||||||||||||||||||||||||||
|
Total interest-earning assets |
$ | 819,296 | 31,959 | 3.90 | $ | 706,542 | 31,890 | 4.51 | $ | 698,373 | 30,381 | 4.35 | ||||||||||||||||||||||||
|
Interest-bearing liabilities: |
||||||||||||||||||||||||||||||||||||
|
Checking accounts |
$ | 122,781 | 151 | 0.12 |
% |
$ | 96,387 | 103 | 0.11 |
% |
$ | 86,750 | 62 | 0.07 |
% |
|||||||||||||||||||||
|
Savings accounts |
90,064 | 65 | 0.07 | 79,587 | 63 | 0.08 | 77,630 | 61 | 0.08 | |||||||||||||||||||||||||||
|
Money market accounts |
209,522 | 840 | 0.40 | 177,587 | 1,171 | 0.66 | 199,202 | 865 | 0.43 | |||||||||||||||||||||||||||
|
Certificate accounts |
115,079 | 1,795 | 1.56 | 121,914 | 1,995 | 1.64 | 114,243 | 1,243 | 1.09 | |||||||||||||||||||||||||||
|
FHLB advances and other borrowings |
0 | 0 | 0.00 | 287 | 7 | 2.54 | 140 | 2 | 1.71 | |||||||||||||||||||||||||||
|
Total interest-bearing liabilities |
$ | 537,446 | $ | 475,762 | $ | 477,965 | ||||||||||||||||||||||||||||||
|
Noninterest checking |
207,456 | 163,420 | 156,482 | |||||||||||||||||||||||||||||||||
|
Other noninterest-bearing liabilities |
2,251 | 2,057 | 1,534 | |||||||||||||||||||||||||||||||||
|
Total interest-bearing liabilities and noninterest-bearing deposits |
$ | 747,153 | 2,851 | 0.38 |
% |
$ | 641,239 | 3,339 | 0.52 |
% |
$ | 635,981 | 2,233 | 0.35 |
% |
|||||||||||||||||||||
|
Net interest income |
29,108 | $ | 28,551 | $ | 28,148 | |||||||||||||||||||||||||||||||
|
Net interest rate spread |
3.52 |
% |
3.99 |
% |
4.00 |
% |
||||||||||||||||||||||||||||||
|
Net earning assets |
$ | 72,143 | $ | 65,303 | $ | 62,392 | ||||||||||||||||||||||||||||||
|
Net interest margin |
3.55 |
% |
4.04 |
% |
4.03 |
% |
||||||||||||||||||||||||||||||
|
Average interest-earning assets to average interest-bearing liabilities and noninterest-bearing deposits |
109.66 |
% |
110.18 |
% |
109.81 |
% |
||||||||||||||||||||||||||||||
|
(1) Tax exempt income was not material; therefore, the yield was not presented on a tax equivalent basis for any of the years presented. |
| (2) Calculated net of deferred loan costs, loan discounts, loans in process and loss reserves. |
Net interest margin (net interest income divided by average interest-earning assets) for 2020 was 3.55%, a decrease of 49 basis points, compared to 4.04% for 2019. The decrease in the net interest margin is primarily related to the decrease in the average yield earned on interest-earning assets as a result of the prime rate decreases that occurred between the periods. Average net earning assets increased from $65.3 million in 2019 to $72.1 million in 2020. The $6.8 million increase in the net earning assets in 2020 is due primarily to the net income earned in 2020 that was partially offset by the purchase of premises, equipment and treasury stock.
The following table presents the dollar amount of changes in interest income and interest expense for major components of interest-earning assets and interest-bearing liabilities. It quantifies the changes in interest income and interest expense related to changes in the average outstanding balances (volume) and those changes caused by fluctuating interest rates. For each category of interest-earning assets and interest-bearing liabilities, information is provided on changes attributable to (i) changes in volume (i.e., changes in volume multiplied by old rate) and (ii) changes in rate (i.e., changes in rate multiplied by current volume).
|
Year Ended December 31, |
||||||||||||||||||||||||
|
2020 vs. 2019 |
2019 vs. 2018 |
|||||||||||||||||||||||
|
Increase (Decrease) Due to |
Increase (Decrease) Due to |
|||||||||||||||||||||||
|
(Dollars in thousands) |
Volume (1) |
Rate(1) |
Total Increase (Decrease) |
Volume (1) |
Rate(1) |
Total Increase (Decrease) |
||||||||||||||||||
|
Interest-earning assets: |
||||||||||||||||||||||||
|
Securities available for sale: |
||||||||||||||||||||||||
|
Mortgage-backed and related securities |
$ | 1,033 | (221 | ) | 812 | 156 | (10 | ) | 146 | |||||||||||||||
|
Other marketable securities |
(356 | ) | (99 | ) | (455 | ) | (60 | ) | 79 | 19 | ||||||||||||||
|
Loans held for sale |
183 | (93 | ) | 90 | 60 | (24 | ) | 36 | ||||||||||||||||
|
Loans receivable, net |
2,744 | (2,697 | ) | 47 | 105 | 1,111 | 1,216 | |||||||||||||||||
|
Other |
518 | (943 | ) | (425 | ) | 17 | 75 | 92 | ||||||||||||||||
|
Total interest-earning assets |
$ | 4,122 | (4,053 | ) | 69 | 278 | 1,231 | 1,509 | ||||||||||||||||
|
Interest-bearing liabilities: |
||||||||||||||||||||||||
|
Checking accounts |
$ | 53 | (5 | ) | 48 | 1 | 40 | 41 | ||||||||||||||||
|
Savings accounts |
7 | (5 | ) | 2 | 2 | 0 | 2 | |||||||||||||||||
|
Money market accounts |
372 | (703 | ) | (331 | ) | (21 | ) | 327 | 306 | |||||||||||||||
|
Certificates of deposit |
(111 | ) | (89 | ) | (200 | ) | 53 | 699 | 752 | |||||||||||||||
|
FHLB advances and other borrowings |
(7 | ) | 0 | (7 | ) | 3 | 2 | 5 | ||||||||||||||||
|
Total interest-bearing liabilities |
$ | 314 | (802 | ) | (488 | ) | 38 | 1,068 | 1,106 | |||||||||||||||
|
Increase (decrease) in net interest income |
$ | 3,808 | (3,251 | ) | 557 | 240 | 163 | 403 | ||||||||||||||||
|
(1) For purposes of this table, changes attributable to both rate and volume which cannot be segregated have been allocated proportionately to the change due to volume and the change due to rate. |
The following table sets forth the weighted average yields on the Company's interest-earning assets, the weighted average interest rates on interest-bearing liabilities and the interest rate spread between the weighted average yields and rates as of the date indicated. Non-accruing loans have been included in the average outstanding loan balances in the table as loans carrying a zero yield.
|
At December 31, 2020 |
|||||||||
|
Weighted average yield on: |
Weighted average rate on: |
||||||||
|
Securities available for sale: |
|||||||||
|
Mortgage-backed and related securities |
1.51 |
% |
Checking accounts |
0.12 |
% |
||||
|
Other marketable securities |
1.29 |
Savings accounts |
0.06 | ||||||
|
Loans held for sale |
3.03 |
Money market accounts |
0.25 | ||||||
|
Loans receivable, net |
4.69 |
Certificates of deposit |
1.14 | ||||||
|
FHLB stock and other interest-earning assets |
0.14 |
Combined weighted average rate on interest-bearing liabilities |
0.25 | ||||||
|
Combined weighted average yield on interest-earning assets |
3.73 |
Interest rate spread |
3.48 | ||||||
Provision for Loan Losses
The provision for loan losses was $2.7 million for 2020, an increase of $3.9 million from the ($1.2) million provision for loan losses for 2019. The provision for loan losses increased between the periods primarily because of the changes in the economic environment related to the disruption in business activity as a result of the COVID-19 pandemic and also because of a reduction in the recoveries received on previously charged off loans. The amount of the increase in the allowance for loan losses related to the economic environment is based, in part, on the amount of loans to borrowers in the hospitality, restaurant and entertainment industries that continue to be negatively impacted by the COVID-19 pandemic. See “Note 6 Allowance for Loan Losses and Credit Quality Information” in the Notes to Consolidated Financial Statements for additional information related to deferrals and loan modifications to borrowers impacted by the COVID-19 pandemic.
Non-Interest Income
Non-interest income was $15.0 million for 2020, an increase of $6.5 million, or 76.9%, from $8.5 million for 2019. The following table presents the components of non-interest income:
|
Year ended December 31, |
Percentage Increase (Decrease) |
|||||||||||||||||||
|
(Dollars in thousands) |
2020 |
2019 |
2018 |
2020/2019 |
2019/2018 |
|||||||||||||||
|
Fees and service charges |
$ | 2,877 | 3,100 | 3,330 | (7.2 |
)% |
(6.9 |
)% |
||||||||||||
|
Loan servicing fees |
1,356 | 1,278 | 1,255 | 6.1 | 1.8 | |||||||||||||||
|
Gain on sales of loans |
9,531 | 2,941 | 2,095 | 224.1 | 40.4 | |||||||||||||||
|
Other non-interest income |
1,190 | 1,136 | 1,034 | 4.8 | 9.9 | |||||||||||||||
|
Total non-interest income |
$ | 14,954 | 8,455 | 7,714 | 76.9 | 9.6 | ||||||||||||||
Gain on sales of loans increased $6.6 million between the periods primarily because of an increase in single family loan originations and sales. Other non-interest income increased $0.1 million due primarily to an increase in the fees earned on the sale of uninsured investment products between the periods. Loan servicing fees increased $0.1 million between the periods due to an increase in the aggregate balances of single family mortgage loans that were being serviced for others. These increases in non-interest income were partially offset by a decrease of $0.2 million in fees and service charges earned between the periods due primarily to a decrease in overdraft fees collected.
Non-Interest Expense
Non-interest expense was $27.0 million for 2020, a decrease of $0.1 million, or 0.4%, from $27.1 million for 2019. The following table presents the components of non-interest expense:
|
Year ended December 31, |
Percentage Increase (Decrease) |
|||||||||||||||||||
|
(Dollars in thousands) |
2020 |
2019 |
2018 |
2020/2019 |
2019/2018 |
|||||||||||||||
|
Compensation and benefits |
$ | 15,646 | 15,659 | 14,728 | (0.1 |
)% |
6.3 |
% |
||||||||||||
|
Occupancy and equipment |
4,429 | 4,442 | 4,304 | (0.3 | ) | 3.2 | ||||||||||||||
|
Data processing |
1,314 | 1,263 | 1,270 | 4.0 | (0.6 | ) | ||||||||||||||
|
Professional services |
1,405 | 1,573 | 1,137 | (10.7 | ) | 38.3 | ||||||||||||||
|
Other |
4,199 | 4,168 | 3,948 | 0.7 | 5.6 | |||||||||||||||
|
Total non-interest expense |
$ | 26,993 | 27,105 | 25,387 | (0.4 | ) | 6.8 | |||||||||||||
Professional services expense decreased $0.2 million between the periods primarily because of a decrease in legal expenses relating to an ongoing bankruptcy litigation claim. Compensation and benefits expense decreased slightly because of an increase in the direct loan origination compensation costs that were deferred as a result of the increased mortgage loan production between the periods. Occupancy and equipment expense decreased slightly between the periods due to a decrease in building expenses as a result of having more staff working remotely in 2020. These decreases in non-interest expense were partially offset by a $0.1 million increase in data processing expenses between the periods due to an increase in internet and mobile banking costs. Other non-interest expense increased slightly due primarily to an increase in mortgage servicing expenses between the periods.
Income Taxes
The Company considers the calculation of current and deferred income taxes to be a critical accounting policy that is subject to significant estimates. Income tax expense was $4.1 million for 2020, an increase of $0.8 million from $3.3 million for 2019. The increase in income tax expense between the periods is primarily the result of an increase in pre-tax income.
Financial Condition
Loans Receivable, Net
The following table sets forth the information on the Company's loan portfolio in dollar amounts and percentages before deductions for deferred costs/fees and discounts and the allowance for losses as of the dates indicated:
|
December 31, |
||||||||||||||||||||||||||||||||||||||||
|
2020 |
2019 |
2018 |
2017 |
2016 |
||||||||||||||||||||||||||||||||||||
|
(Dollars in thousands) |
Amount |
Percent |
Amount |
Percent |
Amount |
Percent |
Amount |
Percent |
Amount |
Percent |
||||||||||||||||||||||||||||||
|
Real Estate Loans: |
||||||||||||||||||||||||||||||||||||||||
|
Single family |
$ | 135,023 | 20.65 |
% |
$ | 120,064 | 19.86 |
% |
$ | 110,698 | 18.61 |
% |
$ | 107,005 | 17.99 |
% |
$ | 103,255 | 18.41 |
% |
||||||||||||||||||||
|
Multi-family |
41,456 | 6.34 | 48,663 | 8.05 | 50,150 | 8.43 | 28,649 | 4.81 | 36,777 | 6.56 | ||||||||||||||||||||||||||||||
|
Commercial |
307,755 | 47.07 | 270,410 | 44.74 | 257,036 | 43.21 | 259,024 | 43.55 | 230,955 | 41.18 | ||||||||||||||||||||||||||||||
|
Construction or development |
31,493 | 4.82 | 31,122 | 5.15 | 28,944 | 4.87 | 46,444 | 7.81 | 31,348 | 5.59 | ||||||||||||||||||||||||||||||
|
Total real estate loans |
515,727 | 78.88 | 470,259 | 77.80 | 446,828 | 75.12 | 441,122 | 74.16 | 402,335 | 71.74 | ||||||||||||||||||||||||||||||
|
Other Loans: |
||||||||||||||||||||||||||||||||||||||||
|
Consumer Loans: |
||||||||||||||||||||||||||||||||||||||||
|
Automobile |
1,937 | 0.30 | 2,608 | 0.43 | 2,483 | 0.42 | 2,894 | 0.49 | 3,036 | 0.54 | ||||||||||||||||||||||||||||||
|
Home equity line |
21,308 | 3.26 | 28,004 | 4.63 | 32,273 | 5.42 | 36,869 | 6.20 | 40,476 | 7.22 | ||||||||||||||||||||||||||||||
|
Home equity |
11,549 | 1.76 | 16,422 | 2.72 | 16,733 | 2.81 | 15,823 | 2.66 | 16,302 | 2.91 | ||||||||||||||||||||||||||||||
|
Recreational vehicles |
15,645 | 2.39 | 17,266 | 2.86 | 16,226 | 2.73 | 13,181 | 2.21 | 7,553 | 1.35 | ||||||||||||||||||||||||||||||
|
Other |
4,952 | 0.76 | 5,649 | 0.93 | 4,817 | 0.81 | 5,000 | 0.84 | 5,916 | 1.05 | ||||||||||||||||||||||||||||||
|
Total consumer loans |
55,391 | 8.47 | 69,949 | 11.57 | 72,532 | 12.19 | 73,767 | 12.40 | 73,283 | 13.07 | ||||||||||||||||||||||||||||||
|
Commercial business loans |
82,673 | 12.65 | 64,227 | 10.63 | 75,496 | 12.69 | 79,909 | 13.44 | 85,176 | 15.19 | ||||||||||||||||||||||||||||||
|
Total other loans |
138,064 | 21.12 | 134,176 | 22.20 | 148,028 | 24.88 | 153,676 | 25.84 | 158,459 | 28.26 | ||||||||||||||||||||||||||||||
|
Total loans |
$ | 653,791 | 100.00 |
% |
$ | 604,435 | 100.00 |
% |
$ | 594,856 | 100.00 |
% |
$ | 594,798 | 100.00 |
% |
$ | 560,794 | 100.00 |
% |
||||||||||||||||||||
|
Less: |
||||||||||||||||||||||||||||||||||||||||
|
Unamortized discounts |
12 | 15 | 17 | 19 | 20 | |||||||||||||||||||||||||||||||||||
|
Net deferred loan fees (costs) |
450 | (536 | ) | (535 | ) | (463 | ) | (300 | ) | |||||||||||||||||||||||||||||||
|
Allowance for losses |
10,699 | 8,564 | 8,686 | 9,311 | 9,903 | |||||||||||||||||||||||||||||||||||
|
Total loans receivable, net |
$ | 642,630 | $ | 596,392 | $ | 586,688 | $ | 585,931 | $ | 551,171 | ||||||||||||||||||||||||||||||
The growth in the loan portfolio in 2020 was primarily because of the growth experienced in commercial real estate, single family real estate and commercial business loans that was partially offset by a decrease in multi-family and consumer loans. Based on current economic conditions and the projected loan origination and prepayment amounts, it is anticipated that the overall growth in the loan portfolio will be limited in 2021.
Single family real estate loans were $135.0 million at December 31, 2020, an increase of $14.9 million, compared to $120.1 million at December 31, 2019. The single family loan portfolio increased in 2020 because of an increase in the single family loans that were originated due to the low interest rate environment and a continued emphasis on placing shorter term fixed rate and adjustable rate mortgage loans into the portfolio. The majority of the longer term mortgage loans that were originated during the year were not placed in the loan portfolio, but were sold into the secondary market in order to manage the Company’s interest rate risk position.
Multi-family real estate loans were $41.5 million at December 31, 2020, a decrease of $7.2 million, compared to $48.7 million at December 31, 2019. The decrease in multi-family real estate loans in 2020 is primarily the result of having more loans that paid off during the period than there were new loan originations.
Commercial real estate loans were $307.8 million at December 31, 2020, an increase of $37.4 million, compared to $270.4 million at December 31, 2019. The increase in commercial real estate loans is primarily due to an increase in the originations of these types of loans in 2020.
Construction or development loans were $31.5 million at December 31, 2020, an increase of $0.4 million, compared to $31.1 million at December 31, 2019. The increase in construction loans is primarily related to the $16.0 million in new construction loans and the $8.7 million in advances on existing loans. These increases were partially offset by the $15.1 million in paid off loans and the $9.2 million of loans on construction projects that were completed during the year and were moved to another loan category.
Home equity lines of credit were $21.3 million at December 31, 2020, a decrease of $6.7 million, compared to $28.0 million at December 31, 2019. The open-end home equity lines are generally written with an adjustable rate and a two to ten year draw period which requires interest only payments followed by a ten year repayment period which fully amortizes the outstanding balance. Home equity loans were $11.5 million at December 31, 2020, a decrease of $4.9 million, compared to $16.4 million at December 31, 2019. Closed-end home equity loans are written with fixed or adjustable rates with terms up to fifteen years. The overall decrease in the open-end equity lines and closed-end equity loans is related primarily to an increase in loan payoffs and other principal reductions as borrowers refinanced their homes and rolled outstanding equity loan balances into their first mortgage.
Recreational vehicle loans were $15.6 million at December 31, 2020, a decrease of $1.7 million, compared to $17.3 million at December 31, 2019. These loans have been made primarily to finance the recreational vehicle sales of a single dealer within the Bank’s market area and the decrease in the balance between the periods is primarily due to a decrease in originations as a result of increasing the credit standards required to obtain a recreational vehicle loan in 2020.
Commercial business loans were $82.7 million at December 31, 2020, an increase of $18.5 million, compared to $64.2 million at December 31, 2019. The increase in commercial business loans in 2020 is primarily because of the $33.7 million in PPP loans that were outstanding at December 31, 2020. The $15.2 million decrease in non-PPP commercial business loans is because loan payoffs exceeded loan originations during the year, with some of the payoffs related to the Bank’s initiative to maintain the credit quality of the loan portfolio.
Allowance for Loan Losses
The determination of the allowance for loan losses and the related provision is a critical accounting policy of the Company that is subject to significant estimates. The allowance for loan losses is made up of general reserves on the entire loan portfolio and specific reserves on impaired loans. The general reserve amount includes quantitative reserves based on our past loan loss history and qualitative reserves for other items determined to have a potential impact on future loan losses. The current level of the allowance for loan losses is a result of management’s assessment of the risks within the portfolio based on the information obtained through the credit evaluation process. The Company utilizes a risk-rating system on non-homogeneous commercial real estate and commercial business loans that includes regular credit reviews to identify and quantify the risk in the commercial portfolio. Management conducts quarterly reviews of the entire loan portfolio and evaluates the need to adjust the allowance balance on the basis of these reviews.
Management actively monitors asset quality and, when appropriate, charges off loans against the allowance for loan losses. Although management believes it uses the best information available to make determinations with respect to the allowance for loan losses, future adjustments may be necessary if economic conditions differ substantially from the economic conditions in the assumptions used to determine the size of the allowance for loan losses.
The allowance for loan losses was $10.7 million, or 1.64% of gross loans at December 31, 2020, compared to $8.6 million, or 1.42% of gross loans at December 31, 2019. The allowance increased in 2020 as a result of an increase in the general qualitative allowance for loan losses because of the current economic environment related to the disruption in business activity as a result of the COVID-19 pandemic.
The following table reflects the activity in the allowance for loan losses and selected statistics:
|
December 31, |
||||||||||||||||||||
|
(Dollars in thousands) |
2020 |
2019 |
2018 |
2017 |
2016 |
|||||||||||||||
|
Balance at beginning of year |
$ | 8,564 | 8,686 | 9,311 | 9,903 | 9,709 | ||||||||||||||
|
Provision for losses |
2,699 | (1,216 | ) | (649 | ) | (523 | ) | (645 | ) | |||||||||||
|
Charge-offs: |
||||||||||||||||||||
|
Single family |
0 | (1 | ) | (24 | ) | (6 | ) | (66 | ) | |||||||||||
|
Commercial real estate |
(730 | ) | 0 | 0 | (50 | ) | (67 | ) | ||||||||||||
|
Consumer |
(84 | ) | (107 | ) | (226 | ) | (288 | ) | (108 | ) | ||||||||||
|
Commercial business |
(8 | ) | (880 | ) | (270 | ) | (311 | ) | (180 | ) | ||||||||||
|
Recoveries |
258 | 2,082 | 544 | 586 | 1,260 | |||||||||||||||
|
Net (charge-offs) recoveries |
(564 | ) | 1,094 | 24 | (69 | ) | 839 | |||||||||||||
|
Balance at end of year |
$ | 10,699 | 8,564 | 8,686 | 9,311 | 9,903 | ||||||||||||||
|
Year end allowance for loan losses as a percent of year end gross loan balance |
1.64 |
% |
1.42 |
% |
1.46 |
% |
1.57 |
% |
1.77 |
% |
||||||||||
|
Ratio of net loan (charge-offs) recoveries to average loans outstanding |
(0.09 | ) | 0.18 | 0.00 | (0.01 | ) | 0.16 | |||||||||||||
|
Allowance as a percent of total assets at year end |
1.18 | 1.10 | 1.22 | 1.29 | 1.45 | |||||||||||||||
The following table reflects the allocation of the allowance for loan losses:
|
December 31, |
||||||||||||||||||||||||||||||||||||||||
|
2020 |
2019 |
2018 |
2017 |
2016 |
||||||||||||||||||||||||||||||||||||
|
Allocated Allowance as a % of Loan Category |
Percent of Loans in Each Category to Total Loans |
Allocated Allowance as a % of Loan Category |
Percent of Loans in Each Category to Total Loans |
Allocated Allowance as a % of Loan Category |
Percent of Loans in Each Category to Total Loans |
Allocated Allowance as a % of Loan Category |
Percent of Loans in Each Category to Total Loans |
Allocated Allowance as a % of Loan Category |
Percent of Loans in Each Category to Total Loans |
|||||||||||||||||||||||||||||||
|
Single family |
0.76 |
% |
20.65 |
% |
0.71 |
% |
19.86 |
% |
0.75 |
% |
18.61 |
% |
0.84 |
% |
17.99 |
% |
1.15 |
% |
18.41 |
% |
||||||||||||||||||||
|
Commercial real estate |
1.92 | 58.23 | 1.44 | 57.94 | 1.45 | 56.51 | 1.52 | 56.17 | 1.66 | 53.33 | ||||||||||||||||||||||||||||||
|
Consumer |
2.51 | 8.47 | 2.15 | 11.57 | 2.24 | 12.19 | 2.21 | 12.40 | 2.20 | 13.07 | ||||||||||||||||||||||||||||||
|
Commercial business |
1.19 | 12.65 | 1.78 | 10.63 | 1.80 | 12.69 | 2.14 | 13.44 | 2.53 | 15.19 | ||||||||||||||||||||||||||||||
|
Total |
1.64 | 100.00 |
% |
1.42 | 100.00 |
% |
1.46 | 100.00 |
% |
1.57 | 100.00 |
% |
1.77 | 100.00 |
% |
|||||||||||||||||||||||||
The allocated allowance percentages for all loan categories, except commercial business loans, increased in 2020 primarily because of the current economic environment related to the disruption in business activity as a result of the COVID-19 pandemic. The decrease in the allowance percentage for commercial business loans is due to the $33.7 million of PPP loans that are included in this category at December 31, 2020 that are guaranteed by the SBA and have no allocated allowance amount.
Allowance for Real Estate Losses
Real estate properties acquired or expected to be acquired through loan foreclosures are initially recorded at fair value less estimated selling costs. Management periodically performs valuations and an allowance for losses is established if the carrying value of a property exceeds its fair value less estimated selling costs. There was no allowance for real estate losses at December 31, 2020 or 2019.
Non-performing Assets
Loans are reviewed at least quarterly and if the collectability of any loan is doubtful, it is placed on non-accrual status. Loans are placed on non-accrual status when either principal or interest is 90 days or more past due, unless, in the judgment of management, the loan is well collateralized and in the process of collection. Interest accrued and unpaid at the time a loan is placed on non-accrual status is charged against interest income. Subsequent payments are either applied to the outstanding principal balance or recorded as interest income, depending on the assessment of the ultimate collectability of the loan. Restructured loans include the Bank's troubled debt restructurings (TDRs) that involved forgiving a portion of interest or principal or making a loan at a rate materially less than the market rate to borrowers whose financial condition has deteriorated. Foreclosed and repossessed assets include assets acquired in settlement of loans. Total non-performing assets were $3.3 million at December 31, 2020, an increase of $0.6 million, or 24.7%, from $2.7 million at December 31, 2019. Non-performing loans increased $0.6 million and foreclosed and repossessed assets remained the same between the periods.
The following table sets forth the amounts and categories of non-performing assets in the Company’s portfolio:
|
December 31, |
||||||||||||||||||||
|
(Dollars in thousands) |
2020 |
2019 |
2018 |
2017 |
2016 |
|||||||||||||||
|
Non-performing loans: |
||||||||||||||||||||
|
Single family |
$ | 502 | 617 | 730 | 949 | 916 | ||||||||||||||
|
Commercial real estate |
1,484 | 184 | 1,311 | 1,364 | 1,384 | |||||||||||||||
|
Consumer |
689 | 659 | 489 | 553 | 630 | |||||||||||||||
|
Commercial business |
9 | 621 | 148 | 278 | 343 | |||||||||||||||
|
Total |
2,684 | 2,081 | 2,678 | 3,144 | 3,273 | |||||||||||||||
|
Foreclosed and repossessed assets: |
||||||||||||||||||||
|
Single family |
0 | 166 | 0 | 0 | 0 | |||||||||||||||
|
Commercial real estate |
636 | 414 | 414 | 627 | 611 | |||||||||||||||
|
Consumer |
0 | 0 | 0 | 0 | 16 | |||||||||||||||
|
Total |
636 | 580 | 414 | 627 | 627 | |||||||||||||||
|
Total non-performing assets |
$ | 3,320 | 2,661 | 3,092 | 3,771 | 3,900 | ||||||||||||||
|
Total as a percentage of total assets |
0.37 |
% |
0.34 |
% |
0.43 |
% |
0.52 |
% |
0.57 |
% |
||||||||||
|
Total non-performing loans |
$ | 2,684 | $ | 2,081 | $ | 2,678 | $ | 3,144 | $ | 3,273 | ||||||||||
|
Total as a percentage of total loans receivable, net |
0.42 |
% |
0.35 |
% |
0.46 |
% |
0.54 |
% |
0.59 |
% |
||||||||||
|
Allowance for loan losses to non-performing loans |
398.72 |
% |
411.25 |
% |
324.27 |
% |
296.11 |
% |
302.56 |
% |
||||||||||
Gross interest income which would have been recorded had the non-accruing loans been current in accordance with their original terms amounted to $0.2 million, $0.2 million and $0.3 million in 2020, 2019 and 2018, respectively. The amounts that were included in interest income on a cash basis for these loans were $0.1 million for each of the three years.
At December 31, 2020, 2019 and 2018, there were loans included in loans receivable, net, with terms that had been modified in a TDR totaling $1.5 million, $2.5 million and $2.5 million, respectively. Had these loans been performing in accordance with their original terms throughout 2020, 2019 and 2018, the Company would have recorded gross interest income of $0.1 million, $0.2 million and $0.3 million, respectively. During 2020 the amount of interest income received on these loans was not material. During 2019 and 2018, the Company recognized interest income of $0.1 million and $0.2 million, respectively, on these loans.
For the loans that were modified in a TDR in 2020, none were classified and performing and $0.3 million were non-performing at December 31, 2020. The decrease in TDRs in 2020 was primarily due to two related commercial loans that had performed according to their restructured terms and met the criteria to be upgraded to non-TDR status during the year. Of the loans that were modified in 2020 and outstanding at December 31, 2020, $0.2 million related to a loan secured by commercial real estate and $0.1 million related to a loan secured by a first mortgage on a single family property.
For the loans that were modified in a TDR in 2019, $0.1 million were classified and performing and $0.5 million were non-performing at December 31, 2019. Total TDRs of $2.5 million remained the same at December 31, 2019 when compared to December 31, 2018. During 2019, several single family and retail consumer TDRs paid off and were replaced by new TDRs. Of the loans that were modified in 2019 and outstanding at December 31, 2019, $0.5 million related to first or second mortgages on single-family properties, and the remaining modifications related to other consumer loans.
For the loans that were modified in a TDR in 2018, $0.4 million were classified and performing and $1.2 million were non-performing at December 31, 2018. The decrease in TDRs in 2018 related primarily to several retail consumer TDRs that were paid or charged off during the year, as well as one commercial business loan that was charged off. Of the loans that were modified in 2018 and outstanding at December 31, 2018, $1.1 million related to loans secured by commercial real estate, $0.4 million related to first or second mortgages on single family properties and the remaining modifications related to other consumer or commercial business loans.
The following table sets forth the amount of TDRs in the Company’s portfolio:
|
December 31, |
||||||||||||||||||||
|
(Dollars in thousands) |
2020 |
2019 |
2018 |
2017 |
2016 |
|||||||||||||||
|
Single family |
$ | 612 | 623 | 636 | 685 | 448 | ||||||||||||||
|
Commercial real estate |
211 | 983 | 1,110 | 1,210 | 1,774 | |||||||||||||||
|
Consumer |
630 | 745 | 522 | 758 | 709 | |||||||||||||||
|
Commercial business |
25 | 114 | 208 | 391 | 369 | |||||||||||||||
|
Total TDRs |
$ | 1,478 | 2,465 | 2,476 | 3,044 | 3,300 | ||||||||||||||
|
TDRs on accrual status |
$ | 442 | 1,770 | 1,018 | 1,129 | 1,297 | ||||||||||||||
|
TDRs on non-accrual status |
1,036 | 695 | 1,458 | 1,915 | 2,003 | |||||||||||||||
|
Total |
$ | 1,478 | 2,465 | 2,476 | 3,044 | 3,300 | ||||||||||||||
This TDR table does not include loan accommodations that were granted during 2020 to borrowers in accordance with the Interagency Statement on Loan Modification and Reporting for Financial Institutions Working with Customers Affected by the Coronavirus or Section 4013 of the CARES Act. See “Note 6 Allowance for Loan Losses and Credit Quality Information” in the Notes to Consolidated Financial Statements for further information on accommodations that were granted to borrowers in 2020.
Liquidity and Capital Resources
The Company manages its liquidity position so that the funding needs of borrowers and depositors are met in a timely and cost-effective manner. Asset liquidity is the ability to convert assets to cash through the maturity or sale of the asset. Liability liquidity is the ability of the Bank to obtain retail, internet, or brokered deposits or to borrow funds from third parties such as the FHLB or the Federal Reserve Bank of Minneapolis.
The primary investing activities are the origination of loans and the purchase of securities. Principal and interest payments on loans and securities, along with the proceeds from the sale of loans held for sale, are the primary sources of cash for the Bank. Additional cash can be obtained by selling securities from the available for sale portfolio or by selling loans or mortgage servicing rights.
The primary financing activity is the attraction of retail, commercial and internet deposits. The Bank also has the ability to borrow funds from the FHLB or Federal Reserve Bank of Minneapolis based on the collateral value of the loans pledged, subject to applicable borrowing base and collateral requirements. See “Note 12 Federal Home Loan Bank (FHLB) Advances and Other Borrowings” in the Notes to Consolidated Financial Statements for more information on the advances that could be drawn based upon existing collateral levels with the FHLB and the Federal Reserve Bank of Minneapolis. Unpledged securities could also be pledged and used as collateral for additional borrowings with the FHLB or Federal Reserve Bank of Minneapolis.
The Bank's most liquid assets are cash and cash equivalents, which consist of short-term highly liquid investments with original maturities of less than three months that are readily convertible to known amounts of cash and interest-bearing deposits. The level of these assets is dependent on the operating, financing and investing activities during any given period.
Cash and cash equivalents for the Company at December 31, 2020 were $86.3 million, an increase of $41.9 million, compared to $44.4 million at December 31, 2019. Net cash provided by operating activities during 2020 was $16.9 million. The Company conducted the following major investing activities during 2020: purchases of securities available for sale and FHLB stock were $97.3 million; principal payments and maturity proceeds received on securities available for sale were $58.3 million; and the proceeds from the sale of premises and other real estate were $0.4 million. Net loans receivable increased $55.1 million and the Company purchased premises and equipment of $0.7 million. Net cash used by investing activities during 2020 was $94.5 million. The Company conducted the following major financing activities during 2020: deposits increased $121.3 million; purchased treasury stock of $1.4 million; customer escrows decreased $0.4 million; and withheld stock of $0.1 million to cover taxes due on vested stock awards. Net cash provided by financing activities was $119.4 million for 2020.
The Bank has certificates of deposits from customers with outstanding balances of $76.2 million that mature during 2021. Based upon past experience, management anticipates that the majority of the deposits will renew for another term. The Company believes that deposits that do not renew will be replaced with deposits from other customers or FHLB advances. Proceeds from the sale of securities could also be used to fund unanticipated outflows of deposits.
The Bank has deposits of $84.5 million in checking and money market accounts of seven customers that have individual relationship balances greater than $5.0 million. These funds may be withdrawn at any time, however, management anticipates that the majority of these deposits will remain on deposit with the Bank over the next twelve months. If these deposits are withdrawn, it is anticipated that they would be funded with available cash or replaced with deposits from other customers or advances from the FHLB. Proceeds from the sale of securities could also be used to fund unanticipated outflows of deposits.
Dividends from the Bank have been the Company’s primary source of cash. The Bank is restricted under applicable federal banking law from paying dividends to the Company without prior notice to and non-objection of the applicable regulator. During 2020, the Bank paid dividends to the Company of $5.0 million and at December 31, 2020, the Company had an available cash balance of $11.0 million.
The Company’s primary use of cash is the payment of holding company level expenses including the payment of director and management fees, legal expenses and regulatory costs. The Company may also use cash to repurchase stock or pay any declared dividends. The Company plans to continue to fund its liquidity needs through dividends from the Bank, or if deemed prudent, by obtaining external capital.
Contractual Obligations and Commercial Commitments
The Company has certain obligations and commitments to make future payments under existing contracts. See “Note 18 Commitments and Contingencies” in the Notes to Consolidated Financial Statements for further information on the outstanding contractual obligations and commercial commitments at December 31, 2020.
Regulatory Capital Requirements
The Company and the Bank are subject to the Basel III regulatory capital requirements. The Basel III requirements, among other things, (i) apply a set of capital requirements to the Bank (the Company is exempt, pursuant to the Small Bank Holding Company Policy Statement (Policy Statement) described below), including requirements relating to common equity as a component of core capital, (ii) implement a “capital conservation buffer” against risk and a minimum Tier 1 capital requirement, and (iii) set forth rules for calculating risk-weighted assets for purposes of such requirements. The rules made corresponding revisions to the prompt corrective action framework and include capital ratios and buffer requirements. Failure to meet minimum capital requirements can initiate certain mandatory and possibly additional discretionary actions by regulators that, if undertaken, could have a direct material effect on the Company's financial statements. Under capital adequacy guidelines and the regulatory framework for prompt corrective action, the Bank must meet specific capital guidelines that involve quantitative measures of its assets, liabilities and certain off-balance sheet items as calculated under regulatory accounting practices. The capital amounts and classification are also subject to qualitative judgments by the regulators about components, risk weightings and other factors.
The FRB amended its Policy Statement, to exempt small bank and savings and loan holding companies with assets less than $3 billion from the above capital requirements. The Company currently meets the qualitative exemption requirements, and therefore, is exempt from the above capital requirements.
Quantitative measures established by regulations to ensure capital adequacy require the Bank to maintain minimum amounts and ratios of common equity Tier 1 capital to risk weighted assets, Tier 1 capital to adjusted total assets, Tier 1 capital to risk weighted assets and total capital to risk weighted assets.
The Bank must maintain a capital conservation buffer of at least 2.50% composed of common equity Tier 1 capital above its minimum risk-based capital requirements in order to avoid limitations on capital distributions, including dividend payments and certain discretionary bonus payments to executive officers. Management believes that, as of December 31, 2020, the Bank’s capital ratios were in excess of those quantitative capital ratio standards set forth under the current prompt corrective action regulations, including the capital conservation buffer described above. However, there can be no assurance that the Bank will continue to maintain such status in the future. The Office of the Comptroller of the Currency has extensive discretion in its supervisory and enforcement activities, and can adjust the requirement to be well-capitalized in the future. See “Note 17 Regulatory Capital” in the Notes to Consolidated Financial Statements for a table that reflects the Bank’s capital compared to these capital requirements.
The Company also serves as a source of capital, liquidity and financial support to the Bank. Depending upon the operating performance of the Bank and the Company’s other liquidity and capital needs, the Company may find it prudent, subject to prevailing capital market conditions and other factors, to raise additional capital through issuance of its common stock or other equity securities. Additional capital would potentially permit the Company to implement a strategy of growing Bank assets. Depending on the circumstances, if it were to raise capital, the Company may deploy it to the Bank for general banking purposes, or may retain some or all of it for use by the Company.
If the Company raises capital through the issuance of additional shares of common stock or other equity securities, it would dilute the ownership interests of existing stockholders and, if issued at less than the Company’s book value would dilute the per share book value of the Company’s common stock, dilute the Company’s earnings per share and could result in a change in control of the Company and the Bank. New investors may also have rights, preferences and privileges senior to the Company’s current stockholders which may adversely impact the Company’s current stockholders. The Company’s ability to raise additional capital through the issuance of equity securities, if deemed prudent, will depend on, among other factors, conditions in the capital markets at that time, which are outside of the Company’s control, and on the Company’s financial performance and plans. Accordingly, the Company may not be able to raise additional capital, if deemed prudent, on favorable economic terms, or other terms acceptable to it. If the Bank cannot satisfactorily address its capital needs as they arise, the Bank’s ability to maintain or expand its operations, maintain compliance with the regulatory capital requirements, to operate without additional regulatory or other restrictions, and its operating results, could be materially adversely affected.
Dividends
The declaration of dividends is subject to, among other things, the Company's financial condition and results of operations, the Bank's compliance with regulatory capital requirements and other regulatory restrictions, tax considerations, industry standards, economic conditions, anticipated asset growth, general business practices and other factors. The Company has not made any dividend payments to common stockholders during the three year period ending December 31, 2020 but will continue to evaluate the best use of the Company’s capital based on the factors identified above.
Under applicable federal banking laws and regulations, no dividends can be declared or paid by the Bank to the Company without notice to and non-objection from the applicable banking regulator. There is no assurance that the Bank and the Company would satisfy the applicable regulatory requirements necessary to effect any such dividends. The payment of dividends by the Company is dependent upon the Company having adequate cash or other assets that can be converted to cash to pay dividends to its stockholders. Further, any determination as to whether, when and in what amount to declare and pay any such dividends would be subject to the discretion of the board of directors of both the Bank and the Company and would depend on numerous factors including the results of operations, financial conditions, asset growth plans, planned stock repurchases, and the cash flow requirements of the Company and the Bank.
New Accounting Pronouncements
“Note 1 Description of the Business and Summary of Significant Accounting Policies” in the Notes to Consolidated Financial Statements discusses recently issued accounting pronouncements that the Company will be required to adopt. Also discussed is management’s expectation of the impact these new accounting pronouncements will have on the Company’s consolidated financial statements.
Market Risk
Market risk is the risk of loss from adverse changes in market prices and rates. The Company's market risk arises primarily from interest rate risk inherent in its investing, lending and deposit taking activities. Management actively monitors and manages its interest rate risk exposure.
The Company's profitability is affected by fluctuations in interest rates. A sudden and substantial change in interest rates may adversely impact the Company's earnings to the extent that the interest rates borne by assets and liabilities do not change at the same speed, to the same extent, or on the same basis. The Company monitors the projected changes in net interest income that occur if interest rates were to suddenly change up or down. The Rate Shock Table located in the following Asset/Liability Management section of this Management’s Discussion and Analysis discloses the Company's projected changes in net interest income based upon immediate interest rate changes called rate shocks. The Company utilizes a model that uses the discounted cash flows from its interest-earning assets and its interest-bearing liabilities to calculate the current market value of those assets and liabilities. The model also calculates the changes in market value of the interest-earning assets and interest-bearing liabilities under different interest rate changes.
The following table discloses the projected changes in market value to the Company’s interest-earning assets and interest-bearing liabilities based upon incremental 100 basis point changes in interest rates from interest rates in effect on December 31, 2020.
|
(Dollars in thousands) |
Market Value |
|||||||||||||||
|
Basis point change in interest rates |
-100 | 0 |
+100 |
+200 |
||||||||||||
|
Total market-risk sensitive assets |
$ | 905,104 | 901,316 | 885,247 | 867,615 | |||||||||||
|
Total market-risk sensitive liabilities |
850,665 | 800,961 | 757,987 | 720,856 | ||||||||||||
|
Off-balance sheet financial instruments |
685 | 0 | 1,128 | 2,176 | ||||||||||||
|
Net market risk |
$ | 53,754 | 100,355 | 126,132 | 144,583 | |||||||||||
|
Percentage change from current market value |
(46.44) |
% |
0.00 |
% |
25.69 |
% |
44.07 |
% |
||||||||
The preceding table was prepared utilizing the following assumptions (the Model Assumptions) regarding prepayment and decay ratios that were determined by management based upon its review of historical prepayment speeds and decay rates. Fixed rate loans were assumed to prepay at annual rates of between 4% and 59%, depending on the note rate and the period to maturity. Adjustable rate mortgages (ARMs) were assumed to prepay at annual rates of between 5% and 52%, depending on the note rate and the period to maturity. Mortgage-backed securities were projected to have prepayments based upon the underlying collateral securing the instrument. All loan prepayments vary based on the note rate and period to maturity of the individual loans. Certificate accounts were assumed not to be withdrawn until maturity. Retail money market demand accounts (MMDAs) and passbook accounts were assumed to decay at annual rates of 17% and 9%, respectively. Retail non-interest and interest-bearing checking accounts were assumed to decay at annual rates of 19% and 6%, respectively. Commercial non-interest and interest-bearing checking accounts were assumed to decay at annual rates of 16% and 22%, respectively. Commercial MMDAs were assumed to decay at annual rates of between 13% and 25%.
Certain shortcomings are inherent in the method of analysis presented in the foregoing table. The interest rates on certain types of assets and liabilities may fluctuate in advance of changes in market interest rates, while interest rates on other types of assets and liabilities may lag behind changes in market interest rates. The model assumes that the difference between the current interest rate being earned or paid compared to a treasury instrument or other interest index with a similar term to maturity (the interest spread) will remain constant over the interest changes disclosed in the table. Changes in interest spread could impact projected market value changes. Certain assets, such as ARMs, have features that restrict changes in interest rates on a short-term basis and over the life of the assets. The market value of the interest-bearing assets that are approaching their lifetime interest rate caps or floors could be different from the values calculated in the table. Certain liabilities, such as certificates of deposit, have fixed rates that restrict interest rate changes until maturity. In the event of a change in interest rates, prepayment and early withdrawal levels may deviate significantly from those assumed in calculating the foregoing table. The ability of many borrowers to service their debt may also decrease in the event of a substantial increase in interest rates.
Asset/Liability Management
The Company's management reviews the impact that changing interest rates will have on the net interest income projected for the twelve months following December 31, 2020 to determine if its current level of interest rate risk is acceptable. The following table projects the estimated impact on net interest income during the twelve month period ending December 31, 2021 of immediate interest rate changes called rate shocks:
|
(Dollars in thousands) |
|||||||||
|
Rate Shock in Basis Points |
Net Interest Change |
Percent Change |
|||||||
|
+200 |
$ | 3,007 | 10.51 |
% |
|||||
|
+100 |
1,441 | 5.04 | |||||||
| 0 | 0 | 0.00 | |||||||
| -100 | (1,582 | ) | (5.53 | ) | |||||
The preceding table was prepared utilizing the Model Assumptions. Certain shortcomings are inherent in the method of analysis presented in the preceding table. In the event of a change in interest rates, prepayment and early withdrawal levels would likely deviate significantly from those assumed in calculating the preceding table. The ability of many borrowers to service their debt may decrease in the event of a substantial increase in interest rates and could impact net interest income. The increase in interest income in a rising rate environment is because there are more loans that are anticipated to reprice to higher interest rates in that environment in the next twelve months than there are deposits that would reprice.
In managing the Company’s exposure to changes in interest rates, management closely monitors interest rate risk. The Company has an Asset/Liability Committee that meets frequently to discuss changes in the interest rate risk position and projected profitability. The Committee makes adjustments to the asset/liability position of the Bank that are reviewed by the Board of Directors of the Bank. This Committee also reviews the Bank's portfolio, formulates investment strategies and oversees the timing and implementation of transactions as intended to assure attainment of the Bank's objectives in an effective manner. In addition, each quarter the Board reviews the Bank's asset/liability position, including simulations of the effect on the Bank's capital of various interest rate scenarios.
In managing its asset/liability composition, the Bank may, at times, depending on the relationship between long-term and short-term interest rates, market conditions and consumer preference, place more emphasis on managing net interest margin than on better matching the interest rate sensitivity of its assets and liabilities in an effort to enhance net interest income. Management believes that the increased net interest income resulting from a mismatch in the maturity of its asset and liability portfolios can, in certain situations, provide high enough returns to justify the increased exposure to sudden and unexpected changes in interest rates.
To the extent consistent with its interest rate spread objectives, the Bank attempts to manage its interest rate risk and has taken a number of steps to structure its balance sheet to better match the maturities of its assets and liabilities. The Bank sells almost all of its originated 30-year fixed rate single family residential loans that are saleable to third parties and generally places only adjustable rate or shorter-term fixed rate loans that meet certain risk characteristics into its loan portfolio. In addition, a significant portion of the Bank’s commercial loans that are placed into the portfolio are adjustable rate loans or fixed rate loans that reprice in less than five years.
Off-Balance Sheet Arrangements
The Company has no off-balance sheet arrangements other than commitments to originate and sell loans in the ordinary course of business. See “Note 18 Commitments and Contingencies” in the Notes to Consolidated Financial Statements for additional information on loan commitments. Management believes that the Company has sufficient liquidity to satisfy the resulting off-balance sheet obligations.
|
Consolidated Balance Sheets |
|
December 31, |
December 31, |
|||||||
|
(Dollars in thousands) |
2020 |
2019 |
||||||
|
ASSETS |
||||||||
|
Cash and cash equivalents |
$ | 86,269 | 44,399 | |||||
|
Securities available for sale: |
||||||||
|
Mortgage-backed and related securities (amortized cost $99,821 and $54,777) |
101,464 | 54,851 | ||||||
|
Other marketable securities (amortized cost $46,491 and $52,751) |
46,626 | 52,741 | ||||||
| 148,090 | 107,592 | |||||||
|
Loans held for sale |
6,186 | 3,606 | ||||||
|
Loans receivable, net |
642,630 | 596,392 | ||||||
|
Accrued interest receivable |
3,102 | 2,251 | ||||||
|
Mortgage servicing rights, net |
3,043 | 2,172 | ||||||
|
Premises and equipment, net |
10,133 | 10,515 | ||||||
|
Goodwill |
802 | 802 | ||||||
|
Core deposit intangible |
57 | 156 | ||||||
|
Prepaid expenses and other assets |
7,241 | 8,052 | ||||||
|
Deferred tax asset, net |
2,027 | 1,702 | ||||||
|
Total assets |
$ | 909,580 | 777,639 | |||||
|
Liabilities and Stockholders’ Equity |
||||||||
|
Deposits |
$ | 795,204 | 673,870 | |||||
|
Accrued interest payable |
140 | 420 | ||||||
|
Customer escrows |
1,998 | 2,413 | ||||||
|
Accrued expenses and other liabilities |
8,986 | 8,288 | ||||||
|
Total liabilities |
806,328 | 684,991 | ||||||
|
Commitments and contingencies |
||||||||
|
Stockholders’ equity: |
||||||||
|
Serial-preferred stock ($.01 par value): authorized 500,000 shares; issued 0 |
0 | 0 | ||||||
|
Common stock ($.01 par value): authorized 16,000,000 shares; issued 9,128,662 |
91 | 91 | ||||||
|
Additional paid-in capital |
40,480 | 40,365 | ||||||
|
Retained earnings, subject to certain restrictions |
117,849 | 107,547 | ||||||
|
Accumulated other comprehensive income |
1,282 | 46 | ||||||
|
Unearned employee stock ownership plan shares |
(1,450 | ) | (1,643 | ) | ||||
|
Treasury stock, at cost 4,359,552 and 4,284,840 shares |
(55,000 | ) | (53,758 | ) | ||||
|
Total stockholders’ equity |
103,252 | 92,648 | ||||||
|
Total liabilities and stockholders’ equity |
$ | 909,580 | 777,639 | |||||
|
See accompanying notes to consolidated financial statements. |
Consolidated Statements of Comprehensive Income
|
Years ended December 31 |
2020 |
2019 |
2018 |
|||||||||
|
Interest income: |
||||||||||||
|
Loans receivable |
$ | 29,924 | 29,787 | 28,535 | ||||||||
|
Securities available for sale: |
||||||||||||
|
Mortgage-backed and related |
1,155 | 343 | 197 | |||||||||
|
Other marketable |
702 | 1,157 | 1,138 | |||||||||
|
Other |
178 | 603 | 511 | |||||||||
|
Total interest income |
31,959 | 31,890 | 30,381 | |||||||||
|
Interest expense: |
||||||||||||
|
Deposits |
2,851 | 3,332 | 2,231 | |||||||||
|
Advances and other borrowings |
0 | 7 | 2 | |||||||||
|
Total interest expense |
2,851 | 3,339 | 2,233 | |||||||||
|
Net interest income |
29,108 | 28,551 | 28,148 | |||||||||
|
Provision for loan losses |
2,699 | (1,216 | ) | (649 | ) | |||||||
|
Net interest income after provision for loan losses |
26,409 | 29,767 | 28,797 | |||||||||
|
Non-interest income: |
||||||||||||
|
Fees and service charges |
2,877 | 3,100 | 3,330 | |||||||||
|
Loan servicing fees |
1,356 | 1,278 | 1,255 | |||||||||
|
Gain on sales of loans |
9,531 | 2,941 | 2,095 | |||||||||
|
Other |
1,190 | 1,136 | 1,034 | |||||||||
|
Total non-interest income |
14,954 | 8,455 | 7,714 | |||||||||
|
Non-interest expense: |
||||||||||||
|
Compensation and benefits |
15,646 | 15,659 | 14,728 | |||||||||
|
Occupancy and equipment |
4,429 | 4,442 | 4,304 | |||||||||
|
Data processing |
1,314 | 1,263 | 1,270 | |||||||||
|
Professional services |
1,405 | 1,573 | 1,137 | |||||||||
|
Other |
4,199 | 4,168 | 3,948 | |||||||||
|
Total non-interest expense |
26,993 | 27,105 | 25,387 | |||||||||
|
Income before income tax expense |
14,370 | 11,117 | 11,124 | |||||||||
|
Income tax expense |
4,068 | 3,324 | 2,888 | |||||||||
|
Net income |
10,302 | 7,793 | 8,236 | |||||||||
|
Other comprehensive income (loss), net of tax |
1,236 | 1,142 | (69 | ) | ||||||||
|
Comprehensive income available to common shareholders |
$ | 11,538 | 8,935 | 8,167 | ||||||||
|
Basic earnings per common share |
$ | 2.23 | 1.69 | 1.89 | ||||||||
|
Diluted earnings per common share |
$ | 2.22 | 1.68 | 1.71 | ||||||||
See accompanying notes to consolidated financial statements.
Consolidated Statements of Stockholders’ Equity
|
(Dollars in thousands) |
Common Stock |
Additional Paid-in Capital |
Retained Earnings |
Accumulated Other Comprehensive Income (Loss) |
Unearned Employee Stock Ownership Plan |
Treasury Stock |
Total Stock- holders’ Equity |
|||||||||||||||||||||
|
Balance, December 31, 2017 |
$ | 91 | 50,623 | 91,448 | (957 | ) | (2,030 | ) | (58,357 | ) | 80,818 | |||||||||||||||||
|
Net income |
8,236 | 8,236 | ||||||||||||||||||||||||||
|
Other comprehensive loss |
(69 | ) | (69 | ) | ||||||||||||||||||||||||
|
Reclassification due to adjustments for equity securities as required by ASU 2016-01 |
70 | (70 | ) | 0 | ||||||||||||||||||||||||
|
Stock warrants purchased |
(6,453 | ) | (6,453 | ) | ||||||||||||||||||||||||
|
Exercise of stock warrants |
(4,168 | ) | 4,168 | 0 | ||||||||||||||||||||||||
|
Exercise of stock options |
(145 | ) | 145 | 0 | ||||||||||||||||||||||||
|
Tax benefits of exercised stock options |
64 | 64 | ||||||||||||||||||||||||||
|
Stock compensation expense |
17 | 17 | ||||||||||||||||||||||||||
|
Restricted stock awards |
(188 | ) | 188 | 0 | ||||||||||||||||||||||||
|
Amortization of restricted stock awards |
134 | 134 | ||||||||||||||||||||||||||
|
Earned employee stock ownership plan shares |
206 | 194 | 400 | |||||||||||||||||||||||||
|
Balance, December 31, 2018 |
$ | 91 | 40,090 | 99,754 | (1,096 | ) | (1,836 | ) | (53,856 | ) | 83,147 | |||||||||||||||||
|
Net income |
7,793 | 7,793 | ||||||||||||||||||||||||||
|
Other comprehensive income |
1,142 | 1,142 | ||||||||||||||||||||||||||
|
Stock compensation expense |
1 | 1 | ||||||||||||||||||||||||||
|
Restricted stock awards |
(143 | ) | 143 | 0 | ||||||||||||||||||||||||
|
Stock awards withheld for tax withholding |
(45 | ) | (45 | ) | ||||||||||||||||||||||||
|
Amortization of restricted stock awards |
187 | 187 | ||||||||||||||||||||||||||
|
Earned employee stock ownership plan shares |
230 | 193 | 423 | |||||||||||||||||||||||||
|
Balance, December 31, 2019 |
$ | 91 | 40,365 | 107,547 | 46 | (1,643 | ) | (53,758 | ) | 92,648 | ||||||||||||||||||
|
Net income |
10,302 | 10,302 | ||||||||||||||||||||||||||
|
Other comprehensive income |
1,236 | 1,236 | ||||||||||||||||||||||||||
|
Stock repurchases |
(1,450 | ) | (1,450 | ) | ||||||||||||||||||||||||
|
Restricted stock awards |
(268 | ) | 268 | 0 | ||||||||||||||||||||||||
|
Stock awards withheld for tax withholding |
(60 | ) | (60 | ) | ||||||||||||||||||||||||
|
Amortization of restricted stock awards |
238 | 238 | ||||||||||||||||||||||||||
|
Earned employee stock ownership plan shares |
145 | 193 | 338 | |||||||||||||||||||||||||
|
Balance, December 31, 2020 |
$ | 91 | 40,480 | 117,849 | 1,282 | (1,450 | ) | (55,000 | ) | 103,252 | ||||||||||||||||||
See accompanying notes to consolidated financial statements.
Consolidated Statements of Cash Flows
|
Years ended December 31 (Dollars in thousands) |
2020 |
2019 |
2018 |
|||||||||
|
Cash flows from operating activities: |
||||||||||||
|
Net income |
$ | 10,302 | 7,793 | 8,236 | ||||||||
|
Adjustments to reconcile net income to cash provided by operating activities: |
||||||||||||
|
Provision for loan losses |
2,699 | (1,216 | ) | (649 | ) | |||||||
|
Depreciation |
1,108 | 1,129 | 1,078 | |||||||||
|
Amortization of premiums, net |
221 | 3 | 16 | |||||||||
|
Amortization of deferred loan fees |
(977 | ) | (91 | ) | (260 | ) | ||||||
|
Amortization of core deposit intangible |
99 | 99 | 99 | |||||||||
|
Amortization of purchased asset fair value adjustments |
(29 | ) | (41 | ) | (70 | ) | ||||||
|
Amortization of mortgage servicing rights |
1,318 | 780 | 551 | |||||||||
|
Capitalized mortgage servicing rights |
(2,189 | ) | (1,097 | ) | (682 | ) | ||||||
|
Deferred income tax (credit) expense |
(802 | ) | 496 | 1,084 | ||||||||
|
Losses (gains) recognized on equity securities, net |
19 | (46 | ) | 36 | ||||||||
|
(Gains) losses on sale of premises |
(5 | ) | 24 | 11 | ||||||||
|
Gains on sale of real estate owned, net |
(129 | ) | 0 | (80 | ) | |||||||
|
Gain on sales of loans |
(9,531 | ) | (2,941 | ) | (2,095 | ) | ||||||
|
Proceeds from sales of loans held for sale |
268,019 | 124,858 | 88,649 | |||||||||
|
Disbursements on loans held for sale |
(254,484 | ) | (115,861 | ) | (76,489 | ) | ||||||
|
Amortization of restricted stock awards |
238 | 187 | 134 | |||||||||
|
Amortization of unearned ESOP shares |
193 | 193 | 194 | |||||||||
|
Earned ESOP shares priced above original cost |
145 | 230 | 206 | |||||||||
|
Stock compensation expense |
0 | 1 | 17 | |||||||||
|
(Increase) decrease in accrued interest receivable |
(851 | ) | 105 | (12 | ) | |||||||
|
(Decrease) increase in accrued interest payable |
(280 | ) | 74 | 200 | ||||||||
|
Decrease (increase) in other assets |
1,175 | 693 | (1,343 | ) | ||||||||
|
Increase (decrease) in other liabilities |
670 | (199 | ) | (1,024 | ) | |||||||
|
Other, net |
13 | 28 | 2 | |||||||||
|
Net cash provided by operating activities |
16,942 | 15,201 | 17,809 | |||||||||
|
Cash flows from investing activities: |
||||||||||||
|
Principal collected on securities available for sale |
17,046 | 2,867 | 1,914 | |||||||||
|
Proceeds collected on maturity of securities available for sale |
41,240 | 25,400 | 310 | |||||||||
|
Purchases of securities available for sale |
(97,294 | ) | (54,427 | ) | (4,888 | ) | ||||||
|
Purchase of Federal Home Loan Bank stock |
(79 | ) | (1,040 | ) | (322 | ) | ||||||
|
Redemption of Federal Home Loan Bank stock |
0 | 1,053 | 272 | |||||||||
|
Proceeds from sales of real estate |
434 | 0 | 367 | |||||||||
|
Net increase in loans receivable |
(55,106 | ) | (14,765 | ) | (11,483 | ) | ||||||
|
Proceeds from sale of premises |
12 | 195 | 0 | |||||||||
|
Purchases of premises and equipment |
(734 | ) | (2,232 | ) | (2,497 | ) | ||||||
|
Net cash used by investing activities |
(94,481 | ) | (42,949 | ) | (16,327 | ) | ||||||
|
Cash flows from financing activities: |
||||||||||||
|
Increase (decrease) in deposits |
121,334 | 50,518 | (12,249 | ) | ||||||||
|
Treasury stock purchased |
(1,450 | ) | 0 | 0 | ||||||||
|
Warrants purchased |
0 | 0 | (6,453 | ) | ||||||||
|
Stock awards withheld for tax withholding |
(60 | ) | (45 | ) | 0 | |||||||
|
Excess tax benefit from options exercised |
0 | 0 | 64 | |||||||||
|
Proceeds from borrowings |
2 | 26,001 | 6,801 | |||||||||
|
Repayment of borrowings |
(2 | ) | (26,001 | ) | (6,801 | ) | ||||||
|
(Decrease) increase in customer escrows |
(415 | ) | 965 | 301 | ||||||||
|
Net cash provided (used) by financing activities |
119,409 | 51,438 | (18,337 | ) | ||||||||
|
Increase (decrease) in cash and cash equivalents |
41,870 | 23,690 | (16,855 | ) | ||||||||
|
Cash and cash equivalents, beginning of year |
44,399 | 20,709 | 37,564 | |||||||||
|
Cash and cash equivalents, end of year |
$ | 86,269 | 44,399 | 20,709 | ||||||||
|
Supplemental cash flow disclosures: |
||||||||||||
|
Cash paid for interest |
$ | 3,131 | 3,265 | 2,034 | ||||||||
|
Cash paid for income taxes |
3,617 | 2,911 | 4,264 | |||||||||
|
Supplemental noncash flow disclosures: |
||||||||||||
|
Loans transferred to loans held for sale |
6,815 | 6,253 | 11,642 | |||||||||
|
Transfer of loans to real estate owned, net |
362 | 166 | 74 | |||||||||
|
Right to use assets and lease obligations |
0 | 4,505 | 0 | |||||||||
See accompanying notes to consolidated financial statements.
Notes to Consolidated Financial Statements
December 31, 2020, 2019 and 2018
NOTE 1 Description of the Business and Summary of Significant Accounting Policies
HMN Financial, Inc. (HMN or the Company) is a stock savings bank holding company that owns 100 percent of Home Federal Savings Bank (the Bank). The Bank has a community banking philosophy and operates retail banking and loan production facilities in Minnesota, Iowa and Wisconsin. The Bank has two wholly owned subsidiaries, Osterud Insurance Agency, Inc. (OIA), which does business as Home Federal Investment Services and offers financial planning products and services, and HFSB Property Holdings, LLC (HPH), which is currently inactive, but has acted in the past as an intermediary for the Bank in holding and operating certain foreclosed properties.
The consolidated financial statements included herein are for HMN, the Bank, OIA and HPH. All significant intercompany accounts and transactions have been eliminated in consolidation.
The Company evaluated subsequent events through the filing date of our annual 10-K with the Securities and Exchange Commission (SEC) on March 5, 2021.
Use of Estimates
In preparing the consolidated financial statements, management is required to make estimates and assumptions that affect the reported amounts of assets and liabilities as of the date of the balance sheet and revenues and expenses for the period. Actual results could differ from those estimates.
An estimate that is particularly susceptible to change relates to the determination of the allowance for loan losses. Management believes that the allowance for loan losses is appropriate to cover probable losses inherent in the portfolio at the date of the balance sheet. While management uses available information to recognize losses on loans, future additions to the allowance may be necessary based on changes in economic conditions and other factors. In addition, various regulatory agencies, as an integral part of their examination process, periodically review the allowance for loan losses. Such agencies may require changes to the allowance based on their judgment about information available to them at the time of their examination.
Deferred tax assets and liabilities are recognized for the future tax consequences attributable to temporary differences between the financial statement carrying amounts of existing assets and liabilities and their respective tax basis. These calculations are based on many complex factors including estimates of the timing of reversals of temporary differences, the interpretation of federal and state income tax laws, and a determination of the differences between the tax and the financial reporting basis of assets and liabilities. Actual results could differ significantly from the estimates and interpretations used in determining the current and deferred income tax assets and liabilities.
Estimates related to litigation are inherently subjective and the ultimate resolution of any litigation may be different than current management estimates. See “Note 18 Commitments and Contingencies” for further information on outstanding litigation matters.
Cash and Cash Equivalents
The Company considers highly liquid investments with original maturities of three months or less to be cash equivalents.
Securities
Securities are accounted for according to their purpose and holding period. The Company classifies its debt securities in one of three categories:
Trading Securities
Securities held principally for resale in the near term are classified as trading securities and are recorded at their fair values. Unrealized gains and losses on trading securities are included in other income.
Securities Held to Maturity
Securities that the Company has the positive intent and ability to hold to maturity are reported at cost and adjusted for premiums and discounts that are recognized in interest income using the interest method with discounts amortized over the period to maturity and premiums amortized to the earliest call date. Unrealized losses on securities held to maturity reflecting a decline in value judged to be other than temporary are charged to income and a new cost basis is established.
Securities Available for Sale
Securities available for sale consist of securities not classified as trading securities or as securities held to maturity. They include securities that management intends to use as part of its asset/liability strategy or that may be sold in response to changes in interest rates, changes in prepayment risk, or similar factors. Unrealized gains and losses, net of income taxes, are reported as a separate component of stockholders’ equity until realized. Gains and losses on the sale of securities available for sale are determined using the specific identification method and recognized on the trade date. Premiums and discounts are recognized in interest income using the interest method with discounts amortized over the period to maturity and premiums amortized to the earliest call date. Unrealized losses on securities available for sale reflecting a decline in value judged to be other than temporary are charged to income and a new cost basis is established.
Management monitors the investment security portfolio for impairment on an individual security basis and has a process in place to identify securities that could potentially have a credit impairment that is other than temporary. This process involves analyzing the length of time and extent to which the fair value has been less than the amortized cost basis, the market liquidity for the security, the financial condition and near-term prospects of the issuer, expected cash flows, and the Company's intent and ability to hold the investment for a period of time sufficient to recover the temporary loss, including determining whether it is more-likely-than-not that the Company will be required to sell the security prior to recovery. To the extent it is determined that a security is deemed to be other-than-temporarily impaired, an impairment loss is recognized.
Equity Securities
Equity securities are carried at their fair market value with any changes during the period recognized in other income on the consolidated statements of comprehensive income.
Loans Held for Sale
Mortgage loans originated which are intended for sale in the secondary market are carried at the lower of cost or estimated market value in the aggregate. Net fees and costs associated with originating loans held for sale are deferred and included in the basis of the loan in determining the gain or loss on the sale of the loans. Gains on the sale of loans are recognized on the settlement date. Net unrealized losses are recognized through a valuation allowance by charges to income.
Loans Receivable, net
Loans receivable, net, are carried at amortized cost. Loan origination fees received, net of certain loan origination costs, are deferred as an adjustment to the carrying value of the related loans, and are amortized into income using the interest method over the estimated life of the loans.
Premiums and discounts on purchased loans are amortized into interest income using the interest method over the period to contractual maturity, adjusted for estimated prepayments.
The allowance for loan losses is based on a periodic analysis of the loan portfolio and is maintained at an amount considered to be appropriate by management to provide for probable losses inherent in the loan portfolio as of the balance sheet dates. In this analysis, management considers factors including, but not limited to, specific occurrences of loan impairment, actual and anticipated changes in the size of the portfolios, national and regional economic conditions (such as unemployment data, loan delinquencies, local economic conditions, demand for single family homes, demand for commercial real estate and building lots), loan portfolio composition, historical loss experience, and observations made by the Company's ongoing internal audit and regulatory exam processes. In connection with the determination of the allowance for loan losses, management obtains independent appraisals for significant properties or other collateral securing classified loans. Appraisals on collateral dependent commercial real estate and commercial business loans are obtained when it is determined that the borrower’s risk profile has deteriorated and the loan is classified as impaired. Subsequent new third party appraisals of properties securing impaired commercial real estate and commercial business loans are prepared at least every two years. For all land development loan types, a new third party appraisal is prepared on an annual basis where current activity is not materially consistent with the assumptions made in the most recent third party appraisal. Non-performing residential and consumer home equity loans and home equity lines may have a third party appraisal or an internal evaluation completed depending on the size of the loan and location of the property. These appraisals, or internal valuations, are generally completed when a residential or consumer home equity loan or home equity line of credit becomes 120 days past due and are typically updated after possession of the property is obtained. Valuations are reviewed on a quarterly basis and adjustments are made to the allowance for loan losses for temporary impairments and charge-offs are taken when the impairment is determined to be permanent. The fair market value of the properties for all loan types are adjusted for estimated selling costs in order to determine the net realizable value of the properties. Loans are charged off to the extent they are deemed to be uncollectible. The appropriateness of the allowance for loan losses is dependent upon management’s estimates of variables affecting valuation, appraisals of collateral, evaluations of performance and status, and the amounts and timing of future cash flows expected to be received on impaired loans. Such estimates, appraisals, evaluations and cash flows may be subject to adjustments due to changing economic prospects of borrowers or properties. The fair market value of collateral dependent loans is typically based on the appraised value of the property less estimated selling costs. The estimates are reviewed periodically and adjustments, if any, are recorded in the provision for loan losses in the periods in which the adjustments become known. The allowance is allocated to individual loan categories based upon the relative risk characteristics of the loan portfolios and the actual loss experience. The Company increases its allowance for loan losses by charging the provision for loan losses against income and decreases its allowance by crediting the provision for loan losses. The methodology for establishing the allowance for loan losses takes into consideration probable losses that have been identified in connection with specific loans as well as losses in the loan portfolio that have not been specifically identified.
Interest income is recognized on an accrual basis except when collectability is in doubt. When loans are placed on a non-accrual basis, generally when the loan is 90 days past due, previously accrued but unpaid interest is reversed from income. If the ultimate collectability of a loan is in doubt and the loan is placed in nonaccrual status, the cost recovery method is used and cash collected is applied to first reduce the principal outstanding. Generally, the Company returns a loan to accrual status when all delinquent interest and principal becomes current under the terms of the loan agreement, the borrower has consistently made the required payments for a period of six months, and the collectability of remaining principal and interest is no longer doubtful. Previously collected interest payments that were applied to principal when the loan was classified as non-accrual are recorded as interest income using the effective yield method over the estimated life of the loan, including expected renewal terms.
All impaired loans are valued at the present value of expected future cash flows discounted at the loan's initial effective interest rate. The fair value of the collateral of an impaired collateral-dependent loan or an observable market price, if one exists, may be used as an alternative to discounting. If the value of the impaired loan is less than the recorded investment in the loan, the impaired amount is charged off. A loan is considered impaired when, based on current information and events, it is probable that the Company will be unable to collect all amounts due according to the contractual terms of the loan agreement. Impaired loans include all loans which are on non-accrual, delinquent as to principal and interest for 90 days or more, or restructured in a troubled debt restructuring (TDR) involving a modification of terms. All non-accruing loans are reviewed for impairment on an individual basis.
Included in loans receivable, net, are certain loans that have been modified in order to maximize collection of the loan balances. The Company evaluates all loan modifications and if the Company, for legal or economic reasons related to the borrower's financial difficulties, grants a concession compared to the original terms and conditions of the loan that the Company would not otherwise consider, the modified loan is considered a TDR and is classified as an impaired loan. If the TDR loan was performing (accruing) prior to the modification, it typically will remain accruing after the modification as long as it continues to perform according to the modified terms. If the TDR loan was non-performing (non-accruing) prior to the modification, it will remain non-accruing after the modification for a minimum of six months. If the loan performs according to the modified terms for a minimum of six months, it typically will be returned to accruing status. In general, there are two conditions in which a TDR loan is no longer considered to be a TDR and potentially not classified as impaired. The first condition is when the loan is refinanced with terms that reflect normal market terms for the type of credit involved and performs according to the modified terms for a period of at least one year. The second condition is when the loan is repaid or charged off.
The Interagency Statement on Loan Modification and Reporting for Financial Institutions Working with Customers Affected by the Coronavirus and section 4013 of the CARES act allow financial institutions to grant modifications of loans to borrowers that were impacted by the pandemic without classifying the modifications as TDR’s. See “Note 6 Allowance for Loan Losses and Credit Quality Information” for additional information on accommodations that were granted to borrowers in 2020.
Transfers of Financial Assets and Participating Interests
Transfers of an entire financial asset or a participating interest in an entire financial asset are accounted for as sales when control over the assets has been surrendered. Control over transferred assets is deemed to be surrendered when (1) the assets have been isolated from the Company, (2) the transferee obtains the right (free of conditions that constrain it from taking advantage of that right) to pledge or exchange the transferred assets, and (3) the Company does not maintain effective control over the transferred assets through an agreement to repurchase them before their maturity.
The transfer of a participating interest in an entire financial asset must also meet the definition of a participating interest. A participating interest in a financial asset has all of the following characteristics: (1) from the date of transfer, it must represent a proportionate (pro rata) ownership interest in the financial asset, (2) from the date of transfer, all cash flows received, except any cash flows allocated as any compensation for servicing or other services performed, must be divided proportionately among participating interest holders in the amount equal to their share of ownership, (3) the rights of each participating interest holder must have the same priority, and (4) no party has the right to pledge or exchange the entire financial asset unless all participating interest holders agree to do so.
Real Estate, net
Real estate acquired through loan foreclosure or deed in lieu of foreclosure is initially recorded at its fair value less estimated selling costs. Third party appraisals are obtained as soon as practical after obtaining possession of the property. Valuations are reviewed quarterly by management and an allowance for losses is established if the carrying value of a property exceeds its fair value less estimated selling costs.
Mortgage Servicing Rights, net
Mortgage servicing rights are capitalized at their fair value and amortized in proportion to, and over the period of, estimated net servicing income. The Company evaluates its capitalized mortgage servicing rights for impairment each quarter. Loan type and note rate are the predominant risk characteristics of the underlying loans used to stratify capitalized mortgage servicing rights for purposes of measuring impairment. Any impairment is recognized through a valuation allowance.
Premises and Equipment, net
Land is carried at cost. Office buildings, improvements, furniture and equipment are carried at cost less accumulated depreciation. Depreciation is computed on a straight-line basis over their estimated useful lives of 5 to 40 years for office buildings and improvements and 3 to 10 years for furniture and equipment.
Goodwill
The Company records goodwill for acquisition amounts paid in excess of the net assets purchased. Goodwill is not amortized, but is tested for impairment at least annually or more frequently if there are indications of impairment.
Core Deposit Intangible, net
The Company records the estimated fair value of the deposit base acquired in an acquisition as a core deposit intangible asset. The recorded amount is amortized on a straight line basis over the estimated life of the deposits acquired.
Impairment of Long-Lived Assets and for Long-Lived Assets to Be Disposed Of
The Company reviews long-lived assets and certain identifiable intangibles for impairment whenever events or changes in circumstances indicate that the carrying amount of an asset may not be recoverable.
Stock Based Compensation
The Company recognizes the grant-date fair value of stock option and restricted stock awards issued as compensation expense, amortized over the vesting period.
Employee Stock Ownership Plan (ESOP)
The Company has an ESOP that borrowed funds from the Company and purchased shares of HMN common stock. The Company makes quarterly principal and interest payments on the ESOP loan. As the debt is repaid, ESOP shares that were pledged as collateral for the debt are released from collateral based on the proportion of debt service paid in the year and then allocated to eligible employees. The Company accounts for its ESOP in accordance with ASC 718, Employers' Accounting for Employee Stock Ownership Plans. Accordingly, the shares pledged as collateral are reported as unearned ESOP shares in stockholders' equity. As shares are determined to be ratably released from collateral, the Company reports compensation expense equal to the current market price of the shares, and the shares become outstanding for earnings per share computations.
Income Taxes
Deferred tax assets and liabilities are recognized for future tax consequences attributable to temporary differences between the financial statement carrying amounts of existing assets and liabilities and their respective tax basis. Deferred tax assets and liabilities are measured using enacted tax rates expected to apply to taxable income in the years in which those temporary differences are expected to be recovered or settled. The effect of a change in tax rates on deferred tax assets and liabilities is recognized in income in the period that includes the enactment date. A valuation allowance is required to be recognized if it is more-likely-than-not that the deferred tax asset will not be realized. The determination of the realizability of the deferred tax asset is subjective and dependent upon judgment concerning management’s evaluation of both positive and negative evidence regarding the ultimate realizability of deferred tax assets. The Company is no longer subject to federal or state income tax examinations by tax authorities for years before 2017.
Earnings per Common Share
Basic earnings per common share excludes dilution and is computed by dividing the income available to common shareholders by the weighted-average number of common shares outstanding for the period. Diluted earnings per common share reflects the potential dilution that could occur if securities or other contracts to issue common stock were exercised or converted into common stock or resulted in the issuance of common stock that shared in the earnings of the entity.
Comprehensive Income
Comprehensive income is defined as the change in equity during a period from transactions and other events from non-owner sources. Comprehensive income is the total of net income and other comprehensive income (loss), which for the Company is comprised of unrealized gains and losses on securities available for sale.
Segment Information
The amount of each segment item reported is the measure reported to the chief operating decision maker for purposes of making decisions about allocating resources to the segment and assessing its performance. Adjustments and eliminations made in preparing an enterprise’s general-purpose financial statements and allocations of revenues, expenses, and gains or losses are included in determining reported segment profit or loss if they are included in the measure of the segment’s profit or loss that is used by the chief operating decision maker. Similarly, only those assets that are included in the measure of the segment’s assets that are used by the chief operating decision maker are reported for that segment.
New Accounting Pronouncements
In June 2016, the Financial Accounting Standards Board (FASB) issued Accounting Standards Update (ASU) 2016-13, Financial Instruments-Credit Losses (Topic 326): Measurement of Credit Losses on Financial Instruments. The amendments in this ASU affect all entities that measure credit losses on financial instruments including loans, debt securities, trade receivables, net investments in leases, off-balance sheet credit exposures, reinsurance receivables, and any other financial asset that has a contractual right to receive cash that is not specifically excluded. The main objective of this ASU is to provide financial statement users with more decision-useful information about the expected credit losses on financial instruments and other commitments to extend credit held by a reporting entity at each reporting date. To achieve this objective, the amendments in this ASU replace the incurred loss impairment methodology required in current GAAP with a methodology that reflects expected credit losses that requires consideration of a broader range of reasonable and supportable information to estimate credit losses. The amendments in this ASU will affect entities to varying degrees depending on the credit quality of the assets held by the entity, the duration of the assets held, and how the entity applies the current incurred loss methodology. The amendments in this ASU, for public business entities that are filers with the Securities and Exchange Commission (SEC), were originally effective for fiscal years beginning after December 15, 2019, including interim periods within those annual periods. On November 26, 2019, the FASB issued ASU 2019-11, Codification Improvements to Topic 326, Financial Instruments – Credit Losses which delayed the implementation date of ASU 2016-13 for SEC smaller reporting companies, such as HMN, from the first quarter of 2020 to the first quarter of 2023. All entities may adopt the amendments in the ASU early as of the fiscal years beginning after December 15, 2018, including interim periods within those fiscal years. Amendments should be applied using a modified retrospective transition method by means of a cumulative-effect adjustment to equity as of the beginning of the period in which the guidance is adopted. The Company has not early adopted this ASU. Management has accumulated the charge off information necessary to calculate the appropriate life of loan loss percentages for the various loan categories, has identified several key metrics to help identify and project anticipated changes in the credit quality of the Bank’s loan portfolio upon enactment, and is in the process of evaluating the determination of potential qualitative reserve amounts and the impact that the adoption of this ASU will have on the Company’s consolidated financial statements when it is adopted in the first quarter of 2023.
On February 6, 2020, the FASB issued ASU 2020-02, Financial Instruments-Credit Losses (Topic 326) and Leases (Topic 842)-Amendments to SEC Paragraphs Pursuant to SEC Staff Accounting Bulletin No. 119 and Update to SEC Section on Effective Date Related to Accounting Standards Update No. 2016-02, Leases (Topic 842). The amendments in this ASU related to Leases (Topic 842) did not have any impact on the Company. The amendments in this ASU related to Topic 326 adds additional guidance related to the SEC’s expectations for the documentation of the measurement, review process, and the systematic methodology used by entities to determine the current credit losses under FASB ASC Topic 326. Management is currently in the process of reviewing how the Company’s credit loss calculation and review processes will be impacted by the additional guidance of this ASU when ASC Topic 326 is adopted in the first quarter of 2023.
Derivative Financial Instruments
The Company uses derivative financial instruments in order to manage the interest rate risk on residential loans held for sale and its commitments to extend credit for residential loans. The Company may also from time to time use interest rate swaps to manage interest rate risk. Derivative financial instruments include commitments to extend credit and forward mortgage loan sales commitments.
Reclassifications
Certain amounts in the consolidated financial statements for the prior year have been reclassified to conform to the current year presentation.
NOTE 2 Revenue Recognition
The Company recognizes revenue in accordance with ASU 2014-09 (Topic 606) and all subsequent amendments to the ASU (collectively, “ASC 606”). The Company’s services that fall within the scope of ASC 606 are presented on the income statement within non-interest income and other non-interest expense and are recognized as revenue as the Company satisfies its performance obligation to the customer. Services within the scope of ASC 606 include fees and service charges on deposit accounts, ATM and debit card interchange income, safe deposit box rental fees, check printing charges, income earned on the sale of uninsured investment products, and gains or losses recognized on the sale of real estate owned that is included in other non-interest expense.
All of the Company’s revenue from contracts with customers within the scope of ASC 606 is recognized within non-interest income except for the gain or loss on the sale of real estate owned which is included in other non-interest expense. The following table presents the Company’s sources of non-interest income for the years ended December 31, 2020, 2019 and 2018. Sources of revenue outside the scope of ASC 606 are noted as such.
|
Year ended |
||||||||||||
|
(Dollars in thousands) |
2020 |
2019 |
2018 |
|||||||||
|
Non-interest income: |
||||||||||||
|
Fees and service charges on deposit accounts |
$ | 986 | 1,257 | 1,308 | ||||||||
|
Other fees and service charges |
369 | 433 | 585 | |||||||||
|
Debit card interchange fees |
1,522 | 1,410 | 1,437 | |||||||||
|
Gain on sale of loans (1) |
9,531 | 2,941 | 2,095 | |||||||||
|
Loan servicing fees (1) |
1,356 | 1,278 | 1,255 | |||||||||
|
Uninsured investment product sales |
991 | 909 | 870 | |||||||||
|
Other |
199 | 227 | 164 | |||||||||
|
Total non-interest income |
14,954 | 8,455 | 7,714 | |||||||||
|
Gain on sale of real estate owned(2) |
129 | 0 | 80 | |||||||||
|
Total non-interest income and other ASC 606 items |
$ | 15,083 | 8,455 | 7,794 | ||||||||
(1) Not within the scope of ASC 606.
(2) Included in other-non-interest expense.
A description of the Company’s revenue categories that are accounted for under ASC 606 is as follows:
Fees and Service Charges on Deposit Accounts
The Company earns fees from deposit customers for transaction-based, account maintenance, and overdraft services. Transaction-based fees, which include services such as ATM use fees, wire transfer fees, check cashing fees, stop payment charges, statement rendering, ACH fees, and other deposit related fees, are recognized at the time the transaction is executed or when the Company fulfills the customer’s request. Account maintenance fees, which relate primarily to monthly maintenance, are earned over the course of a month, representing the period over which the Company satisfies the performance obligation. Overdraft fees are recognized at the point in time that the overdraft occurs. Service charges on deposits are recognized when they are withdrawn from the customer’s account balance.
Other Fees and Service Charges
Other fees and service charges consist of revenues that are both within the scope of and outside the scope of ASC 606. Other fees and service charges within the scope of ASC 606 consist of fees for the rental of safe deposit boxes and check printing charges. Revenues for these fees are recognized over the period the service is provided or the fee is incurred by the customer. Other fees and service charges outside the scope of ASC 606 consist of loan commitment fees and late charges on loans.
Debit Card Interchange Fees
The Company earns interchange fees from debit card holder transactions conducted through various payment networks. Interchange fees from cardholder transactions are recognized daily, concurrently with the transaction processing services provided by an outsourced technology solution and are presented on a net basis.
Uninsured Investment Product Sales
Commission revenues on the sale of uninsured investment products may be recognized up front on the sale date of the investment or monthly over a period of years depending on the product being sold. The commissions on investment sales are recognized when the product sale is completed or monthly for trailer fees in accordance with the customer agreement. Any subsequent commission adjustments are recognized upon our receipt of notification from the investment companies concerning matters necessitating such adjustments. Profit-sharing contingent commissions are recognized when determinable, which is generally when such commissions are received from the investment companies.
Other
Other non-interest income consists of revenues that are both within the scope of and outside the scope of ASC 606. Other income within the scope of ASC 606 consists of gains and losses on asset sales. Other income outside the scope of ASC 606 consists of gains and losses on equity securities and rental income on buildings.
Gain on Sale of Real Estate Owned
Other non-interest expense includes gains and losses on the sale of real estate owned which are recognized when the real estate is sold. Gains realized on the sale of real estate owned is the only item in other non-interest expense that is within the scope of ASC 606.
NOTE 3 Other Comprehensive Income (Loss)
The components of other comprehensive income (loss) and the related tax effects were as follows:
|
For the years ended December 31, |
||||||||||||||||||||||||||||||||||||
|
2020 |
2019 |
2018 |
||||||||||||||||||||||||||||||||||
|
(Dollars in thousands) |
Before Tax |
Tax Effect |
Net of Tax |
Before Tax |
Tax Effect |
Net of Tax |
Before Tax |
Tax Effect |
Net of Tax |
|||||||||||||||||||||||||||
| Securities available for sale: | ||||||||||||||||||||||||||||||||||||
|
Unrealized gains (losses) arising during the period |
$ | 1,714 | 478 | 1,236 | 1,585 | 443 | 1,142 | (94 | ) | (25 | ) | (69 | ) | |||||||||||||||||||||||
|
Other comprehensive income (loss) |
$ | 1,714 | 478 | 1,236 | 1,585 | 443 | 1,142 | (94 | ) | (25 | ) | (69 | ) | |||||||||||||||||||||||
NOTE 4 Securities Available for Sale
A summary of securities available for sale at December 31, 2020 and 2019 is as follows:
|
(Dollars in thousands) |
Amortized Cost |
Gross Unrealized Gains |
Gross Unrealized Losses |
Fair Value |
||||||||||||
|
December 31, 2020 |
||||||||||||||||
|
Mortgage-backed securities: |
||||||||||||||||
|
Federal National Mortgage Association (FNMA) |
$ | 68,699 | 1,313 | (3 | ) | 70,009 | ||||||||||
|
Federal Home Loan Mortgage Corporation (FHLMC) |
31,025 | 327 | 0 | 31,352 | ||||||||||||
|
Collateralized mortgage obligations: |
||||||||||||||||
|
FNMA |
97 | 6 | 0 | 103 | ||||||||||||
| 99,821 | 1,646 | (3 | ) | 101,464 | ||||||||||||
|
Other marketable securities: |
||||||||||||||||
|
U.S. Government agency obligations |
45,029 | 204 | 0 | 45,233 | ||||||||||||
|
Municipal obligations |
725 | 1 | 0 | 726 | ||||||||||||
|
Corporate obligations |
37 | 0 | 0 | 37 | ||||||||||||
|
Corporate preferred stock |
700 | 0 | (70 | ) | 630 | |||||||||||
| 46,491 | 205 | (70 | ) | 46,626 | ||||||||||||
| $ | 146,312 | 1,851 | (73 | ) | 148,090 | |||||||||||
|
December 31, 2019 |
||||||||||||||||
|
Mortgage-backed securities: |
||||||||||||||||
|
FNMA |
$ | 46,604 | 47 | (65 | ) | 46,586 | ||||||||||
|
FHLMC |
8,004 | 88 | 0 | 8,092 | ||||||||||||
|
Collateralized mortgage obligations: |
||||||||||||||||
|
FNMA |
169 | 4 | 0 | 173 | ||||||||||||
| 54,777 | 139 | (65 | ) | 54,851 | ||||||||||||
|
Other marketable securities: |
||||||||||||||||
|
U.S. Government agency obligations |
49,974 | 39 | (21 | ) | 49,992 | |||||||||||
|
Municipal obligations |
1,969 | 7 | 0 | 1,976 | ||||||||||||
|
Corporate obligations |
108 | 0 | 0 | 108 | ||||||||||||
|
Corporate preferred stock |
700 | 0 | (35 | ) | 665 | |||||||||||
| 52,751 | 46 | (56 | ) | 52,741 | ||||||||||||
| $ | 107,528 | 185 | (121 | ) | 107,592 | |||||||||||
The Company did not sell any available for sale securities and did not recognize any gains or losses on securities available for sale in 2020, 2019 or 2018.
The following table presents the amortized cost and estimated fair value of securities available for sale at December 31, 2020, based upon contractual maturity adjusted for scheduled repayments of principal and projected prepayments of principal based upon current economic conditions and interest rates. Actual maturities may differ from the maturities in the following table because obligors may have the right to call or prepay obligations with or without call or prepayment penalties:
|
(Dollars in thousands) |
Amortized Cost |
Fair |
||||||
|
Due one year or less |
$ | 71,923 | 72,677 | |||||
|
Due after one year through five years |
64,016 | 64,951 | ||||||
|
Due after five years through ten years |
9,558 | 9,715 | ||||||
|
Due after ten years |
815 | 747 | ||||||
|
Total |
$ | 146,312 | 148,090 | |||||
The allocation of mortgage-backed securities in the table above is based upon the anticipated future cash flow of the securities using estimated mortgage prepayment speeds.
The following table shows the gross unrealized losses and fair values for the securities available for sale portfolio aggregated by investment category and length of time that individual securities have been in a continuous unrealized loss position at December 31, 2020 and 2019:
|
Less Than Twelve Months |
Twelve Months or More |
Total |
||||||||||||||||||||||||||||||
|
(Dollars in thousands) |
# of Investments |
Fair Value |
Unrealized Losses |
# of Investments |
Fair Value |
Unrealized Losses |
Fair Value |
Unrealized Losses |
||||||||||||||||||||||||
|
December 31, 2020 |
||||||||||||||||||||||||||||||||
|
Mortgage backed securities: |
||||||||||||||||||||||||||||||||
|
FNMA |
1 | $ | 4,956 | (3 | ) | 0 | $ | 0 | 0 | $ | 4,956 | (3 | ) | |||||||||||||||||||
|
Other marketable securities: |
||||||||||||||||||||||||||||||||
|
Corporate preferred stock |
0 | 0 | 0 | 1 | 630 | (70 | ) | 630 | (70 | ) | ||||||||||||||||||||||
|
Total temporarily impaired securities |
1 | $ | 4,956 | (3 | ) | 1 | $ | 630 | (70 | ) | $ | 5,586 | (73 | ) | ||||||||||||||||||
|
December 31, 2019 |
||||||||||||||||||||||||||||||||
|
Mortgage backed securities: |
||||||||||||||||||||||||||||||||
|
FNMA |
4 | $ | 12,143 | (65 | ) | 0 | $ | 0 | 0 | $ | 12,143 | (65 | ) | |||||||||||||||||||
|
Other marketable securities: |
||||||||||||||||||||||||||||||||
|
U.S. Government agency obligations |
0 | 0 | 0 | 4 | 19,972 | (21 | ) | 19,972 | (21 | ) | ||||||||||||||||||||||
|
Corporate preferred stock |
0 | 0 | 0 | 1 | 665 | (35 | ) | 665 | (35 | ) | ||||||||||||||||||||||
|
Total temporarily impaired securities |
4 | $ | 12,143 | (65 | ) | 5 | $ | 20,637 | (56 | ) | $ | 32,780 | (121 | ) | ||||||||||||||||||
We review our investment portfolio on a quarterly basis for indications of impairment. This review includes analyzing the length of time and the extent to which the fair value has been lower than the cost, the market liquidity for the investment, the financial condition and near-term prospects of the issuer, including any specific events which may influence the operations of the issuer, and our intent and ability to hold the investment for a period of time sufficient to recover the temporary loss. The unrealized losses on impaired securities other than the corporate preferred stock are the result of changes in interest rates. The unrealized losses reported for the corporate preferred stock at December 31, 2020 relates to a single trust preferred security that was issued by the holding company of a small community bank. As of December 31, 2020 all payments were current on the trust preferred security and the issuer’s subsidiary bank was considered to be “well capitalized” based on its most recent regulatory filing. Based on a review of the issuer, it was determined that the trust preferred security was not other-than-temporarily impaired at December 31, 2020. The Company does not intend to sell the preferred stock and has the intent and ability to hold it for a period of time sufficient to recover the temporary loss. Management believes that the Company will receive all principal and interest payments contractually due on the security and that the decrease in the market value is primarily due to a lack of liquidity in the market for trust preferred securities. Management will continue to monitor the credit risk of the issuer and may be required to recognize other-than-temporary impairment charges on this security in future periods.
NOTE 5 Loans Receivable, Net
A summary of loans receivable at December 31, 2020 and 2019, is as follows:
|
(Dollars in thousands) |
2020 |
2019 |
||||||
|
Residential real estate loans: |
||||||||
|
Single family conventional |
$ | 134,390 | 119,805 | |||||
|
Single family government guaranteed |
633 | 259 | ||||||
| 135,023 | 120,064 | |||||||
|
Commercial real estate: |
||||||||
|
Construction: |
||||||||
|
Single family |
19,832 | 23,256 | ||||||
|
Multi-family |
2,316 | 1,858 | ||||||
|
Commercial real estate |
9,345 | 6,008 | ||||||
|
Child care services |
3,933 | 1,455 | ||||||
|
Churches/community service |
8,427 | 10,156 | ||||||
|
Fitness/recreation |
1,596 | 1,636 | ||||||
|
Land developments |
13,237 | 13,167 | ||||||
|
Lodging |
61,823 | 58,643 | ||||||
|
Manufacturing |
20,833 | 20,027 | ||||||
|
Movie theaters |
9,619 | 9,761 | ||||||
|
Multi-family |
41,456 | 48,663 | ||||||
|
Nursing home/healthcare |
14,488 | 7,767 | ||||||
|
Restaurant/bar/cafe |
6,383 | 6,752 | ||||||
|
Retail/office |
93,472 | 71,730 | ||||||
|
Warehouse |
32,568 | 32,064 | ||||||
|
Other |
41,376 | 37,252 | ||||||
| 380,704 | 350,195 | |||||||
|
Consumer: |
||||||||
|
Autos |
1,937 | 2,608 | ||||||
|
Home equity line |
21,308 | 28,004 | ||||||
|
Home equity |
11,549 | 16,422 | ||||||
|
Land/lots |
3,357 | 3,358 | ||||||
|
Recreational vehicles |
15,645 | 17,266 | ||||||
|
Other - secured |
855 | 1,195 | ||||||
|
Other - unsecured |
740 | 1,096 | ||||||
| 55,391 | 69,949 | |||||||
|
Commercial business |
82,673 | 64,227 | ||||||
|
Total loans |
653,791 | 604,435 | ||||||
|
Less: |
||||||||
|
Unamortized discounts |
12 | 15 | ||||||
|
Net deferred loan fees (costs) |
450 | (536 | ) | |||||
|
Allowance for loan losses |
10,699 | 8,564 | ||||||
|
Total loans receivable, net |
$ | 642,630 | 596,392 | |||||
|
Commitments to originate or purchase loans |
$ | 23,596 | 38,157 | |||||
|
Commitments to deliver loans to secondary market |
$ | 24,746 | 10,098 | |||||
|
Weighted average contractual rate of loans in portfolio |
4.21 |
% |
4.75 |
% |
||||
Included in total commitments to originate or purchase loans are fixed rate loans aggregating $19.5 million and $19.0 million as of December 31, 2020 and 2019, respectively. The interest rates on these loan commitments ranged from 2.25% to 4.75% at December 31, 2020 and from 3.00% to 5.65% at December 31, 2019.
The aggregate amount of loans to executive officers and directors of the Company was $0.2 million, $0.1 million and $0.1 million at December 31, 2020, 2019 and 2018, respectively. During 2020, new loans to executive officers totaled $0.1 million. There were no principal payments made on this new loan in 2020. The remaining balance of $0.1 million for all three years represents a Home Equity Line of Credit for one executive officer and there have been no advances or principal payments on the line of credit during 2020, 2019 or 2018. All loans to executive officers and directors are made in the ordinary course of business on normal credit terms, including interest rates and collateral, as those prevailing at the time for comparable transactions with unrelated parties.
At December 31, 2020, 2019 and 2018, the Company was servicing loans for others with aggregate unpaid principal balances of $580.0 million, $505.7 million and $480.6 million, respectively.
The Company originates residential, commercial real estate and other loans primarily in Minnesota, Wisconsin and Iowa. At December 31, 2020 and 2019, the Company had in its portfolio single family residential loans located in the following states:
|
2020 |
2019 |
|||||||||||||||
|
(Dollars in thousands) |
Amount |
Percent of Total |
Amount |
Percent of Total |
||||||||||||
|
Minnesota |
$ | 114,575 | 84.9 |
% |
$ | 107,607 | 89.6 |
% |
||||||||
|
Wisconsin |
15,910 | 11.8 | 8,483 | 7.1 | ||||||||||||
|
Other states (1) |
4,538 | 3.3 | 3,974 | 3.3 | ||||||||||||
|
Total |
$ | 135,023 | 100.0 |
% |
$ | 120,064 | 100.0 |
% |
||||||||
|
(1) Amounts under four million dollars in both years are included in “Other states”. |
At December 31, 2020 and 2019, the Company had in its portfolio commercial real estate loans located in the following states:
|
2020 |
2019 |
|||||||||||||||
|
(Dollars in thousands) |
Amount |
Percent of Total |
Amount |
Percent of Total |
||||||||||||
|
Florida |
$ | 4,350 | 1.1 |
% |
$ | 6,520 | 1.9 |
% |
||||||||
|
Iowa |
6,281 | 1.7 | 6,794 | 1.9 | ||||||||||||
|
Minnesota |
261,598 | 68.7 | 244,572 | 69.8 | ||||||||||||
|
North Carolina |
4,571 | 1.2 | 4,624 | 1.3 | ||||||||||||
|
Wisconsin |
90,112 | 23.7 | 73,122 | 20.9 | ||||||||||||
|
Other states(1) |
13,792 | 3.6 | 14,563 | 4.2 | ||||||||||||
|
Total |
$ | 380,704 | 100.0 |
% |
$ | 350,195 | 100.0 |
% |
||||||||
|
(1) Amounts under four million dollars in both years are included in “Other states”. |
NOTE 6 Allowance for Loan Losses and Credit Quality Information
The allowance for loan losses is summarized as follows:
|
(Dollars in thousands) |
Single Family |
Commercial Real Estate |
Consumer |
Commercial Business |
Total |
|||||||||||||||
|
Balance, December 31, 2017 |
$ | 900 | 5,073 | 1,630 | 1,708 | 9,311 | ||||||||||||||
|
Provision for losses |
$ | (44 | ) | (421 | ) | 202 | (386 | ) | (649 | ) | ||||||||||
|
Charge-offs |
(24 | ) | 0 | (226 | ) | (270 | ) | (520 | ) | |||||||||||
|
Recoveries |
1 | 217 | 16 | 310 | 544 | |||||||||||||||
|
Balance, December 31, 2018 |
$ | 833 | 4,869 | 1,622 | 1,362 | 8,686 | ||||||||||||||
|
Provision for losses |
$ | 25 | (1,509 | ) | (29 | ) | 297 | (1,216 | ) | |||||||||||
|
Charge-offs |
(1 | ) | 0 | (107 | ) | (880 | ) | (988 | ) | |||||||||||
|
Recoveries |
0 | 1,700 | 21 | 361 | 2,082 | |||||||||||||||
|
Balance, December 31, 2019 |
$ | 857 | 5,060 | 1,507 | 1,140 | 8,564 | ||||||||||||||
|
Provision for losses |
$ | 173 | 2,938 | (63 | ) | (349 | ) | 2,699 | ||||||||||||
|
Charge-offs |
0 | (730 | ) | (84 | ) | (8 | ) | (822 | ) | |||||||||||
|
Recoveries |
0 | 27 | 29 | 202 | 258 | |||||||||||||||
|
Balance, December 31, 2020 |
$ | 1,030 | 7,295 | 1,389 | 985 | 10,699 | ||||||||||||||
|
Allocated to: |
||||||||||||||||||||
|
Specific reserves |
$ | 62 | 451 | 119 | 93 | 725 | ||||||||||||||
|
General reserves |
795 | 4,609 | 1,388 | 1,047 | 7,839 | |||||||||||||||
|
Balance, December 31, 2019 |
$ | 857 | 5,060 | 1,507 | 1,140 | 8,564 | ||||||||||||||
|
Allocated to: |
||||||||||||||||||||
|
Specific reserves |
$ | 29 | 95 | 100 | 14 | 238 | ||||||||||||||
|
General reserves |
1,001 | 7,200 | 1,289 | 971 | 10,461 | |||||||||||||||
|
Balance, December 31, 2020 |
$ | 1,030 | 7,295 | 1,389 | 985 | 10,699 | ||||||||||||||
|
Loans receivable at December 31, 2019: |
||||||||||||||||||||
|
Individually reviewed for impairment |
$ | 974 | 1,166 | 976 | 735 | 3,851 | ||||||||||||||
|
Collectively reviewed for impairment |
119,090 | 349,029 | 68,973 | 63,492 | 600,584 | |||||||||||||||
|
Ending balance |
$ | 120,064 | 350,195 | 69,949 | 64,227 | 604,435 | ||||||||||||||
|
Loans receivable at December 31, 2020: |
||||||||||||||||||||
|
Individually reviewed for impairment |
$ | 857 | 1,484 | 750 | 35 | 3,126 | ||||||||||||||
|
Collectively reviewed for impairment |
134,166 | 379,220 | 54,641 | 82,638 | 650,665 | |||||||||||||||
|
Ending balance |
$ | 135,023 | 380,704 | 55,391 | 82,673 | 653,791 | ||||||||||||||
The following table summarizes the amount of classified and unclassified loans at December 31, 2020 and 2019:
|
December 31, 2020 |
||||||||||||||||||||||||||||
|
Classified |
Unclassified |
|||||||||||||||||||||||||||
|
(Dollars in thousands) |
Special Mention |
Substandard |
Doubtful |
Loss |
Total |
Total |
Total Loans |
|||||||||||||||||||||
|
Single family |
$ | 1,219 | 2,845 | 29 | 0 | 4,093 | 130,930 | 135,023 | ||||||||||||||||||||
|
Commercial real estate: |
||||||||||||||||||||||||||||
|
Real estate rental and leasing |
8,065 | 3,483 | 0 | 0 | 11,548 | 190,852 | 202,400 | |||||||||||||||||||||
|
Other |
8,774 | 9,750 | 0 | 0 | 18,524 | 159,780 | 178,304 | |||||||||||||||||||||
|
Consumer |
0 | 600 | 132 | 18 | 750 | 54,641 | 55,391 | |||||||||||||||||||||
|
Commercial business |
1,968 | 2,482 | 0 | 0 | 4,450 | 78,223 | 82,673 | |||||||||||||||||||||
| $ | 20,026 | 19,160 | 161 | 18 | 39,365 | 614,426 | 653,791 | |||||||||||||||||||||
|
December 31, 2019 |
||||||||||||||||||||||||||||
|
Classified |
Unclassified |
|||||||||||||||||||||||||||
|
(Dollars in thousands) |
Special Mention |
Substandard |
Doubtful |
Loss |
Total |
Total |
Total Loans |
|||||||||||||||||||||
|
Single family |
$ | 1,118 | 1,765 | 35 | 0 | 2,918 | 117,146 | 120,064 | ||||||||||||||||||||
|
Commercial real estate: |
||||||||||||||||||||||||||||
|
Real estate rental and leasing |
3,489 | 9,114 | 0 | 0 | 12,603 | 179,899 | 192,502 | |||||||||||||||||||||
|
Other |
4,451 | 5,253 | 0 | 0 | 9,704 | 147,989 | 157,693 | |||||||||||||||||||||
|
Consumer |
0 | 842 | 69 | 65 | 976 | 68,973 | 69,949 | |||||||||||||||||||||
|
Commercial business |
5,710 | 2,516 | 0 | 0 | 8,226 | 56,001 | 64,227 | |||||||||||||||||||||
| $ | 14,768 | 19,490 | 104 | 65 | 34,427 | 570,008 | 604,435 | |||||||||||||||||||||
Classified loans represent special mention, substandard (performing and non-performing), and non-performing loans categorized as doubtful and loss. Loans classified as special mention are loans that have potential weaknesses that, if left uncorrected, may result in deterioration of the repayment prospects for the asset or in the Bank’s credit position at some future date. Loans classified as substandard are loans that are generally inadequately protected by the current net worth and paying capacity of the obligor, or by the collateral pledged, if any. Loans classified as substandard have a well-defined weakness or weaknesses that jeopardize the liquidation of the debt. Substandard loans are characterized by the distinct possibility that the Bank will sustain some loss if the deficiencies are not corrected. Loans classified as doubtful have the weaknesses of those classified as substandard, with additional characteristics that make collection in full on the basis of currently existing facts, conditions and values questionable, and there is a high possibility of loss. A loan classified as loss is essentially uncollateralized and/or considered uncollectible and of such little value that continuance as an asset on the balance sheet may not be warranted. Loans classified as substandard or doubtful require the Bank to perform an analysis of the individual loan and charge off any loans, or portion thereof, that are deemed uncollectible.
The aging of past due loans at December 31, 2020 and 2019 is summarized as follows:
|
(Dollars in thousands) |
30-59 Days Past Due |
60-89 Days Past Due |
90 Days or More Past Due |
Total Past Due |
Current Loans |
Total Loans |
Loans 90 Days or More Past Due and Still Accruing |
|||||||||||||||||||||
|
2020 |
||||||||||||||||||||||||||||
|
Single family |
$ | 626 | 38 | 298 | 962 | 134,061 | 135,023 | 0 | ||||||||||||||||||||
|
Commercial real estate: |
||||||||||||||||||||||||||||
|
Real estate rental and leasing |
0 | 0 | 0 | 0 | 202,400 | 202,400 | 0 | |||||||||||||||||||||
|
Other |
0 | 0 | 0 | 0 | 178,304 | 178,304 | 0 | |||||||||||||||||||||
|
Consumer |
458 | 66 | 279 | 803 | 54,588 | 55,391 | 0 | |||||||||||||||||||||
|
Commercial business |
0 | 0 | 0 | 0 | 82,673 | 82,673 | 0 | |||||||||||||||||||||
| $ | 1,084 | 104 | 577 | 1,765 | 652,026 | 653,791 | 0 | |||||||||||||||||||||
| 2019 | ||||||||||||||||||||||||||||
|
Single family |
$ | 786 | 77 | 59 | 922 | 119,142 | 120,064 | 0 | ||||||||||||||||||||
|
Commercial real estate: |
||||||||||||||||||||||||||||
|
Real estate rental and leasing |
0 | 0 | 0 | 0 | 192,502 | 192,502 | 0 | |||||||||||||||||||||
|
Other |
0 | 0 | 0 | 0 | 157,693 | 157,693 | 0 | |||||||||||||||||||||
|
Consumer |
527 | 31 | 206 | 764 | 69,185 | 69,949 | 0 | |||||||||||||||||||||
|
Commercial business |
147 | 13 | 550 | 710 | 63,517 | 64,227 | ||||||||||||||||||||||
| $ | 1,460 | 121 | 815 | 2,396 | 602,039 | 604,435 | 0 | |||||||||||||||||||||
Impaired loans include loans that are non-performing (non-accruing) and loans that have been modified in a TDR.
The following table summarizes impaired loans and related allowances for the years ended December 31, 2020 and 2019:
|
December 31, 2020 |
||||||||||||||||||||
|
(Dollars in thousands) |
Recorded Investment |
Unpaid Principal Balance |
Related Allowance |
Average Recorded Investment |
Interest Income Recognized |
|||||||||||||||
|
Loans with no related allowance recorded: |
||||||||||||||||||||
|
Single family |
$ | 740 | 759 | 0 | 616 | 34 | ||||||||||||||
|
Commercial real estate: |
||||||||||||||||||||
|
Real estate rental and leasing |
932 | 1,582 | 0 | 580 | 33 | |||||||||||||||
|
Other |
211 | 211 | 0 | 314 | 2 | |||||||||||||||
|
Consumer |
574 | 574 | 0 | 626 | 10 | |||||||||||||||
|
Commercial business |
0 | 0 | 0 | 2 | 0 | |||||||||||||||
|
Loans with an allowance recorded: |
||||||||||||||||||||
|
Single family |
117 | 117 | 29 | 242 | 0 | |||||||||||||||
|
Commercial real estate: |
||||||||||||||||||||
|
Real estate rental and leasing |
166 | 166 | 5 | 175 | 0 | |||||||||||||||
|
Other |
175 | 175 | 90 | 425 | 10 | |||||||||||||||
|
Consumer |
176 | 176 | 100 | 170 | 6 | |||||||||||||||
|
Commercial business |
35 | 586 | 14 | 200 | 2 | |||||||||||||||
|
Total: |
||||||||||||||||||||
|
Single family |
857 | 876 | 29 | 858 | 34 | |||||||||||||||
|
Commercial real estate: |
||||||||||||||||||||
|
Real estate rental and leasing |
1,098 | 1,748 | 5 | 755 | 33 | |||||||||||||||
|
Other |
386 | 386 | 90 | 739 | 12 | |||||||||||||||
|
Consumer |
750 | 750 | 100 | 796 | 16 | |||||||||||||||
|
Commercial business |
35 | 586 | 14 | 202 | 2 | |||||||||||||||
| $ | 3,126 | 4,346 | 238 | 3,350 | 97 | |||||||||||||||
| December 31, 2019 | ||||||||||||||||||||
| (Dollars in thousands) | Recorded Investment |
Unpaid Principal Balance |
Related Allowance |
Average Recorded Investment |
Interest Income Recognized |
|||||||||||||||
|
Loans with no related allowance recorded: |
||||||||||||||||||||
|
Single family |
$ | 544 | 563 | 0 | 508 | 33 | ||||||||||||||
|
Commercial real estate: |
||||||||||||||||||||
|
Other |
0 | 0 | 0 | 10 | 0 | |||||||||||||||
|
Consumer |
781 | 781 | 0 | 580 | 26 | |||||||||||||||
|
Loans with an allowance recorded: |
||||||||||||||||||||
|
Single family |
430 | 430 | 62 | 633 | 3 | |||||||||||||||
|
Commercial real estate: |
||||||||||||||||||||
|
Real estate rental and leasing |
184 | 184 | 16 | 193 | 0 | |||||||||||||||
|
Other |
982 | 982 | 435 | 1,048 | 71 | |||||||||||||||
|
Consumer |
195 | 195 | 119 | 231 | 14 | |||||||||||||||
|
Commercial business |
735 | 1,287 | 93 | 476 | 24 | |||||||||||||||
|
Total: |
||||||||||||||||||||
|
Single family |
974 | 993 | 62 | 1,141 | 36 | |||||||||||||||
|
Commercial real estate: |
||||||||||||||||||||
|
Real estate rental and leasing |
184 | 184 | 16 | 193 | 0 | |||||||||||||||
|
Other |
982 | 982 | 435 | 1,058 | 71 | |||||||||||||||
|
Consumer |
976 | 976 | 119 | 811 | 40 | |||||||||||||||
|
Commercial business |
735 | 1,287 | 93 | 476 | 24 | |||||||||||||||
| $ | 3,851 | 4,422 | 725 | 3,679 | 171 | |||||||||||||||
At December 31, 2020, 2019 and 2018, non-accruing loans totaled $2.7 million, $2.1 million and $2.7 million, respectively, for which the related allowance for loan losses was $0.2 million, $0.2 million and $0.7 million, respectively. Non-accruing loans for which no specific allowance has been recorded because management determined that the value of the collateral was sufficient to repay the loan totaled $2.1 million, $0.8 million and $0.4 million at December 31, 2020, 2019 and 2018, respectively. Had the non-accruing loans performed in accordance with their original terms, the Company would have recorded gross interest income on the loans of $0.2 million, $0.2 million and $0.3 million in 2020, 2019 and 2018, respectively. For each of the years ended December 31, 2020, 2019 and 2018, the Company recognized interest income on these loans of $0.1 million. All of the interest income that was recognized for non-accruing loans was recognized using the cash basis method of income recognition. Non-accrual loans also include some of the loans that have had terms modified in a TDR.
The following table summarizes non-accrual loans at December 31, 2020 and 2019:
|
(Dollars in thousands) |
2020 |
2019 |
||||||
|
Single family |
$ | 502 | 617 | |||||
|
Commercial real estate: |
||||||||
|
Real estate rental and leasing |
1,098 | 184 | ||||||
|
Other |
386 | 0 | ||||||
|
Consumer |
689 | 659 | ||||||
|
Commercial business |
9 | 621 | ||||||
| $ | 2,684 | 2,081 | ||||||
Included in loans receivable, net, are certain loans that have been modified in order to maximize collection of loan balances. If the Company, for legal or economic reasons related to the borrower’s financial difficulties, grants a concession compared to the original terms and conditions of the loan, the modified loan is considered a TDR.
At December 31, 2020, 2019 and 2018, there were loans included in loans receivable, net, with terms that had been modified in a TDR totaling $1.5 million, $2.5 million and $2.5 million, respectively. Had these loans been performing in accordance with their original terms throughout 2020, 2019 and 2018, the Company would have recorded gross interest income of $0.1 million, $0.2 million and $0.3 million, respectively. During 2020 the amount of interest income received on these loans was not material. During 2019 and 2018, the Company recognized interest income of $0.1 million and $0.2 million, respectively, on these loans. For the loans that were modified in 2020, none were classified and performing and $0.3 million were non-performing at December 31, 2020.
The following table summarizes TDRs at December 31, 2020 and 2019:
|
(Dollars in thousands) |
2020 |
2019 |
||||||
|
Single family |
$ | 612 | 623 | |||||
|
Commercial real estate: |
||||||||
|
Other |
211 | 983 | ||||||
|
Consumer |
630 | 745 | ||||||
|
Commercial business |
25 | 114 | ||||||
| $ | 1,478 | 2,465 | ||||||
As of December 31, 2020, the Bank had commitments to lend an additional $1.1 million to a borrower who has a TDR and non-accrual loans. These additional funds are for the construction of single family homes with a maximum loan-to-value ratio of 75%. These loans are secured by the homes under construction. There were commitments to lend additional funds of $0.8 million to this same borrower at December 31, 2019.
TDR concessions can include reduction of interest rates, extension of maturity dates, forgiveness of principal and/or interest due, or acceptance of real estate or other assets in full or partial satisfaction of the debt. Loan modifications are not reported as TDRs after 12 months if the loan was modified at a market rate of interest for comparable risk loans, and the loan is performing in accordance with the terms of the restructured agreement. All loans classified as TDRs are considered to be impaired.
When a loan is modified as a TDR, there may be a direct, material impact on the loans within the Consolidated Balance Sheets, as principal balances may be partially forgiven. The financial effects of TDRs are presented in the following table and represent the difference between the outstanding recorded balance pre-modification and post-modification, for the periods ended December 31, 2020 and 2019:
|
Year ended December 31, 2020 |
Year ended December 31, 2019 |
|||||||||||||||||||||||
|
(Dollars in thousands) |
Number of Contracts |
Pre-modification Outstanding Recorded Investment |
Post-modification Outstanding Recorded Investment |
Number of Contracts |
Pre-modification Outstanding Recorded Investment |
Post-modification Outstanding Recorded Investment |
||||||||||||||||||
|
Troubled debt restructurings: |
||||||||||||||||||||||||
|
Single family |
1 | $ | 94 | 101 | 4 | $ | 215 | 220 | ||||||||||||||||
|
Commercial real estate: |
||||||||||||||||||||||||
|
Other |
2 | 293 | 293 | 0 | 0 | 0 | ||||||||||||||||||
|
Consumer |
0 | 0 | 0 | 10 | 371 | 371 | ||||||||||||||||||
|
Total |
3 | $ | 387 | 394 | 14 | $ | 586 | 591 | ||||||||||||||||
There were no loans that were restructured during the years ended December 31, 2020 and 2019 that subsequently defaulted during 2020 and 2019, respectively.
The Company considers a loan to have defaulted when it becomes 90 or more days past due under the modified terms, when it is placed in non-accrual status, when it becomes other real estate owned, or when it becomes non-compliant with some other material requirement of the modification agreement.
Loans that were non-accrual prior to modification remain non-accrual for at least six months following modification. Non-accrual TDR loans that have performed according to the modified terms for six months may be returned to accruing status. Loans that were accruing prior to modification may remain on accrual status after the modification as long as the loan continues to perform under the new terms.
TDRs are reviewed for impairment following the same methodology as other impaired loans. For loans that are collateral dependent, the value of the collateral is reviewed and additional reserves may be added as needed. Loans that are not collateral dependent may have additional reserves established if deemed necessary. The allocated reserves for TDRs were $0.1 million, or 0.9%, of the total $10.7 million in allowance for loan losses at December 31, 2020, and $0.6 million, or 7.2%, of the total $8.6 million in allowance for loan losses at December 31, 2019.
The CARES Act was signed into law on March 27, 2020 and the Bank’s regulators issued the Interagency Statement on Loan Modification and Reporting for Financial Institutions Working with Customers Affected by the Coronavirus on April 7, 2020. In accordance with the regulatory guidance, the Bank offered loan payment accommodations to certain customers who were negatively impacted by the COVID-19 pandemic by deferring the loan payments for up to six months on their outstanding loans with the Bank. At June 30, 2020 the Bank had $119.1 million of loans to borrowers who had their payments deferred. At December 31, 2020 those deferral periods had expired and the Bank had no loans to borrowers that had their loan payments deferred. Section 4013 of the CARES act temporarily allows the Bank to grant modifications of loans to borrowers that were impacted by the pandemic without classifying the modifications as TDR’s if the accommodation was granted prior to December 31, 2020. All of the borrowers whose loan deferral period ended during 2020 have resumed making their normal payments except for the $34.6 million of loans that were granted loan accommodations in accordance with Section 4013 of the CARES Act. These accommodations are in addition to the TDR’s that are disclosed above. The accommodations granted included $29.2 million of loans that are required to make interest only payments for periods up to one year and $5.4 million of loans that had their loan amortization period increased. Of the loans removed from the deferred list during the period, $8.1 million were downgraded, of which $2.3 million were classified but still accruing at December 31, 2020. The commercial credit area continues to communicate regularly with the borrowers that have been granted loan accommodations and monitors their activity closely. This information is used to analyze the performance of these loans and to anticipate potential issues that these loans may develop so that risk ratings may be appropriately adjusted in a timely manner. It is anticipated that some borrowers that have been granted accommodations will be in a position to resume making their regular loan payments at the end of the current accommodation period. Other borrowers, particularly in the hospitality and restaurant industries, may need additional accommodations when the current accommodation period ends as their operations may need more time to recover from the impacts of the pandemic.
NOTE 7 Accrued Interest Receivable
Accrued interest receivable at December 31 is summarized as follows:
|
(Dollars in thousands) |
2020 |
2019 |
||||||
|
Securities available for sale |
$ | 392 | 378 | |||||
|
Loans receivable |
2,710 | 1,873 | ||||||
| $ | 3,102 | 2,251 | ||||||
NOTE 8 Intangible Assets
The Company’s intangible assets consist of core deposit intangibles, goodwill and mortgage servicing rights. A summary of mortgage servicing rights activity for 2020 and 2019 is as follows:
|
(Dollars in thousands) |
2020 |
2019 |
||||||
|
Mortgage servicing rights, net: |
||||||||
|
Balance, beginning of year |
$ | 2,172 | 1,855 | |||||
|
Originations |
2,189 | 1,097 | ||||||
|
Amortization |
(1,318 | ) | (780 | ) | ||||
|
Balance, end of year |
3,043 | 2,172 | ||||||
|
Fair value of mortgage servicing rights |
$ | 3,378 | 3,390 | |||||
All of the single family loans sold where the Company continues to service the loans are serviced for FNMA under the individual loan sale program. The following is a summary of the risk characteristics of the loans being serviced for FNMA at December 31, 2020:
|
(Dollars in thousands) |
Loan Principal Balance |
Weighted Average Interest Rate |
Weighted Average Remaining Term (months) |
Number of Loans |
||||||||||||
|
Original term: |
||||||||||||||||
|
30 year fixed rate |
$ | 393,956 | 3.65 |
% |
312 | 2,629 | ||||||||||
|
15 year fixed rate |
123,442 | 2.97 | 142 | 1,102 | ||||||||||||
The gross carrying amount of intangible assets and the associated accumulated amortization at December 31, 2020 and 2019 are presented in the following table. Amortization expense for intangible assets was $1.4 million, $0.9 million and $0.7 million for the years ended December 31, 2020, 2019 and 2018, respectively.
|
Gross |
Unamortized |
|||||||||||
|
Carrying |
Accumulated |
Intangible |
||||||||||
|
(Dollars in thousands) |
Amount |
Amortization |
Assets |
|||||||||
|
December 31, 2020 |
||||||||||||
|
Mortgage servicing rights |
$ | 5,691 | (2,648 | ) | 3,043 | |||||||
|
Core deposit intangibles |
574 | (517 | ) | 57 | ||||||||
|
Goodwill |
802 | 0 | 802 | |||||||||
|
Total |
$ | 7,067 | (3,165 | ) | 3,902 | |||||||
|
December 31, 2019 |
||||||||||||
|
Mortgage servicing rights |
$ | 4,968 | (2,796 | ) | 2,172 | |||||||
|
Core deposit intangibles |
574 | (418 | ) | 156 | ||||||||
|
Goodwill |
802 | 0 | 802 | |||||||||
|
Total |
$ | 6,344 | (3,214 | ) | 3,130 | |||||||
The following table indicates the estimated future amortization expense for amortizing intangible assets:
|
(Dollars in thousands) |
Mortgage Servicing Rights |
Core Deposit Intangible |
Total Amortizing Assets |
|||||||||
|
Year ended December 31, |
||||||||||||
|
2021 |
$ | 639 | 47 | 686 | ||||||||
|
2022 |
588 | 10 | 598 | |||||||||
|
2023 |
539 | 0 | 539 | |||||||||
|
2024 |
486 | 0 | 486 | |||||||||
|
2025 |
392 | 0 | 392 | |||||||||
|
Thereafter |
399 | 0 | 399 | |||||||||
| $ | 3,043 | 57 | 3,100 | |||||||||
No amortization expense relating to goodwill is recorded as generally accepted accounting principles do not allow goodwill to be amortized, but require that it be tested for impairment at least annually, or sooner, if there are indications that impairment may exist. The Company’s stock was trading at a price below its book value at December 31, 2020 and therefore, goodwill was analyzed for impairment. Based on this analysis, the Company determined that goodwill was not permanently impaired and no write down was required at December 31, 2020.
Projections of amortization are based on asset balances and the interest rate environment that existed at December 31, 2020. The Company’s actual experience may be significantly different depending upon changes in mortgage interest rates and other market conditions.
NOTE 9 Premises and Equipment
A summary of premises and equipment at December 31, 2020 and 2019 is as follows:
|
(Dollars in thousands) |
2020 |
2019 |
||||||
|
Land |
$ | 2,615 | 2,615 | |||||
|
Office buildings and improvements |
12,074 | 11,946 | ||||||
|
Furniture and equipment |
12,497 | 12,954 | ||||||
| 27,186 | 27,515 | |||||||
|
Accumulated depreciation |
(17,053 | ) | (17,000 | ) | ||||
| $ | 10,133 | 10,515 | ||||||
NOTE 10 Leases
The Company accounts for its leases in accordance with ASU 2016-02, Leases (Topic 842) and as of December 31, 2020 a $3.2 million operating lease right-of-use asset and an offsetting lease payment obligation liability were recorded on the consolidated balance sheet in other assets and other liabilities, respectively.
Operating lease right-of-use assets represent our right to use an underlying asset during the lease term and operating lease liabilities represent our obligation to make lease payments arising from the lease. Right-of-use assets and operating lease liabilities are recognized at lease commencement based on the present value of the remaining lease payments using a discount rate that represents the Company’s incremental borrowing rate at the lease commencement date. Because the Company only has operating leases and the right-of-use asset is offset by a lease payment obligation liability, the lease payments are the only amount that is recorded in occupancy expense in the consolidated statements of comprehensive income.
The Company’s leases relate to office space and Bank branches with remaining lease terms between 20 and 52 months. Certain leases contain extension options which typically range from 3 to 10 years. Because these extension options are not considered reasonably certain of exercise, they are not included in the lease term.
The table below summarizes our net lease cost for the years ended December 31, 2020 and 2019.
|
(Dollars in thousands) |
2020 |
2019 |
||||||
|
Operating lease cost |
$ | 892 | 889 | |||||
The table below summarizes other information related to our operating leases for the years ended December 31, 2020 and 2019.
|
(Dollars in thousands) |
2020 |
2019 |
||||||
|
Cash paid for amounts included in the measurement of lease liabilities: |
||||||||
|
Operating cash flows from operating leases |
$ | 892 | 889 | |||||
|
Weighted-average remaining lease term – operating leases, in years |
3.8 | 4.7 | ||||||
|
Weighted-average discount rate – operating leases |
2.19 |
% |
2.19 |
% |
||||
The table below summarizes the maturity of remaining lease liabilities:
|
(Dollars in thousands) |
December 31, 2020 |
|||
|
2021 |
$ | 896 | ||
|
2022 |
932 | |||
|
2023 |
807 | |||
|
2024 |
729 | |||
|
2025 |
15 | |||
|
2026 and thereafter |
0 | |||
|
Total lease payments |
3,379 | |||
|
Less: Interest |
(140 | ) | ||
|
Present value of lease liabilities |
$ | 3,239 | ||
NOTE 11 Deposits
Deposits and their weighted average interest rates at December 31, 2020 and 2019 are summarized as follows:
|
2020 |
2019 |
|||||||||||||||||||||||
|
(Dollars in thousands) |
Weighted Average Rate |
Amount |
Percent of Total |
Weighted Average Rate |
Amount |
Percent of Total |
||||||||||||||||||
|
Noninterest checking |
0.00 |
% |
$ | 239,587 | 30.1 |
% |
0.00 |
% |
$ | 183,350 | 27.2 |
% |
||||||||||||
|
Interest checking |
0.12 | 138,709 | 17.4 | 0.13 | 96,341 | 14.3 | ||||||||||||||||||
|
Savings accounts |
0.06 | 100,209 | 12.6 | 0.08 | 80,054 | 11.9 | ||||||||||||||||||
|
Money market accounts |
0.25 | 214,300 | 27.0 | 0.65 | 187,517 | 27.8 | ||||||||||||||||||
| 692,805 | 87.1 | 547,262 | 81.2 | |||||||||||||||||||||
|
Certificates by rate: |
||||||||||||||||||||||||
| 0-0.99% | 56,001 | 7.0 | 22,499 | 3.3 | ||||||||||||||||||||
| 1-1.99% | 20,613 | 2.6 | 38,097 | 5.7 | ||||||||||||||||||||
| 2-2.99% | 21,973 | 2.8 | 61,936 | 9.2 | ||||||||||||||||||||
| 3-3.99% | 3,812 | 0.5 | 4,076 | 0.6 | ||||||||||||||||||||
|
Total certificates |
1.14 | 102,399 | 12.9 | 1.84 | 126,608 | 18.8 | ||||||||||||||||||
|
Total deposits |
0.25 | $ | 795,204 | 100.0 |
% |
0.56 | $ | 673,870 | 100.0 |
% |
||||||||||||||
At December 31, 2020 and 2019, the Company had $269.3 million and $215.8 million, respectively, of deposit accounts with balances of $250,000 or more. At December 31, 2020 and 2019, the Company had no certificate accounts that had been acquired through a broker.
Certificates had the following maturities at December 31, 2020 and 2019:
|
2020 |
2019 |
|||||||||||||||
|
(Dollars in thousands) |
Amount |
Weighted Average Rate |
Amount |
Weighted Average Rate |
||||||||||||
|
Remaining term to maturity |
||||||||||||||||
|
1-6 months |
$ | 37,165 | 1.24 |
% |
$ | 43,447 | 1.88 |
% |
||||||||
|
7-12 months |
39,063 | 0.97 | 39,074 | 1.63 | ||||||||||||
|
13-36 months |
23,604 | 1.25 | 41,753 | 2.00 | ||||||||||||
|
Over 36 months |
2,567 | 1.21 | 2,334 | 1.71 | ||||||||||||
| $ | 102,399 | 1.14 | $ | 126,608 | 1.84 | |||||||||||
At December 31, 2020 and 2019, the Company had pledged mortgage loans and mortgage-backed and related securities with an amortized cost of approximately $29.8 million and $14.9 million, respectively, as collateral for certain deposits.
Interest expense on deposits is summarized as follows for the years ended December 31, 2020, 2019 and 2018:
|
(Dollars in thousands) |
2020 |
2019 |
2018 |
|||||||||
|
Checking accounts |
$ | 151 | 103 | 62 | ||||||||
|
Savings accounts |
65 | 63 | 61 | |||||||||
|
Money market accounts |
840 | 1,171 | 865 | |||||||||
|
Certificates |
1,795 | 1,995 | 1,243 | |||||||||
| $ | 2,851 | 3,332 | 2,231 | |||||||||
NOTE 12 Federal Home Loan Bank (FHLB) Advances and Other Borrowings
The Bank had no outstanding advances from the FHLB or other borrowings as of December 31, 2020 or December 31, 2019. At December 31, 2020 the Bank had collateral pledged to the FHLB consisting of FHLB stock, mortgage loans, and investments with a borrowing capacity of approximately $168.3 million, subject to a requirement to purchase FHLB stock. The Bank also had the ability to borrow $60.4 million from the Federal Reserve Bank of Minneapolis, based upon the loans that were pledged to them as of December 31, 2020, subject to approval from the Board of Governors of the Federal Reserve System (FRB).
At December 31, 2019 the Bank had collateral pledged to the FHLB consisting of FHLB stock, mortgage loans, and investments with a borrowing capacity of approximately $181.2 million, subject to a requirement to purchase FHLB stock. The Bank also had the ability to borrow $65.3 million from the Federal Reserve Bank of Minneapolis, based upon the loans that were pledged to them as of December 31, 2019, subject to approval from the FRB.
NOTE 13 Income Taxes
Income tax expense for the years ended December 31, 2020, 2019 and 2018 is as follows:
|
(Dollars in thousands) |
2020 |
2019 |
2018 |
|||||||||
|
Current: |
||||||||||||
|
Federal |
$ | 3,418 | 2,141 | 1,690 | ||||||||
|
State |
1,452 | 687 | 115 | |||||||||
|
Total current |
4,870 | 2,828 | 1,805 | |||||||||
|
Deferred: |
||||||||||||
|
Federal |
(589 | ) | 256 | 234 | ||||||||
|
State |
(213 | ) | 240 | 849 | ||||||||
|
Total deferred |
(802 | ) | 496 | 1,083 | ||||||||
|
Income tax expense |
$ | 4,068 | 3,324 | 2,888 | ||||||||
The reasons for the difference between the expected income tax expense utilizing the federal corporate tax rate of 21% and the actual income tax expense are as follows:
|
(Dollars in thousands) |
2020 |
2019 |
2018 |
|||||||||
|
Expected federal income tax expense |
$ | 3,019 | 2,334 | 2,336 | ||||||||
|
Items affecting federal income tax: |
||||||||||||
|
State income taxes, net of federal income tax deduction |
1,025 | 852 | 559 | |||||||||
|
Other, net |
24 | 138 | (7 | ) | ||||||||
|
Income tax expense |
$ | 4,068 | 3,324 | 2,888 | ||||||||
The tax effects of temporary differences that give rise to the deferred tax assets and deferred tax liabilities are as follows at December 31:
|
(Dollars in thousands) |
2020 |
2019 |
||||||
|
Deferred tax assets: |
||||||||
|
Allowances for loan losses |
$ | 3,010 | 2,394 | |||||
|
Deferred compensation costs |
141 | 158 | ||||||
|
Deferred ESOP loan asset |
430 | 453 | ||||||
|
Non-accruing loan interest |
134 | 78 | ||||||
|
Other |
499 | 182 | ||||||
|
Total gross deferred tax assets |
4,214 | 3,265 | ||||||
|
Deferred tax liabilities: |
||||||||
|
Deferred loan costs |
119 | 344 | ||||||
|
Premises and equipment basis difference |
549 | 526 | ||||||
|
Originated mortgage servicing rights |
856 | 607 | ||||||
|
Net unrealized gain on securities available for sale |
496 | 18 | ||||||
|
Other |
167 | 68 | ||||||
|
Total gross deferred tax liabilities |
2,187 | 1,563 | ||||||
|
Net deferred tax assets |
$ | 2,027 | 1,702 | |||||
The Company has no federal and $0.4 million of state net operating loss carryforwards at December 31, 2020.
Retained earnings at December 31, 2020 included approximately $8.8 million for which no provision for income taxes was made. This amount represents allocations of income to bad debt deductions for tax purposes. Reduction of amounts so allocated for purposes other than absorbing losses will create income for tax purposes, which will be subject to the then-current corporate income tax rate.
The Company considers the determination of the deferred tax asset amount and the need for any valuation reserve to be a critical accounting policy that requires significant judgment. The Company has, in its judgment, made reasonable assumptions and considered both positive and negative evidence relating to the ultimate realization of deferred tax assets. Positive evidence includes the cumulative net income generated over the prior three year period and the probability that taxable income will be generated in future periods. The Company could not currently identify any negative evidence. Based upon this evaluation, the Company determined that no valuation allowance was required with respect to the net deferred tax assets at December 31, 2020 and 2019.
NOTE 14 Employee Benefits
The Company participates in the Pentegra Defined Benefit Plan for Financial Institutions (Pentegra DB Plan), a noncontributory multi-employer defined benefit pension plan covering Bank employees who were hired prior to 2002 that met minimum service requirements. Effective September 1, 2002, this plan was frozen and closed to new participants but employees that were already in the plan at the time it was frozen continue to accrue benefits. The Pentegra DB Plan’s Employer Identification Number is 13-5645888 and the Plan number is 333. There are no collective bargaining agreements that require contributions to the Pentegra DB Plan, and there is no funding improvement or rehabilitation plan as part of the Pentegra DB Plan. The Company’s policy is to fund accrued pension costs and the employer contributions paid and expensed for the years ended December 31, 2020, 2019 and 2018 were $0.3 million, $0.3 million and $0.1 million, respectively. The Company’s contributions to the Pentegra DB Plan were not more than 5% of total contributions to the Plan. Funded status (market value of plan assets divided by the funding target) as of July 1 for the 2020, 2019 and 2018 plan years were 85.26%, 87.67% and 89.86%, respectively.
The Company has a qualified, tax-exempt savings plan with a deferred feature qualifying under Section 401(k) of the Internal Revenue Code (the 401(k) Plan). All employees who have attained 18 years of age are eligible to participate in the 401(k) Plan. Participants are permitted to make contributions to the 401(k) Plan equal to the lesser of 50% of their annual salary or the maximum allowed by law, which was $19,500 for 2020, $19,000 for 2019 and $18,500 for 2018, with additional “catch up” contributions allowed for employees over 50 years of age. The Company matches 25% of each participant’s contributions up to a maximum of 8% of their annual salary. Participant contributions and earnings are fully and immediately vested. The Company’s contributions are vested on a three year cliff basis, are expensed annually, and were $0.2 million in 2020, 2019 and 2018.
The Company has adopted an Employee Stock Ownership Plan (the ESOP) that meets the requirements of Section 4975(e)(7) of the Internal Revenue Code and Section 407(d)(6) of ERISA and, as such, the ESOP is empowered to borrow in order to finance purchases of the common stock of HMN. The ESOP borrowed $6.1 million from the Company to purchase 912,866 shares of common stock in the initial public offering of HMN in 1994. As a result of a merger with Marshalltown Financial Corporation (MFC), the ESOP borrowed $1.5 million in 1998 to purchase an additional 76,933 shares of HMN common stock to account for the additional employees and to avoid dilution of the benefit provided by the ESOP. The ESOP debt requires quarterly payments of principal plus interest at 7.52%. The Company has committed to make quarterly contributions to the ESOP necessary to repay the loans including interest. The Company contributed $0.5 million in 2020, 2019 and 2018.
As the debt is repaid, ESOP shares that were pledged as collateral for the debt are released from collateral based on the proportion of debt service paid in the year and then allocated to eligible employees. The Company accounts for its ESOP in accordance with ASU 718, Employers' Accounting for Employee Stock Ownership Plans. Accordingly, the shares pledged as collateral are reported as unearned ESOP shares in stockholders' equity. As shares are determined to be ratably released from collateral, the Company reports compensation expense equal to the current market price of the shares and the shares become outstanding for earnings per common share computations. ESOP compensation expense was $0.4 million for 2020, and $0.5 million for 2019 and 2018.
All employees of the Bank are eligible to participate in the ESOP after they attain age 18 and complete one year of service during which they worked at least 1,000 hours. A summary of the ESOP share allocation is as follows for the years ended December 31:
|
2020 |
2019 |
2018 |
||||||||||
|
Shares held by participants beginning of the year |
346,097 | 340,237 | 357,135 | |||||||||
|
Shares allocated to participants |
24,377 | 24,317 | 24,317 | |||||||||
|
Shares distributed to participants |
(10,631 | ) | (18,457 | ) | (41,215 | ) | ||||||
|
Shares held by participants end of year |
359,843 | 346,097 | 340,237 | |||||||||
|
Unreleased shares beginning of the year |
206,795 | 231,112 | 255,429 | |||||||||
|
Shares released during year |
(24,377 | ) | (24,317 | ) | (24,317 | ) | ||||||
|
Unreleased shares end of year |
182,418 | 206,795 | 231,112 | |||||||||
|
Total ESOP shares end of year |
542,261 | 552,892 | 571,349 | |||||||||
|
Fair value of unreleased shares at December 31 |
$ | 3,137,590 | 4,344,763 | 4,534,417 | ||||||||
In April 2009 the HMN Financial, Inc. 2009 Equity and Incentive Plan (2009 Plan) was adopted by the Company. In April 2017, the 2009 Plan was superseded by the HMN Financial, Inc. 2017 Equity Incentive Plan (2017 Plan) and options or restricted shares were no longer awarded from the 2009 Plan. As of December 31, 2020 there were 34,229 vested options outstanding under the 2009 Plan. These options expire 10 years from the date of grant, have an average exercise price of $11.21 and had a grant date fair value of $4.04. All restricted stock awards previously granted under the 2009 Plan have vested as of December 31, 2020.
The purpose of the 2017 Plan is to attract and retain the best available personnel for positions of responsibility with the Company, to provide additional incentives to them and align their interests with those of the Company’s stockholders, and to thereby promote the Company’s long-term business success. 375,000 shares of HMN common stock were initially available for distribution under the 2017 Plan in either restricted stock or options, subject to adjustment for future stock splits, stock dividends and similar changes to the capitalization of the Company. Additionally, shares of restricted stock that are awarded are counted as 1.5 shares for purposes of determining the total shares available for issuance under the 2017 Plan. As of December 31, 2020, there were no options outstanding under the 2017 Plan. There were 21,484 shares of restricted stock previously granted to employees and directors under the 2017 Plan that remained unvested at December 31, 2020.
A summary of activities under all plans for the past three years is as follows:
|
Unvested options |
||||||||||||||||||||||||||||
|
Shares Available For Grant |
Unvested Restricted Shares Outstanding |
Options Outstanding |
Award Value/ Weighted Average Exercise Price |
Number |
Weighted Average Grant Date Fair Value |
Vesting Period |
||||||||||||||||||||||
|
2009 Plan |
||||||||||||||||||||||||||||
|
December 31, 2017 |
0 | 14,881 | 49,229 | $ | 9.25 | 22,820 | $ | 4.04 | ||||||||||||||||||||
|
Options Exercised |
0 | 0 | (15,000 | ) | ||||||||||||||||||||||||
|
Vested |
0 | (7,541 | ) | 0 | (11,410 | ) | ||||||||||||||||||||||
|
December 31, 2018 |
0 | 7,340 | 34,229 | $ | 11.21 | 11,410 | $ | 4.04 | ||||||||||||||||||||
|
Vested |
0 | (4,238 | ) | 0 | (11,410 | ) | ||||||||||||||||||||||
|
December 31, 2019 |
0 | 3,102 | 34,229 | $ | 11.21 | 0 | ||||||||||||||||||||||
|
Vested |
0 | (3,102 | ) | 0 | 0 | |||||||||||||||||||||||
|
December 31, 2020 |
0 | 0 | 34,229 | $ | 11.21 | 0 | ||||||||||||||||||||||
|
2017 Plan |
||||||||||||||||||||||||||||
|
December 31, 2017 |
415,292 | 2,280 | 0 | N/A | 0 | |||||||||||||||||||||||
|
Granted January 23, 2018 |
(10,044 | ) | 6,696 | 0 | 3 | |||||||||||||||||||||||
|
Granted April 24, 2018 |
(792 | ) | 528 | 0 | 1 | |||||||||||||||||||||||
|
Vested |
0 | (2,280 | ) | 0 | 0 | |||||||||||||||||||||||
|
December 31, 2018 |
404,456 | 7,224 | 0 | N/A | 0 | |||||||||||||||||||||||
|
Granted January 22, 2019 |
(12,971 | ) | 8,647 | 0 | 3 | |||||||||||||||||||||||
|
Granted April 23, 2019 |
(2,514 | ) | 1,676 | 0 | 1 | |||||||||||||||||||||||
|
Vested |
0 | (2,760 | ) | 0 | 0 | |||||||||||||||||||||||
|
December 31, 2019 |
388,971 | 14,787 | 0 | N/A | 0 | |||||||||||||||||||||||
|
Granted January 28, 2020 |
(10,650 | ) | 7,100 | 0 | 3 | |||||||||||||||||||||||
|
Granted April 23, 2020 |
(9,000 | ) | 6,000 | 0 | 2 | |||||||||||||||||||||||
|
Granted April 28, 2020 |
(3,579 | ) | 2,386 | 0 | 1 | |||||||||||||||||||||||
|
Vested |
0 | (8,789 | ) | 0 | 0 | |||||||||||||||||||||||
|
December 31, 2020 |
365,742 | 21,484 | 0 | N/A | 0 | |||||||||||||||||||||||
|
Total all plans |
365,742 | 21,484 | 34,229 | $ | 11.21 | 0 | ||||||||||||||||||||||
The following table summarizes information about stock options outstanding at December 31, 2020:
|
Date of Grant |
Exercise Price |
Number Outstanding |
Weighted Average Remaining Contractual Life in Years |
Number Exercisable |
Number Unexercisable |
|||||||||||||||
|
January 26, 2016 |
$ | 11.21 | 34,229 | 5.1 | 34,229 | 0 | ||||||||||||||
| 34,229 | 34,229 | 0 | ||||||||||||||||||
The Company will issue shares from treasury stock upon the exercise of the outstanding options.
In accordance with ASC 718, the Company recognizes compensation expense relating to stock options over the vesting period. The amount of the expense was determined under the fair value method. The fair value for each option grant is estimated on the date of the grant using the Black Scholes option valuation method. There were no options granted in 2020, 2019 or 2018.
NOTE 15 Earnings per Common Share
The following table reconciles the weighted average shares outstanding and net income for basic and diluted earnings per common share:
|
Year ended December 31, |
||||||||||||
|
(Dollars in thousands, except per share data) |
2020 |
2019 |
2018 |
|||||||||
|
Weighted average number of common shares outstanding used in basic earnings per common share calculation |
4,623,237 | 4,610,469 | 4,368,289 | |||||||||
|
Net dilutive effect of : |
||||||||||||
|
Options and warrants |
10,148 | 16,018 | 423,818 | |||||||||
|
Restricted stock awards |
14,263 | 12,443 | 10,868 | |||||||||
|
Weighted average number of common shares outstanding adjusted for effect of dilutive securities |
4,647,648 | 4,638,930 | 4,802,975 | |||||||||
|
Net income available to common shareholders |
$ | 10,302 | 7,793 | 8,236 | ||||||||
|
Basic earnings per common share |
$ | 2.23 | 1.69 | 1.89 | ||||||||
|
Diluted earnings per common share |
$ | 2.22 | 1.68 | 1.71 | ||||||||
NOTE 16 Stockholders' Equity
The Company's certificate of incorporation authorizes the issuance of up to 500,000 shares of preferred stock, and on December 23, 2008, the Company completed the sale of 26,000 shares of Fixed Rate Cumulative Perpetual Preferred Stock, Series A (Preferred Stock) to the United States Department of Treasury (Treasury). The Preferred Stock had a liquidation value of $1,000 per share and a related warrant was also issued to purchase 833,333 shares of HMN common stock at an exercise price of $4.68 per share (the Warrant). The transaction was part of the Treasury’s Capital Purchase Program under the Emergency Economic Stabilization Act of 2008.
On February 17, 2015, the Company redeemed the final 10,000 shares of outstanding Preferred Stock. On May 21, 2015, the Treasury sold the Warrant at an exercise price of $4.68 per share to three unaffiliated third party investors for an aggregate purchase price of $5.7 million. In 2018, all of the outstanding Warrants were either exercised by the Warrant holder or repurchased by the Company. These Warrant transactions resulted in the Company issuing an additional 319,651 shares of common stock from treasury shares for Warrants that were exercised and paying $6.5 million in cash to repurchase the remaining Warrants. As a result of these transactions, the Company no longer has any obligations under the Warrant.
On November 28, 2018, the Board of Directors announced a share repurchase program, pursuant to which the Company may purchase shares of its common stock for an aggregate purchase price not to exceed $6.0 million. The share repurchase program does not obligate the Company to purchase any shares and has no set expiration date. The Company repurchased 87,249 shares in the open market for $1.5 million in 2020. No shares were repurchased by the Company in 2019 or 2018 under the share repurchase program. The Company did not pay any dividends on its common stock during 2020, 2019 or 2018.
In order to grant a priority to eligible accountholders in the event of future liquidation, the Bank, at the time of conversion to a stock savings bank, established a liquidation account equal to its regulatory capital as of September 30, 1993. In the event of future liquidation of the Bank, an eligible accountholder who continues to maintain their deposit account shall be entitled to receive a distribution from the liquidation account. The total amount of the liquidation account will decrease as the balance of eligible accountholders is reduced subsequent to the conversion, based on an annual determination of such balance.
NOTE 17 Regulatory Capital
The Company and the Bank are subject to the Basel III regulatory capital requirements. The Basel III requirements, among other things, (i) apply a set of capital requirements to the Bank (the Company is exempt, pursuant to the Small Bank Holding Company Policy Statement (Policy Statement) described below), including requirements relating to common equity as a component of core capital, (ii) implement a “capital conservation buffer” against risk and a higher minimum Tier 1 capital requirement, and (iii) set forth rules for calculating risk-weighted assets for purposes of such requirements. The rules made corresponding revisions to the prompt corrective action framework and include capital ratios and buffer requirements. Failure to meet minimum capital requirements can initiate certain mandatory and possibly additional discretionary actions by regulators that, if undertaken, could have a direct material effect on the Company's financial statements. Under capital adequacy guidelines and the regulatory framework for prompt corrective action, the Bank must meet specific capital guidelines that involve quantitative measures of its assets, liabilities and certain off-balance sheet items as calculated under regulatory accounting practices. The capital amounts and classification are also subject to qualitative judgments by the regulators about components, risk weightings and other factors.
The FRB amended its Policy Statement to exempt small bank and savings and loan holding companies with assets less than $3 billion from the above capital requirements. The Company currently meets the qualitative exemption requirements, and therefore, is exempt from the above capital requirements.
Quantitative measures established by regulations to ensure capital adequacy require the Bank to maintain minimum amounts and ratios (set forth in the following table and defined in the regulation) of Common Equity Tier 1 capital to risk weighted assets, Tier 1 capital to adjusted total assets, Tier 1 capital to risk weighted assets, and total capital to risk weighted assets.
At December 31, 2020 and 2019, the Bank's capital amounts and ratios are presented for actual capital, required capital and excess capital including amounts and ratios in order to qualify as being well capitalized under the prompt corrective action regulations:
|
Actual |
Required to be Adequately Capitalized |
Capital in Excess of Minimum Requirements |
To Be Well Capitalized Under Prompt Corrective Action Provisions |
|||||||||||||||||||||||||||||
|
(Dollars in thousands) |
Amount |
Percent of Assets(1) |
Amount |
Percent of Assets(1) |
Amount |
Percent of Assets(1) |
Amount |
Percent of Assets(1) |
||||||||||||||||||||||||
|
December 31, 2020 |
||||||||||||||||||||||||||||||||
|
Common equity Tier 1 capital |
$ | 89,473 | 13.62 |
% |
$ | 29,571 | 4.50 |
% |
$ | 59,902 | 9.12 |
% |
$ | 42,714 | 6.50 |
% |
||||||||||||||||
|
Tier 1 leverage |
89,473 | 9.85 | 36,330 | 4.00 | 53,143 | 5.85 | 45,412 | 5.00 | ||||||||||||||||||||||||
|
Tier 1 risk-based capital |
89,473 | 13.62 | 39,428 | 6.00 | 50,045 | 7.62 | 52,571 | 8.00 | ||||||||||||||||||||||||
|
Total risk-based capital |
97,717 | 14.87 | 52,571 | 8.00 | 45,146 | 6.87 | 65,714 | 10.00 | ||||||||||||||||||||||||
|
December 31, 2019 |
||||||||||||||||||||||||||||||||
|
Common equity Tier 1 capital |
$ | 83,525 | 13.21 |
% |
$ | 28,458 | 4.50 |
% |
$ | 55,067 | 8.71 |
% |
$ | 41,106 | 6.50 |
% |
||||||||||||||||
|
Tier 1 leverage |
83,525 | 10.89 | 30,684 | 4.00 | 52,841 | 6.89 | 38,355 | 5.00 | ||||||||||||||||||||||||
|
Tier 1 risk-based capital |
83,525 | 13.21 | 37,944 | 6.00 | 45,581 | 7.21 | 50,591 | 8.00 | ||||||||||||||||||||||||
|
Total risk-based capital |
91,438 | 14.46 | 50,591 | 8.00 | 40,847 | 6.46 | 63,239 | 10.00 | ||||||||||||||||||||||||
|
(1) Based upon the Bank’s adjusted total assets for the purpose of the Tier 1 leverage capital ratio and risk-weighted assets for the purpose of the risk-based capital ratios. |
The Bank must maintain a capital conservation buffer of 2.50% composed of common equity Tier 1 capital above its minimum risk-based capital requirements in order to avoid limitations on capital distributions, including dividend payments and certain discretionary bonus payments to executive officers. Management believes that, as of December 31, 2020, the Bank’s capital ratios were in excess of those quantitative capital ratio standards set forth under the current prompt corrective action regulations, including the capital conservation buffer described above. However, there can be no assurance that the Bank will continue to maintain such status in the future. The Office of the Comptroller of the Currency has extensive discretion in its supervisory and enforcement activities, and can adjust the requirement to be well-capitalized in the future. In addition, the Company must adhere to various U.S. Department of Housing and Urban Development (HUD) regulatory guidelines including required minimum capital and liquidity amounts to maintain their Federal Housing Administration approved status. Failure to comply with the HUD guidelines could result in withdrawal of this certification. As of December 31, 2020, the Company was in compliance with HUD guidelines.
NOTE 18 Commitments and Contingencies
The Company is a party to financial instruments with off-balance sheet risk in the normal course of business to meet the financing needs of its customers. These financial instruments include all commitments to extend credit. These commitments involve, to varying degrees, elements of credit and interest rate risk in excess of the amounts recognized in the balance sheet. The contract amounts of these instruments reflect the extent of involvement by the Company.
The Company's exposure to credit loss in the event of nonperformance by the other party to the financial instrument for commitments to extend credit is represented by the contract amount of these commitments. The Company uses the same credit policies in making commitments as it does for on-balance sheet instruments.
|
Contract Amount |
||||||||
|
(Dollars in thousands) |
2020 |
2019 |
||||||
|
Financial instruments whose contract amount represents credit risk: |
||||||||
|
Commitments to originate, fund or purchase loans: |
||||||||
|
Single family |
$ | 20,283 | 7,620 | |||||
|
Multi-family |
1,150 | 0 | ||||||
|
Commercial real estate |
821 | 19,183 | ||||||
|
Commercial business |
1,342 | 11,354 | ||||||
|
Undisbursed balance of loans closed |
38,990 | 30,070 | ||||||
|
Unused lines of credit |
113,435 | 107,767 | ||||||
|
Letters of credit |
4,309 | 2,810 | ||||||
|
Total commitments to extend credit |
$ | 180,330 | 178,804 | |||||
|
Forward commitments |
$ | 24,746 | 10,098 | |||||
Commitments to extend credit are agreements to lend to a customer, at the customer’s request, as long as there is no violation of any condition established in the contract. Commitments generally have fixed expiration dates or other termination clauses and may require the payment of a fee. Since a portion of the commitments are expected to expire without being drawn upon, the total commitment amounts do not necessarily represent future cash requirements. The Bank evaluates each customer's creditworthiness on a case-by-case basis. The amount of collateral obtained, if deemed necessary by the Bank upon extension of credit, is based on the loan type and on management's credit evaluation of the borrower. Collateral consists primarily of residential and commercial real estate and personal property. Forward commitments represent commitments to sell loans to a third party following the closing of the loan and are entered into in the normal course of business by the Bank.
The Bank issued standby letters of credit which guarantee the performance of customers to third parties. The standby letters of credit outstanding expire over the next 22 months and totaled $4.1 million at December 31, 2020 and $2.7 million at December 31, 2019. The letters of credit are collateralized primarily with commercial real estate mortgages. Draws on standby letters of credit would be initiated by the secured party under the terms of the underlying obligation. Since the conditions under which the Bank is required to fund the standby letters of credit may not materialize, the cash requirements are expected to be less than the total outstanding commitments.
The Company has certain obligations and commitments to make future payments under existing contracts. At December 31, 2020, the aggregate contractual obligations (excluding bank deposits) and commercial commitments were as follows:
|
Payments Due by Period |
||||||||||||||||||||
|
(Dollars in thousands) |
Total |
Less than 1 Year |
1-3 Years |
4-5 Years |
More than 5 Years |
|||||||||||||||
|
Contractual Obligations: |
||||||||||||||||||||
|
Annual rental commitments under non-cancellable operating leases |
$ | 3,379 | 896 | 1,739 | 744 | 0 | ||||||||||||||
|
Total contractual obligations |
$ | 3,379 | 896 | 1,739 | 744 | 0 | ||||||||||||||
|
Amount of Commitments Expiring by Period |
||||||||||||||||||||
|
Other Commercial Commitments: |
||||||||||||||||||||
|
Commercial lines of credit |
$ | 73,742 | 30,814 | 12,108 | 21,840 | 8,980 | ||||||||||||||
|
Commitments to lend |
29,153 | 9,634 | 2,159 | 553 | 16,807 | |||||||||||||||
|
Standby letters of credit |
4,309 | 4,234 | 75 | 0 | 0 | |||||||||||||||
|
Total other commercial commitments |
$ | 107,204 | 44,682 | 14,342 | 22,393 | 25,787 | ||||||||||||||
From time to time, the Company is party to legal proceedings arising out of its lending and deposit operations. The Company is, and expects to become, engaged in foreclosure proceedings, collection actions, and other litigation as part of its normal banking activities. Among the various current litigation matters, the Company is involved in a bankruptcy litigation claim where the bankruptcy trustee is attempting to recover $1.9 million related to the principal and interest payments made to the Bank prior to the bankruptcy filing of a former customer of the Bank.
The Company examines each legal matter, and, in those situations where it determines that a particular legal matter presents loss contingencies that are both probable and reasonably estimable, establishes an appropriate accrual. In many situations, the Company is not able to estimate reasonably possible losses due to the preliminary nature of the legal matter, as well as a variety of other factors and uncertainties. For those legal matters where the Company is able to estimate a range of reasonably possible losses, management currently estimates that the aggregate range of losses from all of our outstanding litigation is from $0 to $0.9 million in excess of the amounts accrued, if any. This estimated aggregate range is based on an assessment of the information currently available to the Company and the actual aggregate losses could be higher. However, the Company does not believe these losses are probable to occur at this time. The Company reassesses all of its potential loss positions based on the available information each quarter and the estimated range of reasonably possible losses may change in the future. The Company typically vigorously pursues all available defenses related to litigation but may consider other alternatives, including settlement, in situations where there is an opportunity to resolve a legal matter on terms that are considered to be favorable to the Company when considering the continued expense and distraction of defending against any particular legal action.
Based on the Company’s current understanding of all of the outstanding legal matters, management does not believe that judgments or settlements arising from any pending or threatened litigation, individually or in the aggregate, would have a material adverse effect on the consolidated financial condition or results of operations. However, litigation is unpredictable and the actual results of litigation cannot be determined with any certainty. Therefore, the ultimate aggregate resolution of any, or all, of the current outstanding legal matters could have a material adverse effect on the Company’s results of operations in the future.
NOTE 19 Derivative Instruments and Hedging Activities
The Company originates single family residential loans for sale into the secondary market and enters into commitments to sell those loans in order to mitigate the interest rate risk associated with holding the loans until they are sold. The Company accounts for its commitments in accordance with ASC 815, Accounting for Derivative Instruments and Hedging Activities.
The Company had commitments outstanding to extend credit to future borrowers that had not closed prior to the end of the year, which is referred to as its mortgage pipeline. As commitments to originate loans enter the mortgage pipeline, the Company generally enters into commitments to sell the loans into the secondary market. The commitments to originate and sell loans are derivatives that are recorded at fair value. The marking of these derivatives to fair value for the periods ended December 31, 2020 and 2019 did not have a material impact on the Company’s consolidated financial statements.
As of December 31, 2020 and 2019, the current commitments to sell loans held for sale are derivatives that do not qualify for hedge accounting. The loans held for sale that are not hedged are recorded at the lower of cost or market. The marking of these loans for the periods ended December 31, 2020 and 2019 did not have a material impact on the Company’s consolidated financial statements.
NOTE 20 Fair Value Measurement
ASC 820, Fair Value Measurements, establishes a framework for measuring the fair value of assets and liabilities using a hierarchy system consisting of three levels, based on the markets in which the assets and liabilities are traded and the reliability of the assumptions used to determine fair value. These levels are:
Level 1 - Valuation is based upon quoted prices for identical instruments traded in active markets that the Company has the ability to access.
Level 2 - Valuation is based upon quoted prices for similar instruments in active markets, quoted prices for identical or similar instruments in markets that are not active, and model-based valuation techniques for which significant assumptions are observable in the market.
Level 3 - Valuation is generated from model-based techniques that use significant assumptions not observable in the market and are used only to the extent that observable inputs are not available. These unobservable assumptions reflect our own estimates of assumptions that market participants would use in pricing the asset or liability. Valuation techniques include use of option pricing models, discounted cash flow models and similar techniques.
The following table summarizes the assets of the Company for which fair values are determined on a recurring basis as of December 31, 2020 and 2019.
|
Carrying Value at December 31, 2020 |
||||||||||||||||
|
(Dollars in thousands) |
Total |
Level 1 |
Level 2 |
Level 3 |
||||||||||||
|
Securities available for sale |
$ | 148,090 | 0 | 148,090 | 0 | |||||||||||
|
Equity securities |
149 | 0 | 149 | 0 | ||||||||||||
|
Mortgage loan commitments |
261 | 0 | 261 | 0 | ||||||||||||
|
Total |
$ | 148,500 | 0 | 148,500 | 0 | |||||||||||
|
Carrying Value at December 31, 2019 |
||||||||||||||||
|
(Dollars in thousands) |
Total |
Level 1 |
Level 2 |
Level 3 |
||||||||||||
|
Securities available for sale |
$ | 107,592 | 0 | 107,592 | 0 | |||||||||||
|
Equity securities |
167 | 0 | 167 | 0 | ||||||||||||
|
Mortgage loan commitments |
14 | 0 | 14 | 0 | ||||||||||||
|
Total |
$ | 107,773 | 0 | 107,773 | 0 | |||||||||||
The Company may also be required, from time to time, to measure certain other financial assets at fair value on a nonrecurring basis in accordance with generally accepted accounting principles. These adjustments to fair value usually result from the application of the lower-of-cost-or-market accounting or write downs of individual assets. For assets measured at fair value on a nonrecurring basis in 2020 and 2019 that were still held at December 31, the following table provides the level of valuation assumptions used to determine each adjustment and the carrying value of the related individual assets or portfolios at December 31, 2020 and 2019.
|
Carrying Value at December 31, 2020 |
||||||||||||||||||||
|
(Dollars in thousands) |
Total |
Level 1 |
Level 2 |
Level 3 |
Year Ended December 31, 2020 Total Gains (Losses) |
|||||||||||||||
|
Loans held for sale |
$ | 6,186 | 0 | 6,186 | 0 | 28 | ||||||||||||||
|
Mortgage servicing rights, net |
3,043 | 0 | 3,043 | 0 | 0 | |||||||||||||||
|
Impaired loans |
2,888 | 0 | 2,888 | 0 | (76 | ) | ||||||||||||||
|
Real estate, net |
636 | 0 | 636 | 0 | 0 | |||||||||||||||
|
Total |
$ | 12,753 | 0 | 12,753 | 0 | (48 | ) | |||||||||||||
|
Carrying Value at December 31, 2019 |
||||||||||||||||||||
|
(Dollars in thousands) |
Total |
Level 1 |
Level 2 |
Level 3 |
Year Ended December 31, 2019 Total (Losses) |
|||||||||||||||
|
Loans held for sale |
$ | 3,606 | 0 | 3,606 | 0 | (40 | ) | |||||||||||||
|
Mortgage servicing rights, net |
2,172 | 0 | 2,172 | 0 | 0 | |||||||||||||||
|
Impaired loans |
3,126 | 0 | 3,126 | 0 | (28 | ) | ||||||||||||||
|
Real estate, net |
580 | 0 | 580 | 0 | 0 | |||||||||||||||
|
Total |
$ | 9,484 | 0 | 9,484 | 0 | (68 | ) | |||||||||||||
NOTE 21 Fair Value of Financial Instruments
ASC 825, Disclosures about Fair Values of Financial Instruments, requires disclosure of the estimated fair values of the Company's financial instruments, including assets, liabilities and off-balance sheet items for which it is practicable to estimate fair value. The fair value estimates are made as of December 31, 2020 and 2019 based upon relevant market information, if available, and upon the characteristics of the financial instruments themselves. Because no market exists for a significant portion of the Company's financial instruments, fair value estimates are based upon judgments regarding future expected loss experience, current economic conditions, risk characteristics of various financial instruments and other factors. The estimates are subjective in nature and involve uncertainties and matters of significant judgment and therefore cannot be determined with precision. Changes in assumptions could significantly affect the estimates.
Fair value estimates are based only on existing financial instruments without attempting to estimate the value of anticipated future business or the value of assets and liabilities that are not considered financial instruments. In addition, the tax ramifications related to the realization of the unrealized gains and losses can have a significant effect on the fair value estimates and have not been considered in any of the estimates.
The estimated fair value of the Company's financial instruments is shown below. Following the table, there is an explanation of the methods and assumptions used to estimate the fair value of each class of financial instruments.
|
December 31, 2020 |
December 31, 2019 |
|||||||||||||||||||||||||||||||||
|
Fair Value Hierarchy |
||||||||||||||||||||||||||||||||||
|
(Dollars in thousands) |
Carrying Amount |
Estimated Fair Value |
Level 1 |
Level 2 |
Level 3 |
Contract Amount |
Carrying Amount |
Estimated Fair Value |
Contract Amount |
|||||||||||||||||||||||||
|
Financial assets: |
||||||||||||||||||||||||||||||||||
|
Cash and cash equivalents |
$ | 86,269 | 86,269 | 86,269 | 44,399 | 44,399 | ||||||||||||||||||||||||||||
|
Securities available for sale |
148,090 | 148,090 | 148,090 | 107,592 | 107,592 | |||||||||||||||||||||||||||||
|
Equity securities |
149 | 149 | 149 | 167 | 167 | |||||||||||||||||||||||||||||
|
Loans held for sale |
6,186 | 6,186 | 6,186 | 3,606 | 3,606 | |||||||||||||||||||||||||||||
|
Loans receivable, net |
642,630 | 648,275 | 648,275 | 596,392 | 600,863 | |||||||||||||||||||||||||||||
|
FHLB stock |
932 | 932 | 932 | 854 | 854 | |||||||||||||||||||||||||||||
|
Accrued interest receivable |
3,102 | 3,102 | 3,102 | 2,251 | 2,251 | |||||||||||||||||||||||||||||
|
Financial liabilities: |
||||||||||||||||||||||||||||||||||
|
Deposits |
795,204 | 795,927 | 795,927 | 673,870 | 673,945 | |||||||||||||||||||||||||||||
|
Accrued interest payable |
140 | 140 | 140 | 420 | 420 | |||||||||||||||||||||||||||||
|
Off-balance sheet financial instruments: |
||||||||||||||||||||||||||||||||||
|
Commitments to extend credit |
261 | 261 | 180,330 | 14 | 14 | 178,804 | ||||||||||||||||||||||||||||
|
Commitments to sell loans |
(44 | ) | (44 | ) | 24,746 | (16 | ) | (16 | ) | 10,098 | ||||||||||||||||||||||||
Cash and Cash Equivalents
The carrying amount of cash and cash equivalents approximates their fair value.
Securities Available for Sale
The fair values of securities were based upon quoted market prices.
Equity Securities
The fair values of equity securities were based upon quoted market prices.
Loans Held for Sale
The fair values of loans held for sale were based upon quoted market prices for loans with similar interest rates and terms to maturity.
Loans Receivable
The fair value of the loan portfolio, with the exception of the adjustable rate portfolio, was calculated by discounting the scheduled cash flows through the estimated maturity using anticipated prepayment speeds and using discount rates that reflect the credit and interest rate risk inherent in each loan portfolio. The fair value of the adjustable loan portfolio was estimated by grouping the loans with similar characteristics and comparing the characteristics of each group to the prices quoted for similar types of loans in the secondary market. The fair value disclosures for both the fixed and adjustable rate portfolios were adjusted to reflect the exit price amount anticipated to be received from the sale of the portfolio in an open market transaction as required by ASU 2016-01.
FHLB Stock
The carrying amount of FHLB stock approximates its fair value.
Accrued Interest Receivable
The carrying amount of accrued interest receivable approximates its fair value since it is short-term in nature and does not present unanticipated credit concerns.
Deposits
The fair value of demand deposits, savings accounts and certain money market account deposits is the amount payable on demand at the reporting date. The fair value of fixed maturity certificates of deposit is estimated using the rates currently offered for deposits of similar remaining maturities. The fair value disclosures for all of the deposits were adjusted to reflect the exit price amount anticipated to be received from the sale of the deposits in an open market transaction as required by ASU 2016-01.
Accrued Interest Payable
The carrying amount of accrued interest payable approximates its fair value since it is short-term in nature.
Commitments to Extend Credit
The fair values of commitments to extend credit are estimated using the fees normally charged to enter into similar agreements, taking into account the remaining terms of the agreements and the present creditworthiness of the counter parties.
Commitments to Sell Loans
The fair values of commitments to sell loans are estimated using the quoted market prices for loans with similar interest rates and terms to maturity.
NOTE 22 HMN Financial, Inc. Financial Information (Parent Company Only)
The following are the condensed financial statements for the parent company only as of December 31, 2020 and 2019 and for the years ended December 31, 2020, 2019 and 2018.
|
(Dollars in thousands) |
2020 |
2019 |
2018 |
|||||||||
|
Condensed Balance Sheets |
||||||||||||
|
Assets: |
||||||||||||
|
Cash and cash equivalents |
$ | 10,970 | 7,722 | |||||||||
|
Investment in subsidiaries |
91,558 | 84,507 | ||||||||||
|
Prepaid expenses and other assets |
891 | 610 | ||||||||||
|
Deferred tax asset, net |
14 | 24 | ||||||||||
|
Total assets |
$ | 103,433 | 92,863 | |||||||||
|
Liabilities and Stockholders' Equity: |
||||||||||||
|
Accrued expenses and other liabilities |
$ | 181 | 215 | |||||||||
|
Total liabilities |
181 | 215 | ||||||||||
|
Common stock |
91 | 91 | ||||||||||
|
Additional paid-in capital |
40,480 | 40,365 | ||||||||||
|
Retained earnings |
117,849 | 107,547 | ||||||||||
|
Net unrealized gains on securities available for sale |
1,282 | 46 | ||||||||||
|
Unearned employee stock ownership plan shares |
(1,450 | ) | (1,643 | ) | ||||||||
|
Treasury stock, at cost, 4,359,552 and 4,284,840 shares |
(55,000 | ) | (53,758 | ) | ||||||||
|
Total stockholders' equity |
103,252 | 92,648 | ||||||||||
|
Total liabilities and stockholders' equity |
$ | 103,433 | 92,863 | |||||||||
|
Condensed Statements of Income |
||||||||||||
|
Interest income |
$ | 43 | 21 | 0 | ||||||||
|
Equity income of subsidiaries |
10,815 | 8,627 | 8,800 | |||||||||
|
Compensation and benefits |
(243 | ) | (240 | ) | (221 | ) | ||||||
|
Occupancy and equipment |
(30 | ) | (30 | ) | (30 | ) | ||||||
|
Data processing |
(6 | ) | (6 | ) | (6 | ) | ||||||
|
Professional services |
(93 | ) | (131 | ) | (124 | ) | ||||||
|
Other |
(383 | ) | (367 | ) | (331 | ) | ||||||
|
Income before income tax benefit (expense) |
10,103 | 7,874 | 8,088 | |||||||||
|
Income tax benefit (expense) |
199 | (81 | ) | 148 | ||||||||
|
Net income |
$ | 10,302 | 7,793 | 8,236 | ||||||||
|
Condensed Statements of Cash Flows |
||||||||||||
|
Cash flows from operating activities: |
||||||||||||
|
Net income |
$ | 10,302 | 7,793 | 8,236 | ||||||||
|
Adjustments to reconcile net income to cash used by operating activities: |
||||||||||||
|
Equity income of subsidiaries |
(10,815 | ) | (8,627 | ) | (8,800 | ) | ||||||
|
Deferred income tax benefit |
10 | 71 | 46 | |||||||||
|
Earned employee stock ownership shares priced above original cost |
145 | 230 | 206 | |||||||||
|
Stock option compensation |
0 | 1 | 17 | |||||||||
|
Amortization of restricted stock awards |
238 | 187 | 134 | |||||||||
|
Decrease in unearned ESOP shares |
193 | 193 | 194 | |||||||||
|
Decrease (increase) in other assets |
(281 | ) | 1,404 | (146 | ) | |||||||
|
Decrease in other liabilities |
(34 | ) | (18 | ) | (20 | ) | ||||||
|
Other, net |
0 | (1 | ) | (1 | ) | |||||||
|
Net cash (used) provided by operating activities |
(242 | ) | 1,233 | (134 | ) | |||||||
|
Cash flows from financing activities: |
||||||||||||
|
Warrants purchased |
0 | 0 | (6,453 | ) | ||||||||
|
Excess tax benefit from options exercised |
0 | 0 | 64 | |||||||||
|
Treasury stock purchased |
(1,450 | ) | 0 | 0 | ||||||||
|
Stock awards withheld for tax withholding |
(60 | ) | (45 | ) | 0 | |||||||
|
Dividends received from Bank |
5,000 | 5,000 | 6,000 | |||||||||
|
Net cash provided (used) by financing activities |
3,490 | 4,955 | (389 | ) | ||||||||
|
Increase (decrease) in cash and cash equivalents |
3,248 | 6,188 | (523 | ) | ||||||||
|
Cash and cash equivalents, beginning of year |
7,722 | 1,534 | 2,057 | |||||||||
|
Cash and cash equivalents, end of year |
$ | 10,970 | 7,722 | 1,534 | ||||||||
NOTE 23 Business Segments
The Bank has been identified as a reportable operating segment in accordance with the provisions of ASC 280. HMN, the holding company, did not meet the quantitative thresholds for a reportable segment and therefore is included in the “Other” category. The Company evaluates performance and allocates resources based on the segment’s net income, return on average assets and return on average equity. Each corporation is managed separately with its own officers and board of directors.
The following table sets forth certain information about the reconciliations of reported net income and assets for each of the Company’s reportable segments.
|
(Dollars in thousands) |
Home Federal Savings Bank |
Other |
Eliminations |
Consolidated Total |
||||||||||||
|
At or for the year ended December 31, 2020: |
||||||||||||||||
|
Interest income – external customers |
$ | 31,959 | 0 | 0 | 31,959 | |||||||||||
|
Non-interest income – external customers |
14,954 | 0 | 0 | 14,954 | ||||||||||||
|
Intersegment interest income |
0 | 43 | (43 | ) | 0 | |||||||||||
|
Intersegment non-interest income |
234 | 10,815 | (11,049 | ) | 0 | |||||||||||
|
Interest expense |
2,894 | 0 | (43 | ) | 2,851 | |||||||||||
|
Provision for loan losses |
2,699 | 0 | 0 | 2,699 | ||||||||||||
|
Non-interest expense |
26,472 | 755 | (234 | ) | 26,993 | |||||||||||
|
Income tax expense (benefit) |
4,267 | (199 | ) | 0 | 4,068 | |||||||||||
|
Net income |
10,815 | 10,302 | (10,815 | ) | 10,302 | |||||||||||
|
Total assets |
909,605 | 103,433 | (103,458 | ) | 909,580 | |||||||||||
|
At or for the year ended December 31, 2019: |
||||||||||||||||
|
Interest income – external customers |
$ | 31,890 | 0 | 0 | 31,890 | |||||||||||
|
Non-interest income – external customers |
8,455 | 0 | 0 | 8,455 | ||||||||||||
|
Intersegment interest income |
0 | 21 | (21 | ) | 0 | |||||||||||
|
Intersegment non-interest income |
234 | 8,627 | (8,861 | ) | 0 | |||||||||||
|
Interest expense |
3,360 | 0 | (21 | ) | 3,339 | |||||||||||
|
Provision for loan losses |
(1,216 | ) | 0 | 0 | (1,216 | ) | ||||||||||
|
Non-interest expense |
26,565 | 774 | (234 | ) | 27,105 | |||||||||||
|
Income tax expense |
3,243 | 81 | 0 | 3,324 | ||||||||||||
|
Net income |
8,627 | 7,793 | (8,627 | ) | 7,793 | |||||||||||
|
Total assets |
777,083 | 92,863 | (92,307 | ) | 777,639 | |||||||||||
|
At or for the year ended December 31, 2018: |
||||||||||||||||
|
Interest income – external customers |
$ | 30,381 | 0 | 0 | 30,381 | |||||||||||
|
Non-interest income – external customers |
7,714 | 0 | 0 | 7,714 | ||||||||||||
|
Intersegment non-interest income |
222 | 8,800 | (9,022 | ) | 0 | |||||||||||
|
Interest expense |
2,233 | 0 | 0 | 2,233 | ||||||||||||
|
Provision for loan losses |
(649 | ) | 0 | 0 | (649 | ) | ||||||||||
|
Non-interest expense |
24,897 | 712 | (222 | ) | 25,387 | |||||||||||
|
Income tax expense (benefit) |
3,036 | (148 | ) | 0 | 2,888 | |||||||||||
|
Net income |
8,800 | 8,236 | (8,800 | ) | 8,236 | |||||||||||
|
Total assets |
710,281 | 83,380 | (81,346 | ) | 712,315 | |||||||||||

REPORT OF INDEPENDENT REGISTERED PUBLIC ACCOUNTING FIRM
To the Stockholders and the Board of Directors of HMN Financial, Inc.
Opinion on the Financial Statements
We have audited the accompanying consolidated balance sheets of HMN Financial, Inc. and Subsidiaries (the Company) as of December 31, 2020 and 2019, the related consolidated statements of comprehensive income, stockholders’ equity and cash flows for each of the three years in the period ended December 31, 2020, and the related notes (collectively referred to as the “financial statements”). In our opinion, the financial statements present fairly, in all material respects, the financial position of the Company as of December 31, 2020 and 2019, and the results of its operations and its cash flows for each of the three years in the period ended December 31, 2020, in conformity with accounting principles generally accepted in the United States of America.
Basis for Opinion
These financial statements are the responsibility of the Company’s management. Our responsibility is to express an opinion on the Company’s financial statements based on our audits. We are a public accounting firm registered with the Public Company Accounting Oversight Board (United States) (PCAOB) and are required to be independent with respect to the Company in accordance with the U.S. federal securities laws and the applicable rules and regulations of the Securities and Exchange Commission and the PCAOB.
We conducted our audits in accordance with the standards of the PCAOB. Those standards require that we plan and perform the audit to obtain reasonable assurance about whether the financial statements are free of material misstatement, whether due to error or fraud. The Company is not required to have, nor were we engaged to perform, an audit of its internal control over financial reporting. As part of our audit we are required to obtain an understanding of internal control over financial reporting but not for the purpose of expressing an opinion on the effectiveness of the Company’s internal control over financial reporting. Accordingly, we express no such opinion.
Our audits included performing procedures to assess the risks of material misstatement of the financial statements, whether due to error or fraud, and performing procedures that respond to those risks. Such procedures included examining, on a test basis, evidence regarding the amounts and disclosures in the financial statements. Our audits also included evaluating the accounting principles used and significant estimates made by management, as well as evaluating the overall presentation of the financial statements. We believe that our audits provide a reasonable basis for our opinion.
Critical Audit Matters
The critical audit matter communicated below is a matter arising from the current period audit of the financial statements that was communicated or required to be communicated to the audit committee and that: (1) relates to accounts or disclosures that are material to the financial statements and (2) involved our especially challenging, subjective, or complex judgments. The communication of the critical audit matter does not alter in any way our opinion on the financial statements, taken as a whole, and we are not, by communicating the critical audit matter below, providing a separate opinion on the critical audit matter or on the accounts or disclosures to which it relates.
Allowance for loan losses
As described in Notes 1 and 6 to the financial statements, the Company’s allowance for loan losses is a valuation account that reflects the Company’s estimate of incurred losses in its loan portfolio to the extent they are both probable and reasonable to estimate. The allowance for loan losses was $10.7 million at December 31, 2020, which consists of two components (i) specific reserves based on probable losses on specific loans (specific reserves), representing $0.2 million, and (ii) a general allowance based on historical loan loss experience, general economic conditions and other qualitative risk factors, both internal and external to the Company (general reserves), representing $10.5 million. The general component of the allowance for loan losses is based on a variety of risk considerations, both quantitative and qualitative. Quantitative factors include the Company’s historical loss experience, delinquency and charge-off trends, risk ratings, collateral values, known information about individual loans and other factors. Qualitative factors include various considerations regarding the general economic environment in the Company’s market area and national economic factors. The qualitative adjustment for the general reserve includes management’s consideration of industry concentrations; specific credit risks; credit loss experience; current loan portfolio quality; present economic, political and regulatory conditions; and unidentified losses inherent in the current loan portfolio.
The qualitative adjustment contributes significantly to the general reserve component of the allowance for loan losses. Management’s identification and analysis of these considerations and related adjustments requires significant judgment and could have a significant effect on the allowance for loan losses. We identified the estimate of the qualitative adjustment of the general reserve for the allowance for loan losses as a critical audit matter as they represent a significant portion of the total general reserve and because management’s estimate relies on a qualitative analysis to determine a quantitative adjustment which required especially subjective auditor judgment.
The primary procedures we performed to address this critical audit matter included:
|
|
● |
Performing substantive testing, including evaluating management’s judgments and assumptions for developing the general reserve qualitative adjustments for the allowance for loan losses, including: |
|
|
o |
Evaluating the completeness and accuracy of data inputs used as a basis for the adjustments relating to qualitative general reserve factors and considering whether the sources of data and factors that management used in forming the assumptions are relevant, reliable, and sufficient for the purpose based on the information gathered. |
|
|
o |
Assessing the accuracy of management’s risk ratings for commercial real estate and commercial business loans. Our evaluation considered evidence from management’s credit presentations and annual reviews, including review of borrower financial information, collateral values, payment history, and other credit specific information. |
|
|
o |
Evaluating the reasonableness of management’s judgments related to the qualitative and quantitative assessment of the data used in the determination of the general reserve qualitative adjustments for consistency with each other, the supporting data, relevant historical data, and industry data. |
|
|
o |
Assessing whether historical data is comparable and consistent with data of the current year and considering whether the data is sufficiently reliable. Among other procedures, our evaluation considered evidence from internal and external sources, loan portfolio performance and whether such assumptions were applied consistently period to period. |
|
|
o |
Analytically evaluating the qualitative adjustment in the current year compared to prior year for directional consistency and reasonableness. |
|
|
o |
Testing the calculations used by management to translate the assumptions and key factors into the calculation. |

CliftonLarsonAllen LLP
We have served as the Company’s auditor since 2014.
Minneapolis, Minnesota
March 5, 2021
Other Financial Data
The following tables set forth certain information as to the Bank’s FHLB advances and other borrowings.
|
Year Ended December 31, |
||||||||||||
|
(Dollars in thousands) |
2020 |
2019 |
2018 |
|||||||||
|
Maximum Balance: |
||||||||||||
|
FHLB advances and other borrowings |
$ | 2 | 13,800 | 6,800 | ||||||||
|
FHLB short-term advances and other borrowings |
2 | 13,800 | 6,800 | |||||||||
|
Average Balance: |
||||||||||||
|
FHLB advances and other borrowings |
0 | 287 | 140 | |||||||||
|
FHLB short-term advances and other borrowings |
0 | 287 | 140 | |||||||||
See “Note 12 Federal Home Loan Bank (FHLB) Advances and Other Borrowings” in the Notes to Consolidated Financial Statements for more information on the Bank’s FHLB advances and other borrowings.
Selected Quarterly Financial Data
|
(Dollars in thousands, except per share data) |
December 31, 2020 |
September 30, 2020 |
June 30, 2020 |
|||||||||
| Selected Operations Data (3 months ended): | ||||||||||||
|
Interest income |
$ | 8,283 | 7,949 | 7,883 | ||||||||
|
Interest expense |
558 | 656 | 745 | |||||||||
|
Net interest income |
7,725 | 7,293 | 7,138 | |||||||||
|
Provision for loan losses |
1,151 | 770 | 318 | |||||||||
|
Net interest income after provision for loan losses |
6,574 | 6,523 | 6,820 | |||||||||
|
Non-interest income: |
||||||||||||
|
Fees and service charges |
741 | 753 | 669 | |||||||||
|
Loan servicing fees |
380 | 347 | 297 | |||||||||
|
Gain on sales of loans |
3,028 | 3,005 | 2,364 | |||||||||
|
Other |
344 | 291 | 264 | |||||||||
|
Total non-interest income |
4,493 | 4,396 | 3,594 | |||||||||
|
Non-interest expense: |
||||||||||||
|
Compensation and benefits |
3,884 | 3,916 | 3,799 | |||||||||
|
Occupancy and equipment |
1,094 | 1,101 | 1,111 | |||||||||
|
Data processing |
351 | 334 | 321 | |||||||||
|
Professional services |
230 | 241 | 447 | |||||||||
|
Other |
1,184 | 1,004 | 975 | |||||||||
|
Total non-interest expense |
6,743 | 6,596 | 6,653 | |||||||||
|
Income before income tax expense |
4,324 | 4,323 | 3,761 | |||||||||
|
Income tax expense |
1,199 | 1,222 | 1,070 | |||||||||
|
Net income |
$ | 3,125 | 3,101 | 2,691 | ||||||||
|
Basic earnings per common share |
$ | 0.68 | 0.67 | 0.58 | ||||||||
|
Diluted earnings per common share |
$ | 0.67 | 0.67 | 0.58 | ||||||||
|
Financial Ratios: |
||||||||||||
|
Return on average assets(1) |
1.37 |
% |
1.39 |
% |
1.29 |
% |
||||||
|
Return on average common equity(1) |
12.18 | 12.50 | 11.31 | |||||||||
|
Average equity to average assets |
11.43 | 11.50 | 11.72 | |||||||||
|
Net interest margin(1)(2) |
3.51 | 3.40 | 3.57 | |||||||||
|
(Dollars in thousands) |
||||||||||||
|
Selected Financial Condition Data (end of period): |
||||||||||||
|
Total assets |
$ | 909,580 | 898,452 | 862,783 | ||||||||
|
Securities available for sale: |
||||||||||||
|
Mortgage-backed and related securities |
101,464 | 71,458 | 50,593 | |||||||||
|
Other marketable securities |
46,626 | 47,106 | 47,200 | |||||||||
|
Loans held for sale |
6,186 | 7,225 | 5,167 | |||||||||
|
Loans receivable, net |
642,630 | 670,297 | 668,432 | |||||||||
|
Deposits |
795,204 | 787,023 | 752,759 | |||||||||
|
Stockholders’ equity |
103,252 | 101,143 | 98,115 | |||||||||
(1) Annualized
(2) Net interest income divided by average interest-earning assets
|
March 31, 2020 |
December 31, 2019 |
September 30, 2019 |
June 30, 2019 |
March 31, 2019 |
|||||||||||||||
| 7,844 | 7,861 | 7,998 | 8,299 | 7,732 | |||||||||||||||
| 892 | 914 | 906 | 829 | 690 | |||||||||||||||
| 6,952 | 6,947 | 7,092 | 7,470 | 7,042 | |||||||||||||||
| 460 | 236 | (420 | ) | (1,059 | ) | 27 | |||||||||||||
| 6,492 | 6,711 | 7,512 | 8,529 | 7,015 | |||||||||||||||
| 714 | 795 | 820 | 785 | 700 | |||||||||||||||
| 332 | 321 | 324 | 318 | 315 | |||||||||||||||
| 1,134 | 1,106 | 845 | 611 | 379 | |||||||||||||||
| 291 | 294 | 238 | 307 | 297 | |||||||||||||||
| 2,471 | 2,516 | 2,227 | 2,021 | 1,691 | |||||||||||||||
| 4,047 | 4,163 | 3,849 | 3,737 | 3,910 | |||||||||||||||
| 1,123 | 1,158 | 1,142 | 1,081 | 1,061 | |||||||||||||||
| 308 | 338 | 319 | 305 | 301 | |||||||||||||||
| 487 | 492 | 428 | 381 | 272 | |||||||||||||||
| 1,036 | 1,193 | 1,009 | 1,063 | 903 | |||||||||||||||
| 7,001 | 7,344 | 6,747 | 6,567 | 6,447 | |||||||||||||||
| 1,962 | 1,883 | 2,992 | 3,983 | 2,259 | |||||||||||||||
| 577 | 647 | 916 | 1,121 | 640 | |||||||||||||||
| 1,385 | 1,236 | 2,076 | 2,862 | 1,619 | |||||||||||||||
| 0.30 | 0.27 | 0.45 | 0.62 | 0.35 | |||||||||||||||
| 0.30 | 0.27 | 0.45 | 0.62 | 0.35 | |||||||||||||||
| 0.72 |
% |
0.64 |
% |
1.11 |
% |
1.60 |
% |
0.91 |
% |
||||||||||
| 5.93 | 5.29 | 9.10 | 13.10 | 7.67 | |||||||||||||||
| 12.07 | 12.06 | 12.07 | 12.01 | 11.82 | |||||||||||||||
| 3.76 | 3.76 | 3.97 | 4.35 | 4.11 | |||||||||||||||
| 784,200 | 777,639 | 763,228 | 722,767 | 722,745 | |||||||||||||||
| 53,687 | 54,851 | 22,187 | 7,435 | 7,743 | |||||||||||||||
| 47,252 | 52,741 | 62,665 | 72,469 | 72,044 | |||||||||||||||
| 4,884 | 3,606 | 7,819 | 5,912 | 3,292 | |||||||||||||||
| 617,645 | 596,392 | 583,102 | 595,757 | 599,462 | |||||||||||||||
| 677,519 | 673,870 | 659,608 | 623,510 | 626,592 | |||||||||||||||
| 95,035 | 92,648 | 91,190 | 88,811 | 85,350 | |||||||||||||||
The common stock of the Company is listed on the Nasdaq Stock Market (Nasdaq) under the symbol HMNF. As of December 31, 2020, there were 451 stockholders of record and 946 estimated beneficial stockholders. The Company has not paid a dividend on its common stock during the two year period ending December 31, 2020. See “Liquidity and Capital Resources – Dividends” in the “Management Discussion and Analysis” section of this annual report for a description of restrictions on the ability of the Company and the Bank to pay dividends.
The following graph and table compare the total cumulative stockholders’ return on the Company’s common stock to the Nasdaq U.S. Stock Index (“Nasdaq Composite”), which includes all Nasdaq traded stocks of U.S. companies, and the Nasdaq Bank Index. The graph and table assume that $100 was invested on December 31, 2015 and that any dividends were reinvested.
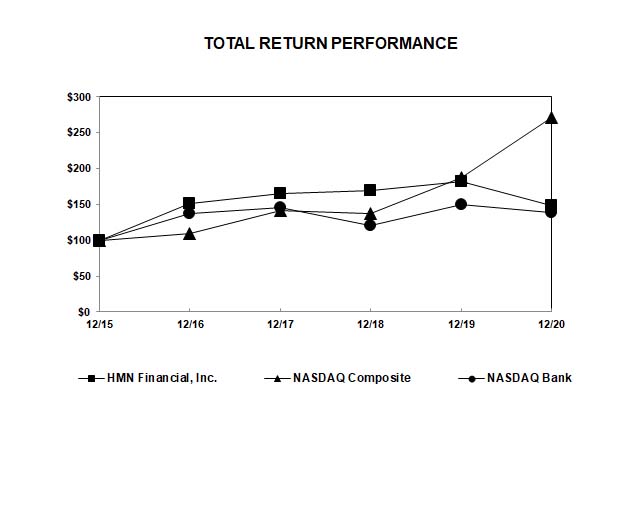
|
Index |
12/31/15 |
12/31/16 |
12/31/17 |
12/31/18 |
12/31/19 |
12/31/20 |
||||||||||||||||||
|
HMN Financial, Inc. |
$ | 100.00 | $ | 151.12 | $ | 165.37 | $ | 169.87 | $ | 181.90 | $ | 148.92 | ||||||||||||
|
Nasdaq Composite |
$ | 100.00 | $ | 108.87 | $ | 141.13 | $ | 137.12 | $ | 187.44 | $ | 271.64 | ||||||||||||
|
Nasdaq Bank |
$ | 100.00 | $ | 137.14 | $ | 145.21 | $ | 120.76 | $ | 150.06 | $ | 138.59 | ||||||||||||
|
HMN Financial, Inc. 1016 Civic Center Drive NW Rochester, MN 55901 (507) 535-1200
Annual Meeting The annual meeting of shareholders will be held virtually on Tuesday, April 27, 2021 at 10:00 a.m. (Central Time).
Legal Counsel Faegre Drinker Biddle & Reath LLP 2200 Wells Fargo Center 90 South Seventh Street Minneapolis, MN 55402-3901
Independent Registered Public Accounting Firm CliftonLarsonAllen LLP 220 South Sixth Street, Suite 300 Minneapolis, MN 55402-1436
Investor Information and Form 10-K HMN’s Form 10-K, filed with the Securities and Exchange Commission, is available without charge upon written request from: HMN Financial, Inc. Attn: Cindy Hamlin, Investor Relations 1016 Civic Center Drive NW Rochester, MN 55901 or at www.hmnf.com
Transfer Agent and Registrar Inquiries regarding change of address, transfer requirements, and lost certificates should be directed to HMN’s transfer agent: Equiniti Trust Company EQ Shareowner Services 1110 Centre Pointe Curve, Suite 101 Mendota Heights, MN 55120 www.shareowneronline.com (800) 468-9716 |
Directors Dr. Wendy S. Shannon Chair of the Board HMN and Home Federal Savings Bank
Allen J. Berning Chief Executive Officer Ambient Clinical Analytics, a provider of clinical decision support products
Sequoya S. Borgman Michael A. Bue Retired President and Chief Executive Officer Marquette Bank Rochester
Bradley C. Krehbiel President and Chief Executive Officer HMN and Home Federal Savings Bank
Bernard R. Nigon Retired Audit Partner with RSM US LLP (formerly McGladrey & Pullen, LLP)
Dr. Hugh C. Smith Retired Professor of Medicine, Mayo Clinic College of Medicine and Consultant in Cardiovascular Division, Mayo Clinic
Attorney at law, Wendland Utz, Ltd.
Hans K. Zietlow Former Director of Real Estate for Kwik Trip, Inc.
Executive Officers Who Are Not Directors Jon J. Eberle Senior Vice President, Chief Financial Officer and Treasurer of HMN and Executive Vice President, Chief Financial Officer and Treasurer of Home Federal Savings Bank
Lawrence D. McGraw Executive Vice President and Chief Operating Officer Home Federal Savings Bank |
Eagan 2805 Dodd Road, Suite 160 Eagan, MN 55121 (651) 405-2000
Kasson 502 South Mantorville Avenue (507) 634-7022
La Crescent 208 South Walnut La Crescent, MN 55947 (507) 895-9200
Marshalltown 303 West Main Street Marshalltown, IA 50158 (641) 754-6198
Owatonna 1015 West Frontage Road, Suite 100 Owatonna, MN 55060
Pewaukee (262) 337-9511
Rochester 1201 South Broadway Rochester, MN 55904 (507) 536-2416
1016 Civic Center Drive NW Rochester, MN 55901 (507) 535-1309
100 1st Avenue Bldg., Suite 200 Rochester, MN 55902 (507) 280-7250
2048 Superior Drive NW, Suite 400 Rochester, MN 55901 (507) 226-0800
Spring Valley 715 North Broadway Spring Valley, MN 55975 (507) 346-9709
|
||
|
Branch Offices of the Bank Albert Lea 143 West Clark Street Albert Lea, MN 56007 (507) 379-2551 |
Winona 175 Center Street Winona, MN 55987 (507) 453-6460
|
|||
|
Austin 201 Oakland Avenue West Austin, MN 55912 (507) 434-2500 |
Loan Production Offices Sartell 50 14th Ave E, Suite 100 (320) 654-4020 |