Attached files
| file | filename |
|---|---|
| EX-32.2 - EX-32.2 - Vroom, Inc. | vrm-ex322_8.htm |
| EX-32.1 - EX-32.1 - Vroom, Inc. | vrm-ex321_10.htm |
| EX-31.2 - EX-31.2 - Vroom, Inc. | vrm-ex312_7.htm |
| EX-31.1 - EX-31.1 - Vroom, Inc. | vrm-ex311_9.htm |
| EX-23.1 - EX-23.1 - Vroom, Inc. | vrm-ex231_1035.htm |
| EX-21.1 - EX-21.1 - Vroom, Inc. | vrm-ex211_962.htm |
| EX-10.25 - EX-10.25 - Vroom, Inc. | vrm-ex1025_1623.htm |
| EX-10.19 - EX-10.19 - Vroom, Inc. | vrm-ex1019_994.htm |
| EX-10.18 - EX-10.18 - Vroom, Inc. | vrm-ex1018_813.htm |
| EX-10.17 - EX-10.17 - Vroom, Inc. | vrm-ex1017_812.htm |
| EX-10.15 - EX-10.15 - Vroom, Inc. | vrm-ex1015_995.htm |
| EX-10.14 - EX-10.14 - Vroom, Inc. | vrm-ex1014_1407.htm |
| EX-10.11 - EX-10.11 - Vroom, Inc. | vrm-ex1011_1117.htm |
| EX-10.5 - EX-10.5 - Vroom, Inc. | vrm-ex105_992.htm |
| EX-10.4 - EX-10.4 - Vroom, Inc. | vrm-ex104_993.htm |
| EX-4.3 - EX-4.3 - Vroom, Inc. | vrm-ex43_991.htm |
UNITED STATES
SECURITIES AND EXCHANGE COMMISSION
WASHINGTON, D.C. 20549
FORM 10-K
|
☒ |
ANNUAL REPORT PURSUANT TO SECTION 13 OR 15(d) OF THE SECURITIES EXCHANGE ACT OF 1934 |
For the fiscal year ended December 31, 2020
or
|
☐ |
TRANSITION REPORT PURSUANT TO SECTION 13 OR 15(d) OF THE SECURITIES EXCHANGE ACT OF 1934 |
For the transition period from to
Commission File Number: 001-39315
VROOM, INC.
(Exact name of registrant as specified in its charter)
|
Delaware |
|
901112566 |
|
(State or other jurisdiction of incorporation or organization) |
|
(I.R.S. Employer Identification Number) |
1375 Broadway, Floor 11
New York, New York 10018
(Address of principal executive offices) (Zip code)
(855) 524-1300
(Registrant's telephone number, including area code)
Securities registered pursuant to Section 12(b) of the Act:
|
Title of each class |
|
Trading Symbol(s) |
|
Name of each exchange on which registered |
|
Common Stock, $0.001 par value |
|
VRM |
|
Nasdaq Global Select |
Securities registered pursuant to Section 12(g) of the Act: None.
Indicate by check mark if the Registrant is a well-known seasoned issuer, as defined in Rule 405 of the Securities Act. YES ☐ NO ☒
Indicate by check mark if the Registrant is not required to file reports pursuant to Section 13 or Section 15(d) of the Act. YES ☐ NO ☒
Indicate by check mark whether the Registrant: (1) has filed all reports required to be filed by Section 13 or 15(d) of the Securities Exchange Act of 1934 during the preceding 12 months (or for such shorter period that the Registrant was required to file such reports), and (2) has been subject to such filing requirements for the past 90 days. YES ☒ NO ☐
Indicate by check mark whether the Registrant has submitted electronically every Interactive Data File required to be submitted pursuant to Rule 405 of Regulation S-T (§232.405 of this chapter) during the preceding 12 months (or for such shorter period that the Registrant was required to submit such files). YES ☒ NO ☐
Indicate by check mark whether the registrant is a large accelerated filer, an accelerated filer, a non-accelerated filer, a smaller reporting company, or an emerging growth company. See the definitions of "large accelerated filer," "accelerated filer," "smaller reporting company," and "emerging growth company" in Rule 12b-2 of the Exchange Act.
|
Large accelerated filer |
☐ |
Accelerated filer |
☐ |
|
Non-accelerated filer |
☒ |
Smaller reporting company |
☐ |
|
|
|
Emerging growth company |
☐ |
If an emerging growth company, indicate by check mark if the registrant has elected not to use the extended transition period for complying with any new or revised financial accounting standards provided pursuant to Section 13(a) of the Exchange Act. ☐
Indicate by check mark whether the registrant has filed a report on and attestation to its management’s assessment of the effectiveness of its internal control over financial reporting under Section 404(b) of the Sarbanes-Oxley Act (15 U.S.C. 7262(b)) by the registered public accounting firm that prepared or issued its audit report. ☐
Indicate by check mark whether the registrant is a shell company (as defined in Rule 12b-2 of the Exchange Act). Yes ☐ No ☒
As of June 30, 2020, the aggregate market value of the common stock of the registrant held by non-affiliates was $4.8 billion based on the closing price of the common stock on the Nasdaq Global Select Market of the Nasdaq Stock Market LLC on such date.
As of March 1, 2021, 135,599,684 shares of the registrants’ common stock were outstanding.
DOCUMENTS INCORPORATED BY REFERENCE
The information required to be furnished pursuant to Part III of this Annual Report on Form 10-K will be set forth in, and incorporated by reference from, the registrant’s definitive proxy statement for the annual meeting of stockholders which will be filed with the Securities and Exchange Commission no later than 120 days after the end of the fiscal year ended December 31, 2020.
|
|
|
Page |
|
|
|
|
|
5 |
||
|
Item 1. |
5 |
|
|
Item 1A. |
20 |
|
|
Item 1B. |
49 |
|
|
Item 2. |
49 |
|
|
Item 3. |
49 |
|
|
Item 4. |
49 |
|
|
|
|
|
|
53 |
||
|
Item 5. |
53 |
|
|
Item 6. |
55 |
|
|
Item 7. |
Management’s Discussion and Analysis of Financial Condition and Results of Operations |
56 |
|
Item 7A. |
79 |
|
|
Item 8. |
80 |
|
|
Item 9. |
Changes in and Disagreements with Accountants on Accounting and Financial Disclosure |
110 |
|
Item 9A. |
110 |
|
|
Item 9B. |
111 |
|
|
|
|
|
|
112 |
||
|
Item 10. |
112 |
|
|
Item 11. |
112 |
|
|
Item 12. |
Security Ownership of Certain Beneficial Owners and Management and Related Stockholder Matters |
112 |
|
Item 13. |
Certain Relationships and Related Transactions, and Director Independence |
112 |
|
Item 14. |
112 |
|
|
|
|
|
|
113 |
||
|
Item 15 |
113 |
|
|
|
113 |
|
|
Item 16. |
116 |
|
|
|
117 |
|
2
SPECIAL NOTE REGARDING FORWARD-LOOKING STATEMENTS
This Annual Report on Form 10-K contains forward-looking statements within the meaning of Section 27A of the Securities Act of 1933, as amended, (the "Securities Act"), and Section 21E of the Securities Exchange Act of 1934, as amended, (the "Exchange Act"), about us and our industry that involve substantial risks and uncertainties. All statements other than statements of historical facts contained in this Annual Report on Form 10-K, including statements regarding our future results of operations and financial condition, business strategy, and plans and objectives of management for future operations, are forward-looking statements. In some cases, forward-looking statements may be identified by words such as "anticipate," "believe," “contemplate,” "continue," "could," "design," "estimate," "expect," "intend," "may," "plan," "potentially," "predict," "project," "should," “target,” "will," “would,” or the negative of these terms or other similar terms or expressions, although not all forward-looking statements contain these identifying words.
The forward-looking statements in this Annual Report on Form 10-K are only predictions. Forward-looking statements are based on our management’s beliefs and assumptions and on information currently available. These forward-looking statements are subject to a number of known and unknown risks, uncertainties, assumptions, and other important factors that may cause our actual results, performance or achievements to be materially different from any future results, performance or achievements expressed or implied by the forward-looking statements, including risks described in the sections titled "Risk Factors," “Summary Risk Factors” and elsewhere in this Annual Report on Form 10-K.
Other sections of this Annual Report on Form 10-K include additional factors that could harm our business and financial performance. Moreover, we operate in a very competitive and rapidly changing environment. New risk factors emerge from time to time, and it is not possible for our management to predict all risk factors nor can we assess the impact of all factors on our business or the extent to which any factor, or combination of factors, may cause actual results to differ from those contained in, or implied by, any forward-looking statements.
You should not rely upon forward-looking statements as predictions of future events. We cannot assure you that the events and circumstances reflected in the forward-looking statements will be achieved or occur. Although we believe that the expectations reflected in the forward-looking statements are reasonable, we cannot guarantee future results, levels of activity, performance or achievements. These forward-looking statements speak only as of the date of this Annual Report on Form 10-K. Except as required by law, we undertake no obligation to update publicly any forward-looking statements for any reason after the date of this report or to conform these statements to actual results or to changes in our expectations. You should read this Annual Report on Form 10-K and the documents that we reference or incorporate by reference in this Annual Report on Form 10-K and have filed as exhibits to this report with the understanding that our actual future results, levels of activity, performance, and achievements may be materially different from what we expect. We qualify all of our forward-looking statements by these cautionary statements.
3
SUMMARY RISK FACTORS
Our business is subject to numerous risks and uncertainties, including those described in Part I, Item 1A. “Risk Factors” in this Annual Report on Form 10-K. You should carefully consider these risks and uncertainties when investing in our common stock. The principal risks and uncertainties affecting our business include, but are not limited to, the following:
|
|
• |
the impact of the COVID-19 pandemic; |
|
|
• |
we have a history of losses and we may not achieve or maintain profitability in the future; |
|
|
• |
we may not be able to generate sufficient revenue to generate positive cash flow on a sustained basis, and our revenue growth rate may decline; |
|
|
• |
we have a limited operating history and are still building out our foundational systems; |
|
|
• |
our recent, rapid growth may not be indicative of our future growth; |
|
|
• |
if we continue to grow rapidly, we may not be able to manage our growth effectively; |
|
|
• |
our business is subject to certain risks related to the operation of Texas Direct Auto; |
|
|
• |
we rely on third-party vendors for key components of our business, which exposes us to increased risks; |
|
|
• |
we have entered into outsourcing arrangements with third parties related to our customer experience team, and any difficulties experienced in these arrangements could result in an interruption of our ability to sell our vehicles and value-added products; |
|
|
• |
if the quality of our customer experience, our reputation or our brand were negatively affected, our business, sales and results of operations could be materially and adversely affected; |
|
|
• |
we face a variety of risks associated with the operation of our vehicle reconditioning centers by us and our third-party service providers, any of which could materially and adversely affect our business, financial condition and results of operations; |
|
|
• |
we rely primarily on third-party carriers to transport our vehicle inventory throughout the United States. Thus, we are subject to business risks and costs associated with such carriers and with the transportation industry, many of which are out of our control; |
|
|
• |
we are expanding our proprietary logistics operations, including vehicle pick-ups and delivery from our last mile hubs and line haul transportation of vehicles between our last mile hubs, which will further expose us to increased risks related to ownership of infrastructure and the transportation of vehicles; |
|
|
• |
the current geographic concentration where we provide reconditioning services and store inventory creates an exposure to local and regional downturns or severe weather or catastrophic occurrences that may materially and adversely affect our business, financial condition and results of operations; |
|
|
• |
if we sustain cyber-attacks or other privacy or data security incidents that result in security breaches, we could suffer a loss of sales and increased costs, exposure to significant liability, reputational harm and other negative consequences; and |
•our actual operating results may differ significantly from our guidance.
4
Our Vision
Build the world’s premier platform to research, discover, buy and sell vehicles.
Our Company
Vroom is an innovative, end-to-end ecommerce platform that is transforming the used vehicle industry by offering a better way to buy and a better way to sell used vehicles. We are deeply committed to creating an exceptional experience for our customers.
We are driving enduring change in the industry on a national scale. We take a vertically integrated, asset-light approach that is reinventing all phases of the vehicle buying and selling process, from discovery to delivery and everything in between. Our platform encompasses:
|
|
• |
Ecommerce: We offer an exceptional ecommerce experience for our customers. In contrast to legacy dealerships and the peer-to-peer market, we provide consumers with a personalized and intuitive ecommerce interface to research and select from thousands of fully reconditioned vehicles. Our platform is accessible at any time on any device and provides transparent pricing, real-time financing and nationwide contact-free delivery right to a buyer’s driveway. For consumers looking to sell or trade in their vehicles, we provide attractive market-based pricing, real-time price quotes and convenient, at-home vehicle pick-up. |
|
|
• |
Vehicle Operations: Our scalable and vertically integrated operations underpin our business model. We strategically source inventory from auctions, consumers, rental car companies, original equipment manufacturers (“OEMs”) and dealers. We improve our ability to acquire high-demand vehicles through enhanced supply science across all our sourcing channels and we have expanded our national marketing efforts to drive consumer sourcing. In our reconditioning and logistics operations, we deploy an asset-light strategy that optimizes a combination of ownership and operation of assets by us with strategic third-party partnerships. This hybrid approach provides flexibility, agility and speed without taking on unnecessary risk and capital investment, and drives improved unit economics and operating leverage. |
|
|
• |
Data Science and Experimentation: Data science and experimentation are at the core of everything we do. We rely on data science, machine learning and A/B and multivariate testing to continually drive optimization and operating leverage across our ecommerce and vehicle operations. We leverage data to increase the effectiveness of our national brand and performance marketing, enhance the customer experience, analyze market dynamics at scale, calibrate our vehicle pricing and optimize our overall inventory sales velocity. On the operations side, data science and experimentation enable us to fine tune our supply, sourcing and logistics models and to streamline our reconditioning processes. |
The U.S. used automotive market is the largest consumer product category and is highly fragmented with over 42,000 dealers and millions of peer-to-peer transactions. It also is ripe for disruption as an industry that is notorious for consumer dissatisfaction and has one of the lowest levels of ecommerce penetration. Our platform, coupled with our national presence and brand, provides a significant competitive advantage versus local dealerships and regional players that lack nationwide reach and scalable technology, operations and logistics. The traditional auto dealers and peer-to-peer market do not and cannot offer consumers what we offer.
In December 2015, we acquired Houston-based Texas Direct Auto® (“TDA”), which included our proprietary vehicle reconditioning center (“Vroom VRC”), the TDA dealership and our Sell Us Your Car® centers. From the launch of our combined operations in January 2016, our business has grown significantly as we have scaled our operations, developed our ecommerce platform and leveraged the network effects inherent in our model. We intend to continue to invest in growth to scale our company responsibly and drive towards profitability.
On June 11, 2020, we completed our initial public offering (the “IPO”), in which we sold 24,437,500 shares of common stock, which included 3,187,500 shares sold pursuant to the exercise by the underwriters of an option to purchase additional shares, at a public offering price of $22.00 per share. We received proceeds of approximately $504.0 million, net of underwriting discounts and before deducting offering expenses of $7.5 million, from sales of our shares in the IPO.
On January 7, 2021, we completed the acquisition of the CarStory business, a leader in AI-powered analytics and digital services for automotive retail, through the acquisition of 100% of Vast Holdings, Inc. Leveraging its machine learning, informed by more than 7 million listings per day and more than 18 million consumer sessions per month, CarStory
5
brings the industry’s most complete and accurate view of predictive market data to our national ecommerce and vehicle operations platform. As part of Vroom, we expect CarStory to continue to drive automotive retail innovation by aggregating, optimizing, and distributing current market data from thousands of automotive sources and offering its digital retailing services to dealers, top automotive financial services companies and household names in automotive industry research and retailing. Pursuant to the acquisition agreement, the aggregate purchase price was approximately $120.0 million, comprised of cash and shares of our common stock. The purchase price is subject to adjustment for certain working capital adjustments and post-closing indemnities.
Our Industry and Market Opportunity
The U.S. used automotive industry is a massive market that is ripe for disruption due to its fragmentation, high level of consumer dissatisfaction, changing consumer buying patterns and lack of ecommerce and technology penetration.
The U.S. Used Automotive Market is Massive and Highly Fragmented
In 2019, the U.S. used automotive market was the largest consumer product category, generating approximately $841 billion from sales. Based on data from Cox Automotive, there were an estimated 37.2 million used vehicle transactions in 2020, compared to approximately 40 million transactions in 2019. The U.S. used automotive market is also highly fragmented with approximately 42,000 automotive dealers and millions of peer-to-peer transactions across the country. Across all used vehicle sales in 2018, the largest U.S. used vehicle dealer had a market-share of only 1.9%, with the top 100 used vehicle dealers collectively representing only 9.3%.
Our Competitors Rely on an Outdated Business Model
The traditional dealership model involves limited selection, lack of transparency, high pressure sales tactics and inconvenient hours. These shortcomings have caused many consumers to transact on their own, creating a large peer-to-peer market for used vehicles with its own set of challenges for both buyers and sellers, which can entail home visits by strangers, lack of secure payment methods or identity checks, difficulty researching available vehicles and lack of verified vehicle condition. Presented with these alternatives, the overwhelming majority of consumers are dissatisfied with the current automotive buying and selling experience. According to a Dealersocket Independent Dealership Action Report, 81% of respondents reported dissatisfaction in the car buying process.
Consumer Buying Patterns are Changing
The U.S. retail used automotive market is experiencing shifting consumer buying patterns from in-store towards online purchases. In particular, mobile commerce is poised for even faster growth than broader ecommerce. Consumers are increasingly focused on customized products and personalized services, while also expecting delivery of those products and services on-demand. Our model enables consumers to select not only the make and model of a vehicle, but also the model year, color, trim and options in many combinations, offering a customized shopping experience that is not possible at a traditional dealership or in the peer-to-peer market.
In addition, used is the new “New” as consumers have become increasingly willing to buy used goods. In 2019, 64% of vehicle shoppers considered buying a used vehicle before making a purchase decision, up from 61% in 2018. At the same time, the average price differential between new and three-year-old used vehicles has grown in recent years and as a result, owning or leasing a new vehicle has become increasingly unaffordable. The purchase of a used vehicle enables a consumer to obtain a fully reconditioned vehicle at a higher standard of luxury or with highly sought-after features for the same dollar amount as a new, lesser-model vehicle.
The U.S. Used Automotive Market is Growing and Resilient and Ecommerce Penetration is Just Beginning
American consumers continue to exhibit entrenched vehicle ownership trends with approximately 284 million registered vehicles on the road in 2019, as compared to 279 million in 2018. Further, approximately 91.5% of families in the United States had at least one vehicle in 2018. Additionally, the retail used vehicle market generally has shown resilience through recessionary markets and other challenging economic cycles.
At the same time, the used automotive market has one of the lowest ecommerce penetration levels among consumer product categories. Industry reports estimate that ecommerce penetration will grow to as much as half of all used vehicle sales by 2030. In a 2019 Cox Automotive Data survey, 49% of consumers reported that they are willing to make a vehicle purchase online. Furthermore, while it is too soon to measure the long-term impact of the COVID-19 pandemic on consumer behavior, recent surveys indicate a growing willingness to buy a vehicle online and reduced use of
6
public transportation and ride-sharing services, with respondents attributing recent vehicle purchases to the COVID-19 pandemic.
What We Do: Offer a Better Way
We are driving a better way to buy and a better way to sell used vehicles and bringing about enduring change in the industry. Our platform brings together all phases of the vehicle buying and selling process in a seamless, intuitive and convenient way. We create a climate of trust and provide an exceptional experience with complete transparency by eliminating friction and sales pressure. The traditional auto dealers and peer-to-peer market do not and cannot offer consumers what we offer. We offer a better way.
A Better Way to Buy
For consumers looking to buy a used vehicle, we offer a value proposition that differs markedly from traditional auto dealers and the peer-to-peer market. We are dedicated to helping customers evolve from wary shoppers to confident owners by streamlining the entire buying process, from discovery through financing to delivery, by offering the following:
|
|
• |
Enormous Selection of Inventory. We currently offer a growing inventory of thousands of low-mileage, high-demand vehicles. By making purchasing decisions based on data rather than intuition, we are able to offer a wide selection of vehicles that excite our customers. Consumers no longer have to settle for traditional dealerships with a limited number of vehicles on hand or scour local peer-to-peer listings and travel to a seller’s location. |
|
|
• |
Consistent High Quality. All of our vehicles pass our detailed inspections and meet our proprietary Vroom Reconditioning Standards, which result in high-quality used vehicles backed by our free Vroom 90-Day Limited Warranty. We never lose sight of the fact that the used vehicles we sell are “new” to our customers. |
|
|
• |
Comprehensive and Transparent Vehicle Information. We remove the asymmetry of information between dealers and consumers by providing comprehensive and transparent information on the vehicles we sell. We mitigate bait-and-switch risk through high-resolution photography and detailed product descriptions on our platform, which show our customers our vehicles from all angles, and provide third-party vehicle history reports on all of our vehicles. |
|
|
• |
Customized Vehicle Search and Discovery. In addition to the size and diversity of our inventory selection, we provide buyers with a personalized, intuitive interface with detailed sorting, searching and filtering functionality. This enables our customers to research and discover the right car for their unique needs. |
|
|
• |
Competitive, Market-based Pricing. We price our vehicles using data science and proprietary algorithms, ensuring that buyers receive attractive, market-based, no-haggle pricing. Our pricing strategy takes into account hundreds of variables when determining the accurate market price of a vehicle, including items beyond make, model and color that are unavailable to traditional dealerships, such as proprietary historical purchase and sales data. |
|
|
• |
Exceptional Customer Support. Our professional customer experience team accompanies the buyer through every step of the process to make sure all questions are answered and any concerns are addressed. In all of our customer interactions, our goal is to ensure that every customer is a delighted customer. |
|
|
• |
On-Demand Shopping and Contact-Free, Convenient Delivery Experience. We offer customers the ability to shop for their desired vehicle at any time, on any device and from any location. We also deliver our vehicles nationwide to a location of our customer’s choosing. Our on-demand shopping and contact-free, convenient delivery not only saves our customers a trip to the dealership, it provides the ultimate driveway experience. |
|
|
• |
Value-Added Products. We provide seamlessly integrated, real-time, individualized financing solutions through our strategic partnerships with trusted lenders in automotive finance and give our customers access to competitive market rates. We also offer third-party protection products, including vehicle service contracts, GAP protection and tire and wheel coverage, all with transparent pricing. |
|
|
• |
Assurance. Our Vroom 7-Day Return Program offers customers seven days or 250 miles to test drive their purchase with their family, versus a seven-minute test drive around the block at a dealership. This fundamentally transforms the customers’ test drive experience by providing the opportunity to see how their vehicle performs in day-to-day life. |
7
A Better Way to Sell
We are revolutionizing the process for consumers to sell or trade-in their vehicles. Consumers typically encounter either low-ball prices from their local dealer or face the prospect of advertising and selling the vehicle themselves in a time-consuming process through the peer-to-peer market. In contrast, we offer consumers the following:
|
|
• |
Ease of Use. We offer the ease of online submission of basic vehicle information in order to receive an appraisal. There is no trip to the dealership and no cost to submit a vehicle for sale, but rather a simple, hassle-free process enabling customers to sell us their vehicles. |
|
|
• |
On-Demand Appraisals. Our Sell Us Your Car® proposition gives customers on-demand appraisals. We utilize our extensive data insights and experience across thousands of transactions to generate a quote that reflects a competitive market-based price, providing customers a fast and easy customer experience. |
|
|
• |
A Real-Time Price on Every Vehicle. For every vehicle that customers submit for appraisal, we provide a real-time price. |
|
|
• |
No High-Pressure Tactics. All price quotes are good for seven days or 250 miles. This process allows customers to shop, compare and analyze the sale of their vehicle from the convenience of their home to ensure they are getting the best value, eliminating pressure to take a deal on the spot. |
|
|
• |
Convenient, Contact-Free Vehicle Pick-ups. Our customers enjoy the convenience of national, at-home contact-free vehicle pick-up free of charge within days of accepting our price. |
|
|
• |
No Hassle Pay-offs. As an added convenience, we offer hassle-free customer payment and/or pay-off of any loans on the vehicle being sold, saving the customer time and paperwork. |
Our Competitive Strengths
A Leading Ecommerce Platform for Used Vehicles
We offer an end-to-end, ecommerce platform for buying, selling, transporting, reconditioning, pricing, financing, registering and delivering vehicles nationwide. Our platform encompasses every element of the customer experience and ensures quality and consistency. Our customer-centric business model addresses the shortcomings of the traditional dealership model and peer-to-peer market. We combine high-quality and high-demand vehicles, asset-light, scalable reconditioning operations, a national logistics network and an exceptional ecommerce experience. In addition, our ability to control the entire customer value chain from demand generation to pick-up or delivery to the customer’s driveway creates operating leverage as we scale, further driving the network effects inherent in our business and contributing to our path to profitability.
Asset-Light, Scalable Operations
An asset-light strategy is fundamental to our business model. We seek to optimize the combination of ownership and operation of assets by us with strategic third-party partnerships. Our strategy provides flexibility, agility and speed as we scale our business, without taking on the unnecessary risk and capital investment inherent in direct investment.
We employ this hybrid approach across our business and utilize strategic relationships with experienced and trusted providers to optimize reconditioning services, logistics, consumer financing and customer experience:
|
|
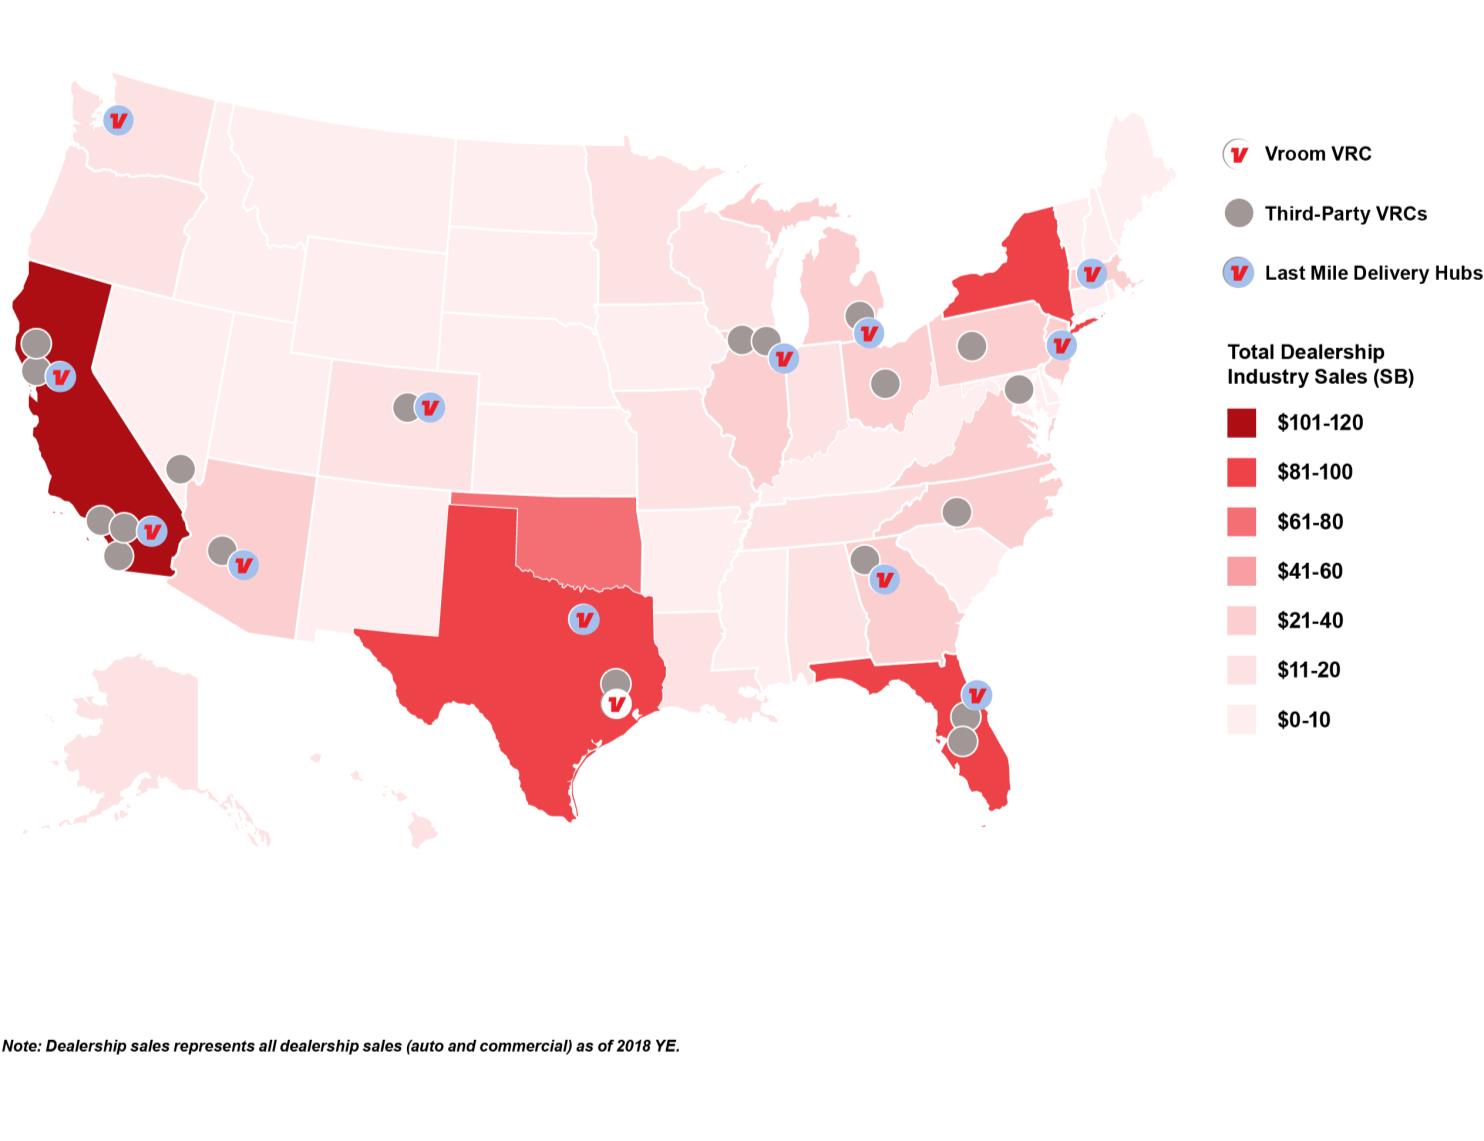
• |
Reconditioning Facilities. We combine the use of our Vroom VRC and third-party vehicle reconditioning centers (“third-party VRCs”) to best meet our reconditioning needs as we continue to expand our business. We leverage our partnerships with third parties within the reconditioning industry to recondition approximately two-thirds of the vehicles in our inventory to our Vroom Reconditioning Standards, which creates capacity to scale quickly and efficiently, while simultaneously reducing our capital commitments and expanding our geographic footprint. |
|
|
• |
Logistics. We primarily have used third-party carriers for our inbound and outbound logistics operations while also developing our proprietary logistics capabilities. This has allowed us to efficiently deliver vehicles to customers throughout the United States while focusing on expanding other critical components of our business, such as the volume and selection of vehicles in our inventory. We are optimizing this hybrid approach by expanding our proprietary logistics operations, including our owned vehicle fleet. We initially are focused on expanding our last-mile delivery operations, which we expect to both improve our operating leverage and enhance our customer experience, and also have begun to invest in long-haul vehicles for hub-to-hub shipments. |
8
VRC and Last Mile Hub Locations as of February 15, 2021
|
|
• |
Customer Financing. By partnering with many of the largest and most trusted banks in the world, we arrange reliable vehicle financing for our customers while avoiding the increased risk associated with underwriting consumer debt and carrying financing receivables on our books. This low-risk, high-margin financing structure enables us to provide customers with an essential aspect of the vehicle-buying process without adding additional debt commitments to our balance sheet and operational cost and complexities to our business. |
|
|
• |
Customer Experience Team. In addition to our in-house customer support personnel, we have partnered with a leading customer experience management provider to operate our primary call center providing sales support to our customers. This strategy enables us to centralize our contact center services, ensure consistency in customer interactions, increase conversion and maximize operating efficiencies. We also recently engaged two additional customer service providers to expand our customer service operations as we scale our business. |
Relentless Focus on Data Science
Data science is at the core of everything we do, and all aspects of our business are enhanced by data analytics. In an industry that historically used intuition and basic industry-wide data to drive purchasing and pricing decisions, we are moving from intuition to algorithm. We are expanding and continuously improving our access to data, using data science and machine learning across our business to maximize efficiency. Our proprietary technology, machine learning and data analytics models continuously optimize our marketing investments and conversion funnel, fine-tune our supply, sourcing and logistics models, calibrate our vehicle pricing, streamline our reconditioning processes and optimize our overall inventory sales velocity. Our recent acquisition of CarStory reinforces and enhances our data analytics, as CarStory continues to drive automotive retail innovation as a leader in artificial intelligence powered analytics and digital services in the automotive space.
Continuous Experimentation and Innovation at Scale
We strive to make key decisions based on data and testing. We continuously experiment using A/B and multivariate testing methodologies to drive conversion, innovation and improved unit economics. We test variables involved in sourcing, buying, reconditioning, and managing our inventory, and make decisions based on the data insights gained from such continuous experimentation. We integrate a full-stack statistics engine that is connected to our front-and back-end operations, enabling us to A/B test across all aspects of our business, including our marketing and conversion funnel, inventory procurement, management, refurbishment and sales processes.
9
National Market Penetration and Brand
Our national presence provides a significant competitive advantage versus local dealerships and regional players that lack scalable technology, operations and logistics, and are unable to take advantage of the efficiencies and lower costs of national brand advertising. We are able to deliver a superior customer experience through the breadth and diversity of our national inventory of thousands of vehicles on our platform. Consumers no longer have to settle for whatever the local dealer has on the lot or scour local peer-to-peer listings and travel to a seller’s location for an unknown, time-consuming experience. Additionally, our customers enjoy the convenience of national, at-home delivery and pick-up of vehicles. We also leverage our national marketing campaigns to efficiently increase brand awareness and attract and convert new customers at lower cost. Our brand’s national reach provides a significant advantage over local dealers who typically rely on costly local or regional advertising campaigns.
Difficult to Replicate Business Model
Our platform overcomes the unique operational and technological challenges associated with buying and selling used vehicles in an ecommerce channel. Each vehicle that we offer through our platform has a unique vehicle identification number (“VIN”) and requires multiple touch points, including appraisal, inspection, reconditioning, photography, pricing and delivery. It requires significant funding sources to finance the acquisition of inventory, the ability to source and manage complex inventory, pricing and appraisal optimization skills, reconditioning expertise and sophisticated logistics capabilities. Given the significance of the purchase to a consumer, it also requires professional customer service and a brand that consumers can trust. These elements make our platform difficult to replicate. Our operational experience and the improvements we have made over time serve as important competitive moats. To succeed, any new entrant to ecommerce used auto sales would require data-driven automotive expertise, ecommerce capabilities and scalable operations integrated in a single platform.
Seasoned Leadership Team and an Exceptional Culture
Our success to date has been built on a culture that reflects our values: s.p.e.e.d – obsessive customer service, unwavering commitment to forward progress, appreciation for the diversity and skills of our employees, engagement and celebration of all we do, and passionate development of our people, products, brand, and communities. We maintain a deep commitment to prudent corporate governance, transparency, accountability and collaboration. Our leadership team is comprised of seasoned executives who possess cross-vertical experience in the ecommerce, technology, supply chain, logistics, retail and automotive sectors, and have a demonstrated track record of scaling businesses and achieving profitable growth. Building on lessons learned and experience leading digital disruption in other fields, we believe we can bring the same level of innovation to the automotive retail industry. Our Growth Strategies and Path to Profitability
The core elements of our platform—ecommerce, vehicle operations and data science and experimentation—serve as the foundation of our growth strategies and path to profitability.
Drive Growth
Our business has grown significantly as we have scaled our operations. Our growth is not attributable to a single innovation or breakthrough, but to coalescence around multiple strategies that serve as points on our flywheel. The diversity and number of vehicles in our inventory drive demand and support expanded national marketing to enable us to acquire new customers more cost effectively, allowing us to invest back into our platform to continue to improve the customer experience, all of which drives increased conversion. This flywheel revolves, builds momentum and ultimately propels our business forward as we seek to drive disciplined growth and operating leverage.
Grow and Optimize Vehicle Inventory
As a data-driven business, we measure demand at the unique VIN level and use data analytics to inform our pricing and inventory selection. This enables us to curate an optimal inventory that matches market demand signals, driving higher conversion and sales. As we grow, we will continuously refine our inventory mix and expand our offerings across vehicle price points to serve a greater range of customers and increase our demand and conversion opportunities.
10
Expand Marketing and Maximize ROI
The strength of our brand and effectiveness of our advertising programs is critical to our ability to attract new customers cost effectively. Leveraging our advanced data analytics, we will continue to invest in national marketing campaigns and targeted performance marketing to identify, attract and convert new customers at lower cost. This strategy provides a significant advantage over local dealers who typically rely on costly local or regional campaigns and enables us to maximize return on our marketing spend. We also run sophisticated digital marketing across various vehicle listing sites, constantly monitoring performance and maximizing ROI with limited reliance on any one platform.
Deliver Exceptional Customer Experience
We believe that customer experience is fundamental to our ability to convert consumers into customers, attract new customers and ensure repeat customers. We seek to provide customers with an intuitive, trustworthy and convenient buying and selling experience. We will continue to invest in our platform to further streamline the transaction process for our customers, as well as invest in expanded customer service operations to support our customers and enhance the customer experience. We will also continue to invest in the development of our mobile experiences to strengthen customer engagement. We believe these investments will lead to greater consumer traffic to our platform, higher levels of customer satisfaction and increased conversion and sales.
Increase Conversion
Sales conversion drives revenue growth and is an output of the acceleration of every point on the growth flywheel. We will continue to invest in our technology framework to optimize all aspects of our conversion funnel by constantly A/B testing our web and mobile applications to ensure we are displaying the features and formats that are most likely to resonate with our customers and lead to increased sales.
Drive Profitability
Our business model benefits from network effects and significant operating leverage as it scales. We believe that improvements in our unit economics are the foundation to driving profitability and will be achieved by scaling and optimizing the following elements of our platform:
Optimize Vehicle Acquisition and Pricing
We strategically source inventory from auctions, consumers, rental car companies, OEMs and dealers. We improve our ability to acquire the right vehicle at the right price through enhanced supply science across all our sourcing channels. We are expanding our national marketing efforts featuring our Sell Us Your Car® proposition to drive consumer sourcing. As a result, we expect to increase the number of vehicles we purchase from consumers, which typically generate higher gross profit per unit when sold compared to other inventory sources. In parallel, we continue to invest in data analytics and machine learning to optimize vehicle acquisition and pricing, increase sales velocity and drive profitability. We also are exploring third-party inventory strategies, which offers the possibility of expanding our sourcing channels while offering attractive revenue models in an asset light, debt free structure.
Increase Reconditioning Capacity
As we scale our business, we intend to continue to invest in increased reconditioning capacity. In addition to achieving cost savings and operational efficiencies, we will be focused on lowering our days to sale to improve working capital efficiency. We will continue to employ a hybrid approach that combines the use of our Vroom VRC with geographically dispersed third-party VRCs to best meet our reconditioning needs. To do so, we have expanded and are continuing to expand our third-party VRC locations to provide added scale with reduced lead-time and greater flexibility. As we search for additional VRC locations, leveraging our data analytics and deep industry experience, we take into account a combination of factors, including proximity to customers, transportation costs, access to inbound inventory and the ability to expand capacity at our third-party partners’ specific locations. All of these initiatives are designed to lower reconditioning costs and inbound shipping costs per unit, and thereby improve per unit economics while enhancing the customer experience.
11
Expand Value-Added Products
Every vehicle sale creates potential for multiple additional revenue streams, including fees earned on third-party vehicle financing and fees from the sale of other value-added products. As we expand our business, we believe there are substantial opportunities to increase attachment rates on our existing value-added products through training, merchandising and technology enhancements. Strategic partnerships with lenders such as Chase and Santander provide enhanced revenue streams for us, as well as offering convenience, assurance and efficiency for our customers. Introducing new types of vehicle related finance and protection products can provide additional revenues going forward. Because we are paid fees on the value-added products we sell, our gross profit on such products is equal to the revenue we generate on such sales. In addition to expanding our offering of value-added products, in the longer term, we see a significant opportunity to provide our customers with complementary services such as entertainment and location-based services. The addition of new value-added products and services will not only increase our product offerings and profitability but will also strengthen and extend our interactions with customers.
Strategically Develop Logistics Network
For our logistics operations, we primarily have used national third-party carriers, which has allowed us to efficiently deliver vehicles to customers throughout the United States while focusing on expanding other critical components of our business, such as the volume and selection of vehicles in our inventory. We optimized our third-party logistics network nationally through the development of strategic carrier arrangements with national haulers and consolidated our carrier base into dedicated operating regions. This strategy enhanced the flexibility, agility and speed of our growth while reducing the need for additional capital commitments as we scaled our business. In part as a result of a reduced supply of carriers, increased shipping prices and deteriorating service levels at the outset of the COVID-19 pandemic, and to further enhance the quality of our logistics operations and our customer experience, we have been accelerating our strategy to optimize our hybrid approach by expanding our proprietary logistics network and improving our operating leverage. Initially, we have been prioritizing investment in our last-mile delivery operations, where we can have the greatest impact on the customer experience, and also have begun to invest in long-haul vehicles for hub-to-hub shipments. Consistent with our hybrid approach, as we continue to scale our business, we will strategically combine the operation of our expanded proprietary fleet with the use of third-party carriers, which will enable us to both accommodate our rapid growth and provide the highest level of customer service.
Capitalize on New Product and Market Opportunities
Expand our Platform to Additional Products and Markets
We have designed and built an innovative platform with countless potential applications. We have the potential to leverage our platform for expansion into adjacent areas of technology-enabled commerce and fully deploy our technology, data analytics and business experience to take advantage of the opportunities this creates. We will have the flexibility to strategically pursue opportunities across markets, potentially including additional transportation and vehicle markets, global geographic markets and B-to-B business models.
Continue to Innovate on New Capabilities
Technological developments have had a significant impact on the automobile industry and are expected to continue to have an impact for the foreseeable future. Electrification and shared mobility in particular are expected to have a transformative impact on road transportation. We continuously monitor developments in autonomy, ride-hailing and ride-sharing as it relates to the overall automotive market, and we are well-positioned to expand our capabilities to participate actively as the industry evolves. As the automotive landscape develops, we will seek to capitalize on new opportunities.
Our Marketing
We operate a multi-channel marketing strategy that includes both national brand and digital performance marketing. We leverage various digital performance channels, including automotive aggregator sites, to generate demand for Vroom inventory by VIN. In these channels, we manage the national distribution footprint of each VIN by continually optimizing its forward distribution to maximize consumer demand and achieve planned conversion, sales velocity and profitability.
Our national brand campaign through TV and online media, which commenced in the first quarter of 2019, has shown strong momentum in its first two years. Because brand leads convert at a higher rate than all other marketing channels, we believe that continued growth of our national brand marketing campaign and an increasing mix of brand leads will improve our marketing efficiency. We also have expanded our national marketing efforts to feature our Sell Us Your Car® proposition to drive consumer sourcing of vehicles, which typically generate higher gross profit per unit when sold compared to other inventory sources.
12
We analyze visitor traffic and customer interaction with our platform to identify and correlate visitor behavior with sales conversion. Our analytics enable us to measure and monitor the ROI generated by our marketing placements, which we then use to optimize placement and spend across marketing channels to balance sales velocity and profitability.
Our Technology
Technology and data science are the foundation of all of our operations and strategic decision making.
Our team of data scientists and engineers continuously extract and analyze additional information, processing millions of data points daily to create models that inform purchasing, pricing and market decisions, allowing us to understand price elasticity, and also allowing us to price a significant majority of the vehicles we acquire from consumers in just a few seconds. We adjust price as a function of overall market value trend, taking into account competitor inventory, market price fluctuations, and relative inventory advantages.
Core to our underlying technology is the real-time collection of customer and inventory data. We analyze and act on the data in real time. As our systems collect new or updated incoming data signals, those signals are immediately available to downstream systems to trigger parallel event processes. Our technology supports multi-channel engagement with our customers, delivering consistent messaging via the web, in native apps and via email. In cases where customers need attention outside of our ecommerce experience, we provide customer assistance via phone.
In addition, CarStory drives automotive retail innovation by aggregating, optimizing, and distributing current market data from thousands of automotive sources. CarStory tracks over five million unique VINs listed for sale every day. This data is aggregated with nationwide demand insights from dealers and enterprise brands to generate accurate price and sales predictions. These predictions are further enhanced by CarStory's proprietary enhanced VIN database, ensuring a comprehensive and accurate view of a vehicle.
Competition
The U.S. used vehicle market is highly fragmented, with over 42,000 traditional franchised and independent dealerships nationwide as well as the peer-to-peer market. The players in the used vehicle market can be classified into the following segments:
|
|
• |
traditional new and used car dealerships; |
|
|
• |
large, national car dealers, such as CarMax and AutoNation, which are expanding into online sales, including “omni-channel” offerings; |
|
|
• |
used car dealers or marketplaces that currently have existing ecommerce businesses or online platforms, such as Carvana; |
|
|
• |
the peer-to-peer market, utilizing sites such as Facebook, Craigslist.com, eBay Motors and Nextdoor.com; and |
|
|
• |
sales by rental car companies directly to consumers of used vehicles which were previously utilized in rental fleets, such as Enterprise Car Sales. |
Internet and online automotive sites could change their models to sell used vehicles and compete with us, such as Google, Amazon, AutoTrader.com, Edmunds.com, KBB.com, Autobytel.com, TrueCar.com, CarGurus and Cars.com. In addition, automobile manufacturers such as General Motors, Ford and Volkswagen could change their sales models to better compete with our model through technology and infrastructure investments. While such enterprises may change their business models and endeavor to compete with us, the sale of used vehicles through ecommerce presents unique operational and technical challenges. See “Business—Our Competitive Strengths—Difficult to Replicate Business Model.”
We view our main competitors to be the traditional auto dealers, who make up the significant portion of U.S. used vehicle sales and are still operating under an outdated business model that is ripe for disruption.
Description of Human Capital Management
Vroom believes in and adheres to a core set of values and Rules of the Road that guide our actions at work. Those values are summed up as s.p.e.e.d: obsessive customer service, unwavering commitment to forward progress, an appreciation for the diversity and skills of our employees, engagement and celebration of all we do, and passionate development of our people, products, brand, and communities. Our core values are embedded in our culture through our onboarding, training, operations and communication. All of our employees receive Driver’s Manuals that outline and define
13
these values and all new hires are invited to listen to our Chief Executive Officer and Chief People and Culture Officer discuss the Company’s Mission, Vision, and Values, and those values inform everything we do.
At the center of Vroom’s values are its employees, without whom we could not achieve our vision of building the world’s premier platform to research, discover, buy and sell vehicles.
As of December 31, 2020, Vroom employed a total of 944 employees. The total consisted of 25.5% reconditioning and logistics staff, 48.6% corporate and transactional staff, 13% technical and engineering staff, and 12.8% retail staff. None of our employees is represented by a labor union. We consider our relationships with our employees to be good and have not experienced any interruptions of operations due to labor disagreements.
Engaging Talent
Each year, we conduct an annual engagement survey of our employees, both to measure our employees’ collective sentiment, and also to focus our efforts on maintaining a workplace where employees can bring their whole selves to work and do their best work every day. We used our 2019 annual engagement survey to identify four key areas for improvement and, through a series of targeted initiatives, we saw improvement across each topic in our 2020 annual engagement survey results:
|
Focus Area |
Year over Year change 2019 to 2020 |
|
Improving employee’s perception that the organization was listening to and acting upon employee feedback |
+6% |
|
Improving individual employee recognition |
+25% |
|
More effectively managing change in the organization |
+5% |
|
Increasing perceptions of fair compensation |
+4% |
14
Measuring Talent
We use a variety of human capital measures in managing our business, including diversity, attrition, hiring, promotions, and leadership. We also use certain talent management metrics, including retention rates of top talent and hiring metrics.
Diversity, Equity, and Inclusion
Diversity, equity and inclusion (“DEI”) are cornerstones of the Vroom values, emphasized most strongly in the s.p.e.e.d. values of Employees and Engagement. During 2020, we made progress on a number of our diversity initiatives:
Representation
|
|
• |
We added two female members to our board of directors, bringing representation of our non-employee directors to 33% female as of December 31, 2020. |
|
|
• |
The percentage of women in our workforce increased from 33.0% as of December 31, 2019 to 40.6% as of December 31, 2020. |
|
|
• |
Efforts to improve race and ethnicity-related voluntary reporting by our employees greatly improved our confidence in the data reported in 2020 relative to 2019. In 2019, 32.6% of our employees did not report a race or ethnicity. That number dropped to 8.2% by the end of 2020. |
|
|
• |
Based on the reported race and ethnicity-related data, non-white representation among our employees stayed nearly flat at 68.5% as of December 31, 2019 and 67.9% as of December 31, 2020. |
|
|
Employee Race and Ethnicity
|
|
|
|
|
2019 |
2020 |
Change |
|
Asian |
7.88% |
8.07% |
0.20% |
|
Black / African American |
20.33% |
25.26% |
4.93% |
|
Hispanic / Latino |
35.71% |
29.53% |
(6.19)% |
|
Native Hawaiian / Pacific Islander |
0.55% |
0.35% |
(0.20)% |
|
Two or More Races |
2.20% |
2.54% |
0.34% |
|
White |
31.50% |
32.06% |
0.56% |
|
I do not wish to answer |
1.83% |
2.19% |
0.36% |
|
Total |
100.00% |
100.00% |
|
Inclusion
|
|
• |
During the summer of 2020, in the midst of social unrest, we held a number of listening sessions to discuss the experiences of our employees — with particular emphasis on our African American colleagues. These sessions were well attended and well received by our employees. |
|
|
• |
We also established a cross functional Diversity, Equity and Inclusion Committee tasked with working with our Senior Leadership Team on efforts aimed at improving DEI experiences and outcomes for our employees. The Diversity, Equity and Inclusion Committee has begun making recommendations for Company-wide training, communication, and other efforts. |
|
|
• |
In addition to our required anti-harassment training, we have introduced mandatory implicit bias training to heighten awareness across the organization. |
Workplace Health & Safety
Vroom takes a comprehensive approach to workplace health and safety. During 2020, efforts were largely focused on addressing the spread of COVID-19, especially given the in-person nature of the work of many of Vroom’s employees, including our reconditioning, titling, and document support staff.
In response to the COVID-19 disruptions, we implemented a number of measures to protect the health and safety of our workforce. These measures include restrictions on non-essential business travel, the institution of work-from-home policies wherever feasible and the implementation of strategies for workplace safety at our facilities. We are following and require all of our on-site vendors to follow the guidance from public health officials and government agencies, including implementation of enhanced cleaning measures, social distancing guidelines, wearing of masks, eliminating non-essential
15
vendor / guest visitation, and requiring temperature checks and health attestations prior to entering buildings. Seating, signage, and cleaning materials have been added to ensure adherence to best practices for employee health and safety during this pandemic. In addition, we have leased additional office space to ensure sufficient in-office capacity while providing adequate spacing of our employees. Where feasible, we operate on a rotating team schedule to reduce exposure and also require any diagnosed or exposed employees to self-isolate for up to two weeks. In response to the COVID-19 pandemic, a cross functional working group was formed to focus on COVID-related matters of space and remote work and continues to meet bi-weekly to ensure up-to-date safety protocols and efficient responses to new information.
Compensation & Rewards
COVID-19 Related Actions
Reduced unit volume in the early weeks of the COVID-19 pandemic led to a furlough of approximately one-third of our staff as well as salary reductions for our remaining staff. Employees were given two weeks’ notice prior to any furlough action and remained on Company-provided benefits for the duration of the furlough. Approximately 77% of those employees furloughed were returned to work within 60 days and only 13% were ultimately terminated. Each of these terminated employees received standard separation benefits, including outplacement and separation pay.
In May 2020, salary reductions were instituted relative to level and overall compensation in the organization. The option to work overtime was eliminated for hourly employees and salaried employees experienced reductions at the most junior level of 5%, up to 25% for our Chief Executive Officer. Salaries were returned to pre-COVID levels by July of 2020, with our Chief Executive Officer being the last employee to have his full salary restored.
General Compensation
Our compensation philosophy is driven by the desire to attract and retain top talent, while ensuring that compensation aligns with our corporate and financial objectives and the long-term interests of our stockholders. We have developed a pay structure that offers a competitive total compensation package including base salary, bonus, equity, and other position-specific incentives. Annual bonus plans are tied to both company and individual performance factors.
Our comprehensive benefit plans offer medical, dental and vision insurance and long and short-term disability, as well as flexible spending accounts and other voluntary coverage to all of our employees. We routinely benchmark our salaries and benefits against market peers to ensure our total rewards package remains competitive.
Communication & Talent Development
A key part of Vroom’s operating philosophy is ensuring that employees are learning and developing as well as providing input into Vroom’s daily operations. In addition to a standard engagement survey and formal feedback tool, Vroom has implemented a number of systems designed to improve feedback to and from employees. They are described below:
|
System / Tool |
Description / Purpose |
|
Pit Crew Meetings |
Frequent small group meetings between employees and a senior leader in the organization to share business updates and surface ideas for improvements in the business and employee experience. |
|
Town Hall Style Meetings with Chief Executive Officer |
Quarterly town-hall style meetings where business results are shared and employees submit questions to the Chief Executive Officer and Senior Leadership Team regarding a wide range of topics. |
|
Check Engine System |
An anonymous forum for uncovering problems or challenges in the business that are then addressed by appropriate parties. |
|
Pit Crew Feedback |
An always-on, multi-rater feedback tool that allows managers to collect feedback from their employee’s key stakeholders at the times when it’s most pertinent. |
16
|
PaceSetter Awards |
Quarterly awards that highlight employees in the business who exemplify Vroom’s values. These awards show appreciation while also setting an example for employee interactions. |
|
Mission, Vision, Values |
The Chief Executive Officer and Chief People and Culture Officer meet with all new hires in interactive sessions to discuss Vroom’s Mission, Vision, and Values in detail. |
The Company offers a number of developmental programs in addition to standard training on compliance-oriented topics. Offerings include content on managing bias, providing effective feedback, utilizing compensation tools, and thoughtful self-evaluation. Vroom invested in development resources during 2020, adding both a Senior Director of Learning and Development focused on broad initiatives, as well as a Director of Training & Quality Assurance focused on operational skills and measurement. We look forward to providing even more growth opportunities for the team in 2021.
Intellectual Property
The protection of our technology and intellectual property is an important aspect of our business. We seek to protect our intellectual property rights, including our intellectual property rights in our technology, through trademark, trade secret and copyright law, as well as confidentiality agreements, procedures and other contractual commitments and other legal rights. We generally enter into confidentiality agreements and invention assignment agreements with our employees and consultants to control access to, and clarify ownership of, our proprietary information.
As of the date of this Annual Report on Form 10-K, we do not own any U.S. or foreign patents and do not have any U.S. or foreign patent applications pending, except for certain U.S. patents and pending U.S. patent applications we acquired as part of the CarStory acquisition. We own 12 registrations for our trademarks in the United States, including Vroom®, Vroom Get In®, TDA®, DealerLane®, Texas Direct®, Flag and Highway Logo and Sell Us Your Car®; and we hold registered trademarks in Colombia, Chile, Mexico, Canada and Peru for the Vroom® trademark and have a number of pending applications to register the Vroom® trademark in other foreign jurisdictions. We continually review our branding strategies and technology development efforts to assess the existence, registrability, and patentability of new intellectual property.
As part of the CarStory acquisition, we acquired 19 U.S. patents and ten pending U.S. patent applications. In addition, we acquired ten trademark registrations and two applications for trademark registration in the United States, Canada, and Europe, including for VAST® and CARSTORY®.
Intellectual property laws, procedures and restrictions provide only limited protection and any of our intellectual property rights may be challenged, invalidated, circumvented, infringed or misappropriated. Further, the laws of certain countries do not protect proprietary rights to the same extent as the laws of the United States, and, therefore, in certain jurisdictions, we may be unable to protect our proprietary technology, brands, or other intellectual property.
Government Regulation
Our business is and will continue to be subject to extensive U.S. federal, state and local laws and regulations. The advertising, sale, purchase, financing and transportation of used vehicles are regulated by every state in which we operate and by the U.S. federal government. The titling and registration of vehicles and the sale of value-added products also are regulated by state laws, and such laws can vary significantly from state to state. In addition, we are subject to regulations and laws specifically governing the internet and ecommerce and the collection, storage and use of personal information and other customer data. We are also subject to federal and state consumer protection laws, including the Equal Credit Opportunities Act and prohibitions again unfair or deceptive acts or practices. The federal governmental agencies that regulate our business and have the authority to enforce such regulations and laws against us include the U.S. Federal Trade Commission, the U.S. Department of Transportation, the U.S. Occupational Health and Safety Administration, the U.S. Department of Justice and the U.S. Federal Communications Commission. Additionally, we are subject to regulation by individual state dealer licensing authorities, state consumer protection agencies and state financial regulatory agencies. We also are subject to audit by such state regulatory authorities.
17
State dealer licensing authorities regulate the purchase and sale of used vehicles by dealers within their respective states. The applicability of these regulatory and legal compliance obligations to our ecommerce business is dependent on evolving interpretations of these laws and regulations and how our operations are, or are not, subject to them. We are licensed as a dealer in the States of Texas and Florida and all of our vehicle transactions are conducted under our Texas and Florida licenses. We believe that our activities in other states are not subject to such states’ vehicle dealer licensing laws; however, regulators in such states could seek to require us to maintain a used vehicle dealer license in order to engage in activities in that state. In addition, we intend to obtain a used vehicle dealer license in certain additional states to maximize operational flexibility and efficiency, enhance our customer experience and invest in relationships with state regulators.
Most states regulate retail installment sales, including setting a maximum interest rate, caps on certain fees or maximum amounts financed. In addition, certain states require that retail installment sellers file a notice or registration document or have a sales finance license or an installment sellers license in order to solicit or originate installment sales in that state. We have obtained a motor vehicle sales finance license in Texas in connection with our Texas dealer license, and we have obtained a retail installment seller license in Florida in connection with our Florida dealer license. The financial regulatory agency in Pennsylvania determined that we need to obtain an installment seller license in order to enter into retail installment sales with residents of Pennsylvania. As a result, we are not currently offering third-party financing to our customers in Pennsylvania, who must obtain independent financing to the extent needed to fund any vehicle purchases on our platform. We recently obtained a Pennsylvania installment seller license and expect to resume offering financing to Pennsylvania customers in the future. In addition, we may elect to obtain sales finance or installment seller licenses in certain other states in which our customers reside in order to maximize operational flexibility and efficiency, enhance our customer experience and invest in relationships with state regulators.
In addition, the ongoing expansion of our proprietary logistics operations exposes us to greater regulation from the U.S. Department of Transportation and state transportation regulators.
We previously had not been operating in the Commonwealth of Massachusetts due to its prohibition on the use of temporary tags, which we typically provide to our customers upon delivery. We recently implemented a solution that enables us to sell vehicles in Massachusetts and provide customers with vehicle registration and permanent tags upon delivery.
In addition to these laws and regulations that apply specifically to the sale and financing of used vehicles, our facilities and business operations are subject to laws and regulations relating to environmental protection, occupational health and safety, and other broadly applicable business regulations. We also are subject to laws and regulations involving taxes, tariffs, privacy and data security, anti-spam, pricing, content protection, electronic contracts and communications, mobile communications, consumer protection, information-reporting requirements, unencumbered internet access to our platform, the design and operation of websites and internet neutrality. We also are subject to laws and regulations affecting public companies, including securities laws and Nasdaq rules.
Additionally, we are subject to Federal, State and local laws and regulations, and other government actions, related to the COVID-19 pandemic.
For a discussion of the various risks we face from regulation and compliance matters, see “Risk Factors—Risks Related to Laws and Regulations—Failure to comply with federal, state and local laws and regulations relating to privacy, data protection and consumer protection, or the expansion of current or the enactment of new laws or regulations relating to privacy, data protection and consumer protection, as well as our actual or perceived failure to protect such information could harm our reputation and could adversely affect our business, financial condition and results of operations”; “—We operate in a highly regulated industry and are subject to a wide range of federal, state and local laws and regulations. Failure to comply with these laws and regulations could have a material adverse effect on our business, financial condition and results of operations”; “—If we fail to comply with the Telephone Consumer Protection Act, we may face significant damages, which could harm our business, financial condition and results of operations”; “—Government regulation of the internet and ecommerce is evolving, and unfavorable changes or failure by us to comply with these regulations could substantially harm our business, financial condition and results of operations”; “Risk Factors—Risks Related to Our Use of Data and Technology—We are subject to risks related to online payment methods”; “Risk Factors—Risks Related to Our Growth and Strategy—We are expanding our proprietary logistics operations, including vehicle pick-ups and delivery from our last mile hubs and line haul transportation of vehicles between our last mile hubs, which will further expose us to increased risks related to ownership of infrastructure and the transportation of vehicles” and “Risk Factors—Risks Related to the COVID-19 Pandemic—The COVID-19 pandemic has had and is expected to continue to have an adverse effect on our business, financial condition and results of operations.”
18
Seasonality
Used vehicle sales are seasonal. The used vehicle industry typically experiences an increase in sales early in the calendar year and reaches its highest point late in the first quarter and early in the second quarter. Vehicle sales then level off through the rest of the year, with the lowest level of sales in the fourth quarter. This seasonality has historically corresponded with the timing of income tax refunds, which are an important source of funding for vehicle purchases. Additionally, used vehicles depreciate at a faster rate in the last two quarters of each year and a slower rate in the first two quarters of each year. In line with these macro trends, our gross profit per unit has historically been higher in the first half of the year when compared to the second half of the year. See “Risk Factors—Risks Related to Our Financial Condition and Results of Operations—We may experience seasonal and other fluctuations in our quarterly results of operations, which may not fully reflect the underlying performance of our business.”
Available Information
Our website address is www.vroom.com. The information contained on, or that can be accessed through, our website is deemed not to be incorporated in this Annual Report on Form 10-K or to be part of this Annual Report on Form 10-K or any other report filed with the SEC. Our Annual Report on Form 10-K, Quarterly Reports on Form 10-Q and Current Reports on Form 8-K, as well as any amendments to those reports, are available free of charge through our website as soon as reasonably practicable after we file them with, or furnish them to, the SEC. The SEC maintains a website at www.sec.gov that contains reports, proxy statements, and other information regarding SEC registrants, including Vroom Inc.
19
An investment in our common stock involves a high degree of risk. You should consider carefully the risks and uncertainties described below, together with the financial and other information contained in this Annual Report on Form 10-K, before you decide to purchase shares of our common stock. The risks and uncertainties described below are not the only ones we face. Additional risks and uncertainties that we are unaware of, or that we currently believe are not material, may also become important factors that adversely affect our business. If any of the following risks or others not specified below materialize, our business, financial condition and results of operations could be materially and adversely affected. In that case, the trading price of our common stock could decline and you could lose all or part of your investment in our common stock.
Risks Related to the COVID-19 Pandemic
The COVID-19 pandemic has had and is expected to continue to have an adverse effect on our business, financial condition and results of operations.
Governmental authorities around the world have implemented measures to reduce the spread of COVID-19. These measures have adversely affected workforces, customers, supply chains, consumer sentiment, economies, and financial markets, and, along with decreased consumer spending, have led to an economic downturn across many global economies.
The COVID-19 pandemic rapidly escalated in the United States, creating significant uncertainty and economic disruption, and leading to record levels of unemployment nationally. Numerous state and local jurisdictions imposed, and others in the future may impose, shelter-in-place orders, quarantines, shut-downs or restrictions on operations of non-essential businesses, and similar government orders and restrictions on their residents to control the spread of COVID-19. While some such orders or restrictions have been lifted in certain jurisdictions, certain of those orders have been re-instated, new orders have been imposed and future orders may be imposed as the COVID-19 pandemic continues to spread in waves nationwide and various new strains of the virus surface. Such orders or restrictions have resulted in temporary facility closures (including certain of our third-party VRCs), work stoppages, slowdowns and travel restrictions, among other effects, thereby adversely impacting our operations. Due to the evolving nature of the COVID-19 crisis and the uncertainties surrounding the availability and efficacy of vaccines and other treatments for COVID-19, including with respect to their development and distribution, we continue to monitor the situation closely and assess the impact on our business. As of the filing of this Annual Report on Form 10-K, we expect our operations will continue to be adversely impacted in 2021, however, the magnitude and duration of the ultimate impact is impossible to predict with certainty due to:
|
|
• |
uncertainties regarding the duration of the COVID-19 pandemic and the length of time over which the disruptions caused by COVID-19 will continue; |
|
|
• |
the impact of governmental orders and regulations that have been, and may in the future be, imposed in response to the pandemic; |
|
|
• |
the impact of COVID-19 on VRCs, wholesale auctions, state DMV titling and registration services, third-party vehicle carriers and other third parties on which we rely; |
|
|
• |
uncertainty as to the impact future increases in COVID-19 transmission rates could have on our ability to fully staff portions of our business; |
|
|
• |
the deterioration of economic conditions in the United States, as well as high unemployment levels, which could have an adverse impact on discretionary consumer spending; |
|
|
• |
uncertainty regarding the potential for, timing and duration of, and severity of future waves of the COVID-19 crisis and the effect of new strains of the virus; |
|
|
• |
uncertainty as to whether and to what degree governmental economic relief will be provided to soften the negative economic effects of the COVID-19 crisis and the resulting governmental orders and restrictions; and |
|
|
• |
the availability and efficacy of vaccines and other treatments for COVID-19, including with respect to their development and distribution. |
In response to the COVID-19 disruptions, we implemented a number of measures designed to protect the health and safety of our workforce. These measures include restrictions on non-essential business travel, the institution of work-from-home policies wherever feasible and the implementation of strategies for workplace safety at our facilities that remain open. We are following the guidance from public health officials and government agencies, including limiting the number of employees in our office facilities, implementation of enhanced cleaning measures, social distancing guidelines, wearing of masks, eliminating non-essential vendor / guest visitation, and requiring health attestations and temperature checks prior to entering facilities, in each case subject to local requirements. Seating, signage, and cleaning materials have
20
been added to ensure adherence to best practices for employee health and safety during this pandemic. Where feasible, we operate on a rotating team schedule to reduce exposure and also require any diagnosed or exposed employees to self-isolate for up to two weeks before returning to work. Nevertheless, these actions may not be sufficient to prevent a material disruption in our workforce.
Both TDA and our back-office facility in Houston continued to remain open during the year ended December 31, 2020 and through the date of this Annual Report on Form 10-K. However, lower foot traffic in the initial phase of the COVID-19 pandemic as well as reduced inventory at the TDA location as the ecommerce business scales, continues to negatively affect our TDA business. We also have experienced disruptions in our logistics network and productivity challenges in our back-office operations, including backlogs in the titling and registration of vehicles due to shutdowns of or limited operations at state departments of motor vehicles. As COVID-19 disruptions continue, we are unsure when the negative effects on our business will subside. As a result of these developments, our business, results of operations, cash flows and financial condition for fiscal year 2020 have been significantly affected by the COVID-19 disruptions and could continue to be adversely impacted in the future. There is no assurance the measures we have taken or may take in the future will be successful in managing the uncertainties caused by COVID-19.
The extent to which COVID-19 ultimately impacts our business, financial condition and results of operations will depend on future developments, which are highly uncertain and unpredictable, including new information which may emerge concerning the severity and duration of the COVID-19 outbreak and the effectiveness of actions taken to contain the COVID-19 outbreak or treat its impact, including the availability and efficacy of vaccines and other treatments for COVID-19, including with respect to their development and distribution, and the resistance of new strains of the virus to vaccines, among others. The ultimate consequences of the COVID-19 pandemic cannot be predicted with certainty, but it could have a material effect on our business, operating results, financial condition and prospects.
In addition to the COVID-19 disruptions adversely impacting our business and financial results, they may also have the effect of heightening many of the other risks described herein, including risks relating to changes in consumer demand; our limited operating history; our ability to generate sufficient revenue to generate positive cash flow; the operation of TDA; our relationships with third party customer experience teams; the availability of third-party providers to deliver our vehicles to customers nationwide; the operation of our VRCs by us and our third party service providers; the current geographic concentration of reconditioning services and store inventory; our level of indebtedness; our agreement with a single lender to finance our vehicle inventory purchases and the expiration of such agreement; our access to desirable vehicle inventory; regulatory restrictions; and the shift by traditional dealers to online sales and deliveries.
Risks Related to Our Financial Condition and Results of Operations
We have a history of losses and we may not achieve or maintain profitability in the future.
We have not been profitable since our inception in 2012 and had an accumulated deficit of approximately $777.9 million as of December 31, 2020. We incurred net losses of $202.8 million and $143.0 million for the years ended December 31, 2020 and 2019, respectively. We may incur significant losses in the future for a number of reasons, including our inability to reduce costs, acquire and appropriately price vehicle inventory, provide the exceptional customer experience needed to attract customers or identify and respond to emerging trends in the used car industry; a slowdown in demand for used vehicles and our related value-added products; weakness in the automotive retail industry generally; general economic conditions; global pandemics; and increasing competition, as well as other risks described in this Annual Report on Form 10-K, and we may encounter unforeseen expenses, difficulties, complications and delays in achieving profitability.
Additionally, we expect to continue to incur losses as we invest in and strive to grow our business. We expect our operating expenses to increase in the future as we increase our investment in our proprietary logistics operations, increase our advertising and marketing efforts to build our brand, continue to invest in technology development, increase hiring and expand our operating infrastructure. In addition, as a public company, we now have significant legal, accounting and other expenses that we did not incur as a private company. As a result of these increased expenditures, we will have to generate and sustain increased revenue to offset our operating expenses and achieve and maintain profitability. In addition, if we reduce variable costs to respond to losses, this may limit our ability to acquire customers and grow our revenues. Our ecommerce gross profit per unit increased by $69, or 4.1%, from the year ended December 31, 2019 to December 31, 2020. To reduce our losses, we will need to increase our gross profit per unit by lowering our costs per unit by, among other things, increasing efficiencies in reconditioning and logistics, which we may be unable to do. Accordingly, we may not achieve or maintain profitability and we may continue to incur significant losses in the future.
21
We may not be able to generate sufficient revenue to generate positive cash flow on a sustained basis, and our revenue growth rate may decline.
We cannot assure you that we will generate sufficient revenue to offset the cost of maintaining our platform and maintaining and growing our business. Although our revenue grew from $1.2 billion for the year ended December 31, 2019 to $1.4 billion for the year ended December 31, 2020, our revenue growth rate may decline in the future because of a variety of factors, including our inability to acquire and appropriately price vehicle inventory, provide the exceptional customer experience needed to attract customers or execute effective marketing campaigns to increase traffic to our platform; a slowdown in demand for used vehicles and our related value-added products; weakness in the automotive retail industry generally; general economic conditions; and increasing competition. We cannot assure you that our revenue will continue to grow or will not decline. You should not consider our historical revenue growth as indicative of our future performance. If our revenue growth rate declines, our business, financial condition and results of operations will be materially and adversely affected.
Further, going forward we expect to make significant investments to further develop and expand our business, and these investments may not result in increased revenue or growth on a timely basis or at all. For example, we expect to continue to expend substantial financial and other resources on increased marketing and other efforts to acquire and retain customers, expanding our customer experience team, developing our technology and data analytics capabilities, adding new features and functionality to our website, mobile application development and expansion of our reconditioning and proprietary logistics operations. These investments may not result in increased revenue or growth in our business. If we cannot successfully earn revenue at a rate that exceeds the costs associated with our business, we will not be able to generate positive cash flow on a sustained basis and our revenue growth rate may decline. Additionally, we base our expenses and investment plans on our estimates of revenue and gross profit. If our assumptions prove to be wrong, we may spend more than we anticipate or may generate less revenue than anticipated. If we fail to continue to grow our revenue, our business, financial condition and results of operations could be materially and adversely affected.
Our business is subject to certain risks related to the operation of TDA.
In the years ended December 31, 2020 and 2019, $196.7 million and $390.2 million, respectively, of our revenues were related to sales at TDA, representing approximately 14.5% and 32.8% of our total revenues for those years. For the years ended December 31, 2020 and 2019, TDA gross profit was $12.1 million and $25.4 million, respectively. Lower foot traffic in the initial phase of the COVID-19 pandemic, as well as reduced inventory at the TDA location as the ecommerce business scales, continues to negatively affect our TDA business. Vehicle sales at TDA also could be adversely affected for a variety of other reasons, including severe weather conditions or other catastrophic events in the Houston area that could damage our facilities and/or our inventory and keep customers from coming onsite, or economic downturns or other factors affecting the Houston area that could lead to reduced demand. Although revenues and gross profit from TDA are expected to decline as a percentage of total revenues over time as we scale our ecommerce business, a material decline in vehicle sales at TDA in the near term would adversely affect our results of operations. In addition, we acquired TDA in 2015, and, in connection with this acquisition, we could continue to be subject to risks and liabilities from the operation of TDA under its prior ownership, and the indemnities that we negotiated as part of the transaction may not adequately protect us.
We may experience seasonal and other fluctuations in our quarterly results of operations, which may not fully reflect the underlying performance of our business.
We expect our quarterly results of operations, including our revenue, gross profit and cash flow to vary significantly in the future based in part on, among other things, vehicle-buying patterns. Vehicle sales generally exhibit seasonality with an increase in sales early in the year that reaches its highest point late in the first quarter and early in the second quarter, which then levels off through the rest of the year with the lowest level of sales in the fourth quarter. This seasonality historically corresponds with the timing of income tax refunds, which can provide a primary source of funds for customers’ payments on used vehicle purchases. Used vehicle prices also exhibit seasonality, with used vehicles depreciating at a faster rate in the last two quarters of each year and a slower rate in the first two quarters of each year.
Other factors that may cause our quarterly results to fluctuate include, without limitation:
|
|
• |
our ability to attract new customers; |
|
|
• |
our ability to generate sales of value-added products; |
|
|
• |
changes in the competitive dynamics of our industry; |
|
|
• |
the regulatory environment; |
|
|
• |
expenses associated with unforeseen quality issues; |
22
|
|
|
|
• |
macroeconomic conditions, including the impact of the COVID-19 pandemic; |
|
|
• |
the scope, impact and timing of any federal economic stimulus checks; |
|
|
• |
our ability to maintain sufficient inventory of desirable vehicles; |
|
|
• |
seasonality of the automotive industry and third-party aggregation websites on which we rely; |
|
|
• |
changes that impact disposable income, including changes that impact the timing or amount of income tax refunds; and |
|
|
• |
litigation or other claims against us. |
In addition, a significant portion of our expenses are fixed and do not vary proportionately with fluctuations in revenues. As a result of these seasonal fluctuations, our results in any quarter may not be indicative of the results we may achieve in any subsequent quarter or for the full year, and period-to-period comparisons of our results of operations may not be meaningful.
Our level of indebtedness could have a material adverse effect on our ability to generate sufficient cash to fulfill our obligations under such indebtedness, to react to changes in our business and to incur additional indebtedness to fund future needs.
As of December 31, 2020, we had outstanding $329.2 million aggregate principal amount of borrowings under our 2020 Vehicle Floorplan Facility (as defined in “Management’s Discussion and Analysis of Financial Condition and Results of Operations—Liquidity and Capital Resources—Vehicle Financing”). Our interest expense was $9.7 million for the year ended December 31, 2020.
If our cash flows and capital resources are insufficient to fund our debt service obligations, we may be forced to reduce or delay investments and capital expenditures, or to sell assets, seek additional capital or restructure or refinance our indebtedness. Our ability to restructure or refinance our current or future debt will depend on the condition of the capital markets and our financial condition at such time. Any refinancing of our debt could be at higher interest rates and may require us to comply with more onerous covenants, which could further restrict our business operations. The terms of existing or future debt instruments may restrict us from adopting some of these alternatives. Any failure to make payments of interest and principal on our outstanding indebtedness on a timely basis or failure to comply with certain restrictions in our debt instruments would result in a default under our debt instruments. In the event of a default under any of our current or future debt instruments, the lenders could elect to declare all amounts outstanding under such debt instruments to be due and payable. Furthermore, our 2020 Vehicle Floorplan Facility restricts our ability to dispose of assets and/or use the proceeds from the disposition. We may not be able to consummate any such dispositions or to obtain the proceeds that we could realize from them and these proceeds may not be adequate to meet any debt service obligations then due.
In addition, our indebtedness under our 2020 Vehicle Floorplan Facility bears interest at variable rates. Because we have variable rate debt, fluctuations in interest rates may affect our cash flows or business, financial condition and results of operations. We may attempt to minimize interest rate risk and lower our overall borrowing costs through the utilization of derivative financial instruments, primarily interest rate swaps.
We may require additional debt and equity capital to pursue our business objectives and respond to business opportunities, challenges or unforeseen circumstances. If such capital is not available to us, our business, financial condition and results of operations may be materially and adversely affected.
We may require additional capital to pursue our business objectives and respond to business opportunities, challenges or unforeseen circumstances, including to increase our marketing expenditures to improve our brand awareness, build and maintain our inventory of used vehicles, develop new products or services or further improve existing products and services, expand and enhance our operating and proprietary logistics infrastructure and acquire complementary businesses and technologies. Accordingly, we may need to engage in equity or debt financings to secure additional funds. However, additional funds may not be available when we need them, on terms that are acceptable to us, or at all. Moreover, any debt financing that we secure in the future could involve restrictive covenants which may make it more difficult for us to obtain additional capital and to pursue business opportunities. Volatility in the credit markets may also have an adverse effect on our ability to obtain debt financing. If we raise additional funds through further issuances of equity or convertible debt securities, our existing stockholders could suffer significant dilution, and any new equity securities we issue could have rights, preferences and privileges superior to those of holders of our common stock. If we are unable to obtain adequate financing or financing on terms satisfactory to us when we require it, we may be forced to obtain financing on undesirable terms or our ability to continue to pursue our business objectives and to respond to business opportunities, challenges or unforeseen circumstances could be significantly limited, and our business, financial condition and results of operations could be materially and adversely affected.
23
We currently rely on an agreement with a single lender to finance our vehicle inventory purchases under our 2020 Vehicle Floorplan Facility. If our relationship with this lender were to terminate, and we fail to acquire alternative sources of funding to finance our vehicle inventory purchases, we may be unable to maintain sufficient inventory, which would adversely affect our business, financial condition and results of operations.
We rely on a revolving credit agreement with a single lender to finance our vehicle inventory purchases under our 2020 Vehicle Floorplan Facility. Outstanding borrowings are due as financed vehicles are sold, and the 2020 Vehicle Floorplan Facility is secured by our vehicle inventory and certain other assets. If we are unable to maintain our 2020 Vehicle Floorplan Facility, which expires in September 2022, absent renewal, on favorable terms or at all, or if the agreement is terminated or expires and is not renewed with our existing third-party lender or we are unable to find a satisfactory replacement, our inventory supply may decline, resulting in fewer vehicles available for sale on our website. Moreover, new funding arrangements may be at higher interest rates or subject to other less favorable terms. These financing risks, in addition to potential rising interest rates and changes in market conditions, if realized, could negatively impact our business, financial condition and results of operations. See “Management’s Discussion and Analysis of Financial Condition and Results of Operations—Liquidity and Capital Resources—Vehicle Financing.”
Risks Related to Our Growth and Strategy
Our recent, rapid growth may not be indicative of our future growth and, if we continue to grow rapidly, we may not be able to manage our growth effectively.
Our revenue grew from $1.2 billion for the year ended December 31, 2019 to $1.4 billion for the year ended December 31, 2020. We expect that, in the future, even if our revenue continues to increase, our rate of growth may decline. In any event, we will not be able to grow as fast or at all if we do not:
|
|
• |
increase the number of unique visitors to our website, the number of qualified visitors to our website (i.e. those who have the intent and ability to transact), and the number of customers transacting on or through our platform; |
|
|
• |
further enhance the quality of our vehicle offerings and value-added products, and introduce high quality new offerings and features on our platform; |
|
|
• |
acquire sufficient high-quality inventory at an attractive cost to meet the increasing demand for our vehicles; |
|
|
• |
further invest in and enhance the quality of our logistics operations, including our customer delivery experience; and |
• further develop the functionality of our website and mobile applications to facilitate fully digital transactions and reduce the need for continued investments in staffing for sales and sales support functions.
Our business has grown rapidly as new customers have purchased vehicles and value-added products from us. However, our business is relatively new and has operated at substantial scale for only a limited period of time. Given this limited history, it is difficult to predict whether we will be able to maintain or grow our business. Our historical revenue growth should not be considered indicative of our future performance. We have encountered, and will continue to encounter, risks and difficulties frequently experienced by growing companies in rapidly changing industries, including difficulties in our ability to achieve market acceptance of our platform and attract customers, as well as increasing competition and increasing expenses as we continue to grow our business. We also expect that our business will evolve in ways that may be difficult to predict. For example, over time our investments that are intended to drive new customer traffic to our website may be less productive than expected. In the event of this or any other adverse developments, our continued success will depend on our ability to successfully adjust our strategy to meet changing market dynamics. If we are unable to do so, our business, financial condition and results of operations could be materially and adversely affected.
Our recent, rapid growth has placed and may continue to place significant demands on our management and our operational and financial resources. In addition to our significant growth in sales and revenues, we have experienced significant growth in the number of customers on our platform as well as the amount of data that we analyze. Although we have hired additional personnel, our operations have not kept pace with our top-line growth, which has resulted in backlog in our operations that have adversely affected our customer experience. We expect to continue hiring additional personnel to support our continued rapid growth. In addition, our organizational structure is becoming more complex as we add staff, and we will need to continue to improve our operational, financial and management controls as well as our reporting systems and procedures. This will require significant capital expenditures and the allocation of valuable management resources to grow and adapt in these areas without undermining our corporate culture of teamwork. If we cannot manage our growth effectively to maintain the quality and efficiency of our customers’ experience and/or the quality of the vehicles we sell, our business, financial condition and results of operations could be materially and adversely affected.
24
We have a limited operating history and are still building out our foundational systems.
We commenced operations in 2012 and acquired TDA in 2015 and, as a result, have a limited operating history. Moreover, over the past four years, we brought in a new senior leadership team that has refocused our strategy, accelerated our growth and committed us to pursue a path to profitability. To execute this strategy, we have invested, and continue to invest, in enhancing our foundational systems as we scale our business, including design and expansion of website functionality and features, mobile application development, advancement and deployment of sophisticated data analytics, lean manufacturing technology and logistics network management, and work on all such foundational systems is ongoing. Fundamental to our continued growth and path to profitability is the further development of the functionality of our website and mobile applications to facilitate fully digital transactions and reduce the need for continued investments in staffing for the sales and sales support functions.
These types of activities and investments subject us to various costs and risks, including increased capital expenditures, additional administration and operating expenses, potential disruption of our internal control structure, acquisition and retention of sufficiently skilled personnel, demands on management time, the introduction of errors or vulnerabilities and other risks and costs of delays or difficulties in transitioning to or integrating new systems into our foundational systems. There can be no assurance that we will succeed in successfully developing our capabilities in each of these areas, or that a desirable return on investment will be achieved on the investments made in these areas. A failure to successfully execute on the development of our foundational systems would adversely affect our business, financial condition and results of operations.
We are expanding our proprietary logistics operations, including vehicle pick-ups and delivery from our last mile hubs and line haul transportation of vehicles between our last mile hubs, which will further expose us to increased risks related to ownership of infrastructure and the transportation of vehicles.
We experienced disruptions across our logistics network at the outset of the COVID-19 pandemic, with a reduced number of third-party providers available to deliver our vehicles, which resulted in a slowdown of inventory being picked up and delivered to our VRCs and in sold units being delivered to customers. In addition, our transportation costs increased as the remaining carriers have increased prices.
In response to these disruptions, and to further enhance the quality of our logistics operations and our customer experience, we have been accelerating our investment in our proprietary logistics operations, including expanding our owned vehicle fleet. Additionally, as of February 15, 2021, we have opened twelve last mile hubs around the country at third-party facilities, through which we will coordinate directly with our customers to schedule deliveries in an effort to further strengthen our customer experience. We also have invested in short-haul trucks to make regional deliveries from our last mile hubs, and have begun to invest in long-haul vehicles for hub-to-hub shipments. These investments will require additional capital expenditures and operating expenses, increase our current risks and expose us to new risks. These risks include local and federal regulations, vehicular crashes, injury, insufficient internal capacity, taxes, license and registration fees, insurance premiums, self-insurance levels, difficulty in recruiting and retaining qualified drivers, maintaining the truck fleet, disruption of our technology systems, equipment supply, equipment quality, and increasing equipment and operational and overhead costs. Our failure to successfully manage the expansion of our logistics operations could cause delays and increase costs in our inbound and outbound shipping, which may adversely affect our operating results and financial condition.
Our ability to expand value-added product offerings and introduce additional products and services may be limited, which could have a material adverse effect on our business, financial condition and results of operations.
Currently, our third-party value-added products consist of finance and protection products, which includes third-party financing of customers’ vehicle purchases, as well as other value-added products, such as vehicle service contracts, GAP protection and tire and wheel coverage. If we introduce new value-added products or expand existing offerings on our platform, such as insurance referral services, music services and vehicle diagnostic and tracking services, we may incur losses or otherwise fail to enter these markets successfully. Our expansion into these markets may place us in competitive and regulatory environments with which we are unfamiliar and involve various risks, including the need to invest significant resources to familiarize ourselves with such frameworks and the possibility that returns on such investments may not be achieved for several years, if at all. In attempting to establish new offerings, we expect to incur significant expenses and face various other challenges, such as expanding our customer experience team and management personnel to cover these markets and complying with complicated regulations that apply to these markets. In addition, we may not successfully demonstrate the value of these value-added products to customers, and failure to do so would compromise our ability to successfully expand into these additional revenue streams. Any of these risks, if realized, could materially and adversely affect our business, financial condition and results of operations.
25
We rely on third-party vendors for key components of our business, which exposes us to increased risks.
In line with our asset-light business strategy, many components of our business, including our reconditioning facilities, our logistics operations, our customer financing and our customer experience teams are primarily provided by third parties. We carefully select our third-party vendors, but we cannot control their actions. If our vendors fail to perform as we expect, our operations and reputation could suffer if the failure harms the vendors’ ability to serve us and our customers. One or more of these third-party vendors may experience financial distress, staffing shortages or liquidity challenges, file for bankruptcy protection, go out of business, or suffer disruptions in their business due to the COVID-19 pandemic. The use of third-party vendors represents an inherent risk to our Company that could have a material adverse effect on our business, financial condition and results of operations.
Our future growth and profitability relies heavily on the effectiveness and efficiency of our marketing and branding efforts, and these efforts may not be successful.
Because we are a consumer brand, we rely heavily on marketing and advertising to increase brand visibility and attract potential customers. Advertising expenditures are and will continue to be a significant component of our operating expenses, and there can be no assurance that we will achieve a meaningful return on investment on such expenditures. We continue to evolve our marketing strategies, adjusting our messages, the amount we spend on advertising and where we spend it, and no assurance can be given that we will be successful in developing effective messages and in achieving efficiency in our marketing and advertising expenditures. As a result, our future growth and profitability will depend in part on:
|
|
• |
the effectiveness of our national television advertising campaigns; |
|
|
• |
the effectiveness of our performance-based digital marketing efforts; |
|
|
• |
the effectiveness and efficiency of our online advertising and search marketing programs in generating consumer awareness of, and sales on, our platform; |
|
|
• |
our ability to prevent confusion among customers that can result from search engines that allow competitors to use or bid on our trademarks to direct customers to competitors’ websites; |
|
|
• |
our ability to prevent internet publication of false or misleading information regarding our platform or our competitors’ offerings; and |
|
|
• |
the effectiveness of our direct-to-consumer advertising to reduce our dependency on third-party aggregation websites. |
We currently advertise through a blend of brand and direct advertising channels with the goal of increasing the strength, recognition and trust in the Vroom brand and driving more unique visitors to our platform. Our marketing strategy includes national television campaigns, and performance marketing through digital platforms, including both auto-centric lead generation platforms and broader consumer-facing platforms. We also strategically use targeted radio campaigns and billboards and other local advertising in key markets, and we are expanding our national marketing efforts featuring Sell Us Your Car®. As such, a significant component of our marketing spend involves the use of various marketing techniques, including programmatic ad-buying, interest targeting, retargeting and email nurturing. Future growth and profitability will depend in part on the cost and efficiency of our promotional advertising and marketing programs and related expenditures, including our ability to create greater awareness of our platform and brand name, to appropriately plan for future expenditures and to drive the promotion of our platform.
Additionally, our business model relies on our ability to grow rapidly and to decrease incremental customer acquisition costs as we grow. If we are unable to recover our marketing costs through increases in customer traffic and incremental sales, if our advertising partners refuse to work with us at competitive rates or at all, or if our broad marketing campaigns are not successful or are terminated, our growth may suffer and our business, financial condition and results of operations could be materially and adversely affected.
26
We may acquire other companies or technologies, which could divert our management’s attention, result in additional dilution to our stockholders and otherwise disrupt our operations and harm our results of operations.
Our success will depend, in part, on our ability to grow our business in response to the demands of consumers and other constituents within the automotive industry, as well as competitive pressures. Although we have no plans to do so currently, in some circumstances, we may determine to grow our business through the acquisition of complementary businesses and technologies rather than through internal development, such as our recent acquisition of the CarStory business. The identification of suitable acquisition candidates can be difficult, time-consuming and costly, and we may not be able to successfully complete identified acquisitions. The risks we face in connection with acquisitions include:
|
|
• |
diversion of management time and focus from operating our business to addressing acquisition integration challenges; |
|
|
• |
coordination of technology, research and development and sales and marketing functions; |
|
|
• |
transition of the acquired company’s users to our platform; |
|
|
• |
retention of employees from the acquired company; |
|
|
• |
potential adverse reactions to the acquisition by an acquired company’s customers; |
|
|
• |
cultural challenges associated with integrating employees from the acquired company into our organization; |
|
|
• |
integration of the acquired company’s accounting, management information, human resources and other administrative systems; |
|
|
• |
the need to implement or improve controls, policies and procedures at a business that, prior to the acquisition, may have lacked effective controls, policies and procedures; |
|
|
• |
potential write-offs of intangibles or other assets acquired in such transactions that may have an adverse effect our results of operations; |
|
|
• |
liability for activities of the acquired company before the acquisition, including patent and trademark infringement claims, violations of laws, commercial disputes, tax liabilities and other known and unknown liabilities; and |
|
|
• |
litigation or other claims in connection with the acquired company, including claims from terminated employees, customers, former stockholders or other third parties. |
Our failure to address these risks or other problems encountered in connection with our past or future acquisitions and investments could cause us to fail to realize the anticipated benefits of these acquisitions or investments, cause us to incur unanticipated liabilities and otherwise harm our business. Future acquisitions also could result in dilutive issuances of our equity securities, the incurrence of debt, contingent liabilities or amortization expenses, any of which could harm our financial condition. Also, the anticipated benefits of any acquisitions may not materialize. Any of these risks, if realized, could materially and adversely affect our business, financial condition and results of operations.
Risks Related to Our Operations
We face a variety of risks associated with the operation of our VRCs by us and our third-party service providers, any of which could materially and adversely affect our business, financial condition and results of operations.
We and third-party service providers operate our VRCs. If we are unable to maintain our relationship with our third-party service providers, such service providers cease to provide the services we need, or such service providers are unable to effectively deliver our services to our standards on timelines and at the prices we have negotiated, and we are unable to contract with alternative vendors or replace such service providers with a Vroom VRC (which may require significant time and investment), we could experience a decrease in the finished goods output sufficient to scale the business and quality of our reconditioning services, delays in listing our inventory, additional expenses, delivery delays and loss of potential and existing customers and related revenues, which may materially and adversely affect our business, financial condition and results of operations. These risks are exacerbated by the fact that slightly more than half of our current third-party VRCs are primarily operated by one third-party provider.
Moreover, our future growth and profitability depends in part on scaling our reconditioning operations and expanding the geographic reach of those operations in order to reduce shipping costs. We are expanding our reconditioning capacity through third-party VRC locations If for any reason we are unable to expand our reconditioning operations as planned, we could experience operational delays and a decrease in planned inventory. Any operational delays or delays in our planned expansion could have a material adverse effect on our business, financial condition and results of operations.
27
Additionally, we and our third-party vendors are required to obtain approvals, permits and licenses from state regulators and local municipalities to operate our VRCs. There could be delays in obtaining the requisite approvals, permits, financing and licenses to operate our VRCs or we may not be able to obtain them at all. If we or our vendors encounter delays in obtaining or cannot obtain the requisite approvals, permits, financing and licenses to operate our VRCs in desirable locations, our business, financial condition and results of operations may be materially and adversely affected.
We rely primarily on third-party carriers to transport our vehicle inventory throughout the United States. Thus, we are subject to business risks and costs associated with such carriers and with the transportation industry, many of which are out of our control.
Although we are expanding our proprietary logistics network, we still primarily rely on third-party carriers to transport vehicles from auctions or individual sellers to VRCs, and then from our VRCs to our customers. As a result, we are exposed to risks associated with the transportation industry such as weather, traffic patterns, local and federal regulations, vehicular crashes, gasoline prices and lack of reliability of many independent carriers. Our third-party carriers’ failure to successfully manage our logistics and fulfilment process could cause a disruption in our inventory supply chain and decrease our inventory sales velocity, which may materially and adversely affect our business, financial condition and results of operations. In addition, third-party carriers who deliver vehicles to our customers could adversely affect the customer experience if they do not perform to our standards of professionalism and courtesy, which could adversely impact our business, financial condition and results of operations.
We rely on third-party service providers to provide financing, as well as value-added products to our customers, and we cannot control the quality or fulfillment of these products.
We rely on third-party lenders to finance our customers’ vehicle purchases. We also offer value-added products to our customers through a third-party service provider, including vehicle service contracts, GAP protection and tire and wheel coverage. Because we utilize third-party service providers, we cannot control all of the factors that might affect the quality and fulfillment of these services and products, including (i) lack of day-to-day control over the activities of third-party service providers, (ii) that such service providers may not fulfill their obligations to us or our customers or may otherwise fail to meet expectations and (iii) that such service providers may terminate their arrangements with us on limited or no notice or may change the terms of these arrangements in a manner unfavorable to us for reasons outside of our control. Such providers also are subject to state and federal regulations and any failure by such third-party service providers to comply with applicable legal requirements could cause us financial or reputational harm.
Our revenues and results of operations are partially dependent on the actions of these third parties. If one or more of these third-party service providers cease to provide these services or products to our customers, tighten their credit standards or otherwise provide services to fewer customers or are no longer able to provide them on competitive terms, it could have a material adverse effect on our business, revenues and results of operations. If we were unable to replace the current third-party providers upon the occurrence of one or more of the foregoing events, it could also have a material adverse effect on our business, revenues and results of operations. In addition, disagreements with such third-party service providers could require or result in costly and time-consuming litigation or arbitration.
Moreover, we receive fees from these third-party service providers in connection with finance, service and protection products purchased by our customers. A portion of the fees we receive on such products is subject to chargebacks in the event of early termination, default or prepayment of the contracts by end-customers, which could adversely affect our business, revenues and results of operations.
28
The current geographic concentration where we provide reconditioning services and store inventory creates an exposure to local and regional downturns or severe weather or catastrophic occurrences that may materially and adversely affect our business, financial condition and results of operations.
We currently conduct our business through multiple VRCs, including our Vroom VRC located outside Houston, Texas, where we hold 22% of our inventory. In addition, more than half of our third-party reconditioning services are conducted through a single provider, with facilities located in California, Florida, Arizona and other states. Any unforeseen events or circumstances that negatively affect these areas, particularly our facilities near Houston, which have experienced flooding and other damage in recent years as a result of severe weather conditions, including hurricanes, could materially and adversely affect our revenues and results of operations. Changes in demographics and population or severe weather conditions and other catastrophic occurrences in areas in which we operate or from which we obtain inventory may materially and adversely affect our results of operations. Such conditions may result in physical damage to our properties, loss of inventory and delays in the delivery of vehicles to our customers.
We depend on key personnel to operate our business, and if we are unable to retain, attract and integrate qualified personnel, our ability to develop and successfully grow our business could be harmed.
We believe our success has depended, and continues to depend, on the efforts and talents of our executives and employees. Our future success depends on our continuing ability to attract, develop, motivate and retain highly qualified and skilled employees. Qualified individuals are in high demand, and we may incur significant costs to attract and retain them. In addition, the loss of any of our key employees or senior management, including our Chief Executive Officer, Paul J. Hennessy, could materially and adversely affect our ability to execute our business plan and strategy, and we may not be able to find adequate replacements on a timely basis, or at all. Our executive officers and other employees are at-will employees, which means they may terminate their employment relationship with us at any time, and their knowledge of our business and industry would be extremely difficult to replace. We may not be able to retain the services of any members of our senior management or other key employees. If we do not succeed in attracting well-qualified employees or retaining and motivating existing employees, our business, financial condition and results of operations could be materially and adversely affected.
Risks Related to Our Customer Experience
We have entered into outsourcing arrangements with third parties related to our customer experience team, and any difficulties experienced in these arrangements could result in an interruption of our ability to sell our vehicles and value-added products.
We have entered into several outsourcing arrangements with third parties related to our customer experience teams, including with respect to our customer inquiries, sales, purchases, financing, document support, customer service and other customer experience operations.
Currently, the substantial majority of inquiries, sales, purchases and financings of our vehicles in our ecommerce business are conducted by phone through a third-party customer experience center located in Detroit, Michigan. Thus, the customer experience center is fundamental to the success of our business. As a result, the success of our business and our customer experience is partially dependent on a third party over which we have limited control. If the third party’s systems and operations fail or if the third party is otherwise unable to perform its sales function, we would be limited in our ability to complete customer transactions, which would make it more difficult to sell vehicles and value-added products through our platform.
We also rely on other third parties to provide customer service, document support and other important customer experience operations. If the customer experience center or any of these third parties are unable to perform to our standards or to provide the level of service required or expected by our customers, or we are unable to renegotiate our agreements with them on attractive terms or at all, or if we are unable to contract with alternative third-party providers, our business, financial condition and results of operations may be harmed and we may be forced to pursue alternatives to provide these services, which could result in delays, interruptions, additional expenses and loss of potential and existing customers and related revenues.
29
If the quality of our customer experience, our reputation or our brand were negatively affected, our business, sales and results of operations could be materially and adversely affected.
Our business model is primarily based on our ability to enable consumers to buy and sell used vehicles through our ecommerce platform in a seamless, transparent and hassle-free transaction. If consumers fail to perceive us as a trusted brand with a strong reputation and high standards, or if an event occurs that damages our reputation, it could adversely affect customer demand and have a material adverse effect on our business, revenues and results of operations. Even the perception of a decrease in the quality of our customer experience or brand could impact results. Our high rate of growth makes maintaining the quality of our customer experience more difficult, and we have encountered operational challenges in keeping up with our rapid growth over the past year. Backlogs in our business developed as there was more sales volume than we had the capacity to process, resulting in delays that degraded the customer experience.
Complaints or negative publicity about our business practices, marketing and advertising campaigns, vehicle quality, customer service, delivery experience, compliance with applicable laws and regulations, data privacy and security or other aspects of our business, including on consumer platforms such as the Better Business Bureau, consumer facing blogs and social media websites, could diminish consumer confidence in our platform and adversely affect our brand. The growing use of social media increases the speed with which information and opinions can be shared and thus the speed with which our reputation can be damaged. If we fail to deliver the desired customer experience, or fail to correct or mitigate misinformation or negative information about us, our platform, our vehicle inventory, our customer experience, our brand or any aspect of our business, including information spread through social media or traditional media channels, it could materially and adversely affect our business, financial condition and results of operations.
Risks Related to Cybersecurity and Privacy
An actual or perceived failure to maintain the security of personal information and other customer data that we collect, store, process, and use could harm our business, financial condition and results of operations.
We collect, store, process, and use personal information and other customer data, and rely in part on third parties that are not directly under our control, including our third-party customer experience teams, to manage certain areas of these operations. For example, we rely on encryption, storage, and processing technology developed by third parties to securely transmit, operate on and store such information. Due to the volume and sensitivity of the personal information and data we and these third parties manage and expect to manage in the future, as well as the nature of our customer base, the security features of our information systems are critical. Any failure or perceived failure to maintain the security of personal and other data that is provided to us by customers, employees and vendors could harm our reputation and brand and expose us to a risk of loss or litigation and possible liability, any of which could adversely affect our business, financial condition, and results of operations.
Additionally, concerns about our practices with regard to the collection, use or disclosure of personal information or other privacy-related matters, even if unfounded, could harm our business, financial condition and results of operations. We are subject to numerous federal, state and local laws and regulations regarding privacy, cybersecurity and the collection, use and disclosure or personal information and other data. The scope and interpretation of these laws continue to evolve and may be inconsistent across jurisdictions. New laws also may be enacted. Further, we are subject to contractual requirements and others’ privacy policies that govern how we use and protect personal information and other data. These obligations may be interpreted and applied inconsistently and may conflict with other rules or our practices. Any failure or perceived failure by us to comply with our privacy policies or obligations may result in governmental enforcement actions, litigation or negative publicity that could have an adverse effect on our business. If our third-party service providers violate applicable laws, contractual obligations or our policies, then such violations also may put consumer, employee and vendor information at risk and could, in turn, harm our reputation, business and operating results. We carry out ongoing efforts to implement a number of security controls to mitigate these risks.
If we sustain cyber-attacks or other privacy or data security incidents that result in security breaches, we could suffer a loss of sales and increased costs, exposure to significant liability, reputational harm and other negative consequences.
Threat actors are increasingly sophisticated and can operate large-scale complex automated attacks. Similar to most IT systems and companies, there is a consistent threat from cyber-attacks, viruses, malicious software, physical break-ins, theft, ransomware, phishing, social engineering, unintentional employee error or malfeasance, system availability, and other security breaches. Further, third-party hosts or service providers are also a source of security concerns as it relates to failures of their own security systems and infrastructure. Our technology infrastructure may be
30
subject to increased risk of slowdown or interruption as a result of integration with third-party services, including cloud services, and/or failures by such third parties, which are beyond our control. The costs to eliminate or address evolving security threats and vulnerabilities before or after a cyber-incident could be significant. Our remediation efforts may not be successful and could result in interruptions, delays or cessation of service and loss of existing or potential suppliers or players.
Although we have insurance coverage for losses associated with cyber-attacks, as with all insurance policies, there are coverage exclusions and limitations, and our coverage may not be sufficient to cover all possible claims, and we may still suffer losses that could have a material adverse effect on our business, including reputational damage. We also could be negatively impacted by existing and proposed U.S. laws and regulations, and government policies and practices related to cybersecurity, data privacy, and data localization. In the event that we or our service providers are unable to prevent, detect, and remediate the foregoing security threats and risks, our operations could be disrupted or we could incur financial, legal or reputational losses arising from misappropriation, misuse, leakage, falsification or intentional or accidental release or loss of information maintained in our information systems and networks, including personal information of our employees and our customers.
Risks Related to Our Industry and General Economic Conditions
Our business is sensitive to changes in the prices of new and used vehicles.
Any significant changes in retail prices for new or used vehicles could have a material adverse effect on our business, financial condition and results of operations. For example, if retail prices for used vehicles rise relative to retail prices for new vehicles, it could make buying a new vehicle more attractive to our customers than buying a used vehicle, which could have a material adverse effect on our business, financial condition and results of operations and could result in reduced vehicle sales and lower revenue. Additionally, manufacturer incentives, including financing, could contribute to narrowing the price gap between new and used vehicles.
Used vehicle prices also may decline due to an increased number of new vehicle lease returns over the next several years. In addition, rental car company bankruptcies may cause a broader disruption in the used vehicle market and adversely impact used vehicle prices. While lower used vehicle prices reduce our cost of acquiring new inventory, lower prices could also lead to reductions in the value of inventory we currently hold, which could have a negative impact on gross profit. Moreover, any significant changes in retail prices due to scarcity or competition for used vehicles could impact our ability to source desirable inventory for our customers, which could have a material adverse effect on our results of operations and could result in fewer used-car sales and lower revenue. Furthermore, any significant changes in wholesale prices for used vehicles could have a negative impact on our results of operations by reducing wholesale margins.
Our business is dependent upon access to desirable vehicle inventory. Obstacles to acquiring attractive inventory, whether because of supply, competition or other factors, may have a material adverse effect on our business, financial condition and results of operations.
We acquire vehicles for sale from auctions, consumers, rental car companies, OEMs and dealers. There can be no assurance that the supply of desirable used vehicles will be sufficient to meet our needs. In addition, we purchase a significant amount of our inventory from one third-party auction source, which accounted for approximately 26% of our inventory sourcing for the year ended December 31, 2020. If this third party is unable to fulfill our inventory needs or if we are unable to source desirable used vehicles from alternative third-party providers, we may lack sufficient inventory and, as a result, may lose potential and existing customers and related revenues. Moreover, we sell consumer-sourced vehicles that do not meet our retail standards to auctions, which may result in lower revenues and also could lead to reductions in our available inventory.
Additionally, we appraise thousands of consumer vehicles daily and evaluate potential purchases based on mechanical soundness, consumer desirability and relative value in relation to retail inventory or wholesale disposition. If we fail to adjust appraisal offers to stay in line with broader market trade-in offer trends or fail to recognize those trends, it could adversely affect our ability to acquire inventory. Our ability to source vehicles through our appraisal process also could be affected by competition, both from new and used vehicle dealers directly and through third-party websites driving appraisal traffic to those dealers. In addition, we remain dependent on third parties to sell us used vehicles, and there can be no assurance of an adequate supply of desirable vehicles on terms that are attractive to us. A reduction in the availability of or access to sources of inventory for any reason could have a material adverse effect on our business, financial condition and results of operations.
31
Our business is dependent upon our ability to expeditiously sell inventory. Failure to expeditiously sell our inventory could have a material adverse effect on our business, financial condition and results of operations.
Sourcing of our used vehicle inventory is based in large part on projected demand. If actual sales are materially less than our forecasts, we would experience an over-supply of used vehicle inventory. An over-supply of used vehicle inventory will generally cause downward pressure on our vehicle sales prices and margins and decrease inventory sales velocity. Vehicles depreciate rapidly, so a failure to expeditiously sell our inventory or to efficiently recondition and deliver vehicles to customers could hurt our gross profit per unit and materially and adversely affect our business, financial condition and results of operations. The rate at which customers return vehicles increased in recent periods. In the years ended December 31, 2020 and December 31, 2019, we had approximately 5.1% and 4.8%, respectively, in total vehicle returns and approximately 4.0% and 3.7%, respectively, in vehicle returns net of vehicle swaps. There is no assurance these rates will remain similar to our historical levels. Vehicles returned continue to depreciate in value and if return rates continue to increase, our revenue, business, financial condition and results of operations could be materially and adversely affected.
Used vehicle inventory has typically represented a significant portion of our total assets. Having such a large portion of our total assets in the form of used vehicle inventory for an extended period of time subjects us to write-downs and other risks that affect our results of operations. Accordingly, if we have excess inventory, if we are unable to ship and deliver vehicles efficiently or if our inventory sales velocity decreases, we may be unable to liquidate such inventory at prices that would allow us to meet unit economics targets or to recover our costs, which could have a material adverse effect on our business, financial condition and results of operations.
We participate in a highly competitive industry, and pressure from existing and new companies may adversely affect our business and results of operations.
Our current and future competitors may include:
|
|
• |
traditional new and used car dealerships; |
|
|
• |
large, national car dealers, such as CarMax and AutoNation, which are expanding into online sales, including “omni-channel” offerings; |
|
|
• |
used car dealers or marketplaces that currently have existing ecommerce businesses or online platforms, such as Carvana; |
|
|
• |
the peer-to-peer market, utilizing sites such as Facebook, Craigslist.com, eBay Motors and Nextdoor.com; and |
|
|
• |
sales by rental car companies directly to consumers of used vehicles which were previously utilized in rental fleets, such as Enterprise Car Sales. |
Internet and online automotive sites could change their models to directly compete with us, such as Google, Amazon, AutoTrader.com, Edmunds.com, KBB.com, Autobytel.com, TrueCar.com, CarGurus and Cars.com. In addition, automobile manufacturers such as General Motors, Ford and Volkswagen could change their sales models to better compete with our model through technology and infrastructure investments. While such enterprises may change their business models and endeavor to compete with us, the purchase and sale of used vehicles through ecommerce presents unique challenges.
Our competitors also compete in the online market through companies that provide listings, information, lead generation and car buying services designed to reach customers and enable dealers to reach these customers and providers of offline, membership-based car buying services such as the Costco Auto Program.
We also expect that new competitors will continue to enter the traditional and ecommerce automotive retail industry with competing brands, business models and products and services, which could have an adverse effect on our revenue, business and financial results. For example, traditional car dealers could transition their selling efforts to the internet, allowing them to sell vehicles across state lines and compete directly with our online offering and no-negotiating pricing model.
Our current and potential competitors may have significantly greater financial, technical, marketing and other resources than we have, and the ability to devote greater resources to the development, promotion and support of their businesses, platforms, and related products and services. Additionally, they may have more extensive automotive industry relationships, longer operating histories and greater name recognition than we have. As a result, these competitors may be able to respond more quickly to consumer needs with new technologies and to undertake more extensive marketing or promotional campaigns. If we are unable to compete with these companies, the demand for our used vehicles and value-added products could substantially decline.
32
In addition, if one or more of our competitors were to merge or partner with another of our competitors, the change in the competitive landscape could adversely affect our ability to compete effectively. We may not be able to compete successfully against current or future competitors, and competitive pressures may harm our business, financial condition and results of operations. Furthermore, if our competitors develop business models, products or services with similar or superior functionality to our platform, it may adversely affect our business. Additionally, our competitors could use their political influence and increase lobbying efforts to encourage new regulations or interpretations of existing regulations that would prevent us from operating in certain markets.
Changes in the auto industry may threaten our business model if we are unable to adapt.
The market for used vehicles may be impacted by the significant, and likely accelerating, changes to the broader automotive industry, which may render our existing or future business model or our ability to sell vehicles, products and services less competitive, unmarketable or obsolete. For example, technology is currently being developed to produce automated, driverless vehicles that could reduce the demand for, or replace, traditional vehicles, including the used vehicles that we acquire and sell. Additionally, ride-hailing and ride-sharing services are becoming increasingly popular as a means of transportation and may decrease consumer demand for the used vehicles we sell, particularly as urbanization increases. Furthermore, new technologies such as autonomous driving software have the potential to change the dynamics of car ownership in the future. If we are unable to or otherwise fail to successfully adapt to such industry changes, our business, financial condition and results of operations could be materially and adversely affected.
Prospective purchasers of vehicles may choose not to shop online, which would prevent us from growing our business.
Our success will depend, in part, on our ability to attract additional customers who have historically purchased vehicles through traditional dealers. The online market for vehicles is significantly less developed than the online market for other goods and services such as books, music, travel and other consumer products. If this market does not gain widespread acceptance, our business may suffer. Furthermore, we may have to incur significantly higher and more sustained advertising and promotional expenditures or offer more incentives than we currently anticipate in order to attract additional consumers to our platform and convert them into purchasing customers. Specific factors that could prevent consumers from purchasing vehicles through our ecommerce platform include:
|
|
• |
concerns about buying vehicles without face-to-face interaction with sales personnel and the ability to physically test-drive and examine vehicles; |
|
|
• |
preference for a more personal experience when purchasing vehicles; |
|
|
• |
insufficient level of desirable inventory; |
|
|
• |
pricing that does not meet consumer expectations; |
|
|
• |
delayed deliveries; |
|
|
• |
inconvenience with returning or exchanging vehicles purchased online; |
|
|
• |
concerns about the security of online transactions and the privacy of personal information; and |
|
|
• |
usability, functionality and features of our platform. |
If the online market for vehicles does not continue to develop and grow, our business will not grow and our business, financial condition and results of operations could be materially and adversely affected.
General business and economic conditions, and risks related to the larger automotive ecosystem, including consumer demand, could reduce our sales and profitability, which could have a material adverse effect on our business, financial condition and results of operations.
Our business is affected by general business and economic conditions. The global economy often experiences periods of instability, and this volatility may result in reduced demand for our vehicles and value-added products, reduced spending on vehicles, inability of customers to obtain credit to finance purchases of vehicles and decreased consumer confidence to make discretionary purchases. Consumer purchases of new and used vehicles generally decline during recessionary periods and other periods in which disposable income is adversely affected.
Purchases of new and used vehicles are typically discretionary for consumers and have been, and may continue to be, affected by negative trends in the economy and other factors, including rising interest rates, the cost of energy and gasoline, the availability and cost of consumer credit, reductions in consumer confidence and fears of recession, stock
33
market volatility, increased regulation and increased unemployment. Increased environmental regulation has made, and may in the future make, used vehicles more expensive and less desirable for consumers.
In addition, changing trends in consumer tastes, negative business and economic conditions and market volatility may make it difficult for us to accurately forecast vehicle demand trends, which could cause us to increase our inventory carrying costs and could materially and adversely affect our business, financial condition and results of operations.
Our business is sensitive to conditions affecting automotive manufacturers, including manufacturer recalls.
Adverse conditions affecting one or more automotive manufacturers could have a material adverse effect on our business, financial condition and results of operations and could impact our supply of used vehicles. In addition, manufacturer recalls are a common occurrence that have accelerated in frequency and scope in recent years. In the instance of an open recall, we may have to temporarily remove vehicles from inventory and may be unable to liquidate such inventory in a timely manner or at all. Because we do not have manufacturer authorization to complete recall-related repairs, some vehicles we sell may have unrepaired safety recalls. Such recalls, and our lack of authorization to make recall-related repairs or potential unavailability of parts needed to make such repairs, could (i) adversely affect used vehicle sales or valuations, (ii) cause us to temporarily remove vehicles from inventory, (iii) cause us to sell any affected vehicles at a loss, (iv) force us to incur increased costs and (v) expose us to litigation and adverse publicity related to the sale of recalled vehicles, which could have a material adverse effect on our business, financial condition and results of operations.
Risks Related to Laws and Regulations
We operate in a highly regulated industry and are subject to a wide range of federal, state and local laws and regulations. Failure to comply with these laws and regulations could have a material adverse effect on our business, financial condition and results of operations.
Our business is and will continue to be subject to extensive U.S. federal, state and local laws and regulations. The advertising, sale, purchase, financing and transportation of used vehicles are regulated by every state in which we operate and by the U.S. federal government. The titling and registration of vehicles and the sale of value-added products also are regulated by state laws, and such laws can vary significantly from state to state. Regulations governing the used vehicle industry generally do not contemplate our ecommerce business model. In addition, we are subject to regulations and laws specifically governing the internet and ecommerce and the collection, storage and use of personal information and other customer data. We are also subject to federal and state consumer protection laws, including the Equal Credit Opportunity Act and prohibitions against unfair or deceptive acts or practices. The federal governmental agencies that regulate our business and have the authority to enforce such regulations and laws against us include the U.S. Federal Trade Commission, the U.S. Department of Transportation (“DOT”), the U.S. Occupational Health and Safety Administration, the U.S. Department of Justice and the U.S. Federal Communications Commission. Additionally, we are subject to regulation by individual state dealer licensing authorities, state consumer protection agencies and state financial regulatory agencies. We also are subject to audit by such state regulatory authorities.
State dealer licensing authorities regulate the purchase and sale of used vehicles by dealers within their respective states. The applicability of these regulatory and legal compliance obligations to our ecommerce business is dependent on evolving interpretations of these laws and regulations and how our operations are, or are not, subject to them. We are licensed as a dealer in the States of Texas and Florida and all of our vehicle transactions are conducted under our Texas and Florida licenses. We believe that our activities in other states are not subject to their vehicle dealer licensing laws; however, regulators in such states could seek to require us to maintain a used vehicle dealer license in order to engage in activities in that state.
Most states regulate retail installment sales, including setting a maximum interest rate, caps on certain fees or maximum amounts financed. In addition, certain states require that retail installment sellers file a notice or registration document or have a sales finance license or an installment sellers license in order to solicit or originate installment sales in that state. We have obtained a motor vehicle sales finance license in Texas in connection with our Texas dealer license, and we have obtained a retail installment seller license in Florida in connection with our Florida dealer license. The financial regulatory agency in Pennsylvania determined that we need to obtain an installment seller license in order to enter into retail installment sales with residents of Pennsylvania. As a result, we are not currently offering third-party financing to our customers in Pennsylvania, who must obtain independent financing to the extent needed to fund any vehicle purchases on our platform. We recently obtained a Pennsylvania installment seller license and expect to resume offering financing to Pennsylvania customers in the future.
Any failure to renew or maintain any of the foregoing licenses would materially and adversely affect our business, financial condition and results of operations. Many aspects of our business are subject to regulatory regimes at the state and local level, and we may not have all licenses required to conduct business in every jurisdiction in which we operate.
34
Despite our belief that we are not subject to certain licensing requirements of those state and local jurisdictions, regulators may seek to impose punitive fines for operating without a license or demand we seek a license in those state and local jurisdictions, any of which may inhibit our ability to do business in those state and local jurisdictions, increase our operating expenses and adversely affect our business, financial condition and results of operations.
Our proprietary logistics operations are subject to regulation by the DOT and by the states through which our vehicles travel. Transport vehicle dimensions, transport vehicle conditions, driver motor vehicle record history, driver alcohol and drug testing, and driver hours of service are also subject to both federal and state regulation. More restrictive limitations on vehicle weight and size, condition, trailer length and configuration, methods of measurement, driver qualifications, or driver hours of service would increase our operating expenses and may adversely affect our financial condition, operating results, and cash flows. If we fail to comply with the DOT regulations or if those regulations become more stringent, we could be subject to increased inspections, audits, or compliance burdens. Regulatory authorities could take remedial action including imposing fines, suspending, or shutting down our transportation operations. If any of these events occur, our business, financial condition and results of operations would be adversely affected.
In addition to these laws and regulations that apply specifically to the sale and financing of used vehicles and logistics, our facilities and business operations are subject to laws and regulations relating to environmental protection, occupational health and safety, and other broadly applicable business regulations. We also are subject to laws and regulations involving taxes, tariffs, privacy and data security, anti-spam, pricing, content protection, electronic contracts and communications, mobile communications, consumer protection, information reporting requirements, unencumbered internet access to our platform, the design and operation of websites and internet neutrality.
We are also subject to laws and regulations affecting public companies, including securities laws and Nasdaq listing rules. The violation of any of these laws or regulations could result in administrative, civil or criminal penalties or in a cease-and-desist order against our business operations, any of which could damage our reputation and have a material adverse effect on our business, financial condition and results of operations. We have incurred and will continue to incur capital and operating expenses and other costs to comply with these laws and regulations.
Additionally, we are subject to Federal, State and local laws and regulations and other government actions related to the COVID-19 pandemic.
The foregoing description of laws and regulations to which we are or may be subject is not exhaustive, and the regulatory framework governing our operations is subject to evolving interpretations and continuous change. The enactment of new laws and regulations or the interpretation of existing laws and regulations in an unfavorable way may affect the operation of our business, directly or indirectly, which could result in substantial regulatory compliance costs, civil or criminal penalties, including fines, adverse publicity, decreased revenues, and increased expenses.
Failure to comply with federal, state and local laws and regulations relating to privacy, data protection and consumer protection, or the expansion of current or the enactment of new laws or regulations relating to privacy, data protection and consumer protection, as well as our actual or perceived failure to protect such information could harm our reputation and could adversely affect our business, financial condition and results of operations.
There are numerous federal, state and local laws regarding privacy and the collection, processing, storing, sharing, disclosing, using and protecting of personal information and other data, the scope of which are changing, subject to differing interpretations, and which may be costly to comply with, inconsistent between jurisdictions or conflicting with other rules. We are also subject to specific contractual requirements contained in third-party agreements governing our use and protection of personal information and other data. We generally comply with industry standards and are subject to the terms of our privacy policies and the privacy- and security-related obligations to third parties. We strive to comply with applicable laws, policies, legal obligations and industry codes of conduct relating to privacy and data protection, to the extent possible. However, it is possible that these obligations may be interpreted and applied in new ways or in a manner that is inconsistent from one jurisdiction to another and may conflict with other rules or our practices. Additionally, new regulations could be enacted with which we are not familiar. Any failure or perceived failure by us to comply with our privacy policies, our privacy-related obligations to customers or other third parties, or our privacy-related legal obligations or any compromise of security that results in the unauthorized release or transfer of sensitive information, which may include personally identifiable information or other customer data, may result in governmental enforcement actions, litigation or public statements against us by consumer advocacy groups or others and could cause customers, vendors and third-party business partners to lose trust in us, which could have a material adverse effect on our business, financial condition and results of operations. Additionally, if vendors, developers or other third parties that we work with violate applicable laws or our policies, such violations may also put customers’, vendors’ or receivables-purchasers’ information at risk and could in turn harm our business, financial condition and results of operations.
35
We expect that new industry standards, laws and regulations will continue to be proposed regarding privacy, data protection and information security in many jurisdictions, including the California Consumer Privacy Act (the “CCPA”), which went into effect on January 1, 2020. We cannot yet determine the impact of the CCPA or such future laws, regulations and standards may have on our business. Complying with these evolving obligations is costly. For instance, expanding definitions and interpretations of what constitutes “personal data” (or the equivalent) within the United States may increase our compliance costs and legal liability. Additionally, the California Privacy Rights Act (“CPRA”), recently passed in California. The CPRA significantly amends the CCPA, and imposes additional data protection obligations on covered companies doing business in California, including additional consumer rights processes and opt outs for certain uses of sensitive data. It also creates a new California data protection agency specifically tasked to enforce the law, which would likely result in increased regulatory scrutiny of California businesses in the areas of data protection and security. The substantive requirements for businesses subject to the CPRA will go into effect on January 1, 2023, and become enforceable on July 1, 2023.
A significant data breach or any failure, or perceived failure, by us to comply with any federal, state or local privacy or consumer protection-related laws, regulations or other principles or orders to which we may be subject or other legal obligations relating to privacy or consumer protection could adversely affect our reputation, brand and business, and may result in claims, investigations, proceedings or actions against us by governmental entities or others or other penalties or liabilities or require us to change our operations and/or cease using certain data sets. Depending on the nature of the information compromised, we may also have obligations to notify users, law enforcement or payment companies about the incident and may need to provide some form of remedy, such as refunds, for the individuals affected by the incident.
If we fail to comply with the Telephone Consumer Protection Act, we may face significant damages, which could harm our business, financial condition and results of operations.
We utilize telephone calls as a means of responding to and marketing to customers interested in purchasing, trading in and/or selling vehicles and value-added products, and intend to implement the use of texting as a means of communication with our customers. We generate leads from our website and online advertising by prompting potential customers to provide their phone numbers so that we can contact them in response to their interest in selling a vehicle, purchasing a vehicle, trading in a vehicle or obtaining financing terms. We currently engage a third-party customer experience center to facilitate substantially all telephone inquiries, sales, purchases and financings of our vehicles through our platform.
The Telephone Consumer Protection Act (the “TCPA”), as interpreted and implemented by the Federal Communication Commission (the “FCC”) and U.S. courts, imposes significant restrictions on the use of telephone calls to residential and mobile telephone numbers as a means of communication when prior consent of the person being contacted has not been obtained. Currently, our third-party customer experience center utilizes automated telephone dialing systems to dial phone numbers of potential customers who have requested that we contact them by providing their phone number to us through our website and through third-party aggregation websites. Our telephone marketing activities, such as these, must comply with the TCPA and the Telephone Sales Rule (the “TSR”). The TCPA prohibits the use of automatic telephone dialing systems for communications with wireless phone numbers without express consent of the consumer, and the TSR established the Do Not Call Registry. Although it is possible that decisions of other appellate courts could further change the standards of conduct applicable to the use of automated telephone dialing systems, at present obtaining appropriate consent for auto-dialed calls and properly managing revocations of consent must comply with the standard of conduct announced in the ACA Ruling. Violations of the TCPA may be enforced by the FCC or by individuals through litigation, including class actions. Statutory penalties for TCPA violations range from $500 to $1,500 per violation, which has been interpreted to mean per phone call.
In September 2016, an individual brought a putative class action against us under the TCPA alleging we violated the TCPA by sending him a single text message expressing interest in purchasing a vehicle he listed for sale online. The court granted summary judgment in our favor and, following the plaintiff’s appeal, the parties resolved the lawsuit. While we have implemented processes and procedures to comply with the TCPA, if we or the third parties on which we rely fail to adhere to or successfully implement appropriate processes and procedures in response to existing or future regulations, it could result in legal and monetary liability, fines, penalties or damage to our reputation in the marketplace, any of which could have a material adverse effect on our business, financial condition and results of operations. Additionally, any changes to the TCPA, its interpretation, or enforcement of it by the government or private parties that further restrict the way we contact and communicate with our potential customers or generate leads could adversely affect our ability to attract customers and could harm our business, financial condition and results of operations.
36
Government regulation of the internet and ecommerce is evolving, and unfavorable changes or failure by us to comply with these regulations could substantially harm our business, financial condition and results of operations.
We are subject to general business regulations and laws, as well as regulations and laws specifically governing the internet and ecommerce. Existing and future regulations and laws could impede the growth of the internet, ecommerce or mobile commerce. These regulations and laws may involve taxes, tariffs, privacy and data security, anti-spam, pricing, content protection, electronic contracts and communications, mobile communications, consumer protection, information reporting requirements, unencumbered internet access to our platform, the design and operation of websites and internet neutrality. It is not clear how existing laws governing issues such as property ownership, sales and other taxes and consumer privacy apply to the internet as the vast majority of these laws were adopted prior to the advent of the internet and do not contemplate or address the unique issues raised by the internet or ecommerce. It is possible that general business regulations and laws, or those specifically governing the internet or ecommerce, may be interpreted and applied in a manner that is inconsistent from one market segment to another and may conflict with other rules or our practices. For example, federal, state and local regulation regarding privacy, data protection and information security has become more significant, and proposed regulations such as the CCPA may increase our costs of compliance. We cannot be sure that our practices have complied, comply or will comply fully with all such laws and regulations. The enactment of new laws and regulations or the interpretation of existing laws and regulations in an unfavorable way may affect the operation of our business, directly or indirectly, which could result in substantial regulatory compliance costs, civil or criminal penalties, including fines, adverse publicity, decreased revenues and increased expenses.
We actively use anonymous online data for targeting ads online and if ad networks are compelled by regulatory bodies to limit use of this data, it could materially affect our ability to do effective performance marketing. Any failure, or perceived failure, by us to comply with any of these laws or regulations could result in damage to our reputation, a loss in business and proceedings or actions against us by governmental entities or others. Any such proceeding or action could hurt our reputation, force us to spend significant amounts in defense of these proceedings, distract our management, increase our costs of doing business, decrease the use of our sites by customers and suppliers and result in the imposition of monetary liability. We also may be contractually liable to indemnify and hold harmless third parties from the costs or consequences of non-compliance with any such laws or regulations. Adverse legal or regulatory developments could substantially harm our business, our ability to attract new customers may be adversely affected, and we may not be able to maintain or grow our revenue and expand our business as anticipated.
Risks Related to Our Use of Data and Technology
Our business and inventory is dependent on our ability to correctly appraise and price vehicles we buy and sell.
When purchasing a vehicle from us, our customers sometimes trade in their current vehicle and apply the trade-in value towards their purchase. We also acquire vehicles from consumers independent of any purchase of a vehicle from us and purchase vehicles from auctions, rental car companies, OEMs and dealers. We appraise and price vehicles we buy and sell using data science and proprietary algorithms based on a number of factors, including mechanical soundness, consumer desirability, vehicle history, market prices and relative value as prospective inventory. If we are unable to correctly appraise and price both the vehicles we buy and the vehicles we sell, we may be unable to acquire or sell inventory at attractive prices or to manage inventory effectively, and accordingly our revenue, gross margins and results of operations would be affected, which could have a material adverse effect on our business, financial condition and results of operations.
We are subject to risks related to online payment methods.
We accept payments for deposits on our vehicles through a variety of methods, including credit card and debit card. As we offer new payment options to customers, we may be subject to additional regulations, compliance requirements and fraud. For certain payment methods, including credit and debit cards, we pay interchange and other fees, which may increase over time and raise our operating costs. We are also subject to payment card association operating rules and certification requirements, including the Payment Card Industry Data Security Standard and rules governing electronic funds transfers, which could change or be reinterpreted to make it difficult or impossible for us to comply. As our business changes, we also may be subject to different rules under existing standards, which may require new assessments that involve costs above what we currently pay for compliance. If we fail to comply with the rules or requirements of any provider of a payment method we accept, if the volume of fraud in our transactions limits or terminates our rights to use payment methods we currently accept, or if a data breach occurs relating to our payment systems, we may, among other things, be subject to fines or higher transaction fees and may lose, or face restrictions placed upon, our ability to accept credit card and debit card payments from customers or facilitate other types of online payments. If any of these events were to occur, our business, financial condition and results of operations could be materially adversely affected.
37
We occasionally receive orders placed with fraudulent credit card data, including stolen credit card numbers, or from clients who have closed bank accounts or have insufficient funds in open bank accounts to satisfy payment obligations. We may suffer losses as a result of orders placed with fraudulent credit card data even if the associated financial institution approved payment of the orders. Under current credit card practices, we may be liable for fraudulent credit card transactions. If we are unable to detect or control credit card or other fraud, our liability for these transactions could harm our business, financial condition and results of operations.
If we do not adequately address our customers’ reliance on mobile device technology, our results of operations could be harmed and our growth could be negatively affected.
Vroom.com is a mobile website that consumers can access and utilize from their mobile devices. In addition, we have designed and launched mobile apps (iOS and android) to enhance customers’ mobile experience. In light of consumers’ shift to mobile technology, our future success depends in part on our ability to provide enhanced functionality for customers who use mobile devices to shop for used vehicles and increase the number of transactions with us that are completed by those users. The shift to mobile technology by our users may harm our business in the following ways:
|
|
• |
customers visiting our website from a mobile device may not accept mobile technology as a viable long-term platform to buy or sell a vehicle. This may occur for a number of reasons, including our ability to provide the same level of website functionality to a mobile device that we provide on a desktop computer, the actual or perceived lack of security of information on a mobile device and possible disruptions of service or connectivity; |
|
|
• |
we may be unable to provide sufficient website functionality to mobile device users, which may cause customers using mobile devices to believe that our competitors offer superior products and features; |
|
|
• |
problems may arise in developing applications for alternative devices and platforms and the need to devote significant resources to the creation, support and maintenance of such applications; or |
|
|
• |
regulations related to consumer protection, such as the Federal Trade Commission Act and similar state regulations, and related to consumer finance disclosures, including the Truth in Lending Act and the Fair Credit Reporting Act, may be interpreted, in the context of mobile devices, in a manner which could expose us to legal liability in the event we are found to have violated applicable laws. |
If we do not develop suitable functionality for users who visit our website using a mobile device, our business, financial condition and results of operations could be harmed.
We rely on internet search engines, vehicle listing sites and social networking sites to help drive traffic to our website, and if we fail to appear prominently in the search results or fail to drive traffic through paid advertising, our traffic would decline and our business, financial condition and results of operations could be materially and adversely affected.
We depend in part on internet search engines, such as Google, Bing and Yahoo!, vehicle listing sites and social networking sites such as Facebook and Instagram to drive traffic to our platform. Our ability to maintain and increase the number of visitors directed to our platform is not entirely within our control. Our competitors may increase their search engine marketing efforts and outbid us for placement on various vehicle listing sites or for search terms on various search engines, resulting in their websites receiving a higher search result page ranking than ours. Additionally, internet search engines could revise their methodologies in a way that would adversely affect our search result rankings. If internet search engines modify their search algorithms in ways that are detrimental to us, if vehicle listing sites refuse to display any or all of our inventory in certain geographic locations, or if our competitors’ efforts are more successful than ours, overall growth in our customer base could slow or our customer base could decline. Internet search engine providers could provide automotive dealer and pricing information directly in search results, align with our competitors or choose to develop competing services. Our platform has experienced fluctuations in search result rankings in the past, and we anticipate similar fluctuations in the future. We could reach a point of inventory saturation at third-party aggregation websites whereby we will exceed the maximum allowable inventory that will require us to spend greater than market rates to list our inventory. Any reduction in the number of users directed to our platform through internet search engines, vehicle listings sites or social networking sites could harm our business, financial condition and results of operations.
Our business relies on email and other messaging services, and any restrictions on the sending of emails or messages or an inability to timely deliver such communications could materially and adversely affect our business, financial condition and results of operations.
Our business is dependent upon email and other messaging services for promoting our platform and vehicles available for purchase. Promotions offered through email and other messages sent by us are an important part of our marketing strategy. We provide emails to customers and other visitors informing them of the convenience and value of
38
using our platform, as well as updates on new inventory and price updates on listed inventory, and we believe these emails, coupled with our general marketing efforts, are an important part of our customer experience and help generate revenue. If we are unable to successfully deliver emails or other messages to our subscribers, or if subscribers decline to open our emails or other messages, our revenues could be materially and adversely affected. Any changes in how webmail applications organize and prioritize email may reduce the number of subscribers opening our emails. For example, Google’s Gmail service has a feature that organizes incoming emails into categories (such as primary, social and promotions). Such categorization or similar inbox organizational features may result in our emails being delivered in a less prominent location in a subscriber’s inbox or viewed as “spam” by our subscribers and may reduce the likelihood of that subscriber opening our emails.
In addition, actions by third parties to block, impose restrictions on or charge for the delivery of emails or other messages could also adversely impact our business. From time to time, internet service providers or other third parties may block bulk email transmissions or otherwise experience technical difficulties that result in our inability to successfully deliver email or other messages to third parties. Changes in the laws or regulations that limit our ability to send such communications or impose additional requirements upon us in connection with sending such communications could also materially and adversely affect our business, financial condition and results of operations. Our use of email and other messaging services to send communications about our sites or other matters may also result in legal claims against us, which may cause us to incur increased expenses, and if successful might result in fines and orders with costly reporting and compliance obligations or might limit or prohibit our ability to send emails or other messages. We also rely on social networking messaging services to send communications and to encourage customers to send communications. Changes to the terms of these social networking services to limit promotional communications, any restrictions that would limit our ability or our customers’ ability to send communications through their services, disruptions or downtime experienced by these social networking services or decline in the use of or engagement with social networking services by customers and potential customers could materially and adversely affect our business, financial condition and results of operations.
We rely on third-party technology and information systems to complete critical business functions. If that technology fails to adequately serve our needs, and we cannot find alternatives, it may negatively impact our business, financial condition and results of operations.
We rely on third-party technology for certain of our critical business functions, including customer identity verification for financing, transportation fleet telemetry, network infrastructure for hosting our website and inventory data, software libraries, development environments and tools, services to calculate state taxes and fees associated with our vehicle sales and acquisitions, services to allow customers to digitally sign contracts and customer experience center management. Our business is dependent on the integrity, security and efficient operation of these systems and technologies. Our systems and operations or those of our third-party vendors and partners could be exposed to damage or interruption from, among other things, fire, natural disaster, power loss, telecommunications failure, unauthorized entry, computer viruses, denial-of-service attacks, acts of terrorism, human error, vandalism or sabotage, financial insolvency, bankruptcy and similar events. The failure of these systems to perform as designed, the failure to maintain or update these systems as necessary, the vulnerability of these systems to security breaches or attacks or the inability to enhance our information technology capabilities, and our inability to find suitable alternatives could disrupt our operations and have a material adverse effect on our business, financial condition and results of operations.
Our platform utilizes open-source software, and any defects or security vulnerabilities in the open-source software could negatively affect our business.
Our platform employs open-source software, and we expect to use open-source software in the future. To the extent that our platform depends upon the successful operation of open-source software, any undetected errors or defects in this open-source software could prevent the deployment or impair the functionality of our platform, delay the introduction of new solutions, result in a failure of our platform and injure our reputation. For example, undetected errors or defects in open-source software could render it vulnerable to breaches or security attacks, and, in conjunction, make our systems more vulnerable to data breaches.
In addition, the terms of various open-source licenses have not been interpreted by United States courts, and there is a risk that such licenses could be construed in a manner that imposes unanticipated conditions or restrictions on our ability to market our platform. Some open-source licenses might require us to make our source code available at no cost or require us to make our source code publicly available for modifications or derivative works if our source code is based upon, incorporates, or was created using the open-source software to license such source code under the terms of the particular open-source license. While we try to insulate our proprietary code from the effects of such open-source license provisions, we cannot guarantee we will be successful. In addition to risks related to open-source license requirements, usage of open-source software can lead to greater risks than use of third-party commercial software, as open-source licensors generally do not provide warranties or controls on the origin of the software. Many of the risks associated with
39
usage of open-source software cannot be eliminated and could materially and adversely affect our business, financial condition and results of operations.
A significant disruption in service on our platform could damage our reputation and result in a loss of customers, which could harm our brand or our business, financial condition and results of operations.
Our brand, reputation and ability to attract customers depend on the reliable performance of our platform and the supporting systems, technology and infrastructure. We may experience significant interruptions to our systems in the future. Interruptions in these systems, whether due to system failures, programming or configuration errors, computer viruses or physical or electronic break-ins, could affect the availability of our inventory on our platform and prevent or inhibit the ability of customers to access our platform. Problems with the reliability or security of our systems could harm our reputation, result in a loss of customers and result in additional costs.
Our data center is located at a facility in Houston, Texas, which connects all of our offices and our Vroom VRC. Our data center is vulnerable to damage or interruption from fire, flood, power loss, telecommunications failure, terrorist attacks, acts of war, electronic and physical break-ins, computer viruses, earthquakes and similar events. The occurrence of any of these events could render communications between Vroom offices inoperable and impact our ability to list and sell vehicles through our platform.
Problems faced by our third-party web-hosting providers, including AWS and Google Cloud, could inhibit the functionality of our platform. For example, our third-party web-hosting providers could close their facilities without adequate notice or suffer interruptions in service caused by cyber-attacks, natural disasters or other phenomena. Disruption of their services could cause our website to be inoperable and could have a material adverse effect on our business, financial condition and results of operations. Any financial difficulties, up to and including bankruptcy, faced by our third-party web-hosting providers or any of the service providers with whom they contract may have negative effects on our business, the nature and extent of which are difficult to predict. In addition, if our third-party web-hosting providers are unable to keep up with our growing capacity needs, our business, financial condition and results of operations could be harmed.
Any errors, defects, disruptions, or other performance or reliability problems with our platform could interrupt our customers’ access to our inventory and our access to data that drives our inventory purchase operations, which could harm our reputation or our business, financial condition and results of operations.
Risks Related to Intellectual Property
Failure to adequately protect our intellectual property, technology and confidential information could harm our business, financial condition and results of operations.
The protection of intellectual property, technology and confidential information is crucial to the success of our business. We rely on a combination of trademark, trade secret, patent and copyright law, as well as contractual restrictions, to protect our intellectual property (including our brand, technology and confidential information). While it is our policy to protect and defend our rights to our intellectual property, we cannot predict whether steps taken by us to protect our intellectual property will be adequate to prevent infringement, misappropriation, dilution or other violations of our intellectual property rights. We also cannot guarantee that others will not independently develop technology that has the same or similar functionality as our technology. Unauthorized parties may also attempt to copy or obtain and use our technology to develop competing solutions, and policing unauthorized use of our technology and intellectual property rights may be difficult and may not be effective. Furthermore, we may face claims of infringement of third-party intellectual property that could interfere with our ability to market, promote and sell our brands, products and services. Any litigation to enforce our intellectual property rights or defend ourselves against claims of infringement of third-party intellectual property rights could be costly, divert attention of management and may not ultimately be resolved in our favor. Moreover, if we are unable to successfully defend against claims that we have infringed the intellectual property rights of others, we may be prevented from using certain intellectual property and may be liable for damages, which in turn could materially adversely affect our business, financial condition or results of operations.
As part of our efforts to protect our intellectual property, technology and confidential information, we require certain of our employees and consultants to enter into confidentiality and assignment of inventions agreements, and we also require certain third parties to enter into nondisclosure agreements. These agreements may not effectively grant all necessary rights to any inventions that may have been developed by our employees and consultants. In addition, these agreements may not effectively prevent unauthorized use or disclosure of our confidential information, intellectual property or technology and may not provide an adequate remedy in the event of unauthorized use or disclosure of our confidential information, intellectual property or technology. Despite our efforts to protect our proprietary rights, unauthorized parties may attempt to copy aspects of our website features, software and functionality or obtain and use information that we
40
consider proprietary. Changes in the law or adverse court rulings may also negatively affect our ability to prevent others from using our technology.
We are currently the registrant of the vroom.com and texasdirectauto.com internet domain names and various other related domain names. The regulation of domain names in the United States is subject to change. Regulatory bodies could establish additional top-level domains, appoint additional domain name registrars or modify the requirements for holding domain names. As a result, we may not be able to acquire or maintain domain names that are important for our business.
In addition, we have certain trademarks that are important to our business, such as the Vroom®, Sell Us Your Car®, CarStory®, and Vast® trademarks. If we fail to adequately protect or enforce our rights under these trademarks, we may lose the ability to use those trademarks or to prevent others from using them, which could adversely harm our reputation and our business, financial condition and results of operations. While we are actively seeking, and have secured registration of several of our trademarks in the U.S. and other jurisdictions (including Canada and Europe), it is possible that others may assert senior rights to similar trademarks, in the U.S. and internationally, and seek to prevent our use and registration of our trademarks in certain jurisdictions. Our pending trademark or service mark applications may not result in such marks being registered.
While software can be protected under copyright law, we have chosen not to register any copyrights in these works, and instead, primarily rely on trade secret law to protect our proprietary software. In order to bring a copyright infringement lawsuit in the United States, the copyright must be registered. Accordingly, the remedies and damages available to us for unauthorized use of our software may be limited. Our trade secrets, know-how and other proprietary materials may be revealed to the public or our competitors or independently developed by our competitors and no longer provide protection for the related intellectual property. Furthermore, our trade secrets, know-how and other proprietary materials may be revealed to the public or our competitors or independently developed by our competitors and no longer provide protection for the related intellectual property.
As part of the CarStory acquisition, we acquired 19 U.S. patents and ten pending U.S. patent applications. Effective protection of patents is expensive and difficult to maintain, both in terms of application and registration costs as well as the costs of defending and enforcing those rights. For example, the U.S. Patent and Trademark Office and various foreign governmental patent agencies require compliance with a number of procedural requirements to complete the patent application process and to maintain issued patents, and noncompliance or non-payment could result in abandonment or lapse of a patent or patent application, resulting in partial or complete loss of patent rights in a relevant jurisdiction.
We may be subject to claims asserting that our employees, consultants or advisors have wrongfully used or disclosed alleged trade secrets of their current or former employers or claims asserting ownership of what we regard as our own intellectual property.
Although we try to ensure that our employees, consultants and advisors do not use the proprietary information or know-how of others in their work for us, we may be subject to claims that we or these individuals have used or disclosed intellectual property, including trade secrets or other proprietary information, of any such individual’s current or former employer. Litigation may be necessary to defend against these claims. If we fail in defending any such claims, in addition to paying monetary damages, we may lose valuable intellectual property rights or personnel. Even if we are successful in defending against such claims, litigation could result in substantial costs and be a distraction to management.
In addition, while it is our policy to require our employees and contractors who may be involved in the creation or development of intellectual property on our behalf to execute agreements assigning such intellectual property to us, we may be unsuccessful in having all such employees and contractors execute such an agreement. The assignment of intellectual property may not be self-executing or the assignment agreement may be breached, and we may be forced to bring claims against third parties or defend claims that they may bring against us to determine the ownership of what we regard as our intellectual property.
41
Risks Related to Ownership of Our Common Stock
Our common stock price may be volatile and the value of our common stock may decline regardless of our operating performance, and you may not be able to resell your shares at or above the price which you paid for them.
It is possible that an active trading market for shares of our common stock will not be sustained, which could make it difficult for you to sell your shares of common stock at an attractive price or at all.
Many factors, some of which are outside our control, may cause the market price of our common stock to fluctuate significantly, including those described in this “Risk Factors” section and elsewhere in this Annual Report on Form 10-K, as well as the following:
|
|
• |
our operating and financial performance and prospects; |
|
|
• |
our quarterly or annual earnings or those of other companies in our industry compared to market expectations; |
|
|
• |
our guidance regarding future quarterly or annual earnings; |
|
|
• |
conditions that impact demand for our offerings and platform, including demand in the automotive industry generally and the performance of the third parties through whom we conduct significant parts of our business; |
|
|
• |
future announcements concerning our business or our competitors’ businesses; |
|
|
• |
the public’s reaction to our press releases, other public announcements and filings with the SEC; |
|
|
• |
coverage by or changes in financial estimates by securities analysts or failure to meet their expectations; |
|
|
• |
market and industry perception of our success, or lack thereof, in pursuing our growth strategy; |
|
|
• |
strategic actions by us or our competitors, such as acquisitions or restructurings; |
|
|
• |
changes in laws or regulations which adversely affect our industry or us; |
|
|
• |
changes in accounting standards, policies, guidance, interpretations or principles; |
|
|
• |
changes in senior management or key personnel; |
|
|
• |
issuances, exchanges or sales, or expected issuances, exchanges or sales of our capital stock; |
|
|
• |
changes in our dividend policy; |
|
|
• |
adverse resolution of new or pending litigation or other claims against us; and |
|
|
• |
changes in general market, economic and political conditions in the United States and global economies or financial markets, including those resulting from natural disasters, terrorist attacks, global pandemics, acts of war and responses to such events. |
As a result, volatility in the market price of our common stock may prevent investors from being able to sell their common stock at or above the price which they paid for them. These broad market and industry factors may materially reduce the market price of our common stock, regardless of our operating performance. In addition, price volatility may be greater if the public float and trading volume of our common stock is low. As a result, you may suffer a loss on your investment. Broad market and industry fluctuations, as well as general economic, political, regulatory, and market conditions, may negatively impact the market price of our common stock. In the past, companies that have experienced volatility in the market price of their securities have been subject to securities class action litigation. We may be the target of this type of litigation in the future, which could result in substantial costs and divert our management’s attention.
We do not intend to pay dividends on our common stock for the foreseeable future.
We currently intend to retain all available funds and any future earnings to fund the development and growth of our business. As a result, we do not anticipate declaring or paying any cash dividends on our common stock in the foreseeable future. Any decision to declare and pay dividends in the future will be made at the discretion of our board of directors and will depend on, among other things, our business prospects, results of operations, financial condition, cash requirements and availability, industry trends and other factors that our board of directors may deem relevant. Any such decision also will be subject to compliance with contractual restrictions and covenants in the agreements governing our current indebtedness. In addition, we may incur additional indebtedness, the terms of which may further restrict or prevent us from paying dividends on our common stock. As a result, you may have to sell some or all of your common stock after price appreciation in order to generate cash flow from your investment, which you may not be able to do. Our inability or decision not to pay dividends could also adversely affect the market price of our common stock.
42
We may issue shares of preferred stock in the future, which could make it difficult for another company to acquire us or could otherwise adversely affect holders of our common stock, which could depress the price of our common stock.
Our amended and restated certificate of incorporation authorizes us to issue one or more series of preferred stock. Our board of directors has the authority to determine the preferences, limitations and relative rights of the shares of preferred stock and to fix the number of shares constituting any series and the designation of such series, without any further vote or action by our stockholders. Our preferred stock could be issued with voting, liquidation, dividend and other rights superior to the rights of our common stock. The potential issuance of preferred stock may delay or prevent a change in control of us, discouraging bids for our common stock at a premium to the market price, and materially and adversely affect the market price and the voting and other rights of the holders of our common stock.
The issuance by us of additional shares of common stock or convertible securities may dilute your ownership of us and could adversely affect our stock price.
We may issue additional capital stock in the future that will result in dilution to all other stockholders. We also expect to continue to grant equity awards to employees, directors and consultants under our equity incentive plans. From time to time in the future, we may also issue additional shares of our common stock or securities convertible into common stock pursuant to a variety of transactions, including acquisitions. The issuance by us of additional shares of our common stock or securities convertible into our common stock would dilute your ownership of us and the sale of a significant amount of such shares in the public market could adversely affect prevailing market prices of our common stock.
Future sales, or the perception of future sales, by us or our existing stockholders in the public market could cause the market price for our common stock to decline.
The sale of substantial amounts of shares of our common stock in the public market, or the perception that such sales could occur, could harm the prevailing market price of shares of our common stock. These sales, or the possibility that these sales may occur, also might make it more difficult for us to sell equity securities in the future at a time and at a price that we deem appropriate. Many of our stockholders who held our capital stock prior to the completion of our IPO have substantial unrecognized gains on the value of the equity they hold based upon the price at which shares were sold in our IPO, and therefore they may take steps to sell their shares or otherwise secure the unrecognized gains on those shares. We are unable to predict the timing of or the effect that such sales may have on the prevailing market price of our common stock.
In connection with our IPO, we registered shares of our common stock issued or reserved for issuance under our 2020 Incentive Award Plan and Second Amended and Restated 2014 Equity Incentive Plan. Subject to the satisfaction of vesting conditions and the expiration of lockup agreements, shares registered under the registration statement on Form S-8 will be available for resale immediately in the public market without restriction.
Further, certain holders of our common stock have rights, subject to some conditions, to require us to file registration statements covering the sale of their shares or to include their shares in registration statements that we may file on our behalf or for other stockholders.
The obligations associated with being a public company require significant resources and management attention, and we have and will continue to incur increased costs as a result of becoming a public company.
As a public company, we face increased legal, accounting, administrative and other costs and expenses that we did not incur as a private company. We expect to continue to incur significant costs related to operating as a public company. We are subject to the Exchange Act, the rules and regulations implemented by the SEC, the Sarbanes-Oxley Act, the Wall Street Reform and Consumer Protection Act of 2020 (the “Dodd-Frank Act”), the Public Company Accounting Oversight Board (“PCAOB”) and Nasdaq rules and standards, each of which imposes additional reporting and other obligations on public companies. As a public company, we are required to, among other things:
|
|
• |
prepare, file and distribute annual, quarterly and current reports with respect to our business and financial condition; |
|
|
• |
prepare, file and distribute proxy statements and other stockholder communications; |
|
|
• |
hire additional financial and accounting personnel and other experienced accounting and finance staff with the expertise to address complex accounting matters applicable to public companies; |
|
|
• |
institute more comprehensive financial reporting and disclosure compliance procedures; |
43
|
|
|
|
• |
involve and retain to a greater degree outside counsel and accountants to assist us with the activities listed above; |
|
|
• |
enhance our investor relations function; |
|
|
• |
establish new internal policies, including those relating to trading in our securities and disclosure controls and procedures; |
|
|
• |
comply with Nasdaq’s listing standards; and |
|
|
• |
comply with the Sarbanes-Oxley Act. |
These rules and regulations and changes in laws, regulations and standards relating to corporate governance and public disclosure, which have created uncertainty for public companies, have and will continue to increase our legal and financial compliance costs and make some activities more time consuming and costly. These laws, regulations and standards are subject to varying interpretations, in many cases due to their lack of specificity, and, as a result, their application in practice may evolve over time as new guidance is provided by regulatory and governing bodies. This could result in continuing uncertainty regarding compliance matters and higher costs necessitated by ongoing revisions to disclosure and governance practices. Our investment in compliance with existing and evolving regulatory requirements has and will continue to result in increased administrative expenses and a diversion of management’s time and attention from revenue-generating activities to compliance activities, which could have a material adverse effect on our business, financial condition and results of operations.
In addition, the need to continue to develop the corporate infrastructure demanded of a public company may also divert management’s attention from implementing our business strategy, which could prevent us from improving our business, financial condition and results of operations. If we do not continue to develop and implement the right processes and tools to manage our changing enterprise and maintain our culture, our ability to compete successfully and achieve our business objectives could be impaired, which could negatively impact our business, financial condition and results of operations. In addition, we cannot predict or estimate the amount of additional costs we may incur to comply with these requirements. We anticipate that these costs will materially increase our general and administrative expenses.
Being a public company and complying with applicable rules and regulations could also make it more difficult and more expensive for us to obtain director and officer liability insurance, and we may be required to accept reduced policy limits and coverage or incur substantially higher costs to obtain the same or similar coverage. As a result, it may be more difficult for us to attract and retain qualified people to serve on our board of directors, our board committees or as executive officers.
As a public reporting company, we are subject to rules and regulations established from time to time by the SEC and Nasdaq regarding our internal control over financial reporting. We have identified material weaknesses in our internal control over financial reporting. If our remediation of such material weaknesses is not effective, or if we experience additional material weaknesses or otherwise fail to establish and maintain effective internal control over financial reporting and disclosure controls and procedures, we may not be able to accurately report our financial results or report them in a timely manner which may adversely affect investor confidence in us and, as a result, the value of our common stock.
We are a public reporting company subject to the rules and regulations established from time to time by the SEC and Nasdaq. These rules and regulations require, among other things, that we establish and periodically evaluate procedures with respect to our disclosure controls and procedures and our internal control over financial reporting. Reporting obligations as a public company place a considerable strain on our financial and management systems, processes and controls, as well as on our personnel.
In addition, as a public company, we will be required to document and test our internal control over financial reporting pursuant to Section 404 of the Sarbanes-Oxley Act so that our management can certify as to the effectiveness of our internal control over financial reporting. Section 404(a) of the Sarbanes-Oxley Act (“Section 404(a)”) requires that management assess and report annually on the effectiveness of our internal control over financial reporting and identify any material weaknesses in our internal control over financial reporting. Additionally, Section 404(b) requires our independent registered public accounting firm to issue an annual report that addresses the effectiveness of our internal control over financial reporting. Our first Section 404(a) assessment will take place for our annual report for the year ending December 31, 2021. We also expect to comply with Section 404(b) at that time. Although we started the costly and challenging process of compiling the system and process documentation necessary to perform the evaluation needed to comply with Section 404(a), we may not be able to complete our evaluation, testing and any required remediation in a timely fashion. Our compliance with Section 404(a) will require that we incur substantial expenses and expend significant management efforts.
44
As of December 31, 2020, we did not design or maintain effective internal control over financial reporting due to certain identified material weaknesses. We describe these material weaknesses in Part II, Item 9A. “Controls and Procedures” in this Annual Report. The material weaknesses did not result in a misstatement to our annual or interim consolidated financial statements. However, each of these control deficiencies, if not remediated, could result in a misstatement of one or more account balances or disclosures that would result in a material misstatement to the annual or interim consolidated financial statements that would not be prevented or detected, and, accordingly, we determined that these control deficiencies constitute material weaknesses. We intend to continue to take steps to remediate the material weaknesses through hiring additional qualified accounting personnel and further evolving our business processes and related internal controls. However, we will not be able to fully remediate these material weaknesses until these steps have been completed and the related internal controls have been operating effectively for a sufficient period of time.
If we identify additional material weaknesses in our internal control over financial reporting or determine that existing material weaknesses have not been remediated, our management will be unable to assert that our disclosure controls and procedures and our internal control over financial reporting is effective. If we are unable to assert that our internal control over financial reporting is effective, or if our independent registered public accounting firm is unable to express an unqualified opinion as to the effectiveness of our internal control over financial reporting, investors may lose confidence in the accuracy and completeness of our financial reports, the market price of our common stock could be adversely affected and we could become subject to litigation or investigations by Nasdaq, the SEC, or other regulatory authorities, which could require additional financial and management resources.
Anti-takeover provisions in our governing documents and under Delaware law could make an acquisition of our company more difficult, limit attempts by our stockholders to replace or remove our current management, and depress the market price of our common stock.
Our amended and restated certificate of incorporation, amended and restated bylaws and Delaware law contain provisions that could have the effect of rendering more difficult, delaying or preventing an acquisition deemed undesirable by our board of directors. Among others, our amended and restated certificate of incorporation and amended and restated bylaws include the following provisions:
|
|
• |
limitations on convening special stockholder meetings, which could make it difficult for our stockholders to adopt desired governance changes; |
|
|
• |
advance notice procedures, which apply for stockholders to nominate candidates for election as directors or to bring matters before an annual meeting of stockholders; |
|
|
• |
a prohibition on stockholder action by written consent, which means that our stockholders will only be able to take action at a meeting of stockholders; |
|
|
• |
a forum selection clause, which means certain litigation against us can only be brought in Delaware; |
|
|
• |
no authorization of cumulative voting, which limits the ability of minority stockholders to elect director candidates; |
|
|
• |
certain amendments to our certificate of incorporation require the approval of two-thirds of the then outstanding voting power of our capital stock; |
|
|
• |
our bylaws provide that the affirmative vote of two-thirds of the then-outstanding voting power of our capital stock, voting as a single class, is required for stockholders to amend or adopt any provision of our bylaws; and |
|
|
• |
the authorization of undesignated or “blank check” preferred stock, the terms of which may be established and shares of which may be issued without further action by our stockholders. |
These provisions, alone or together, could delay or prevent hostile takeovers and changes in control or changes in our management. As a Delaware corporation, we are also subject to provisions of Delaware law, including Section 203 of the Delaware General Corporation Law (the “DGCL”), which prevents interested stockholders, such as certain stockholders holding more than 15% of our outstanding common stock from engaging in certain business combinations unless (i) prior to the time such stockholder became an interested stockholder, the board approved the transaction that resulted in such stockholder becoming an interested stockholder, (ii) upon consummation of the transaction that resulted in such stockholder becoming an interested stockholder, the interested stockholder owned 85% of the common stock or (iii) following board approval, the business combination receives the approval of the holders of at least two-thirds of our outstanding common stock not held by such interested stockholder.
Any provision of our amended and restated certificate of incorporation, amended and restated bylaws or Delaware law that has the effect of delaying, preventing or deterring a change in control could limit the opportunity for our stockholders to receive a premium for their shares of our common stock and could also affect the price that some investors are willing to pay for our common stock.
45
Our amended and restated certificate of incorporation provides that the Court of Chancery of the State of Delaware will be the sole and exclusive forum for substantially all disputes between us and our stockholders, and federal district courts will be the sole and exclusive forum for Securities Act claims, which could limit our stockholders’ ability to obtain a favorable judicial forum for disputes with us or our directors, officers or employees.
Our amended and restated certificate of incorporation provides that, unless we consent to the selection of an alternative forum, the Court of Chancery of the State of Delaware is the sole and exclusive forum for: (a) any derivative action or proceeding brought on our behalf; (b) any action asserting a claim of breach of fiduciary duty owed by any of our directors, officers or other employees to us or to our stockholders; (c) any action asserting a claim arising pursuant to the DGCL, our amended and restated certificate of incorporation or amended bylaws, or as to which the DGCL confers exclusive jurisdiction on the Court of Chancery of the State of Delaware; or (d) any action asserting a claim governed by the internal affairs doctrine; provided that the exclusive forum provisions will not apply to suits brought to enforce any liability or duty created by Exchange Act or to any claim for which the federal courts have exclusive jurisdiction. Our amended and restated certificate of incorporation further provides that, unless we consent in writing to the selection of an alternative forum, the federal district courts are the sole and exclusive forum for the resolution of any complaint asserting a cause of action arising under the Securities Act. The choice of forum provisions may limit a stockholder’s ability to bring a claim in a judicial forum that it finds favorable for disputes with us or our directors, officers or other employees, which may discourage such lawsuits against us and our directors, officers and other employees. Alternatively, if a court were to find the choice of forum provisions contained in our amended and restated certificate of incorporation to be inapplicable or unenforceable in an action, we may incur additional costs associated with resolving such action in other jurisdictions, which could harm our business, financial condition and results of operations.
If securities analysts do not publish research or reports about our company, or if they issue unfavorable commentary about us or our industry or downgrade our common stock, the price of our common stock could decline.
Our stock price and trading volume are heavily influenced by the way analysts and investors interpret our financial information and other disclosures. If securities or industry analysts do not publish research or reports about our business, delay publishing reports about our business, or publish negative reports about our business, regardless of accuracy, our common stock price and trading volume could decline.
The trading market for our common stock depends, in part, on the research and reports that securities or industry analysts publish about us or our business. We do not have any control over these analysts. Currently, [fifteen] analysts cover our company. If the number of analysts that cover us declines, demand for our common stock could decrease and our common stock price and trading volume may decline.
Even if our common stock is actively covered by analysts, we do not have any control over the analysts or the measures that analysts or investors may rely upon to forecast our future results. Over-reliance by analysts or investors on any particular metric to forecast our future results may result in forecasts that differ significantly from our own.
Regardless of accuracy, unfavorable interpretations of our financial information and other public disclosures could have a negative impact on our stock price. If our financial performance fails to meet analyst estimates, for any of the reasons discussed above or otherwise, or one or more of the analysts who cover us downgrade our common stock or change their opinion of our common stock, our stock price would likely decline.
Risks Related to Tax Matters
We may be limited in our ability to utilize, or may not be able to utilize, net operating loss carryforwards to reduce our future tax liability.
As of December 31, 2020 we had U.S. federal net operating loss (“NOL”) carryforwards of $462.1 million, the utilization of which may be limited annually due to certain change in ownership provisions of Section 382 of the Internal Revenue Code of 1986, as amended (the “Code”). Some of our U.S. federal NOL carryforwards will begin to expire in 2034, with the remaining losses having no expiration. Please refer to Note 15 to our consolidated financial statements appearing elsewhere in this Annual Report on Form 10-K for a further discussion of the carryforward of our NOLs. As of December 31, 2020, we maintain a full valuation allowance of $121.9 million for our net deferred tax assets.
An “ownership change” (generally defined as greater than 50-percentage-point cumulative changes in the equity ownership of certain stockholders over a rolling three-year period) under Section 382 of the Code may limit our ability to utilize fully our pre-change NOL carryforwards to reduce our taxable income in periods following the ownership change. In general, an ownership change would limit our ability to utilize U.S. federal NOL carryforwards to an amount equal to the aggregate value of our equity at the time of the ownership change multiplied by a specified tax-exempt interest rate, subject to increase by certain built-in gains. Similar provisions of state tax law may also apply to our state NOL carryforwards. We
46
believe we have undergone an ownership change for purposes of Section 382 of the Code in each of 2013, 2014 and 2015, which substantially limits our ability to use U.S. federal NOL carryforwards generated prior to each such ownership change. In addition, future changes in our stock ownership, some of which may be beyond our control, could result in additional ownership changes under Section 382 of the Code.
Tax matters could impact our results of operations and financial condition.
We are subject to U.S. federal income tax, as well as income tax in certain states. Our provision for income taxes and cash tax liability in the future could be adversely affected by numerous factors including, changes in tax laws, regulations, accounting principles or interpretations thereof, which could materially and adversely impact our cash flows and our business, financial condition and results of operations in future periods. Increases in our effective tax rate could also materially affect our net results. The Tax Cuts and Jobs Act (the “TCJA”), which was enacted in 2017, significantly reformed the Code. The TCJA, among other things, contained significant changes to corporate taxation, including a reduction of the corporate tax rate from a top marginal rate of 35% to a flat rate of 21%, limitations on the deduction for NOL carryforwards and the elimination of NOL carrybacks, in each case, for losses generated after December 31, 2017 (though any such NOLs may be carried forward indefinitely), and limitations on deductions for interest expense. The consolidated financial statements contained herein reflect the effects of the TCJA based on current guidance. However, there remain uncertainties and ambiguities in the application of certain provisions of the TCJA, and, as a result, we made certain judgments and assumptions in the interpretation thereof. The U.S. Treasury Department and the Internal Revenue Service (the “IRS”) may issue further guidance on how the provisions of the TCJA will be applied or otherwise administered that differs from our current interpretation. In addition, the TCJA could be subject to potential amendments and technical corrections, any of which could materially lessen or increase certain adverse impacts of the legislation on us. Further, we are subject to the examination of our income and other tax returns by the IRS and state and local tax authorities, which could have an impact on our business, financial condition and results of operations.
General Risk Factors
We may need to recognize impairment charges related to goodwill, identified intangible assets and fixed assets.
We are required to test goodwill and any other intangible asset with an indefinite life for possible impairment on the same date each year and on an interim basis if there are indicators of a possible impairment. There is significant judgment required in the analysis of a potential impairment of goodwill, identified intangible assets and other long-lived assets. If, as a result of a general economic slowdown or deterioration in one or more of the markets in which we operate or in our financial performance or future outlook, or if the estimated fair value of our long-lived assets decreases, we may determine that one or more of our long-lived assets is impaired. An impairment charge would be determined based on the estimated fair value of the assets and any such impairment charge could have a material adverse effect on our business, financial condition and results of operations.
Our business is subject to the risk of natural disasters, adverse weather events and other catastrophic events, and to interruption by manmade problems such as terrorism.
Our business is vulnerable to damage or interruption from earthquakes, fires, floods, hurricanes, power losses, telecommunications failures, terrorist attacks, acts of war, global pandemics, human errors and similar events. The third-party systems and operations on which we rely are subject to similar risks. For example, a significant natural disaster, such as an earthquake, fire, flood or hurricane could have an adverse effect on our business, financial condition and operating results, and our insurance coverage may be insufficient to compensate us for losses that may occur. Acts of terrorism could also cause disruptions in our businesses, consumer demand or the economy as a whole. We may not have sufficient protection or recovery plans in some circumstances, such as if a natural disaster affects locations that store a significant amount of our inventory vehicles. As we rely heavily on our computer and communications systems and the internet to conduct our business and provide high-quality customer service, any disruptions could negatively affect our ability to run our business, which could have an adverse effect on our business, financial condition, and operating results.
We are, and may in the future be, subject to legal proceedings in the ordinary course of our business. If the outcomes of these proceedings are adverse to us, it could have a material adverse effect on our business, financial condition and results of operations.
We are subject to various litigation matters from time to time, the outcome of which could have a material adverse effect on our business, financial condition and results of operations. Claims arising out of actual or alleged violations of law could be asserted against us by individuals, either individually or through class actions, by governmental entities in civil or criminal investigations and proceedings or by other entities. These claims could be asserted under a variety of laws, including but not limited to consumer finance laws, consumer protection laws, intellectual property laws, privacy laws, labor
47
and employment laws, securities laws and employee benefit laws. These actions could expose us to adverse publicity and to substantial monetary damages and legal defense costs, injunctive relief and criminal and civil fines and penalties, including but not limited to suspension or revocation of licenses to conduct business. See Part I, Item 3. “Legal Proceedings.”
Our insurance may not provide adequate levels of coverage against claims.
We believe that we maintain insurance customary for businesses of our size and type. However, there are types of losses we may incur that cannot be insured against or that we believe are not economically reasonable to insure. Moreover, any loss incurred could exceed policy limits and policy payments made to us may not be made on a timely basis. For example, insurance we maintain against liability claims may not continue to be available on terms acceptable to us and such coverage may not be adequate to cover the types of liabilities actually incurred. A successful claim brought against us, if not fully covered by available insurance coverage, could materially and adversely affect our business, financial condition and results of operations.
If our operating and financial performance in any given period does not meet the guidance that we provide to the public, the market price of our common stock may decline.
From time to time we provide public guidance on our expected operating and financial results for future periods. Any such guidance will be comprised of forward-looking statements subject to the risks and uncertainties described in this Annual Report on Form 10-K and in our other public filings and public statements. Any such guidance is prepared by our management and is qualified by, and subject to, the assumptions and the other information contained or referred to in the relevant release and the factors described under “Special Note Regarding Forward-Looking Statements” in this Annual Report on Form 10-K and our current and periodic reports filed with the SEC.
Guidance is based upon a number of assumptions and estimates that, although presented with numerical specificity, are inherently subject to business, economic and competitive uncertainties and contingencies, many of which are beyond our control and are based upon specific assumptions with respect to future business decisions, some of which will change. We generally state possible outcomes as high and low ranges which are intended to provide a sensitivity analysis as variables are changed but are not intended to represent that actual results could not fall outside of the estimated ranges. The principal reason that we release this guidance is to provide a basis for our management to discuss our business outlook with analysts and investors. We do not accept any responsibility for any projections or reports published by any third parties. Moreover, even if we do issue public guidance, there can be no assurance that we will continue to do so in the future.
Guidance is necessarily speculative in nature, and it can be expected that some or all of the assumptions underlying the guidance furnished by us will not materialize or will vary significantly from actual results. Our actual results may not always be in line with or exceed any guidance we have provided, especially in times of economic uncertainty. If, in the future, our operating or financial results for a particular period do not meet any guidance we provide or the expectations of investment analysts, or if we reduce our guidance for future periods, the market price of our common stock may decline.
Short sellers of our stock may be manipulative and may drive down the market price of our common stock.
Short selling is the practice of selling securities that the seller does not own, but rather has borrowed or intends to borrow from a third party with the intention of buying identical securities at a later date to return to the lender. A short seller hopes to profit from a decline in the value of the securities between the sale of the borrowed securities and the purchase of the replacement shares, as the short seller expects to pay less in that purchase than it received in the sale. It is therefore in the short seller’s interest for the price of the stock to decline, and some short sellers publish, or arrange for the publication of, opinions or characterizations regarding the relevant issuer, often involving misrepresentations of the issuer’s business prospects and similar matters calculated to create negative market momentum, which may permit them to obtain profits for themselves as a result of selling the stock short.
As a public entity, we may be the subject of concerted efforts by short sellers to spread negative information in order to gain a market advantage. In addition, the publication of misinformation may also result in lawsuits, the uncertainty and expense of which could adversely impact our business, financial condition, and reputation. There are no assurances that we will not face short sellers' efforts or similar tactics in the future, and the market price of our common stock may decline as a result of their actions.
48
Item 1B. Unresolved Staff Comments
Not Applicable.
Our corporate headquarters is located in New York, New York, and consists of approximately 22,549 square feet of space under a lease that expires in September 2024. We use these facilities for finance, legal, human resources, information technology, engineering, sales and marketing and other administrative functions. We also lease office space outside Houston, Texas, which we use to support our administrative functions, under leases that expire in March 2024 and December 2022.
Additionally, we operate our Vroom VRC located outside Houston, Texas, under leases that expire in December 2023. We use our Vroom VRC to recondition vehicles.
We also operate the TDA dealership outside Houston, Texas under a lease that expires in September 2024.
We believe our existing and planned facilities are sufficient for our current needs and that, should it be needed, suitable additional or alternative space will be available to accommodate our operations.
From time to time, we are subject to routine legal proceedings in the normal course of operating our business. Although the outcome of litigation is inherently difficult to predict, we are not involved in any legal proceedings that we believe could reasonably be expected to have a material adverse effect on our business, financial condition or results of operations.
Item 4. Mine Safety Disclosures
Not applicable.
49
INFORMATION ABOUT OUR EXECUTIVE OFFICERS AND DIRECTORS
The following table sets forth information regarding our executive officers and directors as of the date of this Annual Report on Form 10-K.
|
|
|
|
|
|
|
|
|
Name |
|
Age |
|
|
Position(s) |
|
|
Robert J. Mylod, Jr. |
|
|
54 |
|
|
Chairperson of the Board |
|
Scott A. Dahnke |
|
|
55 |
|
|
Director |
|
Michael J. Farello |
|
|
56 |
|
|
Director |
|
Laura W. Lang |
|
|
65 |
|
|
Director |
|
Laura G. O’Shaughnessy |
|
|
43 |
|
|
Director |
|
Adam Valkin |
|
|
46 |
|
|
Director |
|
Paul J. Hennessy |
|
|
56 |
|
|
Chief Executive Officer, Director |
|
David K. Jones |
|
|
51 |
|
|
Chief Financial Officer |
|
Mark E. Roszkowski |
|
|
50 |
|
|
Chief Revenue Officer |
|
Patricia Moran |
|
|
61 |
|
|
Chief Legal Officer and Secretary |
|
C. Denise Stott |
|
|
53 |
|
|
Chief People and Culture Officer |
Robert J. Mylod, Jr. has served as a member of our board of directors since September 2015. Mr. Mylod is the Managing Partner of Annox Capital Management, a private investment firm that he founded in 2013. Previously, Mr. Mylod served as Head of Worldwide Strategy & Planning and Vice Chairman for Bookings Holdings, Inc., an online travel services provider, from January 2009 to March 2011 and as its Chief Financial Officer and Vice Chairman from November 2000 to January 2009. He currently serves as the Chairman of the board of directors and a member of the compensation committee of Booking Holdings, Inc. Mr. Mylod also currently serves as a member of the board of directors and of the audit committee of Redfin Corporation, an online real estate company. He is also a member of the board of directors and of the audit and compensation committees of Dropbox, Inc., a cloud-based collaboration and data storage company, and a number of private companies. Mr. Mylod holds a Master of Business Administration from the University of Chicago Booth School of Business and a Bachelor of Arts in English from the University of Michigan. We believe that Mr. Mylod’s experience as a venture capital investor and a senior finance executive, including having served as the chief financial officer and vice chairman of a large publicly traded online services provider, qualifies him to serve on our board of directors.
Scott A. Dahnke has served on our board of directors since July 2015. Since 2016, Mr. Dahnke has served as co-Chief Executive Officer of L Catterton, a consumer-focused private equity firm, after previously serving as Managing Partner from 2003 to 2015. Prior to that, he was Managing Director of Deutsche Bank Capital Partners, the former private equity division of Deutsche Bank AG, from 2002 to 2003, and Managing Director of AEA Investors from 1998 to 2002. Previously, Mr. Dahnke was Chief Executive Officer of infoGROUP (formerly known as InfoUSA), a provider of data and data-driven marketing services, from 1997 to 1998. Prior to joining infoUSA, Mr. Dahnke served clients on an array of strategic and operational issues as a Partner at McKinsey & Company. His early career also includes experience in the Merger Department of Goldman, Sachs & Co. and with General Motors. Mr. Dahnke currently serves as Chairperson of the board of directors and of the compensation committee and the nominations, corporate governance and social responsibility committee of Williams Sonoma Inc. and as a member of the board of directors and of the technology, environmental safety and security committee of Norwegian Cruise Lines Holdings, as well as serving as a director of several private companies. Mr. Dahnke holds a Bachelor of Science from the University of Notre Dame and a Master of Business Administration from Harvard Business School. We believe Mr. Dahnke’s experience in private equity investment and expertise in the ecommerce, retail and consumer industry along with his service as a director at numerous companies qualifies him to serve on our board of directors.
50
Michael Farello has served on our board of directors since July 2015. Since 2006, Mr. Farello has served as Managing Partner at L Catterton, a consumer-focused private equity firm. Prior to this, he served as an executive at Dell Technologies, Inc., a global end-to-end technology provider, from 2002 to 2005, and spent twelve years at McKinsey & Company, a management consulting firm. Mr. Farello currently serves as a member of the board of directors of several private companies including FlashParking, Inc. and ClassPass Inc. Mr. Farello holds a Bachelor of Science from Stanford University and a Master of Business Administration from Harvard Business School. We believe Mr. Farello’s experience in private equity investments and expertise in the consumer sector, along with his service as a director at numerous companies qualifies him to serve on our board of directors.
Laura W. Lang has served on our board of directors since May 2020. Ms. Lang has served as the Managing Director of Narragansett Ventures, LLC, a strategic advisory firm focused on digital business transformation and growth investing, since January 2014. Since November 2018, Ms. Lang has also served as an adviser to L Catterton. Ms. Lang was the Chief Executive Officer of Time Inc., one of the largest branded media companies in the world, until 2013. From 2008 until she joined Time Inc. in 2012, Ms. Lang was Chief Executive Officer of Digitas Inc., a marketing and technology agency and unit of Publicis Groupe S.A. In addition, she headed the company’s pure-play digital agencies, including Razorfish, Big Fuel, Denuo and Phonevalley. Ms. Lang currently serves as a member of the board of directors and the talent and compensation and finance committees of V. F. Corporation, an international apparel and footwear company. She previously served as a member of the board of directors of Care.com Inc. from August 2014 to June 2016, Nutrisystem, Inc. from 2010 to 2012 and Benchmark Electronics, Inc. from 2005 to 2011. Ms. Lang holds a Bachelor of Arts from Tufts University and a Master of Business Administration from the Wharton School of the University of Pennsylvania. We believe Ms. Lang’s extensive leadership experience, digital and media expertise and service on the board of directors of other public companies qualifies her to serve on our board of directors.
Laura G. O’Shaughnessy has served on our board of directors since May 2020. Until recently, Ms. O’Shaughnessy was the Chief Executive Officer of SocialCode, LLC, a technology company that manages digital and social advertising for leading consumer brands, which she co-founded in 2009. Previously, Ms. O’Shaughnessy oversaw business development and product strategy for the Slate Group, an online publisher, where she specialized in advertising product development and strategic partnerships. Ms. O’Shaughnessy currently serves as a member of the board of directors of Acuity Brands and of several nonprofits. Ms. O’Shaughnessy holds a Master of Business Administration from the MIT Sloan School of Management and a Bachelor of Arts in Economics from the University of Chicago. We believe Ms. O’Shaughnessy’s leadership experience, including serving in a chief executive officer role, and digital and technology expertise qualifies her to serve on our board of directors.
Adam Valkin has served on our board of directors since December 2015. Since 2013, Mr. Valkin has served as Managing Director of General Catalyst, a venture capital firm. Mr. Valkin currently serves on the boards of directors of several private companies. Mr. Valkin holds a Bachelor of Arts in Economics from Harvard University. We believe Mr. Valkin’s experience in private equity investments and expertise in consumer businesses, along with his service as a director at numerous companies qualifies him to serve on our board of directors.
Paul J. Hennessy has served as our Chief Executive Officer and as a member of our board of directors since June 2016. Mr. Hennessy has over 20 years of global ecommerce leadership experience, previously serving in several leadership roles for Booking Holdings, Inc. (“Booking Holdings”), a world leader in online travel. At Booking Holdings, he most recently served as Chief Executive Officer of Priceline.com, a leading online travel agency for finding discount rates for travel-related purchases, from April 2015 to June 2016, and as Chief Marketing Officer of Booking.com, a leading online service for booking accommodation reservations, from November 2011 to March 2015. Mr. Hennessy also currently serves on the board of directors of Shutterstock Inc. Mr. Hennessy holds a Bachelor of Science in Marketing Management from Dominican College and a Master of Business Administration from Long Island University. Mr. Hennessy was selected to serve on our board of directors based on his deep experience and the perspective he brings as our Chief Executive Officer, as well as his extensive prior ecommerce leadership experience, driving growth strategies and optimizing operations and marketing for profitability.
David K. Jones has served as our Chief Financial Officer since November 2018. Prior to joining Vroom, he served as Executive Vice President and Chief Financial Officer of Iconix Brand Group, Inc., a global brand management company, from July 2015 to November 2018. From May 2011 to July 2015, Mr. Jones served as Executive Vice President and Chief Financial Officer of Penske Automotive Group, an international transportation services company operating automotive and commercial truck dealerships. Mr. Jones joined Penske Automotive Group in 2003 and served in various senior
51
management roles through May 2011. He began his career in public accounting at Andersen LLP and remained there for over a decade. Mr. Jones holds a Bachelor of Business Administration in Accounting from Seton Hall University.
Mark E. Roszkowski has served as our Chief Revenue Officer since February 2019. Prior to joining Vroom, Mr. Roszkowski served as Executive Vice President, Global Head of Corporate Development, Strategy and Strategic Partnerships of Verizon Media, the media and online businesses division of Verizon Communications Inc., from June 2017 to January 2019. He previously served as Senior Vice President, Global Head of Corporate Development, Strategy and Strategic Partnerships of AOL Inc., a web portal and online service provider, from June 2014 through its sale to Verizon in June 2015 and subsequently until June 2017. Mr. Roszkowski holds a B.S. in Mechanical Engineering from Worcester Polytechnic Institute, a Master of Science in Mechanical Engineering from the University of Rochester and a Master of Business Administration from Massachusetts Institute of Technology.
Patricia Moran has served as our Chief Legal Officer and Secretary since January 2019. Previously, Ms. Moran was a Managing Director, Chief Legal Officer and Secretary of Greenhill & Co. Inc., a publicly traded, global independent investment bank, from April 2014 to October 2016, and a Senior Advisor from November 2016 to April 2017. Prior to joining Greenhill, Ms. Moran was a Partner at Skadden, Arps, Slate, Meagher & Flom LLP, a leading global law firm where she had a 30-year career and chaired the New York office Diversity Committee. Ms. Moran has broad experience in corporate governance and corporate transactions, including mergers and acquisitions, private equity, joint ventures, restructurings and corporation finance. Ms. Moran holds a Bachelor of Science from the University of Scranton and a Juris Doctor from the Villanova University School of Law.
C. Denise Stott has served as our Chief People and Culture Officer since November 2016. Previously, Ms. Stott was Senior Vice President of Human Resources at Undertone, a digital advertising company, from May 2013 to October 2016. Ms. Stott’s tenure at Undertone included leading the human resources function through multiple transformations including acquisitions and the eventual sale to a public company. From February 2010 until she joined Undertone, Ms. Stott was Vice President of Human Resources at Yodle, a leader in local online marketing, where she led people development through a focus on talent acquisition, employee engagement, employee training and compensation and benefits. Ms. Stott also served as Senior Vice President of Human Resources for ZenithOptimedia, a media and advertising services provider, from August 2007 to July 2009. Ms. Stott holds a Bachelor of Science in Mathematical Economics from Tulane University and a Master of Business Administration from Vanderbilt University.
52
Item 5. Market for Registrant’s Common Equity, Related Stockholder Matters, and Issuer Purchases of Equity Securities.
Market Information
On June 9, 2020, our common stock began trading on the Nasdaq Global Select Market under the ticker symbol "VRM." Prior to that date, there was no public trading market for our common stock.
Holders of Record
We are authorized to issue up to 500,000,000 shares of common stock and up to 10,000,000 shares of preferred stock. As of March 1, 2021, there were 40 stockholders of record of our common stock. The actual number of stockholders is greater than this number of record holders, and includes stockholders who are beneficial owners, but whose shares are held in street name by brokers and other nominees. This number of holders of record also does not include stockholders whose shares may be held in trust by other entities.
Dividend Policy
We have not declared or paid any cash dividends on our common stock during the fiscal year and do not currently anticipate paying cash dividends in the foreseeable future.
Stock Performance Graph
The information contained in this Stock Performance Graph section shall not be deemed to be “soliciting material” or “filed” or incorporated by reference in future filings with the SEC, or subject to the liabilities of Section 18 of the Exchange Act, except to the extent that we specifically incorporate it by reference into a document filed under the Securities Act or the Exchange Act.
The following graph compares the total stockholder return from June 9, 2020, the date on which our common shares commenced trading on the Nasdaq Global Select Market, through December 31, 2020 of (i) our common stock, (ii) the Standard and Poor's 500 Stock Index ("S&P 500") and (iii) the Standard and Poor's 500 Retailing Index ("S&P 500 Retailing Index"), assuming an initial investment of $100 on June 9, 2020 including reinvestment of dividends where applicable. The results presented below are not necessarily indicative of future performance.
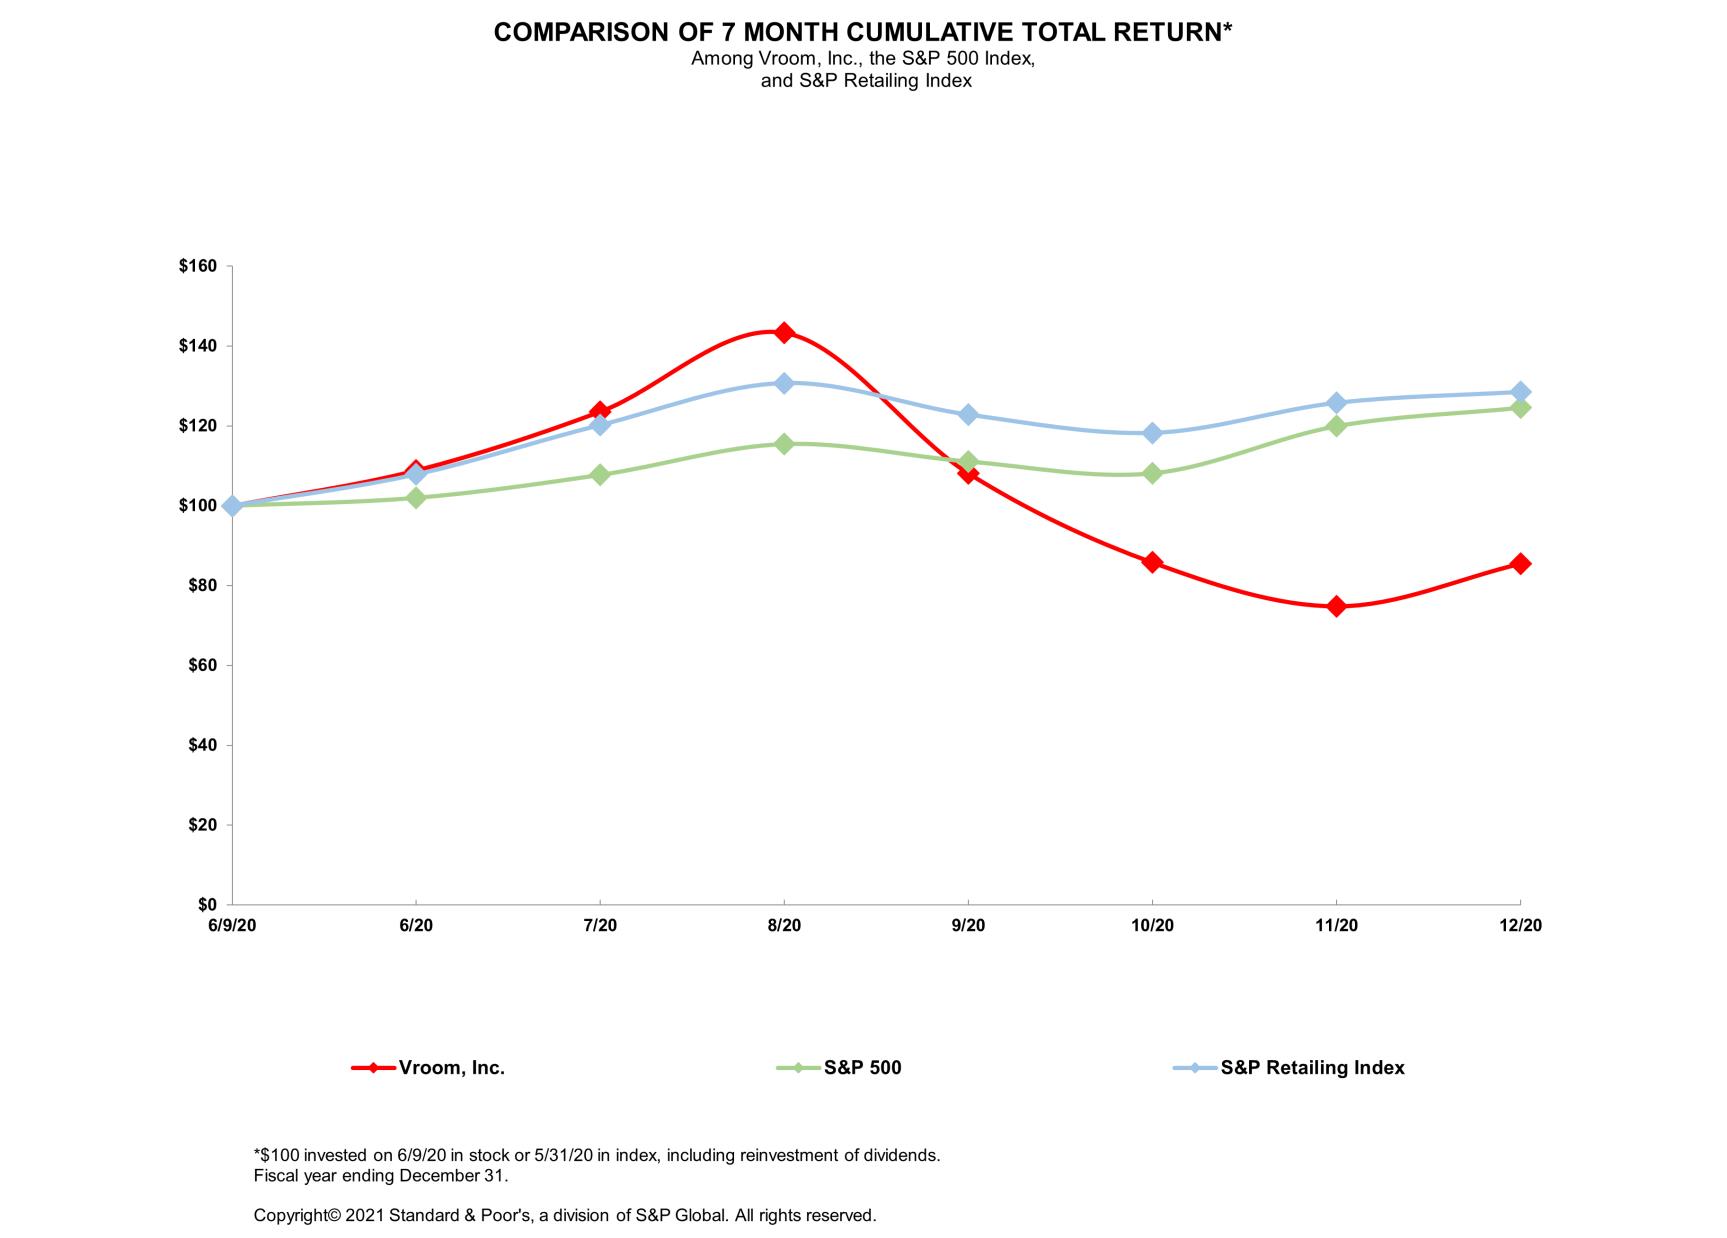
53
Purchases of equity securities by the Issuer or affiliated purchasers
None.
Recent sales of unregistered securities
There were no unregistered equity securities sold from January 1, 2020 to December 31, 2020, other than as previously disclosed in our Quarterly Reports on Form 10-Q.
Use of Proceeds from Public Offering of Common Stock
On June 11, 2020, we completed our IPO. The offer and sale of all of the shares in the IPO were registered under the Securities Act pursuant to a registration statement on Form S-1 (File No. 333-238482), as amended, which was declared effective by the SEC on June 8, 2020. There has been no material change in the planned use of proceeds from our IPO as described in our final prospectus filed with the SEC on June 9, 2020 pursuant to Rule 424(b)(4).
54
Item 6. Selected Financial Data
The following tables present our selected consolidated financial and other data. We have derived the selected consolidated statements of operations data for the years ended December 31, 2020, 2019, and 2018 and the consolidated balance sheet data as of December 31, 2020 and 2019 from our consolidated financial statements included elsewhere in this Annual Report on Form 10-K. You should read the following selected consolidated financial and other data together with the information under the section titled “Management’s Discussion and Analysis of Financial Condition and Results of Operations,” and our consolidated financial statements and related notes included elsewhere in this Annual Report on Form 10-K.
|
|
|
Year Ended December 31, |
|
|||||||||
|
|
|
2020 |
|
|
2019 |
|
|
2018 |
|
|||
|
(in thousands, except share and per share data) |
|
|
|
|
|
|
|
|
|
|
|
|
|
Total revenue |
|
$ |
1,357,700 |
|
|
$ |
1,191,821 |
|
|
$ |
855,429 |
|
|
Cost of sales |
|
|
1,286,155 |
|
|
|
1,133,962 |
|
|
|
794,622 |
|
|
Total gross profit |
|
|
71,545 |
|
|
|
57,859 |
|
|
|
60,807 |
|
|
Selling, general and administrative expenses |
|
|
245,546 |
|
|
|
184,988 |
|
|
|
133,842 |
|
|
Depreciation and amortization |
|
|
4,598 |
|
|
|
6,019 |
|
|
|
6,857 |
|
|
Loss from operations |
|
|
(178,599 |
) |
|
|
(133,148 |
) |
|
|
(79,892 |
) |
|
Interest expense |
|
|
9,656 |
|
|
|
14,596 |
|
|
|
8,513 |
|
|
Interest income |
|
|
(5,896 |
) |
|
|
(5,607 |
) |
|
|
(3,135 |
) |
|
Revaluation of preferred stock warrant |
|
|
20,470 |
|
|
|
769 |
|
|
|
174 |
|
|
Other income, net |
|
|
(114 |
) |
|
|
(96 |
) |
|
|
(495 |
) |
|
Loss before provision for income taxes |
|
|
(202,715 |
) |
|
|
(142,810 |
) |
|
|
(84,949 |
) |
|
Provision for income taxes |
|
|
84 |
|
|
|
168 |
|
|
|
229 |
|
|
Net loss |
|
$ |
(202,799 |
) |
|
$ |
(142,978 |
) |
|
$ |
(85,178 |
) |
|
Accretion of redeemable convertible preferred stock |
|
|
— |
|
|
|
(132,750 |
) |
|
|
(13,036 |
) |
|
Net loss attributable to common stockholders |
|
$ |
(202,799 |
) |
|
$ |
(275,728 |
) |
|
$ |
(98,214 |
) |
|
Net loss per share attributable to common stockholders, basic and diluted(1) |
|
$ |
(2.76 |
) |
|
$ |
(32.04 |
) |
|
$ |
(11.50 |
) |
|
Weighted-average number of shares outstanding used to compute net loss per share attributable to common stockholders, basic and diluted(1) |
|
|
73,345,569 |
|
|
|
8,605,962 |
|
|
|
8,540,778 |
|
|
|
|
As of December 31, |
|
|||||
|
|
|
2020 |
|
|
2019 |
|
||
|
Cash and cash equivalents |
|
$ |
1,056,213 |
|
|
$ |
217,734 |
|
|
Total assets |
|
|
1,724,056 |
|
|
|
563,387 |
|
|
Total liabilities |
|
|
496,954 |
|
|
|
262,907 |
|
|
Total redeemable convertible preferred stock |
|
|
— |
|
|
|
874,332 |
|
|
Total stockholders’ equity (deficit) |
|
|
1,227,102 |
|
|
|
(573,852 |
) |
|
|
(1) |
See Note 16 to our consolidated financial statements included elsewhere in this Annual Report on Form 10-K for an explanation of the calculations of our net loss per share attributable to common stockholders, basic and diluted, for the years ended December 31, 2020, 2019, and 2018. |
|
|
|
Year Ended December 31, |
|
|||||||||
|
|
|
2020 |
|
|
2019 |
|
|
2018 |
|
|||
|
Ecommerce units sold |
|
|
34,488 |
|
|
|
18,945 |
|
|
|
10,006 |
|
|
Vehicle Gross Profit per ecommerce unit |
|
$ |
869 |
|
|
$ |
1,109 |
|
|
$ |
1,666 |
|
|
Product Gross Profit per ecommerce unit |
|
|
896 |
|
|
|
587 |
|
|
|
576 |
|
|
Total Gross Profit per ecommerce unit |
|
$ |
1,765 |
|
|
$ |
1,696 |
|
|
$ |
2,242 |
|
|
Average monthly unique visitors |
|
|
969,890 |
|
|
|
653,216 |
|
|
|
291,772 |
|
|
Listed Vehicles |
|
|
15,963 |
|
|
|
4,956 |
|
|
|
3,421 |
|
|
Ecommerce average days to sale |
|
|
66 |
|
|
|
68 |
|
|
|
59 |
|
|
|
(a) |
See “Management’s Discussion and Analysis of Financial Condition and Results of Operations—Key Operating and Financial Metrics” for information on how we define these key operating and financial metrics. |
55
Item 7. Management’s Discussion and Analysis of Financial Condition and Results of Operations
The following discussion and analysis of our financial condition and results of operations should be read in conjunction with our consolidated financial statements and related notes appearing elsewhere in this Annual Report on Form 10-K. As discussed in the section titled "Special Note Regarding Forward-Looking Statements," the following discussion and analysis contains forward-looking statements that involve risks and uncertainties, as well as assumptions that, if they never materialize or prove incorrect, could cause our results to differ materially from those expressed or implied by such forward-looking statements. Factors that could cause or contribute to these differences include, but are not limited to, those identified below and those incorporated by reference into the section titled "Risk Factors" in Part I, Item 1A of this Annual Report on Form 10-K. Additionally, our historical results are not necessarily indicative of the results that may be expected for any period in the future.
A discussion regarding our financial condition and results of operation for the year ended December 31, 2020 compared to the year ended December 31, 2019 is presented below. A discussion regarding our financial condition and results of operations for the year ended December 31, 2019 compared to the year ended December 31, 2018 is included under “Management’s Discussion and Analysis of Financial Condition and Results of Operations” in our prospectus for our Follow-on Public Offering, which was filed with the SEC pursuant to Rule 424(b) on September 11, 2020.
Overview
Vroom is an innovative, end-to-end ecommerce platform that is transforming the used vehicle industry by offering a better way to buy and a better way to sell used vehicles. We are deeply committed to creating an exceptional experience for our customers.
We are driving enduring change in the industry on a national scale. We take a vertically integrated, asset-light approach that is reinventing all phases of the vehicle buying and selling process, from discovery to delivery and everything in between. Our platform encompasses:
|
|
• |
Ecommerce: We offer an exceptional ecommerce experience for our customers. In contrast to legacy dealerships and the peer-to-peer market, we provide consumers with a personalized and intuitive ecommerce interface to research and select from thousands of fully reconditioned vehicles. Our platform is accessible at any time on any device and provides transparent pricing, real-time financing and nationwide contact-free delivery right to a buyer’s driveway. For consumers looking to sell or trade in their vehicles, we provide attractive market-based pricing, real-time price quotes and convenient, contact-free at-home vehicle pick-up. |
|
|
• |
Vehicle Operations: Our scalable and vertically integrated operations underpin our business model. We strategically source inventory from auctions, consumers, rental car companies, OEMs and dealers. We improve our ability to acquire high-demand vehicles through enhanced supply science across all our sourcing channels and we have expanded our national marketing efforts to drive consumer sourcing. In our reconditioning and logistics operations, we deploy an asset-light strategy that optimizes a combination of ownership and operation of assets by us with strategic third-party partnerships. This hybrid approach provides flexibility, agility and speed without taking on unnecessary risk and capital investment, and drives improved unit economics and operating leverage. |
|
|
• |
Data Science and Experimentation: Data science and experimentation are at the core of everything we do. We rely on data science, machine learning and A/B and multivariate testing to continually drive optimization and operating leverage across our ecommerce and vehicle operations. We leverage data to increase the effectiveness of our national brand and performance marketing, enhance the customer experience, analyze market dynamics at scale, calibrate our vehicle pricing and optimize our overall inventory sales velocity. On the operations side, data science and experimentation enables us to fine tune our supply, sourcing and logistics models and to streamline our reconditioning processes. |
In 2019, the U.S. used automotive market is the largest consumer product category, generating approximately $841 billion from sales. Based on data from Cox Automotive, there were an estimated 37.2 million used vehicle transactions in 2020, compared to approximately 40 million transactions in 2019. The U.S. used automotive market is also highly fragmented, with over 42,000 dealers and millions of peer-to-peer transactions across the country. It also is ripe for disruption as an industry that is notorious for consumer dissatisfaction and has one of the lowest levels of ecommerce penetration. Industry reports estimate that ecommerce penetration will grow to as much as half of all used vehicle sales by 2030. Our platform, coupled with our national presence and brand, provides a significant competitive advantage versus local dealerships and regional players that lack nationwide reach and scalable technology, operations and logistics. The traditional auto dealers and peer-to-peer market do not and cannot offer consumers what we offer.
56
Our Model
We generate revenue through the sale of used vehicles and value-added products. We sell vehicles directly to consumers primarily through our Ecommerce segment. As the largest segment in our business, Ecommerce revenue grew 55.7% from 2019 to 2020, and we expect Ecommerce to continue to outgrow our other segments as it is the core focus of our growth strategy.
We also sell vehicles through wholesale channels, which provide a revenue source for vehicles that do not meet our Vroom retail sales criteria. Additionally, we generate revenue through the retail sale of used vehicles and value-added products at Houston-based Texas Direct Auto, or TDA.
For the year ended December 31, 2020, our Ecommerce, Wholesale and TDA segments represented 67.4%, 18.1% and 14.5% of our total revenue, respectively.
Our retail gross profit consists of two components: Vehicle Gross Profit and Product Gross Profit. Vehicle Gross Profit is calculated as the aggregate retail sales price for all vehicles sold to customers along with delivery fee revenue and document fees received from customers, less the aggregate cost to acquire such vehicles, the aggregate cost of inbound transportation for such vehicles to our vehicle reconditioning centers, which we refer to as VRCs, and the aggregate cost of reconditioning such vehicles for sale. Product Gross Profit consists of fees earned on any finance and protection products sold as part of a vehicle sale. Because we are paid fees on the value-added products we sell, our gross profit on such products is equal to the revenue we generate. See “—Key Operating and Financial Metrics.”
Below is an explanation of how we calculate vehicle gross profit per unit and product gross profit per unit:
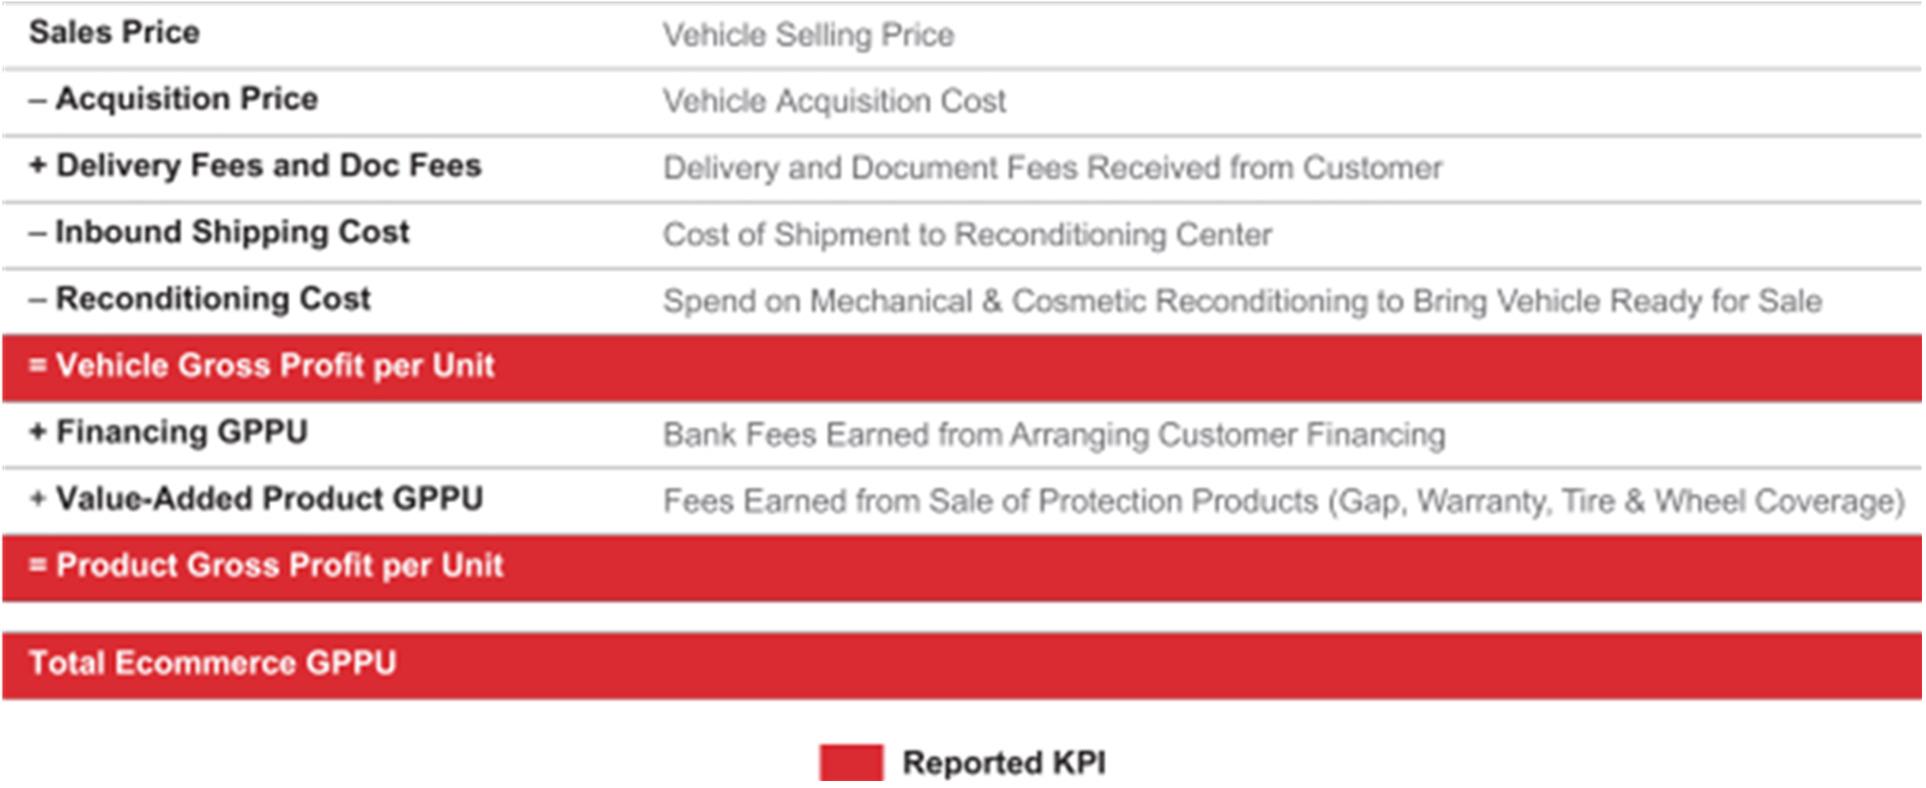
Our profitability depends primarily on increasing unit sales and operating leverage, as well as improving unit economics. We deploy an asset-light strategy that optimizes a combination of ownership and operation of assets by us with strategic third-party partnerships. Our hybrid approach also applies to the third-party value-added products we sell to customers, which enables us to generate additional revenue streams without taking on the risk associated with underwriting vehicle financing or protection products. As we scale, we expect to benefit from efficiencies and operating leverage across our business, including our marketing and technology investments, and our inventory procurement, logistics, reconditioning and sales processes.
Inventory Sourcing
We source our vehicle inventory from a variety of channels, including auctions, consumers, rental car companies, OEMs and dealers. Because the quality of vehicles and associated gross margin profile vary across each channel, the mix of inventory sources has an impact on our profitability. We continually evaluate the optimal mix of sourcing channels to generate the highest sales margins and shortest inventory turns, both of which contribute to increased gross profit per unit. We generate a vast set of data derived from market demand, pricing dynamics, vehicle acquisitions and subsequent sales, and we leverage that data to optimize future vehicle acquisitions. As we scale, we expect to continue to leverage the data at our disposal to optimize and enhance the volume and selection of vehicles in our inventory and, in turn, drive revenue growth and profitability. We are also exploring third party inventory strategies, which offers the possibility of expanding our sourcing channels through third party sellers while offering us attractive revenue models in an asset light, debt free structure. See “—Key Factors and Trends Affecting our Operating Results—Ability to drive growth by cost effectively increasing the volume and selection of vehicles in our inventory.”
57
Vehicle Reconditioning
Before a vehicle is listed for retail sale on our platform, it undergoes a thorough reconditioning process in order to meet our Vroom retail sales criteria. The efficiency of this reconditioning process is a key element in our ability to profitably grow. To recondition vehicles, we rely on a combination of our Vroom VRC along with a network of VRCs owned and operated by third parties, and we intend to continue to expand our network of third-party VRCs. Utilizing this hybrid approach, we have increased our total reconditioning capacity to approximately 2,000 units per week as of December 31, 2020, with approximately two-thirds from our eighteen third-party VRCs. As we increase the number of vehicles in our inventory and expand our reconditioning capacity, we expect that reconditioning costs and inbound shipping costs per unit will decrease as we benefit from economies of scale and operating leverage in reconditioning costs. See “—Key Factors and Trends Affecting our Operating Results—Ability to expand and optimize our reconditioning capacity to satisfy increasing demand.”
Logistics Network
For our logistics operations, we primarily have used national third-party carriers, which has allowed us to efficiently deliver vehicles to customers throughout the United States while focusing on expanding other critical components of our business, such as the volume and selection of vehicles in our inventory. We optimized our third-party logistics network nationally through the development of strategic carrier arrangements with national haulers and consolidated our carrier base into dedicated operating regions. This strategy enhanced the flexibility, agility and speed of our growth while reducing the need for additional capital commitments as we scaled our business. Since the start of the COVID-19 pandemic, we have experienced a reduced supply of carriers, increased shipping prices and deteriorating service levels. Thus, in response to these disruptions, and to further enhance the quality of our logistics operations and our customer experience, we have been accelerating our strategy to optimize our hybrid approach by expanding our proprietary logistics network. Initially we have been prioritizing investment in our last-mile delivery operations where we can have the greatest impact on the customer experience. We also have invested in short-haul trucks to make regional deliveries from our last mile hubs, and have begun to invest in long-haul vehicles for hub-to-hub shipments. Consistent with our hybrid approach, as we scale our business, we continue to strategically combine the operation of our expanded proprietary fleet with the use of third-party carriers, which we expect will enable us to both accommodate our growth and provide the highest level of customer service. See “—Key Factors and Trends Affecting our Operating Results—Ability to expand and develop our logistics network.”
Value-Added Products
We generate revenue by earning fees for selling value-added products to customers in connection with vehicle sales. Currently, our third-party value-added product offering consists of finance and protection products, including financing from third-party lenders for our customers’ vehicle purchases, as well as sales of vehicle service contracts, GAP protection and tire and wheel coverage. As we scale our business, we intend to introduce additional value-added products that will be attractive to our customers and drive revenue and profitable growth. We expect that both expanded product offerings and increased attachment rates in value-added product sales will have a positive impact on our profitability. See “—Key Factors and Trends Affecting our Operating Results—Ability to increase and better monetize value-added products.”
Our Segments
We manage and report operating results through three reportable segments:
|
|
• |
Ecommerce (67.4% of 2020 revenue; 49.3% of 2019 revenue): The Ecommerce segment represents retail sales of used vehicles through our ecommerce platform and fees earned on sales of value-added products associated with those vehicle sales. |
|
|
• |
Wholesale (18.1% of 2020 revenue; 17.9% of 2019 revenue): The Wholesale segment represents sales of used vehicles through wholesale channels. |
|
|
• |
TDA (14.5% of 2020 revenue; 32.8% of 2019 revenue): The TDA segment represents retail sales of used vehicles from TDA and fees earned on sales of value-added products associated with those vehicle sales. |
58
Gross profit is defined as revenue less cost of sales for each segment. Reflected below is a summary of reportable segment revenue and reportable segment gross profit for the years ended December 31, 2020, 2019, and 2018:
|
|
|
Year Ended December 31, |
|
|||||||||
|
|
|
2020 |
|
|
2019 |
|
|
2018 |
|
|||
|
|
|
(in thousands) |
|
|||||||||
|
Revenue: |
|
|
|
|
|
|
|
|
|
|
|
|
|
Ecommerce |
|
$ |
915,451 |
|
|
$ |
588,114 |
|
|
$ |
301,172 |
|
|
Wholesale |
|
|
245,580 |
|
|
|
213,464 |
|
|
|
174,514 |
|
|
TDA |
|
|
196,669 |
|
|
|
390,243 |
|
|
|
379,743 |
|
|
Total revenue |
|
$ |
1,357,700 |
|
|
$ |
1,191,821 |
|
|
$ |
855,429 |
|
|
Gross profit (loss): |
|
|
|
|
|
|
|
|
|
|
|
|
|
Ecommerce |
|
$ |
60,861 |
|
|
$ |
32,127 |
|
|
$ |
22,425 |
|
|
Wholesale |
|
|
(1,432 |
) |
|
|
340 |
|
|
|
3,257 |
|
|
TDA |
|
|
12,116 |
|
|
|
25,392 |
|
|
|
35,125 |
|
|
Total gross profit |
|
$ |
71,545 |
|
|
$ |
57,859 |
|
|
$ |
60,807 |
|
Key Operating and Financial Metrics
We regularly review a number of metrics, including the following key operating and financial metrics, to evaluate our business, measure our performance, identify trends in our business, prepare financial forecasts and make strategic decisions. We believe these operational measures are useful in evaluating our performance, in addition to our financial results prepared in accordance with U.S. Generally Accepted Accounting Principles, or U.S. GAAP. You should read the key operating and financial metrics in conjunction with the following discussion of our results of operations and together with our consolidated financial statements and related notes included elsewhere in this Annual Report on Form 10-K. We focus heavily on metrics related to unit economics as improved gross profit per unit is a key element of our growth and profitability strategies.
The calculation of our key operating and financial metrics is straightforward and does not rely on significant projections, estimates or assumptions. Nevertheless, each of our key operating and financial metrics has limitations because each focuses specifically on only one standard by which to evaluate our business, without taking into account other applicable standards, performance measures or operating trends by which our business could be evaluated. Accordingly, no single metric should be viewed as the bellwether by which our business should be measured. Rather, each key operating and financial metric should be considered in conjunction with other metrics and components of our results of operations, such as each of the other key operating and financial metrics and our revenues, inventory, loss from operations and segment results.
|
|
|
Year Ended December 31, |
|
|||||||||
|
|
|
2020 |
|
|
2019 |
|
|
2018 |
|
|||
|
Ecommerce units sold |
|
|
34,488 |
|
|
|
18,945 |
|
|
|
10,006 |
|
|
Vehicle Gross Profit per ecommerce unit |
|
$ |
869 |
|
|
$ |
1,109 |
|
|
$ |
1,666 |
|
|
Product Gross Profit per ecommerce unit |
|
|
896 |
|
|
|
587 |
|
|
|
576 |
|
|
Total Gross Profit per ecommerce unit |
|
$ |
1,765 |
|
|
$ |
1,696 |
|
|
$ |
2,242 |
|
|
Average monthly unique visitors |
|
|
969,890 |
|
|
|
653,216 |
|
|
|
291,772 |
|
|
Listed Vehicles |
|
|
15,963 |
|
|
|
4,956 |
|
|
|
3,421 |
|
|
Ecommerce average days to sale |
|
|
66 |
|
|
|
68 |
|
|
|
59 |
|
59
Ecommerce Units Sold
Ecommerce units sold is defined as the number of vehicles sold and shipped to customers through our ecommerce platform, net of returns under our Vroom 7-Day Return Program. Ecommerce units sold excludes sales of vehicles through the TDA and Wholesale segments. As we continue to expand our ecommerce business, we expect that ecommerce units sold will be the primary driver of our revenue growth. Additionally, each vehicle sale through our ecommerce platform also creates the opportunity to leverage such sale to sell value-added products. Continued ecommerce growth will also increase the number of trade-in vehicles acquired from our customers, which we can either recondition and add to our inventory or sell through wholesale channels.
Vehicle Gross Profit per Ecommerce Unit
Vehicle Gross Profit per ecommerce unit, which we refer to as Vehicle GPPU, for a given period is defined as the aggregate retail sales price and delivery charges for all vehicles sold through our Ecommerce segment less the aggregate costs to acquire those vehicles, the aggregate costs of inbound transportation to the VRCs and the aggregate costs of reconditioning those vehicles in that period, divided by the number of ecommerce units sold in that period. As we continue to expand our ecommerce business, we believe Vehicle GPPU will be a key driver of our long-term profitability.
Product Gross Profit per Ecommerce Unit
Product Gross Profit per ecommerce unit, which we refer to as Product GPPU, for a given period is defined as the aggregate fees earned on sales of value-added products in that period, net of the reserves for chargebacks on such products in that period, divided by the number of ecommerce units sold in that period. Because we are paid fees on the value-added products we sell, our gross profit is equal to the revenue we generate from the sale of value-added products. We plan to continue to introduce initiatives to increase the attachment rates of value-added products and expand our offerings of value-added products which will grow our Product GPPU.
Total Gross Profit per Ecommerce Unit
Total Gross Profit per ecommerce unit, which we refer to as Total GPPU, for a given period is calculated as the sum of Vehicle GPPU and Product GPPU. We view Total GPPU as a key metric of the profitability of our Ecommerce segment.
Average Monthly Unique Visitors
Average monthly unique visitors is defined as the average number of individuals who access our ecommerce platform within a calendar month. We calculate the average monthly unique visitors over any period by dividing the aggregate monthly unique visitors during such period by the number of months in that period. We use average monthly unique visitors to measure the quality of our customer experience, the effectiveness of our marketing campaigns and customer acquisition as well as the strength of our brand and market penetration.
Average monthly unique visitors is calculated using data provided by Google Analytics. The computation of average monthly unique visitors excludes individuals who access our platform multiple times within a calendar month, counting such individuals only one time for purposes of the calculation. If an individual accesses our ecommerce platform using different devices or different browsers on the same device within a given month, the first access through each such device or browser is counted as a separate monthly unique visitor.
Listed Vehicles
We define listed vehicles as the aggregate number of vehicles listed on our platform at any given point in time. Listed vehicles includes vehicles that are available for sale, pending sale and “coming soon”. Listed vehicles is a key indicator of our performance because we believe that the number of vehicles listed on our platform is a key driver of vehicle sales and revenue growth. Increasing the number of vehicles listed on our platform results in a greater selection of vehicles for our customers, creating demand and increasing conversion.
Ecommerce Average Days to Sale
We define ecommerce average days to sale as the average number of days between our acquisition of vehicles and the final delivery of such vehicles to customers through our ecommerce platform. We calculate average days to sale for a given period by dividing the aggregate number of days between the acquisition of all vehicles sold through our ecommerce platform during such period and final delivery of such vehicles to customers by the number of ecommerce units sold in that period. Ecommerce average days to sale excludes vehicles sold through the TDA and Wholesale segments.
60
Ecommerce average days to sale is an important metric because a reduction in the number of days between the acquisition of a vehicle and the delivery of such vehicle typically results in a higher gross profit per unit.
Non-GAAP Financial Measures
In addition to our results determined in accordance with U.S. GAAP, we believe the following non-GAAP financial measures are useful in evaluating our operating performance: EBITDA, Adjusted EBITDA, Adjusted loss from operations, Non-GAAP net loss, Non-GAAP net loss per share and Non-GAAP net loss per share, as adjusted. These non-GAAP financial measures have limitations as analytical tools in that they do not reflect all of the amounts associated with our results of operations as determined in accordance with U.S. GAAP. Because of these limitations, these non-GAAP financial measures should be considered along with other operating and financial performance measures presented in accordance with U.S. GAAP. The presentation of these non-GAAP financial measures is not intended to be considered in isolation or as a substitute for, or superior to, financial information prepared and presented in accordance with U.S. GAAP. We have reconciled all non-GAAP financial measures with the most directly comparable U.S. GAAP financial measures.
EBITDA, Adjusted EBITDA, Adjusted loss from operations, Non-GAAP net loss, Non-GAAP net loss per share and Non-GAAP net loss per share, as adjusted are supplemental performance measures that our management uses to assess our operating performance and the operating leverage in our business. Because EBITDA, Adjusted EBITDA, Adjusted loss from operations, Non-GAAP net loss, Non-GAAP net loss per share and Non-GAAP net loss per share, as adjusted facilitate internal comparisons of our historical operating performance on a more consistent basis, we use these measures for business planning purposes.
EBITDA and Adjusted EBITDA
We calculate EBITDA as net loss before interest expense, interest income, income tax expense and depreciation and amortization expense and we calculate Adjusted EBITDA as EBITDA adjusted to exclude the one-time, IPO related acceleration of non-cash stock-based compensation expense, the one-time, IPO related non-cash revaluation of a preferred stock warrant, and acquisition related costs. The following table presents a reconciliation of EBITDA and Adjusted EBITDA to net loss, which is the most directly comparable U.S. GAAP measure:
|
|
|
Year Ended December 31, |
|
|||||||||
|
|
|
2020 |
|
|
2019 |
|
|
2018 |
|
|||
|
|
|
(in thousands) |
|
|||||||||
|
Net loss |
|
$ |
(202,799 |
) |
|
$ |
(142,978 |
) |
|
$ |
(85,178 |
) |
|
Adjusted to exclude the following: |
|
|
|
|
|
|
|
|
|
|
|
|
|
Interest expense |
|
|
9,656 |
|
|
|
14,596 |
|
|
|
8,513 |
|
|
Interest income |
|
|
(5,896 |
) |
|
|
(5,607 |
) |
|
|
(3,135 |
) |
|
Provision for income taxes |
|
|
84 |
|
|
|
168 |
|
|
|
229 |
|
|
Depreciation and amortization expense |
|
|
4,654 |
|
|
|
6,157 |
|
|
|
6,932 |
|
|
EBITDA |
|
$ |
(194,301 |
) |
|
$ |
(127,664 |
) |
|
$ |
(72,639 |
) |
|
One-time IPO related acceleration of non-cash stock-based compensation |
|
|
1,262 |
|
|
|
— |
|
|
|
— |
|
|
One-time IPO related non-cash revaluation of preferred stock warrant |
|
|
20,470 |
|
|
|
— |
|
|
|
— |
|
|
Acquisition related costs |
|
|
2,080 |
|
|
|
— |
|
|
|
— |
|
|
Adjusted EBITDA |
|
$ |
(170,489 |
) |
|
$ |
(127,664 |
) |
|
$ |
(72,639 |
) |
Adjusted loss from operations
We calculate Adjusted loss from operations as loss from operations adjusted to exclude the one-time, IPO related acceleration of non-cash stock-based compensation expense and acquisition related costs. The following table presents a reconciliation of Adjusted loss from operations to loss from operations, which is the most directly comparable U.S. GAAP measure:
|
|
|
Year Ended December 31, |
|
|||||||||
|
|
|
2020 |
|
|
2019 |
|
|
2018 |
|
|||
|
|
|
|
|
|
|
(in thousands) |
|
|
|
|
|
|
|
Loss from operations |
|
$ |
(178,599 |
) |
|
$ |
(133,148 |
) |
|
$ |
(79,892 |
) |
|
Add: One-time IPO related acceleration of non-cash stock based compensation |
|
|
1,262 |
|
|
|
— |
|
|
|
— |
|
|
Add: Acquisition related costs |
|
|
2,080 |
|
|
|
— |
|
|
|
— |
|
|
Adjusted loss from operations |
|
$ |
(175,257 |
) |
|
$ |
(133,148 |
) |
|
$ |
(79,892 |
) |
61
Non-GAAP net loss, Non-GAAP net loss per share and Non-GAAP net loss per share, as adjusted
We calculate Non-GAAP net loss as net loss adjusted to exclude the one-time, IPO related acceleration of non-cash stock-based compensation expense, the one-time, IPO related non-cash revaluation of a preferred stock warrant, and acquisition related costs. We calculate Non-GAAP net loss per share as Non-GAAP net loss divided by weighted average number of shares outstanding. The following table presents a reconciliation of Non-GAAP net loss and Non-GAAP net loss per share to net loss and net loss per share, which are the most directly comparable U.S. GAAP measures:
|
|
|
Year Ended December 31, |
|
|||||||||
|
|
|
2020 |
|
|
2019 |
|
|
2018 |
|
|||
|
|
|
|
||||||||||
|
Net loss |
|
$ |
(202,799 |
) |
|
$ |
(142,978 |
) |
|
$ |
(85,178 |
) |
|
Accretion of redeemable convertible preferred stock |
|
|
— |
|
|
|
(132,750 |
) |
|
|
(13,036 |
) |
|
Net loss attributable to common stockholders |
|
$ |
(202,799 |
) |
|
$ |
(275,728 |
) |
|
$ |
(98,214 |
) |
|
Add: One-time IPO related acceleration of non-cash stock based compensation |
|
|
1,262 |
|
|
|
— |
|
|
|
— |
|
|
Add: One-time IPO related non-cash revaluation of preferred stock warrant |
|
|
20,470 |
|
|
|
— |
|
|
|
— |
|
|
Add: Acquisition related costs |
|
|
2,080 |
|
|
|
— |
|
|
|
— |
|
|
Non-GAAP net loss |
|
$ |
(178,987 |
) |
|
$ |
(275,728 |
) |
|
$ |
(98,214 |
) |
|
|
|
|
|
|
|
|
|
|
|
|
|
|
|
Weighted-average number of shares outstanding used to compute net loss per share, basic and diluted |
|
|
73,345,569 |
|
|
|
8,605,962 |
|
|
|
8,540,778 |
|
|
|
|
|
|
|
|
|
|
|
|
|
|
|
|
Net loss per share, basic and diluted |
|
$ |
(2.76 |
) |
|
$ |
(32.04 |
) |
|
$ |
(11.50 |
) |
|
Impact of one-time IPO related acceleration of non-cash stock based compensation |
|
|
0.02 |
|
|
|
— |
|
|
|
— |
|
|
Impact of one-time IPO related non-cash revaluation of preferred stock warrant |
|
|
0.28 |
|
|
|
— |
|
|
|
— |
|
|
Impact of acquisition related costs |
|
|
0.03 |
|
|
|
— |
|
|
|
— |
|
|
Non-GAAP net loss per share, basic and diluted |
|
$ |
(2.43 |
) |
|
$ |
(32.04 |
) |
|
$ |
(11.50 |
) |
|
Non-GAAP net loss per share, as adjusted, basic and diluted(a) |
|
$ |
(1.37 |
) |
|
$ |
(1.11 |
) |
|
$ |
(0.66 |
) |
(a)Non-GAAP net loss per share, as adjusted has been computed to give effect to, as of the beginning of each period presented, (i) the shares of common stock issued in connection with our IPO (ii) the automatic conversion of all outstanding shares of redeemable convertible preferred stock into shares of common stock that occurred upon the consummation of our IPO and (iii) the shares of common stock issued in connection with our follow-on public offering. The computation of Non-GAAP net loss per share, as adjusted is as follows:
|
|
|
Year Ended December 31, |
|
|||||||||
|
|
|
2020 |
|
|
2019 |
|
|
2018 |
|
|||
|
|
|
|
||||||||||
|
Non-GAAP net loss |
|
$ |
(178,987 |
) |
|
$ |
(275,728 |
) |
|
$ |
(98,214 |
) |
|
Add: Accretion of redeemable convertible preferred stock |
|
|
— |
|
|
|
132,750 |
|
|
|
13,036 |
|
|
Non-GAAP net loss, as adjusted |
|
$ |
(178,987 |
) |
|
$ |
(142,978 |
) |
|
$ |
(85,178 |
) |
|
|
|
|
|
|
|
|
|
|
|
|
|
|
|
Weighted-average number of shares outstanding used to compute net loss per share, basic and diluted |
|
|
73,345,569 |
|
|
|
8,605,962 |
|
|
|
8,540,778 |
|
|
Add: unweighted adjustment for common stock issued in connection with IPO |
|
|
24,437,500 |
|
|
|
24,437,500 |
|
|
|
24,437,500 |
|
|
Add: unweighted adjustment for conversion of redeemable convertible preferred stock in connection with IPO |
|
|
85,533,394 |
|
|
|
85,533,394 |
|
|
|
85,533,394 |
|
|
Add: unweighted adjustment for common stock issued in connection with follow-on public offering |
|
|
10,800,000 |
|
|
|
10,800,000 |
|
|
|
10,800,000 |
|
|
Less: Adjustment for the impact of the above items already included in weighted-average number of shares outstanding for the periods presented |
|
|
(63,865,903 |
) |
|
|
— |
|
|
|
— |
|
|
Weighted-average number of shares outstanding used to compute net loss per share, as adjusted, basic and diluted |
|
|
130,250,560 |
|
|
|
129,376,856 |
|
|
|
129,311,672 |
|
|
|
|
|
|
|
|
|
|
|
|
|
|
|
|
Non-GAAP net loss per share, as adjusted, basic and diluted |
|
$ |
(1.37 |
) |
|
$ |
(1.11 |
) |
|
$ |
(0.66 |
) |
62
Recent Events
Initial Public Offering
On June 11, 2020, we completed an initial public offering, or IPO, in which we sold 24,437,500 shares of common stock, which included 3,187,500 shares sold pursuant to the exercise by the underwriters of an over-allotment option to purchase additional shares, at a public offering price of $22.00 per share. We received proceeds of approximately $504.0 million, net of underwriting discount and before deducting offering expenses of $7.5 million, from sales of our shares in the IPO. Prior to the completion of the IPO, we effected a 2-for-1 forward stock split of all the issued and outstanding shares of our common stock the (“Stock Split”). As a result of the Stock Split and the completion of the IPO, all of our redeemable convertible preferred stock outstanding automatically converted into an aggregate of 85,533,394 shares of our common stock.
Follow-on Public Offering
On September 15, 2020, we closed on our follow-on public offering in which we sold 10,800,000 shares of common stock at the public offering price of $54.50 per share. We received proceeds of approximately $569.5 million from the offering, net of the underwriting discount and before deducting offering expenses of $1.5 million.
Rocket Agreement
On May 15, 2020, we entered into an agreement with Rocket Auto LLC and certain of its affiliates (collectively, “Rocket”) providing for the launch of an ecommerce platform under the “Rocket Auto” brand for the marketing and sale of vehicles directly to consumers (the “RA Agreement”). We will list our used vehicle inventory for sale on the Rocket Auto platform, but all sales of the inventory will be conducted through our platform. Rocket Auto is expected to launch publicly during 2021. During the term of the RA Agreement, Rocket has agreed to ensure that a minimum percentage of all used vehicles sold or leased through the platform on a monthly basis will be Vroom inventory. We issued Rocket 183,870 shares of our common stock upon execution of the RA Agreement. We will pay Rocket a combination of cash and stock for vehicle sales made through the platform. Rocket may earn up to 8,641,914 shares of common stock over a four-year period based upon sales volume of Vroom inventory through the Rocket Auto platform.
On January 7, 2021, we completed the acquisition of the CarStory business, a leader in AI-powered analytics and digital services for automotive retail, through the acquisition of 100% of Vast Holdings, Inc.
Leveraging its machine learning, informed by more than 7 million listings per day and more than 18 million consumer sessions per month, CarStory brings the industry’s most complete and accurate view of predictive market data to our national ecommerce and vehicle operations platform. As part of Vroom, we expect CarStory to continue to drive automotive retail innovation by aggregating, optimizing and distributing current market data from thousands of automotive sources and offering its digital retailing services to dealers, top automotive financial services companies and household names in automotive industry research and retailing.
Pursuant to the acquisition agreement, the aggregate purchase price was approximately $120.0 million, comprised of cash and shares of our common stock. On the closing date, we paid $77.5 million in cash and issued 1,072,117 shares of our common stock. The purchase price is subject to adjustment for certain working capital adjustments and post-closing indemnities.
Update on the Impact of the COVID-19 Pandemic
The results of our operations and overall financial performance were impacted due to the COVID-19 pandemic during the year ended December 31, 2020. After the initial disruption in our ecommerce operations, consumer demand for used vehicles now exceeds pre-COVID-19 levels. Lower foot traffic in the initial phase of the COVID-19 pandemic as well as reduced inventory at the TDA location as the ecommerce business scales, continues to negatively affect our TDA business. Additionally, we experienced disruption across our logistics network, with a reduced number of third-party providers available to deliver our vehicles, which has resulted in a slowdown of inventory being picked up and delivered to our VRCs and in sold units being delivered to customers. Our transportation costs have also increased as the remaining carriers have increased prices.
63
We expect our operations will continue to be adversely impacted continuing into in 2021, however, the magnitude and duration of the ultimate impact is impossible to predict with certainty due to:
|
|
• |
uncertainties regarding the duration of the COVID-19 pandemic and the length of time over which the disruptions caused by COVID-19 will continue, including any potential future waves, the spread of new variants and the success of vaccination programs; |
|
|
• |
the impact of governmental orders and regulations that have been, and may in the future be, imposed in response to the pandemic; |
|
|
• |
the impact of COVID-19 on VRCs, wholesale auctions, state DMV titling and registration services, third party vehicle carriers and other third parties on which we rely; |
|
|
• |
uncertainty as to the impact future increases in transmission could have on our ability to fully staff portions of our business; |
|
|
• |
the deterioration of economic conditions in the United States, as well as high unemployment levels, which could have an adverse impact on discretionary consumer spending; and |
|
|
• |
uncertainty as to whether and to what degree governmental stimulus packages or other economic relief will be provided to soften the negative economic effects of the COVID-19 crisis and the impact of any such relief. |
See “Risk Factors—Risk Related to the COVID-19 pandemic—The COVID-19 pandemic has had and is expected to continue to have an adverse effect on our business, financial condition and results of operations.”
Severe Weather Conditions
In February 2021, the state of Texas was hit with record breaking winter weather which resulted in dangerous road conditions, widespread power outages, water outages and contamination of the water supply, which caused significant disruptions to our Houston area operations, including the closure of our offices and Vroom VRC for several days. We immediately focused on the health and wellbeing of our employees, while also working to minimize the impact on our customers. We have resumed full operations and are currently working to address the backlog in certain areas of our business, including our VRC, sales support, and administrative functions. “Risk Factors—General Risk Factors—Our business is subject to the risk of natural disasters, adverse weather events and other catastrophic events, and to interruption by manmade problems such as terrorism.
Other Key Factors and Trends Affecting our Operating Results
Our financial condition and results of operations have been, and will continue to be, affected by a number of factors and trends, including the following:
Ability to utilize data science to drive revenue growth by cost effectively increasing the volume and selection of vehicles in our inventory
Our growth is primarily driven by vehicle sales. Vehicle sales growth, in turn, is largely driven by the volume of inventory and the selection of vehicles listed on our platform. Accordingly, we believe that having the appropriate volume and mix of vehicle inventory is critical to our ability to drive growth.
The continued growth of our vehicle inventory requires a number of important capabilities, including the ability to finance the acquisition of inventory at competitive rates, source high quality vehicles across various acquisition channels nationwide, secure adequate reconditioning capacity and execute effective marketing strategies to increase consumer sourcing. In addition, our ability to accurately forecast pricing and consumer demand for specific types of vehicles is critical to sourcing high quality, high-demand vehicles. This ability is enabled by our data science capabilities that leverage the growing amount of data at our disposal and fine-tune our supply and sourcing models. Our investment in CarStory further enhances our predictive market data capabilities. As we continue to invest in our operational efficiency and data analytics, we expect that we will continue to cost effectively increase the volume and optimize the selection of our ecommerce inventory.
Ability to capitalize on the continued migration of vehicle purchasers to ecommerce platforms through data-driven marketing efforts
While the overall ecommerce penetration rate in used vehicle sales remains low, over the last several years, ecommerce used vehicle sales have experienced significant growth. There has been a shift in consumer buying patterns
64
towards more convenient, personalized, and on-demand purchases, as well as a demand for ecommerce across more diverse categories, including the used vehicle market. We expect that the ecommerce model for buying and selling used vehicles will continue to grow and such growth may be accelerated by the COVID-19 pandemic. Our ability to continue to benefit from this trend will be an important driver of our future performance.
We seek to improve our brand awareness among consumers through national marketing campaigns in order to strengthen our customer acquisition funnel. We also use digital performance marketing such as search engine marketing, automotive aggregator sites and social media to acquire customers more cost effectively. Our aggregate marketing spend has increased over time, with our first national brand marketing campaign commencing in the first quarter of 2019, and we expect to continue to invest in both national brand marketing and performance marketing efforts. As we leverage our national brand, we believe this investment in marketing spend will drive additional demand and sales. We also believe that we have the ability to drive down the cost of acquisition per unit sold by increasing the efficiency of our marketing spend.
Ability to convert visitors to our platform into customers
The quality of the customer experience on our ecommerce platform is critical to our ability to attract new visitors to our platform, convert such visitors into customers and increase repeat customers. Our ability to drive higher customer conversion depends on our ability to make our platform a compelling choice for consumers based on our functionalities and consumer offerings.
Data analytics and experimentation drive decision making across all of our conversion efforts. By analyzing the data generated by the millions of visitors and tens of thousands of transactions on our platform, and continually testing strategies to maximize conversion rates, we form a better understanding of consumer preferences and try to create a more tailored ecommerce experience.
Increased conversion also depends on our ability to provide the necessary customer service and sales support to respond to increased demand. During the fourth quarter, we further expanded our customer experience team as we ramp up our sales support in anticipation of continued sales growth in 2021. We also recently engaged two additional customer service providers to expand our customer service operations as we scale our business. As we continue to invest in our brand and improve the customer experience, we expect that we will attract more visitors, improve conversion and drive greater sales.
Ability to optimize the mix of inventory sources to drive increased gross profit and improvements to our unit economics
We strategically source inventory from auctions, consumers, rental car companies, OEMs and dealers. Auctions, consumers, and rental car companies represent the vast majority of our inventory sources, accounting for approximately 48%, 40%, and 10% of our retail inventory sold for the year ended December 31, 2020, respectively. Because the quality of vehicles and associated gross margin profile vary across each channel, the mix of inventory sources has an impact on our profitability. We continually evaluate the optimal mix of sourcing channels and strive to source vehicles in a way that maximizes our average gross profit per unit and improves our unit economics. For example, purchasing vehicles at third-party auctions is competitive and, consequently, vehicle prices at third-party auctions tend to be higher than vehicle prices for vehicles sourced directly from consumers. Accordingly, as part of our sourcing strategy, we seek to increase the percentage of vehicle sales that we source from consumers.
Our ability to increase the percentage of inventory sourced directly from consumers will depend on the popularity and success of our ecommerce platform. In order to continue to increase the percentage of vehicles that we source directly from consumers, we also have expanded our national marketing efforts that are focused on our Sell Us Your Car® proposition, which we believe will result in more customers gaining familiarity with our platform. We expect that, as consumers experience the convenience of our platform to sell or trade in their used vehicles, the percentage of inventory we source directly from consumers will continue to grow.
We are also exploring third-party inventory strategies, which offers the possibility of expanding our sourcing channels through third party sellers while offering us attractive revenue models in an asset light, debt free structure.
Ability to expand and optimize our reconditioning capacity to satisfy increasing demand
Our ability to recondition purchased vehicles to our quality standards is a critical component of our business. Historically, we have successfully increased our reconditioning capacity as our business has grown, and our future success will depend on our ability to expand and optimize our reconditioning capacity to satisfy increasing customer demand. We employ a hybrid approach that combines the use of our Vroom VRC and third-party VRCs to best meet our reconditioning needs.
65
In 2019, we significantly increased our reconditioning capacity within our Vroom VRC by overhauling our operations and applying lean manufacturing techniques and other software-enabled technological advances. As we continue to grow our business, we intend to continue to invest in increased reconditioning capacity and operational efficiency through third-party VRC locations. Additionally, our use of third-party VRCs to recondition vehicles allows us to avoid additional capital expenditures, quickly increase capacity, maintain greater operational flexibility and broaden our geographic footprint to drive lower logistics costs. We have continued to expand our third-party VRC operations and, as of the date of this Annual Report on Form 10-K, have a total of nineteen VRCs throughout the U.S. See “—Liquidity and Capital Resources.”
We leverage our data analytics and deep industry experience to strategically select VRC locations where we believe there is the highest supply and demand for our vehicles. We expect that our continued investment in reconditioning capacity and technology will lower our reconditioning costs per unit and drive greater operational efficiency, higher gross profit per unit and improved unit economics.
Ability to expand and develop our logistics network
We primarily use third-party carriers and have optimized our third-party logistics network nationwide through the development of strategic carrier arrangements with national haulers and the consolidation of our carrier base into dedicated operating regions. We expect that these enhanced logistics operations, combined with the expansion of strategically located VRCs, will drive efficiency in our logistics operations. Our VRCs also serve as pooling points to aggregate acquired vehicles and we are using certain VRCs as hubs for staging vehicles for last-mile delivery to customers, which we expect to provide an improved experience for customers. Recently, as a result of the continued prevalence of the COVID-19 pandemic, we have experienced a reduced supply of carriers, increased shipping prices and deteriorating service levels. Thus, in response to these disruptions, and to further enhance the quality of our logistics operations and our customer experience, we are accelerating our strategy to optimize our hybrid approach by expanding our proprietary logistics network. Currently, we are prioritizing investment in our last-mile delivery operations where we can have the greatest impact on the customer experience. We also have invested in short-haul trucks to make regional deliveries from our last mile hubs, and have begun to invest in long-haul vehicles for hub-to-hub shipments. As we invest in our expanded logistics operations, we expect to incur increased operating expenses and capital expenditures associated with purchasing or leasing fleet vehicles, leasing space for delivery hubs, hiring qualified drivers, and operating and maintaining fleet vehicles, offset in part by reduced third-party logistics expense. Consistent with our hybrid approach, we continue to strategically combine the operation of our expanded proprietary fleet with the use of third-party carriers, which we expect will enable us to both accommodate our growth and provide the highest level of customer service. Over time, as our business scales, we expect that optimizing our logistics network through this hybrid approach will result in improved unit economics, increased profitability and an enhanced customer experience.
Ability to increase and better monetize value-added products
Our offering of value-added products is an integral part of providing a seamless vehicle-buying experience to our customers. These products provide added revenue streams for us as well as offering convenience, assurance and efficiency for our customers. We sell our third-party value-added products through our strategic relationships with multiple lenders and other third parties who bear the incremental risks associated with the underwriting of finance and protection products. We have entered into strategic partnerships with lenders such as Chase and Santander which have contributed to improvements in Product GPPU. Additionally, through our on-going data analytics, experimentation and further development of our ecommerce technology, we expect to increase attachment rates of our existing value-added products while finding new opportunities to include additional finance and protection products, as well as other value-added products. Because we are paid fees on value-added products we sell, our gross profit is equal to the revenue we generate on such sales. As a result, such sales help drive total gross profit per unit. We expect that, as we scale our business, we will increase the breadth and variety of value-added products offered to customers and improve attachment rates to our vehicle sales, which in turn will grow revenue and drive profitability.
Seasonality
Used vehicle sales are seasonal. The used vehicle industry typically experiences an increase in sales early in the calendar year and reaches its highest point late in the first quarter and early in the second quarter. Vehicle sales then level off through the rest of the year, with the lowest level of sales in the fourth quarter. This seasonality has historically corresponded with the timing of income tax refunds, which are an important source of funding for vehicle purchases. Additionally, used vehicles depreciate at a faster rate in the last two quarters of each year and a slower rate in the first two quarters of each year. In line with these macro trends, our gross profit per unit has historically been higher in the first half of the year when compared to the second half of the year. See “Risk Factors—Risks Related to Our Financial Condition and
66
Results of Operations—We may experience seasonal and other fluctuations in our quarterly results of operations, which may not fully reflect the underlying performance of our business.”
Components of Results of Operations
Revenue
Retail vehicle revenue
We sell retail vehicles through both our ecommerce platform and TDA. Revenue from vehicle sales, including any delivery charges, are recognized when vehicles are delivered to the customers or picked up at our TDA retail location, net of a reserve for estimated returns. The number of units sold and the average selling price (“ASP”) per unit are the primary factors impacting our retail revenue stream.
The number of units sold depends on the volume of inventory and the selection of vehicles listed on our ecommerce platform, our ability to attract new customers, our brand awareness and our ability to expand our reconditioning operations and logistics network.
ASP depends primarily on our acquisition and pricing strategies, retail used car market prices, our average days to sale and our reconditioning and logistics costs.
We have begun to strategically take advantage of a broader portion of the used vehicle market by adding more lower priced vehicles to our inventory. As a data-driven company, we acquire inventory based upon demand predicted by our data analytics. Since the COVID-19 pandemic, that data has been moving towards lower-priced inventory, which we expect to continue to result in a lower ASP per unit than historical levels.
Wholesale vehicle revenue
We sell vehicles that do not meet our Vroom retail sales criteria through wholesale channels. Vehicles sold through wholesale channels are acquired from customers who trade-in their vehicles when making a purchase from us, from customers who sell their vehicle to us in direct-buy transactions, and from liquidation of vehicles previously listed for retail sale. The number of wholesale vehicles sold and the ASP per unit are the primary drivers of wholesale revenue. The ASP per unit is affected by the mix of the vehicles we acquire and general supply and demand conditions in the wholesale market.
Product revenue
We generate revenue by earning fees on sales of value-added products to our customers in connection with vehicle sales, including fees earned on customer vehicle financing from third-party lenders and fees earned on sales of other value-added products, such as vehicle service contracts, GAP protection and tire and wheel coverage. We earn fees on these products pursuant to arrangements with the third parties that sell and administer these products. For accounting purposes, we are an agent for these transactions and, as a result, we recognize fees on a net basis when the customer enters into an arrangement to purchase these products or obtain third-party financing, which is typically at the time of a vehicle sale. Our gross profit on product revenue is equal to the revenue we generate.
Product revenue is affected by the number of vehicles sold, the attachment rate of value-added products and the amount of fees we receive on each product. Product revenue also consists of estimated profit-sharing amounts to which we are entitled based on the performance of third-party protection products once a required claims period has passed.
A portion of the fees we receive is subject to chargeback in the event of early termination, default, or prepayment of the contracts by our customers. We recognize product revenue net of reserves for estimated chargebacks.
Other revenue
Other revenue consists of labor and parts revenue earned by us for vehicle repair services at TDA.
See “Note 3—Revenue Recognition” to our consolidated financial statements included elsewhere in this Annual Report on Form 10-K.
67
Cost of sales
Cost of sales primarily includes the costs to acquire vehicles, inbound transportation costs and direct and indirect reconditioning costs associated with preparing vehicles for sale. Costs to acquire vehicles are primarily driven by the inventory source, vehicle mix and general supply and demand conditions of the used vehicle market. Inbound transportation costs include costs to transport the vehicle to our VRCs. Reconditioning costs include parts, labor and third-party reconditioning costs directly attributable to the vehicle and allocated overhead costs. Cost of sales also includes any accounting adjustments to reflect vehicle inventory at the lower of cost or net realizable value.
Total gross profit
Total gross profit is defined as total revenue less costs associated with such revenue.
Selling, general and administrative expenses
Our selling, general, and administrative expenses, which we refer to as SG&A expenses, consist primarily of advertising and marketing expenses, outbound transportation costs, employee compensation, occupancy costs of our facilities and professional fees for accounting, auditing, tax, legal and consulting services.
We expect that our SG&A expenses will increase in the future as we expand our operations, including our proprietary logistics operations, hire additional employees and continue to increase our marketing spend. In 2020, we further expanded our customer experience team as we ramp up our sales support in anticipation of continued sales growth. We also recently engaged two additional customer service providers to expand our customer service operations as we scale our business. We also will continue to incur increased expenses associated with being a public company, including costs of accounting, audit, legal, regulatory and tax-related services associated with maintaining compliance with SEC and Nasdaq requirements, director and officer insurance costs, and investor and public relations costs.
Depreciation and amortization
Our depreciation and amortization expense primarily includes: depreciation related to our leasehold improvements and company vehicles; amortization related to intangible assets in acquired businesses; and capitalized internal use software costs incurred in the development of our platform and website applications. Depreciation expense related to our Vroom VRC is included in cost of sales in the consolidated statements of operations.
Interest expense
Our interest expense includes interest expense related to our 2020 Vehicle Floorplan Facility, as discussed below, which is used to finance our inventory, as well as interest expense on our term loan facility, which was repaid in full in December 2019.
Interest Income
Interest income primarily represents interest credits earned on cash deposits maintained in relation to our 2020 Vehicle Floorplan Facility as well as interest earned on cash and cash equivalents.
68
Results of Operations
The following table presents our consolidated results of operations for the periods indicated:
|
|
|
Year Ended December 31, |
|
|
|
|
|
|
Year Ended December 31, |
|
|
|
|
|
|||||||||||||
|
|
|
2020 |
|
|
|
2019 |
|
|
% Change |
|
|
|
2019 |
|
|
|
2018 |
|
|
% Change |
|
||||||
|
|
|
(in thousands) |
|
|
|
|
|
|
|
(in thousands) |
|
|
|
|
|
||||||||||||
|
Revenue: |
|
|
|
|
|
|
|
|
|
|
|
|
|
|
|
|
|
|
|
|
|
|
|
|
|
|
|
|
Retail vehicle, net |
$ |
|
1,072,551 |
|
|
$ |
|
952,910 |
|
|
|
12.6 |
% |
|
$ |
|
952,910 |
|
|
$ |
|
656,928 |
|
|
|
45.1 |
% |
|
Wholesale vehicle |
|
|
245,580 |
|
|
|
|
213,464 |
|
|
|
15.0 |
% |
|
|
|
213,464 |
|
|
|
|
174,514 |
|
|
|
22.3 |
% |
|
Product, net |
|
|
38,195 |
|
|
|
|
23,708 |
|
|
|
61.1 |
% |
|
|
|
23,708 |
|
|
|
|
19,653 |
|
|
|
20.6 |
% |
|
Other |
|
|
1,374 |
|
|
|
|
1,739 |
|
|
|
(21.0 |
)% |
|
|
|
1,739 |
|
|
|
|
4,334 |
|
|
|
(59.9 |
)% |
|
Total revenue |
|
|
1,357,700 |
|
|
|
|
1,191,821 |
|
|
|
13.9 |
% |
|
|
|
1,191,821 |
|
|
|
|
855,429 |
|
|
|
39.3 |
% |
|
Cost of sales |
|
|
1,286,155 |
|
|
|
|
1,133,962 |
|
|
|
13.4 |
% |
|
|
|
1,133,962 |
|
|
|
|
794,622 |
|
|
|
42.7 |
% |
|
Total gross profit |
|
|
71,545 |
|
|
|
|
57,859 |
|
|
|
23.7 |
% |
|
|
|
57,859 |
|
|
|
|
60,807 |
|
|
|
(4.8 |
)% |
|
Selling, general and administrative expenses |
|
|
245,546 |
|
|
|
|
184,988 |
|
|
|
32.7 |
% |
|
|
|
184,988 |
|
|
|
|
133,842 |
|
|
|
38.2 |
% |
|
Depreciation and amortization |
|
|
4,598 |
|
|
|
|
6,019 |
|
|
|
(23.6 |
)% |
|
|
|
6,019 |
|
|
|
|
6,857 |
|
|
|
(12.2 |
)% |
|
Loss from operations |
|
|
(178,599 |
) |
|
|
|
(133,148 |
) |
|
|
34.1 |
% |
|
|
|
(133,148 |
) |
|
|
|
(79,892 |
) |
|
|
66.7 |
% |
|
Interest expense |
|
|
9,656 |
|
|
|
|
14,596 |
|
|
|
(33.8 |
)% |
|
|
|
14,596 |
|
|
|
|
8,513 |
|
|
|
71.5 |
% |
|
Interest income |
|
|
(5,896 |
) |
|
|
|
(5,607 |
) |
|
|
5.2 |
% |
|
|
|
(5,607 |
) |
|
|
|
(3,135 |
) |
|
|
78.9 |
% |
|
Revaluation of stock warrant |
|
|
20,470 |
|
|
|
|
769 |
|
|
|
2,561.9 |
% |
|
|
|
769 |
|
|
|
|
174 |
|
|
|
342.0 |
% |
|
Other income, net |
|
|
(114 |
) |
|
|
|
(96 |
) |
|
|
18.8 |
% |
|
|
|
(96 |
) |
|
|
|
(495 |
) |
|
|
(80.6 |
)% |
|
Loss before provision for income taxes |
|
|
(202,715 |
) |
|
|
|
(142,810 |
) |
|
|
41.9 |
% |
|
|
|
(142,810 |
) |
|
|
|
(84,949 |
) |
|
|
68.1 |
% |
|
Provision for income taxes |
|
|
84 |
|
|
|
|
168 |
|
|
|
(50.0 |
)% |
|
|
|
168 |
|
|
|
|
229 |
|
|
|
(26.6 |
)% |
|
Net loss |
$ |
|
(202,799 |
) |
|
$ |
|
(142,978 |
) |
|
|
41.8 |
% |
|
$ |
|
(142,978 |
) |
|
$ |
|
(85,178 |
) |
|
|
67.9 |
% |
Segments
We manage and report operating results through three reportable segments:
|
|
• |
Ecommerce (67.4% of 2020 revenue; 49.3% of 2019 revenue): The Ecommerce segment represents retail sales of used vehicles through our ecommerce platform and fees earned on sales of value-added products associated with those vehicle sales. |
|
|
• |
Wholesale (18.1% of 2020 revenue; 17.9% of 2019 revenue): The Wholesale segment represents sales of used vehicles through wholesale channels. |
|
|
• |
TDA (14.5% of 2020 revenue; 32.8% of 2019 revenue): The TDA segment represents retail sales of used vehicles from TDA and fees earned on sales of value-added products associated with those vehicle sales. |
69
Year Ended December 31, 2020 and 2019
Ecommerce
The following table presents our Ecommerce segment results of operations for the periods indicated:
|
|
|
Year Ended December 31, |
|
|
|
|
|
|
|
|
|
|
|||||||
|
|
|
2020 |
|
|
2019 |
|
|
|
Change |
|
|
% Change |
|
||||||
|
|
|
(in thousands, except unit data and average days to sale) |
|
|
|
|
|
|
|
|
|
|
|||||||
|
Ecommerce units sold |
|
|
|
34,488 |
|
|
|
|
18,945 |
|
|
|
|
15,543 |
|
|
|
82.0 |
% |
|
Ecommerce revenue: |
|
|
|
|
|
|
|
|
|
|
|
|
|
|
|
|
|
|
|
|
Vehicle revenue |
|
$ |
|
884,560 |
|
|
$ |
|
576,998 |
|
|
$ |
|
307,562 |
|
|
|
53.3 |
% |
|
Product revenue |
|
|
|
30,891 |
|
|
|
|
11,116 |
|
|
|
|
19,775 |
|
|
|
177.9 |
% |
|
Total ecommerce revenue |
|
$ |
|
915,451 |
|
|
$ |
|
588,114 |
|
|
$ |
|
327,337 |
|
|
|
55.7 |
% |
|
Ecommerce gross profit: |
|
|
|
|
|
|
|
|
|
|
|
|
|
|
|
|
|
|
|
|
Vehicle gross profit |
|
$ |
|
29,970 |
|
|
$ |
|
21,011 |
|
|
$ |
|
8,959 |
|
|
|
42.6 |
% |
|
Product gross profit |
|
|
|
30,891 |
|
|
|
|
11,116 |
|
|
|
|
19,775 |
|
|
|
177.9 |
% |
|
Total ecommerce gross profit |
|
$ |
|
60,861 |
|
|
$ |
|
32,127 |
|
|
$ |
|
28,734 |
|
|
|
89.4 |
% |
|
Average vehicle selling price per ecommerce unit |
|
$ |
|
25,648 |
|
|
$ |
|
30,456 |
|
|
$ |
|
(4,808 |
) |
|
|
(15.8 |
)% |
|
Gross profit per ecommerce unit: |
|
|
|
|
|
|
|
|
|
|
|
|
|
|
|
|
|
|
|
|
Vehicle gross profit per ecommerce unit |
|
$ |
|
869 |
|
|
$ |
|
1,109 |
|
|
$ |
|
(240 |
) |
|
|
(21.6 |
)% |
|
Product gross profit per ecommerce unit |
|
|
|
896 |
|
|
|
|
587 |
|
|
|
|
309 |
|
|
|
52.6 |
% |
|
Total gross profit per ecommerce unit |
|
$ |
|
1,765 |
|
|
$ |
|
1,696 |
|
|
$ |
|
69 |
|
|
|
4.1 |
% |
|
Ecommerce average days to sale |
|
|
|
66 |
|
|
|
|
68 |
|
|
|
|
(2 |
) |
|
|
(2.9 |
)% |
Ecommerce units
After the initial disruption in our ecommerce operations due to the COVID-19 pandemic, consumer demand for used vehicles has returned to pre-COVID-19 levels and in 2020, we experienced strong consumer demand for our ecommerce solutions and contact-free delivery.
Ecommerce units sold increased 15,543, or 82.0%, from 18,945 in 2019 to 34,488 in 2020. This increase was driven by higher inventory levels, our national advertising campaign which continues to strengthen our national brand awareness as well as greater consumer acceptance of our business model as a result of disruptions caused by the COVID-19 pandemic, and process improvements in our ecommerce platform. Average monthly unique visitors to our website grew from 653,216 in 2019 to 969,890 in 2020, representing year over year growth of 48.5%. We expect ecommerce units sold to continue to grow in the future as we increase our inventory selection and marketing efforts as well as improve conversion.
Vehicle Revenue
Ecommerce vehicle revenue increased $307.6 million, or 53.3%, from $577.0 million in 2019 to $884.6 million in 2020. The increase in ecommerce vehicle revenue was primarily attributable to the 15,543 increase in ecommerce units sold, which increased vehicle revenue by $473.4 million, partially offset by a lower ASP per unit, which decreased from $30,456 in 2019 to $25,648 in 2020 and decreased vehicle revenue by $165.8 million. The decrease in ASP per unit was driven by demand predicted by our data analytics and by our ability to source and recondition lower priced vehicles while maintaining target gross profit per units as a result of our expanding VRC network. We expect to continue to sell vehicles with a lower ASP per unit than historical levels and that ecommerce vehicle revenue will continue to grow driven by increases in ecommerce units sold.
Product Revenue
Ecommerce product revenue increased $19.8 million, or 177.9%, from $11.1 million in 2019 to $30.9 million in 2020. The increase in ecommerce product revenue was primarily attributable to a $309 increase in product revenue per unit, which increased product revenue by $10.7 million and the 15,543 increase in ecommerce units sold, which increased product revenue by $9.1 million. The increase in product revenue per unit was primarily due to higher attachment rates, improved financing features in our ecommerce platform as well as our strategic lender partnerships. We expect ecommerce product revenue will continue to grow in the future driven by increases in ecommerce units sold, new product offerings, initiatives to improve product attachment rates and increases in per unit profit.
70
Vehicle Gross Profit
Ecommerce vehicle gross profit increased $9.0 million, or 42.6%, from $21.0 million in 2019 to $30.0 million in 2020. The increase in vehicle gross profit was primarily attributable to the 15,543 increase in ecommerce units sold, which increased vehicle gross profit by $17.2 million, partially offset by a $240 decrease in vehicle gross profit per unit, which decreased vehicle gross profit by $8.2 million. Vehicle gross profit per unit decreased from $1,109 in 2019 to $869 in 2020, primarily attributable to lower sales margins (sales price less purchase price of vehicles sold), partially offset by improvements in inbound logistics and reconditioning costs.
As we continue to mature our infrastructure, increase and optimize our network of VRCs, we expect ecommerce vehicle gross profit per unit to increase in the future driven by reduced costs across acquisitions, logistics and reconditioning.
Product Gross Profit
Ecommerce product gross profit increased $19.8 million, or 177.9%, from $11.1 million in 2019 to $30.9 million in 2020. The increase in ecommerce product gross profit was primarily attributable to a $309 increase in product gross profit per unit which increased product gross profit by $10.7 million and the 15,543 increase in ecommerce units sold which increased product gross profit by $9.1 million. The increase in product gross profit per unit was primarily attributable to higher attachment rates, improved financing features in our ecommerce platform as well as our strategic lender partnerships. We expect ecommerce product gross profit will continue to grow in the future driven by increases in ecommerce units sold, new product offerings, initiatives to improve product attachment rates and increases in per unit profit.
Wholesale
The following table presents our Wholesale segment results of operations for the periods indicated:
|
|
|
|
Year Ended December 31, |
|
|
|
|
|
|
|
|
|
|
||||||
|
|
|
2020 |
|
|
2019 |
|
|
|
Change |
|
|
% Change |
|
||||||
|
|
|
(in thousands, except unit data) |
|
|
|
|
|
|
|
|
|
|
|||||||
|
Wholesale units sold |
|
|
|
21,108 |
|
|
|
|
20,197 |
|
|
|
|
911 |
|
|
|
4.5 |
% |
|
Wholesale revenue |
|
$ |
|
245,580 |
|
|
$ |
|
213,464 |
|
|
$ |
|
32,116 |
|
|
|
15.0 |
% |
|
Wholesale gross (loss) profit |
|
$ |
|
(1,432 |
) |
|
$ |
|
340 |
|
|
$ |
|
(1,772 |
) |
|
|
(521.2 |
)% |
|
Average selling price per unit |
|
$ |
|
11,634 |
|
|
$ |
|
10,569 |
|
|
$ |
|
1,065 |
|
|
|
10.1 |
% |
|
Wholesale gross (loss) profit per unit |
|
$ |
|
(68 |
) |
|
$ |
|
17 |
|
|
$ |
|
(85 |
) |
|
|
(500.0 |
)% |
Wholesale Units
Wholesale units sold increased 911, or 4.5%, from 20,197 in 2019 to 21,108 in 2020, primarily driven by the sale of retail quality vehicles through wholesale channels in order to reduce inventory risk during the early days of the COVID-19 pandemic as well as in the fourth quarter of 2020, partially offset by a decrease in trade-in vehicles due to a lower volume of ecommerce units sold during the early days of the pandemic.
Wholesale Revenue
Wholesale revenue increased $32.1 million, or 15.0%, from $213.5 million in 2019 to $245.6 million in 2020. The increase was primarily attributable to a higher ASP per wholesale unit, which increased from $10,569 in 2019 to $11,634 in 2020 and increased wholesale revenue by $22.5 million as well as the 911 increase in wholesale units sold, which increased wholesale revenue by $9.6 million.
Wholesale Gross (Loss) Profit
Wholesale gross profit decreased $1.8 million from gross profit of $0.4 million in 2019 to gross loss of $(1.4) million in 2020. The decrease was primarily attributable to a $85 decrease in wholesale gross profit per unit, which decreased primarily as the result of lower sales margin as a result of liquidating aged inventory during the initial phase of the COVID-19 pandemic as well as in the fourth quarter of 2020.
71
TDA
The following table presents our TDA segment results of operations for the periods indicated:
|
|
|
Year Ended December 31, |
|
|
|
|
|
|
|
|
|
|
|||||||
|
|
|
2020 |
|
|
2019 |
|
|
|
Change |
|
|
% Change |
|
||||||
|
|
|
(in thousands, except unit data and average days to sale) |
|
|
|
|
|
|
|
|
|
|
|||||||
|
TDA units sold |
|
|
|
7,385 |
|
|
|
|
13,018 |
|
|
|
|
(5,633 |
) |
|
|
(43.3 |
)% |
|
TDA revenue: |
|
|
|
|
|
|
|
|
|
|
|
|
|
|
|
|
|
|
|
|
Vehicle revenue |
|
$ |
|
187,991 |
|
|
$ |
|
375,912 |
|
|
$ |
|
(187,921 |
) |
|
|
(50.0 |
)% |
|
Product revenue |
|
|
|
7,304 |
|
|
|
|
12,592 |
|
|
|
|
(5,288 |
) |
|
|
(42.0 |
)% |
|
Other |
|
|
|
1,374 |
|
|
|
|
1,739 |
|
|
|
|
(365 |
) |
|
|
(21.0 |
)% |
|
Total TDA revenue |
|
$ |
|
196,669 |
|
|
$ |
|
390,243 |
|
|
$ |
|
(193,574 |
) |
|
|
(49.6 |
)% |
|
TDA gross profit: |
|
|
|
|
|
|
|
|
|
|
|
|
|
|
|
|
|
|
|
|
Vehicle gross profit |
|
$ |
|
4,373 |
|
|
$ |
|
12,069 |
|
|
$ |
|
(7,696 |
) |
|
|
(63.8 |
)% |
|
Product gross profit |
|
|
|
7,304 |
|
|
|
|
12,592 |
|
|
|
|
(5,288 |
) |
|
|
(42.0 |
)% |
|
Other gross profit |
|
|
|
439 |
|
|
|
|
731 |
|
|
|
|
(292 |
) |
|
|
(39.9 |
)% |
|
Total TDA gross profit |
|
$ |
|
12,116 |
|
|
$ |
|
25,392 |
|
|
$ |
|
(13,276 |
) |
|
|
(52.3 |
)% |
|
Average vehicle selling price per TDA unit |
|
$ |
|
25,456 |
|
|
$ |
|
28,876 |
|
|
$ |
|
(3,420 |
) |
|
|
(11.8 |
)% |
|
Gross profit per TDA unit: |
|
|
|
|
|
|
|
|
|
|
|
|
|
|
|
|
|
|
|
|
Vehicle gross profit per TDA unit |
|
$ |
|
592 |
|
|
$ |
|
927 |
|
|
$ |
|
(335 |
) |
|
|
(36.1 |
)% |
|
Product gross profit per TDA unit |
|
|
|
989 |
|
|
|
|
967 |
|
|
|
|
22 |
|
|
|
2.3 |
% |
|
Total gross profit per TDA unit |
|
$ |
|
1,581 |
|
|
$ |
|
1,894 |
|
|
$ |
|
(313 |
) |
|
|
(16.5 |
)% |
|
TDA average days to sale |
|
|
|
46 |
|
|
|
|
50 |
|
|
|
|
(4 |
) |
|
|
(8.0 |
)% |
TDA units
TDA units sold decreased 5,633, or 43.3%, from 13,018 in 2019 to 7,385 in 2020. The decrease was a result of a significant reduction in foot traffic due to the COVID-19 pandemic. Additionally, TDA units sold was impacted by reduced inventory at the TDA location as the ecommerce business continues to scale.
Vehicle Revenue
TDA vehicle revenue decreased $187.9 million, or 50.0%, from $375.9 million in 2019 to $188.0 million in 2020. The decrease in TDA vehicle revenue was primarily due to the 5,633 decrease in TDA units sold, which decreased TDA vehicle revenue by $162.7 million and a lower ASP per unit, which decreased from $28,876 in 2019 to $25,456 in 2020 and decreased revenue by $25.2 million.
Product Revenue
TDA product revenue decreased $5.3 million, or 42.0%, from $12.6 million in 2019 to $7.3 million in 2020. The decrease in TDA product revenue was primarily attributable to the 5,633 decrease in TDA units sold, which decreased TDA product revenue by $5.4 million, partially offset by the increase in product revenue per unit which increased revenue by $0.1 million.
Other Revenue
TDA other revenue decreased $0.3 million, or 21.0%, from $1.7 million in 2019 to $1.4 million in 2020.
Vehicle Gross Profit
TDA vehicle gross profit decreased $7.7 million, or 63.8%, from $12.1 million in 2019 to $4.4 million in 2020. The decrease in vehicle gross profit was primarily attributable to the 5,633 decrease in TDA units sold, which decreased TDA vehicle gross profit by $5.2 million and a $335 decrease in TDA vehicle gross profit per unit, which decreased vehicle gross profit by $2.5 million. Vehicle gross profit per unit decreased from $927 in 2019 to $592 in 2020, primarily due to lower sales margin.
72
Product Gross Profit
TDA product gross profit decreased $5.3 million, or 42.0% from $12.6 million in 2019 to $7.3 million in 2020. The decrease in TDA product gross profit was primarily attributable to the 5,633 decrease in TDA units sold, which decreased TDA product gross profit by $5.4 million, partially offset by the increase in product gross profit per unit which increased gross profit by $0.1 million.
Other gross profit
TDA other gross profit decreased $0.3 million, or 39.9%, from $0.7 million in 2019 to $0.4 million in 2020.
Selling, general and administrative expenses
|
|
|
|
Year Ended December 31, |
|
|
|
|
|
|
|
|
|
||||||
|
|
|
|
2020 |
|
|
|
2019 |
|
|
Change |
|
|
% Change |
|
||||
|
|
|
|
(in thousands) |
|
|
|
|
|
|
|
|
|
||||||
|
Compensation & benefits |
|
$ |
|
92,205 |
|
|
$ |
|
72,473 |
|
|
$ |
19,732 |
|
|
|
27.2 |
% |
|
Marketing expense |
|
|
|
62,393 |
|
|
|
|
49,866 |
|
|
|
12,527 |
|
|
|
25.1 |
% |
|
Outbound logistics |
|
|
|
30,262 |
|
|
|
|
13,950 |
|
|
|
16,312 |
|
|
|
116.9 |
% |
|
Occupancy and related costs |
|
|
|
10,784 |
|
|
|
|
11,335 |
|
|
|
(551 |
) |
|
|
(4.9 |
)% |
|
Professional fees |
|
|
|
10,560 |
|
|
|
|
11,560 |
|
|
|
(1,000 |
) |
|
|
(8.7 |
)% |
|
Other |
|
|
|
39,342 |
|
|
|
|
25,804 |
|
|
|
13,538 |
|
|
|
52.5 |
% |
|
Total selling, general & administrative expenses |
|
$ |
|
245,546 |
|
|
$ |
|
184,988 |
|
|
$ |
60,558 |
|
|
|
32.7 |
% |
Selling, general and administrative expenses increased $60.5 million, or 32.7%, from $185.0 million in 2019 to $245.5 million in 2020. The increase was primarily due to:
|
|
• |
a $19.7 million increase in compensation and benefits as a result of an increase in headcount as well as a $10.5 million increase in stock-based compensation from $2.8 million in 2019 to $13.3 million in 2020; |
|
|
• |
a $16.3 million increase in outbound logistics costs attributable to the growth in ecommerce units sold, which increased outbound logistics costs by $11.4 million, and increases in market rates of logistics providers, which increased outbound logistics costs by $4.9 million; |
|
|
• |
a $13.5 million increase in other selling, general, and administrative expenses primarily related to $3.9 million of additional insurance costs associated with being a publicly traded company and volume-based subscription fees as our business continues to scale; and |
|
|
• |
a $12.5 million increase in marketing expense as we expanded our national broad-reach advertising. |
These increases were partially offset by a $1.0 million decrease in professional fees due to a reduction in consulting expenses, primarily in the finance and reconditioning departments, as a result of completion of certain process improvement projects and hiring more employees. The decrease in professional fees was partially offset by $2.1 million in costs related to the CarStory acquisition.
We expect selling, general and administrative expenses to increase in the future as we scale our business and sell more ecommerce units. We will also continue to invest in and improve our customer experience and invest in expanding our proprietary logistics network including our last-mile delivery operations.
Depreciation and amortization
Depreciation and amortization expenses decreased $1.4 million, or 23.6%, from $6.0 million in 2019 to $4.6 million in 2020. The decrease was primarily due to reduced amortization expense as certain intangible assets were fully amortized.
Interest expense
Interest expense decreased $4.9 million, or 33.8%, from $14.6 million in 2019 to $9.7 million in 2020. The decrease was primarily attributable to lower interest rates for the 2020 Vehicle Floorplan Facility as a result of decreases in the1-Month LIBOR rate as well as the repayment of our term loan facility in December 2019.
73
Interest income
Interest income increased $0.3 million, or 5.2%, from $5.6 million in 2019 to $5.9 million in 2020. The increase in interest income was primarily driven by higher cash and cash equivalent balances as a result of the IPO and follow-on public offering, partially offset by lower interest rates.
Liquidity and Capital Resources
Our operations historically have been financed primarily from the sale of redeemable convertible preferred stock and borrowings under our Vehicle Floorplan Facility. On June 11, 2020, we completed our IPO in which we sold 24,437,500 shares of our common stock, which included 3,187,500 shares sold pursuant to the exercise by the underwriters of an over-allotment option to purchase additional shares, for proceeds of $504.0 million, net of the underwriting discount and before deducting offering expenses of $7.5 million. On September 15, 2020, we completed our follow-on public offering in which we sold 10,800,000 shares of common stock for proceeds of $569.5 million, net of the underwriting discount and before deducting offering expenses of $1.5 million. As of December 31, 2020, we had cash and cash equivalents of $1,056.2 million.
We anticipate that our existing cash and cash equivalents and the 2020 Vehicle Floorplan Facility will be sufficient to support our working capital and capital expenditure requirements for at least the next twelve months from the date of this Annual Report on Form 10-K. For the year ended December 31, 2020, we had negative cash flow from operations and generated a net loss. We have not been profitable since our inception in 2012. We expect to incur additional losses in the future.
We historically have funded vehicle inventory purchases primarily through our floorplan financing arrangements. Our cash flows from operations may differ substantially from our net loss due to non-cash charges or due to changes in balance sheet accounts. The timing of our cash flows from operating activities can also vary among periods due to the timing of payments made or received. Our future capital requirements will depend on many factors, including our rate of revenue growth, our efforts to reduce costs per unit, the expansion of our inventory and sales and marketing activities, investment in our reconditioning, logistics and customer experience operations, enhancements to our ecommerce platform, and increased hiring efforts. We may be required to seek additional equity or debt financing in the future to fund our operations or to fund our needs for capital expenditures. In the event that additional financing is required, we may not be able to raise it on terms acceptable to us, or at all. If we are unable to raise additional capital or generate cash flows necessary to expand our operations, our business, results of operations and financial condition could be adversely affected.
Vehicle Financing
As of December 31, 2020, we finance our inventory with a vehicle floorplan facility (the “2020 Vehicle Floorplan Facility”) with Ally Bank, which provides a committed credit line of up to $450.0 million.
The amount of credit available to us under the 2020 Vehicle Floorplan Facility is determined on a monthly basis based on a calculation that considers average outstanding borrowings and vehicle units paid off by us within the three immediately preceding months. Approximately $27.7 million was available under this facility as of December 31, 2020. In October 2020, we amended our 2020 Vehicle Floorplan Facility to extend the maturity date to September 30, 2022. The amendment requires us to pay an availability fee on the average unused capacity from the prior quarter if it was greater than 50% of the calculated floorplan allowance, as defined. We are subject to financial covenants that require us to maintain a certain level of equity in the vehicles that are financed, to maintain at least 7.5% of the credit line in cash and cash equivalents and to maintain 10% of the monthly daily floorplan principal balance outstanding on deposit with Ally Bank. We were required to pay an upfront commitment fee upon execution of the amendment.
Outstanding borrowings are due as the vehicles financed are sold, or in any event, on the maturity date. The 2020 Vehicle Floorplan Facility bears interest at a rate equal to the 1-Month LIBOR rate applicable in the immediately preceding month plus a spread of 425 basis points.
74
Cash Flows from Operating, Investing, and Financing Activities
The following table summarizes our cash flows for the years ended December 31, 2020, 2019, and 2018:
|
|
|
|
Year Ended December 31, |
|
|||||||||||
|
|
|
|
2020 |
|
|
|
2019 |
|
|
|
2018 |
|
|||
|
|
|
(in thousands) |
|
||||||||||||
|
Net cash used in operating activities |
|
$ |
|
(355,254 |
) |
|
$ |
|
(215,636 |
) |
|
$ |
|
(64,911 |
) |
|
Net cash (used in) provided by investing activities |
|
|
|
(11,329 |
) |
|
|
|
(3,528 |
) |
|
|
|
12,788 |
|
|
Net cash provided by financing activities |
|
|
|
1,237,035 |
|
|
|
|
275,242 |
|
|
|
|
132,375 |
|
|
Net increase in cash and cash equivalents and restricted cash |
|
|
|
870,452 |
|
|
|
|
56,078 |
|
|
|
|
80,252 |
|
|
Cash and cash equivalents and restricted cash at beginning of period |
|
|
|
219,587 |
|
|
|
|
163,509 |
|
|
|
|
83,257 |
|
|
Cash and cash equivalents and restricted cash at end of period |
|
$ |
|
1,090,039 |
|
|
$ |
|
219,587 |
|
|
$ |
|
163,509 |
|
Operating Activities
Net cash flows used in operating activities increased $139.7 million, or 64.8%, from $215.6 million in 2019 to $355.3 million in 2020. The increase is primarily attributable to an increase in working capital, primarily related to higher inventory levels as we continue to scale our business, resulting in an increase in the use of cash of $131.6 million, as well as $27.0 million in incremental net loss after reconciling adjustments in 2020 as compared to 2019.
We finance substantially all our inventories with the Vehicle Floorplan Facility. In accordance with U.S. GAAP relating to the statement of cash flows, we report all cash flows arising in connection with the Vehicle Floorplan Facility, as a financing activity in our statement of cash flows.
Investing Activities
Net cash flows used in investing activities increased $7.8 million, from $3.5 million in 2019 to $11.3 million in 2020, primarily as a result of an increase in capitalization of software development costs and the acquisition of trucks for our proprietary logistics network.
Financing Activities
Net cash flows provided by financing activities increased $961.8 million from $275.2 million in 2019 to $1,237.0 million in 2020. The increase was primarily related to $497.2 million of net proceeds received upon completion of the IPO net of cash paid for offering expenses, $568.0 million of net proceeds received upon completion of the follow-on public offering net of cash paid for offering expenses, a net increase in cash of $74.9 million related to our Vehicle Floorplan Facility, and a net increase in cash related to the $25.7 million repayment of our long-term debt in 2019. These increases were partially offset by a decrease in cash flows provided by financing activities related to the issuance of Series H preferred stock, net of issuance costs paid. Net cash flows provided by financing activities in 2020 included the issuance of $21.7 million of Series H preferred stock, as compared to the issuance of $227.5 million in 2019.
Contractual Obligations and Commitments
The following table summarizes our contractual obligations and commitments as of December 31, 2020:
|
|
|
|
Payments Due by Year |
|
|||||||||||||||||||||
|
|
|
|
Total |
|
|
|
Less than 1 year |
|
|
|
1-3 years |
|
|
|
3-5 years |
|
|
|
More than 5 years |
|
|||||
|
|
|
|
(in thousands) |
|
|||||||||||||||||||||
|
Vehicle Floorplan Facility (excluding interest) |
|
$ |
|
329,231 |
|
|
$ |
|
329,231 |
|
|
$ |
|
— |
|
|
$ |
|
— |
|
|
$ |
|
— |
|
|
Operating leases |
|
|
|
18,145 |
|
|
|
|
6,052 |
|
|
|
|
8,171 |
|
|
|
|
3,922 |
|
|
|
|
— |
|
|
Total |
|
$ |
|
347,376 |
|
|
$ |
|
335,283 |
|
|
$ |
|
8,171 |
|
|
$ |
|
3,922 |
|
|
$ |
|
— |
|
75
Off Balance Sheet Arrangements
We do not have any off balance sheet arrangements, as defined by applicable regulations of the SEC, that are reasonably likely to have a current or future material effect on our financial condition, results of operations, liquidity, capital expenditures or capital resources.
Critical Accounting Policies and Estimates
Our consolidated financial statements are prepared in accordance with GAAP. The preparation of consolidated financial statements requires us to make estimates, assumptions and judgments that affect the reported amounts of assets, liabilities, revenue, and expenses and related disclosures. On an ongoing basis, we evaluate our estimates, including, among others, those related to income taxes, the realizability of inventory, stock-based compensation, revenue-related reserves, as well as impairment of goodwill and long-lived assets. We base our estimates on historical experience, market conditions and on various other assumptions that are believed to be reasonable. Actual results may differ from these estimates.
Beginning in the first quarter of 2020, the COVID-19 pandemic negatively impacted, and may continue to negatively impact, the macroeconomic environment in the United States and globally, as well as our business, financial condition and results of operations. Due to the evolving and uncertain nature of COVID-19, it is reasonably possible that it could materially impact our estimates, particularly those noted above that require consideration of forecasted financial information, in the near to medium term. The ultimate impact will depend on numerous evolving factors that we may not be able to accurately predict, including the duration and extent of the pandemic, the impact of federal, state, local and foreign governmental actions, consumer behavior in response to the pandemic and other economic and operational conditions that we may face.
We believe that the accounting policies described below involve a significant degree of judgment and complexity. Accordingly, we believe these are the most critical to aid in fully understanding and evaluating our financial condition and results of operations. For further information, see “Note 2—Summary of Significant Accounting Policies” and “Note 3—Revenue Recognition” in the Notes to Consolidated Financial Statements included elsewhere in this Annual Report on Form 10-K.
Revenue Recognition
We adopted ASU 2014-09, Revenue from Contracts with Customers (“Topic 606”), as of January 1, 2018 utilizing the modified retrospective approach applied only to contracts not completed as of the date of adoption.
We recognized a net decrease to accumulated deficit of approximately $1.7 million as of January 1, 2018 due to the cumulative effect of adopting Topic 606.
Revenue consists of retail vehicle sales through our ecommerce platform and TDA retail location, wholesale vehicle sales and other revenues. Revenue also includes delivery charges. Our product revenue consists of fees earned on customer vehicle financing from third-party lenders and fees earned on sales of other value-added products, such as vehicle service contracts, GAP protection and tire and wheel coverage.
We recognize revenue upon transfer of control of goods or services to customers, in an amount that reflects the consideration to which we expect to be entitled in exchange for those goods or services. We may collect sales taxes and other taxes from customers on behalf of governmental authorities at the time of sale as required. These taxes are accounted for on a net basis and are not included in revenues or cost of sales.
Our revenue is disaggregated within the consolidated statement of operations and is generated from customers throughout the United States.
Retail Vehicle Revenue
We sell vehicles to our retail customers through our Ecommerce segment and our TDA segment. The transaction price for vehicles is a fixed amount as set forth within the customer contract at the time of sale. Customers frequently trade-in their existing vehicle to apply the amount received for such vehicle towards the transaction price of a purchased vehicle. Trade-in vehicles represent noncash consideration, which we measure at an agreed upon price based on fair value, which is based on external and internal market data for each specific vehicle. We generally satisfy our performance obligation and recognize revenue for vehicle sales at a point in time when the vehicles are delivered to the customers for ecommerce sales or picked up by the customer for TDA sales. The revenue recognized by us includes the agreed upon
76
transaction price, including any delivery charges stated within the customer contract. Revenue excludes any sales taxes, title and registration fees, and other government fees that are collected from customers.
We receive payment for vehicle sales directly from the customer at the time of sale or from third-party financial institutions within a short period of time following the sale if the customer obtains financing. Payments received prior to delivery or pick-up of used vehicles are recorded as “Deferred revenue” within the consolidated balance sheet.
We offer a return program for used vehicle sales and establish a provision for estimated returns based on historical information and current trends. The reserve for estimated returns is presented gross on the consolidated balance sheet, with an asset recorded in “Prepaid expenses and other current assets” and a refund liability recorded in “Other current liabilities.”
Wholesale Vehicle Revenue
We sell vehicles that do not meet our Vroom retail sales criteria primarily through wholesale channels. Vehicles sold through wholesale channels are acquired from customers who trade-in their vehicles when making a purchase from us and also from customers who sell their vehicles to us in direct-buy transactions. The transaction price for a wholesale vehicle is a fixed amount. We satisfy our performance obligation and recognize revenue for wholesale vehicle sales when the vehicle is sold. The transaction price is typically due and collected within a short period of time following the vehicle sales.
Product Revenue
Our product revenue consists of fees earned on customer vehicle financing from third-party lenders and fees earned on sales of other value-added products such as vehicle service contracts, GAP protection and tire and wheel coverage. We sell these products pursuant to arrangements with the third parties that provide these products and are responsible for their fulfilment. We concluded that we are an agent for these transactions because we do not control the products before they are transferred to the customer. As an agent, our performance obligation is to arrange for the third party to provide the products. We recognize product revenues on a net basis when the customer enters into an arrangement for the products, which is typically at the time of a used vehicle sale.
Customers may enter into retail installment sales contracts to finance the purchase of used vehicles. We sell these contracts on a non-recourse basis to various financial institutions. We receive fees from the financial institution based on the difference between the interest rate charged to the customer that purchased the vehicle and the interest rate set by the financial institution. These fees are recognized upon sale and assignment of the installment sales contract to the financial institution.
A portion of the fees earned on these products is subject to chargebacks in the event of early termination, default, or prepayment of the contracts by end-customers. Our exposure for these events is limited to fees that we receive. An estimated refund liability for chargebacks against the revenue recognized from sales of these products is recorded in the period in which the related revenue is recognized and is based primarily on our historical chargeback experience. We update our estimates at each reporting date. As of December 31, 2020 and 2019, our reserve for chargebacks was approximately $3.8 million and $3.3 million, respectively.
We also are contractually entitled to receive profit-sharing revenues based on the performance of the protection policies once a required claims period has passed. We recognize profit-sharing revenue to the extent it is probable that it will not result in a significant revenue reversal. We estimate the revenue based on historical claims and cancellation data from our customers, as well as other qualitative assumptions. We reassess the estimate at each reporting period with any changes reflected as an adjustment to revenues in the period identified. As of December 31, 2020 and 2019, we had recognized approximately $11.5 million and $6.9 million, respectively, related to cumulative profit-sharing payments to which we expect to be entitled.
Other Revenue
Other revenue primarily consists of labor and parts revenue earned by us for vehicle repair services at TDA.
Inventory
Inventory consists of vehicles and parts and accessories and is stated at the lower of cost or net realizable value. Inventory cost is determined by specific identification and includes acquisition cost, direct and indirect reconditioning costs, and in-bound transportation costs. Net realizable value is the estimated selling price less costs to complete, dispose and
77
transport the vehicles. We recognize any necessary adjustments to reflect inventory at the lower of cost or net realizable value in cost of sales in the consolidated statements of operations.
Shipping and Handling
Our logistics costs relate to transporting vehicle inventory and are primarily third-party transportation fees. The portion of these costs related to inbound transportation from the point of acquisition to the relevant reconditioning facility is included within inventory and reclassified into cost of sales when the related vehicle is sold. Logistics costs related to delivering vehicles sold to customers are accounted for as costs to fulfil contracts with customers and are included in “Selling, general and administrative expenses” in the consolidated statement of operations and were approximately $30.3 million, $14.0 million, and $6.4 million for the years ended December 31, 2020, 2019, and 2018, respectively.
Leases
We adopted Topic 842 as of January 1, 2020 using the modified retrospective approach with any cumulative-effect adjustment to opening retained earnings (accumulated deficit) with no restatement of comparative periods. Upon adoption, we recognized $18.4 million of operating lease liabilities and $17.4 million of operating lease right-of-use assets.
The adoption of Topic 842 did not result in a cumulative effect adjustment to accumulated deficit. We elected to utilize the package of practical expedients for transition which permitted us to not reassess our prior conclusions regarding whether a contract is or contains a lease, lease classification and initial direct costs.
We did not elect the hindsight practical expedient to determine lease terms. We elected the short-term lease recognition exemption for all leases that qualify and the practical expedient to not separate lease and non-lease components of leases.
Goodwill
Goodwill represents the excess of the consideration transferred over the fair value of the identifiable assets acquired and liabilities assumed in business combinations. Goodwill is tested for impairment annually as of October 1, or whenever events or changes in circumstances indicate that an impairment may exist.
We have three reporting units: Ecommerce, Wholesale and TDA. In performing our annual goodwill impairment test, we first review qualitative factors to determine whether it is more likely than not that the fair value of a reporting unit is less than its carrying amount. If, after assessing qualitative factors, we determine that it is not more likely than not that the fair value of a reporting unit is less than its carrying amount, then performing the quantitative test is unnecessary and our goodwill is not considered to be impaired. However, if based on the qualitative assessment we conclude that it is more likely than not that the fair value of the reporting unit is less than its carrying amount, or if we elect to bypass the optional qualitative assessment as provided for under GAAP, we proceed with performing the quantitative impairment test.
No goodwill impairment was determined to exist for the years ended December 31, 2020, 2019, and 2018.
In connection with its annual goodwill impairment test as of October 1, 2020, the Company performed impairment assessments for each of its reporting units. The results of the assessments indicated that it was not more likely than not that the fair value of the reporting units were less than the carrying values.
The quantitative goodwill impairment test requires a determination of whether the estimated fair value of a reporting unit is less than its carrying value. We estimate the fair value of our reporting units using an income valuation approach. The income valuation approach is applied using the discounted cash flow method which requires (1) estimating future cash flows for a discrete projection period (2) estimating the terminal value, which reflects the remaining value that the reporting unit is expected to generate beyond the projection period and (3) discounting those amounts to present value at a discount rate which is based on a weighted average cost of capital that considers the relative risk of the cash flows. The income valuation approach requires the use of significant estimates and assumptions, which include revenue growth rates, future gross profit margins and operating expenses used to calculate projected future cash flows, determination of the weighted average cost of capital, and future economic and market conditions. The terminal value is based on an exit multiple which requires significant assumptions regarding the selection of appropriate multiples that consider relevant market trading data. We base our estimates and assumptions on our knowledge of the automotive and ecommerce industries, our recent performance, our expectations of future performance and other assumptions we believe to be reasonable. Actual future results may differ from those estimates. We also make certain judgments and assumptions in allocating shared assets and liabilities to determine the carrying values for each of our reporting units.
78
Income Taxes
We account for income taxes under the asset and liability method. We recognize deferred tax assets and liabilities for the future tax consequences attributable to differences between the financial statement carrying amounts of existing assets and liabilities and their respective tax basis, as well as for operating loss and tax credit carry forwards. We measure deferred tax assets and liabilities using enacted tax rates expected to apply to taxable income in the years in which we expect to recover or settle those temporary differences. We recognize the effect of a change in tax rates on deferred tax assets and liabilities in the results of operations in the period that includes the enactment date. We reduce the measurement of a deferred tax asset, if necessary, by a valuation allowance if it is “more-likely-than-not” that we will not realize some or all of the deferred tax asset. We maintained a full valuation allowance against net deferred tax assets because we determined that is it more likely than not that these assets will not be fully realized based on a current evaluation of expected future taxable income and we are in a cumulative loss position.
We account for uncertain tax positions by recognizing the financial statement effects of a tax position only when, based upon technical merits, it is “more likely than not” that the position will be sustained upon examination. Potential interest and penalties associated with unrecognized tax positions are recognized in income tax expense.
Stock-Based Compensation
We recognize the cost of employee services received in exchange for stock awards based on the fair value of those awards at the date of grant over the requisite service period. We use the Black-Scholes-Merton option-pricing model, which we refer to as Black Scholes option-pricing model, to determine the fair value of our stock-based awards. Estimating the fair value of stock-based awards requires the input of subjective assumptions, including the estimated fair value of our common stock, the expected life of the options, stock price volatility, the risk-free interest rate and expected dividends. The assumptions used in the Black-Scholes option-pricing model represent our best estimates and involve a number of variables, uncertainties and assumptions and the application of management’s judgment, as they are inherently subjective.
Recently Issued and Adopted Accounting Pronouncements
See “Note 2—Summary of Significant Accounting Policies” in Part II, Item 8 of this Annual Report on Form 10-K for a discussion about new accounting pronouncements adopted and not yet adopted as of the date of this report.
Item 7A. Quantitative and Qualitative Disclosure About Market Risk
Market risk is the risk of economic losses due to adverse changes in financial market prices and rates. Our primary market risk has been interest rate risk. We do not have material exposure to commodity risk.
Interest Rate Risk
As of December 31, 2020, we had an outstanding balance under the 2020 Vehicle Floorplan Facility of $329.2 million. The 2020 Vehicle Floorplan Facility bears interest at a rate equal to the 1-Month LIBOR rate applicable in the immediately preceding month, plus a spread of 425 basis points. A hypothetical 10% change in interest rates during the year ended December 31, 2020 would result in a change to interest expense of $0.9 million.
Inflation Risk
Inflationary factors such as increases in overhead costs may adversely affect our operating results. Although we do not believe that inflation has had a material impact on our financial position or results of operations to date, a high rate of inflation in the future may have an adverse effect on our ability to maintain current levels of operating expenses as a percentage of revenue, if the selling prices of our products do not increase with these increased costs.
79
INDEX TO CONSOLIDATED FINANCIAL STATEMENTS
80
Report of Independent Registered Public Accounting Firm
To the Board of Directors and Stockholders of Vroom, Inc.
Opinion on the Financial Statements
We have audited the accompanying consolidated balance sheets of Vroom, Inc. and its subsidiaries (the “Company”) as of December 31, 2020 and 2019, and the related consolidated statements of operations, of changes in redeemable convertible preferred stock and stockholders' equity (deficit) and of cash flows for each of the three years in the period ended December 31, 2020, including the related notes (collectively referred to as the “consolidated financial statements”). In our opinion, the consolidated financial statements present fairly, in all material respects, the financial position of the Company as of December 31, 2020 and 2019, and the results of its operations and its cash flows for each of the three years in the period ended December 31, 2020 in conformity with accounting principles generally accepted in the United States of America.
Basis for Opinion
These consolidated financial statements are the responsibility of the Company’s management. Our responsibility is to express an opinion on the Company’s consolidated financial statements based on our audits. We are a public accounting firm registered with the Public Company Accounting Oversight Board (United States) (PCAOB) and are required to be independent with respect to the Company in accordance with the U.S. federal securities laws and the applicable rules and regulations of the Securities and Exchange Commission and the PCAOB.
We conducted our audits of these consolidated financial statements in accordance with the standards of the PCAOB. Those standards require that we plan and perform the audits to obtain reasonable assurance about whether the consolidated financial statements are free of material misstatement, whether due to error or fraud.
Our audits included performing procedures to assess the risks of material misstatement of the consolidated financial statements, whether due to error or fraud, and performing procedures that respond to those risks. Such procedures included examining, on a test basis, evidence regarding the amounts and disclosures in the consolidated financial statements. Our audits also included evaluating the accounting principles used and significant estimates made by management, as well as evaluating the overall presentation of the consolidated financial statements. We believe that our audits provide a reasonable basis for our opinion.
Critical Audit Matters
The critical audit matter communicated below is a matter arising from the current period audit of the consolidated financial statements that was communicated or required to be communicated to the audit committee and that (i) relates to accounts or disclosures that are material to the consolidated financial statements and (ii) involved our especially challenging, subjective, or complex judgments. The communication of critical audit matters does not alter in any way our opinion on the consolidated financial statements, taken as a whole, and we are not, by communicating the critical audit matter below, providing a separate opinion on the critical audit matter or on the accounts or disclosures to which it relates.
Revenue Recognition
As described in Notes 2 and 3 to the consolidated financial statements, revenue consists of retail used vehicle sales, wholesale used vehicle sales, fees earned on sales of value-added products to customers in connection with vehicle sales, and other revenues. The Company recognizes revenue upon the transfer of control of goods or services to customers, in an amount that reflects the consideration to which the Company expects to be entitled in exchange for those goods or services. The Company’s revenue was $1,357.7 million for the year ended December 31, 2020.
The principal considerations for our determination that performing procedures relating to revenue recognition is a critical audit matter are a high degree of auditor effort in performing procedures and evaluating audit evidence related to revenue recognition after consideration of the material weaknesses identified by the Company in its internal control environment.
81
Addressing the matter involved performing procedures and evaluating audit evidence in connection with forming our overall opinion on the consolidated financial statements. These procedures included, among others, (i) evaluating the recognition of revenue for a sample of revenue transactions by obtaining and inspecting source documents, including invoices, sales contracts, shipping and delivery documents and cash receipts and (ii) testing the cutoff of revenue transactions. These procedures also included evaluating the nature and extent of audit procedures performed and evidence obtained.
/s/ PricewaterhouseCoopers LLP
We have served as the Company’s auditor since 2016.
82
VROOM, INC.
(in thousands, except share and per share amounts)
|
|
|
As of |
|
|||||
|
|
|
December 31, |
|
|||||
|
|
|
2020 |
|
|
2019 |
|
||
|
ASSETS |
|
|
|
|
|
|
|
|
|
Current Assets: |
|
|
|
|
|
|
|
|
|
Cash and cash equivalents |
|
$ |
1,056,213 |
|
|
$ |
217,734 |
|
|
Restricted cash |
|
|
33,826 |
|
|
|
1,853 |
|
|
Accounts receivable, net of allowance of $2,803 and $789, respectively |
|
|
60,576 |
|
|
|
30,848 |
|
|
Inventory |
|
|
423,647 |
|
|
|
205,746 |
|
|
Prepaid expenses and other current assets |
|
|
23,617 |
|
|
|
9,149 |
|
|
Total current assets |
|
|
1,597,879 |
|
|
|
465,330 |
|
|
Property and equipment, net |
|
|
15,092 |
|
|
|
7,828 |
|
|
Goodwill |
|
|
78,172 |
|
|
|
78,172 |
|
|
Operating lease right-of-use assets |
|
|
17,137 |
|
|
|
— |
|
|
Other assets |
|
|
15,776 |
|
|
|
12,057 |
|
|
Total assets |
|
$ |
1,724,056 |
|
|
$ |
563,387 |
|
|
LIABILITIES, REDEEMABLE CONVERTIBLE PREFERRED STOCK AND STOCKHOLDERS’ EQUITY (DEFICIT) |
|
|
|
|
|
|
|
|
|
Current Liabilities: |
|
|
|
|
|
|
|
|
|
Accounts payable |
|
$ |
32,925 |
|
|
$ |
18,987 |
|
|
Accrued expenses |
|
|
59,405 |
|
|
|
38,491 |
|
|
Vehicle floorplan |
|
|
329,231 |
|
|
|
173,461 |
|
|
Deferred revenue |
|
|
24,822 |
|
|
|
17,323 |
|
|
Operating lease liabilities, current |
|
|
6,052 |
|
|
|
— |
|
|
Other current liabilities |
|
|
30,275 |
|
|
|
11,572 |
|
|
Total current liabilities |
|
|
482,710 |
|
|
|
259,834 |
|
|
Operating lease liabilities, excluding current portion |
|
|
12,093 |
|
|
|
— |
|
|
Other long-term liabilities |
|
|
2,151 |
|
|
|
3,073 |
|
|
Total liabilities |
|
|
496,954 |
|
|
|
262,907 |
|
|
Commitments and contingencies (Note 9) |
|
|
|
|
|
|
|
|
|
Redeemable convertible preferred stock, $0.001 par value; 10,000,000 and 86,123,364 shares authorized as of December 31, 2020 and 2019, respectively; zero and 83,568,628 shares issued and outstanding as of December 31, 2020 and 2019, respectively |
|
|
— |
|
|
|
874,332 |
|
|
Stockholders’ equity (deficit): |
|
|
|
|
|
|
|
|
|
Common stock, $0.001 par value; 500,000,000 and 113,443,854 shares authorized as of December 31, 2020 and 2019, respectively; 134,043,969 and 8,650,922 shares issued and outstanding as of December 31, 2020 and 2019, respectively |
|
|
132 |
|
|
|
8 |
|
|
Additional paid-in-capital |
|
|
2,004,841 |
|
|
|
— |
|
|
Accumulated deficit |
|
|
(777,871 |
) |
|
|
(573,860 |
) |
|
Total stockholders’ equity (deficit) |
|
|
1,227,102 |
|
|
|
(573,852 |
) |
|
Total liabilities, redeemable convertible preferred stock and stockholders’ equity (deficit) |
|
$ |
1,724,056 |
|
|
$ |
563,387 |
|
See accompanying notes to these consolidated financial statements.
83
VROOM, INC.
CONSOLIDATED STATEMENTS OF OPERATIONS
(in thousands, except share and per share amounts)
|
|
|
Year Ended December 31, |
|
|||||||||
|
|
|
2020 |
|
|
2019 |
|
|
2018 |
|
|||
|
Revenue: |
|
|
|
|
|
|
|
|
|
|
|
|
|
Retail vehicle, net |
|
$ |
1,072,551 |
|
|
$ |
952,910 |
|
|
$ |
656,928 |
|
|
Wholesale vehicle |
|
|
245,580 |
|
|
|
213,464 |
|
|
|
174,514 |
|
|
Product, net |
|
|
38,195 |
|
|
|
23,708 |
|
|
|
19,653 |
|
|
Other |
|
|
1,374 |
|
|
|
1,739 |
|
|
|
4,334 |
|
|
Total revenue |
|
|
1,357,700 |
|
|
|
1,191,821 |
|
|
|
855,429 |
|
|
Cost of sales |
|
|
1,286,155 |
|
|
|
1,133,962 |
|
|
|
794,622 |
|
|
Total gross profit |
|
|
71,545 |
|
|
|
57,859 |
|
|
|
60,807 |
|
|
Selling, general and administrative expenses |
|
|
245,546 |
|
|
|
184,988 |
|
|
|
133,842 |
|
|
Depreciation and amortization |
|
|
4,598 |
|
|
|
6,019 |
|
|
|
6,857 |
|
|
Loss from operations |
|
|
(178,599 |
) |
|
|
(133,148 |
) |
|
|
(79,892 |
) |
|
Interest expense |
|
|
9,656 |
|
|
|
14,596 |
|
|
|
8,513 |
|
|
Interest income |
|
|
(5,896 |
) |
|
|
(5,607 |
) |
|
|
(3,135 |
) |
|
Revaluation of preferred stock warrant |
|
|
20,470 |
|
|
|
769 |
|
|
|
174 |
|
|
Other income, net |
|
|
(114 |
) |
|
|
(96 |
) |
|
|
(495 |
) |
|
Loss before provision for income taxes |
|
|
(202,715 |
) |
|
|
(142,810 |
) |
|
|
(84,949 |
) |
|
Provision for income taxes |
|
|
84 |
|
|
|
168 |
|
|
|
229 |
|
|
Net loss |
|
$ |
(202,799 |
) |
|
$ |
(142,978 |
) |
|
$ |
(85,178 |
) |
|
Accretion of redeemable convertible preferred stock |
|
|
— |
|
|
|
(132,750 |
) |
|
|
(13,036 |
) |
|
Net loss attributable to common stockholders |
|
$ |
(202,799 |
) |
|
$ |
(275,728 |
) |
|
$ |
(98,214 |
) |
|
Net loss per share attributable to common stockholders, basic and diluted |
|
$ |
(2.76 |
) |
|
$ |
(32.04 |
) |
|
$ |
(11.50 |
) |
|
Weighted-average number of shares outstanding used to compute net loss per share attributable to common stockholders, basic and diluted |
|
|
73,345,569 |
|
|
|
8,605,962 |
|
|
|
8,540,778 |
|
See accompanying notes to these consolidated financial statements.
84
VROOM, INC.
CONSOLIDATED STATEMENTS OF CHANGES IN REDEEMABLE CONVERTIBLE
PREFERRED STOCK AND STOCKHOLDERS’ EQUITY (DEFICIT)
(in thousands, except share amounts)
|
|
|
Redeemable Convertible Preferred Stock |
|
|
|
Common Stock |
|
|
Additional Paid-in |
|
|
Accumulated |
|
|
Total Stockholders’ |
|
|||||||||||||
|
|
|
Shares |
|
|
Amount |
|
|
|
Shares |
|
|
Amount |
|
|
Capital |
|
|
Deficit |
|
|
Equity (Deficit) |
|
|||||||
|
Balance at January 1, 2018 |
|
|
50,545,260 |
|
|
$ |
360,165 |
|
|
|
|
8,522,110 |
|
|
$ |
8 |
|
|
$ |
— |
|
|
$ |
(201,507 |
) |
|
$ |
(201,499 |
) |
|
Cumulative effect of accounting change - revenue recognition |
|
|
— |
|
|
$ |
— |
|
|
|
|
— |
|
|
$ |
— |
|
|
$ |
— |
|
|
$ |
1,658 |
|
|
$ |
1,658 |
|
|
Stock-based compensation |
|
|
— |
|
|
|
— |
|
|
|
|
— |
|
|
|
— |
|
|
|
1,158 |
|
|
|
— |
|
|
|
1,158 |
|
|
Exercise of stock options |
|
|
— |
|
|
|
— |
|
|
|
|
12,502 |
|
|
|
— |
|
|
|
31 |
|
|
|
— |
|
|
|
31 |
|
|
Vesting of restricted stock awards |
|
|
— |
|
|
|
— |
|
|
|
|
36,774 |
|
|
|
— |
|
|
|
— |
|
|
|
— |
|
|
|
— |
|
|
Issuance of Series G redeemable convertible preferred stock, net of issuance costs |
|
|
16,280,040 |
|
|
|
145,899 |
|
|
|
|
— |
|
|
|
— |
|
|
|
— |
|
|
|
— |
|
|
|
— |
|
|
Accretion of redeemable convertible preferred stock |
|
|
— |
|
|
|
13,036 |
|
|
|
|
— |
|
|
|
— |
|
|
|
(1,189 |
) |
|
|
(11,847 |
) |
|
|
(13,036 |
) |
|
Net loss |
|
|
— |
|
|
|
— |
|
|
|
|
— |
|
|
|
— |
|
|
|
— |
|
|
|
(85,178 |
) |
|
|
(85,178 |
) |
|
Balance at December 31, 2018 |
|
|
66,825,300 |
|
|
$ |
519,100 |
|
|
|
|
8,571,386 |
|
|
$ |
8 |
|
|
$ |
— |
|
|
$ |
(296,874 |
) |
|
$ |
(296,866 |
) |
|
Stock-based compensation |
|
|
— |
|
|
$ |
— |
|
|
|
|
— |
|
|
$ |
— |
|
|
$ |
2,756 |
|
|
$ |
— |
|
|
$ |
2,756 |
|
|
Exercise of stock options |
|
|
— |
|
|
|
— |
|
|
|
|
135,950 |
|
|
|
— |
|
|
|
466 |
|
|
|
— |
|
|
|
466 |
|
|
Vesting of restricted stock awards |
|
|
— |
|
|
|
— |
|
|
|
|
623,832 |
|
|
|
— |
|
|
|
1,344 |
|
|
|
— |
|
|
|
1,344 |
|
|
Repurchase of common stock |
|
|
— |
|
|
|
— |
|
|
|
|
(680,246 |
) |
|
|
— |
|
|
|
(4,566 |
) |
|
|
(1,258 |
) |
|
|
(5,824 |
) |
|
Issuance of Series H redeemable convertible preferred stock, net of issuance costs |
|
|
16,743,328 |
|
|
|
222,482 |
|
|
|
|
— |
|
|
|
— |
|
|
|
— |
|
|
|
— |
|
|
|
— |
|
|
Accretion of redeemable convertible preferred stock |
|
|
— |
|
|
|
132,750 |
|
|
|
|
— |
|
|
|
— |
|
|
|
— |
|
|
|
(132,750 |
) |
|
|
(132,750 |
) |
|
Net loss |
|
|
— |
|
|
|
— |
|
|
|
|
— |
|
|
|
— |
|
|
|
— |
|
|
|
(142,978 |
) |
|
|
(142,978 |
) |
|
Balance at December 31, 2019 |
|
|
83,568,628 |
|
|
$ |
874,332 |
|
|
|
|
8,650,922 |
|
|
$ |
8 |
|
|
$ |
— |
|
|
$ |
(573,860 |
) |
|
$ |
(573,852 |
) |
|
Issuance of common stock |
|
|
— |
|
|
$ |
— |
|
|
|
|
183,870 |
|
|
$ |
— |
|
|
$ |
2,127 |
|
|
$ |
— |
|
|
$ |
2,127 |
|
|
Issuance of Series H redeemable convertible preferred stock, net of issuance costs |
|
|
1,964,766 |
|
|
|
26,714 |
|
|
|
|
— |
|
|
|
— |
|
|
|
— |
|
|
|
— |
|
|
|
— |
|
|
Conversion of redeemable convertible preferred stock to common stock |
|
|
(85,533,394 |
) |
|
|
(901,046 |
) |
|
|
|
85,533,394 |
|
|
|
86 |
|
|
|
900,960 |
|
|
|
— |
|
|
|
901,046 |
|
|
Conversion of redeemable convertible preferred stock warrant to common stock warrant |
|
|
— |
|
|
|
— |
|
|
|
|
— |
|
|
|
— |
|
|
|
21,873 |
|
|
|
— |
|
|
|
21,873 |
|
|
Issuance of common stock in IPO, net of offering costs |
|
|
— |
|
|
|
— |
|
|
|
|
24,437,500 |
|
|
|
24 |
|
|
|
496,486 |
|
|
|
— |
|
|
|
496,510 |
|
|
Issuance of common stock in follow-on public offering, net of offering costs |
|
|
— |
|
|
|
— |
|
|
|
|
10,800,000 |
|
|
|
11 |
|
|
|
567,941 |
|
|
|
— |
|
|
|
567,952 |
|
|
Repurchase of common stock |
|
|
— |
|
|
|
— |
|
|
|
|
(200,000 |
) |
|
|
— |
|
|
|
(606 |
) |
|
|
(1,212 |
) |
|
|
(1,818 |
) |
|
Vesting of restricted stock awards |
|
|
|
|
|
|
|
|
|
|
|
3,249,346 |
|
|
|
2 |
|
|
|
3,381 |
|
|
|
— |
|
|
|
3,383 |
|
|
Stock-based compensation |
|
|
— |
|
|
|
— |
|
|
|
|
— |
|
|
|
— |
|
|
|
13,254 |
|
|
|
— |
|
|
|
13,254 |
|
|
Exercise of stock options |
|
|
— |
|
|
|
— |
|
|
|
|
598,406 |
|
|
|
1 |
|
|
|
2,340 |
|
|
|
— |
|
|
|
2,341 |
|
|
Exercise of common stock warrants |
|
|
— |
|
|
|
— |
|
|
|
|
636,112 |
|
|
|
— |
|
|
|
— |
|
|
|
— |
|
|
|
— |
|
|
Vesting of restricted stock units |
|
|
— |
|
|
|
— |
|
|
|
|
237,334 |
|
|
|
— |
|
|
|
— |
|
|
|
— |
|
|
|
— |
|
|
Common stock shares withheld to satisfy employee tax withholding obligations |
|
|
— |
|
|
|
— |
|
|
|
|
(82,915 |
) |
|
|
— |
|
|
|
(2,915 |
) |
|
|
— |
|
|
|
(2,915 |
) |
|
Net loss |
|
|
— |
|
|
|
— |
|
|
|
|
— |
|
|
|
— |
|
|
|
— |
|
|
|
(202,799 |
) |
|
|
(202,799 |
) |
|
Balance at December 31, 2020 |
|
|
— |
|
|
$ |
— |
|
|
|
|
134,043,969 |
|
|
$ |
132 |
|
|
$ |
2,004,841 |
|
|
$ |
(777,871 |
) |
|
$ |
1,227,102 |
|
See accompanying notes to these consolidated financial statements.
85
VROOM, INC.
CONSOLIDATED STATEMENTS OF CASH FLOWS
(in thousands)
|
|
|
Year Ended December 31, |
|
|||||||||
|
|
|
2020 |
|
|
2019 |
|
|
2018 |
|
|||
|
Operating activities |
|
|
|
|
|
|
|
|
|
|
|
|
|
Net loss |
|
$ |
(202,799 |
) |
|
$ |
(142,978 |
) |
|
$ |
(85,178 |
) |
|
Adjustments to reconcile net loss to net cash used in operating activities: |
|
|
|
|
|
|
|
|
|
|
|
|
|
Depreciation and amortization |
|
|
4,654 |
|
|
|
6,157 |
|
|
|
6,932 |
|
|
Amortization of debt issuance costs |
|
|
938 |
|
|
|
357 |
|
|
|
279 |
|
|
Loss on extinguishment of debt |
|
|
— |
|
|
|
1,031 |
|
|
|
— |
|
|
Stock-based compensation expense |
|
|
13,254 |
|
|
|
2,756 |
|
|
|
1,158 |
|
|
Loss on disposal of property and equipment |
|
|
46 |
|
|
|
789 |
|
|
|
3,198 |
|
|
Provision for inventory obsolescence |
|
|
6,588 |
|
|
|
2,682 |
|
|
|
(1,069 |
) |
|
Revaluation of preferred stock warrant |
|
|
20,470 |
|
|
|
769 |
|
|
|
174 |
|
|
Other |
|
|
2,329 |
|
|
|
789 |
|
|
|
— |
|
|
Changes in operating assets and liabilities: |
|
|
|
|
|
|
|
|
|
|
|
|
|
Accounts receivable |
|
|
(32,068 |
) |
|
|
(18,430 |
) |
|
|
9,049 |
|
|
Inventory |
|
|
(224,489 |
) |
|
|
(92,877 |
) |
|
|
11,902 |
|
|
Prepaid expenses and other current assets |
|
|
(9,117 |
) |
|
|
(3,935 |
) |
|
|
(2,916 |
) |
|
Other assets |
|
|
(4,556 |
) |
|
|
(3,487 |
) |
|
|
(3,105 |
) |
|
Accounts payable |
|
|
14,066 |
|
|
|
4,035 |
|
|
|
(6,527 |
) |
|
Accrued expenses |
|
|
28,431 |
|
|
|
10,131 |
|
|
|
6,291 |
|
|
Deferred revenue |
|
|
7,499 |
|
|
|
10,902 |
|
|
|
860 |
|
|
Other liabilities |
|
|
19,500 |
|
|
|
5,673 |
|
|
|
(5,959 |
) |
|
Net cash used in operating activities |
|
|
(355,254 |
) |
|
|
(215,636 |
) |
|
|
(64,911 |
) |
|
Investing activities |
|
|
|
|
|
|
|
|
|
|
|
|
|
Purchase of property and equipment |
|
|
(11,329 |
) |
|
|
(3,528 |
) |
|
|
(2,062 |
) |
|
Proceeds from the sale of property and equipment |
|
|
— |
|
|
|
— |
|
|
|
14,850 |
|
|
Net cash (used in) provided by investing activities |
|
|
(11,329 |
) |
|
|
(3,528 |
) |
|
|
12,788 |
|
|
Financing activities |
|
|
|
|
|
|
|
|
|
|
|
|
|
Repayments of long-term debt |
|
|
— |
|
|
|
(25,000 |
) |
|
|
(5,506 |
) |
|
Payments of debt extinguishment costs |
|
|
— |
|
|
|
(685 |
) |
|
|
— |
|
|
Proceeds from vehicle floorplan |
|
|
1,242,736 |
|
|
|
992,179 |
|
|
|
648,309 |
|
|
Repayments of vehicle floorplan |
|
|
(1,086,966 |
) |
|
|
(914,200 |
) |
|
|
(656,194 |
) |
|
Payment of vehicle floorplan upfront commitment fees |
|
|
(2,906 |
) |
|
|
— |
|
|
|
— |
|
|
Proceeds from the issuance of redeemable convertible preferred stock, net |
|
|
21,694 |
|
|
|
227,502 |
|
|
|
145,899 |
|
|
Repurchase of common stock |
|
|
(1,818 |
) |
|
|
(5,824 |
) |
|
|
— |
|
|
Common stock shares withheld to satisfy employee tax withholding obligations |
|
|
(2,915 |
) |
|
|
— |
|
|
|
— |
|
|
Proceeds from the issuance of common stock in connection with IPO, net of underwriting discount |
|
|
504,024 |
|
|
|
— |
|
|
|
— |
|
|
Payments of costs related to IPO |
|
|
(6,791 |
) |
|
|
(723 |
) |
|
|
— |
|
|
Proceeds from the issuance of common stock in connection with follow-on public offering, net of underwriting discount |
|
|
569,471 |
|
|
|
— |
|
|
|
— |
|
|
Payments of costs related to follow-on public offering |
|
|
(1,519 |
) |
|
|
— |
|
|
|
— |
|
|
Proceeds from exercise of stock options |
|
|
2,341 |
|
|
|
1,810 |
|
|
|
31 |
|
|
Other financing activities |
|
|
(316 |
) |
|
|
183 |
|
|
|
(164 |
) |
|
Net cash provided by financing activities |
|
|
1,237,035 |
|
|
|
275,242 |
|
|
|
132,375 |
|
|
Net increase in cash, cash equivalents and restricted cash |
|
|
870,452 |
|
|
|
56,078 |
|
|
|
80,252 |
|
|
Cash, cash equivalents and restricted cash at the beginning of period |
|
|
219,587 |
|
|
|
163,509 |
|
|
|
83,257 |
|
|
Cash, cash equivalents and restricted cash at the end of period |
|
$ |
1,090,039 |
|
|
$ |
219,587 |
|
|
$ |
163,509 |
|
86
|
Supplemental disclosure of cash flow information: |
|
|
|
|
|
|
|
|
|
|
|
|
|
Cash paid for interest |
|
$ |
8,540 |
|
|
$ |
12,607 |
|
|
$ |
7,743 |
|
|
Cash paid for income taxes |
|
$ |
163 |
|
|
$ |
157 |
|
|
$ |
212 |
|
|
Supplemental disclosure of non-cash investing and financing activities: |
|
|
|
|
|
|
|
|
|
|
|
|
|
Accretion of redeemable convertible preferred stock |
|
$ |
— |
|
|
$ |
132,750 |
|
|
$ |
13,036 |
|
|
Series H preferred stock issuance costs included in accrued expenses |
|
$ |
— |
|
|
$ |
5,020 |
|
|
$ |
— |
|
|
Costs related to IPO included in accrued expenses and accounts payable |
|
$ |
— |
|
|
$ |
1,703 |
|
|
$ |
— |
|
|
Conversion of redeemable convertible preferred stock warrant to common stock warrant |
|
$ |
21,873 |
|
|
$ |
— |
|
|
$ |
— |
|
|
Issuance of common stock as upfront payment to nonemployee |
|
$ |
2,127 |
|
|
$ |
— |
|
|
$ |
— |
|
|
Accrued property and equipment expenditures |
|
$ |
97 |
|
|
$ |
200 |
|
|
$ |
— |
|
See accompanying notes to these consolidated financial statements.
87
VROOM, INC.
NOTES TO CONSOLIDATED FINANCIAL STATEMENTS
1. Description of Business and Basis of Presentation
Description of Business and Organization
Vroom, Inc., and its wholly owned subsidiaries (collectively, “the Company”) is an innovative, end-to-end ecommerce platform that is transforming the used vehicle industry by offering a better way to buy and a better way to sell used vehicles.
In December 2015, the Company acquired Houston-based Left Gate Property Holding, LLC (d/b/a Texas Direct Auto and Vroom). The acquisition included the Company's proprietary vehicle reconditioning center, the Texas Direct Auto ("TDA") dealership, and Sell Us Your Car® centers. Left Gate Property Holding, LLC was renamed Vroom Automotive, LLC in March 2021, and is the primary operating entity for the Company's purchases and sales of used vehicles.
The Company currently is organized into three reportable segments: Ecommerce, Wholesale, and TDA. The Ecommerce reportable segment represents retail sales of used vehicles through the Company’s ecommerce platform and fees earned on sales of value-added products associated with those vehicles sales. The Wholesale reportable segment represents sales of used vehicles through wholesale channels. The TDA reportable segment represents retail sales of used vehicles from TDA and fees earned on sales of value-added products associated with those vehicles sales.
The Company was incorporated in Delaware on January 31, 2012 under the name BCM Partners III, Corp. On June 25, 2013, the Company changed its name to Auto America, Inc. and on July 9, 2015, the Company changed its name to Vroom, Inc.
Stock Split
In connection with the closing of the Company’s initial public offering (“IPO”) on June 11, 2020, the Company effected a 2-for-1 forward stock split of the Company’s common stock, which became effective immediately prior to the consummation of the IPO. All shares of the Company’s common stock, stock-based instruments, and per-share data included in these consolidated financial statements have been retroactively adjusted as though the stock split has been effected prior to all periods presented.
Initial Public Offering
The Company closed its IPO on June 11, 2020 in which it sold 24,437,500 shares of common stock at the public offering price of $22.00 per share, including 3,187,500 shares sold pursuant to exercise by the underwriters of their option to purchase additional shares. The Company received proceeds of $504.0 million from the IPO, net of the underwriting discount and before deducting offering expenses of $7.5 million. In addition, in accordance with their terms and consistent with the conversion rates discussed in Note 11 - Redeemable Convertible Preferred Stock and Stockholders’ Equity (Deficit), all shares of the Company’s outstanding redeemable convertible preferred stock were automatically converted into common stock upon the closing of the IPO.
Follow-on Public Offering
The Company closed its follow-on public offering on September 15, 2020 in which it sold 10,800,000 shares of common stock at the public offering price of $54.50 per share. The Company received proceeds of $569.5 million from the offering, net of the underwriting discount and before deducting offering expenses of $1.5 million.
Basis of Presentation
The consolidated financial statements of the Company have been prepared in accordance with U.S. generally accepted accounting principles (“U.S. GAAP”). Certain prior year amounts have been reclassified to conform to the current year presentation.
88
VROOM, INC.
NOTES TO CONSOLIDATED FINANCIAL STATEMENTS
Principles of Consolidation
The accompanying consolidated financial statements include the accounts of the Company and its wholly owned subsidiaries. All intercompany accounts and transactions have been eliminated in consolidation.
2. Summary of Significant Accounting Policies
Use of Estimates
The preparation of consolidated financial statements in accordance with U.S. GAAP requires management to make estimates, assumptions and judgments that affect the reported amounts of assets, liabilities, revenue, and expenses and related disclosures. On an ongoing basis, the Company evaluates its estimates, including, among others, those related to income taxes, the realizability of inventory, stock-based compensation, contingencies, revenue-related reserves, fair value measurements, goodwill, and useful lives of property and equipment and intangible assets. The Company bases its estimates on historical experience, market conditions, and on various other assumptions that are believed to be reasonable. Actual results may differ from these estimates.
Beginning in the first quarter of 2020, the COVID-19 pandemic negatively impacted, and may continue to negatively impact, the macroeconomic environment in the United States and globally, as well as the Company’s business, financial condition and results of operations. Due to the evolving and uncertain nature of COVID-19, it is reasonably possible that it could materially impact the Company’s estimates, particularly those noted above that require consideration of forecasted financial information, in the near to medium term. The ultimate impact will depend on numerous evolving factors that the Company may not be able to accurately predict, including the duration and extent of the pandemic, the impact of federal, state, local and foreign governmental actions, consumer behavior in response to the pandemic and other economic and operational conditions the Company may face.
Comprehensive Loss
The Company did not have any other comprehensive income or loss for the years ended December 31, 2020, 2019, and 2018. Accordingly, net loss and comprehensive loss are the same for the periods presented.
Revenue Recognition
Revenue consists of retail used vehicle sales, wholesale used vehicle sales, fees earned on sales of value-added products to customers in connection with vehicles sales, and other revenues. Refer to Note 3 – Revenue Recognition for a discussion of the Company’s significant accounting policies related to revenue recognition.
Cost of sales
Cost of sales primarily includes the cost to acquire used vehicles, inbound transportation costs and direct and indirect reconditioning costs associated with preparing vehicles for resale. Reconditioning costs include parts, labor and third-party reconditioning costs directly attributable to the vehicle and allocated overhead costs. Cost of sales also includes any necessary adjustments to reflect vehicle inventory at the lower of cost or net realizable value.
Cash and Cash Equivalents
Cash and cash equivalents include cash deposits at financial institutions and highly liquid investments with original maturities of three months or less. Outstanding checks that are in excess of the cash balances at certain financial institutions are included in “Accounts payable” in the consolidated balance sheets and changes in these amounts are reflected in operating cash flows in the consolidated statements of cash flows.
Restricted Cash
Restricted cash includes cash deposits required under letter of credit agreements as explained in Note 9 – Commitments and Contingencies. As of December 31, 2020, restricted cash also includes a $31.6 million cash deposit required under the Company’s 2020 Vehicle Floorplan Facility as explained in Note 8 – Vehicle Floorplan Facilities.
89
VROOM, INC.
NOTES TO CONSOLIDATED FINANCIAL STATEMENTS
Accounts Receivable, Net
Accounts receivable, net of an allowance for doubtful accounts, includes amounts due from customers and from third-party financial institutions related to vehicle purchases. The allowance for doubtful accounts is estimated based upon historical experience, age of the balances, current economic conditions and other factors and is evaluated as of each reporting date. Increases and decreases in the allowance for doubtful accounts are recorded in “Selling, general and administrative expenses” in the consolidated statements of operations.
Inventory
Inventory consists primarily of used vehicles and parts and accessories and is stated at the lower of cost or net realizable value. Inventory cost is determined by specific identification and includes acquisition cost, direct and indirect reconditioning costs and inbound transportation expenses. Net realizable value represents the estimated selling price less costs to complete, dispose and transport the vehicles. The Company recognizes any necessary adjustments to reflect inventory at the lower of cost or net realizable value through adjustments to “Cost of sales” in the consolidated statements of operations.
Property and Equipment, Net
Property and equipment are recorded at cost less accumulated depreciation and amortization. Charges for repairs and maintenance that do not improve or extend the life of the respective assets are expensed as incurred. When assets are retired or otherwise disposed of, their costs and related accumulated depreciation are written off and any resulting gains or losses are recorded during the period.
Depreciation and amortization are calculated using the straight-line method over the following estimated useful lives of the assets:
|
Equipment |
3 to 15 years |
|
Furniture and fixtures |
3 to 15 years |
|
Company Vehicles |
5 to 7 years |
|
Leasehold improvements |
Lesser of useful life or lease term |
|
Internal-use software |
3 to 5 years |
The Company capitalizes direct costs of materials and services utilized in developing or obtaining internal-use software. The Company also capitalizes payroll and payroll-related costs for employees who are directly associated with and who devote time to the development of software products for internal use, to the extent of the time spent directly on the project. Capitalization of costs begins during the application development stage and ends when the software is available for general use. Costs incurred during the preliminary project and post-implementation stages are charged to expense as incurred.
Goodwill
Goodwill represents the excess of the consideration transferred over the fair value of the identifiable assets acquired and liabilities assumed in business combinations. Goodwill is tested for impairment annually as of October 1 or whenever events or changes in circumstances indicate that an impairment may exist.
The Company has three reporting units: Ecommerce, Wholesale, and TDA. In performing its annual goodwill impairment test, the Company first reviews qualitative factors to determine whether it is more likely than not that the fair value of a reporting unit is less than its carrying amount. If, after assessing qualitative factors, the Company determines that it is not more likely than not that the fair value of a reporting unit is less than its carrying amount, then performing the quantitative test is unnecessary and the Company’s goodwill is not considered to be impaired. However, if based on the qualitative assessment the Company concludes that it is more likely than not that the fair value of the reporting unit is less than its carrying amount, or if the Company elects to bypass the optional qualitative assessment as provided for under U.S. GAAP, the Company proceeds with performing the quantitative impairment test.
No goodwill impairment was determined to exist for the years ended December 31, 2020, 2019, and 2018.
90
VROOM, INC.
NOTES TO CONSOLIDATED FINANCIAL STATEMENTS
In connection with its annual goodwill impairment test as of October 1, 2020, the Company performed qualitative impairment assessments for each of its reporting units. The results of the qualitative assessments indicated that it was not more likely than not that the fair value of the reporting units were less than the carrying values.
Deferred Offering Costs
Deferred offering costs, including legal, accounting and other fees and costs relating to the Company’s IPO and Follow-on Public Offering, are capitalized and included within “Other assets” in the consolidated balance sheets. The deferred offering costs were offset against the IPO proceeds within equity upon the closing of the IPO and Follow-on Public Offering. As of December 31, 2020 and 2019, there were $0.0 million and $2.4 million, respectively, of capitalized deferred offering costs included within “Other assets.”
Vehicle Floorplan
The vehicle floorplan payable (the “Vehicle Floorplan Facility”) reflects amounts borrowed to finance the purchase of specific vehicle inventories. Portions of the Vehicle Floorplan Facility are settled on a daily basis depending on the Company’s sales and purchasing activity. The Vehicle Floorplan Facility is collateralized by vehicle inventories and certain other assets of the Company. Borrowings and repayments are presented separately and classified as financing activities within the consolidated statements of cash flows.
Income Taxes
The Company accounts for income taxes under the asset and liability method. The Company recognizes deferred tax assets and liabilities for the future tax consequences attributable to differences between the financial statement carrying amounts of existing assets and liabilities and their respective tax basis, as well as for operating loss and tax credit carry forwards. The Company measures deferred tax assets and liabilities using enacted tax rates expected to apply to taxable income in the years in which the Company expects to recover or settle those temporary differences. The Company recognizes the effect of a change in tax rates on deferred tax assets and liabilities in the results of operations in the period that includes the enactment date. The Company reduces the measurement of a deferred tax asset, if necessary, by a valuation allowance if it is “more-likely-than-not” that the Company will not realize some or all of the deferred tax asset. The Company accounts for uncertain tax positions by recognizing the financial statement effects of a tax position only when, based upon technical merits, it is “more likely than not” that the position will be sustained upon examination. Potential interest and penalties associated with unrecognized tax positions are recognized in income tax expense.
Stock-Based Compensation
The Company recognizes the cost of employee services received in exchange for stock awards based on the fair value of those awards at the date of grant over the requisite service period. The Company uses the Black-Scholes-Merton (“Black-Scholes”) option pricing model to determine the fair value of its stock-based awards. Estimating the fair value of stock-based awards requires the input of subjective assumptions, including the estimated fair value of the Company’s common stock, the expected life of the options, stock price volatility, which is determined based on the historical volatilities of several publicly listed peer companies as the Company has only a short trading history for its common stock, the risk-free interest rate and expected dividends. The assumptions used in the Company’s Black-Scholes option-pricing model represent management’s best estimates and involve a number of variables, uncertainties and assumptions and the application of management’s judgment, as they are inherently subjective.
Advertising
Advertising costs are expensed as incurred and are included within “Selling, general and administrative expenses” in the consolidated statements of operations. Advertising expenses were $62.4 million, $49.9 million, and $25.6 million for the years ended December 31, 2020, 2019, and 2018, respectively.
Shipping and Handling
The Company’s logistics costs related to transporting its used vehicle inventory primarily include third-party transportation fees. The portion of these costs related to inbound transportation from the point of acquisition to the relevant reconditioning facility is included in cost of sales when the related used vehicle is sold. Logistics costs not included in cost of sales are accounted for as costs to fulfil contracts with customers and are included in “Selling, general
91
VROOM, INC.
NOTES TO CONSOLIDATED FINANCIAL STATEMENTS
and administrative expenses” in the consolidated statements of operations and were $30.3 million, $14.0 million, and $6.4 million for the years ended December 31, 2020, 2019, and 2018, respectively.
Concentration of Credit Risk and Significant Customers
The Company’s principal financial instruments subject to potential concentration of credit risk are cash and cash equivalents and accounts receivable, which are unsecured. The Company’s cash balances are maintained at various large financial institutions. Deposits held with financial institutions may at times exceed the amount of insurance provided on such deposits. Generally, these deposits may be redeemed upon demand and, therefore, management believes they bear minimal risk. The Company’s cash equivalents primarily consist of money market funds that hold investments in highly liquid US treasury securities. Concentration of credit risk with respect to accounts receivable is generally mitigated by a large customer base.
For the years ended December 31, 2020, 2019, and 2018, no customer represented 10% or more of the Company’s revenues and no customer represented more than 10% of the Company’s accounts receivable as of December 31, 2020 and 2019.
Liquidity
The Company has had negative cash flows and losses from operations since inception which it has funded primarily through issuances of common and preferred stock. The Company has historically funded vehicle inventory purchases through a vehicle floorplan facility. As further discussed in Note 8 – Vehicle Floorplan Facilities, the Company entered into a new facility in March 2020 which increased the borrowing capacity up to $450.0 million. In October 2020, the Vehicle Floorplan Facility was amended to extend the maturity date to September 2022.
Net Loss Per Share Attributable to Common Stockholders
Basic and diluted net loss per share attributable to common stockholders is presented in conformity with the two-class method required for participating securities. Under the two-class method, net loss is attributed to common stockholders and participating securities based on their participation rights. The Company considers all series of its redeemable convertible preferred stock to be participating securities. Under the two-class method, the net loss attributable to common stockholders is not allocated to the redeemable convertible preferred stock as the holders of the Company’s redeemable convertible preferred stock do not have a contractual obligation to share in the Company’s losses. Under the two-class method, basic net loss per share attributable to common stockholders is computed by dividing the net loss attributable to common stockholders by the weighted-average number of shares of common stock outstanding during the period. For periods in which the Company reports net losses, diluted net loss per common share attributable to common stockholders is the same as basic net loss per common share attributable to common stockholders because potentially dilutive common shares are not assumed to have been issued if their effect is anti-dilutive.
The accretion of the Company’s redeemable convertible preferred stock (refer to Note 11) for the years ended December 31, 2019 and 2018 has been presented as an increase to net loss to determine net loss attributable to common stockholders.
Nonemployee Share-Based Payments
On May 15, 2020, the Company entered into an agreement with Rocket Auto LLC and certain of its affiliates (collectively, “Rocket”) providing for the launch of an ecommerce platform under the “Rocket Auto” brand for the marketing and sale of vehicles directly to consumers (the “RA Agreement”). The Company will list its used vehicle inventory for sale on the Rocket Auto platform, but all sales of the Company’s inventory will be conducted through the Company’s platform. Rocket Auto is expected to launch publicly during 2021 and, during the term of the RA Agreement, Rocket has agreed to ensure that not less than a minimum percentage of all used vehicles sold or leased through the platform on a monthly basis will be Vroom inventory. The Company issued Rocket 183,870 shares of the Company’s common stock upon execution of the RA Agreement. The Company will pay Rocket a combination of cash and stock for vehicle sales made through the platform. Rocket may earn up to 8,641,914 shares of common stock over a four-year period based upon sales volume of Vroom inventory through the Rocket Auto platform.
The Company accounts for the issuance of its common stock under the RA agreement in accordance with ASC 718, Compensation – Stock Compensation, including the provisions that apply to share-based payments issued to nonemployees for goods or services. The Company determined that the grant date was May 15, 2020 for both the upfront
92
VROOM, INC.
NOTES TO CONSOLIDATED FINANCIAL STATEMENTS
shares issued and the additional shares that potentially are to be issued based on sales volume through the Rocket Auto platform. The fair value of the Company’s common stock on the grant date was determined to be $11.57 per share. The grant date fair value of the upfront shares issued was initially recognized as an asset within “Other assets” in the consolidated balance sheet, which will subsequently be amortized within “Selling, general and administrative expenses” over the term of the RA agreement commencing on the launch date. The grant date fair value of the potential shares to be issued will be recognized within “Selling, general and administrative expenses” as sales of Vroom’s inventory associated with the Rocket Auto platform occur and such shares are earned.
Accounting Standards Adopted
In May 2014, the Financial Accounting Standards Board (“FASB”) issued ASU 2014-09, Revenue from Contracts with Customers (“Topic 606”), which amends the guidance on revenue recognition. Under the new standard, revenue is recognized upon transfer of control of promised goods or services to customers in an amount that reflects the consideration the entity expects to receive in exchange for those goods and services. The principles in the standard are applied using a five-step model that includes 1) identifying the contract(s) with a customer, 2) identifying the performance obligations in the contract, 3) determining the transaction price, 4) allocating the transaction price to the performance obligations in the contract, and 5) recognizing revenue when (or as) the performance obligations are satisfied. The standard also requires disclosure of the nature, amount, timing, and uncertainty of revenue and cash flows arising from contracts with customers. The FASB also subsequently issued several amendments to the standard to clarify the guidance.
The Company adopted Topic 606 as of January 1, 2018 utilizing the modified retrospective approach applied only to contracts not completed as of the date of adoption. The Company recognized a net decrease to accumulated deficit of $1.7 million as January 1, 2018 due to the cumulative effect of adopting Topic 606.
The cumulative effect adjustment primarily resulted from a change in revenue recognition for sales of vehicle service contracts which are provided by a third-party and are sold by the Company on a commission basis. For these products, the Company is contractually entitled to receive profit-sharing revenues based on the performance of the vehicle service contracts once a required claims period has passed. The Company previously recognized this revenue at each reporting date based on the performance of the vehicle service contracts at such date. Under Topic 606, profit sharing revenues are recognized earlier because they represent variable consideration which the Company estimates and recognizes at the time the vehicle services are sold to the end-customer.
Topic 606 also requires the Company to make additional disclosures about the amount, timing, and uncertainty of revenue and cash flows arising from contracts with customers. Refer to Note 3—Revenue Recognition for further information on the Company’s revenue recognition accounting policies.
In August 2018, the FASB issued ASU 2018-15, Intangibles—Goodwill and Other—Internal-Use Software (Subtopic 350-40): Customer’s Accounting for Implementation Costs Incurred in a Cloud Computing Arrangement That Is a Service Contract (“ASU 2018-15”). The intent of this new guidance is to align the requirements for capitalizing implementation costs incurred in a cloud computing arrangement that is a service contract with the requirements for capitalizing implementation costs incurred to develop or obtain internal-use software as defined in ASC 350-40. Under ASU 2018-15, the capitalized implementation costs related to a cloud computing arrangement will be amortized over the term of the arrangement and all capitalized implementation amounts will be required to be presented in the same line items of the financial statements as the related hosting fees. The Company adopted ASU 2018-15 as of January 1, 2019. The new guidance was applied prospectively to all implementation costs incurred after the date of adoption and resulted in the capitalization of $2.7 million of implementation costs, which primarily relate to the Company’s hosted general ledger system. Capitalized implementation costs are included in “Other assets” in the consolidated balance sheet as of December 31, 2019 and are amortized over the terms of the arrangements, which range between 2 and 5 years. Total amortization expense for the year ended December 31, 2019 was $0.3 million.
93
VROOM, INC.
NOTES TO CONSOLIDATED FINANCIAL STATEMENTS
In February 2016, the FASB issued, ASU 2016-02, Leases (Topic 842), which amends the accounting guidance on leases. The new standard requires a lessee to recognize right-of-use assets and lease obligations on the balance sheet for most lease agreements. Leases are classified as either operating or finance, with classification affecting the pattern of expense recognition in the statement of operations. The FASB also subsequently issued amendments to the standard to provide additional practical expedients and an additional transition method option.
The Company adopted Topic 842 as of January 1, 2020 using the modified retrospective approach with a cumulative-effect adjustment to opening retained earnings (accumulated deficit) with no restatement of comparative periods. Upon adoption, the Company recognized $18.4 million of operating lease liabilities and $17.4 million of operating lease right-of-use assets. The adoption of Topic 842 did not result in a cumulative effect adjustment to accumulated deficit.
Topic 842 provides various optional practical expedients for transition. The Company elected to utilize the package of practical expedients for transition which permitted the Company to not reassess its prior conclusions regarding whether a contract is or contains a lease, lease classification and initial direct costs. The Company did not elect the hindsight practical expedient to determine lease terms.
Topic 842 also provides optional practical expedients for an entity’s ongoing lease accounting. The Company elected the short-term lease recognition exemption for all leases that qualify and the practical expedient to not separate lease and non-lease components of leases.
In August 2018, the FASB issued ASU 2018-13, Fair Value Measurement (Topic 820): Disclosure Framework — Changes to the Disclosure Requirements for Fair Value Measurement, related to updated requirements over the disclosures of fair value measurements. Under ASU 2018-13, certain disclosure requirements for fair value measurements were eliminated, modified or added to facilitate better disclosure regarding recurring and non-recurring fair value measurements. The Company adopted the guidance on January 1, 2020 which did not have a material impact on the Company’s consolidated financial statements and related disclosures.
In June 2016, the FASB issued ASU 2016-13, Financial instruments, Credit Losses (Topic 326): Measurement of Credit Losses on Financial Instruments, which amends the guidance on the impairment of financial instruments by requiring measurement and recognition of expected credit losses for most financial assets, including trade receivables, and other instruments that are not measured at fair value through net income. The Company adopted the guidance on January 1, 2020 which did not have a material impact on the Company’s consolidated financial statements and related disclosures.
Accounting Standards Issued But Not Yet Adopted
In December 2019, the FASB issued ASU 2019-12, Income Taxes (Topic 740): Simplifying the Accounting for Income Taxes, which enhances and simplifies various aspects of the income tax accounting guidance including the elimination of certain exceptions related to the approach for intraperiod tax allocation, the methodology for calculating income taxes in an interim period and the recognition of deferred tax liabilities for outside basis differences. The guidance will be effective for fiscal years beginning after December 15, 2020, with early adoption permitted. The adoption of ASU 2019-12 will not result in a material change to the Company’s consolidated financial statements and related disclosures.
3. Revenue Recognition
The Company recognizes revenue upon transfer of control of goods or services to customers, in an amount that reflects the consideration to which the Company expects to be entitled in exchange for those goods or services. The Company may collect sales taxes and other taxes from customers on behalf of governmental authorities at the time of sale as required. These taxes are accounted for on a net basis and are not included in revenues or cost of sales.
The Company’s revenue is disaggregated within the consolidated statements of operations and is generated from customers throughout the United States. The Company recognizes revenue at a point in time as described below.
Retail Vehicle Revenue
The Company sells used vehicles to its retail customers through its ecommerce platform and TDA retail location. The transaction price for used vehicles is a fixed amount as set forth within the customer contract at the time of sale. Customers frequently trade-in their existing vehicle to apply toward the transaction price of a used vehicle. Trade-in vehicles represent non-cash consideration which the Company measures at fair value based on external and internal
94
VROOM, INC.
NOTES TO CONSOLIDATED FINANCIAL STATEMENTS
market data for each specific vehicle. The Company satisfies its performance obligation and recognizes revenue for used vehicle sales generally at a point in time when the vehicles are delivered to the customer for ecommerce sales or picked up by the customer for TDA sales. The revenue recognized by the Company includes the agreed upon transaction price, including any delivery charges stated within the customer contract. Revenue excludes any sales taxes, title and registration fees, and other government fees that are collected from customers.
The Company receives payment for used vehicle sales directly from the customer at the time of sale or from third-party financial institutions within a short period of time following the sale if the customer obtains financing. Payments received prior to delivery or pick-up of used vehicles are recorded as “Deferred revenue” within the consolidated balance sheets.
The Company offers a return program for used vehicle sales and establishes a provision for estimated returns based on historical information and current trends. The reserve for estimated returns is presented gross on the consolidated balance sheets, with an asset recorded in “Prepaid expenses and other current assets” and a refund liability recorded in “Other current liabilities.”
Wholesale Vehicle Revenue
The Company sells vehicles that do not meet its retail sales criteria through wholesale channels. Vehicles sold through wholesale channels are acquired from customers who trade-in their vehicles when making a purchase from the Company, from customers who sell their vehicles to the Company in direct-buy transactions, and from liquidation of vehicles previously listed for retail sale. The transaction price for wholesale vehicles is a fixed amount. The Company satisfies its performance obligation and recognizes revenue for wholesale vehicle sales at a point in time when the vehicle is sold. The transaction price is typically due and collected within a short period of time following the vehicle sales.
Product Revenue
The Company’s product revenue consists of fees earned on selling vehicle service contracts, guaranteed asset protection (“GAP”) and tire and wheel coverage. The Company sells these products pursuant to arrangements with the third parties that provide these products and are responsible for their fulfillment. The Company concluded that it is an agent for these transactions because it does not control the products before they are transferred to the customer. The Company recognizes product revenues on a net basis when the customer enters into an arrangement for the products, which is typically at the time of a used vehicle sale.
Customers may enter into a retail installment sales contract to finance the purchase of used vehicles. The Company sells these contracts on a non-recourse basis to various financial institutions. The Company receives a fee from the financial institution based on the difference between the interest rate charged to the customer that purchased the used vehicle and the interest rate set by the financial institution. These fees are recognized upon sale and assignment of the installment sales contract to the financial institution, which occurs concurrently at the time of a used vehicle sale.
A portion of the fees earned on these products is subject to chargebacks in the event of early termination, default, or prepayment of the contracts by end-customers. The Company’s exposure for these events is limited to the fees that it receives. An estimated refund liability for chargebacks against the revenue recognized from sales of these products is recorded in the period in which the related revenue is recognized and is based primarily on the Company’s historical chargeback experience. The Company updates its estimates at each reporting date. As of December 31, 2020 and 2019, the Company’s reserve for chargebacks was $3.8 million and $3.3 million, respectively, of which $1.7 million and $1.8 million, respectively, are included within “Accrued expenses” and $2.1 million and $1.5 million, respectively, are included in “Other long-term liabilities.”
The Company also is contractually entitled to receive profit-sharing revenues based on the performance of the vehicle service policies once a required claims period has passed. The Company recognizes profit-sharing revenues to the extent it is probable that it will not result in a significant revenue reversal. The Company estimates the revenue based on historical claims and cancellation data from its customers, as well as other qualitative assumptions. The Company reassesses the estimate at each reporting period with any changes reflected as an adjustment to revenues in the period identified. As of December 31, 2020 and 2019, the Company recognized $11.5 million and $6.9 million, respectively, related to cumulative profit-sharing payments to which it expects to be entitled, of which $0.8 million and $0.3 million, respectively, are included within “Prepaid expenses and other current assets” and $10.7 million and $6.6 million, respectively, are included within “Other assets.”
95
VROOM, INC.
NOTES TO CONSOLIDATED FINANCIAL STATEMENTS
Other Revenue
Other revenue primarily consists of labor and parts revenue earned by the Company for vehicle repair services at TDA.
Contract Costs
The Company has elected, as a practical expedient, to expense sales commissions when incurred because the amortization period would have been less than one year. These costs are recorded within “Selling, general and administrative expenses” in the consolidated statements of operations.
4. Inventory
Inventory consisted of the following (in thousands):
|
|
|
December 31, |
|
|||||
|
|
|
2020 |
|
|
2019 |
|
||
|
Vehicles |
|
$ |
421,458 |
|
|
$ |
203,290 |
|
|
Parts and accessories |
|
|
2,189 |
|
|
|
2,456 |
|
|
Total inventory |
|
$ |
423,647 |
|
|
$ |
205,746 |
|
As of December 31, 2020 and 2019, “Inventory” includes an adjustment of $12.9 million and $6.3 million, respectively, to record the balances at the lower of cost or net realizable value.
5. Property and Equipment, Net
Property and equipment, net consisted of the following (in thousands):
|
|
|
December 31, |
|
|||||
|
|
|
2020 |
|
|
2019 |
|
||
|
Equipment |
|
$ |
1,061 |
|
|
$ |
930 |
|
|
Furniture and fixtures |
|
|
1,746 |
|
|
|
1,725 |
|
|
Company vehicles |
|
|
5,002 |
|
|
|
1,151 |
|
|
Leasehold improvements |
|
|
7,068 |
|
|
|
6,556 |
|
|
Internal-use software |
|
|
10,552 |
|
|
|
4,406 |
|
|
Other |
|
|
2,997 |
|
|
|
2,580 |
|
|
|
|
|
28,426 |
|
|
|
17,348 |
|
|
Accumulated depreciation and amortization |
|
|
(13,334 |
) |
|
|
(9,520 |
) |
|
Property and equipment, net |
|
$ |
15,092 |
|
|
$ |
7,828 |
|
Depreciation and amortization expense was $4.1 million, $2.8 million, and $3.5 million for the years ended December 31, 2020, 2019, and 2018, respectively. Depreciation and amortization expense of $0.1 million was included within “Cost of sales” in the consolidated statements of operations for the years ended December 31, 2020, 2019 and 2018.
6. Goodwill
The carrying amount of the Company’s goodwill was $78.2 million as of December 31, 2020 and 2019, of which $72.2 million, $4.2 million and $1.8 million is allocated to the Ecommerce, TDA, and Wholesale reportable segments, respectively. There were no changes in the carrying amount of the Company’s goodwill for the years ended December 31, 2020 and 2019 and there have been no accumulated impairment charges.
96
VROOM, INC.
NOTES TO CONSOLIDATED FINANCIAL STATEMENTS
7. Accrued Expenses and Other Current Liabilities
The Company’s accrued expenses consisted of the following (in thousands):
|
|
|
December 31, |
|
|||||
|
|
|
2020 |
|
|
2019 |
|
||
|
Accrued marketing expenses |
|
$ |
9,106 |
|
|
$ |
3,158 |
|
|
Vehicle related expenses |
|
|
13,062 |
|
|
|
8,923 |
|
|
Sales taxes |
|
|
15,443 |
|
|
|
7,455 |
|
|
Accrued compensation and benefits |
|
|
5,749 |
|
|
|
3,386 |
|
|
Accrued professional services |
|
|
4,890 |
|
|
|
2,964 |
|
|
Accrued Series H preferred stock issuance costs |
|
|
— |
|
|
|
5,020 |
|
|
Other |
|
|
11,155 |
|
|
|
7,585 |
|
|
Total accrued expenses |
|
$ |
59,405 |
|
|
$ |
38,491 |
|
The Company’s other current liabilities consisted of the following (in thousands):
|
|
|
December 31, |
|
|||||
|
|
|
2020 |
|
|
2019 |
|
||
|
Vehicle payable |
|
$ |
25,086 |
|
|
$ |
8,904 |
|
|
Other |
|
|
5,189 |
|
|
|
2,668 |
|
|
Total other current liabilities |
|
$ |
30,275 |
|
|
$ |
11,572 |
|
8. Vehicle Floorplan Facilities
In March 2020, the Company entered into a new vehicle floorplan facility with Ally Bank and Ally Financial (the “2020 Vehicle Floorplan Facility”), which replaced the Company’s previous vehicle floorplan facility. The 2020 Vehicle Floorplan Facility provides a committed credit line of up to $450.0 million which originally was scheduled to expire in March 2021.The amount of credit available is determined on a monthly basis based on a calculation that considers average outstanding borrowings and vehicle units paid off by the Company within the immediately preceding three-month period. As of December 31, 2020, the borrowing capacity of the 2020 Vehicle Floorplan Facility was $356.9 million, of which $27.7 million was unutilized.
Outstanding borrowings related to the 2020 Vehicle Floorplan Facility are due as the vehicles financed are sold, or in any event, on the maturity date. The 2020 Vehicle Floorplan Facility bears interest at a rate equal to the 1-Month LIBOR rate applicable in the immediately preceding month plus a spread of 425 basis points. The 2020 Vehicle Floorplan Facility is collateralized by the Company’s vehicle inventory and certain other assets and the Company is subject to covenants that require it to maintain a certain level of equity in the vehicles that are financed, to maintain at least 10% of the outstanding borrowings in cash and cash equivalents, to maintain 10% of the monthly credit line availability on deposit with Ally Bank and to maintain a minimum tangible adjusted net worth of $167.0 million, which is defined as shareholder equity (deficit) plus redeemable convertible preferred stock as determined under U.S. GAAP. The Company was required to pay an upfront commitment fee upon execution of the 2020 Vehicle Floorplan Facility.
In October 2020, the Company amended its 2020 Vehicle Floorplan Facility to extend the maturity date to September 30, 2022. The amendment requires the Company to pay an availability fee each quarter on the average unused capacity from the prior quarter if it was greater than 50% of the calculated floorplan allowance, as defined. The amendment reduces the minimum liquidity requirement to maintain in cash and cash equivalents as a percentage of the credit line from 10.0% to 7.5% and changes the requirement to maintain 10% of the monthly credit line availability on deposit with Ally Bank to 10% of the daily floorplan principal balance outstanding. The amendment eliminated the minimum tangible adjusted net worth covenant. The Company was required to pay an upfront commitment fee upon execution of the amendment.
The Company previously entered into a vehicle floorplan (the “2016 Vehicle Floorplan Facility”) with Ally Bank and Ally Financial in April 2016, as subsequently amended. The 2016 Vehicle Floorplan Facility consisted of a revolving line of credit with a borrowing capacity of $220.0 million as of December 31, 2019, which could be used to finance the Company’s vehicle inventory.
97
VROOM, INC.
NOTES TO CONSOLIDATED FINANCIAL STATEMENTS
The interest rate on the 2016 Vehicle Floorplan Facility was equal to the 1-Month LIBOR rate applicable in the immediately preceding month plus a spread of 425 basis points and was payable on a monthly basis.
As of December 31, 2020 and 2019, outstanding borrowings on the vehicle floorplan facilities were $329.2 million and $173.5 million, respectively.
Interest expense incurred by the Company for the vehicle floorplan facilities was $9.7 million, $10.4 million, and $4.7 million for the years ended December 31, 2020, 2019, and 2018, respectively, which are recorded within “Interest expense” in the consolidated statements of operations. The weighted average interest rate on the vehicle floorplan borrowings was 4.39% and 6.00% as of December 31, 2020 and 2019, respectively.
As of December 31, 2020 and 2019, the Company was in compliance with all covenants related to the vehicle floorplan facilities.
In connection with the vehicle floorplan facilities, the Company entered into credit balance agreements with Ally Bank and Ally Financial that permit the Company to deposit cash with the bank for the purpose of reducing the amount of interest payable for borrowings. Interest credits earned by the Company were $5.4 million, $5.1 million, and $2.9 million for the years ended December 31, 2020, 2019, and 2018, respectively, which are recorded within “Interest income” in the consolidated statements of operations.
9. Commitments and Contingencies
Litigation
From time to time, the Company is involved in various claims and legal actions that arise in the ordinary course of business. The Company accrues a liability when a loss is considered probable and the amount can be reasonably estimated. When a material loss contingency is reasonably possible but not probable, the Company does not record a liability, but instead discloses the nature and the amount of the claim, and an estimate of the loss or range of loss, if such an estimate can be made. Legal fees are expensed as incurred. As of December 31, 2020 and 2019, the Company was not a party to any legal proceedings that, individually or in the aggregate, are reasonably expected to have a material adverse effect on the Company’s consolidated results of operations, financial condition or cash flows. However, the results of these matters cannot be predicted with certainty, and an unfavorable resolution of one or more matters could have a material adverse effect on the Company’s consolidated results of operations, financial condition or cash flows.
Letters of Credit
The Company obtained stand-by letters of credit totaling $2.2 million in 2020 to satisfy conditions under three lease agreements. The Company was required to maintain a cash deposit of $2.2 million and $1.9 million with the financial institution that issued the stand-by letters of credit, which is classified as “Restricted cash” within the consolidated balance sheets as of December 31, 2020 and 2019, respectively.
Other Matters
The Company enters into agreements with third parties in the ordinary course of business that may contain indemnification provisions. In the event that an indemnification claim is asserted, the Company’s liability, if any, would be limited by the terms of the applicable agreement. Historically, the Company has not incurred material costs to defend lawsuits or settle claims related to indemnification provisions.
10. Leases
The Company’s leasing activities primarily consist of real estate leases for its operations, including office space, the Company’s reconditioning facility, the TDA retail location, the Company’s Sell Us Your Car centers, parking lots and other facilities. The real estate leases have terms ranging from six months to eight years. The Company also has leases for various types of equipment, which are not material, individually or in the aggregate. The Company assesses whether each lease is an operating or finance lease at the lease commencement date. The Company does not have any material leases, individually or in the aggregate, classified as a finance leasing arrangement.
The Company’s lease agreements do not contain any material residual value guarantees or material restrictive covenants. The Company does not have any significant leases that have not yet commenced but that create significant rights and obligations for the Company.
98
VROOM, INC.
NOTES TO CONSOLIDATED FINANCIAL STATEMENTS
The Company’s real estate leases often require it to make payments for maintenance in addition to rent as well as payments for real estate taxes and insurance. Maintenance, real estate taxes, and insurance payments are generally variable costs which are based on actual expenses incurred by the lessor. Therefore, these amounts are not included in the consideration of the contract when determining the right-of-use asset and lease liability but are reflected as variable lease expenses.
Leases with an initial term of 12 months or less are not recorded on the Company’s consolidated balance sheet and expense for these leases are recognized on a straight-line basis over the lease term.
Options to extend or terminate leases
Certain of the Company’s real estate leases include one or more options to renew, with renewal terms that can extend the lease term from one to five years. The exercise of lease renewal options is at the Company’s sole discretion. If it is reasonably certain that the Company will exercise such options, the periods covered by such options are included in the lease term and are recognized as part of the Company’s right-of-use assets and lease liabilities. The depreciable life of assets and leasehold improvements are limited by the expected lease term, unless there is a transfer of title or purchase option reasonably certain of exercise.
Lease term and discount rate
As of December 31, 2020, the weighted-average remaining lease term and discount rate for the Company’s operating leases were 3.5 years and 3.4%, excluding short-term operating leases.
As the rate implicit in the lease is generally not readily determinable for the Company’s operating leases, the discount rates used to determine the present value of the Company’s lease liabilities are based on the Company’s incremental borrowing rate at the lease commencement date and commensurate with the remaining lease term. The incremental borrowing rate for a lease is the rate of interest the Company would have to pay to borrow on a collateralized basis over a similar term for an amount equal to the lease payments in a similar economic environment. The Company determines its incremental borrowing rate based on a synthetic credit rating that was developed with the assistance of a third-party specialist.
Lease costs and activity
The Company’s lease costs and activity for the year ended December 31, 2020 were as follows (in thousands):
|
|
|
Year Ended December 31, |
|
|
|
|
|
2020 |
|
|
|
Lease Cost |
|
|
|
|
|
Operating lease cost |
|
$ |
5,503 |
|
|
Short-term lease cost |
|
|
350 |
|
|
Variable lease cost |
|
|
1,915 |
|
|
Sublease income |
|
|
(445 |
) |
|
Net lease cost |
|
$ |
7,323 |
|
|
|
|
|
|
|
|
|
|
Year Ended December 31, |
|
|
|
|
|
2020 |
|
|
|
Other information |
|
|
|
|
|
Cash paid for amounts included in the measurement of lease liabilities: |
|
|
|
|
|
Operating cash flows from operating leases |
|
$ |
5,524 |
|
|
Right-of-use assets obtained in exchange for operating lease liabilities |
|
$ |
4,600 |
|
99
VROOM, INC.
NOTES TO CONSOLIDATED FINANCIAL STATEMENTS
Maturity of Lease Liabilities
The maturity of the Company’s lease liabilities on an undiscounted cash flow basis and a reconciliation to the operating lease liabilities recognized on the Company’s consolidated balance sheet as of December 31, 2020 were as follows (in thousands):
|
2021 |
|
|
6,577 |
|
|
2022 |
|
|
5,318 |
|
|
2023 |
|
|
3,398 |
|
|
2024 |
|
|
3,111 |
|
|
2025 |
|
|
907 |
|
|
Thereafter |
|
|
- |
|
|
Total lease payments |
|
|
19,311 |
|
|
Less: interest |
|
|
(1,166 |
) |
|
Present value of lease liabilities |
|
$ |
18,145 |
|
|
|
|
|
|
|
|
Operating lease liabilities, current |
|
$ |
6,052 |
|
|
Operating lease liabilities, noncurrent |
|
|
12,093 |
|
|
Total operating lease liabilities |
|
$ |
18,145 |
|
Future minimum payments under non-cancelable operating leases with initial terms of one year or more consisted of the following as of December 31, 2019 in accordance with ASC Topic 840 (in thousands):
|
Year Ending December 31, |
|
|
|
|
|
2020 |
|
$ |
5,509 |
|
|
2021 |
|
|
4,909 |
|
|
2022 |
|
|
3,204 |
|
|
2023 |
|
|
3,026 |
|
|
2024 |
|
|
2,746 |
|
|
Thereafter |
|
|
699 |
|
|
Total future minimum lease payments |
|
$ |
20,093 |
|
In accordance with ASC Topic 840, rent expense was $7.2 million and $5.7 million for the years ended December 31, 2019 and 2018. Certain of the Company’s lease agreements contain escalation clauses, and accordingly, the Company records the rent expense on a straight-line basis over the lease term. Deferred rent under ASC Topic ASC 840 is recorded within “Accrued expenses” in the consolidated balance sheet.
11. Redeemable Convertible Preferred Stock and Stockholders’ Equity (Deficit)
Redeemable Convertible Preferred Stock
As of December 31, 2019, the Company had eight outstanding series of redeemable convertible preferred stock (collectively the “Series Preferred”). The Company classified its Series B through H Preferred Stock (collectively the “Senior Preferred Stock”) as temporary equity within the Company’s consolidated balance sheet as of December 31, 2019 because the instruments contained redemption rights. The Company concluded that the Senior Preferred Stock were considered probable of becoming redeemable through November 2019 and therefore recorded accretion to their redemption values of $132.8 million during the year ended December 31, 2019. During December 2019, the Company ceased accretion of the Senior Preferred Stock to their redemption values due to a sufficiently high likelihood of an IPO requiring a conversion of the instruments into common stock.
As of December 31, 2019, the Company classified its Series A Preferred Stock as temporary equity within the Company’s consolidated balance sheets because the instrument contained liquidation features, including a liquidation preference in the event of a deemed liquidation event, that were not solely within the Company’s control. The Company did not adjust the carrying value of the Series A Preferred Stock to its redemption value because it was not probable that the Series A Preferred Stock would become redeemable.
100
VROOM, INC.
NOTES TO CONSOLIDATED FINANCIAL STATEMENTS
On January 8, 2020, the Company completed an additional closing of its Series H Preferred Stock whereby it sold and issued an aggregate of 1,964,766 shares of Series H Preferred Stock in exchange for gross proceeds of $26.7 million. The proceeds were used for general corporate purposes and business development.
Immediately upon closing of the IPO, the Company’s outstanding preferred stock was automatically converted into an aggregate of 85,533,394 shares of the Company’s common stock. On June 11, 2020, the Company amended its certificate of incorporation to authorize the issuance of up to 10,000,000 shares of Preferred Stock. As of December 31, 2020, there was no preferred stock issued or outstanding.
The authorized, issued and outstanding shares, issue price, conversion price, liquidation preference, and carrying value of the Series Preferred as of December 31, 2019 were as follows:
|
|
|
As of December 31, 2019 |
|
|||||||||||||||||||||
|
|
|
(in thousands, except share and per share amounts) |
|
|||||||||||||||||||||
|
|
|
Shares authorized |
|
|
Shares issued and outstanding |
|
|
Issue price |
|
|
Per share conversion price |
|
|
Liquidation preference |
|
|
Carrying value |
|
||||||
|
Series A |
|
|
3,983,996 |
|
|
|
3,983,996 |
|
|
$ |
1.61 |
|
|
$ |
1.61 |
|
|
$ |
6,419 |
|
|
$ |
6,167 |
|
|
Series B |
|
|
4,716,484 |
|
|
|
4,716,484 |
|
|
|
2.48 |
|
|
|
2.48 |
|
|
|
11,709 |
|
|
|
42,425 |
|
|
Series C |
|
|
9,134,242 |
|
|
|
9,134,242 |
|
|
|
5.93 |
|
|
|
5.93 |
|
|
|
54,209 |
|
|
|
88,739 |
|
|
Series D |
|
|
14,431,136 |
|
|
|
14,431,136 |
|
|
|
6.58 |
|
|
|
6.58 |
|
|
|
95,000 |
|
|
|
142,724 |
|
|
Series E |
|
|
6,163,792 |
|
|
|
6,163,792 |
|
|
|
8.11 |
|
|
|
8.11 |
|
|
|
50,000 |
|
|
|
64,042 |
|
|
Series F |
|
|
12,705,580 |
|
|
|
12,115,610 |
|
|
|
8.53 |
|
|
|
8.53 |
|
|
|
103,346 |
|
|
|
127,820 |
|
|
Series G |
|
|
16,280,040 |
|
|
|
16,280,040 |
|
|
|
8.98 |
|
|
|
8.98 |
|
|
|
146,113 |
|
|
|
174,764 |
|
|
Series H |
|
|
18,708,094 |
|
|
|
16,743,328 |
|
|
|
13.60 |
|
|
|
13.60 |
|
|
|
227,651 |
|
|
|
227,651 |
|
|
|
|
|
86,123,364 |
|
|
|
83,568,628 |
|
|
|
|
|
|
|
|
|
|
$ |
694,447 |
|
|
$ |
874,332 |
|
Common Stock
On June 11, 2020, the Company amended its certificate of incorporation to effect a 2-for-1 forward stock split of shares of the Company’s outstanding common stock, such that each share of common stock, $0.001 par value became two shares of common stock, $0.001 par value per share. The shares of common stock authorized for issuance was increased to 500,000,000. Each share of common stock entitles the holder to one vote on all matters submitted to a vote of the Company’s stockholders.
Warrants
In connection with the offering of shares of Series B Preferred Stock, the Company issued warrants to an investor in return for providing ongoing advisory services (“Series B Warrants”). The Series B Warrants allowed the investor to purchase up to 161,136 shares of common stock with an exercise price of $0.72 per share. The Series B Warrants vested in equal monthly installments through October 1, 2017. Upon the closing of the IPO, all of the Series B Warrants were exercised cashless by the holder which resulted in the net issuance of 155,862 shares of the Company’s common stock.
In August 2017, the Company issued a warrant (the “Series F Preferred Stock Warrant”) which allowed the holders to purchase up to 589,970 shares of the Company’s Series F Preferred Stock, or common stock upon conversion of the Company’s preferred stock into common stock, with an exercise price of $8.53 per share. The holders exercised the warrant on June 23, 2020 on a cashless basis, which resulted in the net issuance of 480,250 shares of the Company’s common stock. Prior to the conversion of the Company’s preferred stock into common stock, the Series F Preferred Stock Warrant was classified as a liability due to the contingent redemption features of the Series F Preferred Stock and was measured at fair value at each reporting date. Refer to Note 13 – Financial Instruments and Fair Value Measurements.
12. Stock-based Compensation
On May 28, 2020, the Company adopted the 2020 Incentive Award Plan (“the 2020 Plan”), which authorized the issuance of (i) up to 3,019,108 shares of the Company’s common stock, (ii) up to 4% of an annual increase on the first day of each year beginning on January 1, 2022 and ending on January 1, 2030, and (iii) any shares of the Company’s common stock subject to awards under the 2014 Plan which are forfeited or lapse unexercised and which following the effective date are not issued under the 2014 Plan. Awards may be issued in the form of restricted stock units, restricted stock, stock
101
VROOM, INC.
NOTES TO CONSOLIDATED FINANCIAL STATEMENTS
appreciation rights, and stock options. As of December 31, 2020, there were 3,185,964 shares available for future issuance under the 2020 Plan.
Stock Options
The following table summarizes stock option activity for the year ended December 31, 2020:
|
|
|
Shares |
|
|
Weighted Average Exercise Price |
|
|
Weighted Average Remaining Contractual Life |
|
|||
|
Outstanding as of December 31, 2019 |
|
|
6,340,000 |
|
|
$ |
3.92 |
|
|
|
8.22 |
|
|
Granted |
|
|
420,500 |
|
|
|
10.46 |
|
|
|
|
|
|
Exercised |
|
|
(598,406 |
) |
|
|
3.91 |
|
|
|
|
|
|
Forfeited / cancelled |
|
|
(544,526 |
) |
|
|
4.48 |
|
|
|
|
|
|
Outstanding as of December 31, 2020 |
|
|
5,617,568 |
|
|
$ |
4.35 |
|
|
|
7.33 |
|
|
Vested and exercisable as of December 31, 2019 |
|
|
2,684,160 |
|
|
$ |
3.58 |
|
|
|
7.41 |
|
|
Vested and exercisable as of December 31, 2020 |
|
|
3,449,606 |
|
|
$ |
3.83 |
|
|
|
6.74 |
|
The Company recognized $2.2 million, $2.6 million, and $1.0 million of stock-based compensation expense related to stock options for the years ended December 31, 2020, 2019, and 2018, respectively. As of December 31, 2020 and 2019, the Company had $3.5 million and $5.2 million, respectively, of unrecognized stock-based compensation expense that is expected to be recognized over a weighted-average period of 2.2 years and 2.6 years, respectively.
The grant date fair value of stock options granted during the year ended December 31, 2020 was estimated at the time of grant using the Black-Scholes option-pricing model and utilized the following weighted average assumptions:
|
|
|
Year Ended December 31, 2020 |
|
|
|
Fair value of common stock (per share) |
|
$ |
10.46 |
|
|
Expected term (in years) |
|
5.9 — 6.3 |
|
|
|
Risk-free interest rate |
|
1.7% |
|
|
|
Expected volatility |
|
36.3% — 36.6% |
|
|
|
Dividend yield |
|
—% |
|
|
The weighted average fair value of stock options granted during the year ended December 31, 2020 was estimated to be $3.97 per share. The aggregate intrinsic value of options exercised during the year ended December 31, 2020 was $22.4 million, and the aggregate intrinsic value of options outstanding and options exercisable as of December 31, 2020 was $205.7 million and $128.1 million, respectively.
RSUs
The following table summarizes activity for restricted stock units (“RSUs”) for the year ended December 31, 2020:
|
|
|
Shares |
|
|
Weighted Average Grant Date Fair Value per Share |
|
||
|
Unvested and outstanding as of December 31, 2019 |
|
|
408,000 |
|
|
$ |
4.01 |
|
|
Granted |
|
|
2,073,006 |
|
|
|
12.06 |
|
|
Vested |
|
|
(237,334 |
) |
|
|
3.86 |
|
|
Forfeited / cancelled |
|
|
(8,230 |
) |
|
|
11.86 |
|
|
Unvested and outstanding as of December 31, 2020 |
|
|
2,235,442 |
|
|
$ |
11.46 |
|
The Company recognized $10.9 million, $0.1 million, and $0.1 million of stock-based compensation expense related to RSUs for the years ended December 31, 2020, 2019, and 2018, respectively. As of December 31, 2020 and 2019, the Company had $15.4 million and $1.3 million, respectively, of unrecognized stock-based compensation expense that is expected to be recognized over a weighted-average period of 1.8 years and 2.4 years, respectively.
102
VROOM, INC.
NOTES TO CONSOLIDATED FINANCIAL STATEMENTS
As a result of completing its IPO in June 2020, the Company commenced the recognition of compensation expense for 510,278 RSUs that vest upon the occurrence of a liquidity event, which includes an IPO, and continuous service that generally ranges from 12 to 48 months.
In February 2020, the Company granted 367,782 RSUs to its chief executive officer that vest upon the achievement of performance-based conditions, which includes Revenue and EBITDA targets for fiscal year 2022, and the achievement of a liquidity event, which includes a change of control or an IPO. As a result of completing its IPO in June 2020, and the probability of achieving the performance-based conditions, the Company commenced recognition of compensation expense.
Certain of the Company’s RSU grants are subject to acceleration upon a change of control and termination within 12 months, and upon death, disability, retirement and certain “good leaver” circumstances.
RSAs
During the years ended December 31, 2014 and 2015, the Company granted awards of 4,751,874 shares of restricted common stock (the “RSAs”).
The following table summarizes the activity related to the Company’s RSAs for the year ended December 31, 2020:
|
|
|
Shares |
|
|
|
Unvested at December 31, 2019 |
|
|
272,868 |
|
|
Vested |
|
|
(272,868 |
) |
|
Unvested at December 31, 2020 |
|
|
— |
|
For the years ended December 31, 2020, 2019, and 2018, the expense related to the RSAs was $0.2 million, $0.0 million and $0.1 million, respectively. As of December 31, 2020, there was no remaining unrecognized stock-based compensation expense related to the RSAs.
13. Financial Instruments and Fair Value Measurements
U.S. GAAP defines fair value as the price that would be received from selling an asset or paid to transfer a liability in the principal or most advantageous market for the asset or liability in an orderly transaction between market participants at the measurement date. These estimates are subjective in nature and involve uncertainties and matters of judgment, and therefore cannot be determined with precision. U.S. GAAP establishes a fair value hierarchy which requires an entity to maximize the use of observable inputs and minimize the use of unobservable inputs when measuring fair value and establishes the following three levels of inputs that may be used to measure fair value:
Level 1—Quoted prices in active markets for identical assets or liabilities
Level 2—Observable inputs other than Level 1 prices such as quoted prices for similar assets or liabilities; quoted market prices in markets that are not active; or model-derived valuations or other inputs that are observable or can be corroborated by observable market data for substantially the full term of the assets or liabilities
Level 3—Unobservable inputs that are supported by little or no market activity and that are significant to the fair value of the assets or liabilities
103
VROOM, INC.
NOTES TO CONSOLIDATED FINANCIAL STATEMENTS
Items Measured at Fair Value on a Recurring Basis
The following tables present the Company’s financial assets and liabilities measured at fair value on a recurring basis (in thousands):
|
` |
|
As of December 31, 2020 |
|
|||||||||||||
|
|
|
Level 1 |
|
|
Level 2 |
|
|
Level 3 |
|
|
Total |
|
||||
|
Financial Assets |
|
|
|
|
|
|
|
|
|
|
|
|
|
|
|
|
|
Cash and cash equivalents: |
|
|
|
|
|
|
|
|
|
|
|
|
|
|
|
|
|
Money market funds |
|
$ |
814,681 |
|
|
$ |
— |
|
|
$ |
— |
|
|
$ |
— |
|
|
Total financial assets |
|
$ |
814,681 |
|
|
$ |
— |
|
|
$ |
— |
|
|
$ |
— |
|
|
|
|
|
|
|
|
|
|
|
|
|
|
|
|
|
|
|
|
` |
|
As of December 31, 2019 |
|
|||||||||||||
|
|
|
Level 1 |
|
|
Level 2 |
|
|
Level 3 |
|
|
Total |
|
||||
|
Financial Assets |
|
|
|
|
|
|
|
|
|
|
|
|
|
|
|
|
|
Cash and cash equivalents: |
|
|
|
|
|
|
|
|
|
|
|
|
|
|
|
|
|
Money market funds |
|
$ |
70,059 |
|
|
$ |
— |
|
|
$ |
— |
|
|
$ |
— |
|
|
Total financial assets |
|
$ |
70,059 |
|
|
$ |
— |
|
|
$ |
— |
|
|
$ |
— |
|
|
Financial Liabilities |
|
|
|
|
|
|
|
|
|
|
|
|
|
|
|
|
|
Other long-term liabilities: |
|
|
|
|
|
|
|
|
|
|
|
|
|
|
|
|
|
Series F Preferred Stock Warrant |
|
|
— |
|
|
|
— |
|
|
|
1,403 |
|
|
|
1,403 |
|
|
Total financial liabilities |
|
$ |
— |
|
|
$ |
— |
|
|
$ |
1,403 |
|
|
$ |
1,403 |
|
The following table presents a reconciliation of the Series F Preferred Stock Warrant, which was measured at fair value using Level 3 inputs (in thousands):
|
|
|
Series F Preferred Stock Warrant |
|
|
|
Balance as of December 31, 2019 |
|
$ |
1,403 |
|
|
Change in fair value |
|
|
20,470 |
|
|
Conversion to common stock warrant |
|
|
(21,873 |
) |
|
Balance as of December 31, 2020 |
|
$ |
— |
|
Prior to the closing of the IPO on June 11, 2020 and the related conversion of the Company’s preferred stock into common stock, the Company estimated the fair value of the Series F Preferred Stock Warrant based on the Black-Scholes option-pricing model which utilized the value of shares sold in the Company’s latest preferred stock financing and allocated the estimated equity value of the Company to each class of the Company’s outstanding securities using an option-pricing back-solve model. Upon the closing of the IPO, the Series F Preferred Stock Warrant converted into a common stock warrant and the warrant liability was remeasured at fair value for the last time based on the quoted price of the Company’s publicly traded common stock. On June 23, 2020, the holders exercised the Series F Preferred Stock Warrant.
Fair Value of Financial Instruments
The carrying amounts of restricted cash, accounts receivable, accounts payable and accrued liabilities approximate fair value due to their short-term nature. The carrying value of the 2020 Vehicle Floorplan Facility was determined to approximate fair value due to its short-term duration and variable interest rate that approximates prevailing interest rates as of each reporting period.
14. Segment Information
The Company has three reportable segments: Ecommerce, Wholesale, and TDA. No operating segments have been aggregated to form the reportable segments. The Company determined its operating segments based on how the chief operating decision maker (“CODM”) reviews the Company’s operating results in assessing performance and allocating resources. The CODM reviews revenue and gross profit for each of the reportable segments. Gross profit is defined as revenue less cost of sales incurred by the segment. The CODM does not evaluate operating segments using asset information as these are managed on an enterprise wide group basis. Accordingly, the Company does not report
104
VROOM, INC.
NOTES TO CONSOLIDATED FINANCIAL STATEMENTS
segment asset information. As of December 31, 2020, 2019, and 2018, the Company did not have any assets located outside of the United States.
The Ecommerce reportable segment represents retail sales of used vehicles through the Company’s ecommerce platform and fees earned on sales of value-added products associated with those vehicle sales. The Wholesale reportable segment represents sales of used vehicles through wholesale channels. The TDA reportable segment represents retail sales of used vehicles from TDA and fees earned on sales of value-added products associated with those vehicle sales.
Information about the Company’s reportable segments are as follows (in thousands):
|
|
|
Year Ended December 31, 2020 |
|
|||||||||||||
|
|
|
Ecommerce |
|
|
Wholesale |
|
|
TDA |
|
|
Consolidated |
|
||||
|
Revenues from external customers |
|
$ |
915,451 |
|
|
$ |
245,580 |
|
|
$ |
196,669 |
|
|
$ |
1,357,700 |
|
|
Gross profit (loss) |
|
$ |
60,861 |
|
|
$ |
(1,432 |
) |
|
$ |
12,116 |
|
|
$ |
71,545 |
|
|
|
|
|
|
|
|
|
|
|
|
|
|
|
|
|
|
|
|
|
|
Year Ended December 31, 2019 |
|
|||||||||||||
|
|
|
Ecommerce |
|
|
Wholesale |
|
|
TDA |
|
|
Consolidated |
|
||||
|
Revenues from external customers |
|
$ |
588,114 |
|
|
$ |
213,464 |
|
|
$ |
390,243 |
|
|
$ |
1,191,821 |
|
|
Gross profit |
|
$ |
32,127 |
|
|
$ |
340 |
|
|
$ |
25,392 |
|
|
$ |
57,859 |
|
|
|
|
|
|
|
|
|
|
|
|
|
|
|
|
|
|
|
|
|
|
Year Ended December 31, 2018 |
|
|||||||||||||
|
|
|
Ecommerce |
|
|
Wholesale |
|
|
TDA |
|
|
Consolidated |
|
||||
|
Revenues from external customers |
|
$ |
301,172 |
|
|
$ |
174,514 |
|
|
$ |
379,743 |
|
|
$ |
855,429 |
|
|
Gross profit |
|
$ |
22,425 |
|
|
$ |
3,257 |
|
|
$ |
35,125 |
|
|
$ |
60,807 |
|
The reconciliation between reportable segment gross profit to consolidated loss before provision for income taxes is as follows (in thousands):
|
|
|
Year Ended December 31, |
|
|||||||||
|
|
|
2020 |
|
|
2019 |
|
|
2018 |
|
|||
|
Segment gross profit |
|
$ |
71,545 |
|
|
$ |
57,859 |
|
|
$ |
60,807 |
|
|
Selling, general and administrative expenses |
|
|
245,546 |
|
|
|
184,988 |
|
|
|
133,842 |
|
|
Depreciation and amortization |
|
|
4,598 |
|
|
|
6,019 |
|
|
|
6,857 |
|
|
Interest expense |
|
|
9,656 |
|
|
|
14,596 |
|
|
|
8,513 |
|
|
Interest Income |
|
|
(5,896 |
) |
|
|
(5,607 |
) |
|
|
(3,135 |
) |
|
Revaluation of preferred stock warrant |
|
|
20,470 |
|
|
|
769 |
|
|
|
174 |
|
|
Other income, net |
|
|
(114 |
) |
|
|
(96 |
) |
|
|
(495 |
) |
|
Loss before provision for income taxes |
|
$ |
(202,715 |
) |
|
$ |
(142,810 |
) |
|
$ |
(84,949 |
) |
105
VROOM, INC.
NOTES TO CONSOLIDATED FINANCIAL STATEMENTS
15. Income Taxes
Income Tax Provision
The components of the provision for income taxes are as follows for the years ended December 31, 2020, 2019, and 2018 (in thousands):
|
|
|
Year Ended December 31, |
|
|||||||||
|
|
|
2020 |
|
|
2019 |
|
|
2018 |
|
|||
|
Current: |
|
|
|
|
|
|
|
|
|
|
|
|
|
Federal |
|
$ |
— |
|
|
$ |
— |
|
|
$ |
— |
|
|
State and local |
|
|
84 |
|
|
|
168 |
|
|
|
229 |
|
|
Total current tax expense |
|
|
84 |
|
|
|
168 |
|
|
|
229 |
|
|
Deferred tax (benefit): |
|
|
|
|
|
|
|
|
|
|
|
|
|
Federal |
|
|
— |
|
|
|
— |
|
|
|
— |
|
|
State and local |
|
|
— |
|
|
|
— |
|
|
|
— |
|
|
Total deferred tax (benefit) |
|
|
— |
|
|
|
— |
|
|
|
— |
|
|
Provision for income taxes |
|
$ |
84 |
|
|
$ |
168 |
|
|
$ |
229 |
|
Pretax loss for all periods presented were classified as Domestic.
Tax Rate Reconciliation
The Company’s effective tax rate for the years ended December 31, 2020, 2019, and 2018 was (0.04)%, (0.12)%, and (0.27)%, respectively.
A reconciliation of the provision for income taxes at the statutory rate to the amount reflected in the consolidated statements of operations is as follows (in thousands):
|
|
|
Year Ended December 31, |
|
|||||||||
|
|
|
2020 |
|
|
2019 |
|
|
2018 |
|
|||
|
Income taxes at statutory rate |
|
$ |
(42,570 |
) |
|
$ |
(29,990 |
) |
|
$ |
(17,839 |
) |
|
State income taxes, net of federal benefit |
|
|
(5,417 |
) |
|
|
(1,096 |
) |
|
|
180 |
|
|
Permanent differences |
|
|
1,264 |
|
|
|
772 |
|
|
|
229 |
|
|
Change in valuation allowance |
|
|
46,901 |
|
|
|
30,051 |
|
|
|
17,756 |
|
|
Other |
|
|
(94 |
) |
|
|
431 |
|
|
|
(97 |
) |
|
Provision for income taxes |
|
$ |
84 |
|
|
$ |
168 |
|
|
$ |
229 |
|
Deferred Tax Assets (Liabilities)
The Company computes income taxes using the liability method. This method requires recognition of deferred tax assets and liabilities, measured by enacted rates, attributable to temporary differences between the financial statements and the income tax basis of assets and liabilities. In assessing the realizability of deferred tax assets, the Company considers whether it is more likely than not that certain deferred tax assets will be realized. The ultimate realization of deferred tax assets is dependent upon the generation of future taxable income in those specific jurisdictions prior to the dates on which such net operating losses expire. The Company maintained a full valuation allowance against its net deferred tax assets for December 31, 2020 and 2019 because the Company has determined that is it more likely than not that these assets will not be fully realized based on a current evaluation of expected future taxable income and the Company is in a cumulative loss position. As of December 31, 2020 and 2019 the Valuation Allowance balance was $121.9 million and $75.0 million, respectively. The Valuation Allowance was $44.9 million and $27.5 million as of December 31, 2018 and January 1, 2018, respectively.
106
VROOM, INC.
NOTES TO CONSOLIDATED FINANCIAL STATEMENTS
Significant components of the Company’s deferred tax assets and liabilities are as follows (in thousands):
|
|
|
As of December 31, |
|
|||||
|
|
|
2020 |
|
|
2019 |
|
||
|
Deferred tax assets: |
|
|
|
|
|
|
|
|
|
Net operating loss carryforwards |
|
$ |
102,252 |
|
|
$ |
66,879 |
|
|
Inventory reserves |
|
|
12,409 |
|
|
|
5,911 |
|
|
Stock-based compensation |
|
|
3,119 |
|
|
|
840 |
|
|
Accrued Expense |
|
|
1,456 |
|
|
|
867 |
|
|
Depreciation |
|
|
— |
|
|
|
114 |
|
|
Right of Use Asset |
|
|
4,175 |
|
|
|
— |
|
|
Allowance for Doubtful Accounts |
|
|
1,809 |
|
|
|
173 |
|
|
Other |
|
|
836 |
|
|
|
423 |
|
|
Total deferred tax assets |
|
|
126,056 |
|
|
|
75,207 |
|
|
Less: valuation allowance |
|
|
(121,859 |
) |
|
|
(74,959 |
) |
|
Net deferred tax assets |
|
|
4,197 |
|
|
|
248 |
|
|
Deferred tax liabilities: |
|
|
|
|
|
|
|
|
|
Intangible amortization |
|
|
(225 |
) |
|
|
(248 |
) |
|
Depreciation |
|
|
(29 |
) |
|
|
— |
|
|
Lease Liability |
|
|
(3,943 |
) |
|
|
— |
|
|
Net deferred tax liabilities |
|
|
(4,197 |
) |
|
|
(248 |
) |
|
Net deferred income taxes |
|
$ |
— |
|
|
$ |
— |
|
Net Operating Losses
As of December 31, 2020, the Company had total net operating loss carryforwards for U.S. federal income tax purposes of $462.1 million, of which $126.2 million expire from 2034 through 2037 and $335.9 million do not expire. The Company has net operating loss carryforwards for state income tax purposes of $78.7 million, which expire from 2034 through 2040.
The Company is subject to tax in the United States and many state and local jurisdictions. The Company, with certain exceptions, is no longer subject to income tax examinations by U.S. federal, state and local for tax years 2015 and prior. The company is not currently under audit for any US federal or state income tax audits.
The Internal Revenue Code (IRC) Section 382 provides for a limitation of the annual use of net operating loss and tax credit carryforwards following certain ownership changes (as defined by the IRC Section 382) that limits the Company’s ability to utilize these carryforwards. The Company completed a Section 382 study to determine the applicable limitation, if any. It was determined that the Company has undergone three ownership changes. There were ownership changes in July 2013, November 2014 and July 2015 which substantially limit the use of the net operating losses generated before the change in control. The Company is still evaluating to see if the shareholder lock-up period expiration in December 2020 associated with the IPO, resulted in a change in control.
Uncertain Tax Positions
The Company has not identified any uncertain tax positions as of December 31, 2020 or 2019. Any interest and penalties related to uncertain tax positions shall be recorded as a component of income tax expense. To date, no interest or penalties have been accrued in relation to uncertain tax positions.
107
VROOM, INC.
NOTES TO CONSOLIDATED FINANCIAL STATEMENTS
16. Net Loss Per Share
The following table sets forth the computation of basic and diluted net loss per share attributable to common stockholders:
|
|
|
Year Ended December 31, |
|
|||||||||
|
(in thousands, except share and per share amounts) |
|
2020 |
|
|
2019 |
|
|
2018 |
|
|||
|
Net loss |
|
$ |
(202,799 |
) |
|
$ |
(142,978 |
) |
|
$ |
(85,178 |
) |
|
Accretion of redeemable convertible preferred stock |
|
|
— |
|
|
|
(132,750 |
) |
|
|
(13,036 |
) |
|
Net loss attributable to common stockholders |
|
$ |
(202,799 |
) |
|
$ |
(275,728 |
) |
|
$ |
(98,214 |
) |
|
Weighted-average number of shares outstanding used to compute net loss per share attributable to common stockholders, basic and diluted |
|
|
73,345,569 |
|
|
|
8,605,962 |
|
|
|
8,540,778 |
|
|
Net loss per share attributable to common stockholders, basic and diluted |
|
$ |
(2.76 |
) |
|
$ |
(32.04 |
) |
|
$ |
(11.50 |
) |
The following potentially dilutive shares were not included in the calculation of diluted shares outstanding for the periods presented as the effect would have been anti-dilutive:
|
|
|
Year Ended December 31, |
|
|||||||||
|
|
|
2020 |
|
|
2019 |
|
|
2018 |
|
|||
|
Redeemable convertible preferred stock |
|
|
— |
|
|
|
83,568,628 |
|
|
|
66,825,300 |
|
|
Warrants |
|
|
— |
|
|
|
161,136 |
|
|
|
161,136 |
|
|
Stock options |
|
|
5,617,568 |
|
|
|
6,110,000 |
|
|
|
2,961,008 |
|
|
Restricted stock awards |
|
|
— |
|
|
|
3,249,382 |
|
|
|
3,873,214 |
|
|
Restricted stock units |
|
|
2,235,442 |
|
|
|
408,000 |
|
|
|
100,000 |
|
|
Total |
|
|
7,853,010 |
|
|
|
93,497,146 |
|
|
|
73,920,658 |
|
17. Related Party Transactions
Management Services Agreement
In July 2015, the Company entered into a management services agreement (“MSA”) with Catterton Management Company, L.L.C. (“Catterton Management”), an affiliate of L Catterton (“Catterton”), a holder of more than 5% of the Company’s outstanding capital stock, pursuant to which Catterton Management agreed to provide consulting services on certain business and financial matters. Under the MSA, the Company agreed to pay Catterton Management an annual fee of $0.3 million until the expiration of the MSA upon the earlier of (i) termination by mutual consent of the parties and (ii) such time that Catterton and/or its affiliates cease to be one of the Company’s stockholders. For the years ended December 31, 2020, 2019, and 2018, payments of the annual fees were waived. In May 2020, the MSA was terminated.
AutoNation Reconditioning Agreement
In January 2019, the Company entered into a vendor agreement (“Vendor Agreement”) with AutoNation, Inc. (“AutoNation”), an affiliate of Auto Holdings, Inc., a holder of more than 5% of the Company’s outstanding capital stock, pursuant to which AutoNation agreed to provide certain reconditioning and repair services for vehicles owned by the Company. Amounts due under the Vendor Agreement for parts supplied and services performed by AutoNation become due and payable as they accrued. For the year ended December 31, 2019, the Company incurred $1.1 million of costs under the Vendor Agreement. The Vendor Agreement was terminated in February 2020.
108
VROOM, INC.
NOTES TO CONSOLIDATED FINANCIAL STATEMENTS
18. Subsequent Event
On January 7, 2021, the Company completed the acquisition of the CarStory business, a leader in AI-powered analytics and digital services for automotive retail, through the acquisition of 100% of Vast Holdings, Inc. Leveraging its machine learning, CarStory brings predictive market data to Vroom’s national ecommerce and vehicle operations platform. As part of Vroom, we expect CarStory to continue to offer its digital retailing services to dealers, automotive financial services companies and others in the automotive industry.
Pursuant to the acquisition agreement, the aggregate purchase price was approximately $120.0 million, comprised of cash and shares of the Company’s common stock. On the closing date, the Company paid $77.5 million in cash and issued 1,072,117 shares of common stock. The purchase price is subject to adjustment for certain working capital adjustments and post-closing indemnities.
Due to the proximity of the acquisition date to the Company’s filing of its annual report on Form 10-K for the year ended December 31, 2020, the initial accounting for the CarStory business combination is incomplete, and therefore the Company is unable to disclose certain information required by ASC 805, Business Combinations, including the provisional amounts recognized as of the acquisition date for each major class of assets acquired and liabilities assumed and goodwill.
109
Item 9. Changes in and Disagreements with Accountants on Accounting and Financial Disclosure
Not applicable.
Item 9A. Controls and Procedures
Limitations on effectiveness of controls and procedures
In designing and evaluating our disclosure controls and procedures, management recognizes that any controls and procedures, no matter how well designed and operated, can provide only reasonable assurance of achieving the desired control objectives. In addition, the design of disclosure controls and procedures must reflect the fact that there are resource constraints and that management is required to apply judgment in evaluating the benefits of possible controls and procedures relative to their costs.
Evaluation of Disclosure Controls and Procedures
Our management, with the participation of our principal executive officer and principal financial officer, evaluated, as of the end of the period covered by this Annual Report on Form 10-K, the effectiveness of our disclosure controls and procedures (as defined in Rules 13a-15(e) and 15d-15(e) under the Exchange Act). Based on that evaluation, and as a result of the material weaknesses described below, our principal executive officer and principal financial officer concluded that, as of December 31, 2020, our disclosure controls and procedures were not effective. In light of this fact, our management has performed additional analyses, reconciliations, and other post-closing procedures and has concluded that, notwithstanding the material weaknesses in our internal control over financial reporting, the consolidated financial statements for the periods covered by and included in this Annual Report on Form 10-K fairly state, in all material respects, our financial position, results of operations and cash flows for the periods presented in conformity with U.S. GAAP.
Management's Annual Report on Internal Control Over Financial Reporting
This Annual Report on Form 10-K does not include a report of management's assessment regarding internal control over financial reporting or an attestation report of our independent registered public accounting firm due to a transition period established by the rules of the SEC for newly public companies.
Material Weaknesses
A material weakness is a deficiency, or combination of deficiencies, in internal control over financial reporting such that there is a reasonable possibility that a material misstatement of annual or interim financial statements will not be prevented or detected on a timely basis. Internal control over financial reporting is a process designed to provide reasonable assurance regarding the reliability of financial reporting and the preparation of financial statements in accordance with GAAP. In connection with our audit of consolidated financial statements for the year ended December 31, 2018, we identified material weaknesses in our internal control over financial reporting. We did not design or maintain an effective control environment commensurate with our financial reporting requirements. Specifically, we lacked a sufficient complement of personnel with (i) an appropriate level of accounting knowledge, training and experience to appropriately analyze, record and disclose accounting matters timely and accurately, and (ii) an appropriate level of knowledge and experience to establish effective information technology processes and controls. This material weakness contributed to the following material weaknesses:
|
|
• |
we did not design and maintain adequate controls over the preparation and review of certain account reconciliations and journal entries. Specifically, we did not design and maintain controls to ensure (i) the appropriate segregation of duties in the preparation and review of account reconciliations and journal entries and (ii) account reconciliations and journal entries were reviewed at the appropriate level of precision. |
|
|
• |
we did not design and maintain effective controls over certain information technology general controls for information systems and applications that are relevant to the preparation of the consolidated financial statements. Specifically, we did not design and maintain sufficient user and privileged access controls to ensure appropriate segregation of duties and adequate restricted user access to financial applications; program change management controls to ensure that IT program and data changes affecting financial IT applications and underlying accounting records are identified, tested, authorized and implemented appropriately; or computer operations controls as well as testing and approval controls for program development. |
110
The control deficiencies described above did not result in a misstatement to our annual or interim consolidated financial statements. However, each of the control deficiencies described above, if not remediated, could result in a misstatement of one or more account balances or disclosures that would result in a material misstatement to the annual or interim consolidated financial statements that would not be prevented or detected, and, accordingly, we determined that these control deficiencies constitute material weaknesses.
We have concluded that these material weaknesses arose because, as a private company, we did not have the necessary business processes, systems, personnel and related internal controls.
Remediation of Material Weakness
In the year ended December 31, 2019, we undertook measures to address material weaknesses in our internal controls. In particular, we (i) hired additional finance and accounting personnel with expertise in preparation of financial statements and account reconciliations; (ii) further developed and documented our accounting policies; and (iii) hired a director responsible for implementation of information technology general controls. In addition, in the year ended December 31, 2020, we continued to take steps to remediate these material weaknesses, including:
|
|
• |
hiring additional qualified accounting, financial reporting and information technology personnel with public company experience; |
|
|
• |
providing additional training for our personnel on internal control over financial reporting; |
|
|
• |
implementing new financial systems and processes; |
|
|
• |
implementing additional review controls and processes and requiring timely account reconciliation and analyses; |
|
|
• |
implementing processes and controls to better identify and manage segregation of duties; and |
|
|
• |
engaging an external advisor to assist with evaluating and documenting the design and operating effectiveness of internal controls and assisting with the remediation of deficiencies, as necessary. |
Changes in Internal Control over Financial Reporting
We are taking steps, as described above, to remediate the material weaknesses relating to our internal control over financial reporting. However, we will not be able to fully remediate these material weaknesses until these steps have been completed and the related internal controls have been operating effectively for a sufficient period of time. Except as otherwise described herein, there was no change in our internal control over financial reporting (as defined in Rules 13a-15(f) and 15d-15(f) under the Exchange Act) during the quarter ended December 31, 2020 that has materially affected, or is reasonably likely to materially affect, our internal control over financial reporting.
As we approach the completion of our first full year as a public company, Mr. Adam Valkin indicated to us on March 2, 2021 that he plans to step down as a director effective as of our 2021 Annual Meeting of Stockholders, and therefore he will not stand for re-election at that meeting.
111
Item 10. Directors, Executive Officers, and Corporate Governance
We have adopted a written code of ethics, entitled “Code of Business Conduct and Ethics,” that applies to all of our directors, executive officers and employees, including our principal executive officer, principal financial officer, principal accounting officer and controller, or persons performing similar functions. We make available our code of ethics free of charge through our investor relations website which is located at ir.vroom.com. We intend to post on our website all disclosures that are required by law or Nasdaq listing standards concerning any amendments to, or waivers from, any provision of our code of ethics.
The information concerning our executive offers and directors required by this Item 10 is contained under the caption “Information about our Executive Officers and Directors” at the end of Part I of this Annual Report on Form 10-K. The remaining information required by this item is incorporated by reference to Vroom’s Proxy Statement for its 2021 Annual Meeting of Stockholders to be filed with the SEC within 120 days after the end of the fiscal year ended December 31, 2020.
Item 11. Executive Compensation
The information required by this item is incorporated by reference to Vroom’s Proxy Statement for its 2021 Annual Meeting of Stockholders to be filed with the SEC within 120 days after the end of the fiscal year ended December 31, 2020.
Item 12. Security Ownership of Certain Beneficial Owners and Management and Related Stockholder Matters
The information required by this item is incorporated by reference to Vroom’s Proxy Statement for its 2021 Annual Meeting of Stockholders to be filed with the SEC within 120 days after the end of the fiscal year ended December 31, 2020.
Item 13. Certain Relationships and Related Transactions, and Director Independence
The information required by this item is incorporated by reference to Vroom’s Proxy Statement for its 2021 Annual Meeting of Stockholders to be filed with the SEC within 120 days after the end of the fiscal year ended December 31, 2020.
Item 14. Principal Accounting Fees and Services
The information required by this item is incorporated by reference to Vroom’s Proxy Statement for its 2021 Annual Meeting of Stockholders to be filed with the SEC within 120 days after the end of the fiscal year ended December 31, 2020.
112
Item 15. Exhibits and Financial Statement Schedules
|
|
1. |
Financial Statements: The Consolidated Financial Statements of Vroom are set forth in Part II, Item 8 of this Annual Report on Form 10-K. |
|
|
2. |
Financial Statement Schedules: All financial statement schedules have been omitted because they are not applicable, not material or the required information is shown in Part II, Item 8 of this Annual Report on Form 10-K. |
|
|
3. |
Exhibits: The exhibits listed in the accompanying Exhibit Index are filed, furnished or incorporated by reference as part of this Annual Report on Form 10-K. |
113
|
Exhibit Number |
|
Exhibit Description |
|
Form |
|
File No. |
|
Exhibit |
|
Filing Date |
|
Filed Herewith |
Furnished Herewith |
|
|
|
|
|
|
|
|
|
|
|
|
|
|
|
|
|
|
|
|
|
|
|
|
|
|
|
|
|
|
|
10.9† |
|
Non-Employee Director Compensation Policy
|
|
S-1/A |
|
333-238482 |
|
10.4 |
|
June 1, 2020 |
|
|
|
|
10.10† |
|
|
S-1/A |
|
333-238482 |
|
10.5 |
|
June 1, 2020 |
|
|
|
|
|
|
|
|
|
|
|
|
|
|
|
|
|
|
|
|
10.11† |
|
|
|
|
|
|
|
|
|
|
X |
|
|
|
|
|
|
|
|
|
|
|
|
|
|
|
|
|
|
10.12 |
|
|
S-1/A |
|
333-238482 |
|
10.6 |
|
June 1, 2020 |
|
|
|
|
|
|
|
|
|
|
|
|
|
|
|
|
|
|
|
|
10.13 |
|
|
|
S-1/A |
|
333-248655 |
|
10.7 |
|
June 1, 2020 |
|
|
|
|
10.14 |
|
|
|
|
|
|
|
|
|
|
X |
|
|
|
|
|
|
|
|
|
|
|
|
|
|
|
|
|
|
10.15 |
|
|
|
|
|
|
|
|
|
|
|
X |
|
|
10.16 |
|
|
S-1/A |
|
333-248655 |
|
10.8 |
|
June 1, 2020 |
|
|
|
|
|
|
|
|
|
|
|
|
|
|
|
|
|
|
|
|
10.17 |
|
|
|
|
|
|
|
|
|
|
X |
|
|
|
|
|
|
|
|
|
|
|
|
|
|
|
|
|
|
10.18 |
|
|
|
|
|
|
|
|
|
|
X |
|
|
|
|
|
|
|
|
|
|
|
|
|
|
|
|
|
|
10.19 |
|
|
|
|
|
|
|
|
|
|
X |
|
|
|
|
|
|
|
|
|
|
|
|
|
|
|
|
|
|
10.20 |
|
|
S-1/A |
|
333-248655 |
|
10.9 |
|
June 1, 2020 |
|
|
|
114
|
Exhibit Number |
|
Exhibit Description |
|
Form |
|
File No. |
|
Exhibit |
|
Filing Date |
|
Filed Herewith |
Furnished Herewith |
|
|
|
|
|
|
|
|
|
|
|
|
|
|
|
|
10.21# |
|
|
S-1/A |
|
333-248655 |
|
10.10 |
|
May 18, 2020 |
|
|
|
|
|
|
|
|
|
|
|
|
|
|
|
|
|
|
|
|
10.22# |
|
|
|
10-Q |
|
001-39315 |
|
10.9 |
|
August 13, 2020 |
|
|
|
|
10.23# |
|
|
|
10-Q |
|
001-39315 |
|
10.1 |
|
November 12, 2020 |
|
|
|
|
10.24# |
|
|
S-1/A |
|
333-248655 |
|
10.11 |
|
June 1, 2020 |
|
|
|
|
|
|
|
|
|
|
|
|
|
|
|
|
|
|
|
|
10.25# |
|
|
|
|
|
|
|
|
|
|
X |
|
|
|
|
|
|
|
|
|
|
|
|
|
|
|
|
|
|
10.26# |
|
|
S-1/A |
|
333-248655 |
|
10.12 |
|
June 1, 2020 |
|
|
|
|
|
|
|
|
|
|
|
|
|
|
|
|
|
|
|
|
10.27† |
|
Employment Agreement, dated June 8, 2016, by and between Vroom, Inc. and Paul J. Hennessy |
|
S-1/A |
|
333-248655 |
|
10.13 |
|
June 1, 2020 |
|
|
|
|
|
|
|
|
|
|
|
|
|
|
|
|
|
|
|
10.28† |
|
Employment Offer Letter, dated October 15, 2018, by and between Vroom, Inc. and David K. Jones |
|
S-1/A |
|
333-248655 |
|
10.14 |
|
June 1, 2020 |
|
|
|
|
|
|
|
|
|
|
|
|
|
|
|
|
|
|
|
10.29† |
|
Employment Offer Letter, dated January 6, 2019, by and between Vroom, Inc. and Mark Roszkowski |
|
S-1/A |
|
333-248655 |
|
10.15 |
|
June 1, 2020 |
|
|
|
|
|
|
|
|
|
|
|
|
|
|
|
|
|
|
|
10.30† |
|
Employment Offer Letter, dated December 29, 2018, by and between Vroom, Inc. and Patricia Moran |
|
S-1/A |
|
333-248655 |
|
10.18 |
|
September 8, 2020 |
|
|
|
|
|
|
|
|
|
|
|
|
|
|
|
|
|
|
|
10.31† |
|
Employment Offer Letter, dated November 3, 2016, by and between Vroom, Inc. and Carol Denise Stott |
|
S-1/A |
|
333-248655 |
|
10.19 |
|
September 8, 2020 |
|
|
|
|
|
|
|
|
|
|
|
|
|
|
|
|
|
|
|
|
|
|
|
|
|
|
|
|
|
|
|
|
|
|
10.32† |
|
|
S-1/A |
|
333-248655 |
|
10.20 |
|
September 8, 2020 |
|
|
|
115
|
Exhibit Number |
|
Exhibit Description |
|
Form |
|
File No. |
|
Exhibit |
|
Filing Date |
|
Filed Herewith |
Furnished Herewith |
|
|
|
|
|
|
|
|
|
|
|
|
|
|
|
|
|
|
|
|
|
|
|
|
|
|
|
|
|
|
|
10.33† |
|
|
|
S-1/A |
|
333-248655 |
|
10.21 |
|
September 8, 2020 |
|
|
|
|
21.1 |
|
Subsidiaries of the Registrant
|
|
|
|
|
|
|
|
|
|
X |
|
|
23.1 |
|
|
|
|
|
|
|
|
|
|
X |
|
|
|
|
|
|
|
|
|
|
|
|
|
|
|
|
|
|
31.1 |
|
|
|
|
|
|
|
|
|
|
|
X |
|
|
|
|
|
|
|
|
|
|
|
|
|
|
|
|
|
31.2 |
|
|
|
|
|
|
|
|
|
|
X |
|
|
|
|
|
|
|
|
|
|
|
|
|
|
|
|
|
|
32.1 |
|
|
|
|
|
|
|
|
|
|
|
XX |
|
|
|
|
|
|
|
|
|
|
|
|
|
|
|
|
|
32.2 |
|
|
|
|
|
|
|
|
|
|
|
XX |
|
|
|
|
|
|
|
|
|
|
|
|
|
|
|
|
|
101.INS |
|
XBRL Instance Document |
|
|
|
|
|
|
|
|
|
|
X |
|
|
|
|
|
|
|
|
|
|
|
|
|
|
|
|
101.SCH |
|
XBRL Taxonomy Extension Schema Document |
|
|
|
|
|
|
|
|
|
|
X |
|
|
|
|
|
|
|
|
|
|
|
|
|
|
|
|
101.CAL |
|
XBRL Taxonomy Extension Calculation Linkbase Document |
|
|
|
|
|
|
|
|
|
|
X |
|
|
|
|
|
|
|
|
|
|
|
|
|
|
|
|
101.DEF |
|
XBRL Taxonomy Extension Definition Linkbase Document |
|
|
|
|
|
|
|
|
|
|
X |
|
|
|
|
|
|
|
|
|
|
|
|
|
|
|
|
101.LAB |
|
XBRL Taxonomy Extension Label Linkbase Document |
|
|
|
|
|
|
|
|
|
|
X |
|
|
|
|
|
|
|
|
|
|
|
|
|
|
|
|
101.PRE |
|
XBRL Taxonomy Extension Presentation Linkbase Document |
|
|
|
|
|
|
|
|
|
|
X |
†Indicates a management contract or compensatory plan or arrangement.
#Certain portions of this exhibit (indicated by “[***]”) have been omitted pursuant to Regulation S-K, Item (601)(b)(10).
None.
116
Pursuant to the requirements of the Securities Exchange Act of 1934, the registrant has duly caused this report to be signed on its behalf by the undersigned thereunto duly authorized.
|
|
|
Vroom, Inc. |
|
|
|
|
|
|
|
Date: March 3, 2021 |
|
By: |
/s/ Paul J. Hennessy |
|
|
|
|
Paul J. Hennessy |
|
|
|
|
Chief Executive Officer |
|
|
|
|
(principal executive officer) |
|
|
|
|
|
|
|
|
|
|
|
Date: March 3, 2021 |
|
By: |
/s/ David K Jones |
|
|
|
|
David K. Jones |
|
|
|
|
Chief Financial Officer |
|
|
|
|
(principal financial and accounting officer) |
Pursuant to the requirements of the Securities Exchange Act of 1934, this report has been signed below by the following persons on behalf of the registrant and in the capacities and on the dates indicated.
117