Attached files
| file | filename |
|---|---|
| 8-K - FORM 8-K - CALIFORNIA WATER SERVICE GROUP | tm217930d1_8k.htm |
| EX-99.1 - EXHIBIT 99.1 - CALIFORNIA WATER SERVICE GROUP | tm217930d1_ex99-1.htm |
Exhibit 99.2

0 Full Year & Fourth Quarter 2020 Results Presentation February 25, 2021

INVESTOR RELATIONS Such words as would, expects, intends, plans, believes, may, estimates, assumes, anticipates, projects, predicts, targets, fo rec asts or variations of such words or similar expressions are intended to identify forward - looking statements. The forward - looking statements are not guarant ees of future performance. They are subject to uncertainty and changes in circumstances. Actual results may vary materially from what is co nta ined in a forward - looking statement. Factors that may cause a result different than expected or anticipated include, but are not limited to: th e i mpact of the ongoing COVID - 19 pandemic and related public health measures; our ability to invest or apply the proceeds from the issuance of common st ock in an accretive manner ; governmental and regulatory commissions' decisions, including decisions on proper disposition of property; consequen ces of eminent domain actions relating to our water systems; changes in regulatory commissions' policies and procedures; the outcome and timeliness of regulatory commissions' actions concerning rate relief and other matters; increased risk of inverse condemnation losses as a result of c lim ate conditions; inability to renew leases to operate water systems owned by others on beneficial terms; changes in California State Water Resources Contro l B oard water quality standards; changes in environmental compliance and water quality requirements; electric power interruptions; housing and cust ome r growth; the impact of opposition to rate increases; our ability to recover costs; availability of water supplies; issues with the impleme nta tion, maintenance or security of our information technology systems; civil disturbances or terrorist threats or acts; the adequacy of our efforts to mitig ate physical and cyber security risks and threats; the ability of our enterprise risk management processes to identify or address risks adequately; labor rel ati ons matters as we negotiate with the unions; changes in customer water use patterns and the effects of conservation; our ability to complete, successfull y i ntegrate and achieve anticipated benefits form announced acquisitions; the impact of weather, climate, natural disasters, and actual or threatened pu blic health emergencies, including disease outbreaks, on our operations, water quality, water availability, water sales and operating results and the ade quacy of our emergency preparedness; restrictive covenants in or changes to the credit ratings on our current or future debt that could increase our fi nancing costs or affect our ability to borrow, make payments on debt or pay dividends; and, other risks and unforeseen events. When considering forward - loo king statements, you should keep in mind the cautionary statements included in this paragraph, as well as the annual 10 - K, Quarterly 10 - Q, and other reports filed from time - to - time with the Securities and Exchange Commission (SEC). The Company assumes no obligation to provide public updates of forwar d - looking statements. Forward - Looking Statements 1 This presentation contains forward - looking statements within the meaning established by the Private Securities Litigation Reform Act of 1995 ("Act"). The forward - looking statements are intended to qualify under provisions of the federal securities laws for "safe harbor" treatme nt established by the Act. Forward - looking statements are based on currently available information, expectations, estimates, assumptions and projectio ns, and management's judgment about the Company, the water utility industry and general economic conditions.

INVESTOR RELATIONS Today’s Participants Marty Kropelnicki President & CEO Tom Smegal Vice President, CFO & Treasurer Paul Townsley Vice President, Corporate Development and Chief Regulatory Officer 2 Dave Healey Vice President, Controller Shannon Dean Vice President, Customer Service and Chief Citizenship Officer

3 INVESTOR RELATIONS Presentation Overview o Our Operating Priorities o Financial Results o Earnings Breakdown for 2020 o How to Look at 2021 Earnings o Continuing COVID - 19 Impacts o Company Values Statement o ESG Update o California Regulatory Update o Capital Investment Update o Cap Ex and Rate Base Tables o Long - Term Debt & Financing Plan o 2021 Focus o In Summary

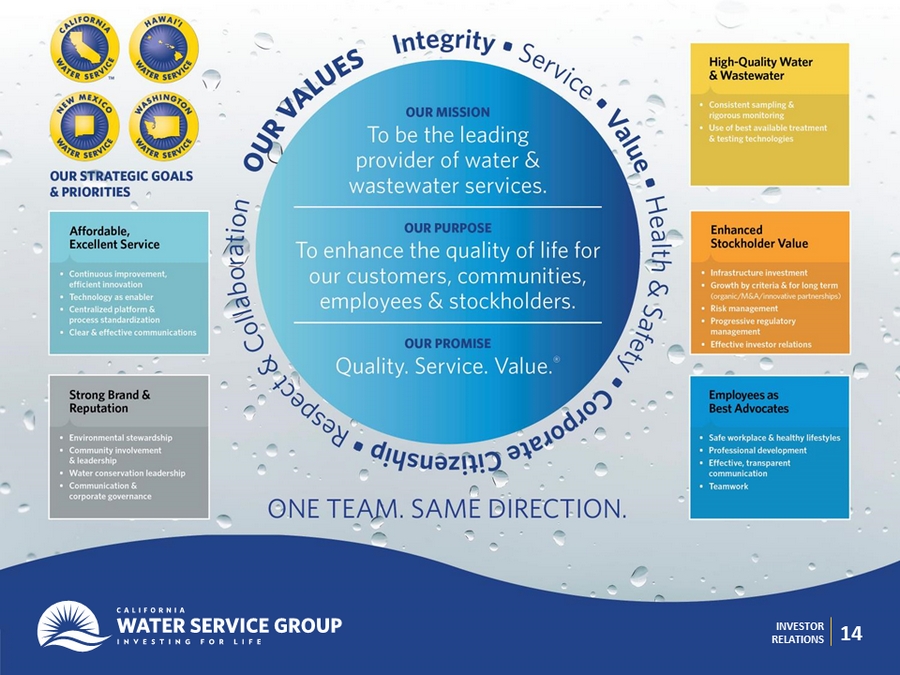
INVESTOR RELATIONS 4 Our Operating Priorities Affordable, Excellent Service o Continuous improvement, efficient innovation o Technology as enabler o Centralized platform & process standardization o Clear & effective communications High - Quality Water & Wastewater o Consistent sampling & rigorous monitoring o Use of best available treatment & testing technologies Employees as Best Advocates o Safe workplace & healthy lifestyles o Professional development o Effective, transparent communication o Teamwork Strong Brand & Reputation o Environmental stewardship o Community involvement & leadership o Water conservation leadership o Communication & corporate governance Enhanced Stockholder Value o Infrastructure investment o Growth by criteria & for long term (organic/M&A/innovat ive partnerships) o Risk management o Progressive regulatory management o Effective investor relations
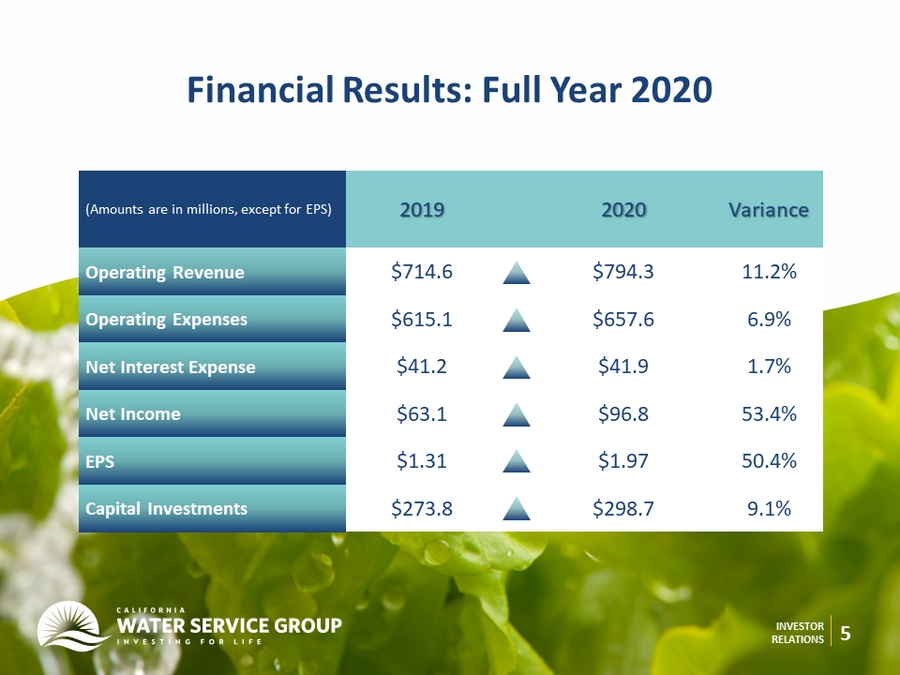
INVESTOR RELATIONS 5 Financial Results: Full Year 2020 (Amounts are in millions, except for EPS) 2019 2020 Variance Operating Revenue $714.6 $794.3 11.2% Operating Expenses $615.1 $657.6 6.9% Net Interest Expense $41.2 $41.9 1.7% Net In come $63.1 $96.8 53.4% EPS $1.31 $1.97 50.4% Capital Investments $273.8 $298.7 9.1%

INVESTOR RELATIONS 6 (Amounts are in millions, except for EPS) Q4 2019 Q4 2020 Variance Operating Revenue $176.9 $189.2 7.0% Operating Expenses $156.5 $164.1 4.9% Net Interest Expense $10.5 $11.0 4.8% Net In come $11.3 $15.5 37.2% EPS $0.24 $0.31 29.2% Capital Investments $78.8 $77.4 - 1.8% Financial Results: Fourth Quarter 2020

INVESTOR RELATIONS 7 INCREASE PRIMARILY DUE TO THE ADOPTION OF THE CALIFORNIA GENERAL RATE CASE, WHICH… Added revenue - cash recovery expected to begin April 2021 Lowered adopted water expense Recorded water cost above adopted created additional revenue through Modified Cost Balancing Account revenue Lower effective income tax rates Due in part to GRC refund of excess deferred tax and part due to “repairs” deductions Full Year Financial Highlights NET INCOME INCREASED BY $33.7M TO $96.8M PLUS: Company invested record $ 298.7M in capital improvements, including completing Palos Verdes Peninsula Water Supply Reliability Project, largest single project in our history

INVESTOR RELATIONS 8 Q4 2020 Financial Highlights Rate Increases Increased Repairs Tax Deductions Operating Cost Increases Net income increased by $4.2M to $15.5M due to adoption of California GRC and lower income tax expense due to repairs deductions for mainline replacements $12.0M $4.8M $7.6M

INVESTOR RELATIONS EPS Bridge 2019 to 2020 9 $0.00 $0.20 $0.40 $0.60 $0.80 $1.00 $1.20 $1.40 $1.60 $1.80 $2.00 - $0.01 - $ 0.17 - $ 0.01 - $0.07 $1.31 $0.11 - $ 0.04 $0.85 $1.97
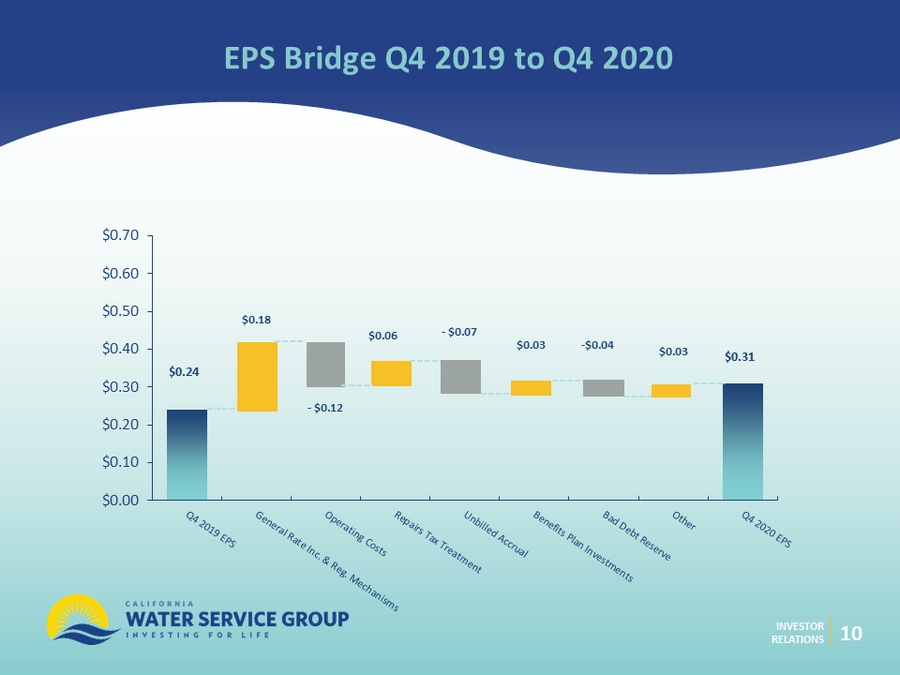
INVESTOR RELATIONS EPS Bridge Q4 2019 to Q4 2020 10 $0.00 $0.10 $0.20 $0.30 $0.40 $0.50 $0.60 $0.70 $0.03 - $ 0.12 - $ 0.07 - $0.04 $0.24 $0.06 $0.03 $0.18 $0.31

INVESTOR RELATIONS 11 Earnings Breakdown 2020 2020 California regulated operations adopted net income of $76M Regulated activities outside California added $3.8M Notable differences from GRC adopted earnings o Recorded bad debt higher due to COVID o Travel, depreciation, property taxes below adopted expense Additional net income outside core regulated came from: o Recognition of AFUDC equity $5.0M o Benefits Plans Investments $3.4M o Non - regulated activities $1.4M o Repairs tax treatment added $3.3M

12 INVESTOR RELATIONS How to Look at Earnings 2021 2021 California regulated operations adopted rate base of $1.70B and adopted net income of $83.5M o Depreciation and property taxes likely to be higher due to 2020 plant additions o Bad debt expense likely to continue through 2021 o Hiring authorized positions will add wages Other states, with $110M in rate base, will add net income in line with their size Additional net income outside core regulated o Recognition of AFUDC likely to be lower after completion of major projects in 2020 o Mark - to - market and unbilled revenue are unknown o Non - regulated activities are also variable o Net income effect of state tax repairs deduction determined by construction completion

13 INVESTOR RELATIONS Continuing Impacts from Covid - 19 Pandemic Will continue to operate with enhanced safety protocols Will c ontinue to suspend water shutoffs through at least end of Q1 2021 Increased customer account aging from suspension of collection activities o Bills outstanding >90 days increased to $9.6M o Increased reserve for doubtful accounts from $2.7M to $5.2M in Q4 Incremental COVID - 19 - related expenses in Q4 of $0.4M ; potential to recover in HI and CA Water sales in aggregate close to adopted levels (96% of adopted sales in CA), up 4.9% from 2019, with increases in residential usage offset by lower business, industrial, and public authority sales Liquidity remains strong; at year - end, $44.6M cash and additional current capacity of $180M+ on lines of credit, subject to meeting borrowing conditions
INVESTOR RELATIONS 14 14 14 INVESTOR RELATIONS
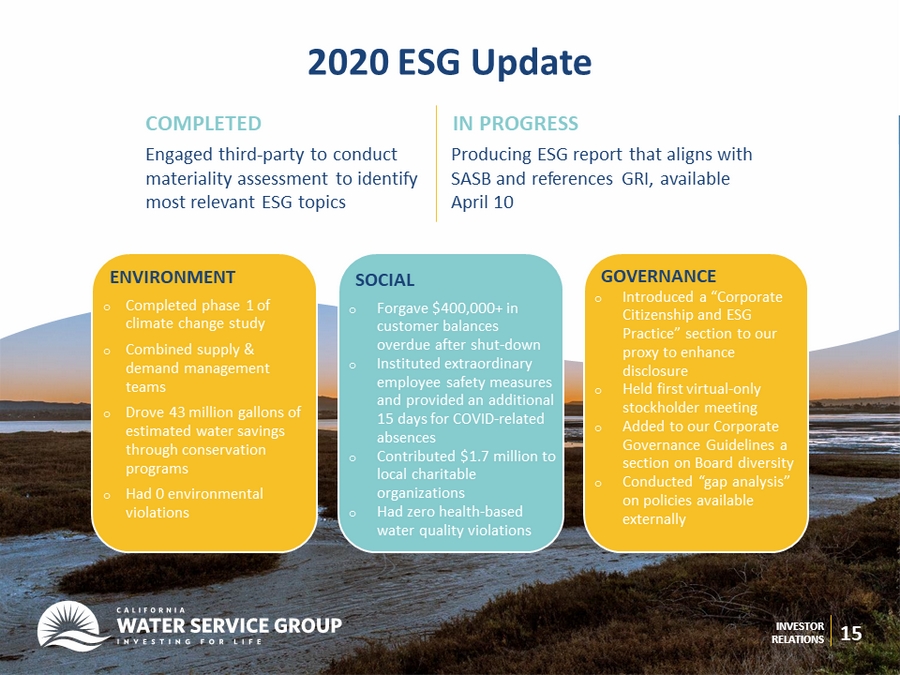
INVESTOR RELATIONS 2020 ESG Update Engaged third - party to conduct materiality assessment to identify most relevant ESG topics Producing ESG report that aligns with SASB and references GRI, available April 10 INVESTOR RELATIONS 15 COMPLETED IN PROGRESS ENVIRONMENT o Completed phase 1 of climate change study o Combined supply & demand management teams o Drove 43 million gallons of estimated water savings through conservation programs o Had 0 environmental violations SOCIAL o Forgave $400,000+ in customer balances overdue after shut - down o Instituted extraordinary employee safety measures and provided an additional 15 days for COVID - related absences o Contributed $1.7 million to local charitable organizations o Had zero health - based water quality violations GOVERNANCE o Introduced a “ Corporate Citizenship and ESG Practice” section to our proxy to enhance disclosure o Held first virtual - only stockholder meeting o Added to our Corporate Governance Guidelines a section on Board diversity o Conducted “gap analysis” on policies available externally

INVESTOR RELATIONS 16 2021 California Regulatory Update On May 1, Cal Water will file for review of Cost of Capital for 2022 - 2024 We anticipate requesting higher level of capital improvements than adopted in last GRC On July 1, Cal Water expects to file 2021 GRC, with rates expected to be effective January 1, 2023 Filing will address rate design, sales forecast, and water cost forecast due to discontinuance of revenue decoupling We are working to balance these changes so low - income and low - water - use customers are not unreasonably impacted

INVESTOR RELATIONS 17 Capital Investment Update 2020 Company and developer - funded capital investments: $298.7M 9.1% compared to 2019 Capital Spending Target: $ 270 - $300M For 2021 Investments exceeded target range due to favorable working conditions throughout the year 2022 - 2024 capital plans released in July

INVESTOR RELATIONS 18 Long - Term Debt and Financing Plan TODAY: Cal Water announced it had priced $280M in first mortgage bonds through private placement process o $130M of 30 - year bonds with coupon of 2.87% o $150M of 40 - year bonds with coupon of 3.02% Bonds will fund May 11, 2021 In 2020, we issued $82.6M through continuing At - the - Market stock issuance program; expect to raise $300M of equity over duration Cal Water’s weighted average debt cost will be below 4.3%, benefiting customers beginning in 2022

INVESTOR RELATIONS $108 $113 $111 $118 $116 $131 $177 $229 $259 $272 $274 $299 $285 $40 $40 $43 $55 $58 $61 $61 $64 $77 $84 $89 $99 $108 $0 $50 $100 $150 $200 $250 $300 $350 2009 2010 2011 2012 2013 2014 2015 2016 2017 2018 2019 2020 *2021 Capital Investment and Depreciation 19 (in millions) * 2021 represents midpoint of Company’s current projection of $270 - $300 million; Company plans to provide estimate of 2022 - 2024 capital Investments in Q2 after filing California 2021 GRC 2008 - 2019 CAGR 9.7% 2015 - 2020 CapEx 3x DEPRECIATION

INVESTOR RELATIONS Estimated Regulated Rate Base of CWT (in millions) * 2022 Rate Base estimate assumes Cal Water is eligible for all escalation rate increases included in the California GRC decision. They are subject to an earnings test. Advice Letter values reflect authorized amounts which would be included only after projects are complete and in service. . 2021 2022 Adopted Regulated Rate Base (CA) and projected (Other States) $ 1,810 $ 1,920 Remaining potential a dvice letters $ 54 $ 54 Potential ra te base including all advice letters $ 1,864 $ 1,974 20 $978 $1,004 $1,058 $1,241 $1,119 $ 1,263 $0 $500 $1,000 $1,500 $2,000 $2,500 2014 2015 2016 2017 2018 2019 2020 2021 *2022 $1,607

INVESTOR RELATIONS 21 2021 Business Outlook File California GRC File and Complete California Cost of Capital Emerge from COVID - 19 2021 ESG Initiatives

22 INVESTOR RELATIONS In Summary o Performed well through COVID - 19 and a delayed GRC in California o Record earnings paired with record capital spending o Kept our customers and employees safe o Strong year of business development o Looking forward to our new set of challenges in 2021
DISCUSSION