Attached files
| file | filename |
|---|---|
| 8-K - 8-K - FLUSHING FINANCIAL CORP | ffic-20210218x8k.htm |
Exhibit 99.1
| KBW Investor Presentation February 18, 2021 contact: susan.cullen@flushingbank.com | phone: 718.961.5400 | website: www.flushingbank.com |
| “Safe Harbor” Statement under the Private Securities Litigation Reform Act of 1995: Statements in this Presentation relating to plans, strategies, economic performance and trends, projections specific activities or investments and other statements that are not descriptions of historical forward-looking statements within the meaning of the Private Securities Litigation Reform of results of facts may be Act of 1995, Section 27A of the Securities Act of 1933 and Section 21E of the Securities Exchange Act of 1934. Forward-looking information is inherently subject to risks and uncertainties, and actual results could differ materially from those currently anticipated due to a number of factors, which include, but are not limited to, risk factors discussed in the Company’s Annual Report on Form 10-K for the fiscal year ended December 31, 2019 and in other documents filed by the Company with the Securities and Exchange Commission from time to time, as well as the possibility that the proposed expected benefits of the Empire merger may not materialize in the timeframe expected or at all, or may be more costly to achieve. These proposed risks, as well as other risks associated with the transaction, are more fully discussed in the proxy statement/prospectus that is included in the registration statement on Form S-4 filed with the SEC in connection with the transaction, as amended and supplemented from time to time. Forward-looking statements may be identified by terms such as “may”, “will”, “should”, “could”, “expects”, “plans”, “intends”, “anticipates”, “believes”, “estimates”, “predicts”, “forecasts”, “goals”, “potential” or “continue” or similar terms or the negative of these terms. Although we believe that the expectations reflected in the forward-looking statements are reasonable, we cannot guarantee future results, levels of activity, performance or achievements. The Company has no obligation to update these forward-looking statements. 2 Safe Harbor Statement |
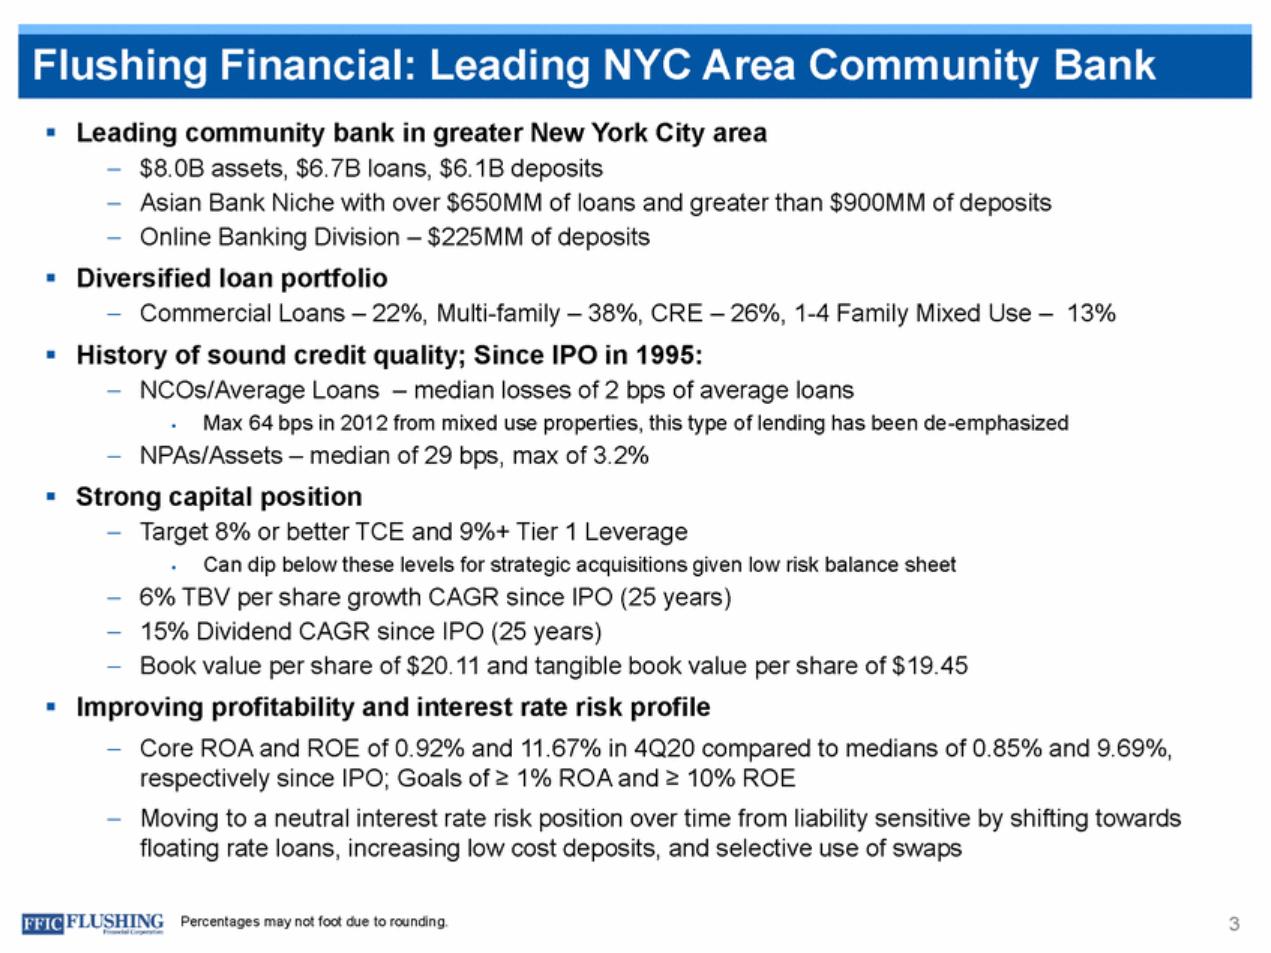
| Leading community bank in greater New York City area – – – $8.0B assets, $6.7B loans, $6.1B deposits Asian Bank Niche with over $650MM of loans and greater than $900MM of deposits Online Banking Division – $225MM of deposits Diversified loan portfolio –Commercial Loans – 22%, Multi-family – 38%, CRE – 26%, 1-4 Family Mixed Use – 13% History of sound credit quality; Since IPO in 1995: –NCOs/Average Loans – median losses of 2 bps of average loans Max 64 bps in 2012 from mixed use properties, this type of lending has been de-emphasized –NPAs/Assets – median of 29 bps, max of 3.2% Strong capital position – Target 8% or better TCE and 9%+ Tier 1 Leverage Can dip below these levels for strategic acquisitions given low risk balance sheet – – – 6% TBV per share growth CAGR since IPO (25 years) 15% Dividend CAGR since IPO (25 years) Book value per share of $20.11 and tangible book value per share of $19.45 Improving profitability and interest rate risk profile –Core ROA and ROE of 0.92% and 11.67% in 4Q20 compared to medians of 0.85% and 9.69%, respectively since IPO; Goals of ≥ 1% ROA and ≥ 10% ROE –Moving to a neutral interest rate risk position over time from liability sensitive by shifting towards floating rate loans, increasing low cost deposits, and selective use of swaps Percentages may not foot due to rounding. 3 Flushing Financial: Leading NYC Area Community Bank |
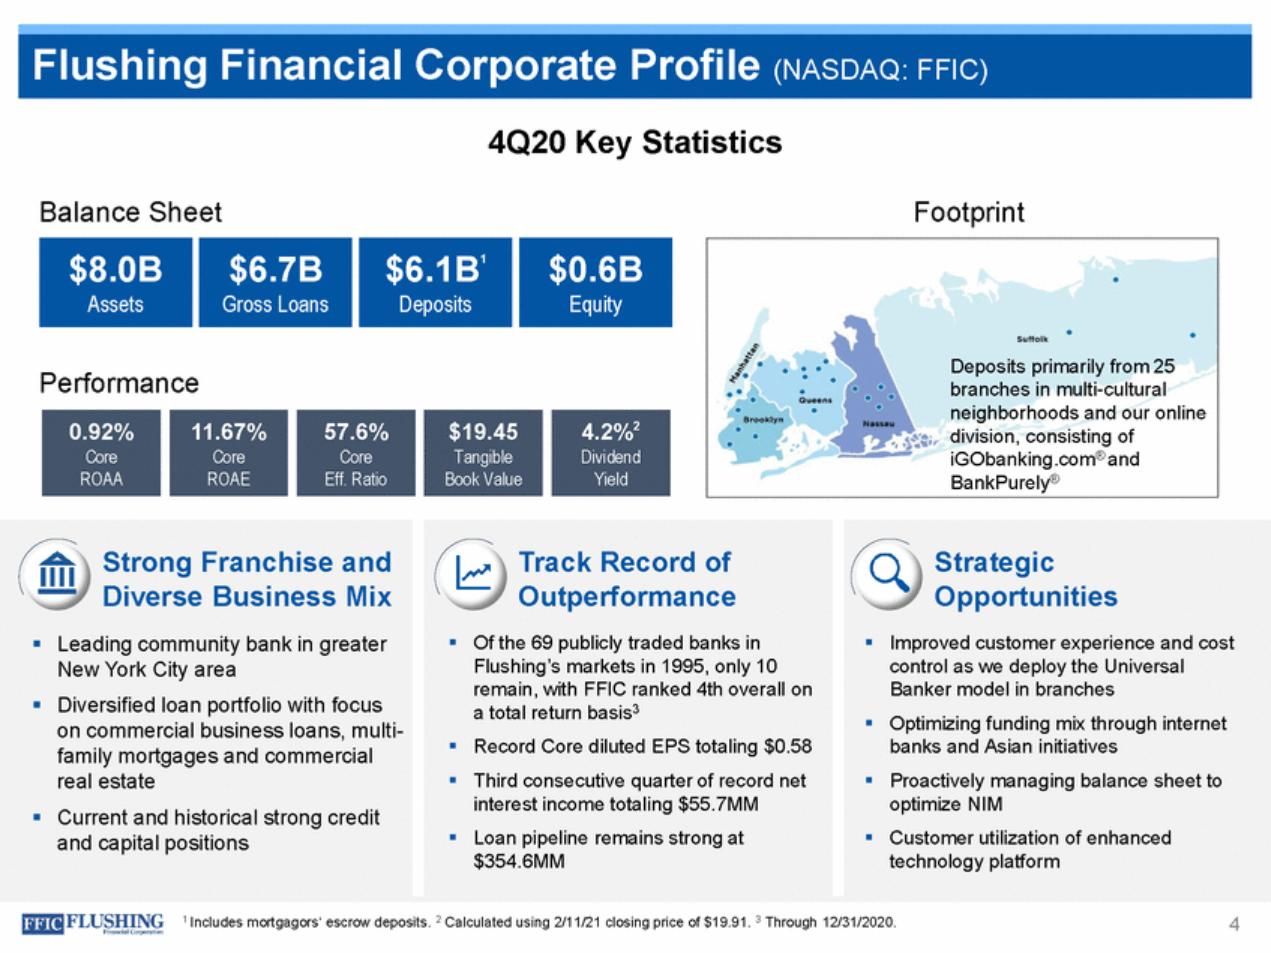
| 4Q20 Key Statistics Balance Sheet Footprint Deposits primarily from 25 branches in multi-cultural neighborhoods and our online division, consisting of iGObanking.com® and BankPurely® Performance Strong Franchise and Diverse Business Mix Leading community bank in greater New York City area Diversified loan portfolio with focus on commercial business loans, multi-family mortgages and commercial real estate Current and historical strong credit and capital positions Track Record of Outperformance Of the 69 publicly traded banks in Flushing’s markets in 1995, only 10 remain, with FFIC ranked 4th overall on a total return basis3 Record Core diluted EPS totaling $0.58 Third consecutive quarter of record net interest income totaling $55.7MM Loan pipeline remains strong at $354.6MM Strategic Opportunities Improved customer experience and cost control as we deploy the Universal Banker model in branches Optimizing funding mix through internet banks and Asian initiatives Proactively managing balance sheet to optimize NIM Customer utilization of enhanced technology platform 4 1 Includes mortgagors‘ escrow deposits. 2 Calculated using 2/11/21 closing price of $19.91. 3 Through 12/31/2020. 0.92% Core ROAA 11.67% Core ROAE 57.6% Core Eff. Ratio $19.45 Tangible Book Value 4.2%2 Dividend Yield $0.6B Equity $6.1B1 Deposits $6.7B Gross Loans $8.0B Assets Flushing Financial Corporate Profile (NASDAQ: FFIC) |
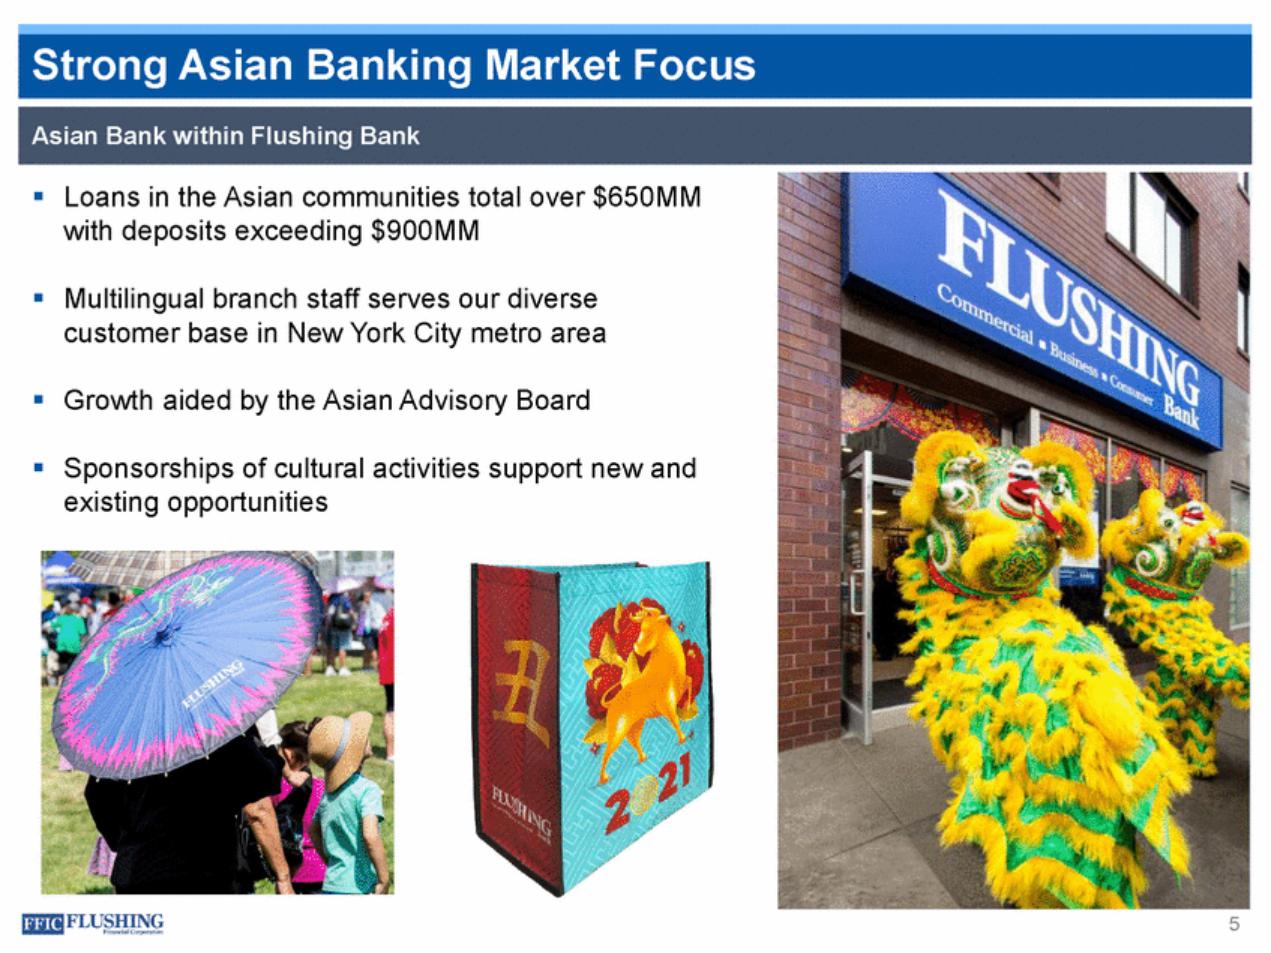
| Loans in the Asian communities total over $650MM with deposits exceeding $900MM Multilingual branch staff serves our diverse customer base in New York City metro area Growth aided by the Asian Advisory Board Sponsorships of cultural activities support new and existing opportunities 5 Asian Bank within Flushing Bank Strong Asian Banking Market Focus |
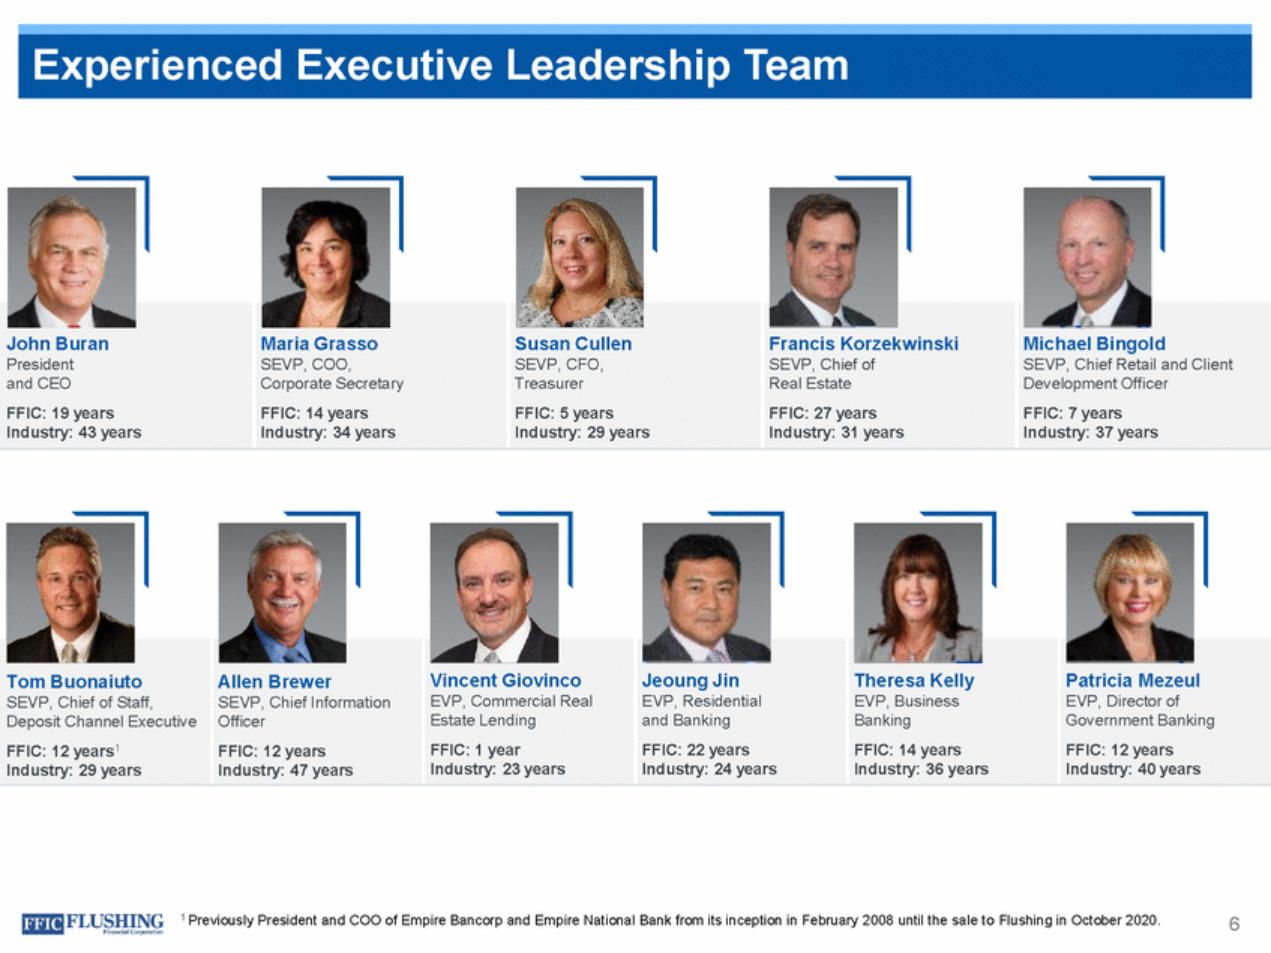
| 1 Previously President and COO of Empire Bancorp and Empire National Bank from its inception in February 2008 until the sale to Flushing in October 2020. 6 Tom Buonaiuto SEVP, Chief of Staff, Deposit Channel Executive FFIC: 12 years1 Industry: 29 years Allen Brewer SEVP, Chief Information Officer FFIC: 12 years Industry: 47 years Vincent Giovinco EVP, Commercial Real Estate Lending FFIC: 1 year Industry: 23 years Jeoung Jin EVP, Residential and Banking FFIC: 22 years Industry: 24 years Theresa Kelly EVP, Business Banking FFIC: 14 years Industry: 36 years Patricia Mezeul EVP, Director of Government Banking FFIC: 12 years Industry: 40 years John Buran President and CEO FFIC: 19 years Industry: 43 years Maria Grasso SEVP, COO, Corporate Secretary FFIC: 14 years Industry: 34 years Susan Cullen SEVP, CFO, Treasurer FFIC: 5 years Industry: 29 years Francis Korzekwinski SEVP, Chief of Real Estate FFIC: 27 years Industry: 31 years Michael Bingold SEVP, Chief Retail and Client Development Officer FFIC: 7 years Industry: 37 years Experienced Executive Leadership Team |
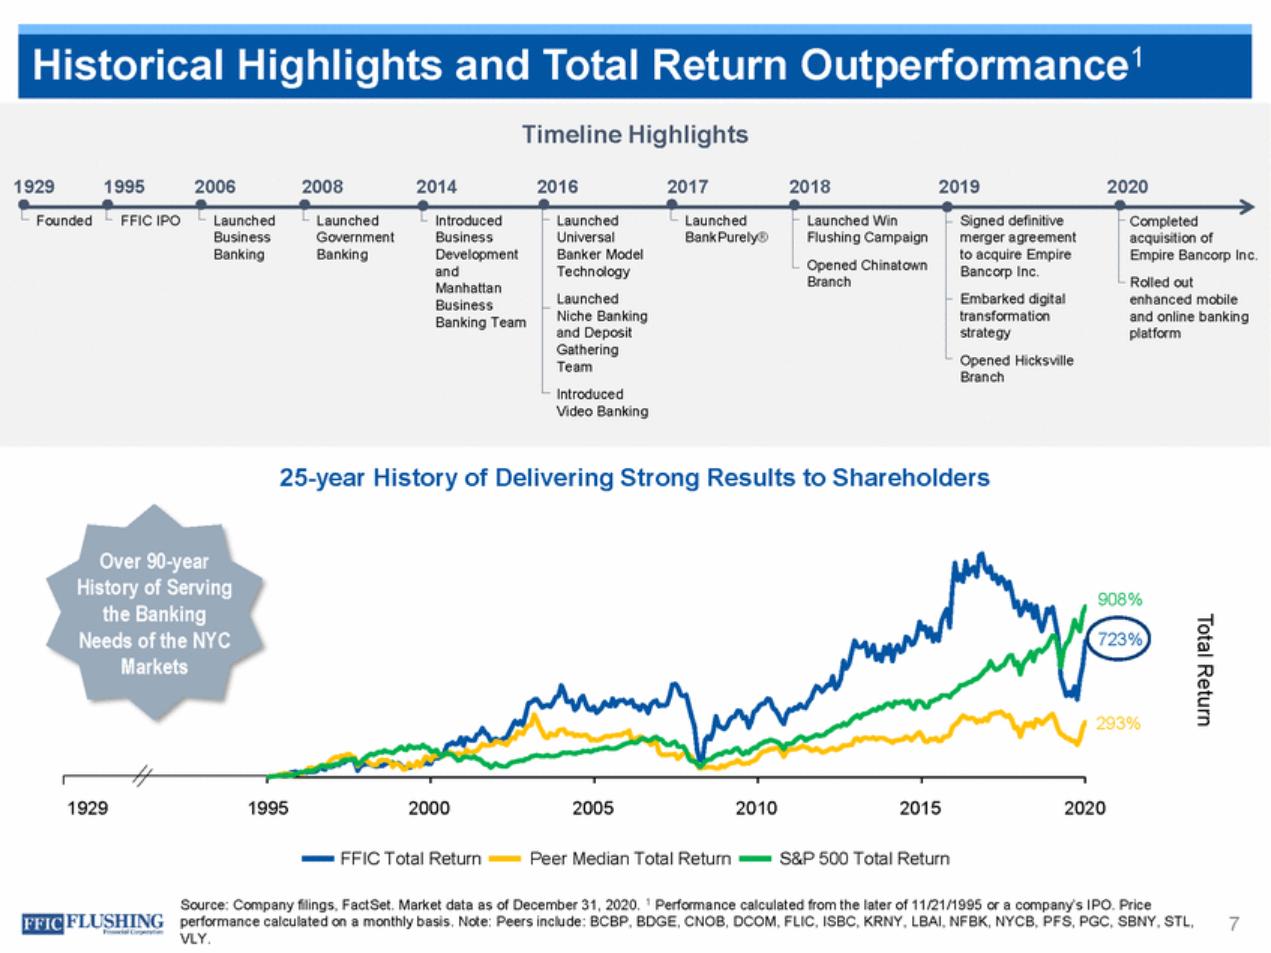
| Timeline Highlights 1929 1995 2006 2008 2014 2016 2017 2018 2019 2020 FoundedFFIC IPO Launched Business Banking Launched Government Banking Introduced Business Development and Manhattan Business Banking Team Launched Universal Banker Model Technology Launched Niche Banking and Deposit Gathering Team Introduced Video Banking Launched BankPurely® Launched Win Flushing Campaign Opened Chinatown Branch Signed definitive merger agreement to acquire Empire Bancorp Inc. Embarked digital transformation strategy Opened Hicksville Branch Completed acquisition of Empire Bancorp Inc. Rolled out enhanced mobile and online banking platform 25-year History of Delivering Strong Results to Shareholders Over 90-year History of Serv the Banking Needs of the N Markets 908% 723% 293% 1929 1995 2000 2005 2010 2015 2020 FFIC Total Return Peer Median Total Return S&P 500 Total Return Source: Company filings, FactSet. Market data as of December 31, 2020. 1 Performance calculated from the later of 11/21/1995 or a company’s IPO. Price performance calculated on a monthly basis. Note: Peers include: BCBP, BDGE, CNOB, DCOM, FLIC, ISBC, KRNY, LBAI, NFBK, NYCB, PFS, PGC, SBNY, STL, VLY. 7 Total Return Historical Highlights and Total Return Outperformance1 |
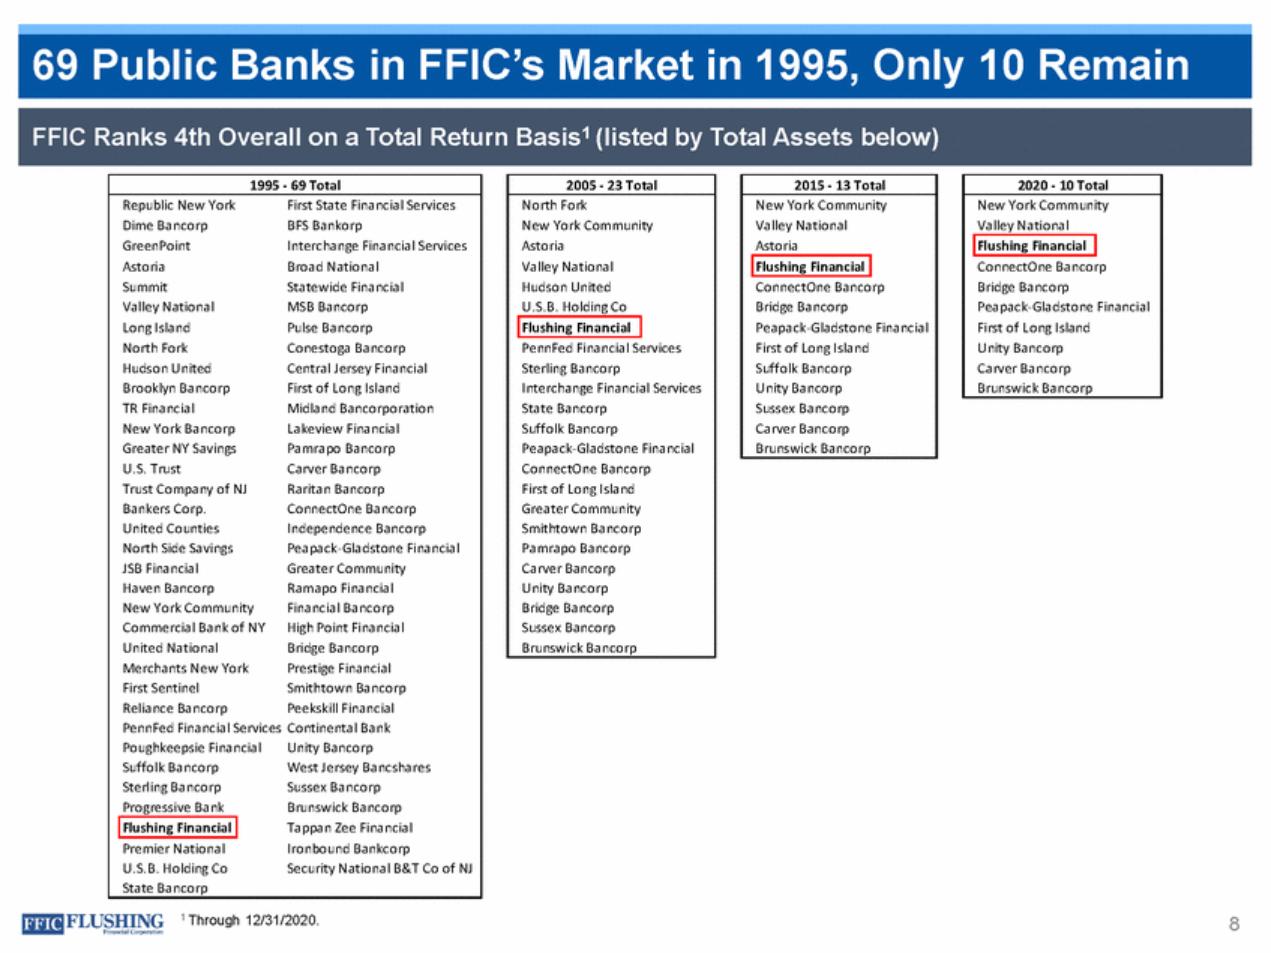
| 1 Through 12/31/2020. 8 2020 - 10 Total New York Community Valley National ConnectOne Bancorp Bridge Bancorp Peapack-Gladstone Financial First of Long Island Unity Bancorp Carver Bancorp Brunswick Bancorp Flushing Financial 2015 - 13 Total New York Community Valley National Astoria ConnectOne Bancorp Bridge Bancorp Peapack-Gladstone Financial First of Long Island Suffolk Bancorp Unity Bancorp Sussex Bancorp Carver Bancorp Brunswick Bancorp Flushing Financial 2005 - 23 Total North Fork New York Community Astoria Valley National Hudson United U.S.B. Holding Co PennFed Financial Services Sterling Bancorp Interchange Financial Services State Bancorp Suffolk Bancorp Peapack-Gladstone Financial ConnectOne Bancorp First of Long Island Greater Community Smithtown Bancorp Pamrapo Bancorp Carver Bancorp Unity Bancorp Bridge Bancorp Sussex Bancorp Brunswick Bancorp Flushing Financial 1995 - 69 Total Republic New YorkFirst State Financial Services Dime BancorpBFS Bankorp GreenPointInterchange Financial Services AstoriaBroad National SummitStatewide Financial Valley NationalMSB Bancorp Long IslandPulse Bancorp North ForkConestoga Bancorp Hudson UnitedCentral Jersey Financial Brooklyn BancorpFirst of Long Island TR FinancialMidland Bancorporation New York BancorpLakeview Financial Greater NY SavingsPamrapo Bancorp U.S. TrustCarver Bancorp Trust Company of NJRaritan Bancorp Bankers Corp.ConnectOne Bancorp United CountiesIndependence Bancorp North Side SavingsPeapack-Gladstone Financial JSB FinancialGreater Community Haven BancorpRamapo Financial New York CommunityFinancial Bancorp Commercial Bank of NYHigh Point Financial United NationalBridge Bancorp Merchants New YorkPrestige Financial First SentinelSmithtown Bancorp Reliance BancorpPeekskill Financial PennFed Financial Services Continental Bank Poughkeepsie FinancialUnity Bancorp Suffolk BancorpWest Jersey Bancshares Sterling BancorpSussex Bancorp Progressive BankBrunswick Bancorp Tappan Zee Financial Premier NationalIronbound Bankcorp U.S.B. Holding CoSecurity National B&T Co of NJ State Bancorp Flushing Financial FFIC Ranks 4th Overall on a Total Return Basis1 (listed by Total Assets below) 69 Public Banks in FFIC’s Market in 1995, Only 10 Remain |
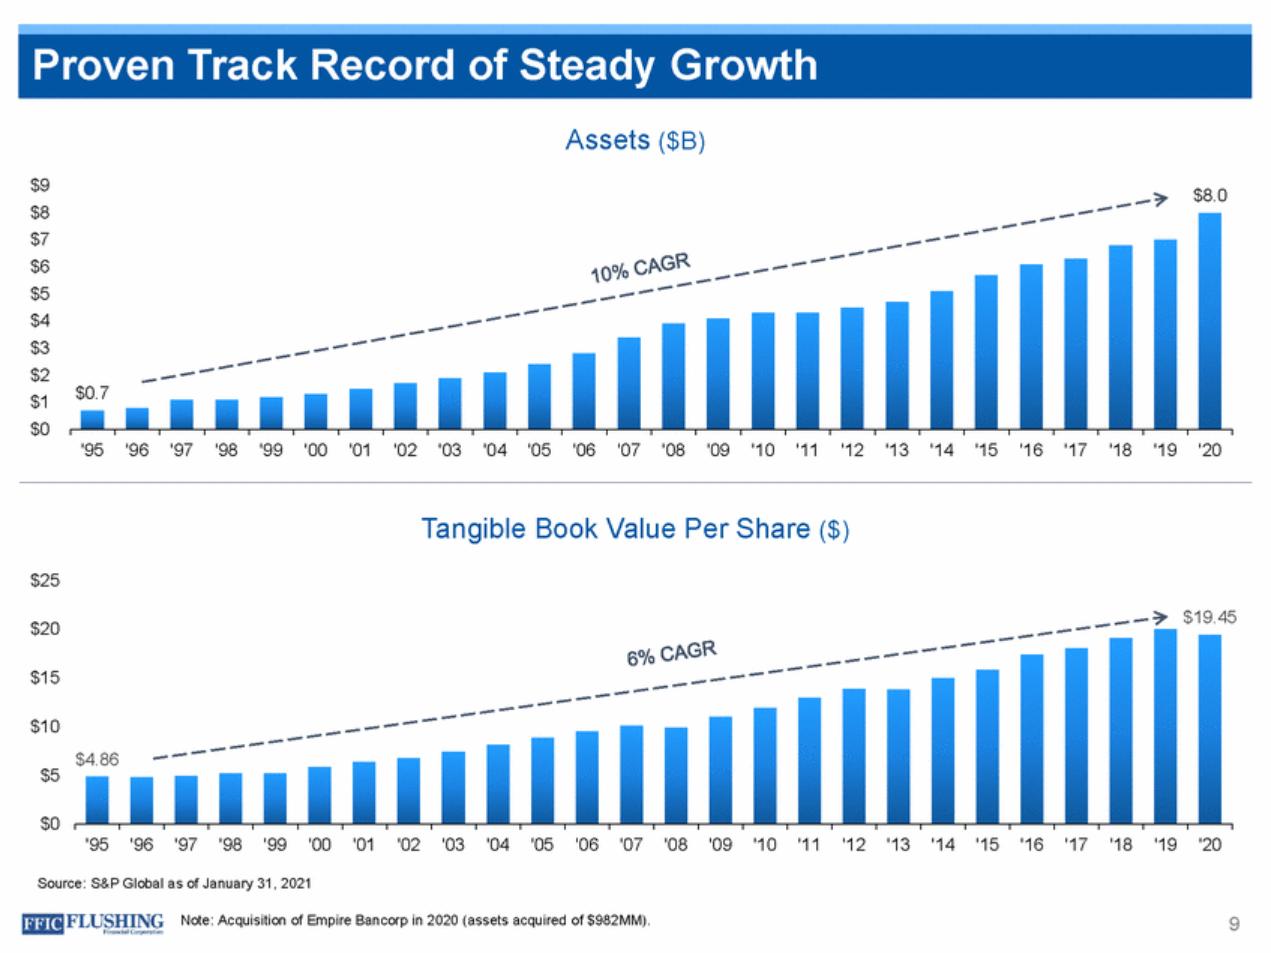
| Assets ($B) $9 $8 $7 $6 $5 $4 $3 $2 $1 $0 $8.0 $0.7 '95 '96 '97 '98 '99 '00 '01 '02 '03 '04 '05 '06 '07 '08 '09 '10 '11 '12 '13 '14 '15 '16 '17 '18 '19 '20 Tangible Book Value Per Share ($) $25 $19.45 $20 $15 $10 $4.86 $5 $0 '95 '96 '97 '98 '99 '00 '01 '02 '03 '04 '05 '06 '07'08 '09 '10 '11 '12 '13 '14 '15 '16 '17 '18 '19 '20 Source: S&P Global as of January 31, 2021 Note: Acquisition of Empire Bancorp in 2020 (assets acquired of $982MM). 9 Proven Track Record of Steady Growth |
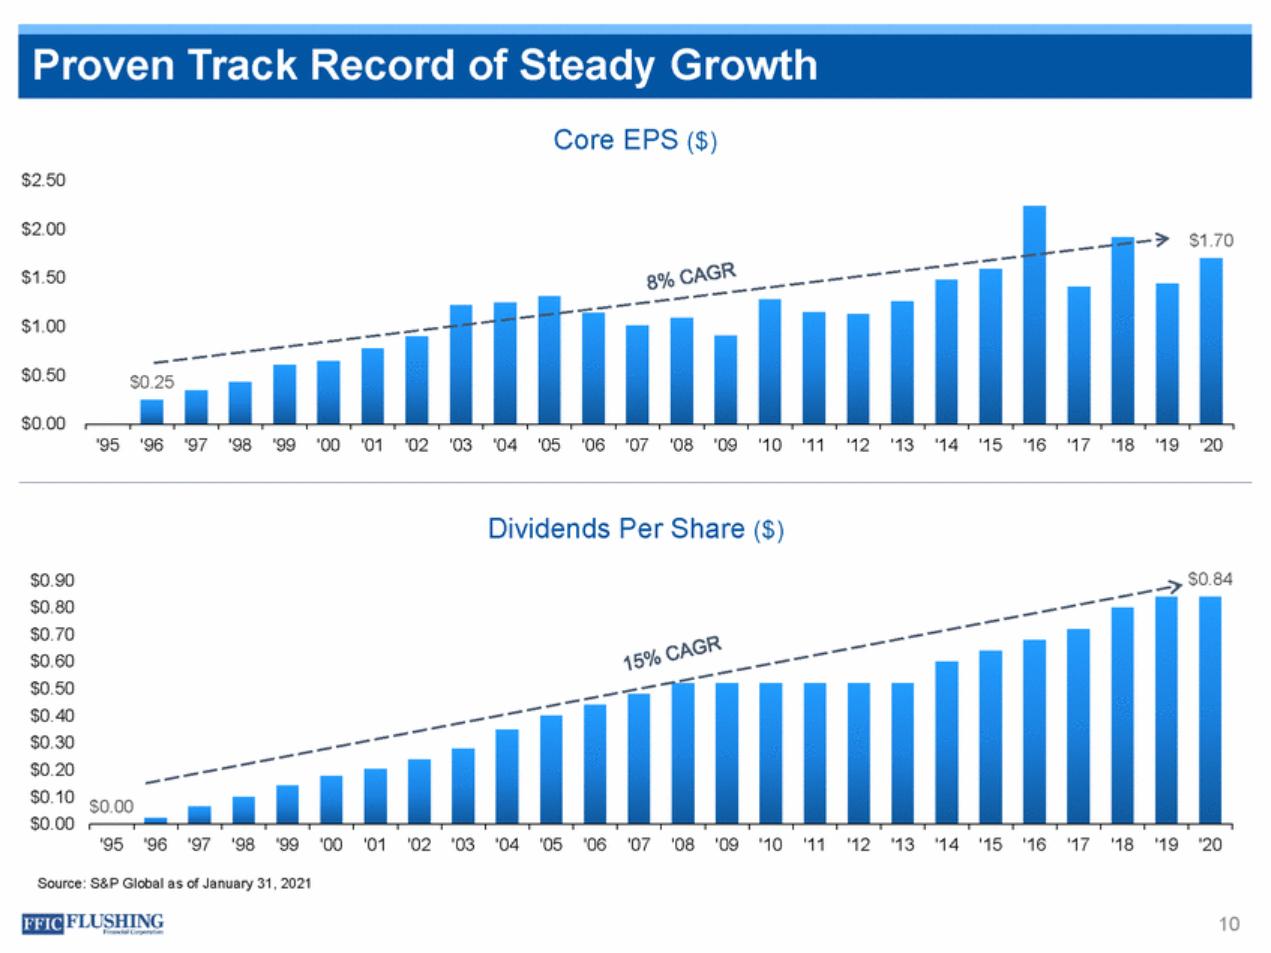
| Core EPS ($) $2.50 $2.00 $1.70 $1.50 $1.00 $0.50 $0.25 $0.00 '95 '96 '97 '98 '99 '00 '01 '02 '03 '04 '05 '06 '07 '08 '09 '10 '11 '12 '13 '14 '15 '16 '17 '18 '19 '20 Dividends Per Share ($) $0.90 $0.80 $0.70 $0.60 $0.50 $0.40 $0.30 $0.20 $0.10 $0.00 $0.84 $0.00 '95'96 '97 '98 '99 '00 '01 '02 '03 '04'05'06'07'08'09'10 '11 '12 '13 '14 '15 '16 '17 '18 '19 '20 Source: S&P Global as of January 31, 2021 10 Proven Track Record of Steady Growth |
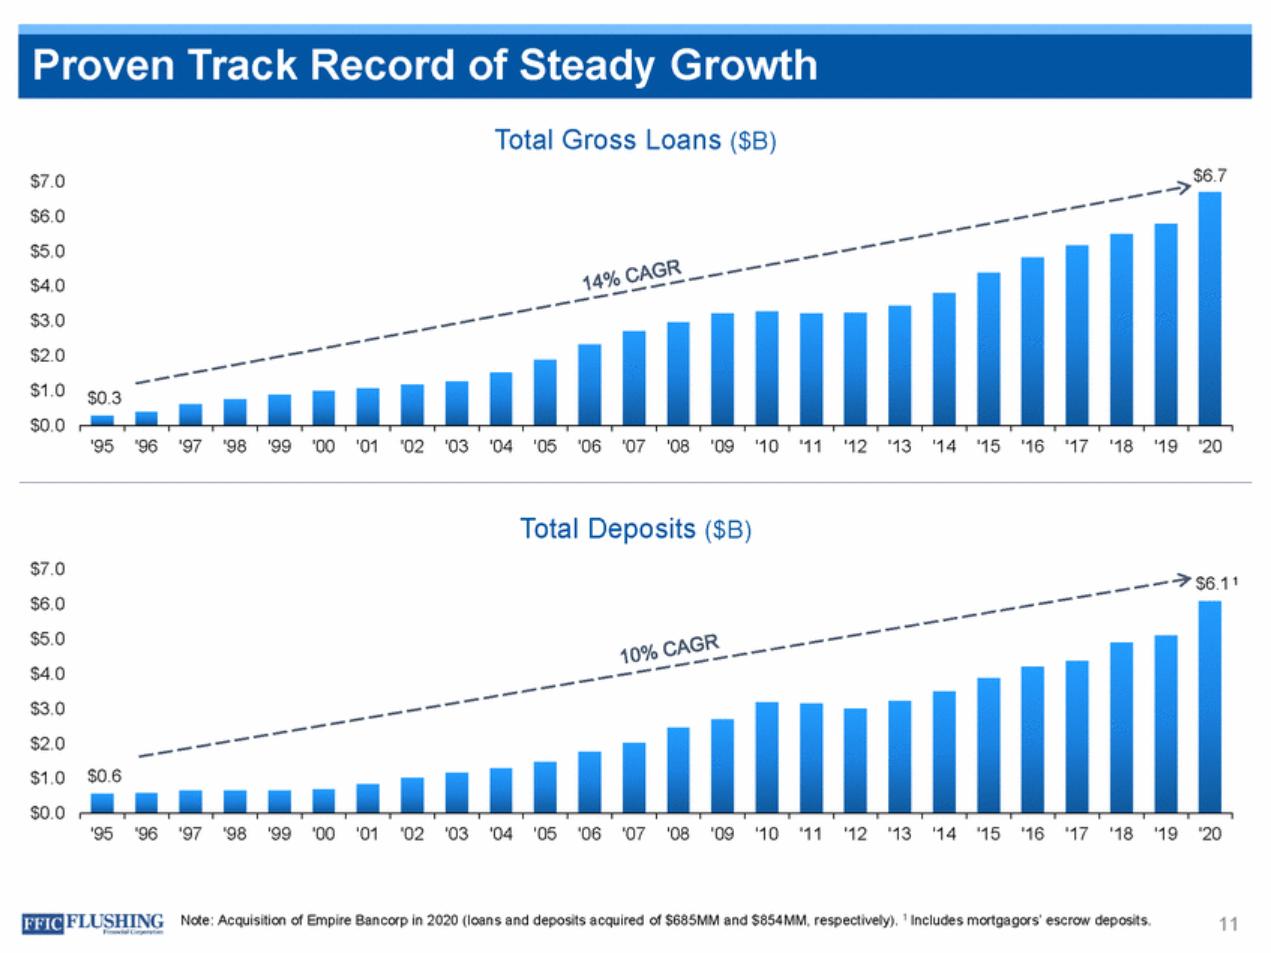
| Total Gross Loans ($B) $6.7 $7.0 $6.0 $5.0 $4.0 $3.0 $2.0 $1.0 $0.0 $0.3 '95 '96 '97 '98 '99 '00 '01 '02 '03 '04 '05 '06 '07 '08 '09 '10 '11 '12 '13 '14 '15 '16 '17 '18 '19 '20 Total Deposits ($B) $7.0 $6.0 $5.0 $4.0 $3.0 $2.0 $1.0 $0.0 $6.1 1 $0.6 '95 '96 '97 '98 '99 '00 '01 '02 '03 '04 '05 '06 '07 '08 '09 '10 '11 '12 '13 '14 '15 '16 '17 '18 '19 '20 Note: Acquisition of Empire Bancorp in 2020 (loans and deposits acquired of $685MM and $854MM, respectively). 1 Includes mortgagors’ escrow deposits. 11 Proven Track Record of Steady Growth |
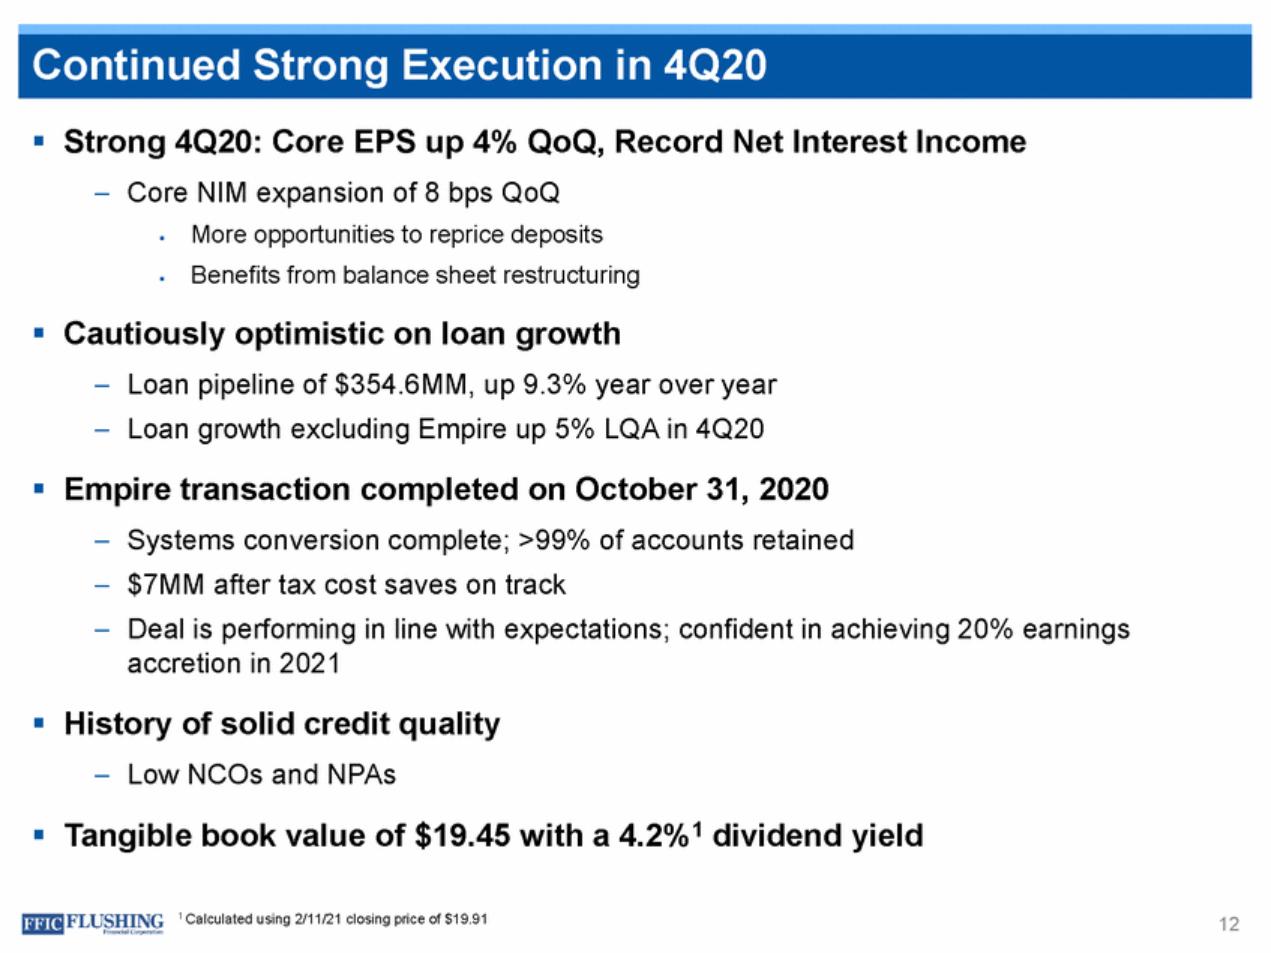
| Strong 4Q20: Core EPS up 4% QoQ, Record Net –Core NIM expansion of 8 bps QoQ Interest Income More opportunities to reprice deposits Benefits from balance sheet restructuring Cautiously optimistic on loan growth –Loan pipeline of $354.6MM, up 9.3% year over year –Loan growth excluding Empire up 5% LQA in 4Q20 Empire transaction completed on October 31, 2020 – – – Systems conversion complete; >99% of accounts retained $7MM after tax cost saves on track Deal is performing in line with expectations; confident in achieving 20% earnings accretion in 2021 History of solid credit quality –Low NCOs and NPAs Tangible book value of $19.45 with a 4.2%1 dividend yield 1 Calculated using 2/11/21 closing price of $19.91 12 Continued Strong Execution in 4Q20 |
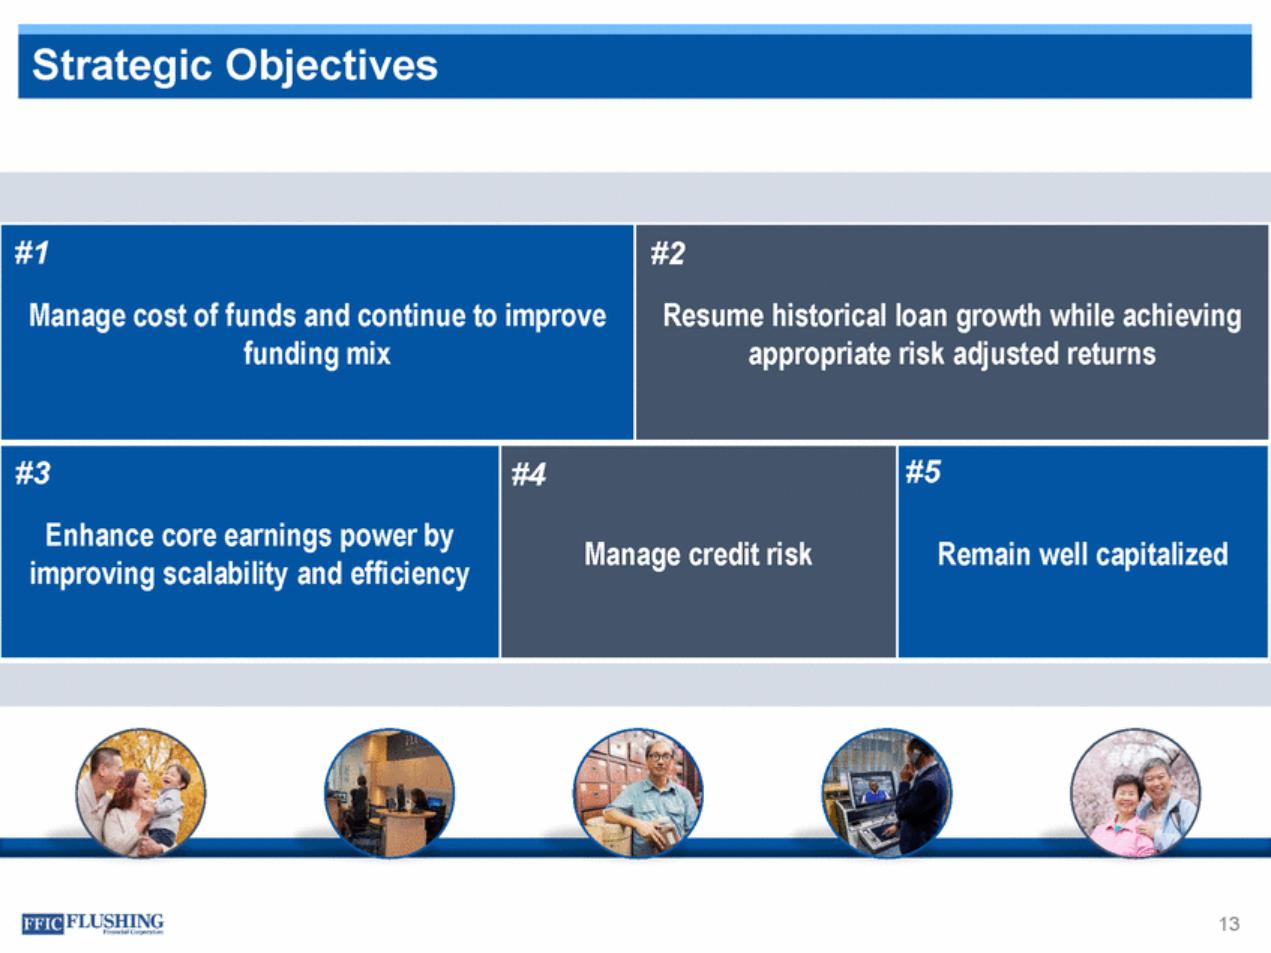
| 13 #1 Manage cost of funds and continue to improve funding mix #2 Resume historical loan growth while achieving appropriate risk adjusted returns #3 Enhance core earnings power by improving scalability and efficiency #4 Manage credit risk #5 Remain well capitalized Strategic Objectives |
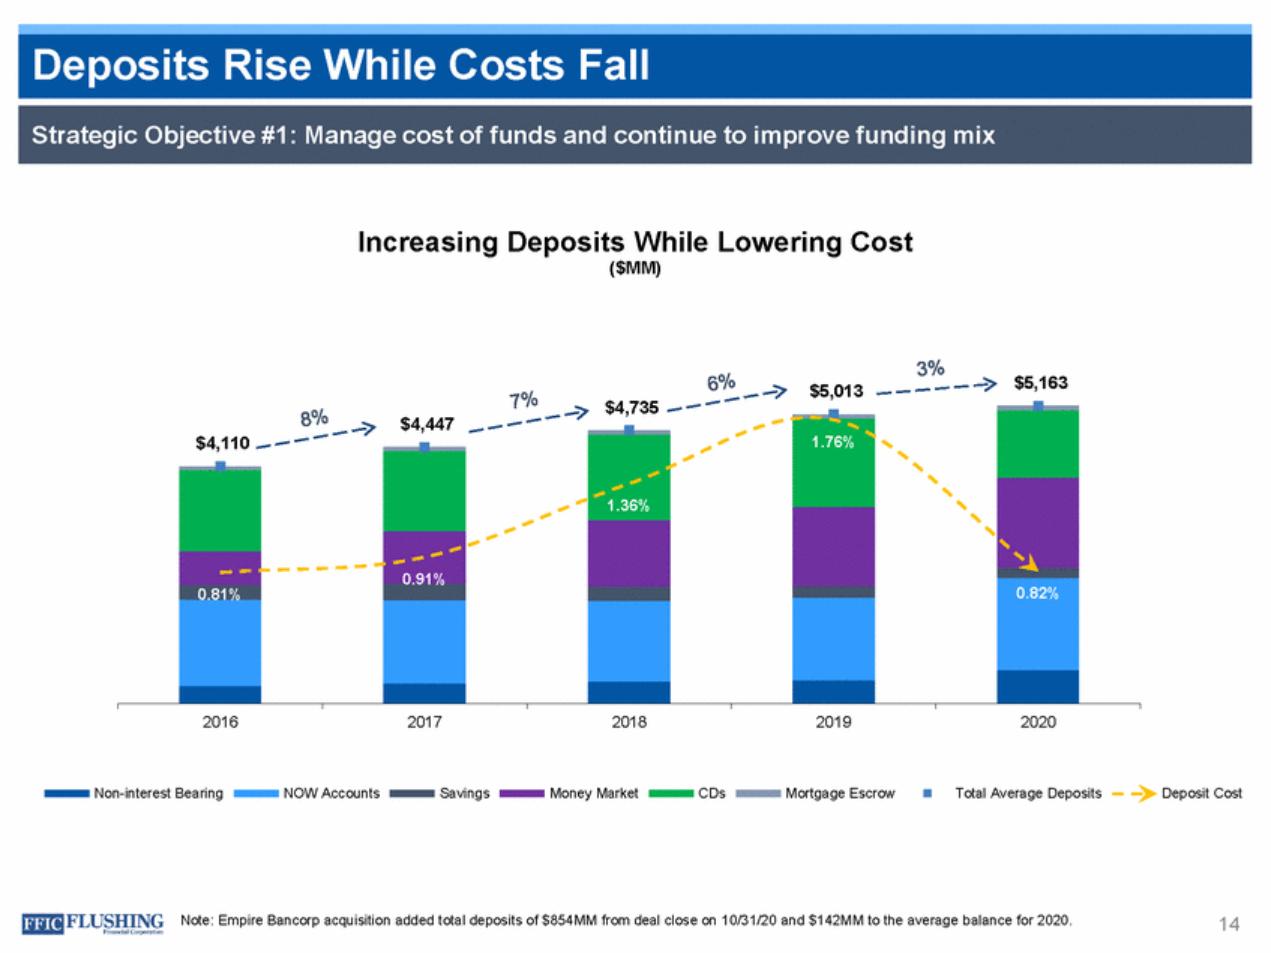
| Increasing Deposits While Lowering Cost ($MM) $5,163 $5,013 $4,735 $4,447 $4,110 2016 2017 2018 2019 2020 Non-interest Bearing NOW Accounts Savings Money Market CDs Mortgage Escrow Total Average Deposits Deposit Cost Note: Empire Bancorp acquisition added total deposits of $854MM from deal close on 10/31/20 and $142MM to the average balance for 2020. 14 1.76% 1.36% 0.82% Strategic Objective #1: Manage cost of funds and continue to improve funding mix Deposits Rise While Costs Fall |
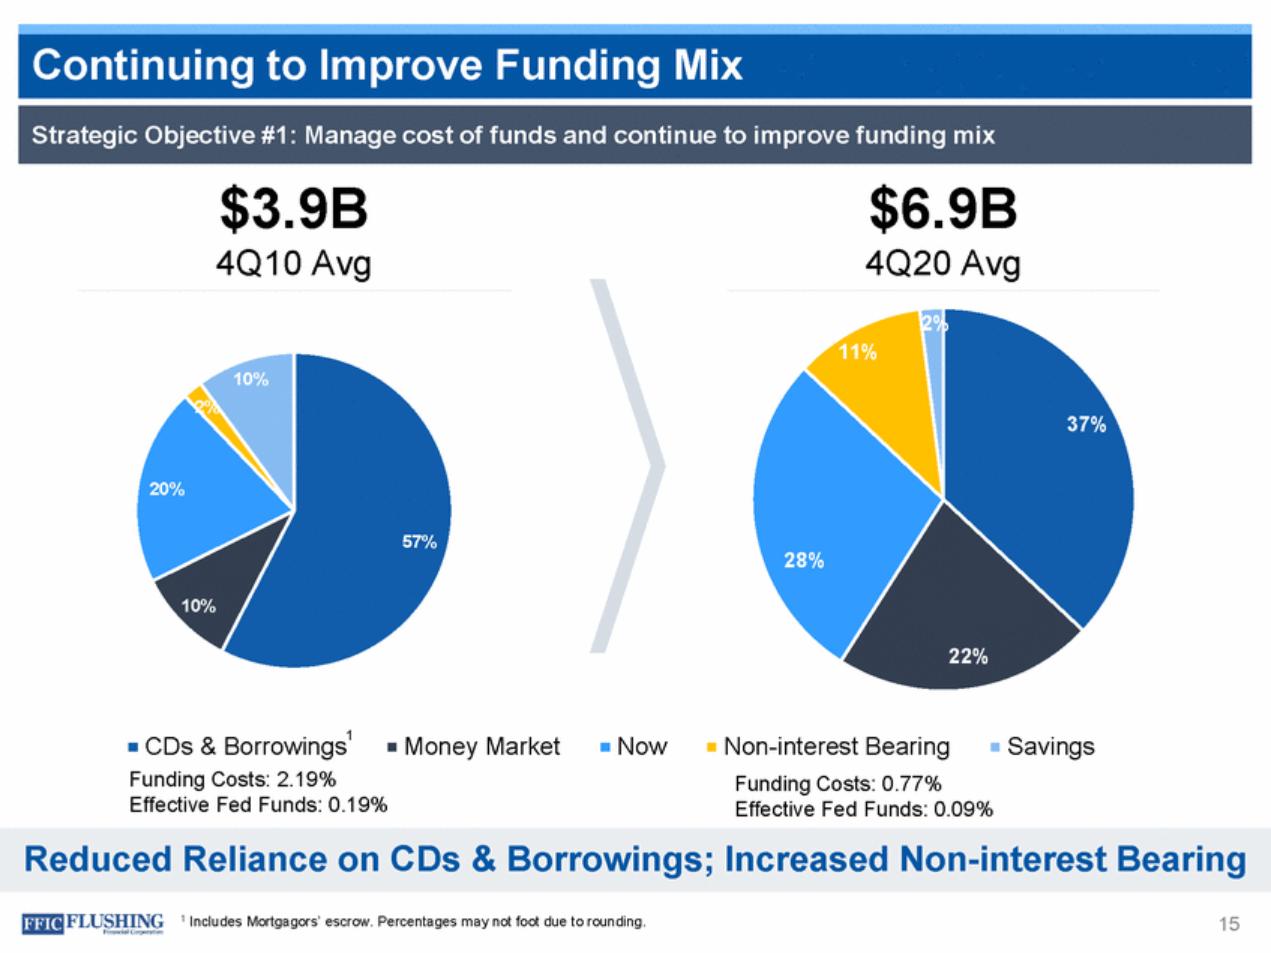
| $3.9B $6.9B 4Q10 Avg 4Q20 Avg 11% 10% 37% 20% 57% 28% 10% 22% 1 CDs & Borrowings Money Market Now Non-interest Bearing Funding Costs: 0.77% Savings Funding Costs: 2.19% Effective Fed Funds: 0.19% Effective Fed Funds: 0.09% Reduced Reliance on CDs & Borrowings; Increased Non-interest Bearing 1 Includes Mortgagors’ escrow. Percentages may not foot due to rounding. 15 Strategic Objective #1: Manage cost of funds and continue to improve funding mix Continuing to Improve Funding Mix |
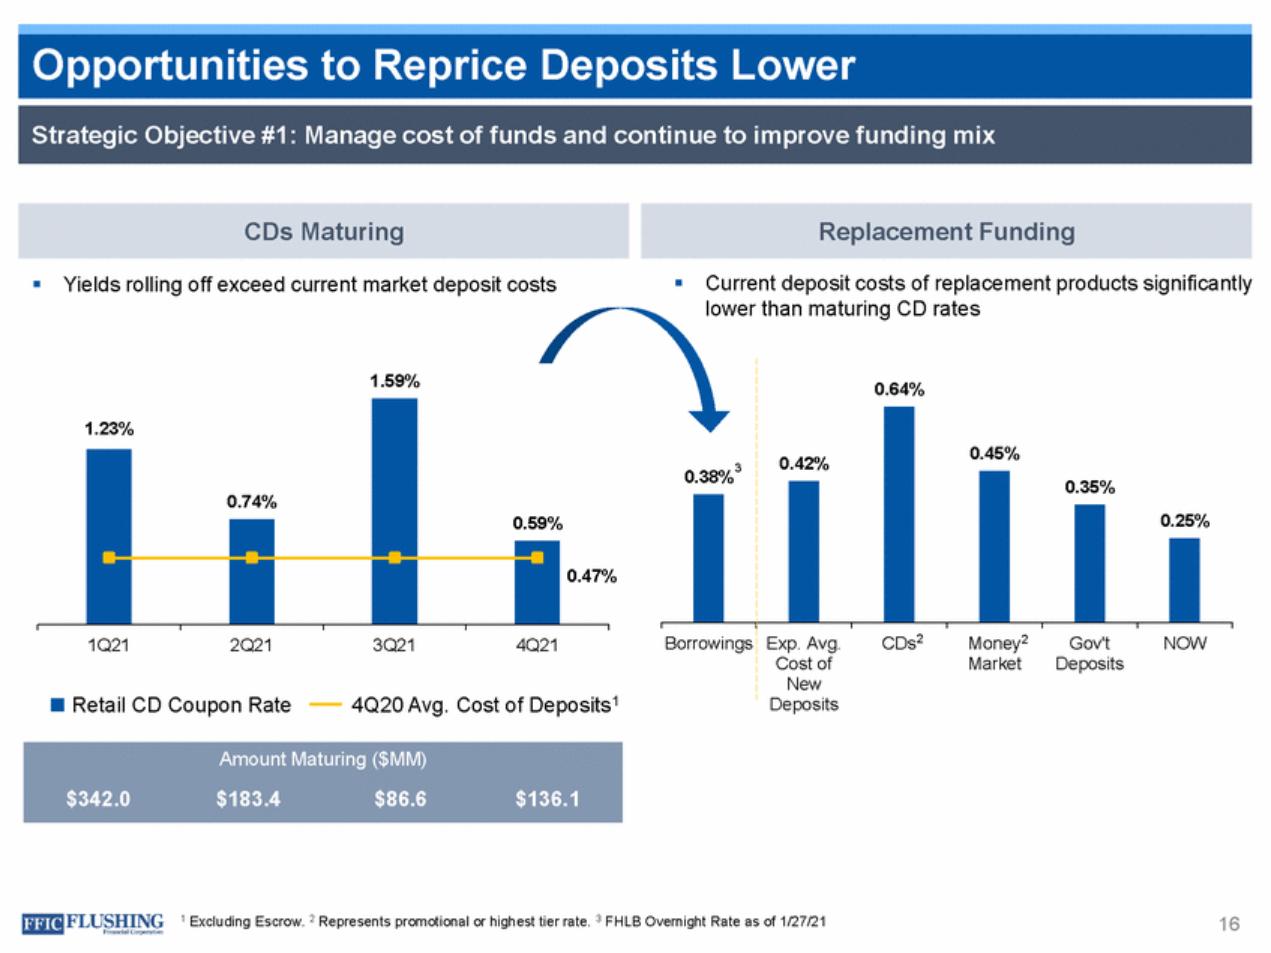
| Current deposit costs of replacement products significantly lower than maturing CD rates Yields rolling off exceed current market deposit costs 1.59% 0.47% CDs2 Money2 Market Gov't Deposits NOW 1Q21 2Q21 3Q21 4Q21 4Q20 Avg. Cost of Deposits1 Retail CD Coupon Rate Deposits 1 Excluding Escrow. 2 Represents promotional or highest tier rate. 3 FHLB Overnight Rate as of 1/27/21 16 Amount Maturing ($MM) $342.0$183.4$86.6$136.1 3 0.38% 0.64% 0.42% 0.45% 0.35% 0.25% Borrowings Exp. Avg. Cost of New 1.23% 0.59% 0.74% Replacement Funding CDs Maturing Strategic Objective #1: Manage cost of funds and continue to improve funding mix SOtrpatpegoicrtOubnjecitiivees#1t:oMaRnaegpe rciocset oDf fuenpdsoasnidtscoLntoinwueetor improve funding mix |
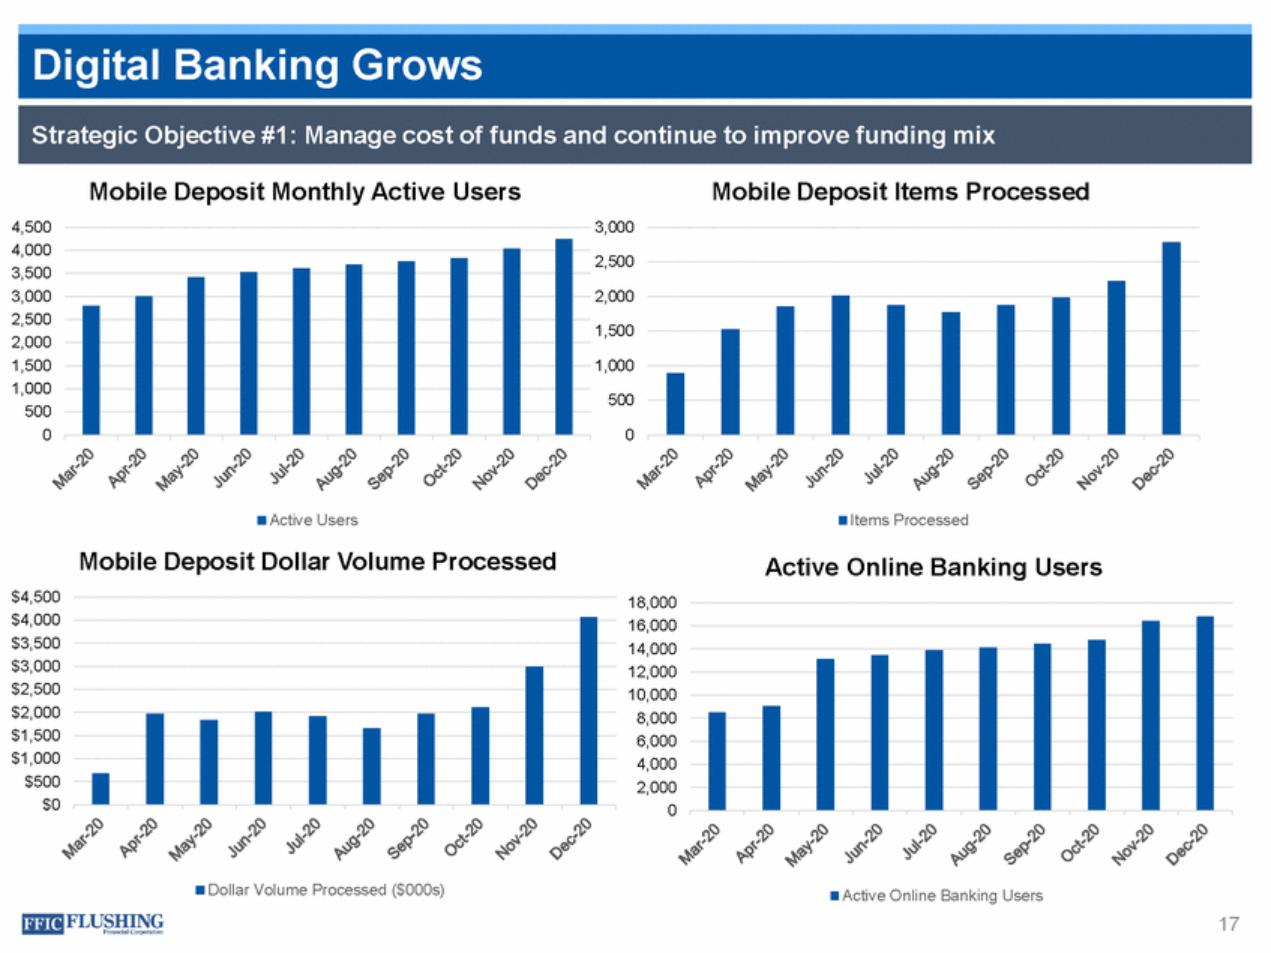
| Mobile Deposit Monthly Active Users Mobile Deposit Items Processed 4,500 4,000 3,500 3,000 2,500 2,000 1,500 1,000 500 0 3,000 2,500 2,000 1,500 1,000 500 0 Active Users Items Processed Mobile Deposit Dollar Volume Processed Active Online Banking Users $4,500 $4,000 $3,500 $3,000 $2,500 $2,000 $1,500 $1,000 $500 $0 18,000 16,000 14,000 12,000 10,000 8,000 6,000 4,000 2,000 0 Dollar Volume Processed ($000s) Active Online Banking Users 17 Strategic Objective #1: Manage cost of funds and continue to improve funding mix Digital Banking Grows |
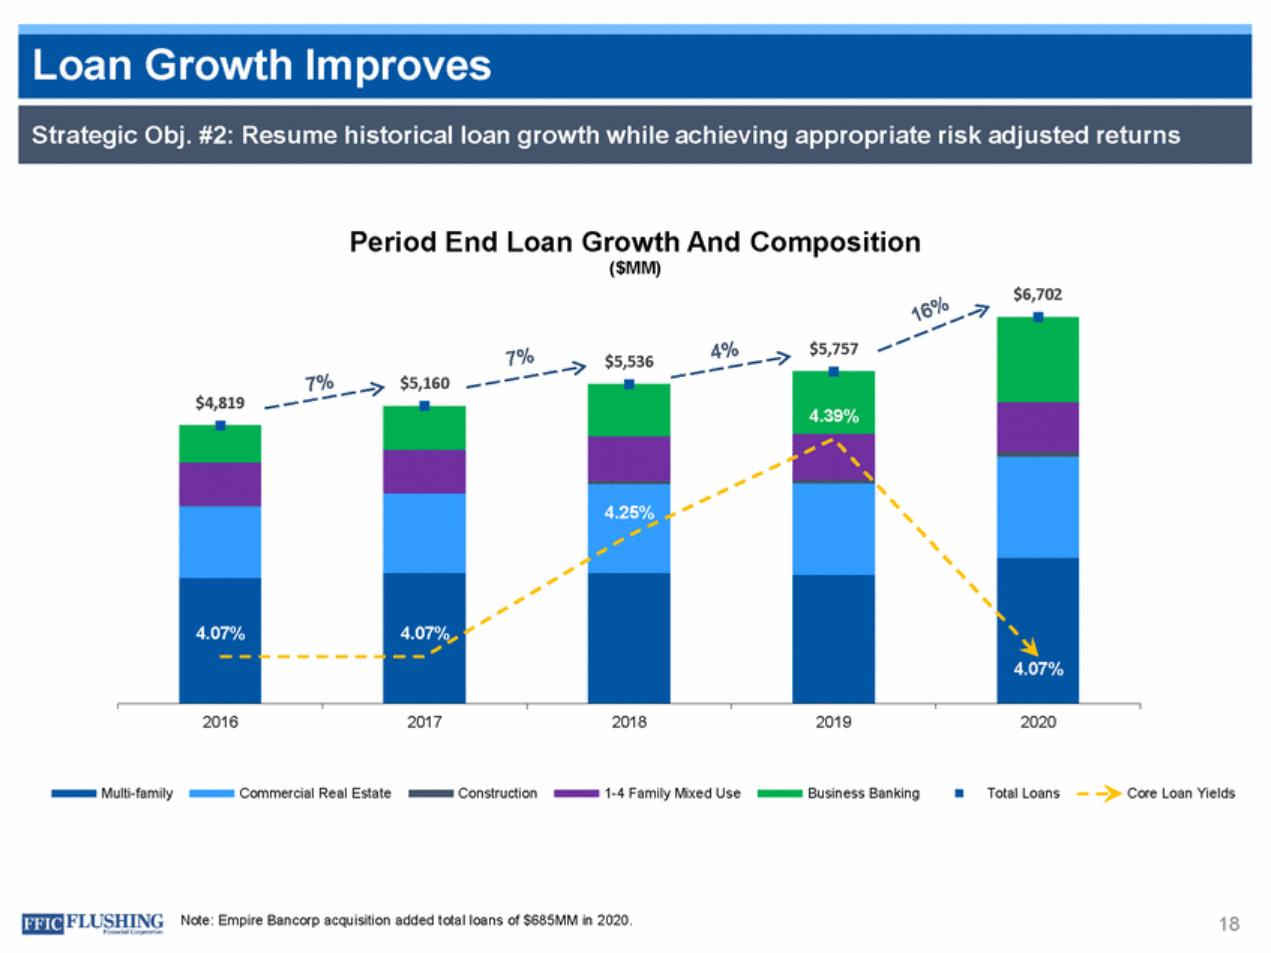
| Period End Loan Growth And Composition ($MM) $6,702 $5,536 $5,160 $4,819 2016 2017 2018 2019 2020 Multi-family Commercial Real Estate Construction 1-4 Family Mixed Use Business Banking Total Loans Core Loan Yields Note: Empire Bancorp acquisition added total loans of $685MM in 2020. 18 $5,757 4.39% 4.25% 4.07% 4.07% Strategic Obj. #2: Resume historical loan growth while achieving appropriate risk adjusted returns Loan Growth Improves |
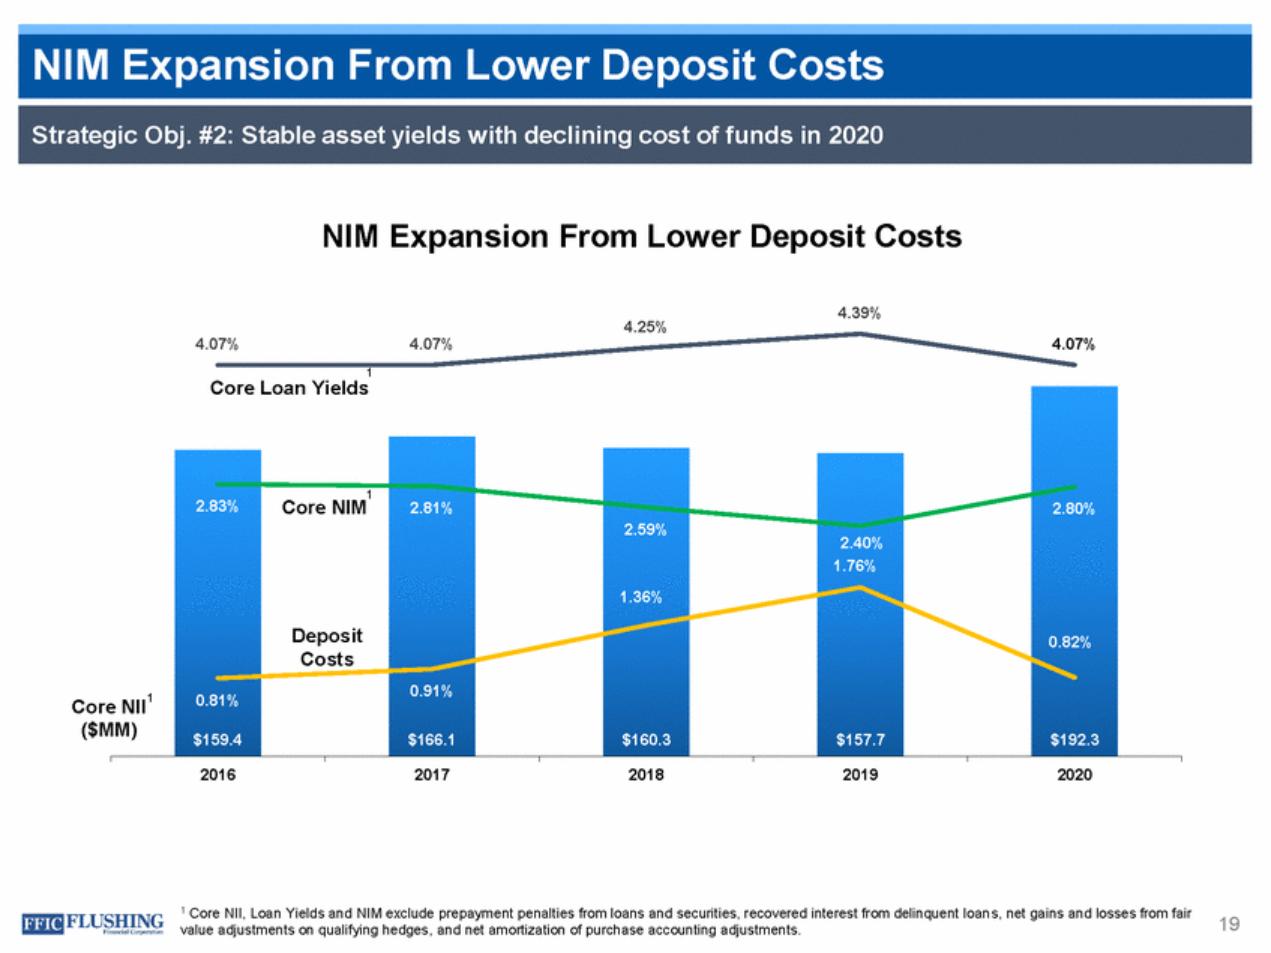
| NIM Expansion From Lower Deposit Costs 4.39% 4.25% 4.07% 4.07% 4.07% 1 Core Loan Yields 1 Core NIM 2.83% 2.81% 2.80% 2.59% 2.40% 1.76% 1.36% Deposit Costs 0.82% 0.91% Core NII1 ($MM) 0.81% $159.4 $166.1 $160.3 $157.7 $192.3 2016 2017 2018 2019 2020 1 Core NII, Loan Yields and NIM exclude prepayment penalties from loans and securities, recovered interest from delinquent loans, net gains and losses from fair value adjustments on qualifying hedges, and net amortization of purchase accounting adjustments. 19 Strategic Obj. #2: Stable asset yields with declining cost of funds in 2020 NIM Expansion From Lower Deposit Costs |
| Closed the Empire transaction on October 31, 2020 – – This added $982MM of assets, $685MM of loans and $854MM of deposits Recorded goodwill of $1.5MM, CDI of $3.3MM and approximately 2.0% loan portfolio purchase accounting mark Systems conversion completed in November Targeted costs savings are $7MM after-tax, most of which will start in 1Q21 Merger costs were approximately $5.0MM The system conversion and integration are complete – – – – Overall, the deal is in line with expectations achieving 20% earnings accretion in 2021 and we are confident in 20 Strategic Objective #3: Enhance core earnings power by improving scalability and efficiency 20% Earnings Accretion in 2021 From Empire Expected |
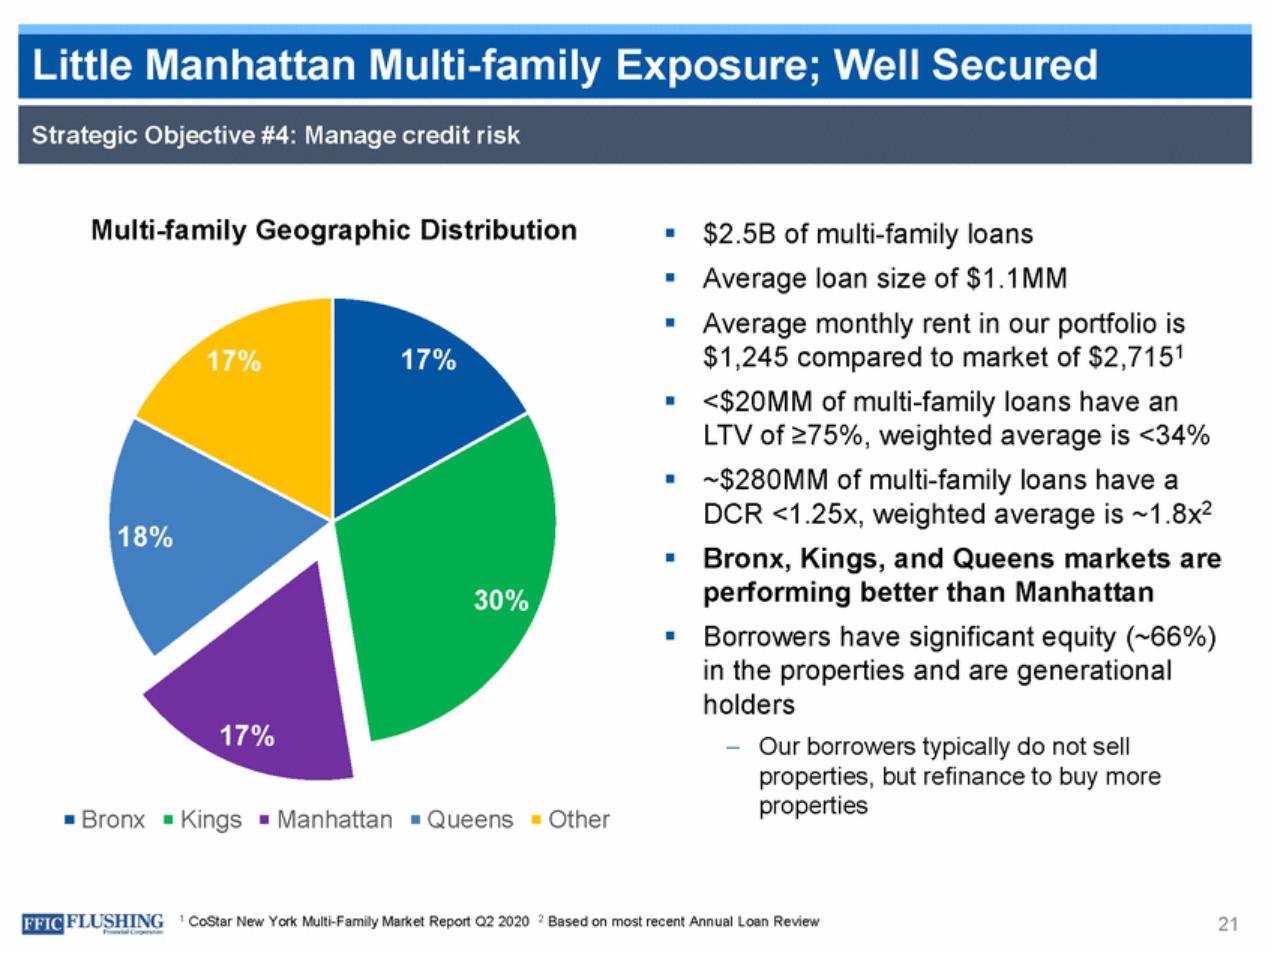
| Multi-family Geographic Distribution $2.5B of multi-family loans Average loan size of $1.1MM Average monthly rent in our portfolio is $1,245 compared to market of $2,7151 <$20MM of multi-family loans have an LTV of ≥75%, weighted average is <34% ~$280MM of multi-family loans have a DCR <1.25x, weighted average is ~1.8x2 Bronx, Kings, and Queens markets are performing better than Manhattan Borrowers have significant equity (~66%) in the properties and are generational holders –Our borrowers typically do not sell properties, but refinance to buy more properties 17% 17% 18% 30% 17% Bronx Kings Manhattan Queens Other 1 CoStar New York Multi-Family Market Report Q2 2020 2 Based on most recent Annual Loan Review 21 Strategic Objective #4: Manage credit risk Little Manhattan Multi-family Exposure; Well Secured |
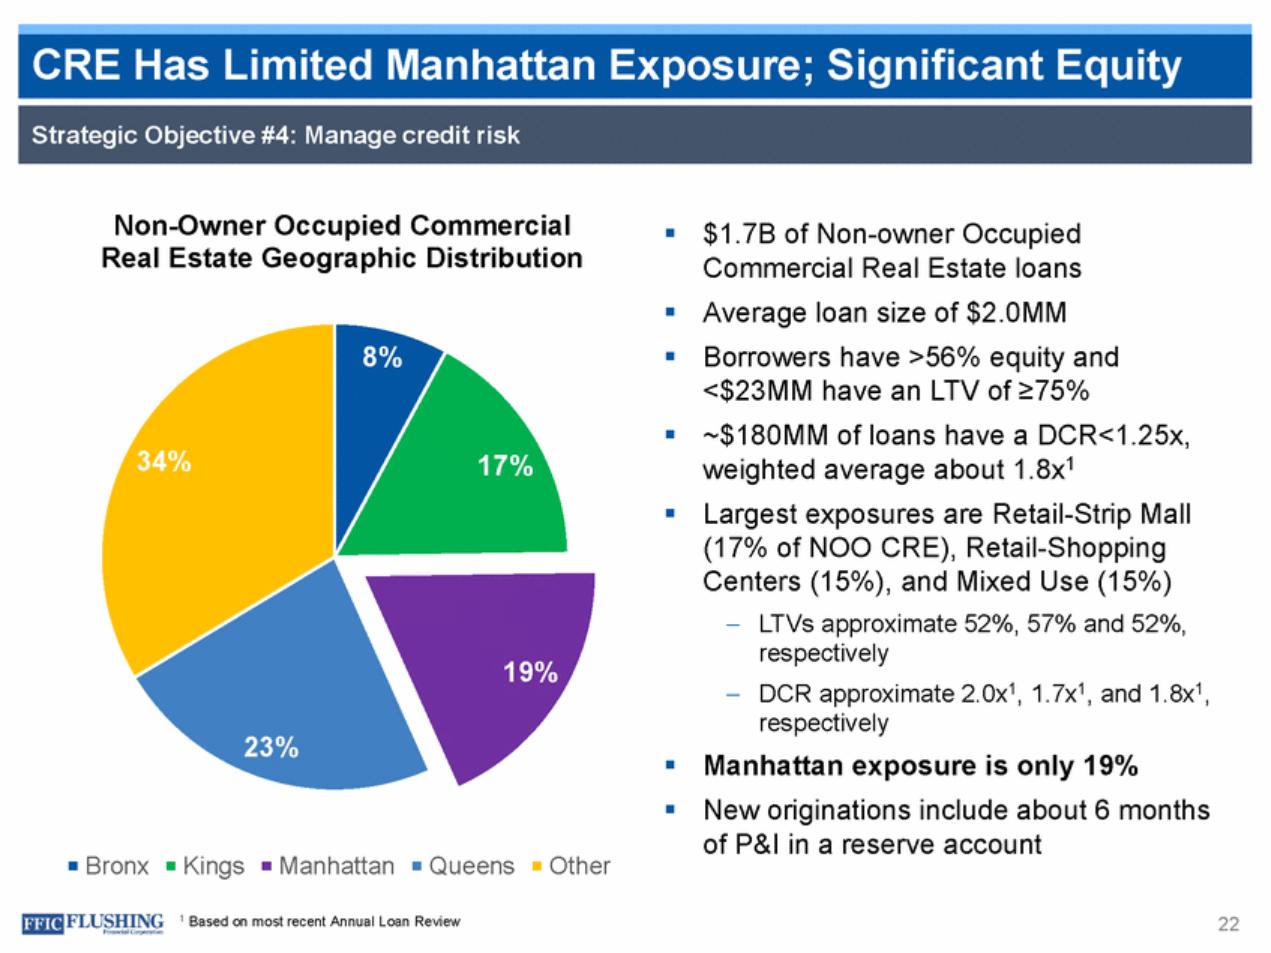
| Non-Owner Occupied Commercial Real Estate Geographic Distribution $1.7B of Non-owner Occupied Commercial Real Estate loans Average loan size of $2.0MM Borrowers have >56% equity and <$23MM have an LTV of ≥75% ~$180MM of loans have a DCR<1.25x, weighted average about 1.8x1 Largest exposures are Retail-Strip Mall (17% of NOO CRE), Retail-Shopping Centers (15%), and Mixed Use (15%) –LTVs approximate 52%, 57% and 52%, respectively –DCR approximate 2.0x1, 1.7x1, and 1.8x1, respectively Manhattan exposure is only 19% New originations include about 6 months of P&I in a reserve account 34% 17% 19% 23% Bronx Kings Manhattan Queens Other 1 Based on most recent Annual Loan Review 22 Strategic Objective #4: Manage credit risk CRE Has Limited Manhattan Exposure; Significant Equity |
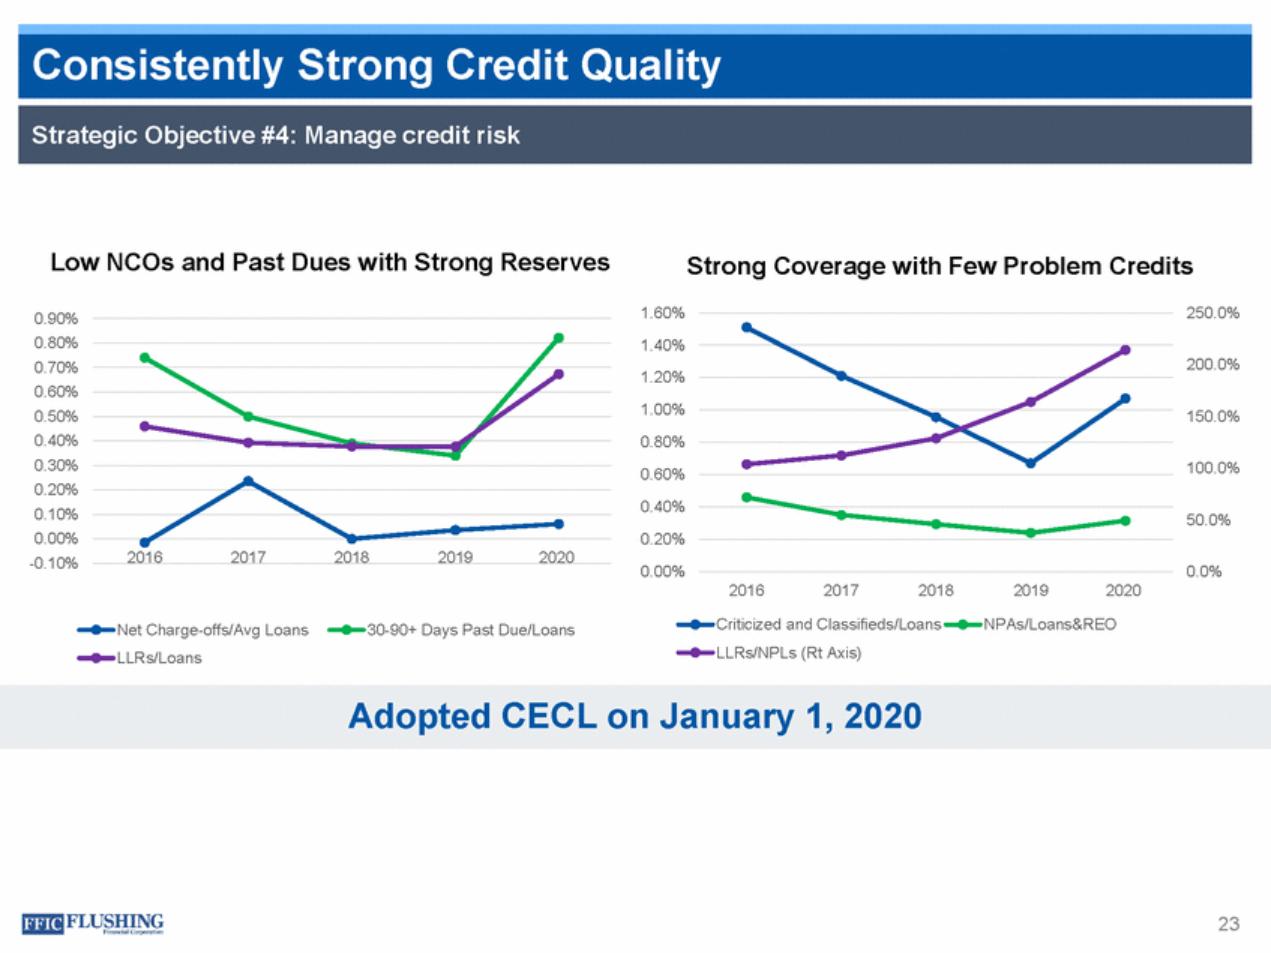
| Low NCOs and Past Dues with Strong Reserves Strong Coverage with Few Problem Credits 1.60% 1.40% 250.0% 0.90% 0.80% 0.70% 0.60% 0.50% 0.40% 0.30% 0.20% 0.10% 0.00% -0.10% 200.0% 1.20% 1.00% 0.80% 150.0% 100.0% 0.60% 0.40% 0.20% 50.0% 2016 2017 2018 2019 2020 0.00% 0.0% 2016 2017 2018 2019 2020 Criticized and Classifieds/Loans LLRs/NPLs (Rt Axis) NPAs/Loans&REO Net Charge-offs/Avg Loans LLRs/Loans 30-90+ Days Past Due/Loans Adopted CECL on January 1, 2020 23 Strategic Objective #4: Manage credit risk Consistently Strong Credit Quality |
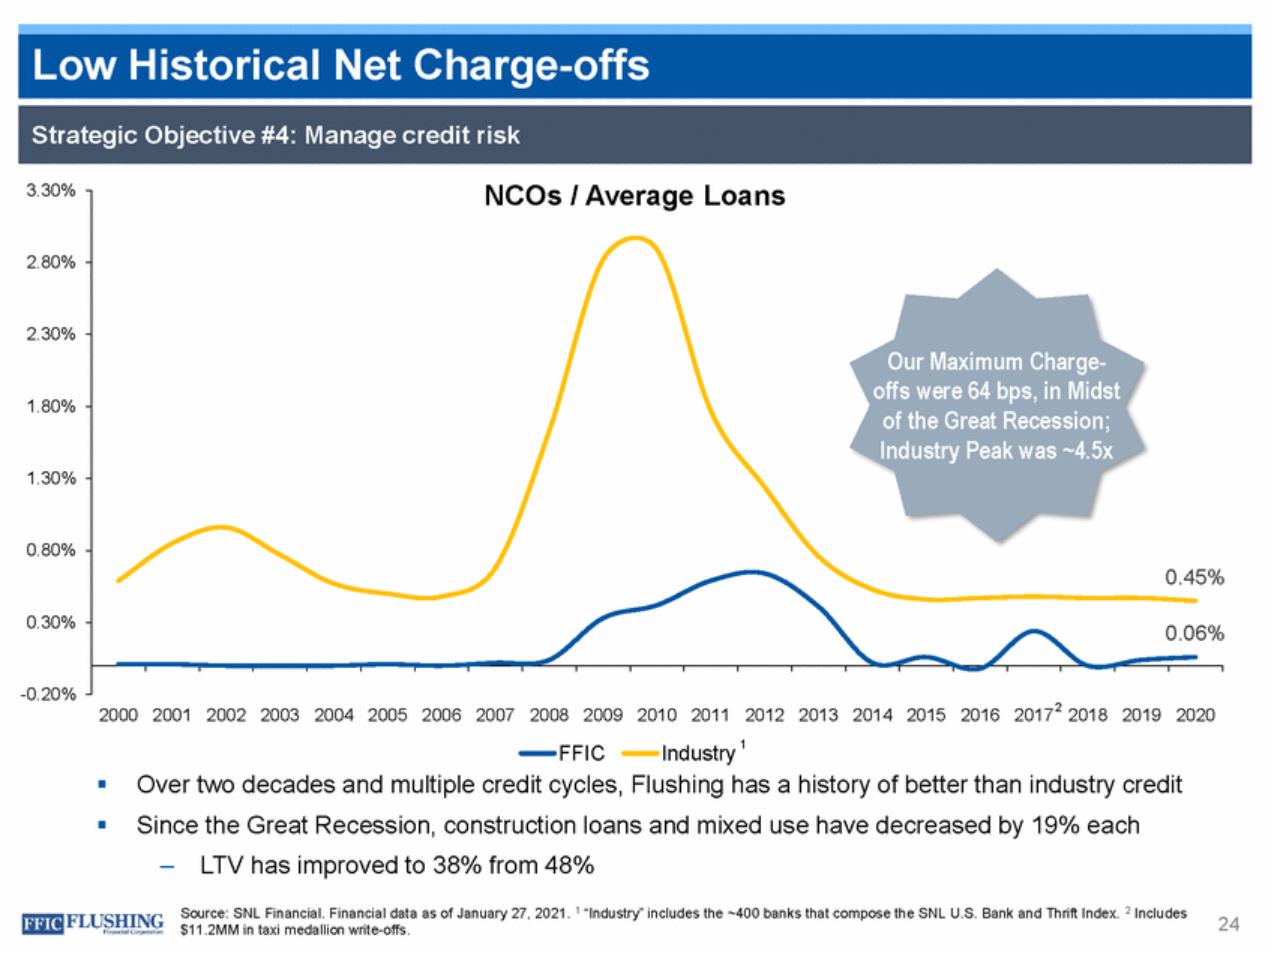
| 3.30% 2.80% 2.30% 1.80% 1.30% 0.80% % 0.30% % -0.20% 2000 2001 2002 2003 2004 2005 2006 2007 2008 2009 2010 2011 2012 2013 2014 2015 2016 2017 2 2018 2019 2020 Industry 1 FFIC Over two decades and multiple credit cycles, Flushing has a history of better than industry credit Since the Great Recession, construction loans and mixed use have decreased by 19% each ‒ LTV has improved to 38% from 48% Source: SNL Financial. Financial data as of January 27, 2021. 1 “Industry” includes the ~400 banks that compose the SNL U.S. Bank and Thrift Index. 2 Includes $11.2MM in taxi medallion write-offs. 24 NCOs / Average Loans Our Maximum Charge-offs were 64 bps, in Midst of the Great Recession; Industry Peak was ~4.5x 0.45 0.06 Strategic Objective #4: Manage credit risk Low Historical Net Charge-offs |
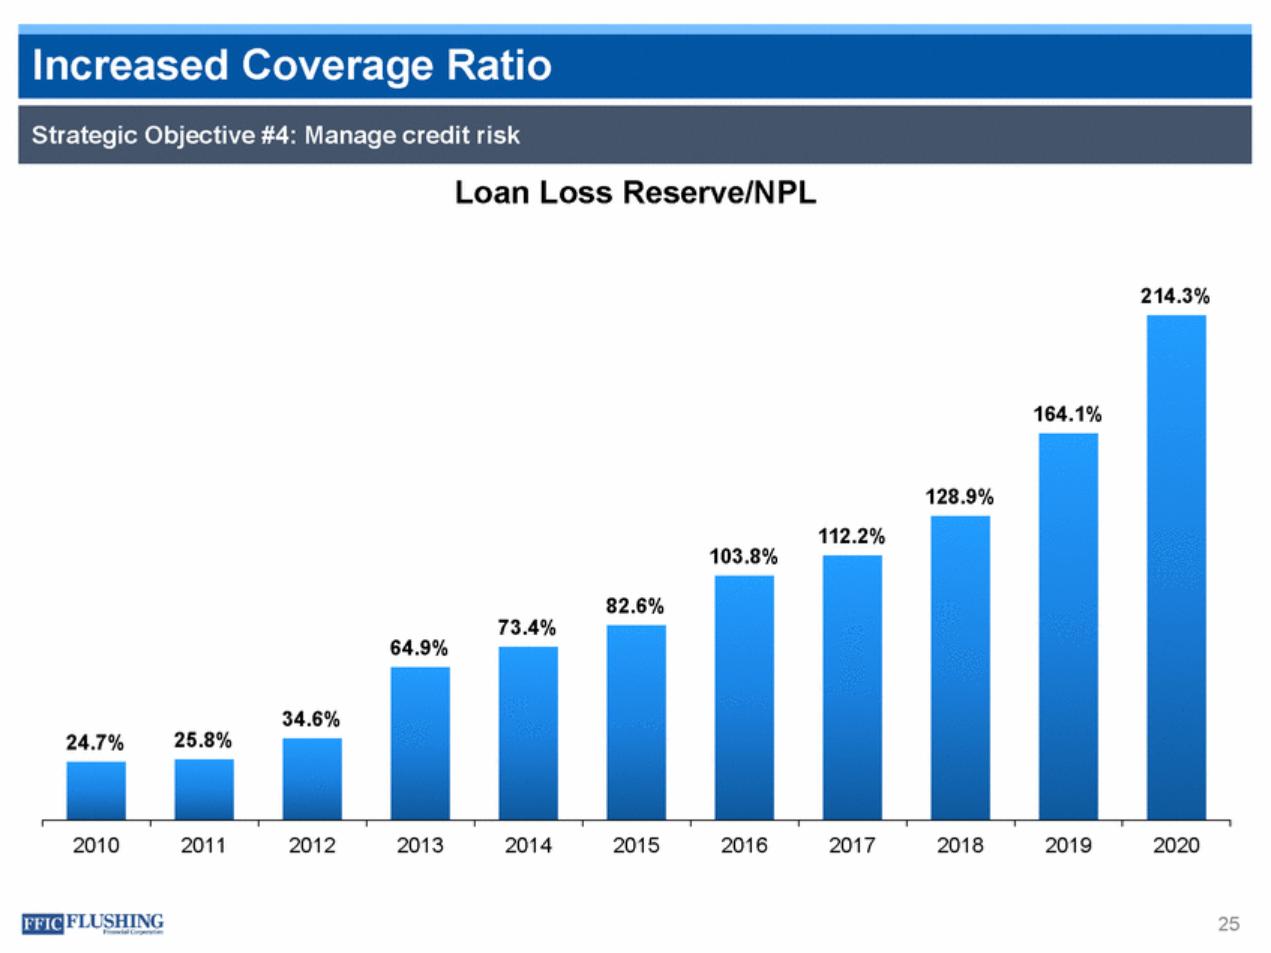
| Loan Loss Reserve/NPL 214.3% 164.1% 128.9% 112.2% 103.8% 82.6% 73.4% 64.9% 34.6% 25.8% 24.7% 2010 2011 2012 2013 2014 2015 2016 2017 2018 2019 2020 25 Strategic Objective #4: Manage credit risk Increased Coverage Ratio |
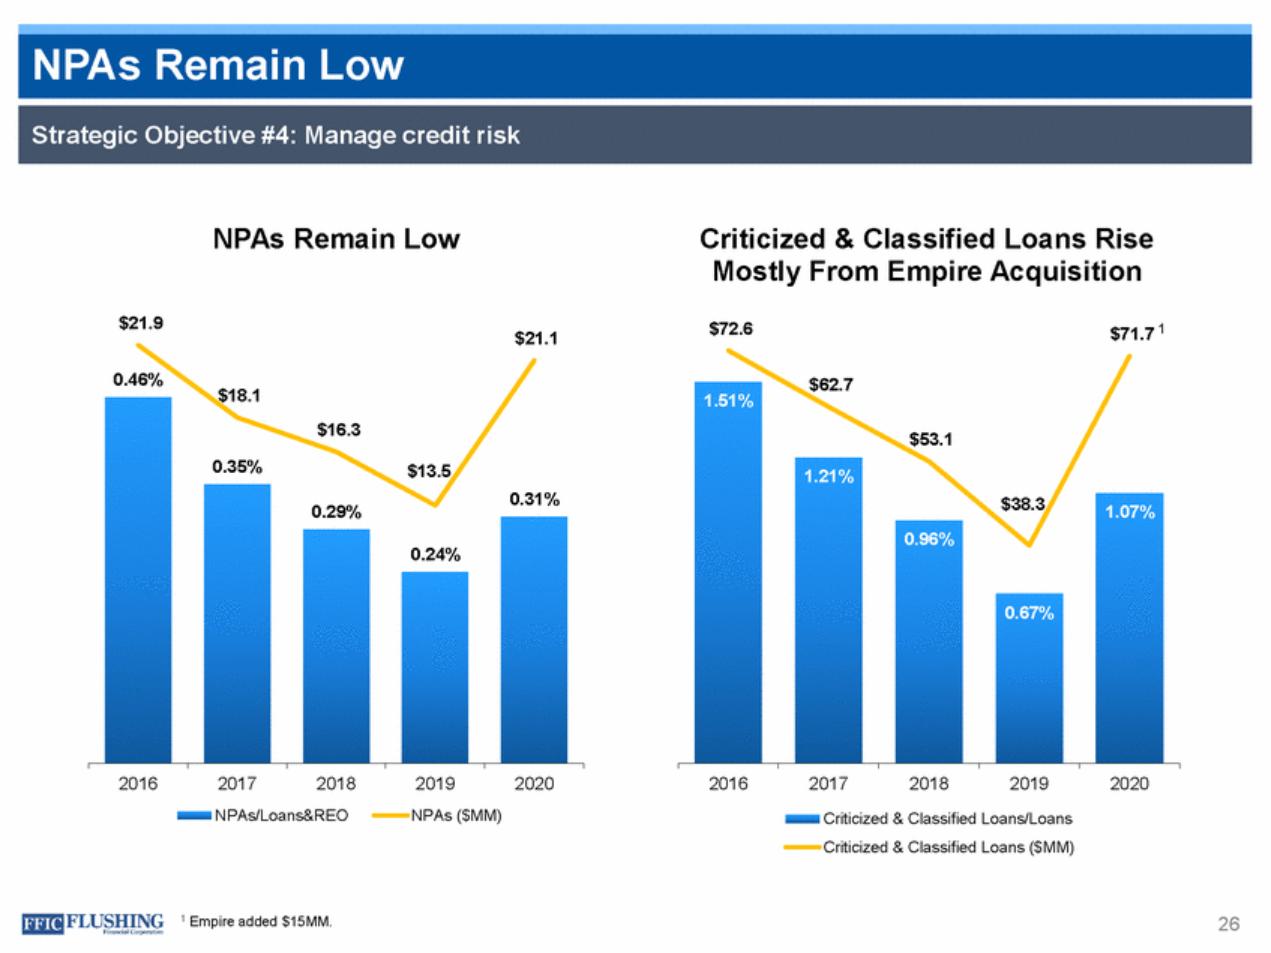
| NPAs Remain Low Criticized & Classified Loans Rise Mostly From Empire Acquisition $21.9 $72.6 1 $71.7 $21.1 0.46% $62.7 $18.1 1.51% $16.3 $53.1 0.35% $13.5 1.21% 0.31% $38.3 0.29% 1.07% 0.96% 0.24% 0.67% 2016 2017 2018 2019 NPAs ($MM) 2020 2016 2017 2018 2019 2020 NPAs/Loans&REO Criticized & Classified Loans/Loans Criticized & Classified Loans ($MM) 1 Empire added $15MM. 26 Strategic Objective #4: Manage credit risk NPAs Remain Low |
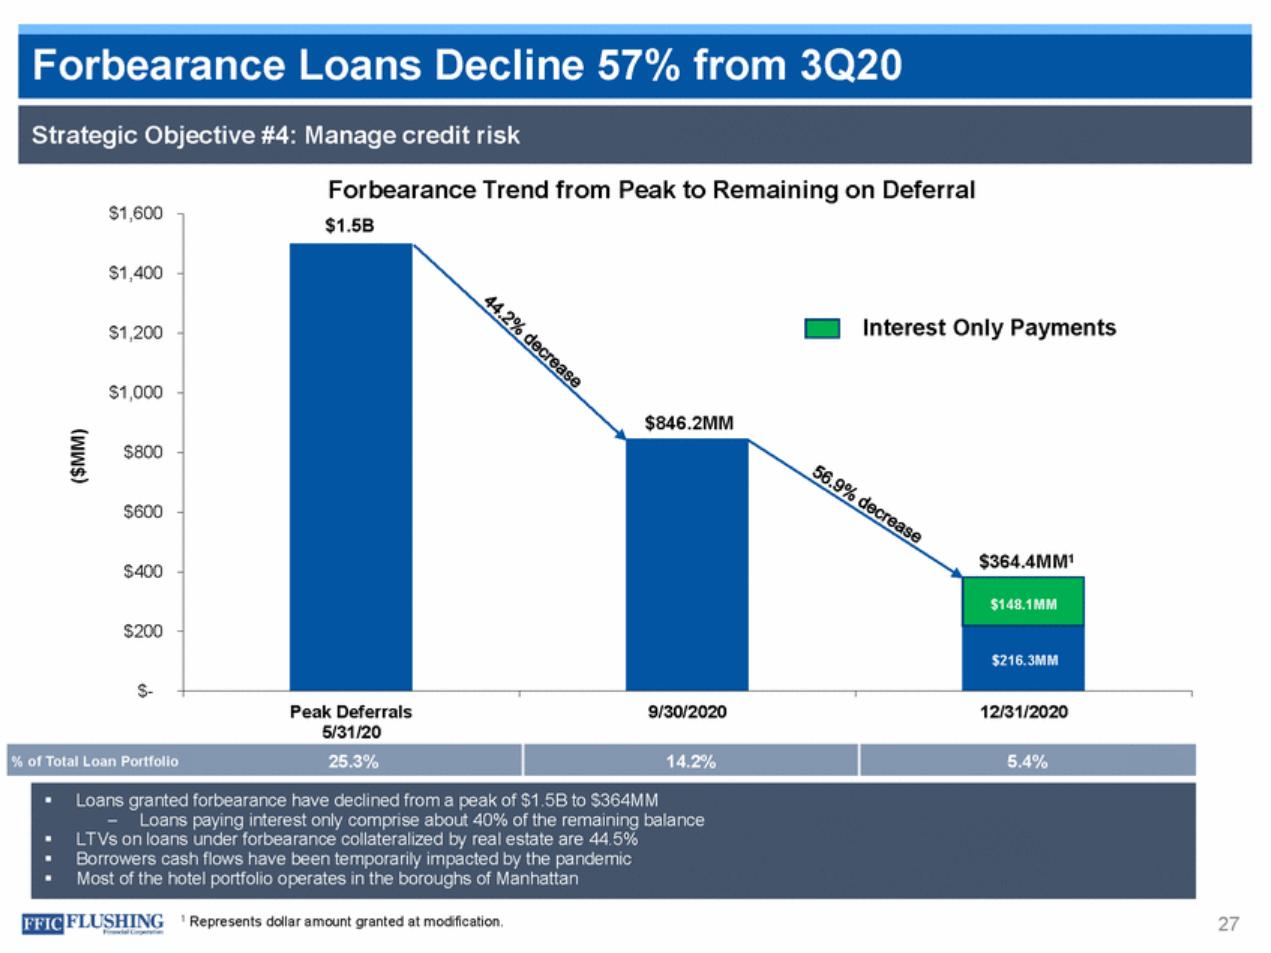
| Forbearance Trend from Peak to Remaining on Deferral $1,600 $1,400 $1,200 $1,000 $800 $600 $400 $200 $-Peak Deferrals 5/31/20 9/30/2020 12/31/2020 25.3% 14.2% 5.4% % of Total Loan Portfolio 1 Represents dollar amount granted at modification. 27 ($MM) Loans granted forbearance have declined from a peak of $1.5B to $364MM –Loans paying interest only comprise about 40% of the remaining balance LTVs on loans under forbearance collateralized by real estate are 44.5% Borrowers cash flows have been temporarily impacted by the pandemic Most of the hotel portfolio operates in the boroughs of Manhattan $1.5B Interest Only Payments $846.2MM $364.4MM1 $148.1MM $216.3MM Strategic Objective #4: Manage credit risk Forbearance Loans Decline 57% from 3Q20 |
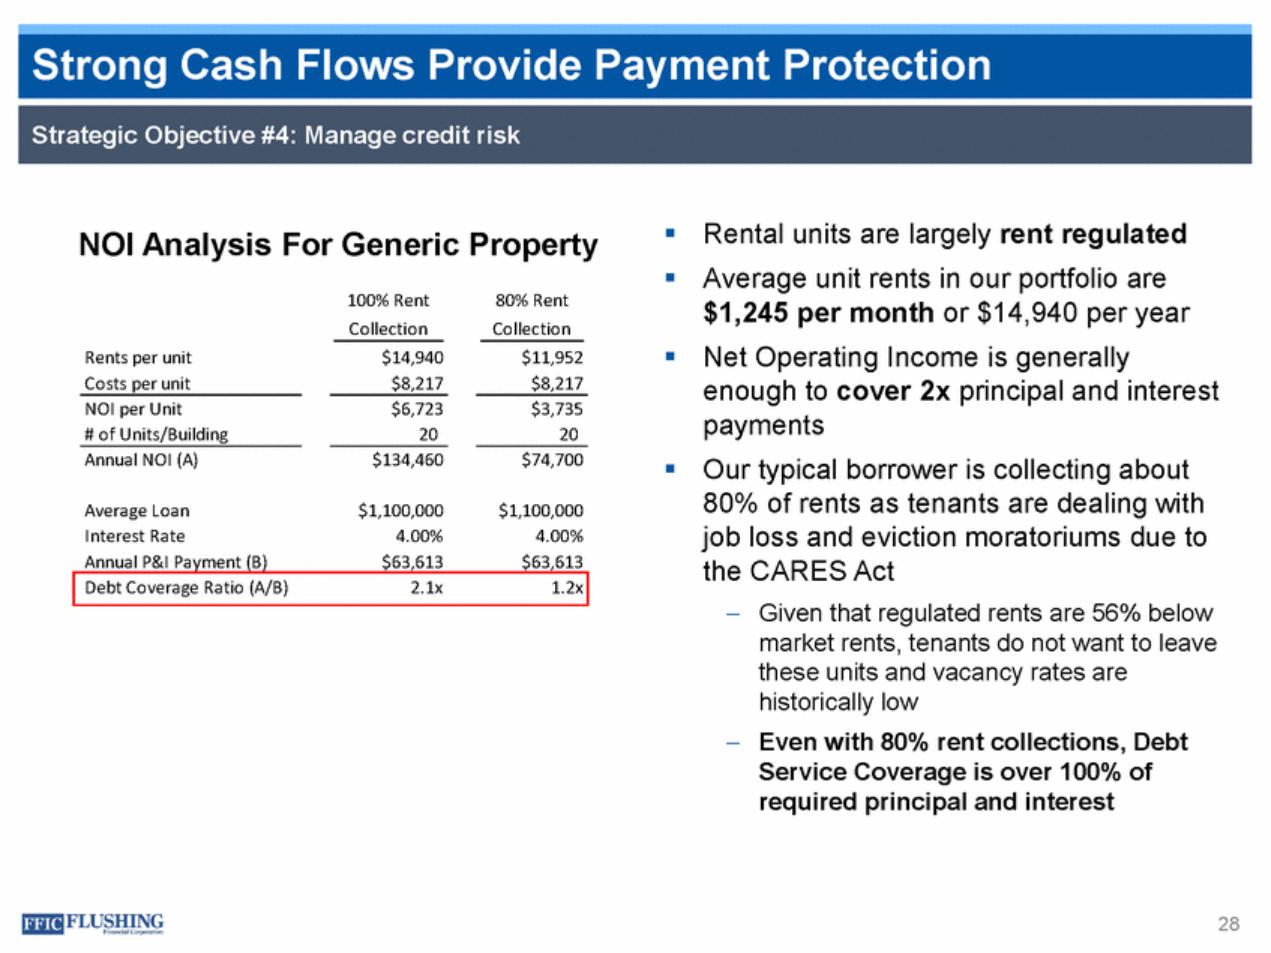
| Rental units are largely rent regulated Average unit rents in our portfolio are $1,245 per month or $14,940 per year Net Operating Income is generally enough to cover 2x principal and interest payments Our typical borrower is collecting about 80% of rents as tenants are dealing with job loss and eviction moratoriums due to the CARES Act NOI Analysis For Generic 100% Rent Collection Property 80% Rent Collection Rents per unit Costs per unit $14,940 $8,217 $11,952 $8,217 NOI per Unit # of Units/Building $6,723 20 $3,735 20 Annual NOI (A) $134,460 $74,700 Average Loan Interest Rate Annual P&I Payment (B) $1,100,000 4.00% $63,613 $1,100,000 4.00% $63,613 – Given that regulated rents are 56% below market rents, tenants do not want to leave these units and vacancy rates are historically low Even with 80% rent collections, Debt Service Coverage is over 100% of required principal and interest – 28 Debt Coverage Ratio (A/B) 2.1x 1.2x Strategic Objective #4: Manage credit risk Strong Cash Flows Provide Payment Protection |
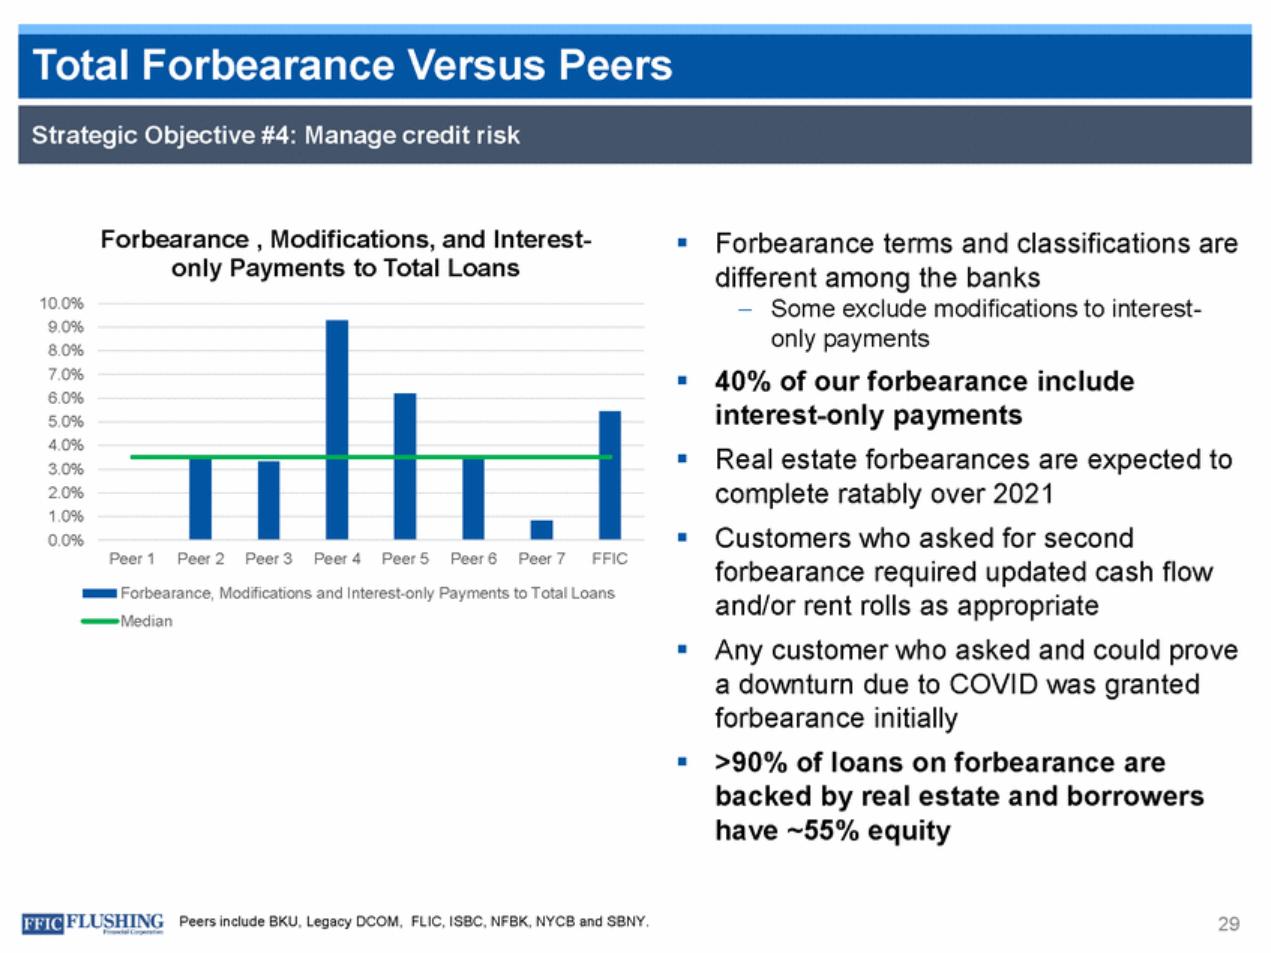
| Forbearance , Modifications, and Interest-only Payments to Total Loans Forbearance terms and classifications are different among the banks –Some exclude modifications to interest-only payments 40% of our forbearance include interest-only payments Real estate forbearances are expected to complete ratably over 2021 Customers who asked for second forbearance required updated cash flow and/or rent rolls as appropriate Any customer who asked and could prove a downturn due to COVID was granted forbearance initially >90% of loans on forbearance are backed by real estate and borrowers have ~55% equity 10.0% 9.0% 8.0% 7.0% 6.0% 5.0% 4.0% 3.0% 2.0% 1.0% 0.0% Peer 1 Peer 2 Peer 3 Peer 4 Peer 5 Peer 6 Peer 7 FFIC Forbearance, Modifications and Interest-only Payments to Total Loans Median Peers include BKU, Legacy DCOM, FLIC, ISBC, NFBK, NYCB and SBNY. 29 Strategic Objective #4: Manage credit risk Total Forbearance Versus Peers |
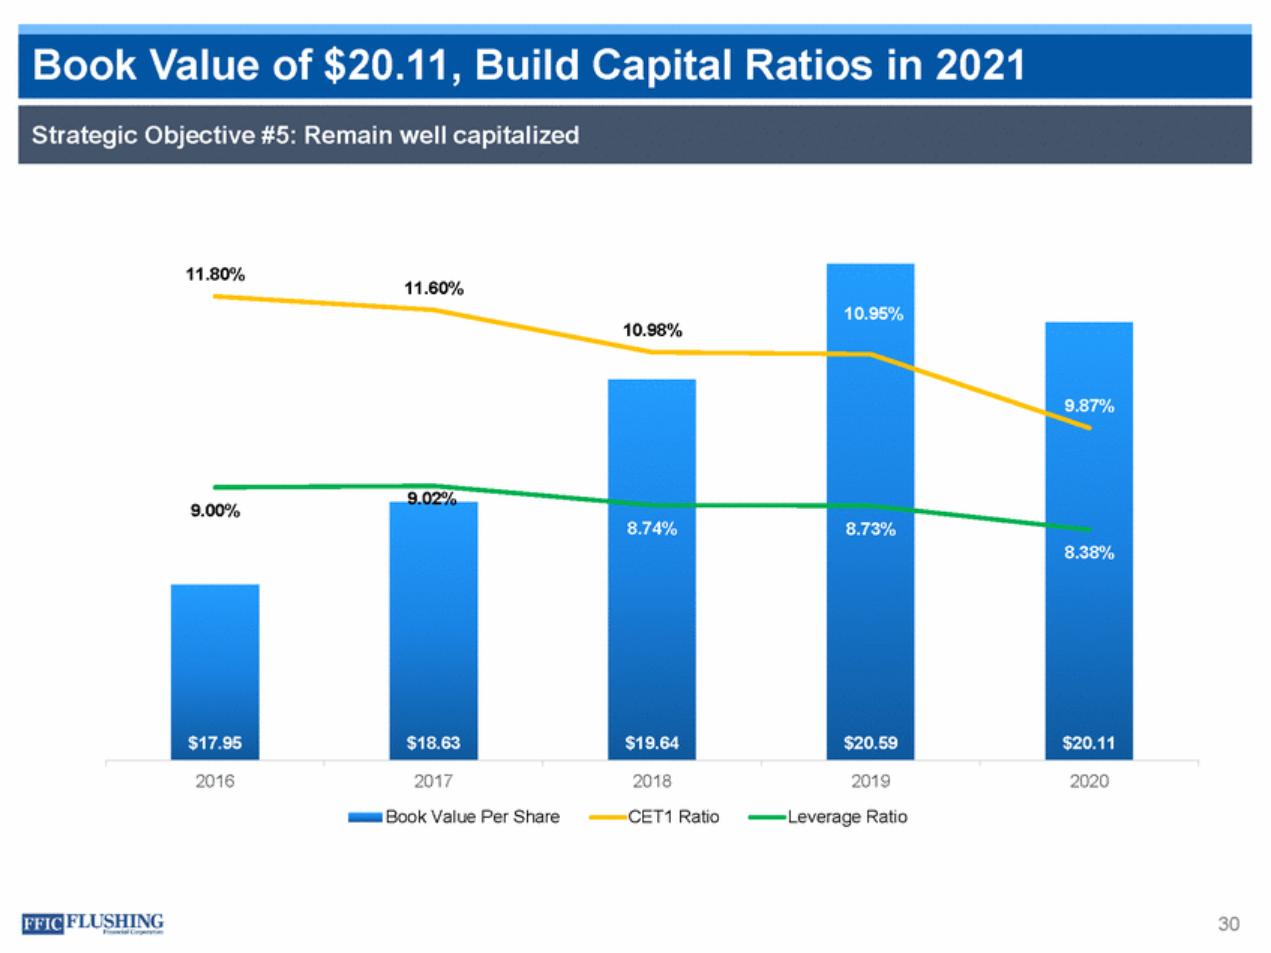
| 11.80% 11.60% 10.95% 10.98% 9.87% 9.02% 9.00% 8.74% 8.73% 8.38% $17.95 $18.63 $19.64 $20.59 $20.11 2016 2017 Book Value Per Share 2018 CET1 Ratio 2019 Leverage Ratio 2020 30 Strategic Objective #5: Remain well capitalized Book Value of $20.11, Build Capital Ratios in 2021 |
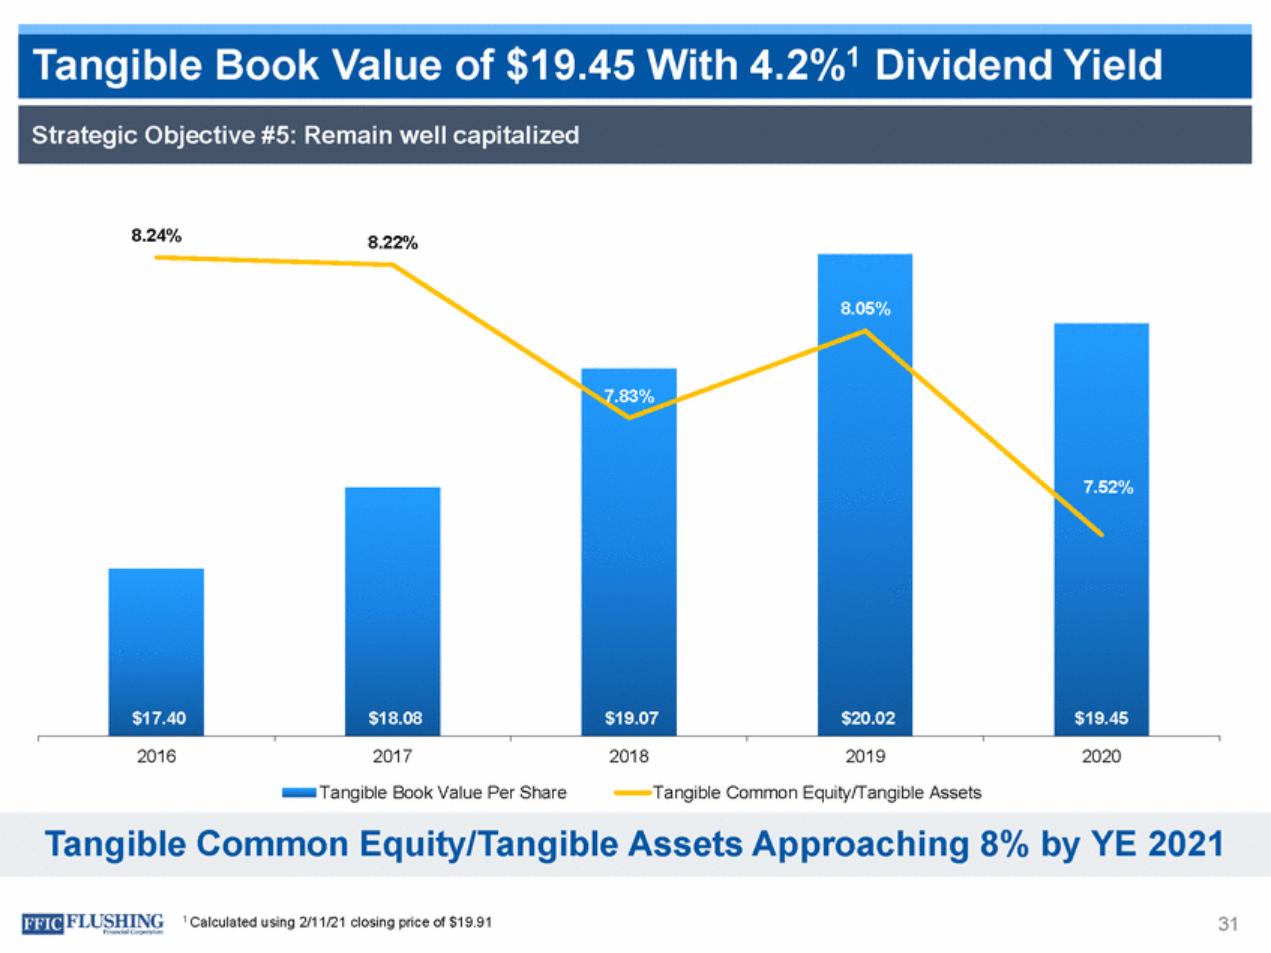
| 8.24% 8.22% 8.05% 7.83% 7.52% $17.40 $18.08 $19.07 $20.02 $19.45 2016 2017 Tangible Book Value Per Share 2018 2019 Tangible Common Equity/Tangible Assets 2020 Tangible Common Equity/Tangible Assets Approaching 8% by YE 2021 31 1 Calculated using 2/11/21 closing price of $19.91 Strategic Objective #5: Remain well capitalized Tangible Book Value of $19.45 With 4.2%1 Dividend Yield |
| We are cautiously optimistic about the operating environment –Steeper yield curve –Fiscal stimulus and vaccine roll out should have a positive impact on the economy and borrowers We are watching –COVID cases near term and what that might mean for the local economy –Potential tax policy and regulatory changes Loan pipelines are solid Empire integration is complete and performance is in line with expectations We remain very comfortable with our credit profile Overall, we are on the right path to reach our LT goals ROA ≥1% and ROE ≥10% of having an 32 Outlook |
| Appendix |

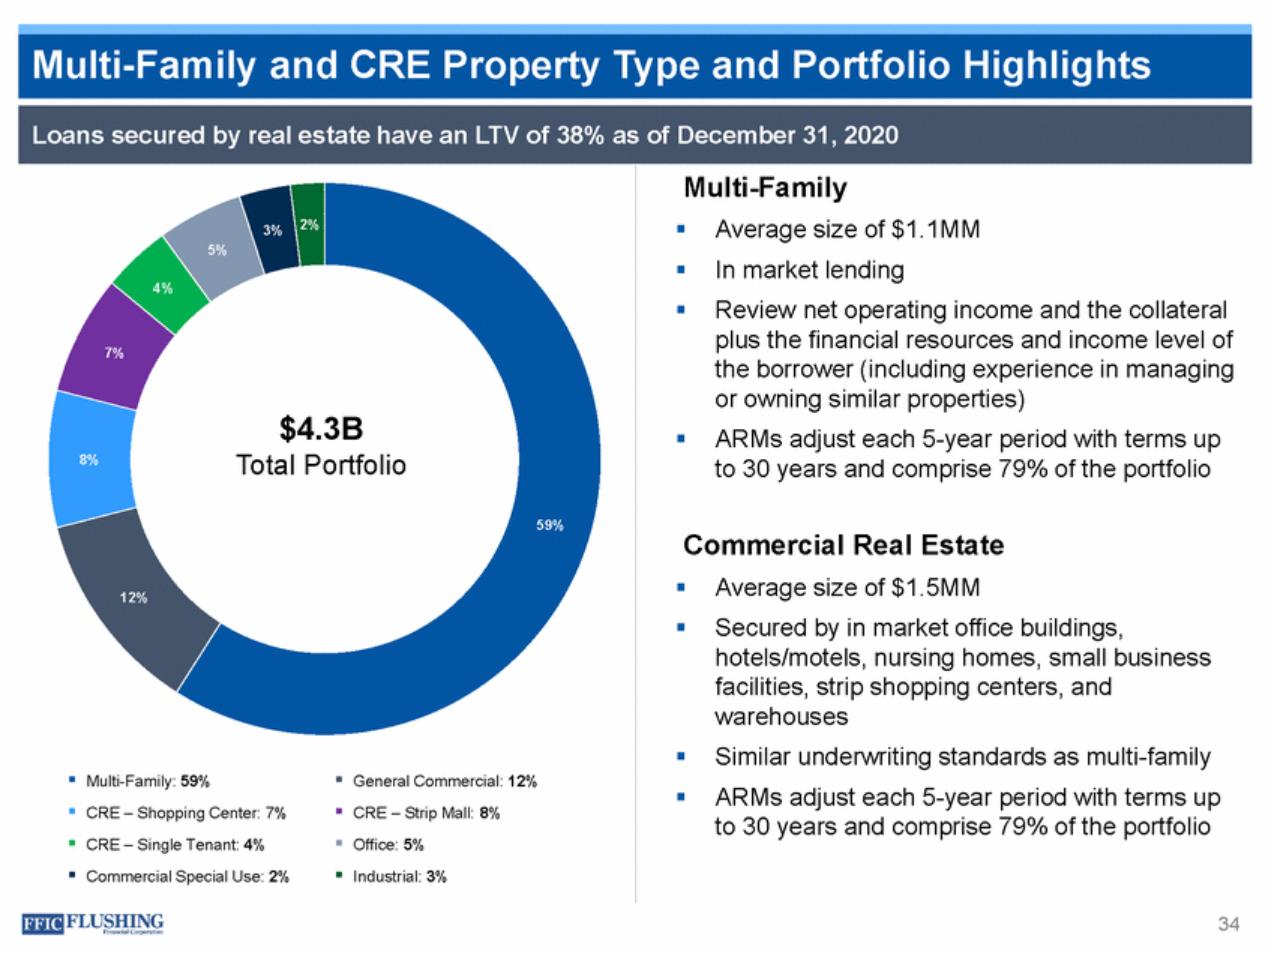
| to 30 years and comprise 79% of the portfolio to 30 years and comprise 79% of the portfolio 34 Loans secured by real estate have an LTV of 38% as of December 31, 2020 3% 2% 5% 7% $4.3B 8%Total Portfolio 59% 12% Multi-Family: 59% General Commercial: 12% CRE – Shopping Center: 7% CRE – Strip Mall: 8% CRE – Single Tenant: 4% Office: 5% Commercial Special Use: 2% Industrial: 3% Multi-Family Average size of $1.1MM In market lending Review net operating income and the collateral plus the financial resources and income level of the borrower (including experience in managing or owning similar properties) ARMs adjust each 5-year period with terms up Commercial Real Estate Average size of $1.5MM Secured by in market office buildings, hotels/motels, nursing homes, small business facilities, strip shopping centers, and warehouses Similar underwriting standards as multi-family ARMs adjust each 5-year period with terms up Multi-Family and CRE Property Type and Portfolio Highlights |
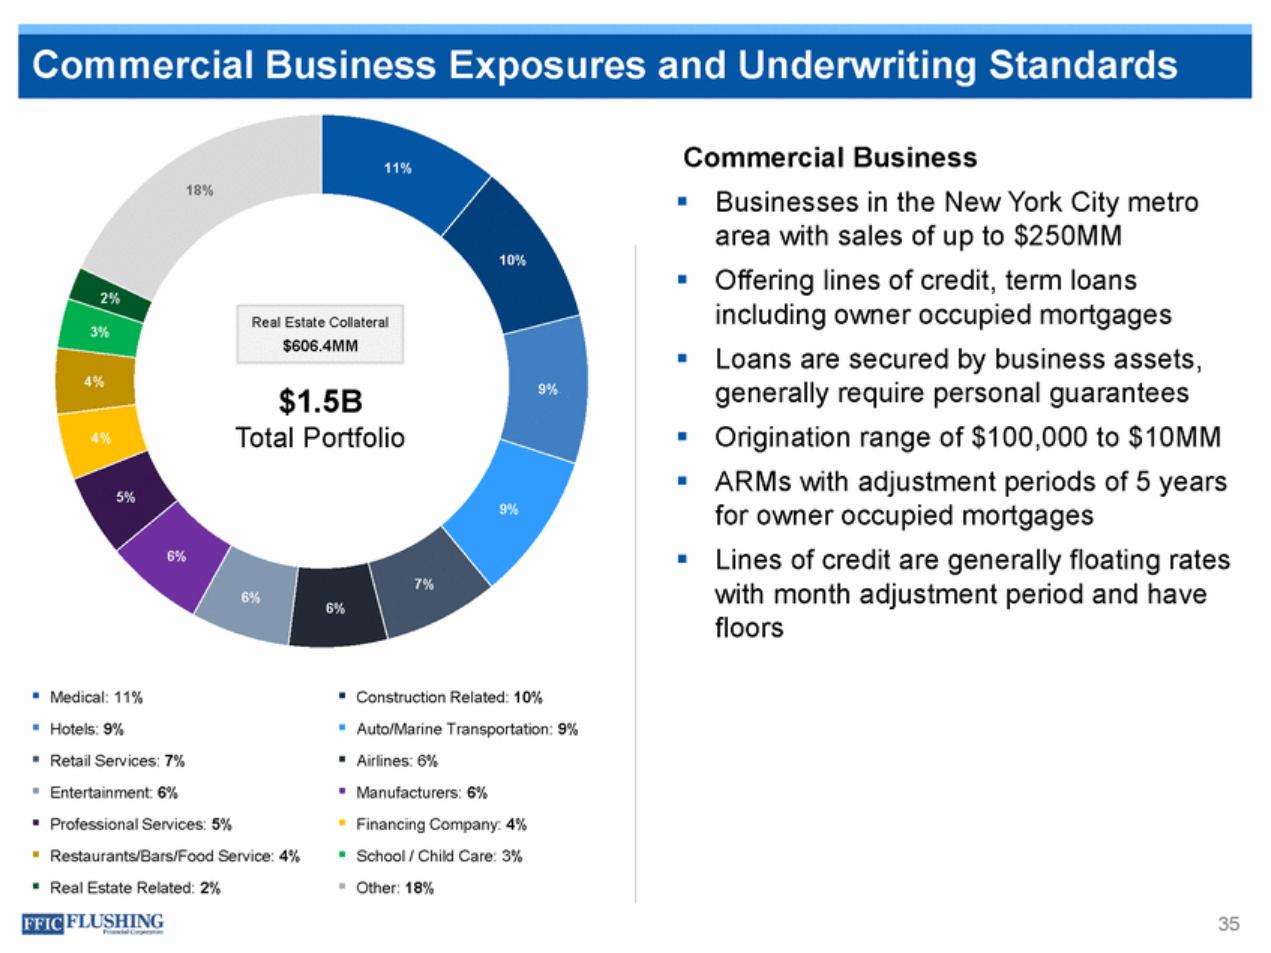
| Commercial Business 11% 18% Businesses in the New York City metro area with sales of up to $250MM Offering lines of credit, term loans including owner occupied mortgages Loans are secured by business assets, generally require personal guarantees Origination range of $100,000 to $10MM ARMs with adjustment periods of 5 years for owner occupied mortgages Lines of credit are generally floating rates with month adjustment period and have floors 10% 3% 4% 9% $1.5B Total Portfolio 4% 5% 9% 6% 7% 6% 6% Medical: 11% Hotels: 9% Retail Services: 7% Entertainment: 6% Professional Services: 5% Restaurants/Bars/Food Service: 4% Real Estate Related: 2% Construction Related: 10% Auto/Marine Transportation: 9% Airlines: 6% Manufacturers: 6% Financing Company: 4% School / Child Care: 3% Other: 18% 35 Real Estate Collateral $606.4MM Commercial Business Exposures and Underwriting Standards |
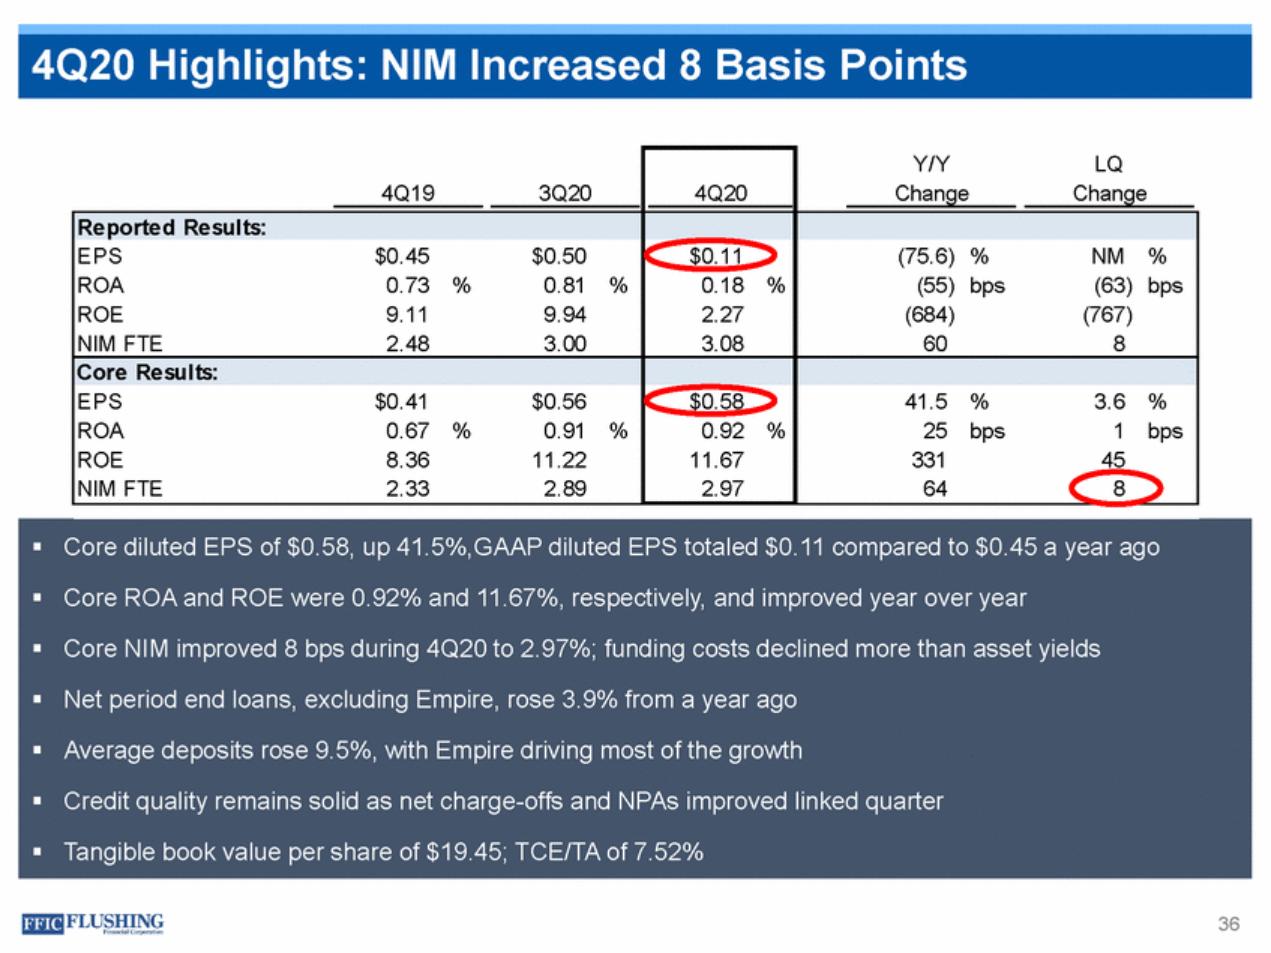
| 36 Core diluted EPS of $0.58, up 41.5%,GAAP diluted EPS totaled $0.11 compared to $0.45 a year ago Core ROA and ROE were 0.92% and 11.67%, respectively, and improved year over year Core NIM improved 8 bps during 4Q20 to 2.97%; funding costs declined more than asset yields Net period end loans, excluding Empire, rose 3.9% from a year ago Average deposits rose 9.5%, with Empire driving most of the growth Credit quality remains solid as net charge-offs and NPAs improved linked quarter Tangible book value per share of $19.45; TCE/TA of 7.52% 4Q19 3Q20 4Q20 Y/Y LQ Change Change Reported Results: EPS $0.45 $0.50 ROA 0.73 % 0.81 % ROE 9.11 9.94 NIM FTE 2.48 3.00 $0.11 0.18 % 2.27 3.08 (75.6) % NM % (55) bps (63) bps (684) (767) 60 8 Core Results: EPS $0.41 $0.56 ROA 0.67 % 0.91 % ROE 8.36 11.22 NIM FTE 2.33 2.89 $0.58 0.92 % 11.67 2.97 41.5 % 3.6 % 25 bps 1 bps 331 45 64 8 4Q20 Highlights: NIM Increased 8 Basis Points |
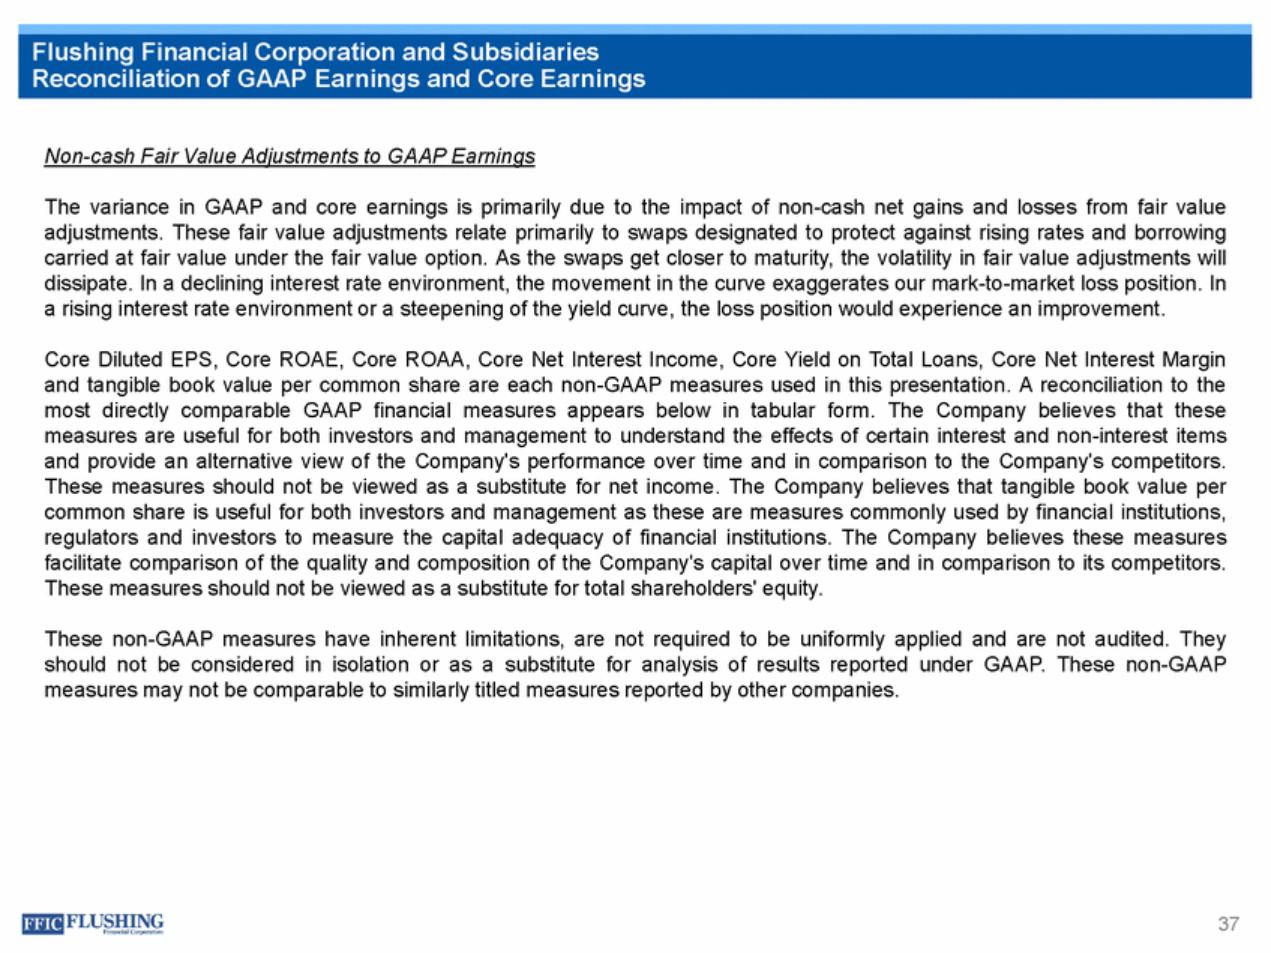
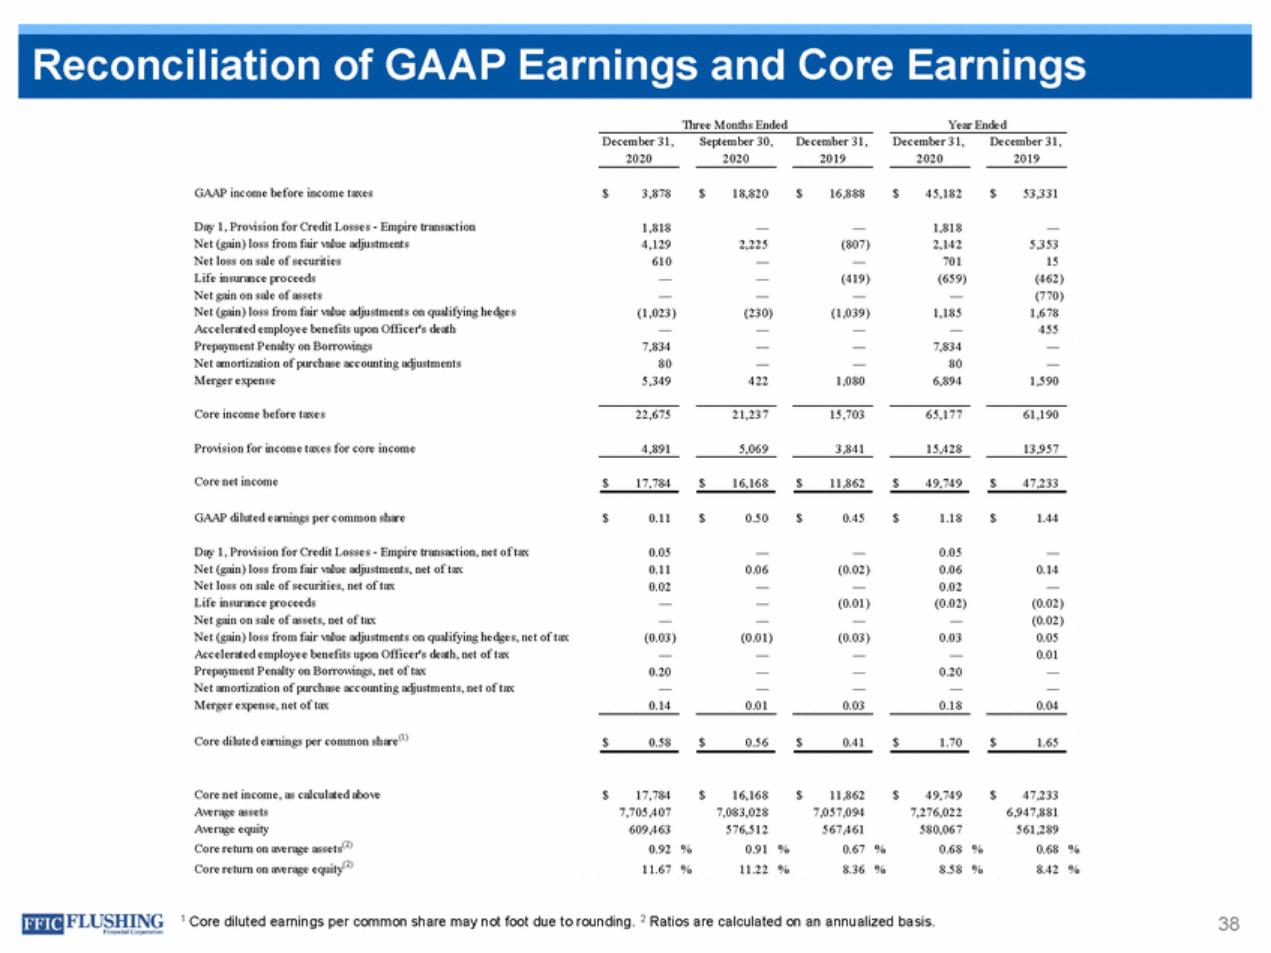
| Non-cash Fair Value Adjustments to GAAP Earnings The variance in GAAP and core earnings is primarily due to the impact of non-cash net gains and losses from fair value adjustments. These fair value adjustments relate primarily to swaps designated to protect against rising rates and borrowing carried at fair value under the fair value option. As the swaps get closer to maturity, the volatility in fair value adjustments will dissipate. In a declining interest rate environment, the movement in the curve exaggerates our mark-to-market loss position. In a rising interest rate environment or a steepening of the yield curve, the loss position would experience an improvement. Core Diluted EPS, Core ROAE, Core ROAA, Core Net Interest Income, Core Yield on Total Loans, Core Net Interest Margin and tangible book value per common share are each non-GAAP measures used in this presentation. A reconciliation to the most directly comparable GAAP financial measures appears below in tabular form. The Company believes that these measures are useful for both investors and management to understand the effects of certain interest and non-interest items and provide an alternative view of the Company's performance over time and in comparison to the Company's competitors. These measures should not be viewed as a substitute for net income. The Company believes that tangible book value per common share is useful for both investors and management as these are measures commonly used by financial institutions, regulators and investors to measure the capital adequacy of financial institutions. The Company believes these measures facilitate comparison of the quality and composition of the Company's capital over time and in comparison to its competitors. These measures should not be viewed as a substitute for total shareholders' equity. These non-GAAP measures have inherent limitations, are not required to be uniformly applied and are not audited. They should not be considered in isolation or as a substitute for analysis of results reported under GAAP. These non-GAAP measures may not be comparable to similarly titled measures reported by other companies. 37 Flushing Financial Corporation and Subsidiaries Reconciliation of GAAP Earnings and Core Earnings |
| Three Months Ended Year Ended December 31, 2020 September 30, 2020 December 31, 2019 December 31, 2020 December 31, 2019 GAAP income before income taxes $ 3,878 $ 18,820 $ 16,888 $ 45,182 $ 53,331 Day 1, Provision for Credit Losses - Empire transaction Net (gain) loss from fair value adjustments Net loss on sale of securities Life insurance proceeds Net gain on sale of assets Net (gain) loss from fair value adjustments on qualifying hedges Accelerated employee benefits upon Officer's death Prepayment Penalty on Borrowings Net amortization of purchase accounting adjustments Merger expense 1,818 4,129 610 — — (1,023) — 7,834 80 5,349 — 2,225 — — — (230) — — — 422 — (807) — (419) — (1,039) — — — 1,080 1,818 2,142 701 (659) — 1,185 — 7,834 80 6,894 — 5,353 15 (462) (770) 1,678 455 — — 1,590 Core income before taxes 22,675 21,237 15,703 65,177 61,190 Provision for income taxes for core income 4,891 5,069 3,841 15,428 13,957 Core net income $ 17,784 $ 16,168 $ 11,862 $ 49,749 $ 47,233 GAAP diluted earnings per common share $ 0.11 $ 0.50 $ 0.45 $ 1.18 $ 1.44 Day 1, Provision for Credit Losses - Empire transaction, net of tax Net (gain) loss from fair value adjustments, net of tax Net loss on sale of securities, net of tax Life insurance proceeds Net gain on sale of assets, net of tax Net (gain) loss from fair value adjustments on qualifying hedges, net of tax Accelerated employee benefits upon Officer's death, net of tax Prepayment Penalty on Borrowings, net of tax Net amortization of purchase accounting adjustments, net of tax Merger expense, net of tax 0.05 0.11 0.02 — — (0.03) — 0.20 — 0.14 — 0.06 — — — (0.01) — — — 0.01 — (0.02) — (0.01) — (0.03) — — — 0.03 0.05 0.06 0.02 (0.02) — 0.03 — 0.20 — 0.18 — 0.14 — (0.02) (0.02) 0.05 0.01 — — 0.04 Core diluted earnings per common share(1) $ 0.58 $ 0.56 $ 0.41 $ 1.70 $ 1.65 Core net income, as calculated above Average assets Average equity Core return on average assets(2) Core return on average equity(2) $ 17,784 7,705,407 609,463 0.92 11.67 $ 16,168 7,083,028 576,512 0.91 11.22 $ 11,862 7,057,094 567,461 0.67 8.36 $ 49,749 7,276,022 580,067 0.68 8.58 $ 47,233 6,947,881 561,289 0.68 8.42 % % % % % % % % % % 1 Core diluted earnings per common share may not foot due to rounding. 2 Ratios are calculated on an annualized basis. 38 Reconciliation of GAAP Earnings and Core Earnings |
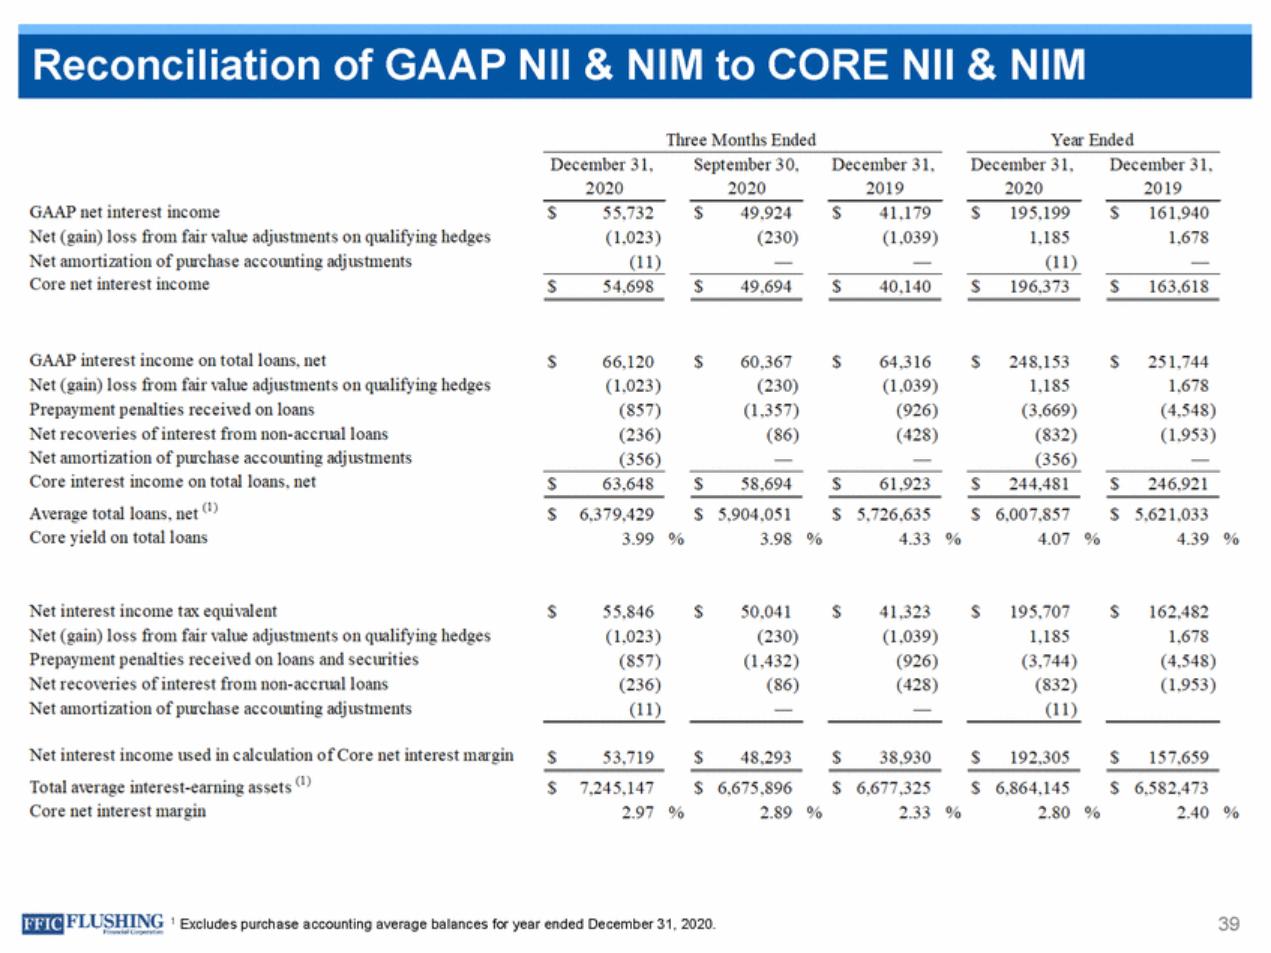
| Nil NIM Three Months Ended Year Ended December 31, 2020 September 30, 2020 December 31, 2019 December 31, 2020 December 31, 2019 GAAP net interest income Net (gain) loss from fair value adjustments on qualifying hedges Net am011izat ion of pmchase accounting adj ustments Core net interes t income 55,732 (1,023) (11) 49,924 (230) 41,179 (1,039) 195,199 1,185 (11) 161,940 1,678 $ $ $ $ $ 54,698 49,694 40,140 196,373 163,618 $ $ $ $ $ GAAP interest income on total loans, net Net (gain) loss from fair value adjustments o n qualifying hedges Prepayment penalties received on loans Net recoveries of interest from non-accmal loans Net am01tizat ion of pmchase accounting adj ustments Core interest inc ome on total loans, net Average total loans, net (I ) Core yield on total loans 66,120 (1,023) (857) (236) (356) 60,367 (230) (1,357) (86) 64,316 (1,039) (926) (428) 248,153 1,185 (3,669) (832) (356) 251,744 1,678 (4,548) (1,953) $ $ $ $ $ 63,648 58,694 61,923 244,481 246,921 $ $ $ $ $ $ $ $ $ $ 6,379,429 3.99 5,904,051 3.98 5,726,635 4.33 6,007,857 4.07 5,621,033 4.39 % % % % % Net interest income tax equivalent Net (gain) loss from fair value adjustments on qualifying hedges Prepayment penalties received on loans and securities Net recoveries of interest from non-accrual loans Net am011izat ion of pmchase accounting adj ustments $ 55,846 (1,023) (857) (236) (11) $ 50,041 (230) (1,432) (86) $ 41,323 (1,039) (926) (428) $ 195,707 1,185 (3,744) (832) (11) $ 162,482 1,678 (4,548) (1,953) Net interest income used in calculation of Core net interest margin Total average interest-earning assets (I) Core net interest mru·gin 53,719 48,293 38,930 192,305 157,659 $ $ $ $ $ $ $ $ $ 7,245,147 2.97 6,675,896 2.89 6,677,325 2.33 6,864,145 2.80 6,582,473 2.40 $ % % % % % [J]I!IFLU§.!!J Q 1 Excludes purchase accounting average balances for year ended December 31, 2020. 39 & NIM to CORE Nil & Reconciliation of GAAP |
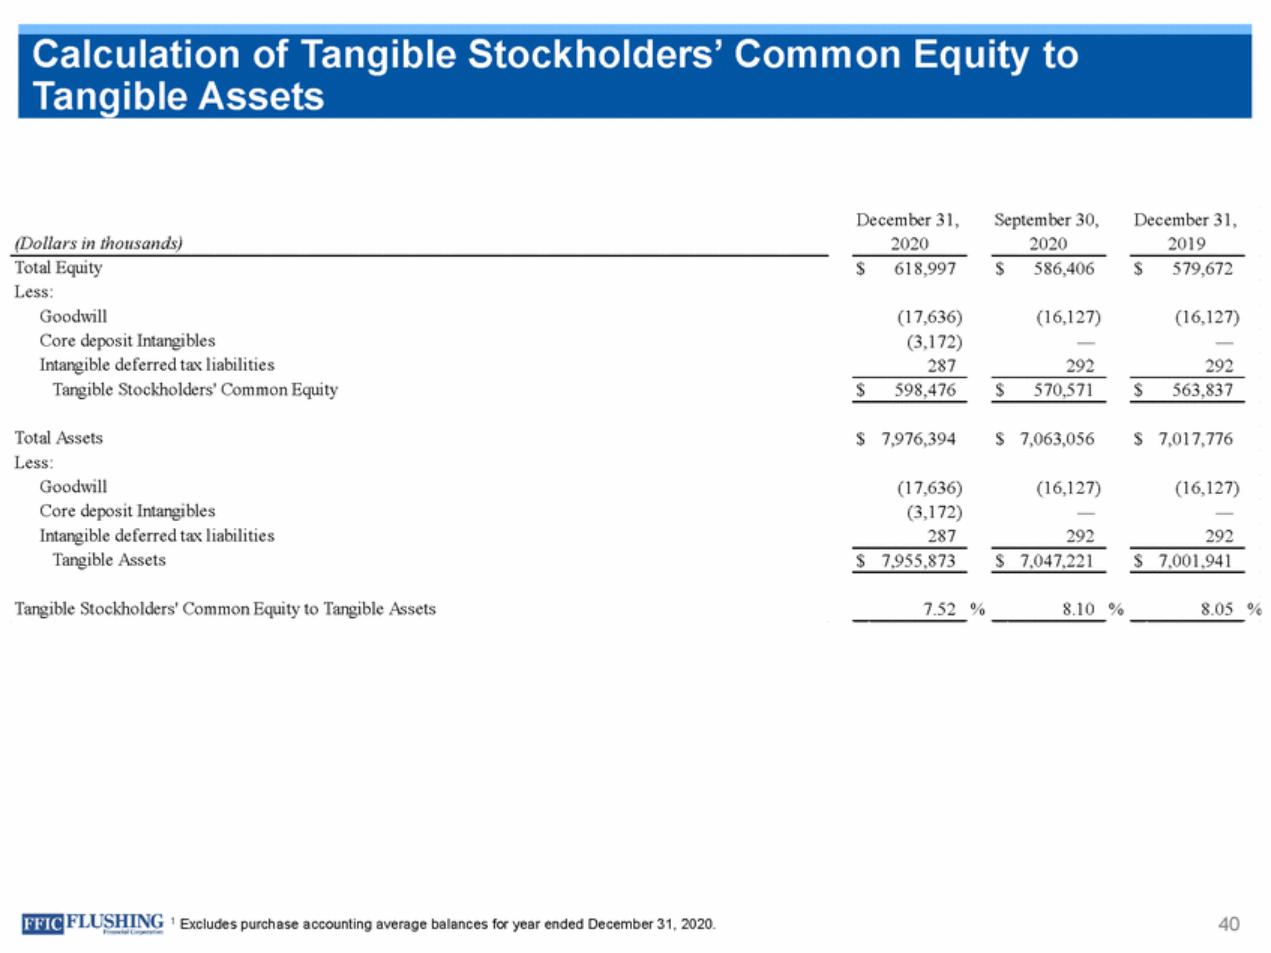
| December 31, 2020 September 30, 2020 December 31, 2019 (Dollars in thousands) Total Equity Less: Goodwill Core deposit Intangibles Intangible deferred tax liabilities Tangible Stockholders' Common Equity $ 618,997 $ 586,406 $ 579,672 (17,636) (3,172) 287 (16,127) — 292 (16,127) — 292 $ 598,476 $ 570,571 $ 563,837 Total Assets Less: Goodwill Core deposit Intangibles Intangible deferred tax liabilities Tangible Assets $ 7,976,394 $ 7,063,056 $ 7,017,776 (17,636) (3,172) 287 (16,127) — 292 (16,127) — 292 $ 7,955,873 $ 7,047,221 $ 7,001,941 Tangible Stockholders' Common Equity to Tangible Assets 7.52 % 8.10 % 8.05 % 40 1 Excludes purchase accounting average balances for year ended December 31, 2020. Calculation of Tangible Stockholders’ Common Equity to Tangible Assets |
| 41 Susan Cullen SEVP, CFO & Treasurer (516) 209-3622 susan.cullen@flushingbank.com NASDAQ: FFIC Contact Details | Flushing Financial Corporation |
| FLUSHING Financial Corporation FFIC |