Attached files
| file | filename |
|---|---|
| 8-K - 8-K - HarborOne Bancorp, Inc. | hone-20210202x8k.htm |
Exhibit 99.1
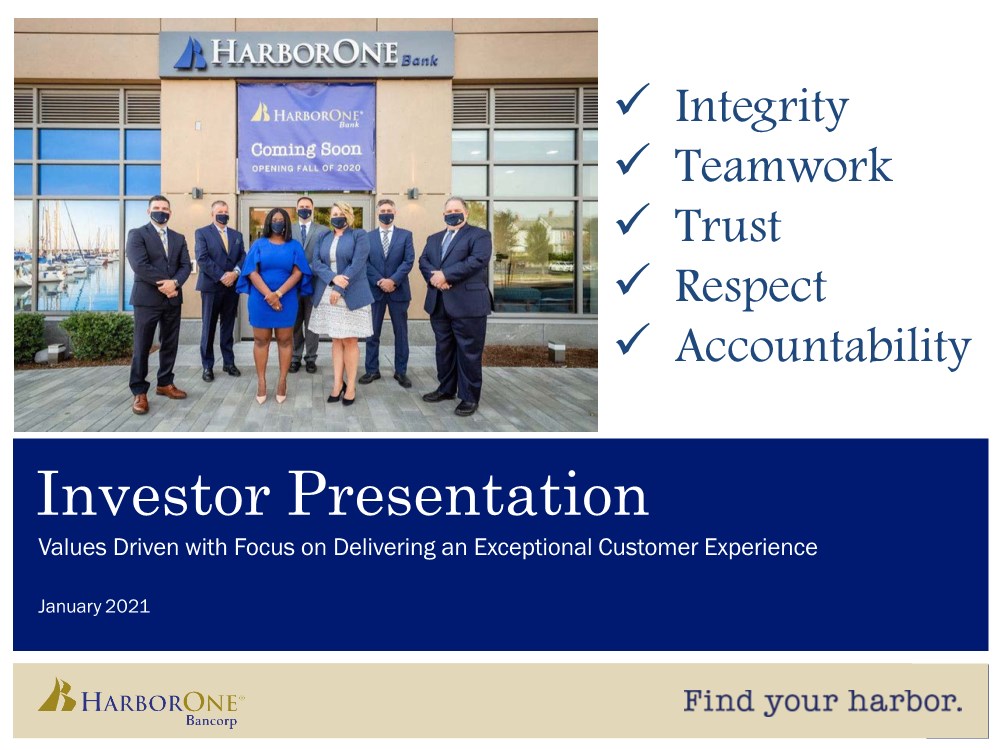
| Investor Presentation Values Driven with Focus on Delivering an Exceptional Customer Experience January 2021 Integrity Teamwork Trust Respect Accountability |
| Forward Looking Statements 2 Certain statements herein constitute forward-looking statements within the meaning of Section 27A of the Securities Act of 1933, as amended, and Section 21E of the Securities Exchange Act of 1934, as amended and are intended to be covered by the safe harbor provisions of the Private Securities Litigation Reform Act of 1995. Such statements may be identified by words such as ”may,” “will,” “should,” “could,” “would,” “plan,” “potential,” “estimate,” “project,” “believe,” “intend,” “anticipate,” “expect,” “target” and similar expressions. These statements are based upon the current assumptions and beliefs of the Company’s management, are expectations of future results, and are subject to significant risks and uncertainties. Actual results may differ materially from those set forth in the forward-looking statements as a result of numerous factors. Factors that could cause such differences to exist include, but are not limited to, the negative impacts and disruptions of the COVID-19 pandemic and measures taken to contain its spread on our employees, customers, business operations, credit quality, financial position, liquidity and results of operations; the length and extent of the economic contraction as a result of the COVID-19 pandemic; continued deterioration in employment levels and other general business and economic conditions on a national basis and in the local markets in which the Company operates; changes in customer behavior; the possibility that future credit losses, loan defaults and charge-off rates are higher than expected due to changes in economic assumptions or adverse economic developments; turbulence in the capital and debt markets; changes in interest rates; decreases in the value of securities and other assets; decreases in deposit levels necessitating increased borrowing to fund loans and investments; competitive pressures from other financial institutions; operational risks including, but not limited to, cybersecurity incidents, fraud, natural disasters and future pandemics; changes in regulation; reputational risks relating to the Company’s participation in the Paycheck Protection Program and other pandemic-related legislative and regulatory initiatives and programs; changes in accounting standards and practices; the risk that goodwill and intangibles recorded in our financial statements will become impaired; risks related to the implementation of acquisitions, dispositions, and restructurings, including the risk that acquisitions may not produce results at levels or within time frames originally anticipated; the risk that we may not be successful in the implementation of our business strategy; changes in assumptions used in making such forward-looking statements; and the other risks and uncertainties detailed in the Company’s Annual Report on Form 10-K and Quarterly Reports on Form 10-Q as filed with the Securities and Exchange Commission (the “SEC”), which are available at the SEC’s website, www.sec.gov. Should one or more of these risks materialize or should underlying beliefs or assumptions prove incorrect, HarborOne Bancorp, Inc.’s actual results could differ materially from those discussed. Forward-looking statements speak only as of the date on which they are made. The Company does not undertake any obligation to update any forward-looking statement to reflect circumstances or events that occur after the date the forward-looking statements aremade. |
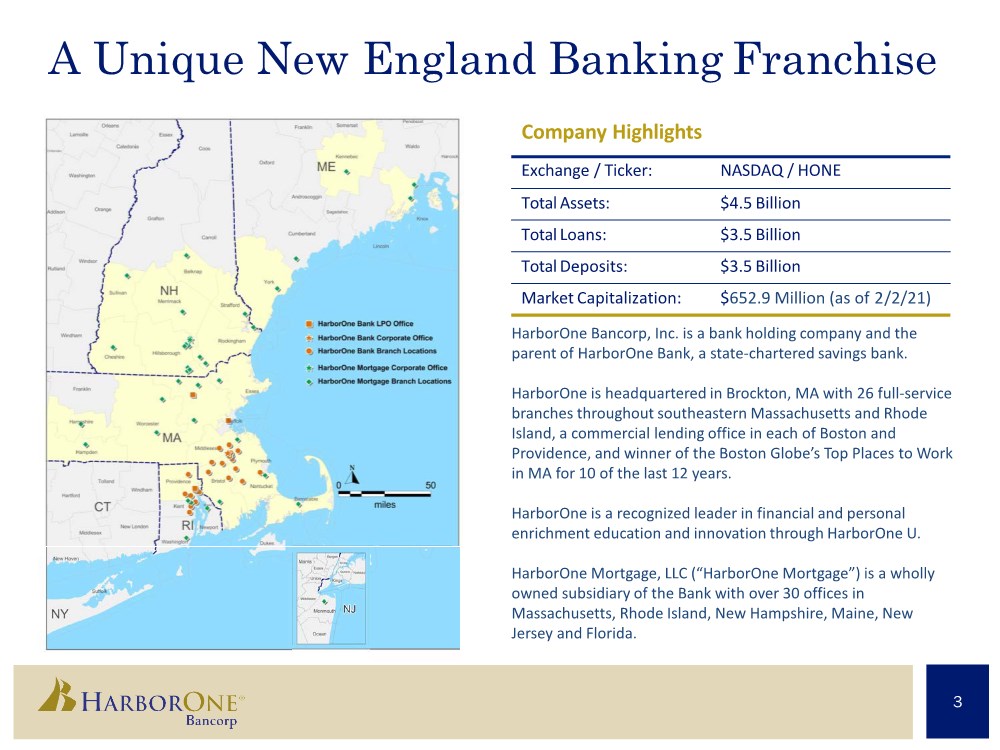
| Exchange / Ticker: NASDAQ / HONE Total Assets: $4.5 Billion Total Loans: $3.5 Billion Total Deposits: $3.5 Billion Market Capitalization: $652.9 Million (as of 2/2/21) Company Highlights A Unique New England Banking Franchise 3 HarborOne Bancorp, Inc. is a bank holding company and the parent of HarborOne Bank, a state-chartered savings bank. HarborOne is headquartered in Brockton, MA with 26 full-service branches throughout southeastern Massachusetts and Rhode Island, a commercial lending office in each of Boston and Providence, and winner of the Boston Globe’s Top Places to Work in MA for 10 of the last 12 years. HarborOne is a recognized leader in financial and personal enrichment education and innovation through HarborOne U. HarborOne Mortgage, LLC (“HarborOne Mortgage”) is a wholly owned subsidiary of the Bank with over 30 offices in Massachusetts, Rhode Island, New Hampshire, Maine, New Jersey and Florida. |
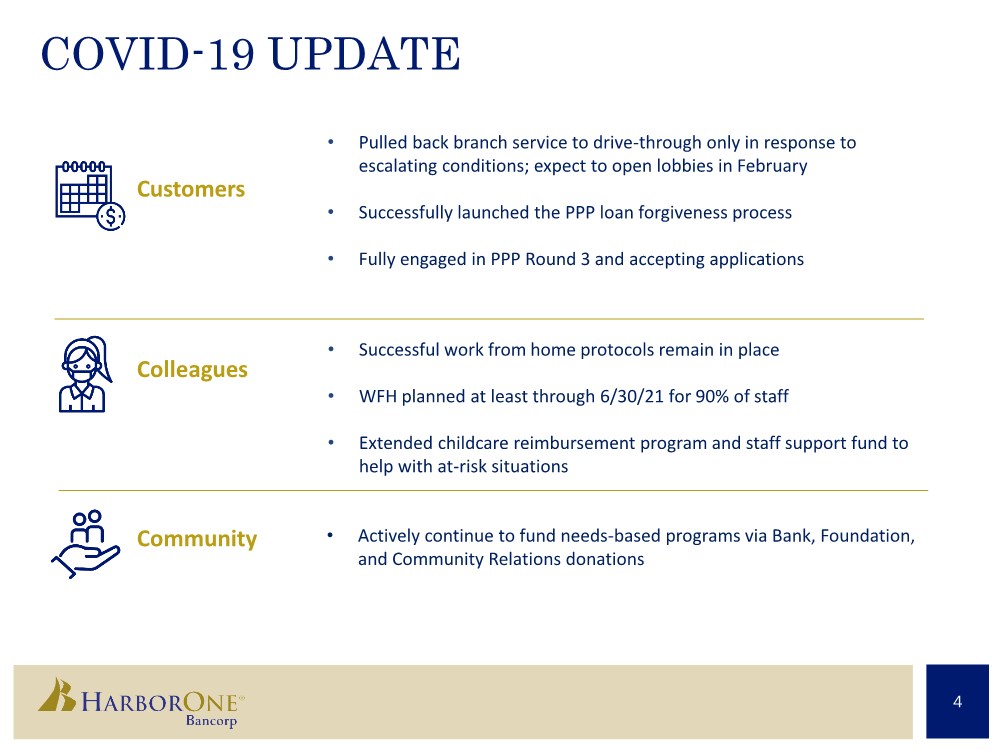
| COVID-19 UPDATE Colleagues Community Customers • Actively continue to fund needs-based programs via Bank, Foundation, and Community Relations donations 4 • Pulled back branch service to drive-through only in response to escalating conditions; expect to open lobbies in February • Successfully launched the PPP loan forgiveness process • Fully engaged in PPP Round 3 and accepting applications • Successful work from home protocols remain in place • WFH planned at least through 6/30/21 for 90% of staff • Extended childcare reimbursement program and staff support fund to help with at-risk situations |
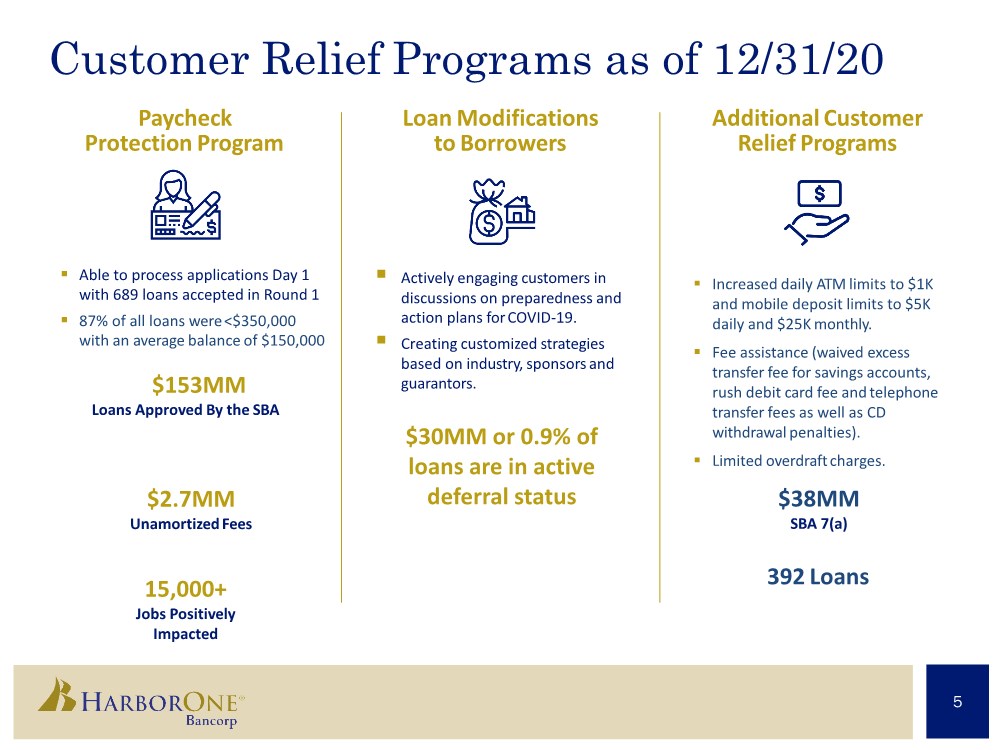
| Customer Relief Programs as of 12/31/20 Paycheck Protection Program . Able to process applications Day 1 with 689 loans accepted in Round 1 . 87% of all loans were<$350,000 with an average balance of $150,000 $153MM Loans Approved By the SBA $2.7MM UnamortizedFees 15,000+ Jobs Positively Impacted Loan Modifications to Borrowers . Actively engaging customers in discussions on preparedness and action plans forCOVID-19. . Creating customized strategies based on industry, sponsorsand guarantors. Additional Customer Relief Programs . Increased daily ATM limits to $1K and mobile deposit limits to $5K daily and $25K monthly. . Fee assistance (waived excess transfer fee for savings accounts, rush debit card fee andtelephone transfer fees as well as CD withdrawal penalties). . Limited overdraftcharges. $30MM or 0.9% of loans are in active deferral status 5 $38MM SBA 7(a) 392 Loans |
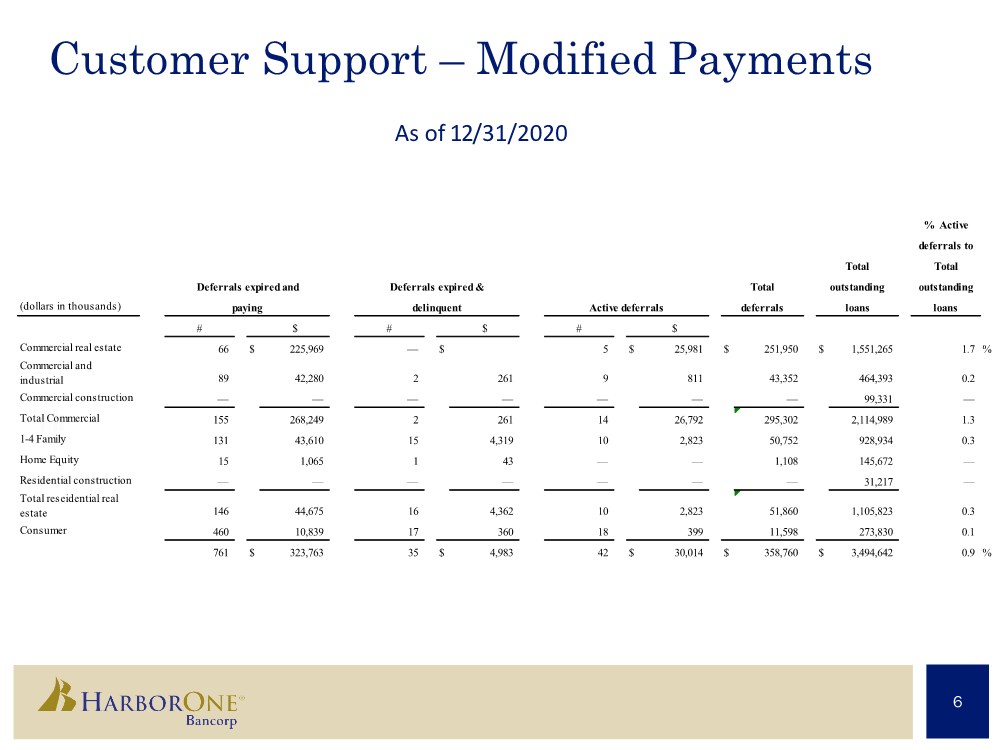
| Customer Support – Modified Payments As of 12/31/2020 6 % Ac ti ve deferrals to Total outstanding (dollars in thousands) loans # $ # $ # $ Commercial real estate 66 $ 225,969 — $ 5 $ 25,981 $ 251,950 $ 1,551,265 1.7 % Commercial and industrial 89 42,280 2 261 9 811 43,352 464,393 0.2 Commercial construction — — — — — — — 99,331 — Total Commercial 155 268,249 2 261 14 26,792 295,302 2,114,989 1.3 1-4 Family 131 43,610 15 4,319 10 2,823 50,752 928,934 0.3 Home Equity 15 1,065 1 43 — — 1,108 145,672 — Residential construction — — — — — — — 31,217 — Total reseidential real estate 146 44,675 16 4,362 10 2,823 51,860 1,105,823 0.3 Consumer 460 10,839 17 360 18 399 11,598 273,830 0.1 761 $ 323,763 35 $ 4,983 42 $ 30,014 $ 358,760 $ 3,494,642 0.9 % paying delinquent Active deferrals deferrals loans Total Deferrals expired and Deferrals expired & Total outstanding |
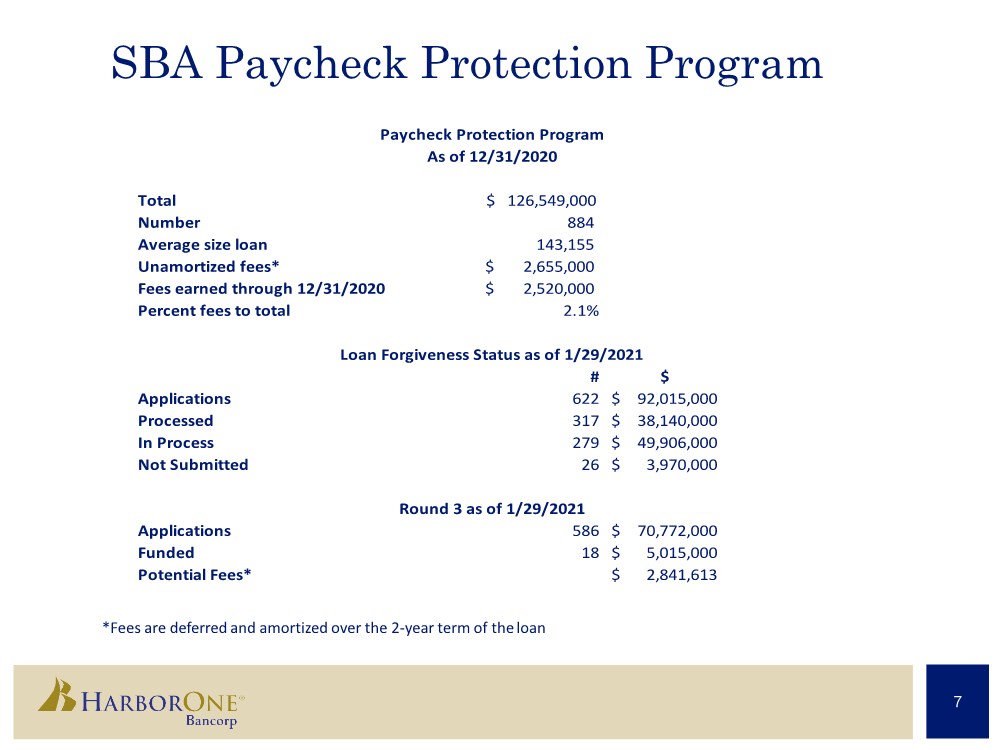
| SBA Paycheck Protection Program *Fees are deferred and amortized over the 2-year term of theloan 7 Total $ 126,549,000 Number 884 Average size loan 143,155 Unamortized fees* 2,655,000 $ Fees earned through 12/31/2020 2,520,000 $ Percent fees to total 2.1% # $ Applications 622 92,015,000 $ Processed 317 38,140,000 $ In Process 279 49,906,000 $ Not Submitted 26 3,970,000 $ Applications 586 70,772,000 $ Funded 18 5,015,000 $ Potential Fees* 2,841,613 $ Paycheck Protection Program Loan Forgiveness Status as of 1/29/2021 Round 3 as of 1/29/2021 As of 12/31/2020 |
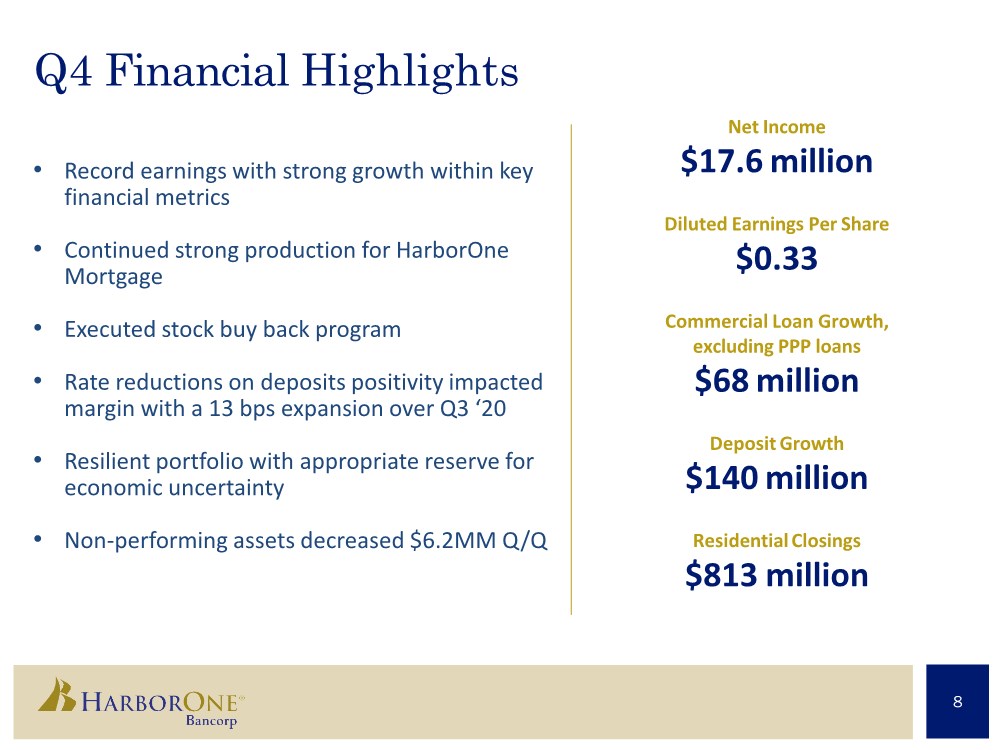
| Q4 Financial Highlights • Record earnings with strong growth within key financial metrics • Continued strong production for HarborOne Mortgage • Executed stock buy back program • Rate reductions on deposits positivity impacted margin with a 13 bps expansion over Q3 ‘20 • Resilient portfolio with appropriate reserve for economic uncertainty • Non-performing assets decreased $6.2MM Q/Q Net Income $17.6 million Diluted Earnings Per Share $0.33 Commercial Loan Growth, excluding PPP loans $68 million DepositGrowth $140 million ResidentialClosings $813 million 8 |
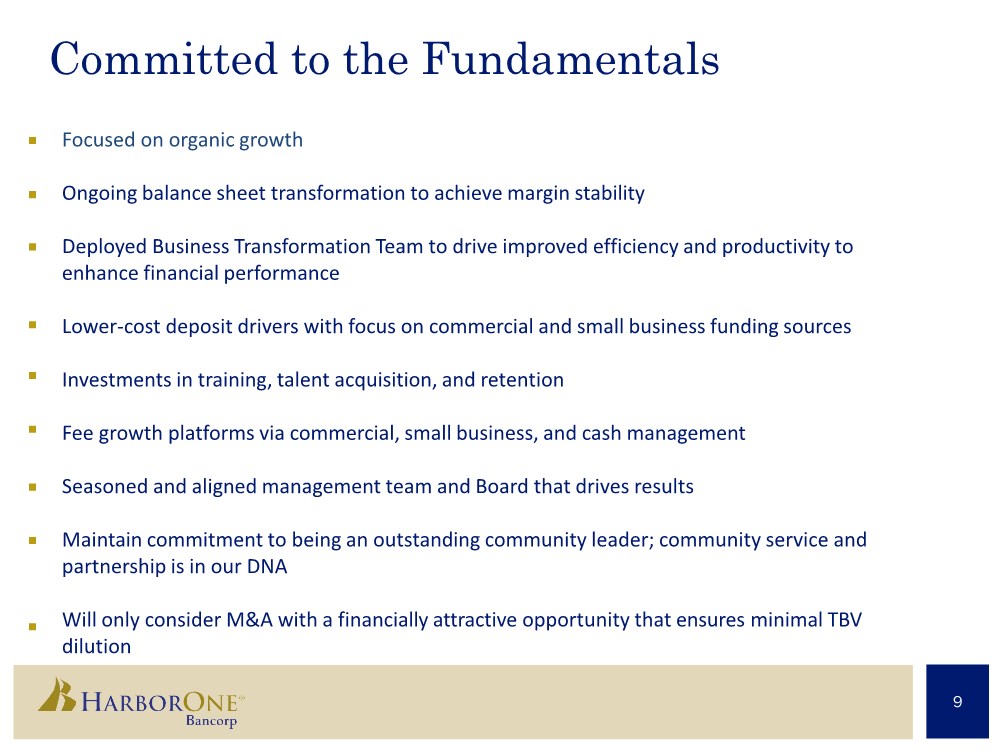
| Committed to the Fundamentals 9 . Focused on organic growth Ongoing balance sheet transformation to achieve margin stability Deployed Business Transformation Team to drive improved efficiency and productivity to enhance financial performance Lower-cost deposit drivers with focus on commercial and small business funding sources Investments in training, talent acquisition, and retention Fee growth platforms via commercial, small business, and cash management Seasoned and aligned management team and Board that drives results Maintain commitment to being an outstanding community leader; community service and partnership is in our DNA Will only consider M&A with a financially attractive opportunity that ensures minimal TBV dilution . . . . . . . . |
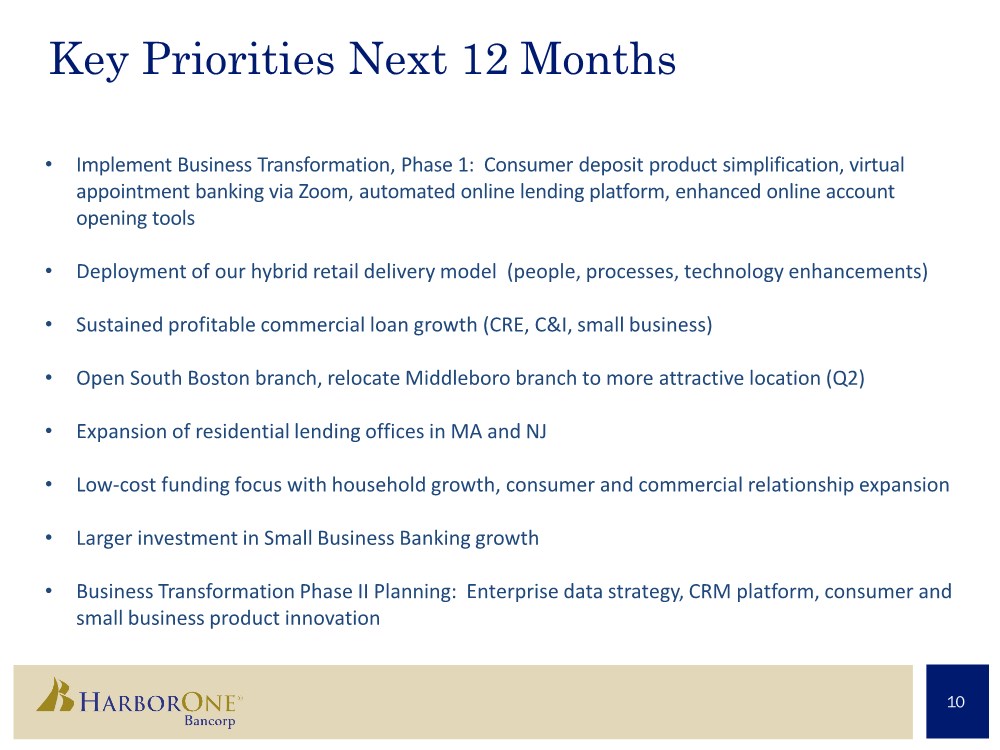
| Key Priorities Next 12 Months 10 • Implement Business Transformation, Phase 1: Consumer deposit product simplification, virtual appointment banking via Zoom, automated online lending platform, enhanced online account opening tools • Deployment of our hybrid retail delivery model (people, processes, technology enhancements) • Sustained profitable commercial loan growth (CRE, C&I, small business) • Open South Boston branch, relocate Middleboro branch to more attractive location (Q2) • Expansion of residential lending offices in MA and NJ • Low-cost funding focus with household growth, consumer and commercial relationship expansion • Larger investment in Small Business Banking growth • Business Transformation Phase II Planning: Enterprise data strategy, CRM platform, consumer and small business product innovation |
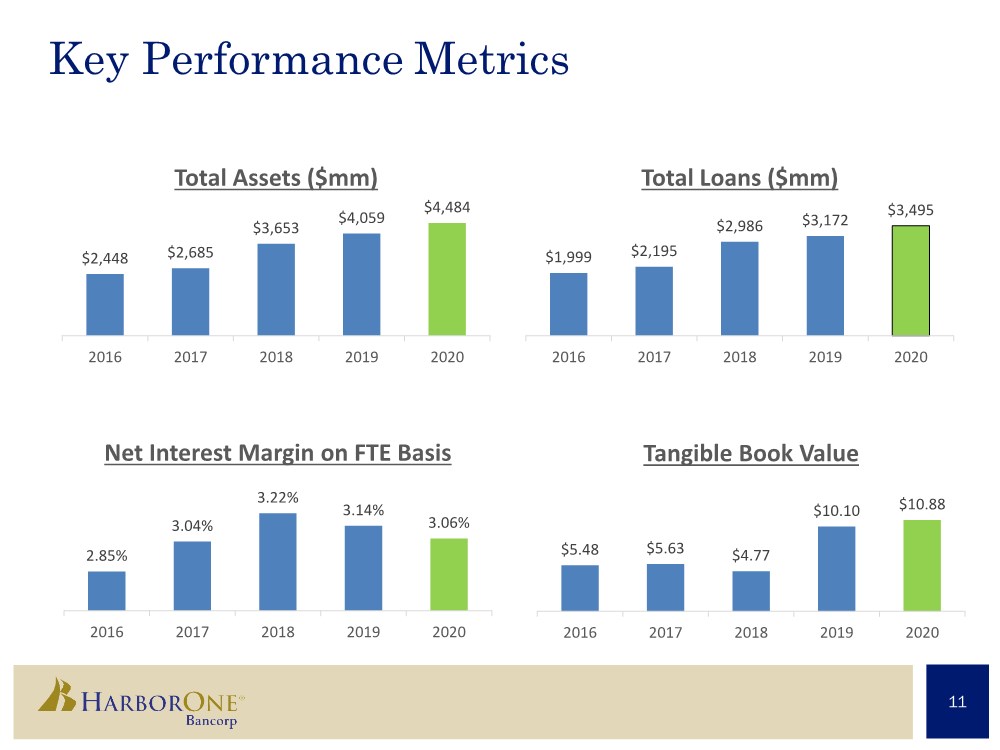
| Key Performance Metrics 11 $2,448 $2,685 $3,653 $4,059 $4,484 2016 2017 2018 2019 2020 Total Assets ($mm) $1,999 $2,195 $2,986 $3,172 $3,495 2016 2017 2018 2019 2020 Total Loans ($mm) 2.85% 3.04% 3.22% 3.14% 3.06% 2016 2017 2018 2019 2020 Net Interest Margin on FTE Basis $5.48 $5.63 $4.77 $10.10 $10.88 2016 2017 2018 2019 2020 Tangible Book Value |
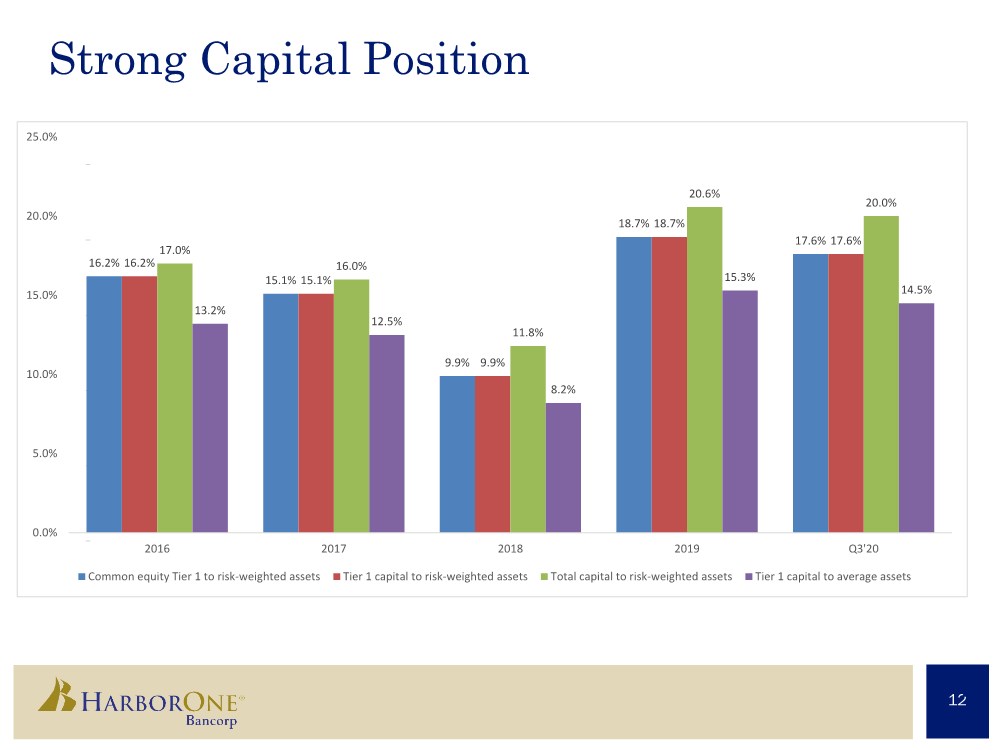
| Strong Capital Position 1 1 2 2 16.2% 15.1% 9.9% 18.7% 17.6% 16.2% 15.1% 9.9% 18.7% 17.6% 17.0% 16.0% 11.8% 20.6% 20.0% 13.2% 12.5% 8.2% 15.3% 14.5% 0.0% 5.0% 10.0% 15.0% 20.0% 25.0% 2016 2017 2018 2019 Q3'20 Common equity Tier 1 to risk-weighted assets Tier 1 capital to risk-weighted assets Total capital to risk-weighted assets Tier 1 capital to average assets |
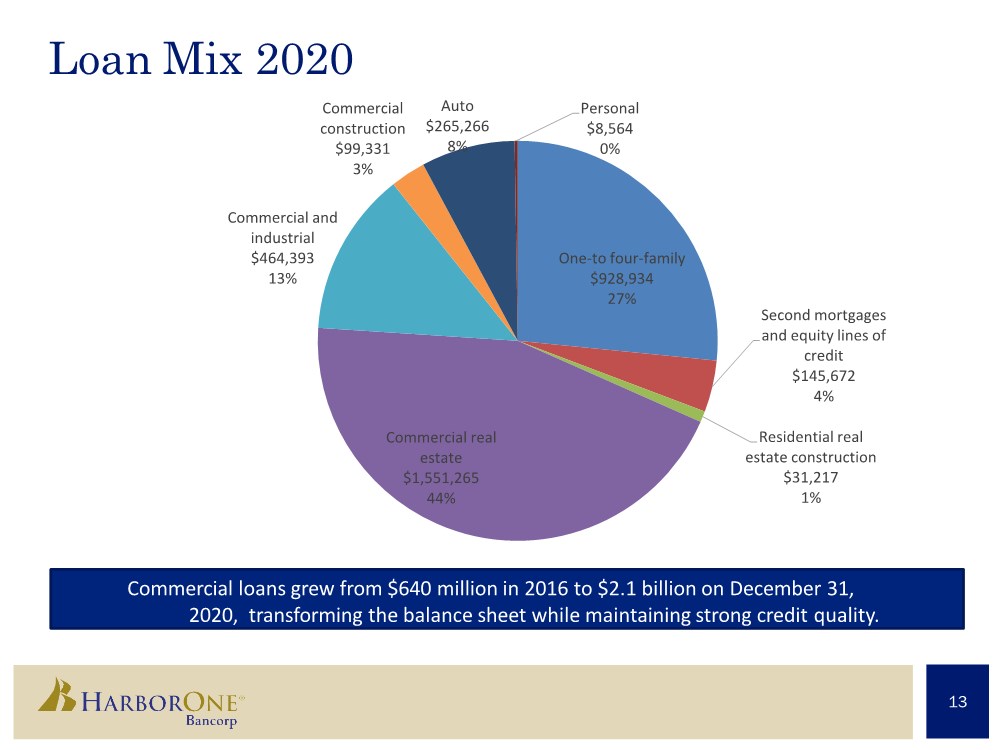
| Loan Mix 2020 Commercial loans grew from $640 million in 2016 to $2.1 billion on December 31, 2020, transforming the balance sheet while maintaining strong credit quality. 13 One-to four-family $928,934 27% Second mortgages and equity lines of credit $145,672 4% Residential real estate construction $31,217 1% Commercial real estate $1,551,265 44% Commercial and industrial $464,393 13% Commercial construction $99,331 3% Auto $265,266 8% Personal $8,564 0% |
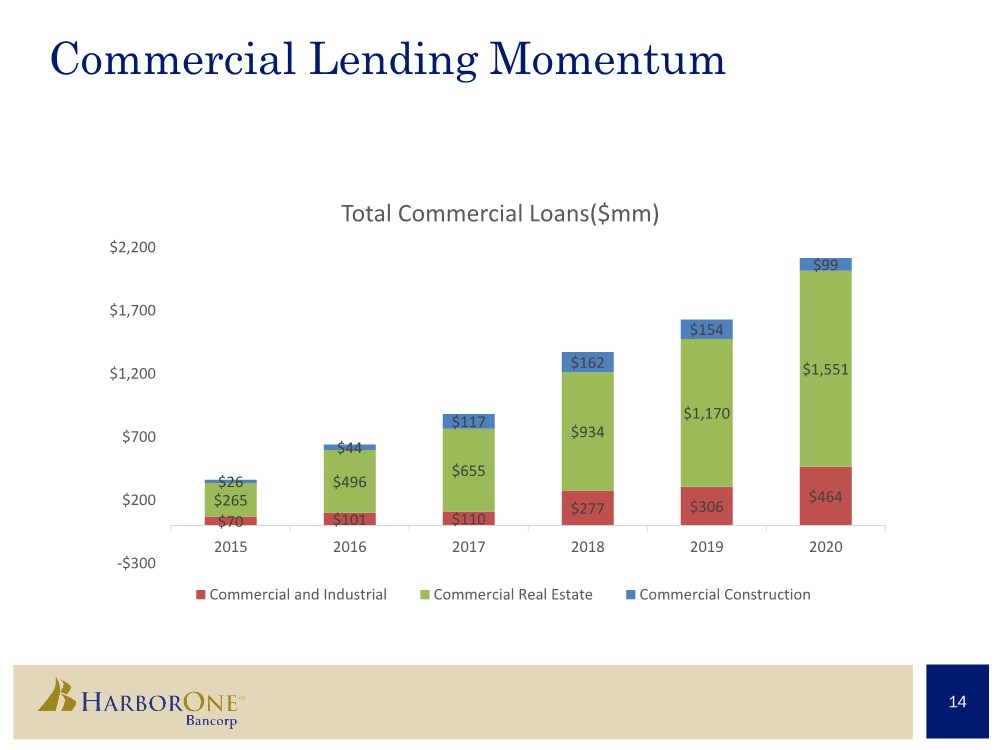
| Commercial Lending Momentum $496 $655 $934 $1,170 $1,213 14 $70 $101 $110 $277 $306 $464 $265 $496 $655 $934 $1,170 $1,551 $26 $44 $117 $162 $154 $99 -$300 $200 $700 $1,200 $1,700 $2,200 2015 2016 2017 2018 2019 2020 Total Commercial Loans($mm) Commercial and Industrial Commercial Real Estate Commercial Construction |
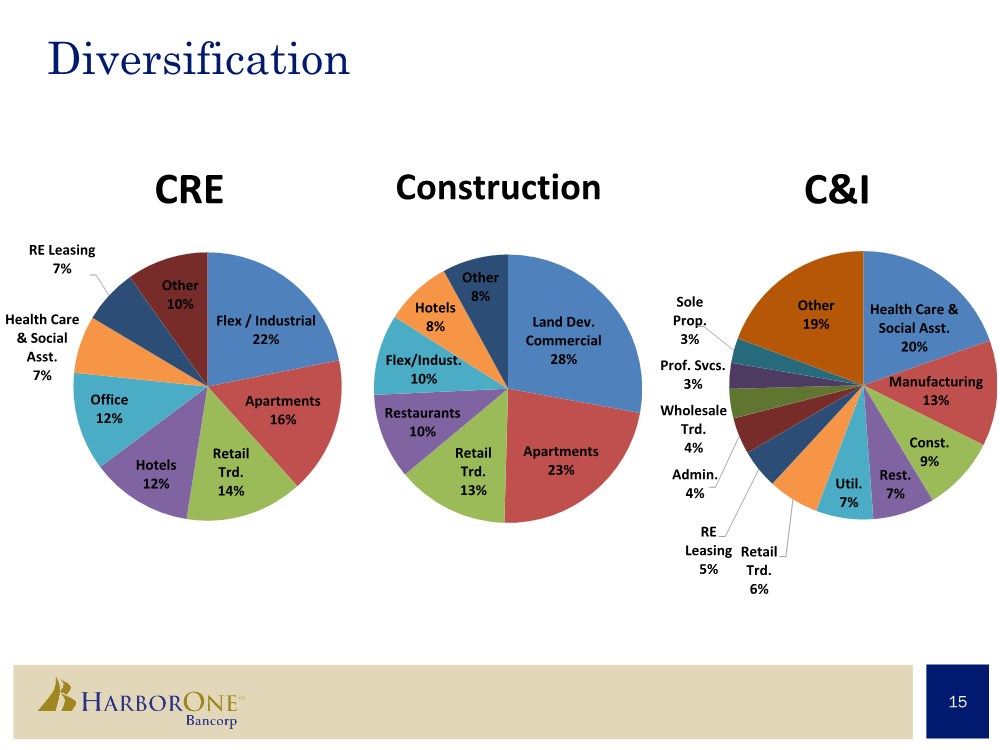
| Diversification 15 Flex / Industrial 22% Apartments 16% Retail Trd. 14% Hotels 12% Office 12% Health Care & Social Asst. 7% RE Leasing 7% Other 10% CRE Land Dev. Commercial 28% Apartments 23% Retail Trd. 13% Restaurants 10% Flex/Indust. 10% Hotels 8% Other 8% Construction Health Care & Social Asst. 20% Manufacturing 13% Const. 9% Rest. 7% Util. 7% Retail Trd. 6% RE Leasing 5% Admin. 4% Wholesale Trd. 4% Prof. Svcs. 3% Sole Prop. 3% Other 19% C&I |
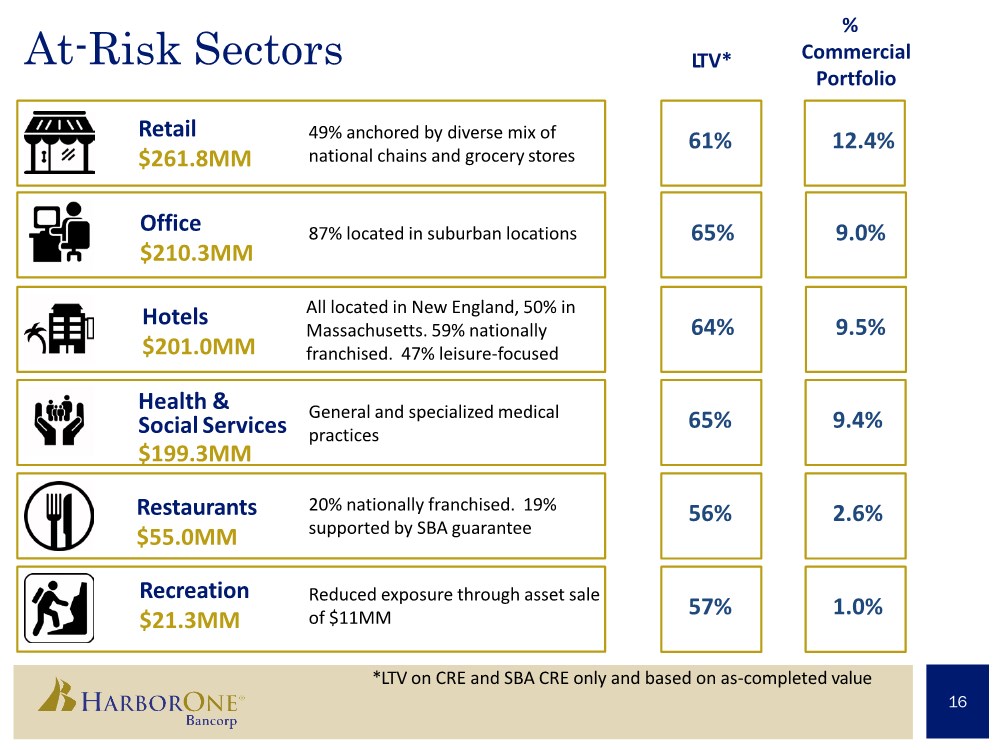
| At-Risk Sectors *LTV on CRE and SBA CRE only and based on as-completed value Retail $261.8MM 49% anchored by diverse mix of national chains and grocery stores Hotels $201.0MM Health & Social Services $199.3MM 16 L TV* % Commercial Portfolio 61% 64% 65% Office $210.3MM 65% Recreation $21.3MM 57% Restaurants $55.0MM 56% 12.4% 9.0% 9.5% 9.4% 2.6% 1.0% 87% located in suburban locations All located in New England, 50% in Massachusetts. 59% nationally franchised. 47% leisure-focused General and specialized medical practices 20% nationally franchised. 19% supported by SBA guarantee Reduced exposure through asset sale of $11MM |
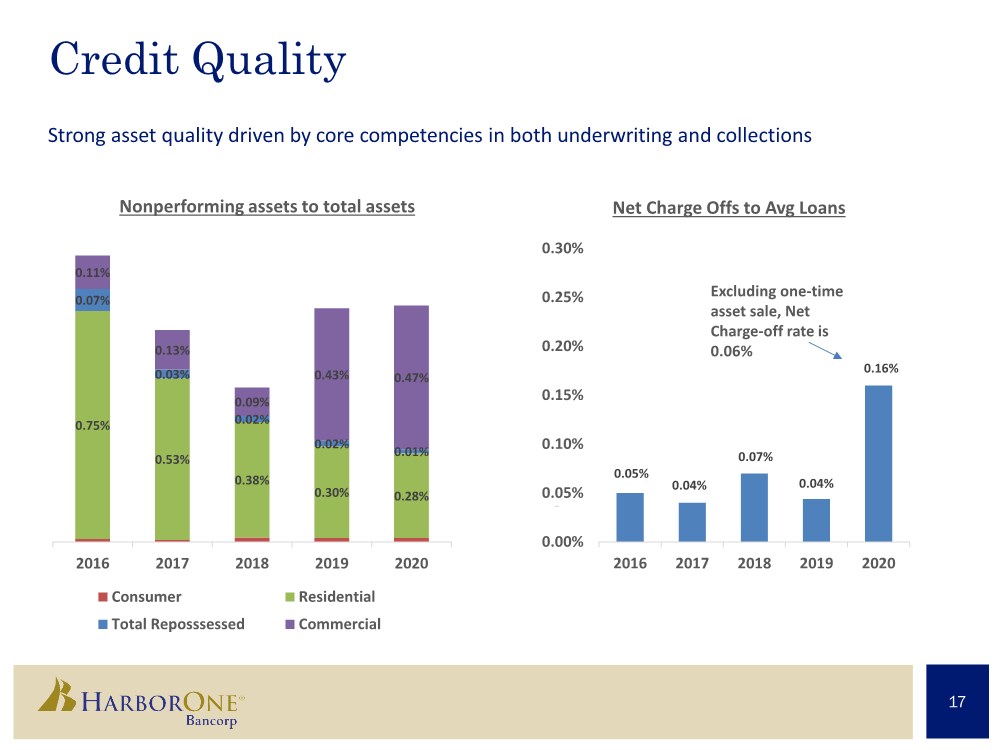
| Credit Quality Strong asset quality driven by core competencies in both underwriting and collections 17 0.75% 0.53% 0.38% 0.30% 0.28% 0.07% 0.03% 0.02% 0.02% 0.01% 0.11% 0.13% 0.09% 0.43% 0.47% 2016 2017 2018 2019 2020 Nonperforming assets to total assets Consumer Residential Total Reposssessed Commercial 0.05% 0.04% 0.07% 0.04% 0.16% 0.00% 0.05% 0.10% 0.15% 0.20% 0.25% 0.30% 2016 2017 2018 2019 2020 Net Charge Offs to Avg Loans Excluding one-time asset sale, Net Charge-off rate is 0.06% |
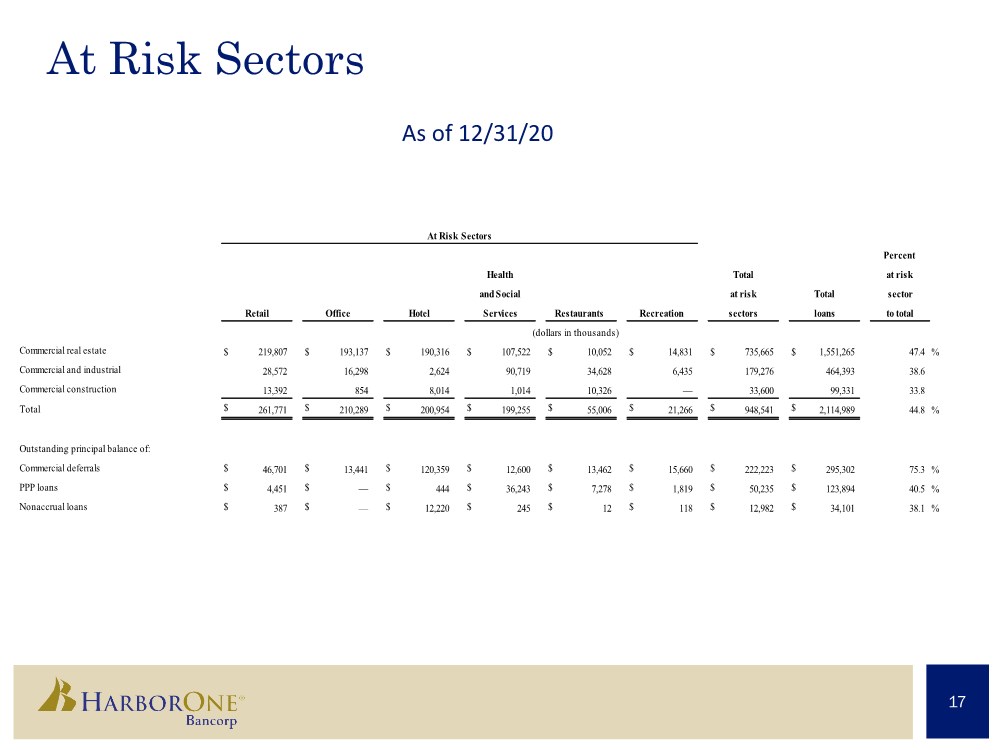
| At Risk Sectors 17 As of 12/31/20 Percent at risk sector to total Commercial real estate $ 219,807 $ 193,137 $ 190,316 $ 107,522 $ 10,052 $ 14,831 $ 735,665 $ 1,551,265 47.4 % Commercial and industrial 28,572 16,298 2,624 90,719 34,628 6,435 179,276 464,393 38.6 Commercial construction 13,392 854 8,014 1,014 10,326 — 33,600 99,331 33.8 Total $ 261,771 $ 210,289 $ 200,954 $ 199,255 $ 55,006 $ 21,266 $ 948,541 $ 2,114,989 44.8 % Outstanding principal balance of: Commercial deferrals $ 46,701 $ 13,441 $ 120,359 $ 12,600 $ 13,462 $ 15,660 $ 222,223 $ 295,302 75.3 % PPP loans $ 4,451 $ — $ 444 $ 36,243 $ 7,278 $ 1,819 $ 50,235 $ 123,894 40.5 % Nonaccrual loans $ 387 $ — $ 12,220 $ 245 $ 12 $ 118 $ 12,982 $ 34,101 38.1 % At Risk Sectors Health Total (dollars in thousands) at risk Total Retail Office Hotel Services Restaurants Recreation sectors loans and Social |
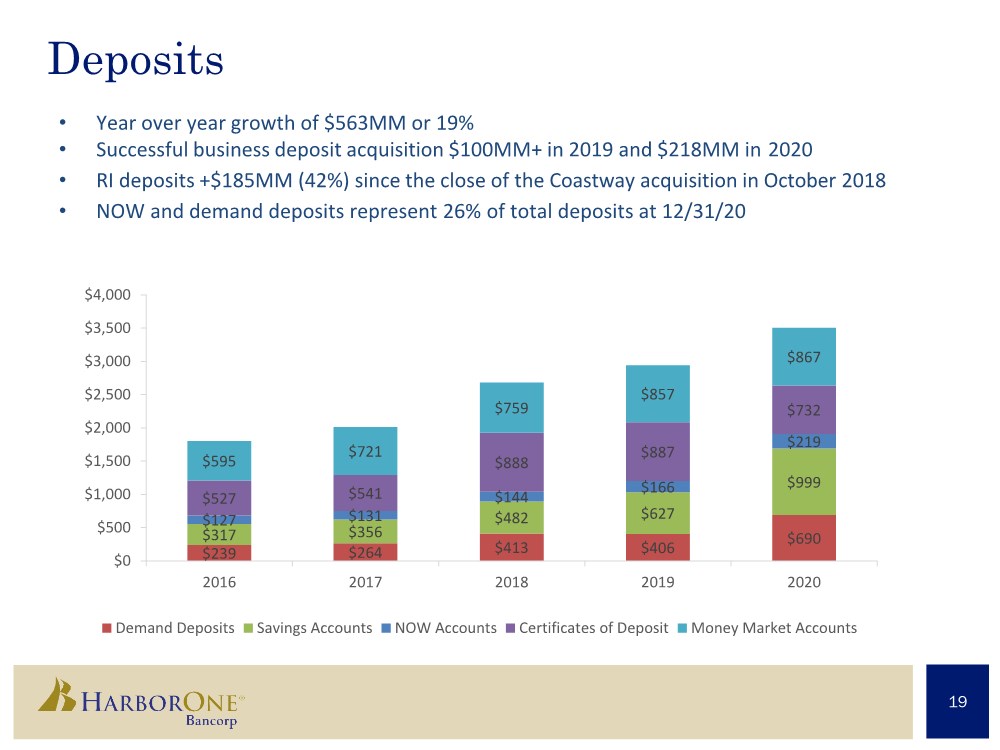
| Deposits • Year over year growth of $563MM or 19% • Successful business deposit acquisition $100MM+ in 2019 and $218MM in 2020 • RI deposits +$185MM (42%) since the close of the Coastway acquisition in October 2018 • NOW and demand deposits represent 26% of total deposits at 12/31/20 19 $239 $264 $413 $406 $690 $317 $356 $482 $627 $999 $127 $131 $144 $166 $219 $527 $541 $888 $887 $732 $595 $721 $759 $857 $867 $0 $500 $1,000 $1,500 $2,000 $2,500 $3,000 $3,500 $4,000 2016 2017 2018 2019 2020 Demand Deposits Savings Accounts NOW Accounts Certificates of Deposit Money Market Accounts |
| Retail Branch Expansion • South Boston opening and Middleboro relocation Q2 2021 Drive to Digital • Virtual Appointment Banking launch in April (Zoom/Kronos-powered platform) • Added 2,027 new eBanking users in Q4, with 3,600 new mobile app downloads • Mobile deposits grew 4% in Q4 Q/Q Transformed Retail Model • Continue to implement the relationship banking model across 85% of branches. Model includes higher-skilled cross-trained positions • Highly focused on relationship development for both consumer and small business • Modified staff and customer protocols to remain flexible in COVID environment 20 |
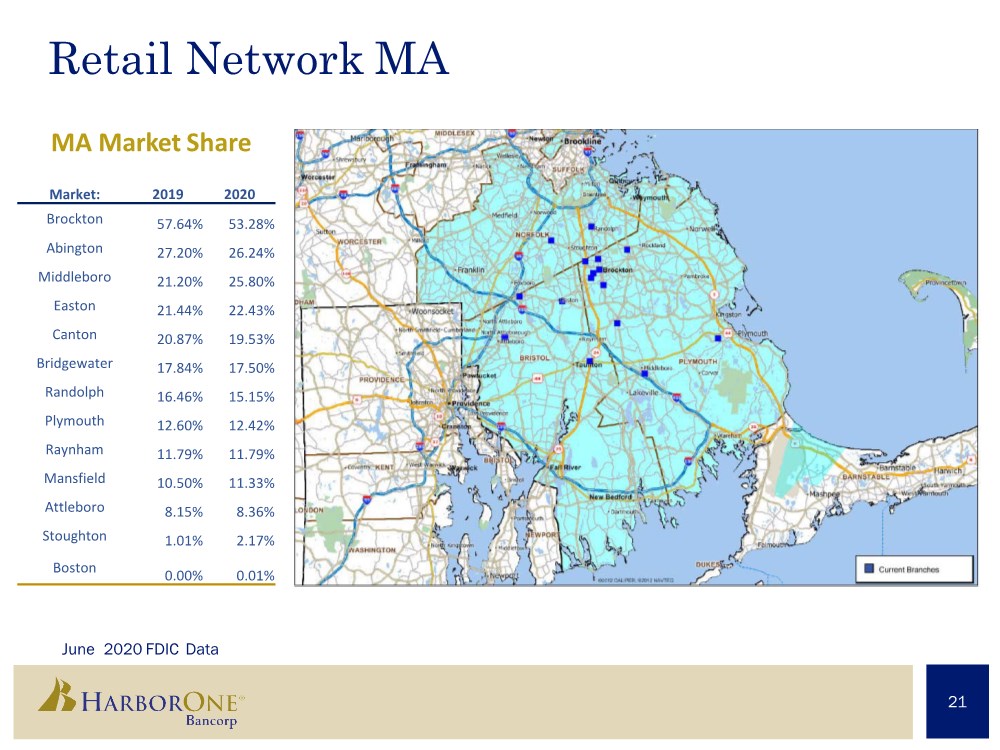
| Retail Network MA June 2020 FDIC Data 21 MA Market Share Market: 2019 2020 Brockton 57.64% 53.28% Abington 27.20% 26.24% Middleboro 21.20% 25.80% Easton 21.44% 22.43% Canton 20.87% 19.53% Bridgewater 17.84% 17.50% Randolph 16.46% 15.15% Plymouth 12.60% 12.42% Raynham 11.79% 11.79% Mansfield 10.50% 11.33% Attleboro 8.15% 8.36% Stoughton 1.01% 2.17% Boston 0.00% 0.01% |
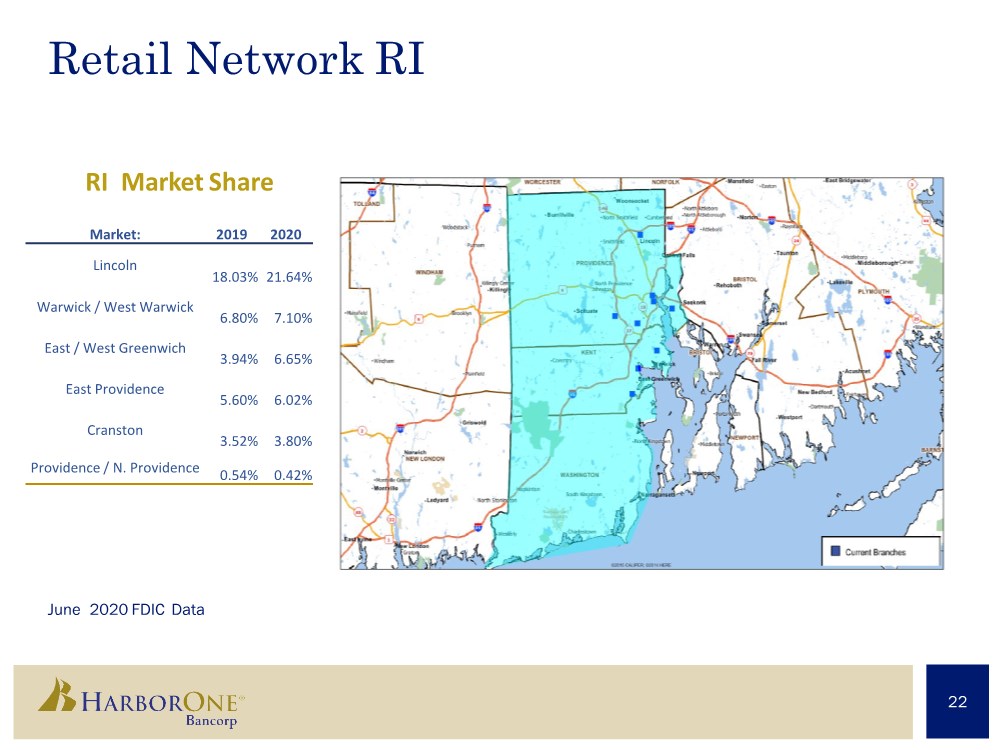
| Retail Network RI June 2020 FDIC Data 22 RI Market Share Market: 2019 2020 Lincoln 18.03% 21.64% Warwick / West Warwick 6.80% 7.10% East / West Greenwich 3.94% 6.65% East Providence 5.60% 6.02% Cranston 3.52% 3.80% Providence / N. Providence 0.54% 0.42% |
| * Data source: The WarrenGroup 23 • 107 loan originators across 6 states (MA/NH/ME/RI/NJ/FL) that also support limited business in CT and VT. • Exceeded $813 million in fundings in Q4 2020 verses $789 million in Q3 2020 and $442 million in Q4 2019. Locked pipeline at year end stands at $485 million, $384 million higher then December 31, 2019. • Market share for purchases are 3rd in NH, 11th in RI, 14th in ME, 22nd in MA*. • 42%/58% purchase-to-refi split in Q4 2020. Q1 2020 was 30%/70% split. • Disciplined and flexible sales structure to match market expansion and contraction. • Q4 2020 earnings of $10.9 million. This included a positive $340,000 fair value mark on mortgage servicing rights. Record earnings of $41.8 million with $2.8 billion of disbursements in 2020. |
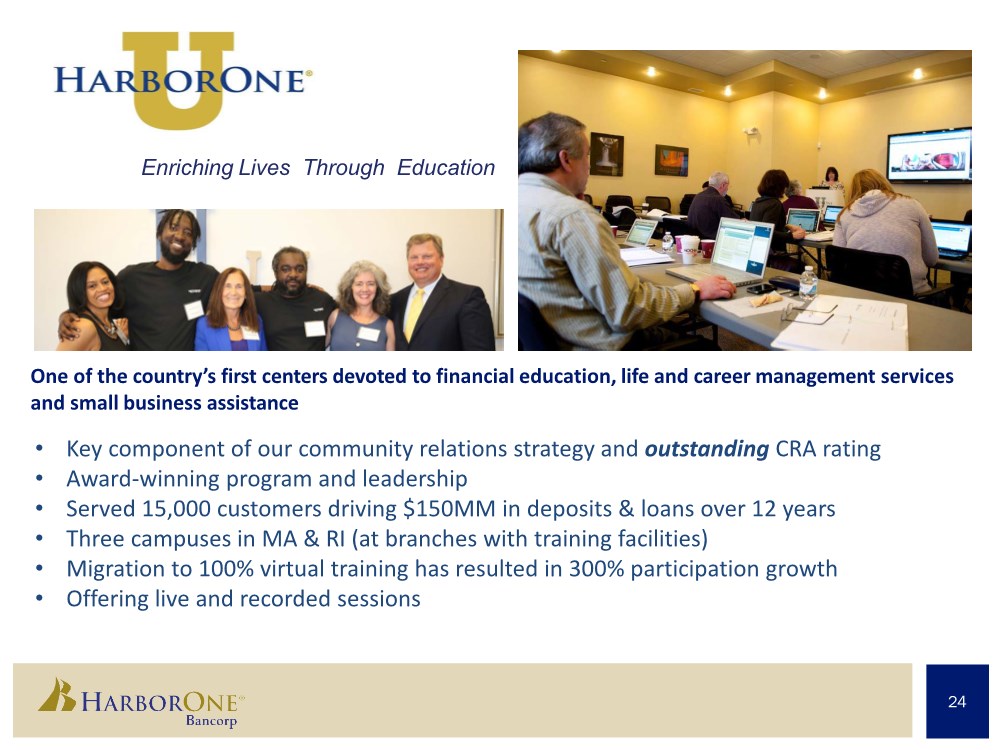
| Enriching Lives Through Education 24 One of the country’s first centers devoted to financial education, life and career management services and small business assistance • Key component of our community relations strategy and outstanding CRA rating • Award-winning program and leadership • Served 15,000 customers driving $150MM in deposits & loans over 12 years • Three campuses in MA & RI (at branches with training facilities) • Migration to 100% virtual training has resulted in 300% participation growth • Offering live and recorded sessions |
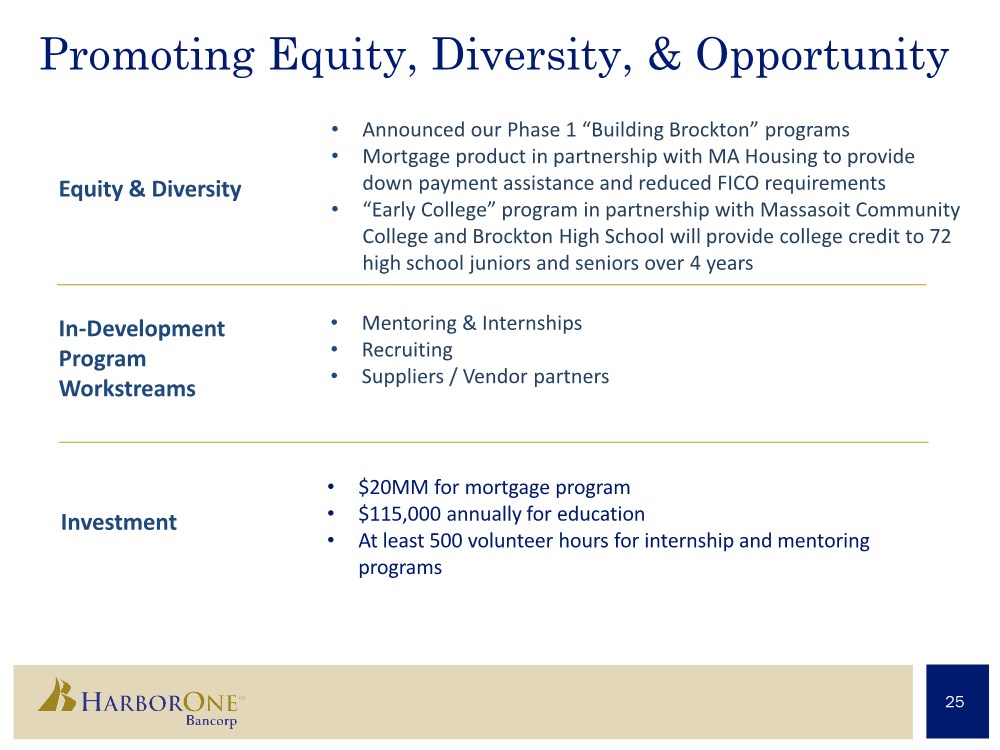
| Promoting Equity, Diversity, & Opportunity In-Development Program Workstreams Investment Equity & Diversity • $20MM for mortgage program • $115,000 annually for education • At least 500 volunteer hours for internship and mentoring programs 25 • Announced our Phase 1 “Building Brockton” programs • Mortgage product in partnership with MA Housing to provide down payment assistance and reduced FICO requirements • “Early College” program in partnership with Massasoit Community College and Brockton High School will provide college credit to 72 high school juniors and seniors over 4 years • Mentoring & Internships • Recruiting • Suppliers / Vendor partners |
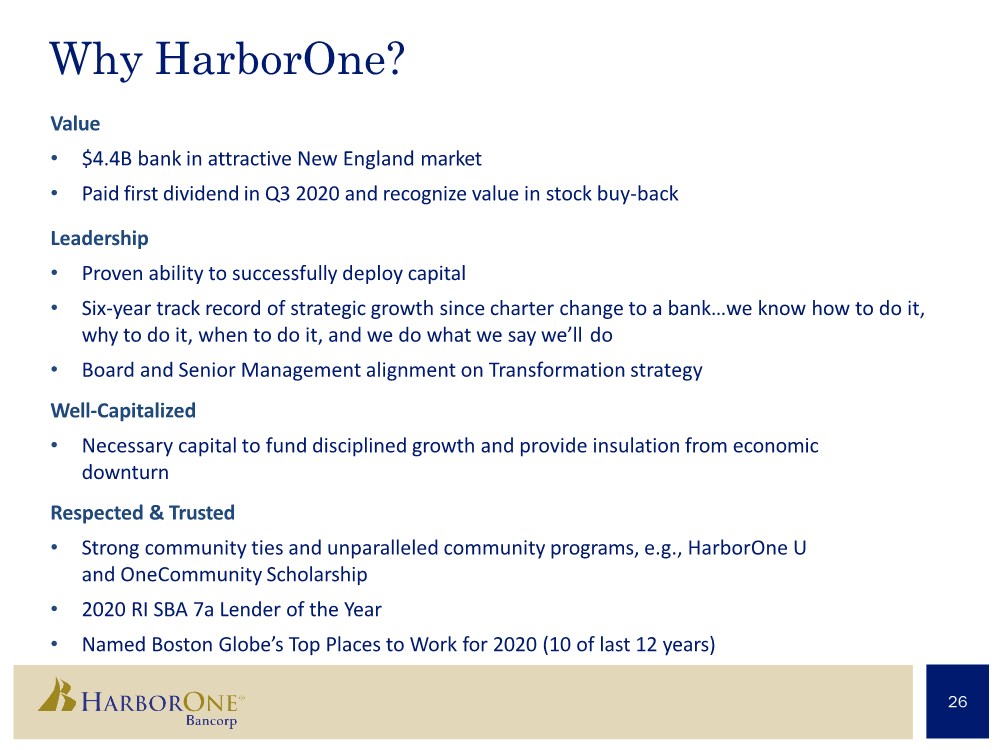
| Why HarborOne? 26 Value • $4.4B bank in attractive New England market • Paid first dividend in Q3 2020 and recognize value in stock buy-back Leadership • Proven ability to successfully deploy capital • Six-year track record of strategic growth since charter change to a bank…we know how to do it, why to do it, when to do it, and we do what we say we’ll do • Board and Senior Management alignment on Transformation strategy Well-Capitalized • Necessary capital to fund disciplined growth and provide insulation from economic downturn Respected & Trusted • Strong community ties and unparalleled community programs, e.g., HarborOne U and OneCommunity Scholarship • 2020 RI SBA 7a Lender of the Year • Named Boston Globe’s Top Places to Work for 2020 (10 of last 12 years) |
| A Commitment To Doing What’s Right Mission Statement We provide a personalized experience while caring about every customer. We focus on understanding their financial goals for today and dreams for tomorrow. We are unwavering in our commitment to the communities that we serve. Vision Statement To be our customers’ most trusted financial partner. 27 Our Values Integrity. Teamwork. Trust. Respect. Accountability. |
| “ Our vision for the future is disciplined, organic growth. Our commitment to those we serve and each other is to be the very best that we can be, every day. We embrace challenge, seek opportunity, and are steadfast in our focus to build an exceptional company.” 28 – Jim Blake, CEO |