Attached files
| file | filename |
|---|---|
| EX-99.1 - EXHIBIT 99.1 - FIRST BANCORP /PR/ | a52369960ex99_1.htm |
| 8-K - FIRST BANCORP. 8-K - FIRST BANCORP /PR/ | a52369960.htm |
Exhibit 99.2

Financial Results 4Q 2020 & FY 2020

Forward-Looking Statement This presentation may contain “forward-looking statements” concerning the
Corporation’s future economic, operational and financial performance. The words or phrases “expect,” “anticipate,” “intend,” “should,” “would,” “believe” and similar expressions are meant to identify “forward-looking statements” within the
meaning of Section 27A of the Securities Act of 1933, as amended, and Section 21E of the Securities Exchange Act of 1934, as amended, and are subject to the safe harbor created by such sections. The Corporation cautions readers not to place
undue reliance on any such forward-looking statements, which speak only as of the date made, and advises readers that various factors, including, but not limited to, the following could cause actual results to differ materially from those
expressed in, or implied by, such forward-looking statements: uncertainties relating to the impact of the COVID-19 pandemic, including recent increases in, and any additional waves of, COVID-19 cases and the development and availability of a
vaccine and treatments for the disease, on the Corporation’s business, operations, employees, credit quality, financial condition and net income, including because of uncertainties as to the extent and duration of the pandemic and the impact
of the pandemic on consumer spending, borrowing and saving habits, the underemployment and unemployment rates, which can adversely affect repayment patterns, the Puerto Rico economy and the global economy, as well as the risk that COVID-19
may exacerbate any other factor that could cause our actual results to differ materially from those expressed in or implied by any forward-looking statements; the success of our preventative actions to protect the Corporation’s information
and that of its customers in response to the cyber incident that we recently experienced, including the integrity of our data and data security systems, increased mitigation costs or an adverse effect to our reputation; risks related to the
effect on the Corporation and its customers of governmental, regulatory, or central bank responses to COVID-19 and the Corporation’s participation in any such responses or programs, such as the Paycheck Protection Program established by the
CARES Act of 2020, including any judgments, claims, damages, penalties, fines or reputational damage resulting from claims or challenges against the Corporation by governments, regulators, customers or otherwise, relating to the Corporation’s
participation in any such responses or programs; the risk that costs, expenses, and resources associated with the Corporation’s recent acquisition of BSPR may be higher than expected; the ability to successfully complete the integration of
systems, procedures, and personnel of BSPR into FirstBank that are necessary to make the transaction economically successful; the risk that the Corporation may not be able to effectively integrate BSPR into the Corporation’s internal control
over financial reporting; the risk that the cost savings and any other synergies from the acquisition may not be fully realized or may take longer to realize than expected, such as the risk that deposit attrition, customer loss and/or revenue
loss following the acquisition may exceed expectations, including because of the impact of the COVID-19 pandemic on customers; uncertainty as to the ultimate outcomes of actions taken, or those that may be taken, by the Puerto Rico
government, or the oversight board established by the Puerto Rico Oversight, Management, and Economic Stability Act (“PROMESA”) to address the Commonwealth of Puerto Rico’s financial problems, including a court-supervised debt restructuring
process similar to U.S. bankruptcy protection undertaken pursuant to Title III of PROMESA, the designation by the PROMESA oversight board of Puerto Rico municipalities as instrumentalities covered under PROMESA, the effects of measures
included in the Puerto Rico government fiscal plan, or any revisions to it, on our clients and loan portfolios, and any potential impact from future economic or political developments in Puerto Rico; changes in economic and business
conditions, including those caused by the COVID-19 pandemic, including recent increases in, and any additional waves of, COVID-19 cases, or other global or regional health crises as well as past or future natural disasters, such as the
earthquakes affecting Puerto Rico’s southern coast, that directly or indirectly affect the financial health of the Corporation’s customer base in the geographic areas we serve and may result in increased costs or losses of property and
equipment and other assets; the impact that a slowing economy and increased unemployment or underemployment may have on the performance of our loan and lease portfolio, the market price of our investment securities, the availability of
sources of funding and the demand for our products; a decrease in demand for the Corporation’s products and services, resulting in lower revenues and earnings because of the continued economic recession in Puerto Rico; uncertainty as to the
availability of certain funding sources, such as brokered CDs; the deteriorating weakness of the real estate markets and of the consumer and commercial sectors, which may be exacerbated by unemployment and underemployment and government
restrictions imposed as a result of the COVID-19 pandemic, including recent increases in, and any additional waves of, COVID-19 cases, and their impact on the credit quality of the Corporation’s loans and other assets, which have contributed
and may continue to contribute to, among other things, higher than targeted levels of non-performing assets, charge-offs and provisions for credit losses, and may subject the Corporation to further risk from loan defaults and foreclosures;
the impact of changes in accounting standards or assumptions in applying those standards, including the impact of the COVID-19 pandemic on the determination of the allowance for credit losses required by the new CECL accounting standard
effective since January 1, 2020; the ability of FirstBank to realize the benefits of its net deferred tax assets; the ability of FirstBank to generate sufficient cash flow to make dividend payments to the Corporation; adverse changes in
general economic conditions in Puerto Rico, the U.S., the U.S. Virgin Islands, and the British Virgin Islands, including the interest rate environment, market liquidity, housing absorption rates, real estate prices, and disruptions in the
U.S. capital markets, including as a result of the COVID-19 pandemic and recent increases in, and any additional waves of, COVID-19 cases, which may further reduce interest margins, affect funding sources and demand for all of the
Corporation’s products and services, and reduce the Corporation’s revenues and earnings and the value of the Corporation’s assets; uncertainty related to the effect of the discontinuation of the London Interbank Offered Rate at the end of
2021; an adverse change in the Corporation’s ability to attract new clients and retain existing ones; the risk that additional portions of the unrealized losses in the Corporation’s investment portfolio are determined to be credit-related,
including additional charges to the provision for credit losses on the Corporation’s remaining $8.0 million exposure to the Puerto Rico government’s debt securities held as part of the available-for-sale securities portfolio; uncertainty
about legislative, tax or regulatory changes that affect financial services companies in Puerto Rico, the U.S., and the U.S. and British Virgin Islands, which could affect the Corporation’s financial condition or performance and could cause
the Corporation’s actual results for future periods to differ materially from prior results and anticipated or projected results; changes in the fiscal and monetary policies and regulations of the U.S. federal government and the Puerto Rico
and other governments, including those determined by the Federal Reserve Board, the New York FED, the FDIC, government-sponsored housing agencies, and regulators in Puerto Rico and the U.S. and British Virgin Islands; the risk of possible
failure or circumvention of the Corporation’s internal controls and procedures and the risk that the Corporation’s risk management policies may not be adequate; the Corporation’s ability to identify and prevent cyber-security incidents, such
as data security breaches, malware, “denial of service” attacks, “hacking” and identity theft, a failure of which most recently caused a cyber incident, and which may result in misuse or misappropriation of confidential or proprietary
information, and could result in the disruption or damage to our systems, increased costs and losses or an adverse effect to our reputation; the risk that the FDIC may increase the deposit insurance premium and/or require special assessments
to replenish its insurance fund, causing an additional increase in the Corporation’s non-interest expenses; the impact on the Corporation’s results of operations and financial condition of business acquisitions, such as the recent acquisition
of BSPR, and dispositions; a need to recognize impairments on the Corporation’s financial instruments, goodwill and other intangible assets relating to business acquisitions, including as a result of the COVID-19 pandemic; the effect of
changes in the interest rate environment, including as a result of the impact of the COVID-19 pandemic, including recent increases in, and any additional waves of, COVID-19 cases, on the global economy, on the Corporation’s businesses,
business practices and results of operations; the risk that the impact of the occurrence of any of these uncertainties on the Corporation’s capital would preclude further growth of the Bank and preclude the Corporation’s Board of Directors
from declaring dividends; uncertainty as to whether FirstBank will be able to continue to satisfy its regulators regarding, among other things, its asset quality, liquidity plans, maintenance of capital levels and compliance with applicable
laws, regulations, and related requirements; and general competitive factors and industry consolidation. The Corporation does not undertake, and specifically disclaims any obligation, to update any “forward-looking statements” to reflect
occurrences or unanticipated events or circumstances after the date of such statements, except as required by the federal securities laws.

Agenda FY & 4Q 2020 Quarter Highlights Aurelio Alemán, President & Chief Executive OfficerFY
& 4Q 2020 Results of Operations Orlando Berges, Executive Vice President & Chief Financial OfficerQuestions & Answers 3

FY & 4Q 2020 Highlights

FY2020 Highlights Improved Strategic Positioning Successful acquisition of Banco Santander Puerto Rico
in 3Q 2020 has secured our market position in a consolidated market with opportunities for enhanced market penetration with over 30% growth in new customers to 675,000 customers Fortress Balance Sheet Liquidity, reserve coverage and capital
levels remain among the highest in the banking industry with ample coverage to weather the impact of disruptions caused by the pandemic Economic Recovery Underway Unprecedented local and federal stimulus programs (~$15 billion) have
bolstered liquidity in the system, in addition to over $60 billion of estimated remaining hurricane relief funding Strong Capital Position Capital ratios remain among the highest in the banking sector even with the balance sheet increasing
$6.2 billion or 49% to $18.8 billion. Capital actions remain a top priority as the economic environment stabilizes Strong Core Operating Performance Pre-tax, pre-provision income for the year increased 6% to $300 million with only four
months of our combined Company. Year-over-year, core deposits increased $6.1 billion or 69% (acquired operations contributed $4.1 billion) 5
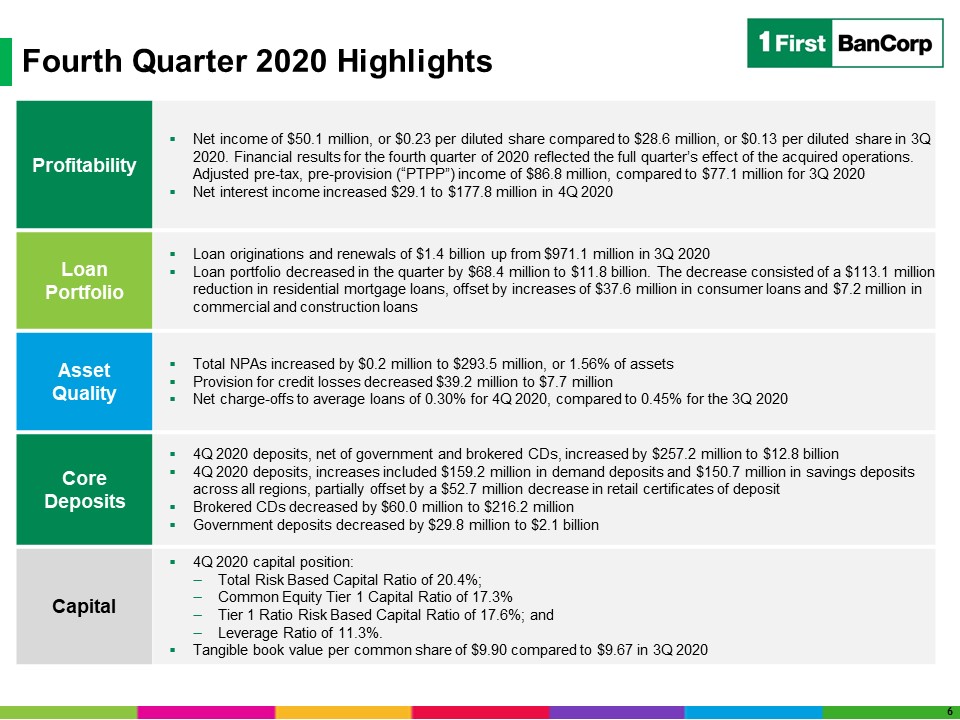
Fourth Quarter 2020 Highlights 6 Profitability Net income of $50.1 million, or $0.23 per diluted
share compared to $28.6 million, or $0.13 per diluted share in 3Q 2020. Financial results for the fourth quarter of 2020 reflected the full quarter’s effect of the acquired operations. Adjusted pre-tax, pre-provision (“PTPP”) income of $86.8
million, compared to $77.1 million for 3Q 2020Net interest income increased $29.1 to $177.8 million in 4Q 2020 Loan Portfolio Loan originations and renewals of $1.4 billion up from $971.1 million in 3Q 2020Loan portfolio decreased in the
quarter by $68.4 million to $11.8 billion. The decrease consisted of a $113.1 million reduction in residential mortgage loans, offset by increases of $37.6 million in consumer loans and $7.2 million in commercial and construction loans Asset
Quality Total NPAs increased by $0.2 million to $293.5 million, or 1.56% of assetsProvision for credit losses decreased $39.2 million to $7.7 millionNet charge-offs to average loans of 0.30% for 4Q 2020, compared to 0.45% for the 3Q
2020 Core Deposits 4Q 2020 deposits, net of government and brokered CDs, increased by $257.2 million to $12.8 billion4Q 2020 deposits, increases included $159.2 million in demand deposits and $150.7 million in savings deposits across all
regions, partially offset by a $52.7 million decrease in retail certificates of deposit Brokered CDs decreased by $60.0 million to $216.2 millionGovernment deposits decreased by $29.8 million to $2.1 billion Capital 4Q 2020 capital
position: Total Risk Based Capital Ratio of 20.4%;Common Equity Tier 1 Capital Ratio of 17.3%Tier 1 Ratio Risk Based Capital Ratio of 17.6%; andLeverage Ratio of 11.3%.Tangible book value per common share of $9.90 compared to $9.67 in 3Q
2020

Strong Operating Metrics During Pandemic Loan Portfolio ($ in millions) Loan Originations (1)($ in
millions) Core Deposits (2)($ in millions) $8,887 $10,086 $14,876 $14,648 $887 $962 $4,424 7 $1,053 $4,346 $1,521 $8,791 Commercial activity is showing signs of strength (8 large originations in excess of $10 million this
quarter). While the overall portfolio increased $7 million, this is net of a $49 million reduction in SBA PPP loans The Consumer portfolio continues to grow nicely, up $38 million in 4Q 2020, driven largely by the auto portfolio, and $328
million, or 14% compared to 4Q 2019Core deposits, increased by $228 million in 4Q 2020. Year-over-year, core deposits increased $6.1 billion. The BSPR transaction contributed $4.1 billion of this growth Loan Originations include originations
and renewals, as well as credit card utilization activityCore Deposits exclude brokered deposits
Strong Operating Metrics During Pandemic Net Interest Income($ in millions) Pre-tax Pre-provision
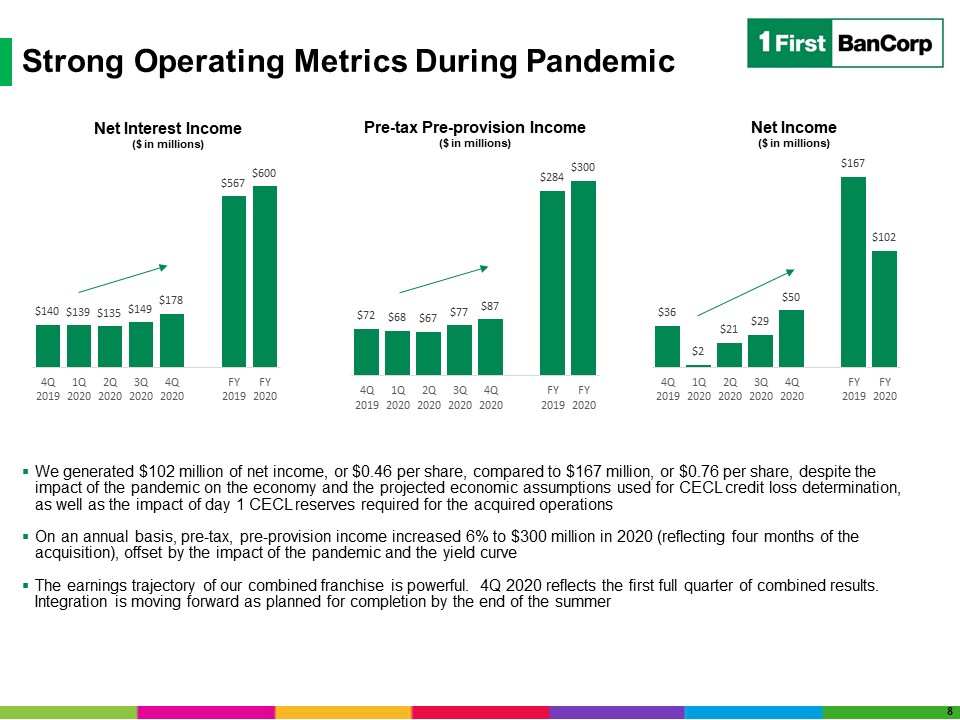
Income($ in millions) Net Income($ in millions) 8 We generated $102 million of net income, or $0.46 per share, compared to $167 million, or $0.76 per share, despite the impact of the pandemic on the economy and the projected economic
assumptions used for CECL credit loss determination, as well as the impact of day 1 CECL reserves required for the acquired operationsOn an annual basis, pre-tax, pre-provision income increased 6% to $300 million in 2020 (reflecting four
months of the acquisition), offset by the impact of the pandemic and the yield curveThe earnings trajectory of our combined franchise is powerful. 4Q 2020 reflects the first full quarter of combined results. Integration is moving forward as
planned for completion by the end of the summer

Fortress Balance Sheet Ample liquidity to drive loan demand as economy continues reopening
effortsStrong reserve coverage on a well-diversified loan portfolioCapital ratios remain among the highest in the banking sector; capital ratios remain well above regulatory “Well-Capitalized” guidelinesCapital deployment opportunities remain
a priority Ample liquidity, reserve coverage and capital post acquisition to support growth initiatives and capital deployment 1) Peer group consists of U.S. banks with assets between $10 billion and $25 billion (64 institutions). Top
quartile as of 3Q 2020 as per S&P Market Intelligence. 9

Results of Operations

Fourth Quarter Highlights ($ in thousands, except per share data) 11

Net Interest Income Key Highlights Net Interest Income ($ millions) A $27.8 million increase in
interest income on loans reflecting:A $1.7 billion increase in average balances primarily related to the full quarter effect of the Santander acquisitionRecognition of $1.1 million in interest collected on two non-accrual loans Acceleration
of $0.7 million in fee income related to forgiveness remittances for SBA PPP loans An $0.8 million reduction in interest expense resulting from an 18bp reduction in funding costs in spite of a $2 billion increase in the average balances of
funding sources NIM was 3.95% for 4Q 2020, compared to 3.93% in 3Q 2020, reflecting, a 4 basis point pick-up from the interest collected on certain non-accrual loans paid-off and the acceleration of fee income recognition related to SBA PPP
loans 12
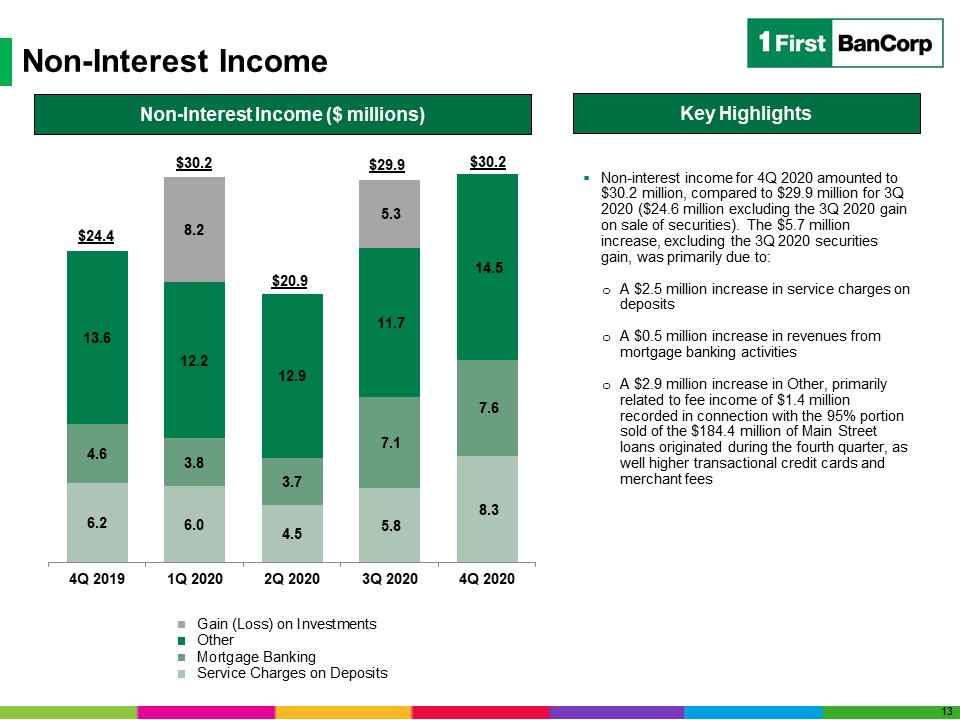
Non-Interest Income Non-interest income for 4Q 2020 amounted to $30.2 million, compared to $29.9
million for 3Q 2020 ($24.6 million excluding the 3Q 2020 gain on sale of securities). The $5.7 million increase, excluding the 3Q 2020 securities gain, was primarily due to: A $2.5 million increase in service charges on deposits A $0.5
million increase in revenues from mortgage banking activitiesA $2.9 million increase in Other, primarily related to fee income of $1.4 million recorded in connection with the 95% portion sold of the $184.4 million of Main Street loans
originated during the fourth quarter, as well higher transactional credit cards and merchant fees Non-Interest Income ($ millions) $20.9 $24.4 $30.2 $29.9 Key Highlights $30.2 13

Non-Interest Expense Non-interest expenses amounted to $134.8 million in 4Q 2020, an increase of $27.3
million from $107.5 million in 3Q 2020, including the following special items:Merger and restructuring costs associated with the acquisition of $12.3 million for 4Q 2020, compared to $10.4 million for 3Q 2020 COVID-19 pandemic-related
expenses of $1.1 million for 4Q 2020, compared to $1.0 million for 3Q 2020 Credit Related expenses (OREO & Collections, Appraisals and Other) amounted to $1.8 million in 4Q 2020 compared to $2.2 million in 3Q 2020On a non-GAAP basis,
excluding the effect of these items, expenses amounted to $119.6 million for 4Q 2020, compared to $93.8 million for 3Q 2020. The $25.7 million increase reflects the full quarter of the acquisition and higher expenses associated with increases
in the level of economic activity, and the following:A $0.9 million increase associated with incentive compensationA $2.3 million increase in outsourced technology fees, primarily related to information technology mattersA $1.5 million
increase in the amortization of core deposit and purchased credit card relationship intangible assets recorded in connection with the acquisition Non-Interest Expense ($ millions) Key Highlights 14
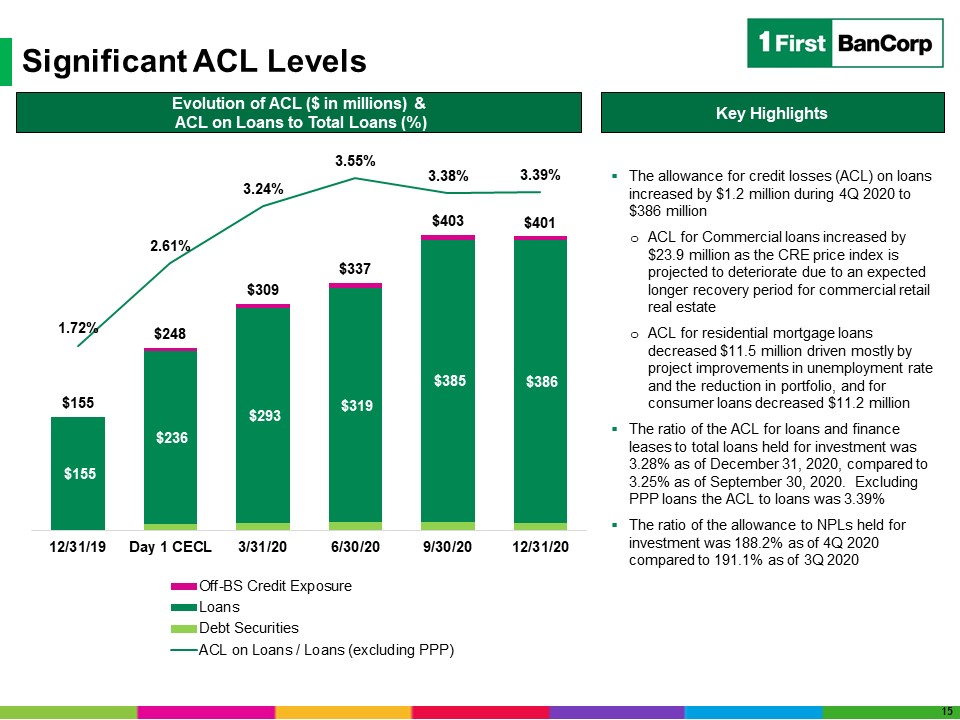
Significant ACL Levels Evolution of ACL ($ in millions) & ACL on Loans to Total Loans (%) The
allowance for credit losses (ACL) on loans increased by $1.2 million during 4Q 2020 to $386 millionACL for Commercial loans increased by $23.9 million as the CRE price index is projected to deteriorate due to an expected longer recovery
period for commercial retail real estateACL for residential mortgage loans decreased $11.5 million driven mostly by project improvements in unemployment rate and the reduction in portfolio, and for consumer loans decreased $11.2 millionThe
ratio of the ACL for loans and finance leases to total loans held for investment was 3.28% as of December 31, 2020, compared to 3.25% as of September 30, 2020. Excluding PPP loans the ACL to loans was 3.39%The ratio of the allowance to NPLs
held for investment was 188.2% as of 4Q 2020 compared to 191.1% as of 3Q 2020 Key Highlights 15
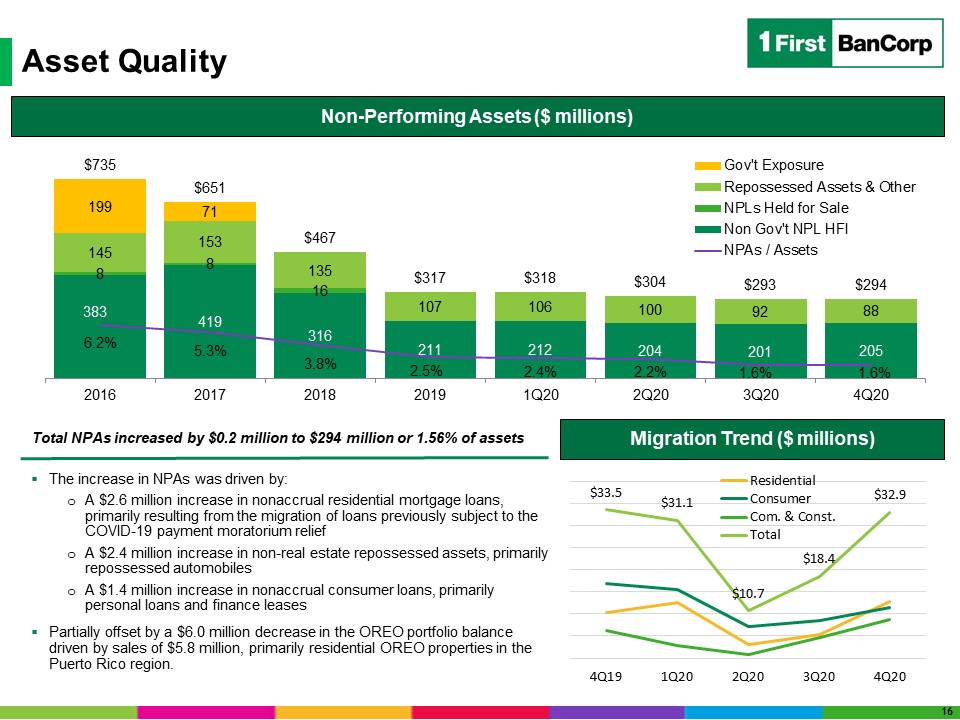
Asset Quality Non-Performing Assets ($ millions) The increase in NPAs was driven by:A $2.6 million
increase in nonaccrual residential mortgage loans, primarily resulting from the migration of loans previously subject to the COVID-19 payment moratorium reliefA $2.4 million increase in non-real estate repossessed assets, primarily
repossessed automobilesA $1.4 million increase in nonaccrual consumer loans, primarily personal loans and finance leasesPartially offset by a $6.0 million decrease in the OREO portfolio balance driven by sales of $5.8 million, primarily
residential OREO properties in the Puerto Rico region. Total NPAs increased by $0.2 million to $294 million or 1.56% of assets Migration Trend ($ millions) 16

Capital Ratios Total stockholders’ equity amounted to $2.3 billion as of December 31, 2020, an
increase of $49.9 million from September 30, 2020. The increase was driven by earnings generated in the fourth quarter, and a $10.4 million increase in the fair value of available-for-sale investment securities recorded as part of Other
comprehensive income in the consolidated statements of financial condition, partially offset by common and preferred stock dividends declared in the fourth quarter totaling $11.6 million. Key Highlights 17

FY 2020 Highlights ($ in thousands, except per share data) 18

Exhibits

Fourth Quarter 2020 Highlights: PR Government Exposure ($ in millions) As of December 31, 2020,
the Corporation had $394.8 million of direct exposure to the Puerto Rico Government, its municipalities and public corporations, compared to $400.3 million as of September 30, 202085% of direct government exposure is to municipalities, which
are supported by assigned property tax revenuesAs of December 31, 2020, the Corporation had $1,797.1 million of public sector deposits in Puerto Rico, compared to $1,702.9 million as of September 30, 2020Approximately 23% is from
municipalities in Puerto Rico and 74% is from public corporations and the central government and agencies in Puerto Rico 20

($ in 000) Fourth Quarter 2020 Highlights: NPL Migration 21

Use of Non-GAAP Financial Measures Basis of PresentationUse of Non-GAAP Financial Measures This
presentation contains non-GAAP financial measures. Non-GAAP financial measures are used when management believes they will be helpful to an understanding of the Corporation’s results of operations or financial position. Where non-GAAP
financial measures are used, the comparable GAAP financial measure, as well as the reconciliation of the non-GAAP financial measure to the comparable GAAP financial measure, can be found in the text or in the attached tables to this earnings
release. Any analysis of these non-GAAP financial measures should be used only in conjunction with results presented in accordance with GAAP. Tangible Common Equity Ratio and Tangible Book Value per Common Share The tangible common equity
ratio and tangible book value per common share are non-GAAP financial measures generally used by the financial community to evaluate capital adequacy. Tangible common equity is total equity less preferred equity, goodwill, core deposit
intangibles, and other intangibles, such as the purchased credit card relationship intangible and the insurance customer relationship intangible. Tangible assets are total assets less goodwill, core deposit intangibles, and other intangibles,
such as the purchased credit card relationship intangible and the insurance customer relationship intangible. Management and many stock analysts use the tangible common equity ratio and tangible book value per common share in conjunction with
more traditional bank capital ratios to compare the capital adequacy of banking organizations with significant amounts of goodwill or other intangible assets, typically stemming from the use of the purchase method of accounting for mergers
and acquisitions. Accordingly, the Corporation believes that disclosures of these financial measures may be useful also to investors. Neither tangible common equity nor tangible assets, or the related measures should be considered in
isolation or as a substitute for stockholders’ equity, total assets, or any other measure calculated in accordance with GAAP. Moreover, the manner in which the Corporation calculates its tangible common equity, tangible assets, and any other
related measures may differ from that of other companies reporting measures with similar names. 22
Use of Non-GAAP Financial Measures Basis of PresentationUse of Non-GAAP Financial Measures This
presentation contains non-GAAP financial measures. Non-GAAP financial measures are used when management believes they will be helpful to an understanding of the Corporation’s results of operations or financial position. Where non-GAAP
financial measures are used, the comparable GAAP financial measure, as well as the reconciliation of the non-GAAP financial measure to the comparable GAAP financial measure, can be found in the text or in the attached tables to this earnings
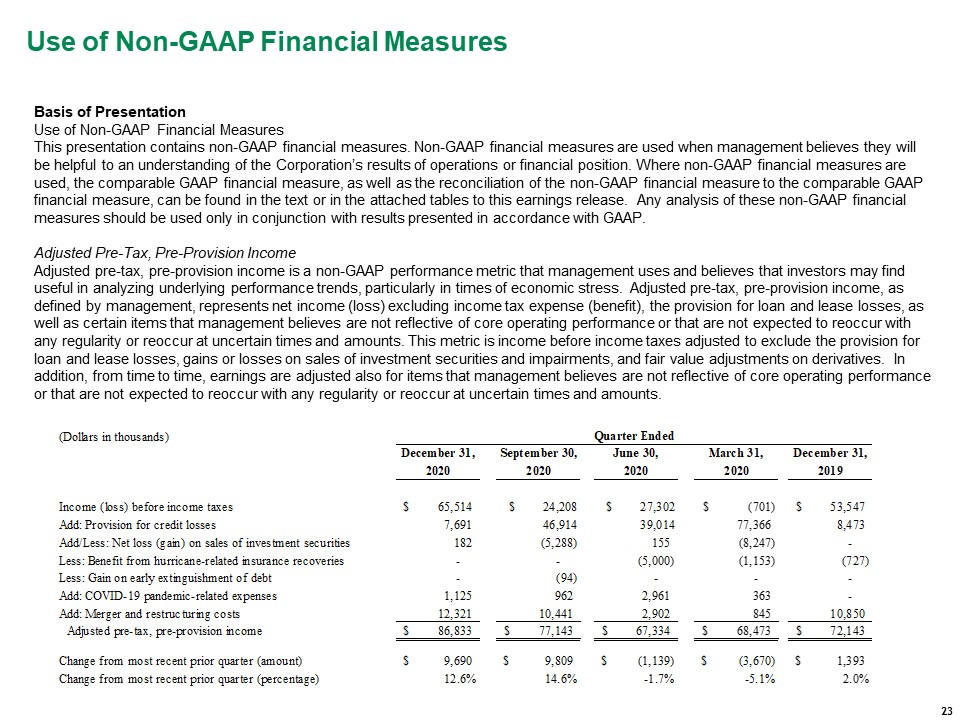
release. Any analysis of these non-GAAP financial measures should be used only in conjunction with results presented in accordance with GAAP. Adjusted Pre-Tax, Pre-Provision IncomeAdjusted pre-tax, pre-provision income is a non-GAAP
performance metric that management uses and believes that investors may find useful in analyzing underlying performance trends, particularly in times of economic stress. Adjusted pre-tax, pre-provision income, as defined by management,
represents net income (loss) excluding income tax expense (benefit), the provision for loan and lease losses, as well as certain items that management believes are not reflective of core operating performance or that are not expected to
reoccur with any regularity or reoccur at uncertain times and amounts. This metric is income before income taxes adjusted to exclude the provision for loan and lease losses, gains or losses on sales of investment securities and impairments,
and fair value adjustments on derivatives. In addition, from time to time, earnings are adjusted also for items that management believes are not reflective of core operating performance or that are not expected to reoccur with any regularity
or reoccur at uncertain times and amounts. 23

Use of Non-GAAP Financial Measures Basis of PresentationUse of Non-GAAP Financial Measures This
presentation contains non-GAAP financial measures. Non-GAAP financial measures are used when management believes they will be helpful to an understanding of the Corporation’s results of operations or financial position. Where non-GAAP
financial measures are used, the comparable GAAP financial measure, as well as the reconciliation of the non-GAAP financial measure to the comparable GAAP financial measure, can be found in the text or in the attached tables to this earnings
release. Any analysis of these non-GAAP financial measures should be used only in conjunction with results presented in accordance with GAAP. Adjusted Pre-Tax, Pre-Provision IncomeAdjusted pre-tax, pre-provision income is a non-GAAP
performance metric that management uses and believes that investors may find useful in analyzing underlying performance trends, particularly in times of economic stress. Adjusted pre-tax, pre-provision income, as defined by management,
represents net income (loss) excluding income tax expense (benefit), the provision for loan and lease losses, as well as certain items that management believes are not reflective of core operating performance or that are not expected to
reoccur with any regularity or reoccur at uncertain times and amounts. This metric is income before income taxes adjusted to exclude the provision for loan and lease losses, gains or losses on sales of investment securities and impairments,
and fair value adjustments on derivatives. In addition, from time to time, earnings are adjusted also for items that management believes are not reflective of core operating performance or that are not expected to reoccur with any regularity
or reoccur at uncertain times and amounts. 24

Use of Non-GAAP Financial Measures Basis of PresentationUse of Non-GAAP Financial Measures This
presentation contains non-GAAP financial measures. Non-GAAP financial measures are used when management believes they will be helpful to an understanding of the Corporation’s results of operations or financial position. Where non-GAAP
financial measures are used, the comparable GAAP financial measure, as well as the reconciliation of the non-GAAP financial measure to the comparable GAAP financial measure, can be found in the text or in the attached tables to this earnings
release. Any analysis of these non-GAAP financial measures should be used only in conjunction with results presented in accordance with GAAP. The financial results include the following significant items that management believes are not
reflective of core operating performance, are not expected to reoccur with any regularity or may reoccur at uncertain times and in uncertain amounts (the “Special Items”):Quarter ended December 31, 2020Merger and restructuring costs of $12.3
million ($7.7 million after-tax) in connection with the BSPR acquisition integration process and related restructuring initiatives. Merger and restructuring costs in the fourth quarter included a $4.3 million charge associated with an
Employee Voluntary Separation Program (“VSP”) offered to eligible employees in the Puerto Rico region. Approximately 100 employees participated in the program. To allow for a transition period, the effective separation date for eligible
employees is the period between the end of November 2020 until the end of June 2021. The estimated total cost of the VSP is approximately $9.2 million; thus, the Corporation anticipates additional charges of approximately $3.2 million in the
first quarter of 2021 and $1.7 million in the second quarter of 2021. In addition to the charge associated with the VSP, merger and restructuring costs in the fourth quarter of 2020 primarily included bonuses, consulting fees, and expenses
related to system conversions and other integration related efforts.Costs of $1.1 million ($0.7 million after-tax) related to the COVID-19 pandemic response efforts, primarily costs related to additional cleaning, safety materials, and
security matters.Loss of $0.2 million realized on sales of available-for-sale investment securities. The loss realized at the tax-exempt international banking entity subsidiary level had no effect on the income tax expense recorded in the
fourth quarter of 2020.Quarter ended September 30, 2020Merger and restructuring costs of $10.4 million ($6.5 million after-tax) in connection with the acquisition of BSPR and related restructuring initiatives. Merger and restructuring costs
in the third quarter of 2020 primarily included consulting, legal, system conversions and other integration related efforts.An $8.0 million tax benefit related to a partial reversal of the deferred tax asset valuation allowance. 25

Use of Non-GAAP Financial Measures Basis of PresentationUse of Non-GAAP Financial Measures This
presentation contains non-GAAP financial measures. Non-GAAP financial measures are used when management believes they will be helpful to an understanding of the Corporation’s results of operations or financial position. Where non-GAAP
financial measures are used, the comparable GAAP financial measure, as well as the reconciliation of the non-GAAP financial measure to the comparable GAAP financial measure, can be found in the text or in the attached tables to this earnings
release. Any analysis of these non-GAAP financial measures should be used only in conjunction with results presented in accordance with GAAP. The financial results include the following significant items that management believes are not
reflective of core operating performance, are not expected to reoccur with any regularity or may reoccur at uncertain times and in uncertain amounts (the “Special Items”):Quarter ended September 30, 2020A $5.3 million aggregate gain on sales
of approximately $116.6 million of U.S. agencies MBS and $803.3 million of U.S. Treasury Notes executed in the latter part of September. The gain on tax-exempt securities or realized at the tax-exempt international banking entity subsidiary
level had no effect in the income tax expense recorded in the third quarter of 2020. Costs of $1.0 million ($0.6 million after-tax) related to the COVID-19 pandemic response efforts, primarily costs related to additional cleaning, safety
materials, and security matters. Quarter ended June 30, 2020A $5.0 million ($3.1 million after-tax) benefit resulting from the final settlement of the Corporation’s business interruption insurance claim related to lost profits caused by
Hurricanes Irma and Maria in 2017.Merger and restructuring costs of $2.9 million ($1.8 million after-tax) in connection with the previously announced stock purchase agreement with Santander Holdings USA, Inc. relating to the Corporation’s
acquisition of BSPR and related restructuring initiatives. Merger and restructuring costs in the second quarter of 2020 primarily included consulting, legal, and other pre-conversion related efforts associated with the pending acquisition of
BSPR.Costs of $3.0 million ($1.9 million after-tax) related to the COVID-19 pandemic response efforts, including approximately $1.7 million in bonuses paid to branch personnel and other essential employees for working during the pandemic, as
well as other employee-related expenses such as expenses for the administration of COVID-19 tests and purchases of personal protective equipment.A $0.2 million loss realized on sales of U.S. agencies MBS. The loss, realized at the tax-exempt
international banking entity subsidiary, had no effect on the income tax expense recorded in the second quarter of 2020. 26

Use of Non-GAAP Financial Measures Basis of PresentationUse of Non-GAAP Financial Measures This
presentation contains non-GAAP financial measures. Non-GAAP financial measures are used when management believes they will be helpful to an understanding of the Corporation’s results of operations or financial position. Where non-GAAP
financial measures are used, the comparable GAAP financial measure, as well as the reconciliation of the non-GAAP financial measure to the comparable GAAP financial measure, can be found in the text or in the attached tables to this earnings
release. Any analysis of these non-GAAP financial measures should be used only in conjunction with results presented in accordance with GAAP. The financial results include the following significant items that management believes are not
reflective of core operating performance, are not expected to reoccur with any regularity or may reoccur at uncertain times and in uncertain amounts (the “Special Items”):Quarter ended March 31, 2020An $8.2 million gain on sales of
approximately $275.6 million of U.S. agencies MBS executed in the latter part of March. The gain, realized at the tax-exempt international banking entity subsidiary, had no effect on the income tax expense recorded in the first quarter of
2020.A $1.2 million ($0.7 million after-tax) benefit resulting from insurance recoveries associated with hurricane-related expenses incurred primarily in the Puerto Rico region.Merger and restructuring costs of $0.8 million ($0.5 million
after-tax) in connection with the pending acquisition of BSPR and related restructuring initiatives. Costs of $0.4 million ($0.2 million after-tax) related to the COVID-19 pandemic response efforts, primarily costs related to additional
cleaning and communications with customers. Quarter ended December 31, 2019Merger and restructuring costs of $10.9 million ($6.8 million after-tax) in connection with the BSPR acquisition and related restructuring initiatives. Merger and
restructuring costs in the fourth quarter of 2019 primarily included advisory, legal, valuation, and other professional service fees associated with the then pending acquisition of BSPR, as well as a $3.4 million charge related to a VSP
offered to eligible employees of FirstBank in connection with initiatives to capitalize on expected operational efficiencies from the acquisition. A $0.7 million ($0.5 million after-tax) benefit resulting from hurricane-related insurance
recoveries related to repairs and maintenance costs incurred on facilities in the Virgin Islands region. 27

Use of Non-GAAP Financial Measures Basis of PresentationUse of Non-GAAP Financial Measures This
presentation contains non-GAAP financial measures. Non-GAAP financial measures are used when management believes they will be helpful to an understanding of the Corporation’s results of operations or financial position. Where non-GAAP
financial measures are used, the comparable GAAP financial measure, as well as the reconciliation of the non-GAAP financial measure to the comparable GAAP financial measure, can be found in the text or in the attached tables to this earnings
release. Any analysis of these non-GAAP financial measures should be used only in conjunction with results presented in accordance with GAAP. The following table the reported net income to adjusted net income, a non-GAAP financial measure
that excludes the Special Items identified on prior pages as well as gains or losses on sales of investment securities and impairments:Adjusted net income (Non-GAAP) 28