Attached files
| file | filename |
|---|---|
| 8-K - FORM 8-K - Carter Bankshares, Inc. | tm214761d1_8k.htm |
Exhibit 99.1

Investor Update: Q4/YE 2020 Updated January 2021

IMPORTANT NOTE REGARDING FORWARD LOOKING STATEMENTS 2 This information contains certain forward - looking statements within the meaning of the Private Securities Litigation Reform Act of 1995. Forward - looking statements generally relate to our financial condition, results of operations, plans, objectives, outlook for earnings, revenues, expenses, capita l a nd liquidity levels and ratios, asset levels, asset quality, financial position, and other matters regarding or affecting Carter Bankshares , Inc. and its future business and operations, and specifically including information related to the pending appraisal of collateral for one impaired loan relationship and potential impacts on the Company’s financial results. For ward looking statements are typically identified by words or phrases such as “will likely result,” “expect,” “anticipate,” “estimate,” “forecast,” “project,” “intend,” “ believe ,” “assume,” “strategy,” “trend,” “plan,” “outlook,” “outcome,” “continue,” “remain,” “potential,” “opportunity,” “believe,” “comfortable,” “current,” “position,” “maintain,” “su sta in,” “seek,” “achieve” and variations of such words and similar expressions, or future or conditional verbs such as will, would, should, could or may. Although we believe the as sum ptions upon which these forward - looking statements are based are reasonable, any of these assumptions could prove to be inaccurate and the forward - looking statements ba sed on these assumptions could be incorrect. The matters discussed in these forward - looking statements are subject to various risks, uncertainties and other factors that cou ld cause actual results and trends to differ materially from those made, projected, or implied in or by the forward - looking statements depending on a variety of uncertaintie s or other factors including, but not limited to: credit losses; cyber - security concerns; rapid technological developments and changes; the Company’s liquidity and capital positi ons; the potential adverse effects of unusual and infrequently occurring events, such as weather - related disasters, terrorist acts or public health events (such as the current CO VID - 19 pandemic), and of governmental and societal responses thereto; these potential adverse effects may include, without limitation, adverse effects on the ability of the Com pan y's borrowers to satisfy their obligations to the Bank, on the value of collateral securing loans, on the demand for the Company's loans or its other products and services, on in cidents of cyberattack and fraud, on the Company’s liquidity or capital positions, on risks posed by reliance on third - party service providers, on other aspects of the C ompany's business operations and on financial markets and economic growth; sensitivity to the interest rate environment including a prolonged period of low interest rates, a rapid increase in interest rates or a change in the shape of the yield curve; a change in spreads on interest - earning assets and interest - bearing liabilities; regulatory supervisio n and oversight; legislation affecting the financial services industry as a whole, and Carter Bankshares , Inc., in particular; the outcome of pending and future litigation and governmental proceedings; increasing price and product/service competition; the ability to continue to introduce competitive new products and services on a timely, cost - effect ive basis; managing our internal growth and acquisitions; the possibility that the anticipated benefits from acquisitions cannot be fully realized in a timely manner or at all, or that integrating the acquired operations will be more difficult, disruptive or more costly than anticipated; containing costs and expenses; reliance on significant customer r ela tionships; general economic or business conditions; deterioration of the housing market and reduced demand for mortgages; deterioration in the overall macroeconomic conditions o r t he state of the banking industry that could warrant further analysis of the carrying value of goodwill and could result in an adjustment to its carrying value resulting in a non - cash charge to net income; re - emergence of turbulence in significant portions of the global financial and real estate markets that could impact our performance, both di rec tly, by affecting our revenues and the value of our assets and liabilities, and indirectly, by affecting the economy generally and access to capital in the amounts, at the times an d on the terms required to support our future businesses. Many of these factors, as well as other factors, are described in our filings with the Securities and Exchange Co mmi ssion. Forward - looking statements are based on beliefs and assumptions using information available at the time the statements are made. We caution you not to unduly rely on fo rward - looking statements because the assumptions, beliefs, expectations and projections about future events may, and often do, differ materially from actual resul ts. Any forward - looking statement speaks only as to the date on which it is made, and we undertake no obligation to update any forward - looking statement to reflect developments occ urring after the statement is made.
IMPORTANT NOTE REGARDING NON - GAAP FINANCIAL MEASURES Statements included in this press release include non - GAAP financial measures and should be read along with the accompanying tab les in our definitions and reconciliations of GAAP to non - GAAP financial measures. This press release and the accompanying tables discuss f inancial measures, such as adj usted noninterest expense, adjusted efficiency ratio, and net interest income on a fully taxable equivalent basis, which are all non - GAAP measures. We believe that such non - GAAP measures are useful because they enhance the ability of investors and management to evaluate and compare the Company’s operating results from period to period in a meaningful manner. Non - GAAP measur es should not be considered as an alternative to any measure of performance as promulgated under GAAP, nor are they necessarily com parable to non - GAAP performance measures that may be presented by other companies. Investors should consider the Company’s performance and financial condition as reported under GAAP and all other relevant information when assessing the performance or financial con dit ion of the Company’s. Non - GAAP measures have limitations as analytical tools, and investors should not consider them in isolation or as a s ubstitute for analysis of the Company’s results or financial condition as reported under GAAP. 3
4 TABLE OF CONTENTS 1. INTRODUCTION TO CARTER BANKSHARES, INC. 2. FINANCIAL RESULTS 3. CAPITAL & LIQUIDITY UPDATE 4. LOAN PORTFOLIO COMPOSITION 5. STRATEGIC INITIATIVES UPDATE 6. RETAIL NETWORK OPTIMIZATION UPDATE 7. TECHNOLOGY/NEW PRODUCTS UPDATE 8. ASSET QUALITY UPDATE 9. BALANCE SHEET TRANSFORMATION 10. DEPOSIT MIX/COF UPDATE 11. LOAN DEFERRAL UPDATE 12. PAYCHECK PROTECTION PROGRAM UPDATE

INTRODUCTION 01 5
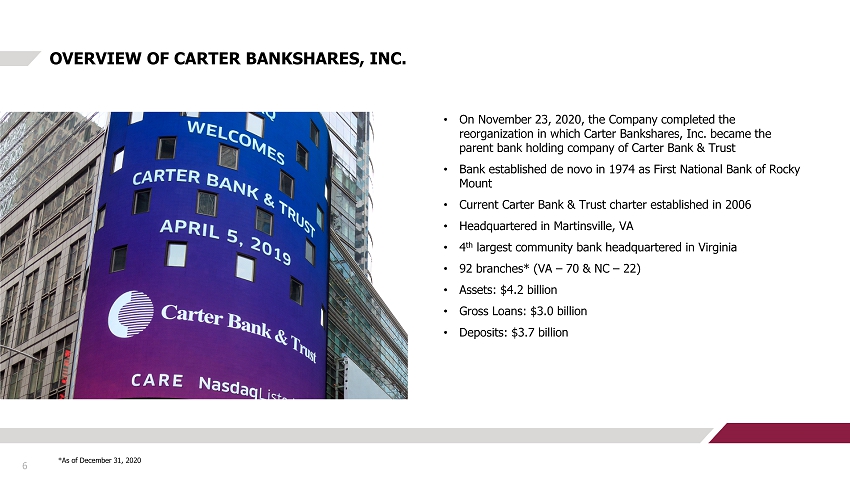
• On November 23, 2020, the Company completed the reorganization in which Carter Bankshares , Inc. became the parent bank holding company of Carter Bank & Trust • Bank established de novo in 1974 as First National Bank of Rocky Mount • Current Carter Bank & Trust charter established in 2006 • Headquartered in Martinsville, VA • 4 th largest community bank headquartered in Virginia • 92 branches* (VA – 70 & NC – 22) • Assets: $4.2 billion • Gross Loans: $3.0 billion • Deposits: $3.7 billion OVERVIEW OF CARTER BANKSHARES, INC. 6 *As of December 31, 2020
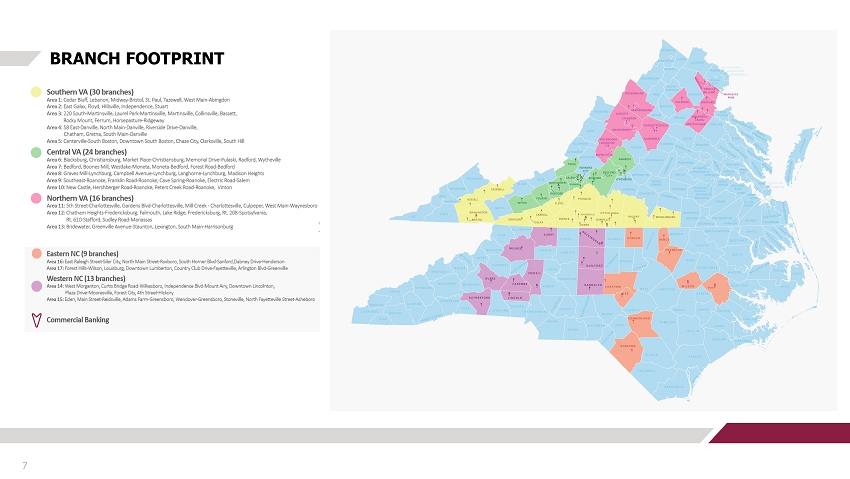
BRANCH FOOTPRINT 7
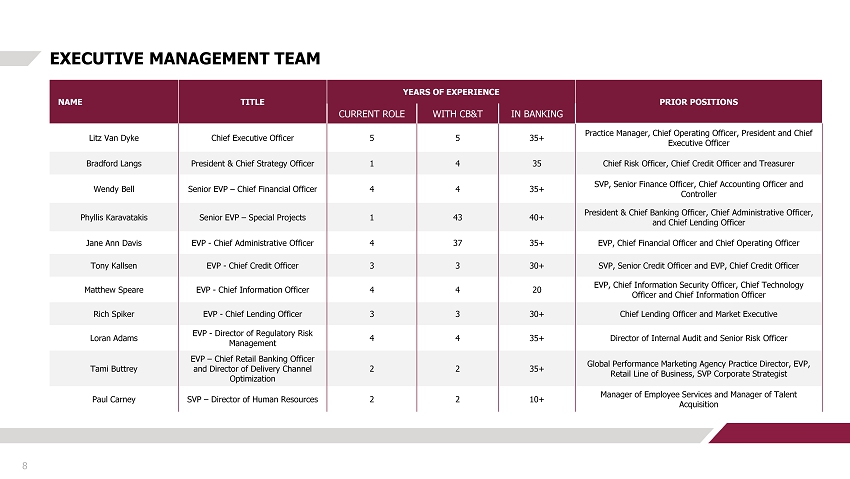
EXECUTIVE MANAGEMENT TEAM 8 NAME TITLE YEARS OF EXPERIENCE PRIOR POSITIONS CURRENT ROLE WITH CB&T IN BANKING Litz Van Dyke Chief Executive Officer 5 5 35+ Practice Manager, Chief Operating Officer, President and Chief Executive Officer Bradford Langs President & Chief Strategy Officer 1 4 35 Chief Risk Officer, Chief Credit Officer and Treasurer Wendy Bell Senior EVP – Chief Financial Officer 4 4 35+ SVP, Senior Finance Officer, Chief Accounting Officer and Controller Phyllis Karavatakis Senior EVP – Special Projects 1 43 40+ President & Chief Banking Officer, Chief Administrative Officer, and Chief Lending Officer Jane Ann Davis EVP - Chief Administrative Officer 4 37 35+ EVP, Chief Financial Officer and Chief Operating Officer Tony Kallsen EVP - Chief Credit Officer 3 3 30+ SVP, Senior Credit Officer and EVP, Chief Credit Officer Matthew Speare EVP - Chief Information Officer 4 4 20 EVP, Chief Information Security Officer, Chief Technology Officer and Chief Information Officer Rich Spiker EVP - Chief Lending Officer 3 3 30+ Chief Lending Officer and Market Executive Loran Adams EVP - Director of Regulatory Risk Management 4 4 35+ Director of Internal Audit and Senior Risk Officer Tami Buttrey EVP – Chief Retail Banking Officer and Director of Delivery Channel Optimization 2 2 35+ Global Performance Marketing Agency Practice Director, EVP, Retail Line of Business, SVP Corporate Strategist Paul Carney SVP – Director of Human Resources 2 2 10+ Manager of Employee Services and Manager of Talent Acquisition

FINANCIAL RESULTS 02 9

KEY FINANCIAL METRICS 10 (1) At December 31, 2020, total deposits include $84.7 million of deposits held for assumption and total loans included $9.8 mil lion of loans held - for - sale, both in connection with the Company’s agreement to sell four of its banking branches. (2) Net income, excluding a one - time $62.2 million goodwill impairment charge, was $16.3 million in 2020 12/31/20 12/31/19 12/31/18 Total Assets $4.2 Billion $4.0 Billion $4.0 Billion Total Loans $3.0 Billion (1) $2.9 Billion $2.7 Billion Total Deposits $3.7 Billion (1) $3.5 Billion $3.6 Billion Total Capital Ratio 14.33% 14.83% 15.11% Tier 1 Capital 13.08% 13.58% 13.86% Leverage Ratio 10.26% 10.33% 9.61% Market Capitalization $283 Million $625 Million $472 Million Market Value Per Share $10.72 $23.72 $17.96 Price to Tangible Book 0.64x 1.52x 1.24x Net Income (YTD) (GAAP) $(45.9) Million $26.6 Million $11.9 Million Net Income (YTD) (Non - GAAP) $16.3 Million (2) $26.6 Million $11.9 Million
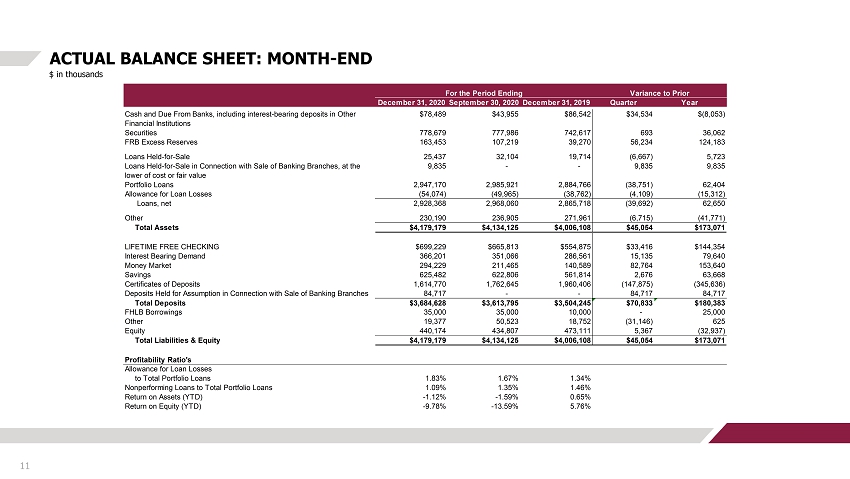
ACTUAL BALANCE SHEET: MONTH - END 11 $ in thousands December 31, 2020September 30, 2020December 31, 2019 Quarter Year Cash and Due From Banks, including interest-bearing deposits in Other Financial Institutions $78,489 $43,955 $86,542 $34,534 $(8,053) Securities 778,679 777,986 742,617 693 36,062 FRB Excess Reserves 163,453 107,219 39,270 56,234 124,183 Loans Held-for-Sale 25,437 32,104 19,714 (6,667) 5,723 Loans Held-for-Sale in Connection with Sale of Banking Branches, at the lower of cost or fair value 9,835 - - 9,835 9,835 Portfolio Loans 2,947,170 2,985,921 2,884,766 (38,751) 62,404 Allowance for Loan Losses (54,074) (49,965) (38,762) (4,109) (15,312) Loans, net 2,928,368 2,968,060 2,865,718 (39,692) 62,650 Other 230,190 236,905 271,961 (6,715) (41,771) Total Assets $4,179,179 $4,134,125 $4,006,108 $45,054 $173,071 LIFETIME FREE CHECKING $699,229 $665,813 $554,875 $33,416 $144,354 Interest Bearing Demand 366,201 351,066 286,561 15,135 79,640 Money Market 294,229 211,465 140,589 82,764 153,640 Savings 625,482 622,806 561,814 2,676 63,668 Certificates of Deposits 1,614,770 1,762,645 1,960,406 (147,875) (345,636) Deposits Held for Assumption in Connection with Sale of Banking Branches 84,717 - - 84,717 84,717 Total Deposits $3,684,628 $3,613,795 $3,504,245 $70,833 $180,383 FHLB Borrowings 35,000 35,000 10,000 - 25,000 Other 19,377 50,523 18,752 (31,146) 625 Equity 440,174 434,807 473,111 5,367 (32,937) Total Liabilities & Equity $4,179,179 $4,134,125 $4,006,108 $45,054 $173,071 Profitability Ratio's Allowance for Loan Losses to Total Portfolio Loans 1.83% 1.67% 1.34% Nonperforming Loans to Total Portfolio Loans 1.09% 1.35% 1.46% Return on Assets (YTD) -1.12% -1.59% 0.65% Return on Equity (YTD) -9.78% -13.59% 5.76% For the Period Ending Variance to Prior
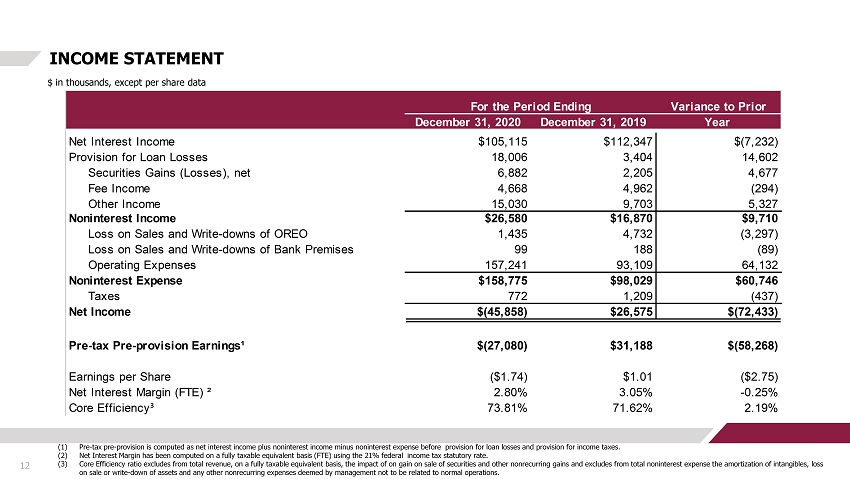
INCOME STATEMENT 12 $ in thousands, except per share data (1) Pre - tax pre - provision is computed as net interest income plus noninterest income minus noninterest expense before provision for loan losses and provision for income taxes. (2) Net Interest Margin has been computed on a fully taxable equivalent basis (FTE) using the 21% federal income tax statutory r ate . (3) Core Efficiency ratio excludes from total revenue, on a fully taxable equivalent basis, the impact of on gain on sale of secu rit ies and other nonrecurring gains and excludes from total noninterest expense the amortization of intangibles, loss on sale or write - down of assets and any other nonrecurring expenses deemed by management not to be related to normal operations. Variance to Prior December 31, 2020 December 31, 2019 Year Net Interest Income $105,115 $112,347 $(7,232) Provision for Loan Losses 18,006 3,404 14,602 Securities Gains (Losses), net 6,882 2,205 4,677 Fee Income 4,668 4,962 (294) Other Income 15,030 9,703 5,327 Noninterest Income $26,580 $16,870 $9,710 Loss on Sales and Write-downs of OREO 1,435 4,732 (3,297) Loss on Sales and Write-downs of Bank Premises 99 188 (89) Operating Expenses 157,241 93,109 64,132 Noninterest Expense $158,775 $98,029 $60,746 Taxes 772 1,209 (437) Net Income $(45,858) $26,575 $(72,433) Pre-tax Pre-provision Earnings¹ $(27,080) $31,188 $(58,268) Earnings per Share ($1.74) $1.01 ($2.75) Net Interest Margin (FTE) ² 2.80% 3.05% -0.25% Core Efficiency³ 73.81% 71.62% 2.19% For the Period Ending

CAPITAL & LIQUIDITY UPDATE 03 13
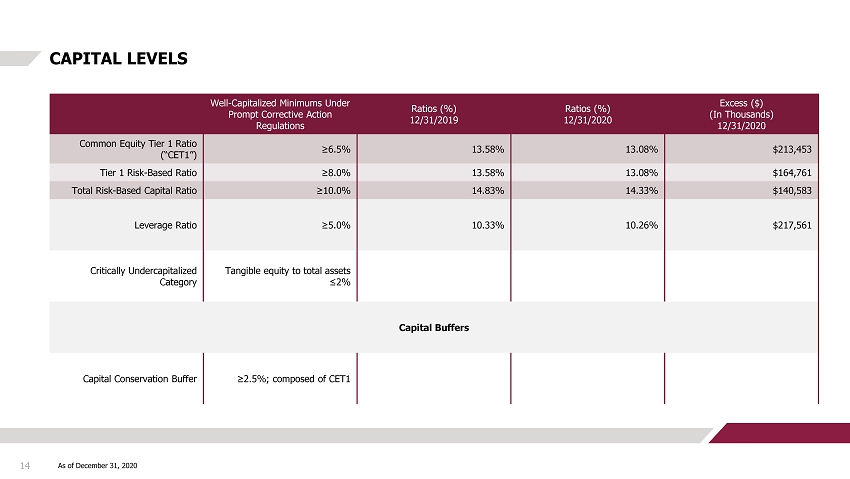
CAPITAL LEVELS 14 As of December 31, 2020 Well - Capitalized Minimums Under Prompt Corrective Action Regulations Ratios (%) 12/31/2019 Ratios (%) 12/31/2020 Excess ($) (In Thousands) 12/31/2020 Common Equity Tier 1 Ratio (“CET1”) ≥6.5% 13.58% 13.08% $213,453 Tier 1 Risk - Based Ratio ≥8.0% 13.58% 13.08% $164,761 Total Risk - Based Capital Ratio ≥10.0% 14.83% 14.33% $140,583 Leverage Ratio ≥5.0% 10.33% 10.26% $217,561 Critically Undercapitalized Category Tangible equity to total assets ≤2% Capital Buffers Capital Conservation Buffer ≥2.5%; composed of CET1
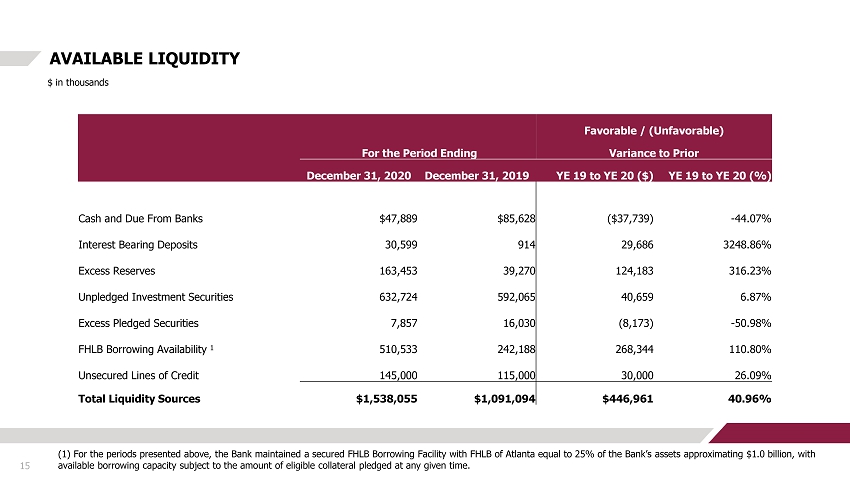
AVAILABLE LIQUIDITY 15 $ in thousands (1) For the periods presented above, the Bank maintained a secured FHLB Borrowing Facility with FHLB of Atlanta equal to 25% of the Bank’s assets approximating $1.0 billion, with available borrowing capacity subject to the amount of eligible collateral pledged at any given time. Favorable / (Unfavorable) For the Period Ending Variance to Prior December 31, 2020 December 31, 2019 YE 19 to YE 20 ($) YE 19 to YE 20 (%) Cash and Due From Banks $47,889 $85,628 ($37,739) - 44.07% Interest Bearing Deposits 30,599 914 29,686 3248.86% Excess Reserves 163,453 39,270 124,183 316.23% Unpledged Investment Securities 632,724 592,065 40,659 6.87% Excess Pledged Securities 7,857 16,030 (8,173) - 50.98% FHLB Borrowing Availability 1 510,533 242,188 268,344 110.80% Unsecured Lines of Credit 145,000 115,000 30,000 26.09% Total Liquidity Sources $1,538,055 $1,091,094 $446,961 40.96%

LOAN PORTFOLIO COMPOSITION 04 16
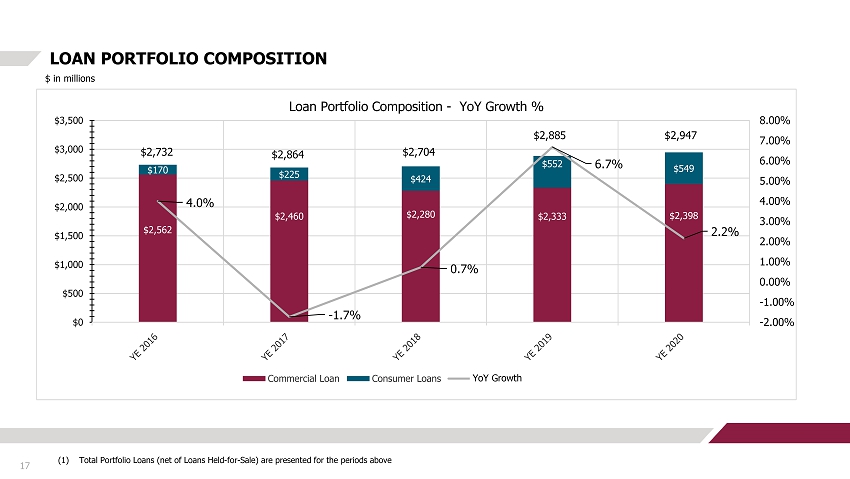
$2,562 $2,460 $2,280 $2,333 $2,398 $170 $225 $424 $552 $549 4.0% - 1.7% 0.7% 6.7% 2.2% -2.00% -1.00% 0.00% 1.00% 2.00% 3.00% 4.00% 5.00% 6.00% 7.00% 8.00% $0 $500 $1,000 $1,500 $2,000 $2,500 $3,000 $3,500 Loan Portfolio Composition - YoY Growth % Commercial Loan Consumer Loans PoP Growth (Annualized) LOAN PORTFOLIO COMPOSITION 17 $ in millions (1) Total Portfolio Loans (net of Loans Held - for - Sale) are presented for the periods above $2,732 $2,864 $2,704 $2,885 $2,947 YoY Growth
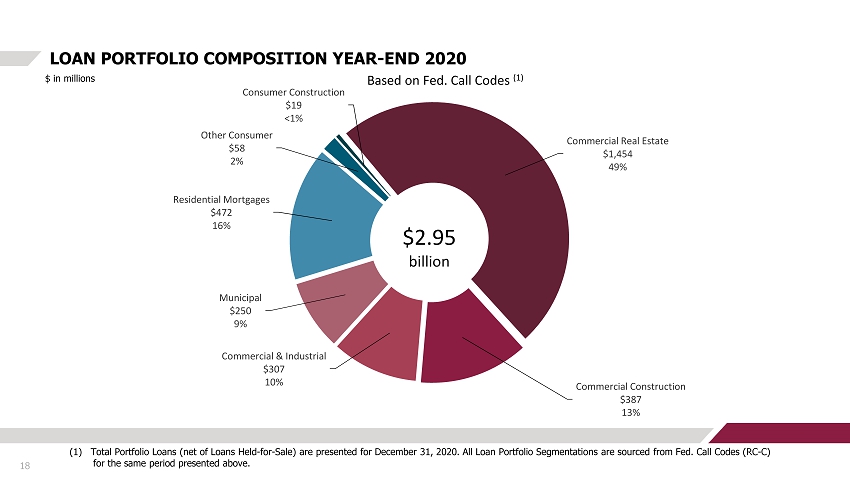
18 LOAN PORTFOLIO COMPOSITION YEAR - END 2020 $ in millions (1) Total Portfolio Loans (net of Loans Held - for - Sale) are presented for December 31, 2020. All Loan Portfolio Segmentations are sourced from Fed. Call Codes (RC - C) for the same period presented above. Commercial Real Estate $1,454 49% Commercial Construction $387 13% Commercial & Industrial $307 10% Municipal $250 9% Residential Mortgages $472 16% Other Consumer $58 2% Consumer Construction $19 <1% $2.95 billion Based on Fed. Call Codes (1)

19 LOAN PORTFOLIO: CRE SEGMENT OVERVIEW By Collateral Code (1) Other CRE & Other Commercial Construction Segments include, but are not limited to, Special / Limited Use, Church, Mobile Hom e P ark, Gas Station, Self - Storage Facilities, Auto Shops As of December 31, 2020 Row Labels Balance $ in thousands Hotel $497,181 Retail/Restaurant $301,871 Land $220,651 Multifamily/Student Housing $296,763 Office $147,340 Warehouse $138,549 Single Family $96,466 Country Club $77,237 Long Term Care $23,950 Other (1) $133,917 Total $1,933,925 $1.93 Billion Hotel - 25.7% Retail/Restaurant - 15.6% Land - 11.4% Multifamily/Student Housing - 15.4% Office - 7.6% Warehouse - 7.2% Single Family – 5.0% Country Club – 4.0% Long Term Care - 1.2% Other - 6.9% $1.93 billion
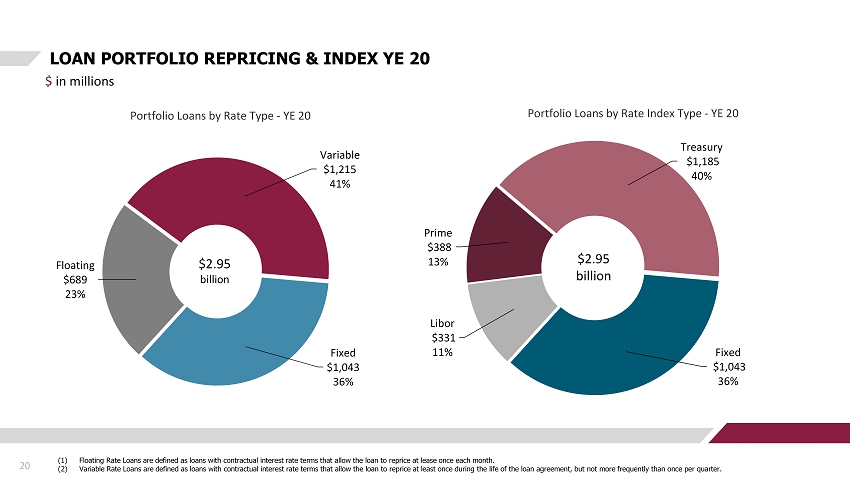
20 LOAN PORTFOLIO REPRICING & INDEX YE 20 $ in millions (1) Floating Rate Loans are defined as loans with contractual interest rate terms that allow the loan to reprice at lease once ea ch month. (2) Variable Rate Loans are defined as loans with contractual interest rate terms that allow the loan to reprice at least once du rin g the life of the loan agreement, but not more frequently than once per quarter. Fixed $1,043 36% Floating $689 23% Variable $1,215 41% Portfolio Loans by Rate Type - YE 20 $2.95 billion Fixed $1,043 36% Libor $331 11% Prime $388 13% Treasury $1,185 40% Portfolio Loans by Rate Index Type - YE 20 $2.95 billion

STRATEGIC INITIATIVES UPDATE 05 21

22 STRATEGIC INITIATIVES COMPLETED MANAGEMENT & CORPORATE GOVERNANCE • Build out executive management team (2017 - present) • Expand and enhance board of directors (2017 - present) KEY INFRASTRUCTURE BUILDOUT • Credit Underwriting/Administration, Compliance, Risk Management (2017 – present) LINES OF BUSINESS BUILDOUT • Commercial Lending, Retail Banking and Mortgage Banking (2017 – present) TECHNOLOGY & REGULATORY • Technology Upgrade to Fiserv Prologue/DNA (2018) • BSA Consent Order terminated (2019) BALANCE SHEET & EARNINGS DIVERSIFICATION • Diversified Asset Mix (loans and investments) (2017 – present) • Diversified and Increased Revenue Streams (2017 – present) • Enhanced Liquidity Sources and Management (2017 – present) • Brought ALM and forecasting model - in house (2019)

23 KEY STRATEGIC INITIATIVES IN PLAY DEPOSIT MIX RESTRUCTURE AND GROWTH • Reduce time deposits %, increase checking, savings and money market accounts • Deposit acquisition strategy (Retail) initiated 2019, brought in - house 2020 • Treasury Management Services (Commercial), Launched 2019 RETAIL NETWORK OPTIMIZATION • Staffing models, hours of operation streamlined • Right sizing core branch network • Future focus on growth in key existing markets and new emerging markets • Branch remodels and upgrades RESOLVE LEGACY CREDIT ISSUES • Continue reduction of adversely classified assets IMPROVE FINANCIAL METRICS • EPS, ROA, ROE, NIM, and Efficiency Ratio
RETAIL NETWORK OPTIMIZATION UPDATES 06 24
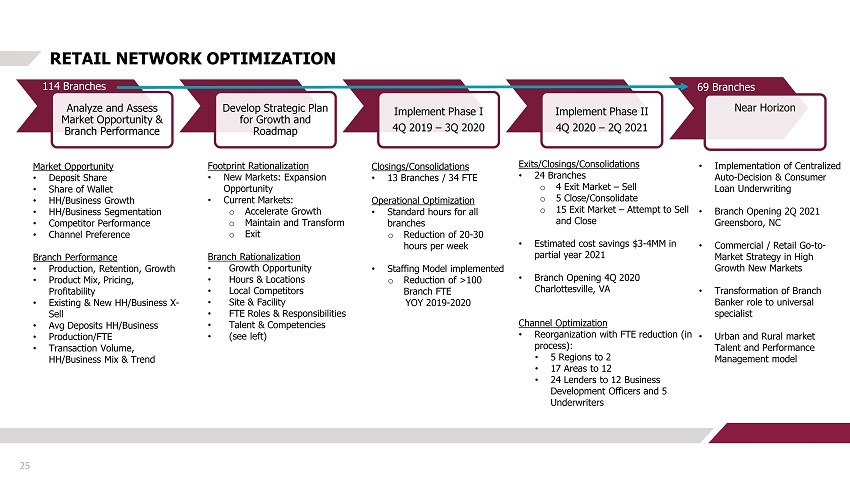
25 RETAIL NETWORK OPTIMIZATION Analyze and Assess Market Opportunity & Branch Performance Develop Strategic Plan for Growth and Roadmap Implement Phase I 4Q 2019 – 3Q 2020 Implement Phase II 4Q 2020 – 2Q 2021 Near Horizon 114 Branches 69 Branches Market Opportunity • Deposit Share • Share of Wallet • HH/Business Growth • HH/Business Segmentation • Competitor Performance • Channel Preference Branch Performance • Production, Retention, Growth • Product Mix, Pricing, Profitability • Existing & New HH/Business X - Sell • Avg Deposits HH/Business • Production/FTE • Transaction Volume, HH/Business Mix & Trend Footprint Rationalization • New Markets: Expansion Opportunity • Current Markets: o Accelerate Growth o Maintain and Transform o Exit Branch Rationalization • Growth Opportunity • Hours & Locations • Local Competitors • Site & Facility • FTE Roles & Responsibilities • Talent & Competencies • (see left) Closings/Consolidations • 13 Branches / 34 FTE Operational Optimization • Standard hours for all branches o Reduction of 20 - 30 hours per week • Staffing Model implemented o Reduction of >100 Branch FTE YOY 2019 - 2020 Exits/Closings/Consolidations • 24 Branches o 4 Exit Market – Sell o 5 Close/Consolidate o 15 Exit Market – Attempt to Sell and Close • Estimated cost savings $3 - 4MM in partial year 2021 • Branch Opening 4Q 2020 Charlottesville, VA Channel Optimization • Reorganization with FTE reduction (in process): • 5 Regions to 2 • 17 Areas to 12 • 24 Lenders to 12 Business Development Officers and 5 Underwriters • Implementation of Centralized Auto - Decision & Consumer Loan Underwriting • Branch Opening 2Q 2021 Greensboro, NC • Commercial / Retail Go - to - Market Strategy in High Growth New Markets • Transformation of Branch Banker role to universal specialist • Urban and Rural market Talent and Performance Management model

TECHNOLOGY & NEW PRODUCTS UPDATE 07 26
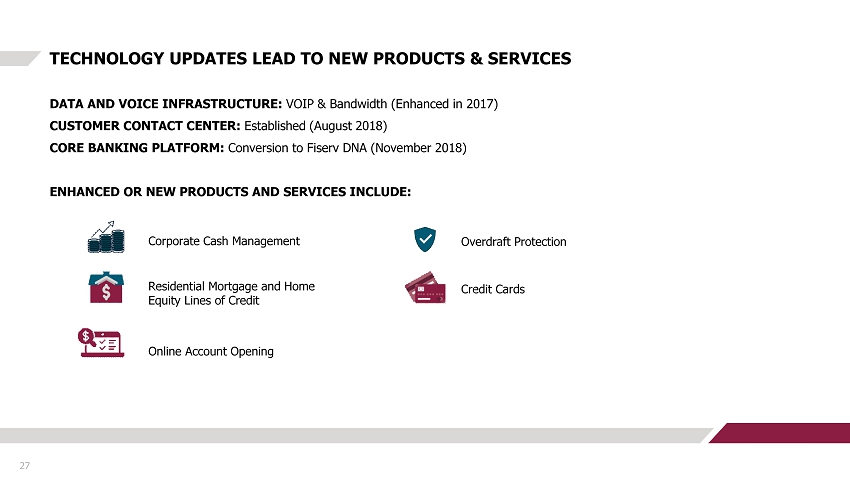
27 TECHNOLOGY UPDATES LEAD TO NEW PRODUCTS & SERVICES DATA AND VOICE INFRASTRUCTURE: VOIP & Bandwidth (Enhanced in 2017) CUSTOMER CONTACT CENTER: Established (August 2018) CORE BANKING PLATFORM: Conversion to Fiserv DNA (November 2018) ENHANCED OR NEW PRODUCTS AND SERVICES INCLUDE: Corporate Cash Management Residential Mortgage and Home Equity Lines of Credit Online Account Opening Overdraft Protection Credit Cards
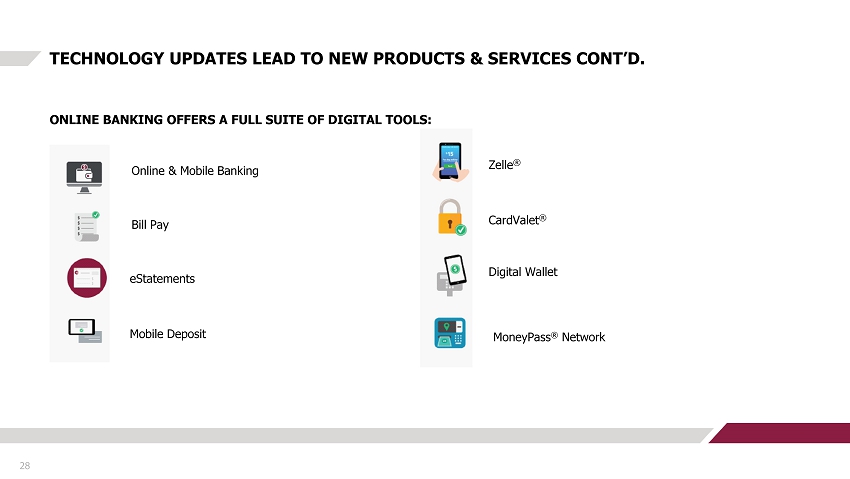
28 TECHNOLOGY UPDATES LEAD TO NEW PRODUCTS & SERVICES CONT’D. ONLINE BANKING OFFERS A FULL SUITE OF DIGITAL TOOLS: Online & Mobile Banking Bill Pay eStatements Mobile Deposit Zelle ® CardValet ® Digital Wallet MoneyPass ® Network

ASSET QUALITY UPDATE 08 29
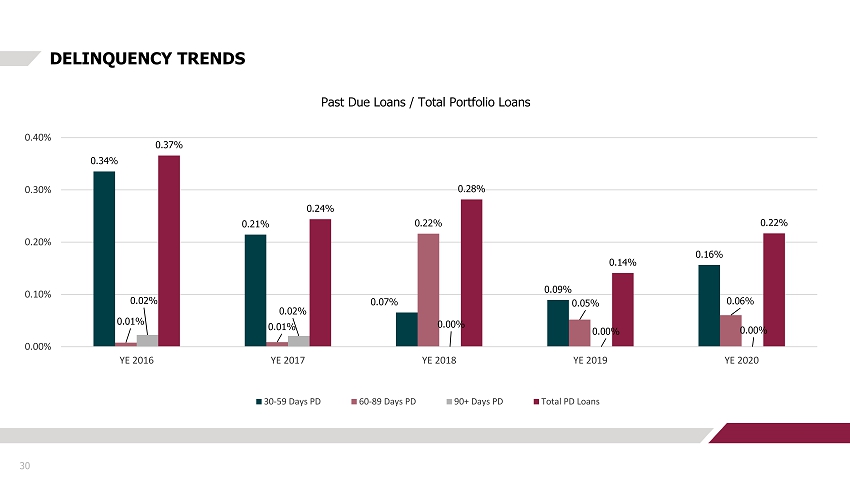
30 DELINQUENCY TRENDS 0.34% 0.21% 0.07% 0.09% 0.16% 0.01% 0.01% 0.22% 0.05% 0.06% 0.02% 0.02% 0.00% 0.00% 0.00% 0.37% 0.24% 0.28% 0.14% 0.22% 0.00% 0.10% 0.20% 0.30% 0.40% YE 2016 YE 2017 YE 2018 YE 2019 YE 2020 Past Due Loans / Total Portfolio Loans 30-59 Days PD 60-89 Days PD 90+ Days PD Total PD Loans
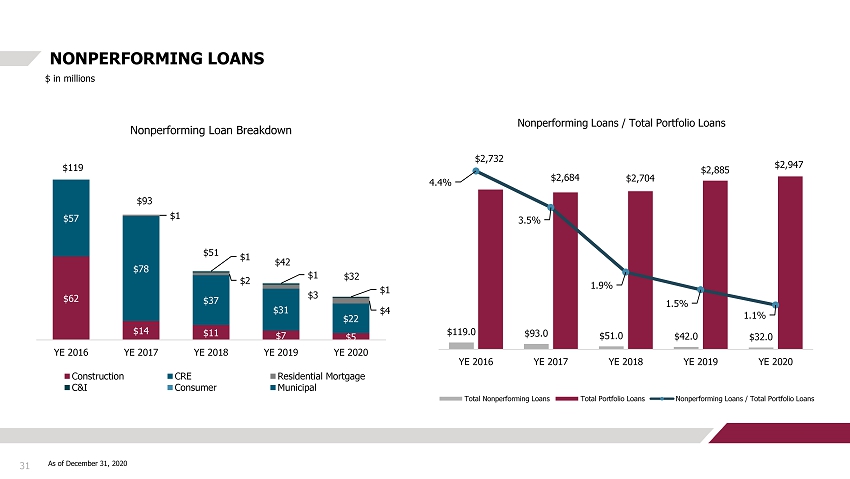
31 NONPERFORMING LOANS $ in millions As of December 31, 2020 $62 $14 $11 $7 $5 $57 $78 $37 $31 $22 $1 $2 $3 $4 $1 $1 $1 YE 2016 YE 2017 YE 2018 YE 2019 YE 2020 Nonperforming Loan Breakdown Construction CRE Residential Mortgage C&I Consumer Municipal $119 $93 $51 $42 $32 $119.0 $93.0 $51.0 $42.0 $32.0 $2,732 $2,684 $2,704 $2,885 $2,947 4.4% 3.5% 1.9% 1.5% 1.1% 0.0% 0.5% 1.0% 1.5% 2.0% 2.5% 3.0% 3.5% 4.0% 4.5% 5.0% $0 $500 $1,000 $1,500 $2,000 $2,500 $3,000 $3,500 YE 2016 YE 2017 YE 2018 YE 2019 YE 2020 Nonperforming Loans / Total Portfolio Loans Total Nonperforming Loans Total Portfolio Loans Nonperforming Loans / Total Portfolio Loans
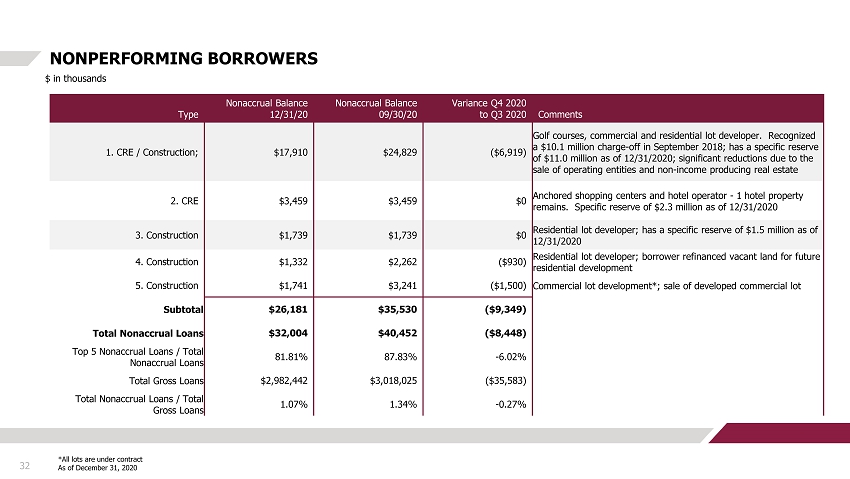
32 NONPERFORMING BORROWERS $ in thousands *All lots are under contract As of December 31, 2020 Type Nonaccrual Balance 12/31/20 Nonaccrual Balance 09/30/20 Variance Q4 2020 to Q3 2020 Comments 1. CRE / Construction; $17,910 $24,829 ($6,919) Golf courses, commercial and residential lot developer. Recognized a $10.1 million charge - off in September 2018; has a specific reserve of $11.0 million as of 12/31/2020 ; significant reductions due to the sale of operating entities and non - income producing real estate 2. CRE $3,459 $3,459 $0 Anchored shopping centers and hotel operator - 1 hotel property remains. Specific reserve of $2.3 million as of 12/31/2020 3. Construction $1,739 $1,739 $0 Residential lot developer; has a specific reserve of $1.5 million as of 12/31/2020 4. Construction $1,332 $2,262 ($930) Residential lot developer ; borrower refinanced vacant land for future residential development 5. Construction $1,741 $3,241 ($1,500) Commercial lot development* ; sale of developed commercial lot Subtotal $26,181 $35,530 ($9,349) Tota l Nonaccrual Loans $32,004 $40,452 ($8,448) Top 5 Nonaccrual Loans / Total Nonaccrual Loans 81.81% 87.83% - 6.02% Total Gross Loans $2,982,442 $3,018,025 ($35,583) Total Nonaccrual Loans / Total Gross Loans 1.07% 1.34% - 0.27%

33 NONPERFORMING ASSETS $ in millions $24 $40 $33 $18 $16 $23 $42 $47 $35 $25 $96 $51 $4 $7 $7 YE 2016 YE 2017 YE 2018 YE 2019 YE 2020 Nonperforming Assets OREO Nonperforming TDR's Nonperforming Loans $143 $133 $84 $60 $48 $4,506 $4,112 $4,040 $4,006 $4,179 3.2% 3.2% 2.1% 1.5% 1.1% 0.0% 0.5% 1.0% 1.5% 2.0% 2.5% 3.0% 3.5% 4.0% $0 $500 $1,000 $1,500 $2,000 $2,500 $3,000 $3,500 $4,000 $4,500 $5,000 YE 2016 YE 2017 YE 2018 YE 2019 YE 2020 Nonperforming Assets / Total Assets Total Nonperforming Assets Total Assets Nonperforming Assets / Total Assets $143 $143 $133 $60 $48

$651 $719 $461 $430 $239 $75 $97 $11 $4 $186 $0 $100 $200 $300 $400 $500 $600 $700 $800 $900 YE 2016 YE 2017 YE 2018 YE 2019 YE 2020 Credit Quality Trend Substandard Special Mention 34 LOAN PORTFOLIO* – PASS/NON - PASS AND CRITICIZED ASSETS $ in millions *Excludes loans held - for - sale $2,006 $1,868 $2,232 $2,451 $2,522 $651 $719 $461 $430 $239 $75 $97 $11 $4 $186 YE 2016 YE 2017 YE 2018 YE 2019 YE 2020 Credit Quality Trend Pass Substandard Special Mention $2,732 $2,684 $2,704 $2,885 $2,947 $726 $816 $472 $434 $425

35 NET CHARGE - OFF & PROVISION EXPENSE TRENDS $ in thousands $10,207 $42,379 $12,989 $3,841 $2,694 $17,717 $43,197 $16,870 $3,404 $18,006 $- $5,000 $10,000 $15,000 $20,000 $25,000 $30,000 $35,000 $40,000 $45,000 YE 2016 YE 2017 YE 2018 YE 2019 YE 2020 Net Charge-Offs Provision Expense

36 ALLL COMPOSITION & ALLL COVERAGE RATIO TRENDS $ in thousands ~99% ~99% 87% 84% 72% <1% <1% 13% 16% 28% 1.26% 1.32% 1.45% 1.34% 1.83% 1.64% 1.58% 1.34% 1.19% 1.38% 0.00% 0.20% 0.40% 0.60% 0.80% 1.00% 1.20% 1.40% 1.60% 1.80% 2.00% $- $10,000 $20,000 $30,000 $40,000 $50,000 $60,000 YE 2016 YE 2017 YE 2018 YE 2019 YE 2020 General Reserve Specific Reserve ALLL to Total Portfolio Loans General Reserve to Collectively Evaluated Loans

BALANCE SHEET TRANSFORMATION 9 37

38 EARNING ASSETS Goal is to deploy cash into higher yielding loans and investments while foregoing undue concentration risk: • Earning Assets stand at $3.9B • Our primary mandate is to use cash to grow the loan book with well diversified, higher yielding loan products to increase the NI M and mitigate concentration risks. • Our secondary mandate is to utilize the investment portfolio to hedge the loan portfolio while providing a steady stream of i nco me to supplement earnings. The investment book can be liquidated, or pledged, on an as - needed basis to fund loan growth, when appropri ate. Loans 84% Investments 15% Cash 1% Earning Assets - Target Loans 70% Investments 25% Cash 5% Earning Assets - 12/31/17 Past Present Future Loans 75% Investments 20% Cash 5% Earning Assets - 12/31/20

39 LOANS Goal is to further diversify and de - risk the loan portfolio by reducing dependency on CRE loans and increasing C&I loans, consumer loans and single - family mortgages. Increased granularity is also a focus. • Portfolio loans currently stand at $2.9B • Our primary mandate is to always provide solutions to our customers in our footprint. CRE loans will continue to be a foundat ion of the portfolio. • We are layering in additional loan products, tapping previously underutilized markets within the footprint and partnering wit h n ew borrowers to help with diversification, utilizing excess liquidity and maximizing the NIM. Past Present Future CRE 40% Municipal 10% C&I 20% Residential Mortgage 20% Construction 5% Consumer 5% Loan Portfolio - Target CRE 57% Municipal 18% C&I 12% Residential Mortgage 5% Construction 5% Consumer 3% Loan Portfolio 12/31/17 CRE , 50% Municipal , 8% C&I , 10% Residential Mortgage , 16% Construction , 14% Consumer , 2% Loan Portfolio 12/31/20

40 BOND PORTFOLIO Goal is to increase diversification, maintain strong credit quality, and improve performance versus peer group. • Portfolio stands at $779MM, or about 19% of total assets, target is 15 - 20% of total assets • Per the charts, diversification has improved significantly over the past several years • The portfolio is now about 50% floating rate (versus 0% floating rate two years ago) • All bonds are “available - for - sale”, and can be used for liquidity and pledging purposes as needed Past Present Future Agency 32% Taxfree Muni 18% Taxable Muni 14% SBA 7% MBS 6% Agency CMO , 6% ABS 2% CMBS - CMO , 3% Corporate 8% Other 4% 12/31/17 Inv. Portfolio Taxfree Muni , 10% Taxable Muni , 15% SBA , 10% MBS , 8% Agency CMO , 30% ABS , 10% CMBS - CMO , 15% Corporate , 2% Inv. Portfolio - Target As of December 31, 2020 Taxfree Muni 9% Taxable Muni 23% SBA 12% MBS 4% Agency CMO 6% ABS 16% Floating Agency CMO 18% CMBS - CMO 4% CMBS - MBS 1% Fixed Corporate 2% Floating Corporate 1% Floating MBS , 2% Other 1% 12/31/20 Inv. Portfolio
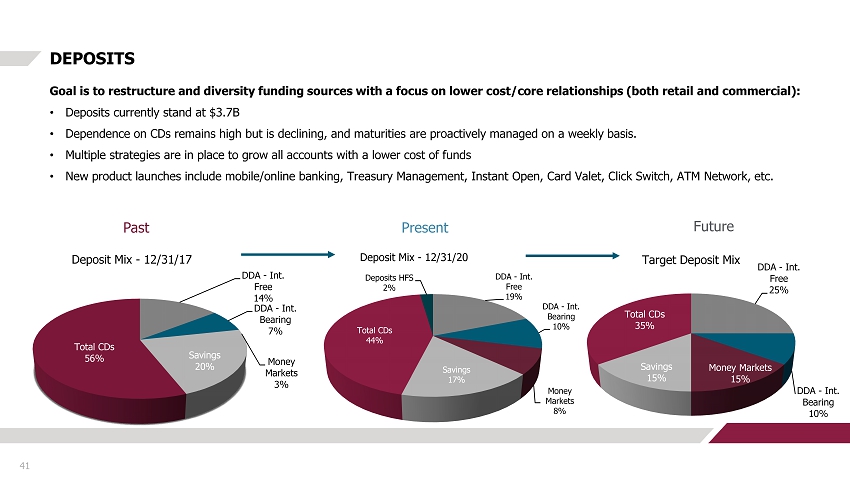
41 DEPOSITS Goal is to restructure and diversity funding sources with a focus on lower cost/core relationships (both retail and commercia l): • Deposits currently stand at $3.7B • Dependence on CDs remains high but is declining, and maturities are proactively managed on a weekly basis. • Multiple strategies are in place to grow all accounts with a lower cost of funds • New product launches include mobile/online banking, Treasury Management, Instant Open, Card Valet, Click Switch, ATM Network, et c. Past Present Future DDA - Int. Free 14% DDA - Int. Bearing 7% Money Markets 3% Savings 20% Total CDs 56% Deposit Mix - 12/31/17 DDA - Int. Free 25% DDA - Int. Bearing 10% Money Markets 15% Savings 15% Total CDs 35% Target Deposit Mix DDA - Int. Free 19% DDA - Int. Bearing 10% Money Markets 8% Savings 17% Total CDs 44% Deposits HFS 2% Deposit Mix - 12/31/20
DEPOSIT MIX/COF UPDATES 10 42
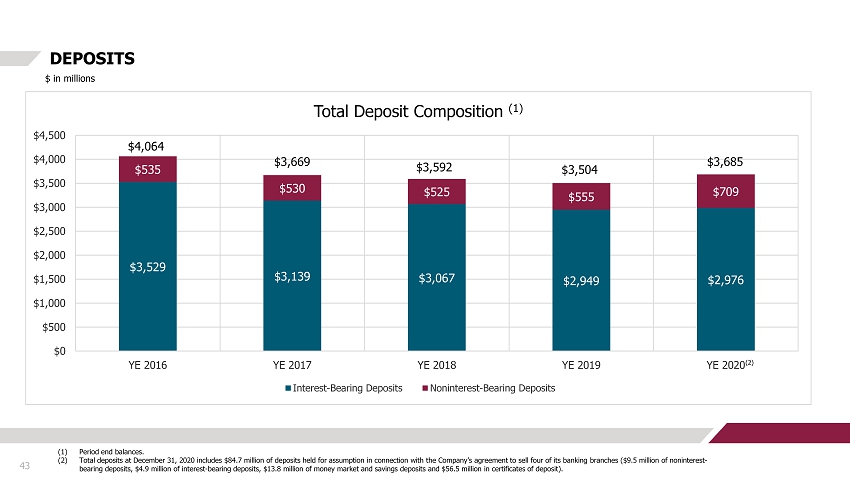
43 DEPOSITS $ in millions $3,529 $3,139 $3,067 $2,949 $2,976 $535 $530 $525 $555 $709 $0 $500 $1,000 $1,500 $2,000 $2,500 $3,000 $3,500 $4,000 $4,500 YE 2016 YE 2017 YE 2018 YE 2019 YE 2020 Total Deposit Composition (1) Interest-Bearing Deposits Noninterest-Bearing Deposits $4,064 $3,669 $3,592 $3,504 $3,685 (2) (1) Period end balances. (2) Total deposits at December 31, 2020 includes $84.7 million of deposits held for assumption in connection with the Company’s a gre ement to sell four of its banking branches ($9.5 million of noninterest - bearing deposits, $4.9 million of interest - bearing deposits, $13.8 million of money market and savings deposits and $56.5 millio n in certificates of deposit).
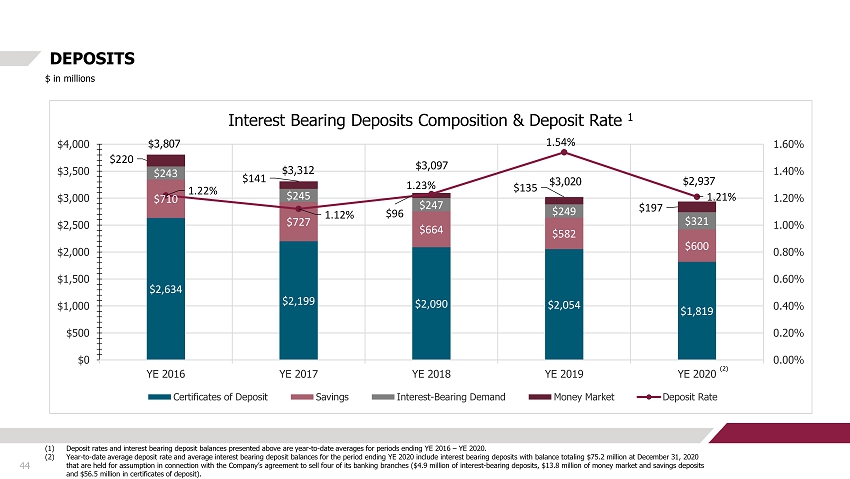
44 DEPOSITS $ in millions $2,634 $2,199 $2,090 $2,054 $1,819 $710 $727 $664 $582 $600 $243 $245 $247 $249 $321 $220 $141 $96 $135 $197 1.22% 1.12% 1.23% 1.54% 1.21% 0.00% 0.20% 0.40% 0.60% 0.80% 1.00% 1.20% 1.40% 1.60% $0 $500 $1,000 $1,500 $2,000 $2,500 $3,000 $3,500 $4,000 YE 2016 YE 2017 YE 2018 YE 2019 YE 2020 Interest Bearing Deposits Composition & Deposit Rate 1 Certificates of Deposit Savings Interest-Bearing Demand Money Market Deposit Rate $3,807 $3,312 $3,097 $3,020 $2,937 (2) (1) Deposit rates and interest bearing deposit balances presented above are year - to - date averages for periods ending YE 2016 – YE 20 20. (2) Year - to - date average deposit rate and average interest bearing deposit balances for the period ending YE 2020 include interest b earing deposits with balance totaling $75.2 million at December 31, 2020 that are held for assumption in connection with the Company’s agreement to sell four of its banking branches ($4.9 million of in terest - bearing deposits, $13.8 million of money market and savings deposits and $56.5 million in certificates of deposit).

45 TOTAL DEPOSITS & TOTAL COST OF DEPOSITS $ in millions $2,999 $2,959 $2,934 $2,919 $2,949 $2,946 $569 $567 $551 $651 $668 $695 1.34% 1.27% 1.21% 1.04% 0.93% 0.79% 0.50% 0.60% 0.70% 0.80% 0.90% 1.00% 1.10% 1.20% 1.30% 1.40% $0 $500 $1,000 $1,500 $2,000 $2,500 $3,000 $3,500 $4,000 Q3 2019 Q4 2019 Q1 2020 Q2 2020 Q3 2020 Q4 2020 Total Deposits & Cost of Deposits (1) Interest Bearing Deposits Noninterest Bearing Deposits Total Cost of Deposits (1) Quarterly Average Balances (2) Total Cost of Deposits incorporates the noninterest - bearing demand deposits with the rate on total interest - bearing deposits to illustrate the impact of those free funds on the overall cost of deposits (2) $3,588 $3,526 $3,485 $3,570 $3,617 $3,641
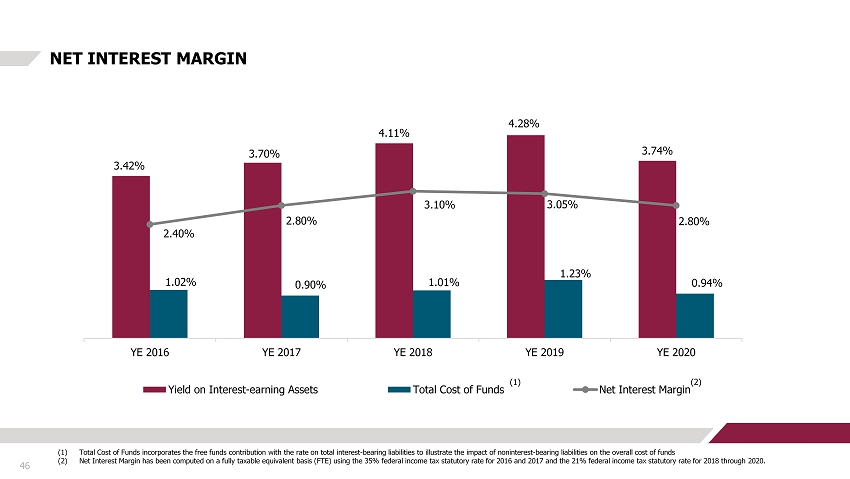
46 NET INTEREST MARGIN 3.42% 3.70% 4.11% 4.28% 3.74% 1.02% 0.90% 1.01% 1.23% 0.94% 2.40% 2.80% 3.10% 3.05% 2.80% YE 2016 YE 2017 YE 2018 YE 2019 YE 2020 Yield on Interest-earning Assets Total Cost of Funds Net Interest Margin (1) Total Cost of Funds incorporates the free funds contribution with the rate on total interest - bearing liabilities to illustrate t he impact of noninterest - bearing liabilities on the overall cost of funds (2) Net Interest Margin has been computed on a fully taxable equivalent basis (FTE) using the 35% federal income tax statutory ra te for 2016 and 2017 and the 21% federal income tax statutory rate for 2018 through 2020. (1) (2)
LOAN DEFERRAL UPDATE 11 47
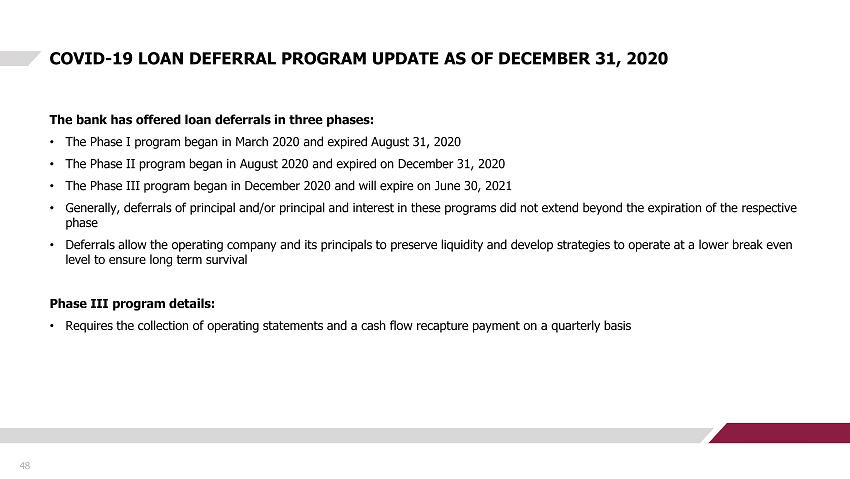
48 COVID - 19 LOAN DEFERRAL PROGRAM UPDATE AS OF DECEMBER 31, 2020 The bank has offered loan deferrals in three phases: • The Phase I program began in March 2020 and expired August 31, 2020 • The Phase II program began in August 2020 and expired on December 31, 2020 • The Phase III program began in December 2020 and will expire on June 30, 2021 • Generally, deferrals of principal and/or principal and interest in these programs did not extend beyond the expiration of the re spective phase • Deferrals allow the operating company and its principals to preserve liquidity and develop strategies to operate at a lower b rea k even level to ensure long term survival Phase III program details: • Requires the collection of operating statements and a cash flow recapture payment on a quarterly basis
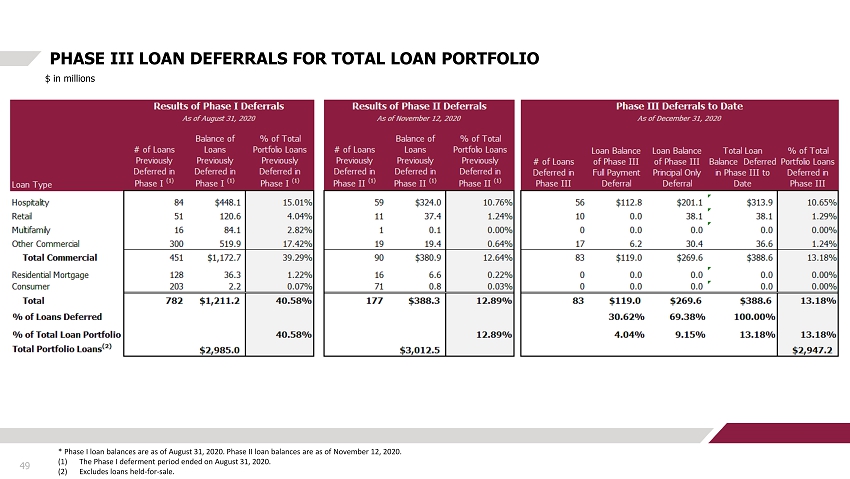
49 PHASE III LOAN DEFERRALS FOR TOTAL LOAN PORTFOLIO $ in millions * Phase I loan balances are as of August 31, 2020. Phase II loan balances are as of November 12, 2020. (1) The Phase I deferment period ended on August 31, 2020. (2) Excludes loans held - for - sale.

50 PHASE III HOSPITALITY LOAN DEFERRALS $ in thousands As of December 31, 2020.

51 HOSPITALITY METRICS BY STATE $ in thousands As of December 31, 2020 State Balance Avg. LTV Avg. Commitment Size Avg. of Debt per Key NC $191,934 61.15% $4,436 $66 SC $154,385 60.18% $6,062 $87 VA $59,363 57.39% $3,298 $81 WV $62,509 27.93% $15,627 $65 FL $12,743 64.71% $6,372 $122 GA $11,728 61.90% $5,864 $68 TN $4,519 46.59% $4,519 $22 Total $497,181 56.26% $5,192 $75 NC - 38.6% SC - 31.1% VA - 11.9% WV - 12.6% FL - 2.6% GA - 2.3% TN - 0.9% $497 million

52 HOSPITALITY METRICS BY BRAND As of December 31, 2020 $ in thousands Hilton - 26.4% IHG - 22.9% Upscale Independent/Boutique - 11.5% Marriott - 13.6% Wyndham - 8.1% Choice - 6.1% Independent - 5% Best Western - 3.5% Other - 2.9% $497 million Brand Balance Avg. LTV Avg. Commitment Size Avg. of Debt per Key Hilton $131,123 62.23% $8,791 $99 IHG $113,805 60.29% $5,081 $64 Upscale Independent/Boutique $57,111 28.23% $28,556 $74 Marriott $67,672 56.94% $7,811 $79 Wyndham $40,190 65.08% $2,871 $46 Choice $30,310 56.53% $2,755 $36 Independent $24,923 57.44% $2,776 $146 Best Western $17,728 49.98% $2,216 $30 Other $14,320 57.20% $2,387 $41 Total $497,181 56.26% $5,192 $75

53 CRE SEGMENT OVERVIEW By Collateral Code (1) Other CRE & Other Commercial Construction Segments include, but are not limited to, Special / Limited Use, Church, Mobile Hom e P ark, Gas Station, Self - Storage Facilities, Auto Shops As of December 31, 2020 Row Labels Balance $ in thousands Deferment Percentage Hotel $497,181 63.13% Retail/Restaurant $301,871 33.07% Land $220,651 0.07% Multifamily/Student Housing $296,763 0.00% Office $147,340 3.82% Warehouse $138,549 0.00% Single Family $96,466 0.14% Country Club $77,237 18.55% Long Term Care $23,950 0.00% Other (1) $133,917 61.02% Total $1,933,925 19.75% Hotel - 25.7% Retail/Restaurant - 15.6% Land - 11.4% Multifamily/Student Housing - 15.4% Office - 7.6% Warehouse - 7.2% Single Family – 5.0% Country Club – 4.0% Long Term Care - 1.2% Other - 6.9% $1.93 billion
PAYCHECK PROTECTION PROGRAM UPDATES 12 54

PAYCHECK PROTECTION PROGRAM (PPP) 55 Round I (April 3 - 17) – Referral Agreement with Kabbage Round II (April 27 – June 15) – Carter Bank stood up internal process and referred to Kabbage Round III (Jan 22, 2021...) – Carter Bank is processing in - house only PPP Rounds I and II • 966 loans totaling $57.8MM (Kabbage and Carter programs combined) • Kabbage made 451 loans totaling $17.9MM generating $27K in referrals fees to Carter Bank • Carter Bank made 515 loans totaling $39.9MM generating $1.49MM in SBA fees • Began processing loan forgiveness applications in November • 62 loans made by Carter Bank totaling $7.7MM have been fully forgiven by SBA • $48K in interest had been received on these 62 loans at time of forgiveness PPP Round III • $284B in new funding appropriated by Congress in late December • Carter Bank began processing applications on January 22 nd • Extensive waiting list – 220 applicants Day 1 451 Kabbage 515 Carter Bank & Trust 966 Total $57.8 MM in Funding April 3 - 17 April 27 - June 15 Jan 22…