Attached files
| file | filename |
|---|---|
| EX-99.2 - EXHIBIT 99.2 - INDEPENDENT BANK CORP /MI/ | brhc10019313_ex99-2.htm |
| EX-99.1 - EXHIBIT 99.1 - INDEPENDENT BANK CORP /MI/ | brhc10019313_ex99-1.htm |
| 8-K - 8-K - INDEPENDENT BANK CORP /MI/ | brhc10019313_8k.htm |
Exhibit 99.3
Q4 EARNINGS Independent Bank Corporation (IBCP)Conference Call – January 28, 2021
Cautionary note regarding forward-looking statements This presentation contains forward-looking
statements about Independent Bank Corporation. Statements that are not historical or current facts, including statements about beliefs and expectations, are forward-looking statements and are based on the information available to, and
assumptions and estimates made by, management as of the date hereof. These forward-looking statements cover, among other things, anticipated future revenue and expenses and the future plans and prospects of Independent Bank Corporation.
Forward-looking statements involve inherent risks and uncertainties, and important factors could cause actual results to differ materially from those anticipated. The COVID-19 pandemic is adversely affecting Independent Bank Corporation, its
customers, counterparties, employees, and third-party service providers, and the ultimate extent of the impacts on its business, financial position, results of operations, liquidity, and prospects is uncertain. Continued deterioration in
general business and economic conditions or turbulence in domestic or global financial markets could adversely affect Independent Bank Corporation’s revenues and the values of its assets and liabilities, reduce the availability of funding
from certain financial institutions, lead to a tightening of credit, and increase stock price volatility. In addition, changes to statutes, regulations, or regulatory policies or practices could affect Independent Bank Corporation in
substantial and unpredictable ways. Independent Bank Corporation’s results could also be adversely affected by changes in interest rates; further increases in unemployment rates; deterioration in the credit quality of its loan portfolios or
in the value of the collateral securing those loans; deterioration in the value of its investment securities; legal and regulatory developments; litigation; increased competition from both banks and non-banks; changes in the level of tariffs
and other trade policies of the United States and its global trading partners; changes in customer behavior and preferences; breaches in data security; failures to safeguard personal information; effects of mergers and acquisitions and
related integration; effects of critical accounting policies and judgments; and management’s ability to effectively manage credit risk, market risk, operational risk, compliance risk, strategic risk, interest rate risk, liquidity risk and
reputation risk. Certain risks and important factors that could affect Independent Bank Corporation's future results are identified in its Annual Report on Form 10-K for the year ended December 31, 2019 and other reports filed with the SEC,
including among other things under the heading “Risk Factors” in such Annual Report on Form 10-K. Any forward-looking statement speaks only as of the date on which it is made, and Independent Bank Corporation undertakes no obligation to
update any forward-looking statement, whether to reflect events or circumstances after the date on which the statement is made, to reflect new information or the occurrence of unanticipated events, or otherwise. 2
Agenda Formal Remarks.William B. (Brad) Kessel, President and Chief Executive OfficerGavin A. Mohr,
Executive Vice President and Chief Financial OfficerQuestion and Answer session.Closing Remarks.Note: This presentation is available at www.IndependentBank.com in the Investor Relations area under the “Presentations” tab. 3
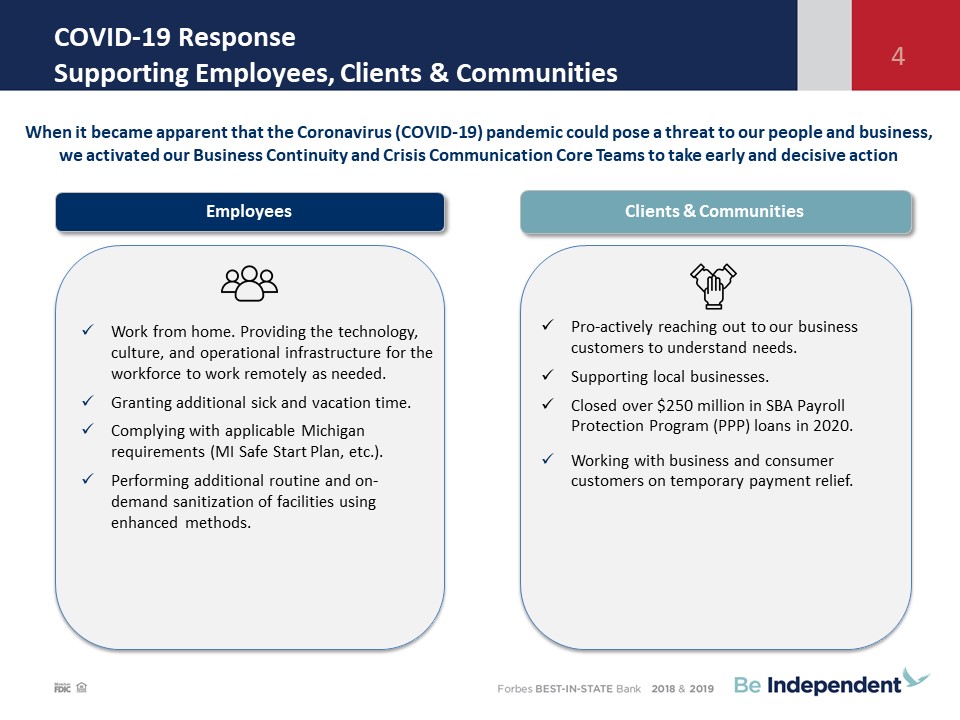
COVID-19 ResponseSupporting Employees, Clients & Communities 4 Employees Clients &
Communities Work from home. Providing the technology, culture, and operational infrastructure for the workforce to work remotely as needed.Granting additional sick and vacation time. Complying with applicable Michigan requirements (MI
Safe Start Plan, etc.).Performing additional routine and on-demand sanitization of facilities using enhanced methods. Pro-actively reaching out to our business customers to understand needs. Supporting local businesses. Closed over $250
million in SBA Payroll Protection Program (PPP) loans in 2020. Working with business and consumer customers on temporary payment relief. When it became apparent that the Coronavirus (COVID-19) pandemic could pose a threat to our people and
business, we activated our Business Continuity and Crisis Communication Core Teams to take early and decisive action

Historical Quarterly Results 5 Quarter Ended, ($M except per share
data) 12/31/19 3/31/20 6/30/20 9/30/20 12/31/20 Balance Sheet: Total Assets $3,565 $3,632 $4,043 $4,169 $4,204 Portfolio Loans $2,725 $2,718 $2,867 $2,855 $2,734
Deposits $3,037 $3,084 $3,485 $3,598 $3,637 Tangible Common Equity $317 $302 $322 $340 $357 Profitability: Pre-Tax, Pre-Provision Income $17.0 $12.5 $23.5 $25.3 $20.6 Pre-Tax, Pre-Prov /
Avg. Assets 1.91% 1.41% 2.44% 2.46% 1.98% Net Income(1) $13.9 $4.8 $14.8 $19.6 $17.0 Return on Average Assets(1) 1.56% 0.54% 1.54% 1.90% 1.61% Return on Average Equity(1) 15.9% 5.5% 17.4% 21.4% 17.8% Net
Interest Margin (FTE) 3.70% 3.63% 3.36% 3.31% 3.12% Efficiency Ratio 62.6% 69.3% 53.1% 56.4% 60.6% Asset Quality: NPAs / Assets 0.32% 0.50% 0.34% 0.28% 0.21% NPAs / Loans +
OREO 0.42% 0.67% 0.48% 0.41% 0.32% Reserves / Total Loans 0.96% 1.20% 1.20% 1.25% 1.30% NCOs / Avg. Loans (0.01%) 0.06% 0.45% (0.04%) (0.02%) Capital Ratios: TCE
Ratio 9.0% 8.4% 8.0% 8.2% 8.6% Leverage Ratio 10.1% 9.6% 9.1% 9.0% 9.2% Tier 1 Capital Ratio 12.7% 12.2% 12.6% 13.0% 13.3% Total Capital Ratio 13.7% 13.4% 15.3% 15.6% 16.0%
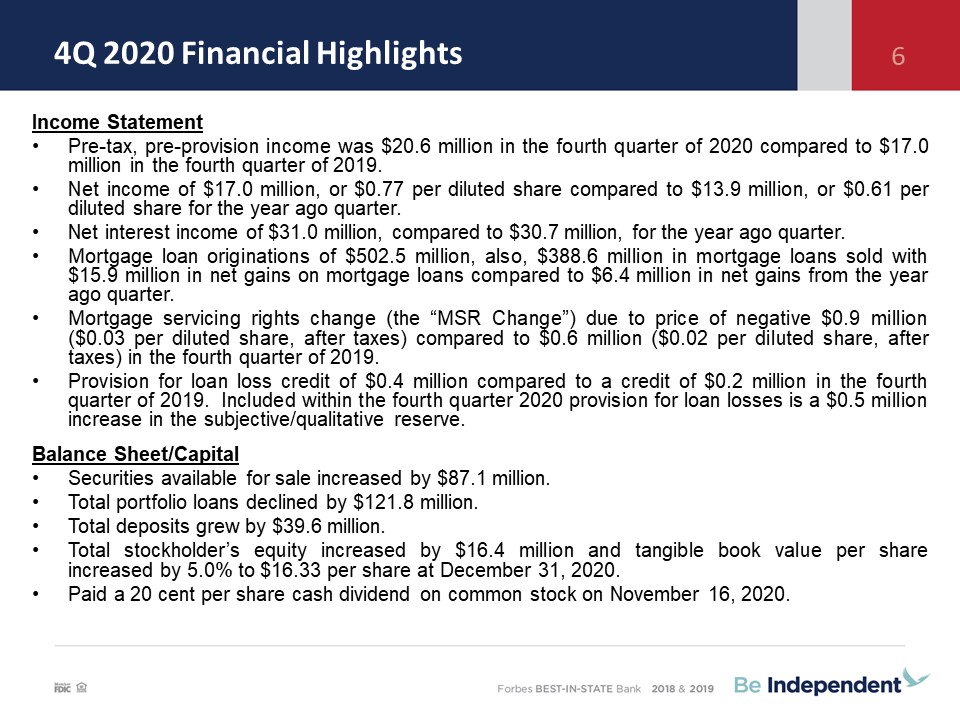
4Q 2020 Financial Highlights Income StatementPre-tax, pre-provision income was $20.6 million in
the fourth quarter of 2020 compared to $17.0 million in the fourth quarter of 2019.Net income of $17.0 million, or $0.77 per diluted share compared to $13.9 million, or $0.61 per diluted share for the year ago quarter.Net interest
income of $31.0 million, compared to $30.7 million, for the year ago quarter.Mortgage loan originations of $502.5 million, also, $388.6 million in mortgage loans sold with $15.9 million in net gains on mortgage loans compared to $6.4
million in net gains from the year ago quarter. Mortgage servicing rights change (the “MSR Change”) due to price of negative $0.9 million ($0.03 per diluted share, after taxes) compared to $0.6 million ($0.02 per diluted share, after
taxes) in the fourth quarter of 2019. Provision for loan loss credit of $0.4 million compared to a credit of $0.2 million in the fourth quarter of 2019. Included within the fourth quarter 2020 provision for loan losses is a $0.5 million
increase in the subjective/qualitative reserve.Balance Sheet/CapitalSecurities available for sale increased by $87.1 million.Total portfolio loans declined by $121.8 million.Total deposits grew by $39.6 million.Total stockholder’s
equity increased by $16.4 million and tangible book value per share increased by 5.0% to $16.33 per share at December 31, 2020. Paid a 20 cent per share cash dividend on common stock on November 16, 2020. 6
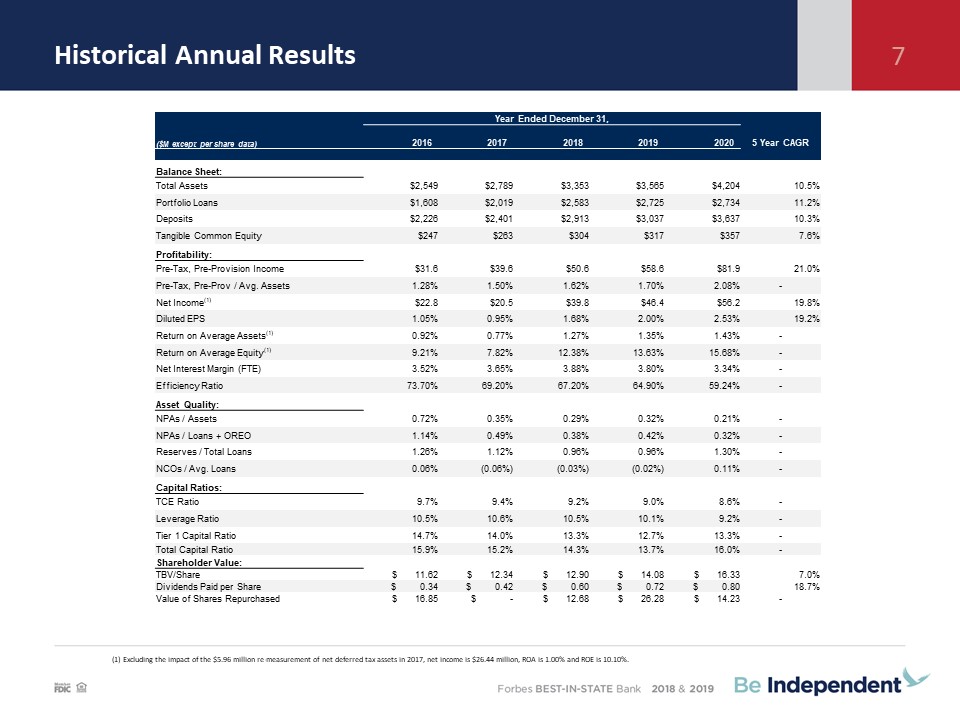
Historical Annual Results 7 (1) Excluding the impact of the $5.96 million re-measurement of net
deferred tax assets in 2017, net income is $26.44 million, ROA is 1.00% and ROE is 10.10%. Year Ended December 31, ($M except per share data) 2016 2017 2018 2019 2020 5 Year
CAGR Balance Sheet: Total Assets $2,549 $2,789 $3,353 $3,565 $4,204 10.5% Portfolio Loans $1,608 $2,019 $2,583 $2,725 $2,734 11.2% Deposits $2,226 $2,401
$2,913 $3,037 $3,637 10.3% Tangible Common Equity $247 $263 $304 $317 $357 7.6% Profitability: Pre-Tax, Pre-Provision Income $31.6 $39.6 $50.6 $58.6 $81.9 21.0% Pre-Tax, Pre-Prov /
Avg. Assets 1.28% 1.50% 1.62% 1.70% 2.08% - Net Income(1) $22.8 $20.5 $39.8 $46.4 $56.2 19.8% Diluted EPS 1.05% 0.95% 1.68% 2.00% 2.53% 19.2% Return on Average
Assets(1) 0.92% 0.77% 1.27% 1.35% 1.43% - Return on Average Equity(1) 9.21% 7.82% 12.38% 13.63% 15.68% - Net Interest Margin (FTE) 3.52% 3.65% 3.88% 3.80% 3.34% - Efficiency
Ratio 73.70% 69.20% 67.20% 64.90% 59.24% - Asset Quality: NPAs / Assets 0.72% 0.35% 0.29% 0.32% 0.21% - NPAs / Loans + OREO 1.14% 0.49% 0.38% 0.42% 0.32% - Reserves / Total
Loans 1.26% 1.12% 0.96% 0.96% 1.30% - NCOs / Avg. Loans 0.06% (0.06%) (0.03%) (0.02%) 0.11% - Capital Ratios: TCE Ratio 9.7% 9.4% 9.2% 9.0% 8.6% - Leverage
Ratio 10.5% 10.6% 10.5% 10.1% 9.2% - Tier 1 Capital Ratio 14.7% 14.0% 13.3% 12.7% 13.3% - Total Capital Ratio 15.9% 15.2% 14.3% 13.7% 16.0% - Shareholder Value: TBV/Share $ 11.62 $
12.34 $ 12.90 $ 14.08 $ 16.33 7.0% Dividends Paid per Share $ 0.34 $ 0.42 $ 0.60 $ 0.72 $ 0.80 18.7% Value of Shares Repurchased $ 16.85 $ - $ 12.68 $ 26.28 $ 14.23 -
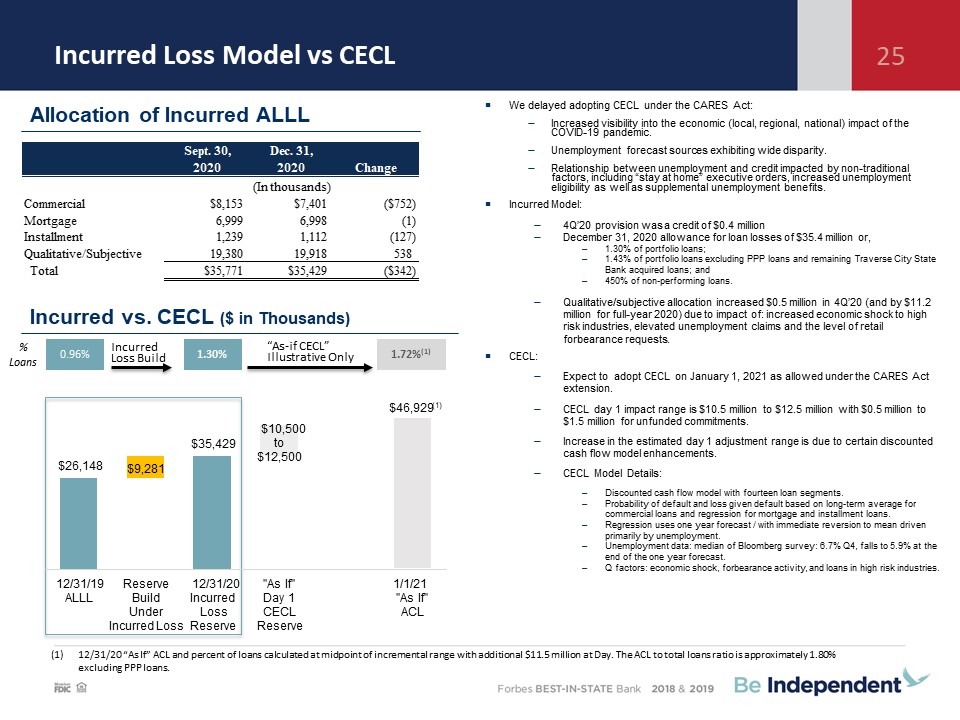
Incurred Loss Model vs CECL 25 Incurred vs. CECL ($ in Thousands) 12/31/20 “As If” ACL
and percent of loans calculated at midpoint of incremental range with additional $11.5 million at Day. The ACL to total loans ratio is approximately 1.80% excluding PPP loans. % Loans 0.96% 1.30% 1.72%(1) “As-if CECL” Illustrative
Only Incurred Loss Build We delayed adopting CECL under the CARES Act:Increased visibility into the economic (local, regional, national) impact of the COVID-19 pandemic. Unemployment forecast sources exhibiting wide
disparity.Relationship between unemployment and credit impacted by non-traditional factors, including “stay at home” executive orders, increased unemployment eligibility as well as supplemental unemployment benefits. Incurred
Model:4Q’20 provision was a credit of $0.4 millionDecember 31, 2020 allowance for loan losses of $35.4 million or,1.30% of portfolio loans;1.43% of portfolio loans excluding PPP loans and remaining Traverse City State Bank acquired
loans; and450% of non-performing loans.Qualitative/subjective allocation increased $0.5 million in 4Q’20 (and by $11.2 million for full-year 2020) due to impact of: increased economic shock to high risk industries, elevated unemployment
claims and the level of retail forbearance requests.CECL:Expect to adopt CECL on January 1, 2021 as allowed under the CARES Act extension. ECL day 1 impact range is $10.5 million to $12.5 million with $0.5 million to $1.5 million for
unfunded commitments.Increase in the estimated day 1 adjustment range is due to certain discounted cash flow model enhancements.CECL Model Details:Discounted cash flow model with fourteen loan segments.Probability of default and loss
given default based on long-term average for commercial loans and regression for mortgage and installment loans.Regression uses one year forecast / with immediate reversion to mean driven primarily by unemployment.Unemployment data:
median of Bloomberg survey: 6.7% Q4, falls to 5.9% at the end of the one year forecast.Q factors: economic shock, forbearance activity, and loans in high risk industries. Allocation of Incurred ALLL $26,148 $35,429
$46,929 (1) $9,281 $10,500 to $12,500 12/31/19 ALLL Reserve Build Under Incurred Loss 12/31/20 Incurred Loss Reserve "As If" Day 1 CECL Reserve 1/1/21 "As If" ACL
Historical Annual Results 6 (1) Excluding the impact of the $5.96 million re-measurement of net
deferred tax assets in 2017, net income is $26.44 million, ROA is 1.00% and ROE is 10.10%. Year Ended December 31, ($M except per share data) 2016 2017 2018 2019 2020 5 Year CAGR Balance
Sheet: Total Assets $2,549 $2,789 $3,353 $3,565 $4,204 10.5% Portfolio Loans $1,608 $2,019 $2,583 $2,725 $2,734 11.2% Deposits $2,226 $2,401 $2,913 $3,037 $3,637 10.3% Tangible Common
Equity $247 $263 $304 $317 $357 7.6% Profitability: Pre-Tax, Pre-Provision Income $31.6 $39.6 $50.6 $58.6 $81.9 21.0% Pre-Tax, Pre-Prov / Avg. Assets 1.28% 1.50% 1.62% 1.70% 2.08% - Net
Income(1) $22.8 $20.5 $39.8 $46.4 $56.2 19.8% Diluted EPS 1.05% 0.95% 1.68% 2.00% 2.53% 19.2% Return on Average Assets(1) 0.92% 0.77% 1.27% 1.35% 1.43% - Return on Average
Equity(1) 9.21% 7.82% 12.38% 13.63% 15.68% - Net Interest Margin (FTE) 3.52% 3.65% 3.88% 3.80% 3.34% - Efficiency Ratio 73.70% 69.20% 67.20% 64.90% 59.24% - Asset Quality: NPAs /
Assets 0.72% 0.35% 0.29% 0.32% 0.21% - NPAs / Loans + OREO 1.14% 0.49% 0.38% 0.42% 0.32% - Reserves / Total Loans 1.26% 1.12% 0.96% 0.96% 1.30% - NCOs / Avg.
Loans 0.06% (0.06%) (0.03%) (0.02%) 0.11% - Capital Ratios: TCE Ratio 9.7% 9.4% 9.2% 9.0% 8.6% - Leverage Ratio 10.5% 10.6% 10.5% 10.1% 9.2% - Tier 1 Capital
Ratio 14.7% 14.0% 13.3% 12.7% 13.3% - Total Capital Ratio 15.9% 15.2% 14.3% 13.7% 16.0% - Shareholder Value: TBV/Share $ 11.62 $ 12.34 $ 12.90 $ 14.08 $ 16.33 7.0% Dividends Paid per
Share $ 0.34 $ 0.42 $ 0.60 $ 0.72 $ 0.80 18.7% Value of Shares Repurchased $ 16.85 $ - $ 12.68 $ 26.28 $ 14.23 -
4Q 2020 Financial Highlights Income StatementPre-tax, pre-provision income was $20.6 million in the
fourth quarter of 2020 compared to $17.0 million in the fourth quarter of 2019.Net income of $17.0 million, or $0.77 per diluted share compared to $13.9 million, or $0.61 per diluted share for the year ago quarter.Net interest income of $31.0
million, compared to $30.7 million, for the year ago quarter.Mortgage loan originations of $502.5 million, also, $388.6 million in mortgage loans sold with $15.9 million in net gains on mortgage loans compared to $6.4 million in net gains
from the year ago quarter. Mortgage servicing rights change (the “MSR Change”) due to price of negative $0.9 million ($0.03 per diluted share, after taxes) compared to $0.6 million ($0.02 per diluted share, after taxes) in the fourth quarter
of 2019. Provision for loan loss credit of $0.4 million compared to a credit of $0.2 million in the fourth quarter of 2019. Included within the fourth quarter 2020 provision for loan losses is a $0.5 million increase in the
subjective/qualitative reserve.Balance Sheet/CapitalSecurities available for sale increased by $87.1 million.Total portfolio loans declined by $121.8 million.Total deposits grew by $39.6 million.Total stockholder’s equity increased by $16.4
million and tangible book value per share increased by 5.0% to $16.33 per share at December 31, 2020. Paid a 20 cent per share cash dividend on common stock on November 16, 2020. 7
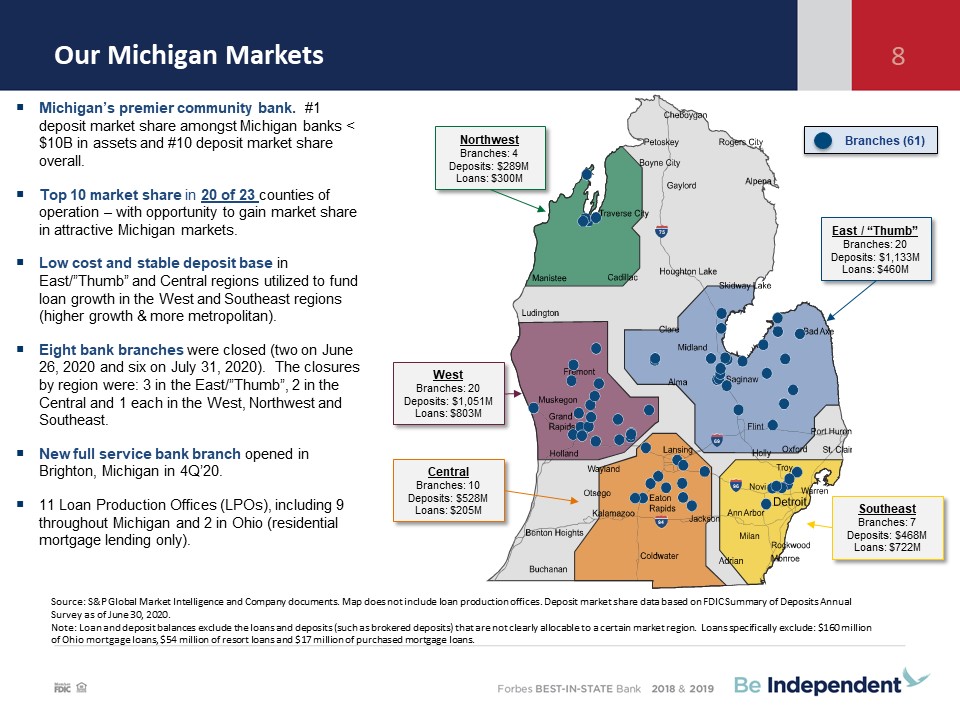
Our Michigan Markets 8 Source: S&P Global Market Intelligence and Company documents. Map does not
include loan production offices. Deposit market share data based on FDIC Summary of Deposits Annual Survey as of June 30, 2020.Note: Loan and deposit balances exclude the loans and deposits (such as brokered deposits) that are not clearly
allocable to a certain market region. Loans specifically exclude: $160 million of Ohio mortgage loans, $54 million of resort loans and $17 million of purchased mortgage loans. 94 96 75 69 Michigan’s
premier community bank. #1 deposit market share amongst Michigan banks < $10B in assets and #10 deposit market share overall. Top 10 market share in 20 of 23 counties of operation – with opportunity to gain market share in attractive
Michigan markets.Low cost and stable deposit base in East/”Thumb” and Central regions utilized to fund loan growth in the West and Southeast regions (higher growth & more metropolitan).Eight bank branches were closed (two on June 26, 2020
and six on July 31, 2020). The closures by region were: 3 in the East/”Thumb”, 2 in the Central and 1 each in the West, Northwest and Southeast. New full service bank branch opened in Brighton, Michigan in 4Q’20.11 Loan Production Offices
(LPOs), including 9 throughout Michigan and 2 in Ohio (residential mortgage lending only). Branches (61) East / “Thumb”Branches: 20Deposits: $1,133MLoans: $460M SoutheastBranches: 7Deposits: $468MLoans: $722M CentralBranches:
10Deposits: $528MLoans: $205M WestBranches: 20Deposits: $1,051MLoans: $803M NorthwestBranches: 4Deposits: $289MLoans: $300M
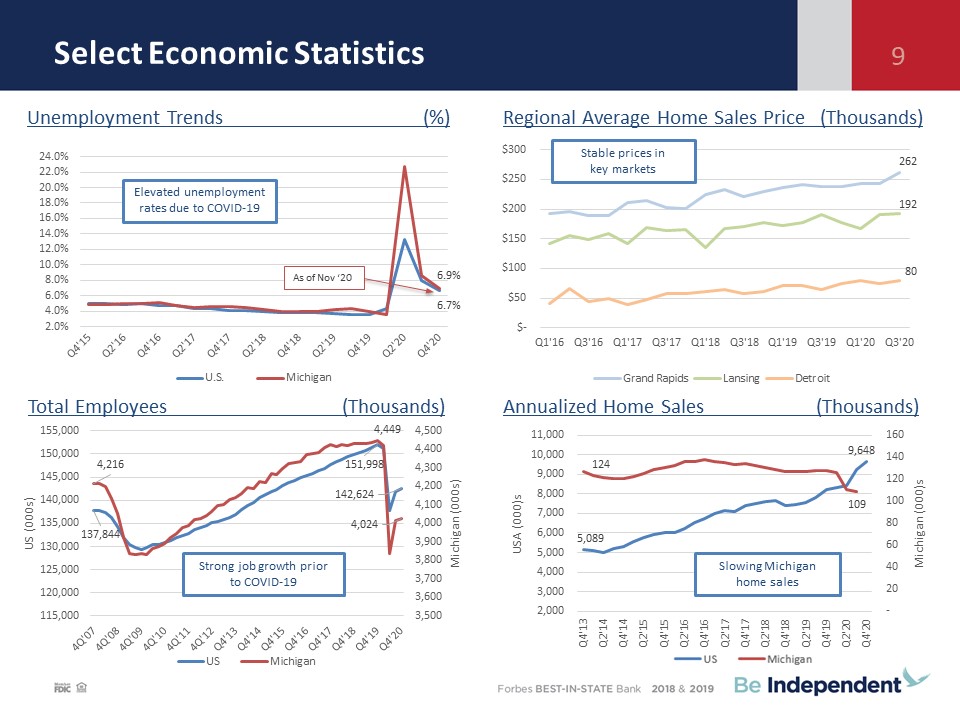
Select Economic Statistics Unemployment Trends (%) Total Employees (Thousands) Regional Average
Home Sales Price (Thousands) Annualized Home Sales (Thousands) 9 Elevated unemployment rates due to COVID-19 As of Nov ‘20 Stable prices in key markets Strong job growth prior to COVID-19 Slowing Michigan home sales
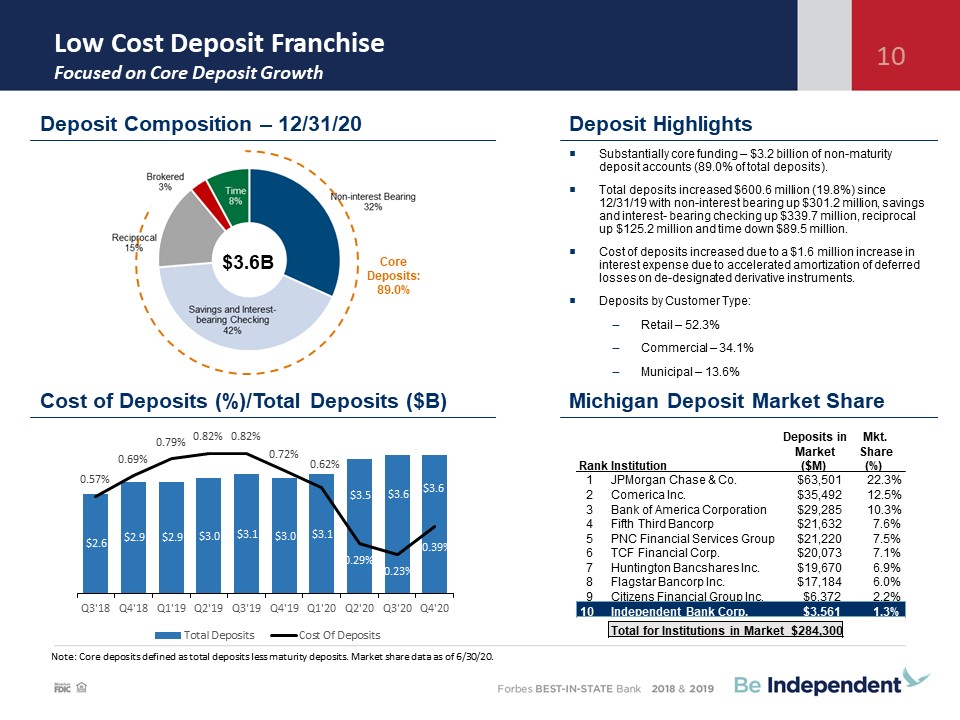
Low Cost Deposit Franchise Focused on Core Deposit Growth 10 Substantially core funding – $3.2
billion of non-maturity deposit accounts (89.0% of total deposits).Total deposits increased $600.6 million (19.8%) since 12/31/19 with non-interest bearing up $301.2 million, savings and interest- bearing checking up $339.7 million,
reciprocal up $125.2 million and time down $89.5 million.Cost of deposits increased due to a $1.6 million increase in interest expense due to accelerated amortization of deferred losses on de-designated derivative instruments. Deposits by
Customer Type:Retail – 52.3%Commercial – 34.1%Municipal – 13.6% Deposit Composition – 12/31/20 Deposit Highlights Michigan Deposit Market Share $3.6B Core Deposits: 89.0% Cost of Deposits (%)/Total Deposits ($B) Note: Core deposits
defined as total deposits less maturity deposits. Market share data as of 6/30/20. Deposits in Mkt. Market Share Rank Institution ($M) (%) 1 JPMorgan Chase & Co. $63,501 22.3% 2 Comerica Inc. $35,492 12.5% 3 Bank
of America Corporation $29,285 10.3% 4 Fifth Third Bancorp $21,632 7.6% 5 PNC Financial Services Group $21,220 7.5% 6 TCF Financial Corp. $20,073 7.1% 7 Huntington Bancshares Inc. $19,670 6.9% 8 Flagstar Bancorp Inc.
$17,184 6.0% 9 Citizens Financial Group Inc. $6,372 2.2% 10 Independent Bank Corp. $3,561 1.3% Total for Institutions in Market $284,300
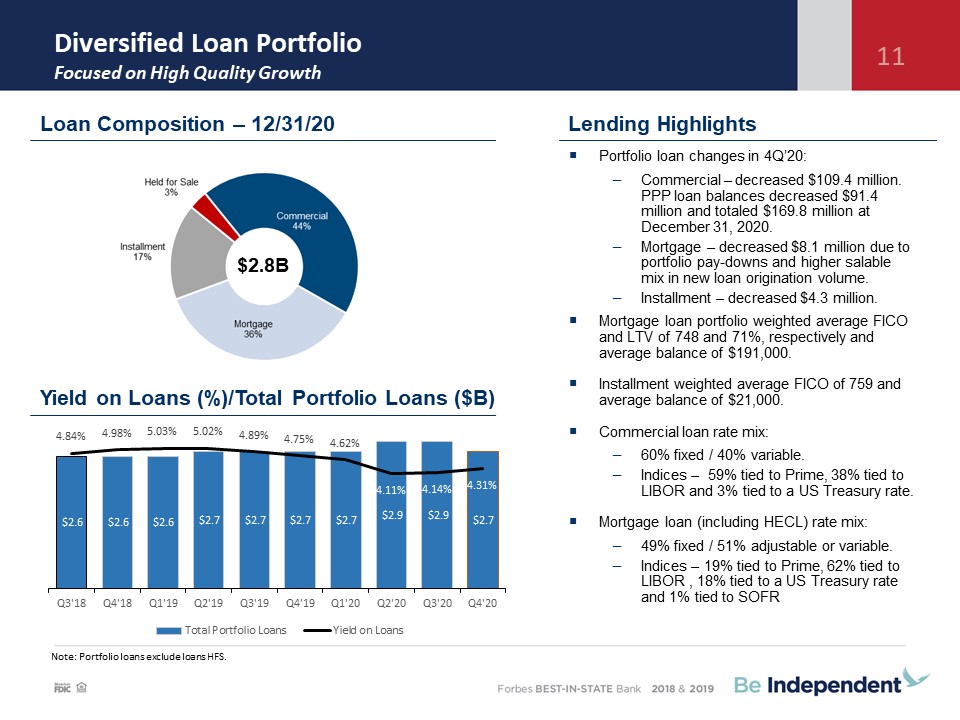
Diversified Loan PortfolioFocused on High Quality Growth 11 Lending Highlights Note: Portfolio loans
exclude loans HFS. Portfolio loan changes in 4Q’20:Commercial – decreased $109.4 million. PPP loan balances decreased $91.4 million and totaled $169.8 million at December 31, 2020.Mortgage – decreased $8.1 million due to portfolio pay-downs
and higher salable mix in new loan origination volume. Installment – decreased $4.3 million.Mortgage loan portfolio weighted average FICO and LTV of 748 and 71%, respectively and average balance of $191,000.Installment weighted average FICO
of 759 and average balance of $21,000.Commercial loan rate mix:60% fixed / 40% variable.Indices – 59% tied to Prime, 38% tied to LIBOR and 3% tied to a US Treasury rate.Mortgage loan (including HECL) rate mix: 49% fixed / 51% adjustable or
variable. Indices – 19% tied to Prime, 62% tied to LIBOR , 18% tied to a US Treasury rate and 1% tied to SOFR Loan Composition – 12/31/20 $2.8B Yield on Loans (%)/Total Portfolio Loans ($B)

COVID-19 Programs – Loan Forbearances 12 Highlights Loan
Forbearances 12/31/2020 9/30/2020 6/30/2020 Current % Change from 6/30 Loan Type # $ (000’s) % of portfolio # $ (000’s) % of portfolio # $ (000's) % of portfolio # $ Commercial 2 $163
0.01% 17 $25,105 1.90% 386 $210,486 15.40% -99.5% -99.9% Mortgage 134 19,830 1.95% 197 32,091 3.10% 388 81,212 7.80% -65.5% -75.6% Installment 48 1,412 0.30% 97 2,631 0.50% 280 7,459 1.60% -82.9% -81.1%
Total Portfolio Loans 184 $21,405 0.78% 311 $59,827 2.10% 1,054 $299,157 10.40% -82.5% -92.8% Loans Serviced for Others 288 $42,897 1.44% 416 $66,279 2.30% 773 $114,839 4.2% -62.7% -62.6% The table
above reflects the status of loan forbearances for the last three quarters. The percent of the loan portfolio is based on loan dollars.Loan Forbearances:Forbearance period is generally three months for mortgage and installment loans and three
or six months for commercial loans. Retail (mortgage and installment) loan forbearances are primarily principal & interest deferrals.Commercial loan forbearances are primarily principal deferrals only.Forbearance requests peaked in early
June 2020 and have since significantly abated.
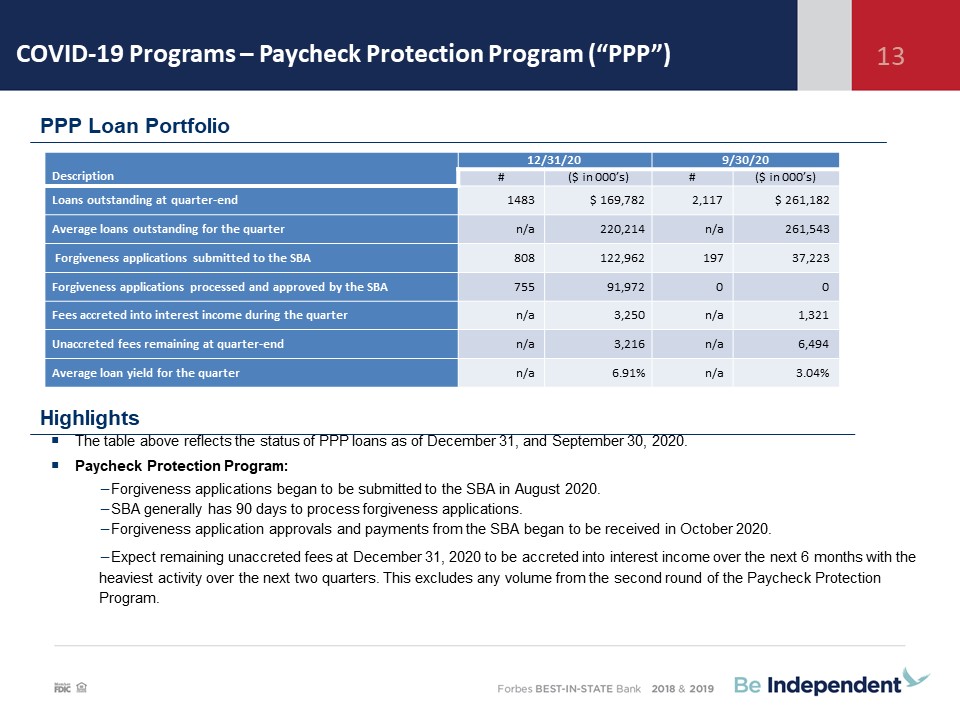
COVID-19 Programs – Paycheck Protection Program (“PPP”) 13 Highlights PPP Loan Portfolio The table
above reflects the status of PPP loans as of December 31, and September 30, 2020.Paycheck Protection Program:Forgiveness applications began to be submitted to the SBA in August 2020. SBA generally has 90 days to process forgiveness
applications.Forgiveness application approvals and payments from the SBA began to be received in October 2020.Expect remaining unaccreted fees at December 31, 2020 to be accreted into interest income over the next 6 months with the heaviest
activity over the next two quarters. This excludes any volume from the second round of the Paycheck Protection Program. Description 12/31/20 9/30/20 # ($ in 000’s) # ($ in 000’s) Loans outstanding at quarter-end 1483 $
169,782 2,117 $ 261,182 Average loans outstanding for the quarter n/a 220,214 n/a 261,543 Forgiveness applications submitted to the SBA 808 122,962 197 37,223 Forgiveness applications processed and approved by the
SBA 755 91,972 0 0 Fees accreted into interest income during the quarter n/a 3,250 n/a 1,321 Unaccreted fees remaining at quarter-end n/a 3,216 n/a 6,494 Average loan yield for the quarter n/a 6.91% n/a 3.04%
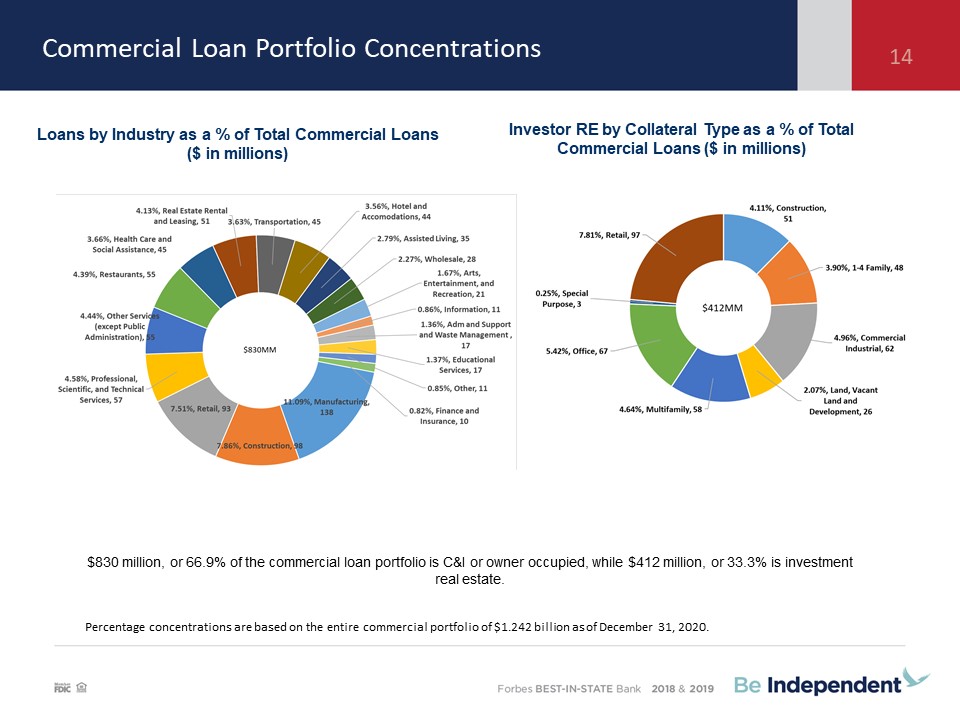
Loan Portfolio Concentrations by Industry Percentage concentrations are based on the entire
commercial portfolio of $1.242 billion as of December 31, 2020. Loans by Industry as a % of Total Commercial Loans ($ in millions) Investor RE by Collateral Type as a % of Total Commercial Loans ($ in millions) $830 million, or 66.9% of
the commercial loan portfolio is C&I or owner occupied, while $412 million, or 33.3% is investment real estate. 14 Commercial Loan Portfolio Concentrations
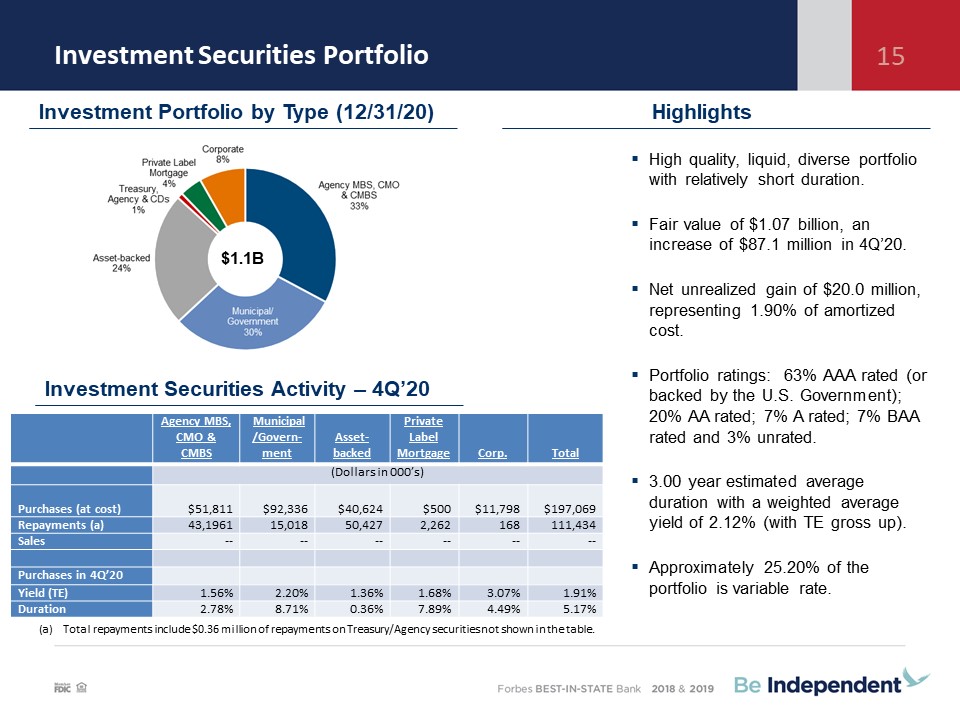
Investment Securities Portfolio 15 Highlights High quality, liquid, diverse portfolio with
relatively short duration.Fair value of $1.07 billion, an increase of $87.1 million in 4Q’20.Net unrealized gain of $20.0 million, representing 1.90% of amortized cost.Portfolio ratings: 63% AAA rated (or backed by the U.S. Government); 20%
AA rated; 7% A rated; 7% BAA rated and 3% unrated.3.00 year estimated average duration with a weighted average yield of 2.12% (with TE gross up).Approximately 25.20% of the portfolio is variable rate. $1.1B Investment Portfolio by Type
(12/31/20) Investment Securities Activity – 4Q’20 Agency MBS, CMO & CMBS Municipal/Govern-ment Asset-backed Private Label Mortgage Corp. Total (Dollars in 000’s) Purchases (at
cost) $51,811 $92,336 $40,624 $500 $11,798 $197,069 Repayments (a) 43,1961 15,018 50,427 2,262 168 111,434 Sales -- -- -- -- -- -- Purchases in 4Q’20 Yield
(TE) 1.56% 2.20% 1.36% 1.68% 3.07% 1.91% Duration 2.78% 8.71% 0.36% 7.89% 4.49% 5.17% Total repayments include $0.36 million of repayments on Treasury/Agency securities not shown in the table.
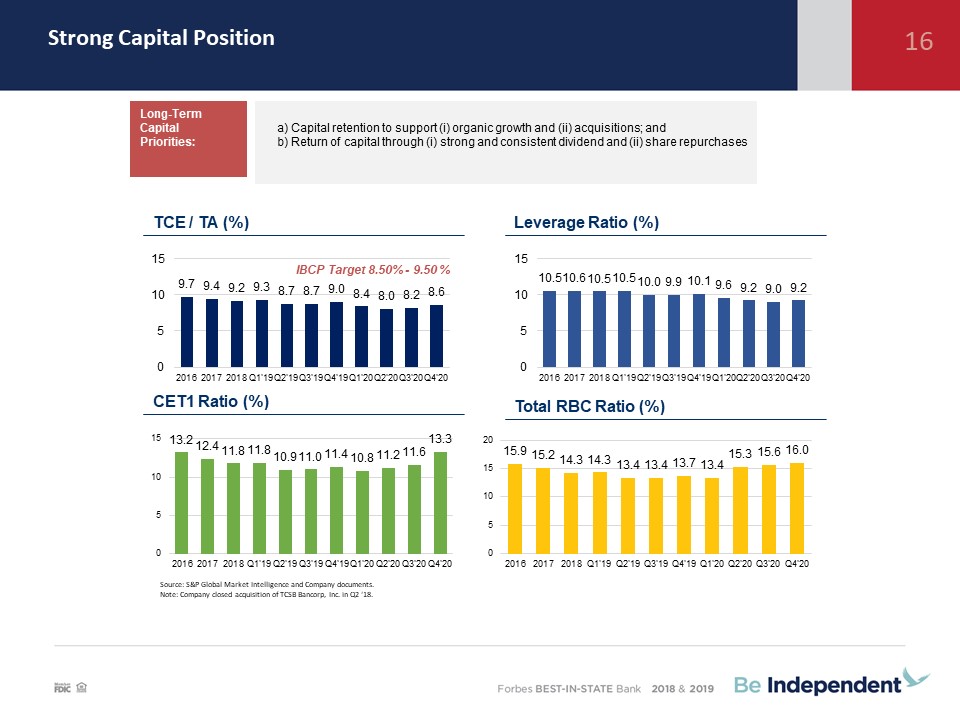
Strong Capital Position 16 Source: S&P Global Market Intelligence and Company documents.Note:
Company closed acquisition of TCSB Bancorp, Inc. in Q2 ‘18. TCE / TA (%) Leverage Ratio (%) CET1 Ratio (%) Total RBC Ratio (%) IBCP Target 8.50% - 9.50 % Capital retention to support (i) organic growth and (ii) acquisitions; and
Return of capital through (i) strong and consistent dividend and (ii) share repurchases Long-Term Capital Priorities: Strong Capital Position
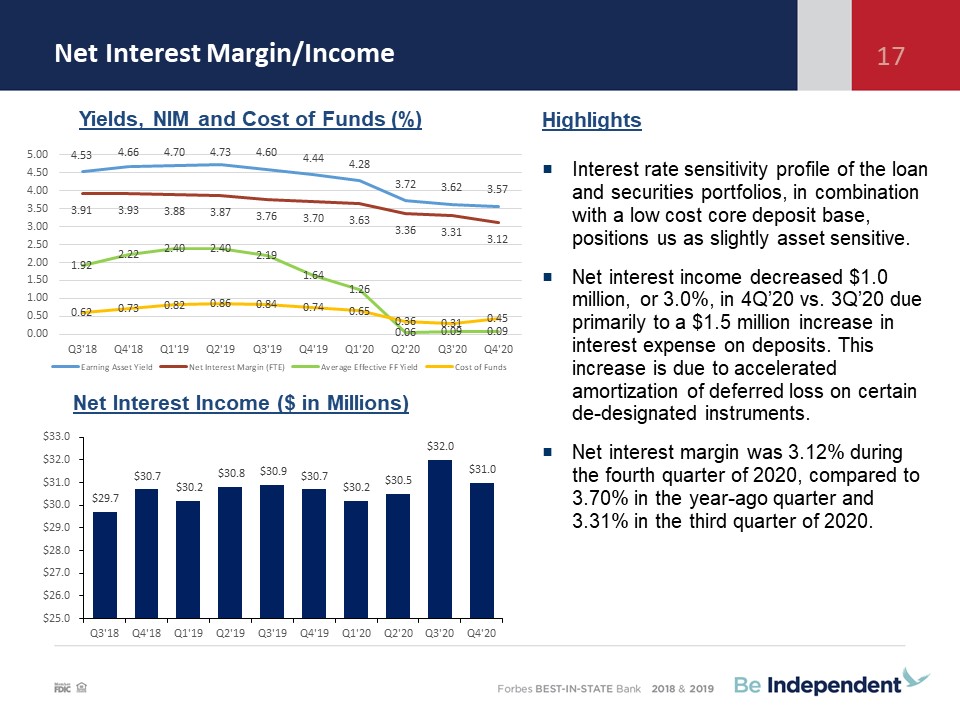
HighlightsInterest rate sensitivity profile of the loan and securities portfolios, in combination with
a low cost core deposit base, positions us as slightly asset sensitive.Net interest income decreased $1.0 million, or 3.0%, in 4Q’20 vs. 3Q’20 due primarily to a $1.5 million increase in interest expense on deposits. This increase is due to
accelerated amortization of deferred loss on certain de-designated instruments. Net interest margin was 3.12% during the fourth quarter of 2020, compared to 3.70% in the year-ago quarter and 3.31% in the third quarter of 2020. Yields, NIM
and Cost of Funds (%) Net Interest Income ($ in Millions) Net Interest Margin/Income 17
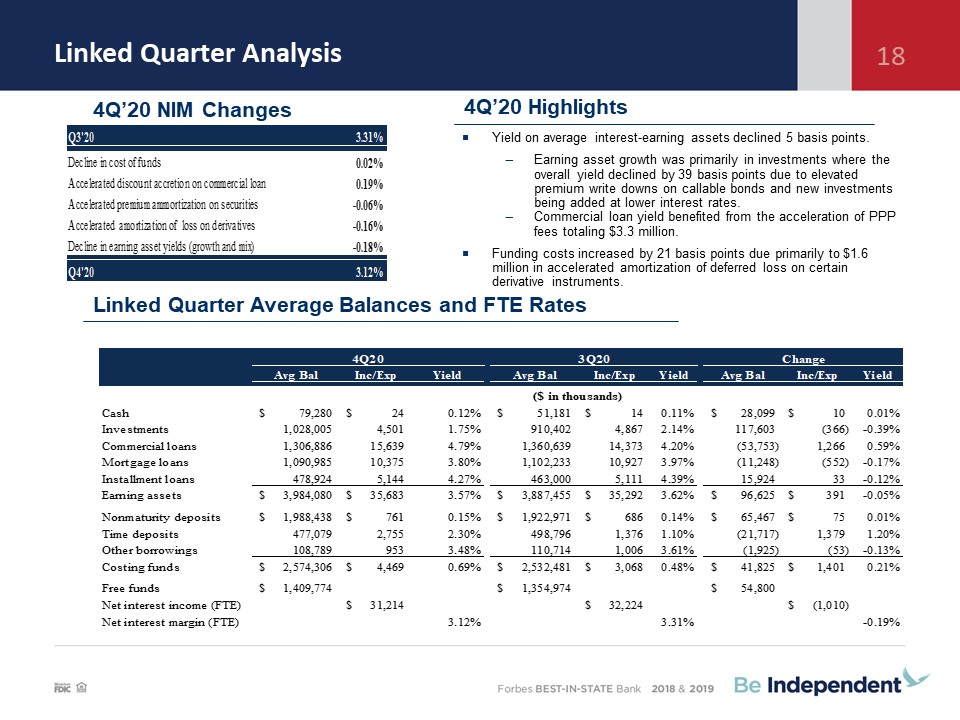
Linked Quarter Analysis 18 4Q’20 NIM Changes Linked Quarter Average Balances and FTE Rates Yield on
average interest-earning assets declined 5 basis points.Earning asset growth was primarily in investments where the overall yield declined by 39 basis points due to elevated premium write downs on callable bonds and new investments being
added at lower interest rates.Commercial loan yield benefited from the acceleration of PPP fees totaling $3.3 million. Funding costs increased by 21 basis points due primarily to $1.6 million in accelerated amortization of deferred loss on
certain derivative instruments. 4Q’20 Highlights
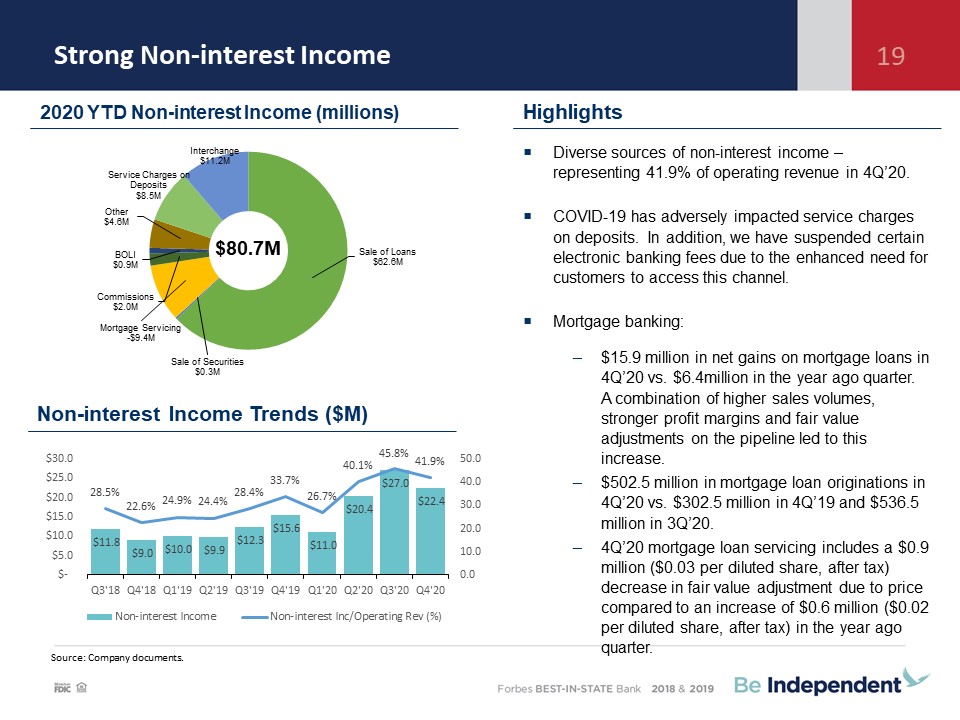
Strong Non-interest Income 19 Diverse sources of non-interest income – representing 41.9% of
operating revenue in 4Q’20.COVID-19 has adversely impacted service charges on deposits. In addition, we have suspended certain electronic banking fees due to the enhanced need for customers to access this channel.Mortgage banking: $15.9
million in net gains on mortgage loans in 4Q’20 vs. $6.4million in the year ago quarter. A combination of higher sales volumes, stronger profit margins and fair value adjustments on the pipeline led to this increase.$502.5 million in mortgage
loan originations in 4Q’20 vs. $302.5 million in 4Q’19 and $536.5 million in 3Q’20.4Q’20 mortgage loan servicing includes a $0.9 million ($0.03 per diluted share, after tax) decrease in fair value adjustment due to price compared to an
increase of $0.6 million ($0.02 per diluted share, after tax) in the year ago quarter. Source: Company documents. $80.7M 2020 YTD Non-interest Income (millions) Non-interest Income Trends ($M) Highlights
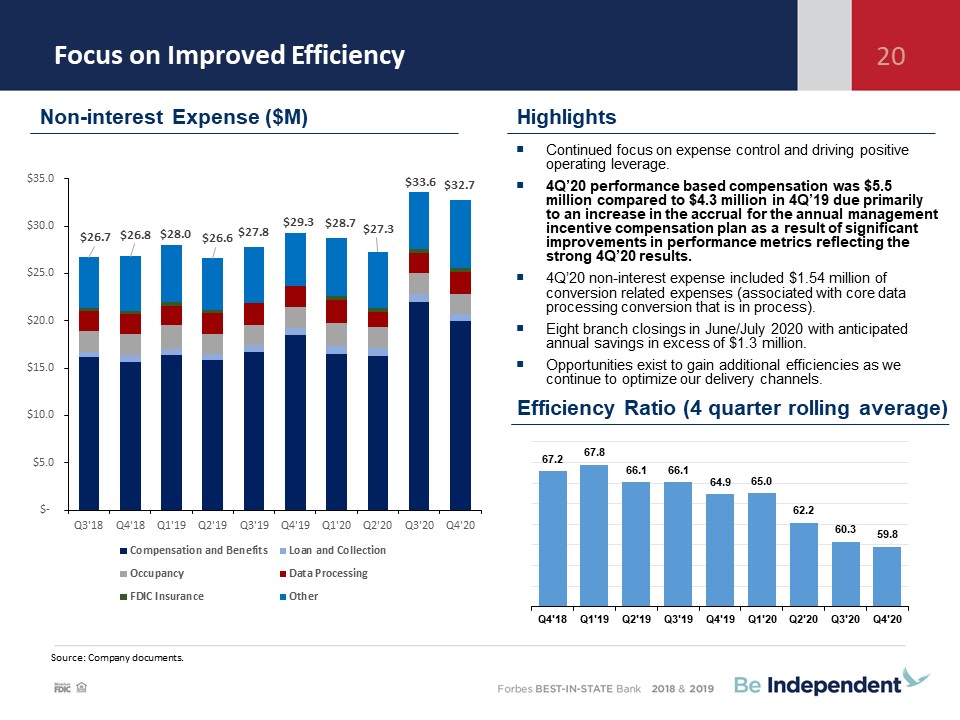
Focus on Improved Efficiency 20 Source: Company documents. Non-interest Expense ($M) Highlights
Efficiency Ratio (4 quarter rolling average) Continued focus on expense control and driving positive operating leverage. 4Q’20 performance based compensation was $5.5 million compared to $4.3 million in 4Q’19 due primarily to an increase in
the accrual for the annual management incentive compensation plan as a result of significant improvements in performance metrics reflecting the strong 4Q’20 results.4Q’20 non-interest expense included $1.54 million of conversion related
expenses (associated with core data processing conversion that is in process).Eight branch closings in June/July 2020 with anticipated annual savings in excess of $1.3 million.Opportunities exist to gain additional efficiencies as we continue
to optimize our delivery channels.

Credit Quality Summary Note 1: Non-performing loans and non-performing assets exclude troubled debt
restructurings that are performing.Note 2: 12/31/16 30 to 89 days delinquent data excludes $1.63 million of payment plan receivables that were held for sale. Non-performing Assets ($ in Millions) ORE/ORA ($ in Millions) Non-performing
Loans ($ in Millions) 30 to 89 Days Delinquent ($ in Millions) 21
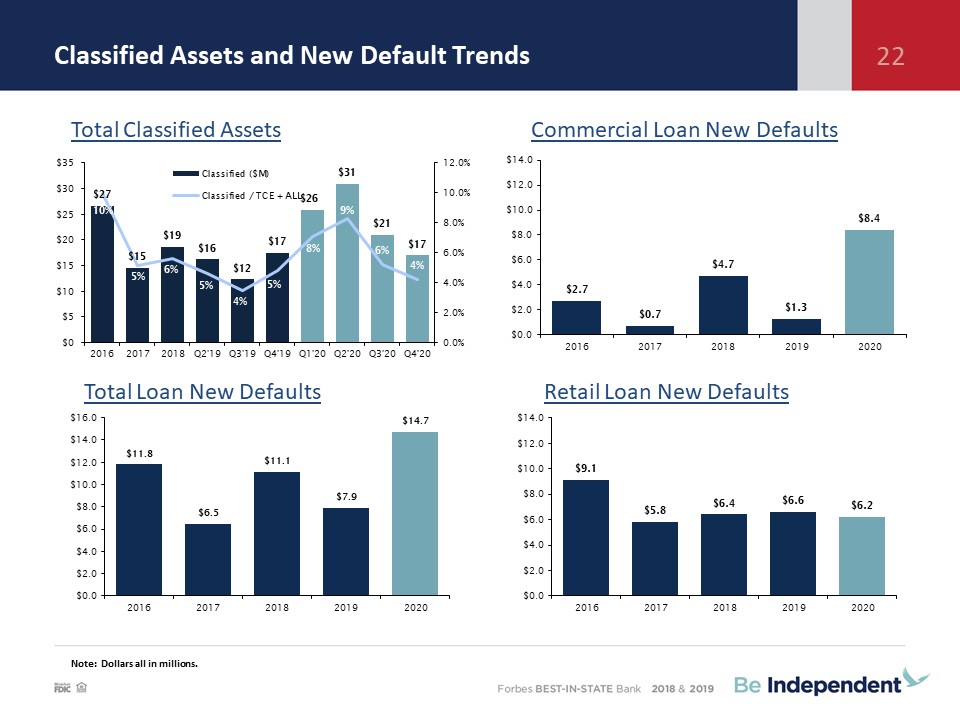
Classified Assets and New Default Trends Note: Dollars all in millions. Total Classified
Assets Commercial Loan New Defaults Total Loan New Defaults Retail Loan New Defaults 22
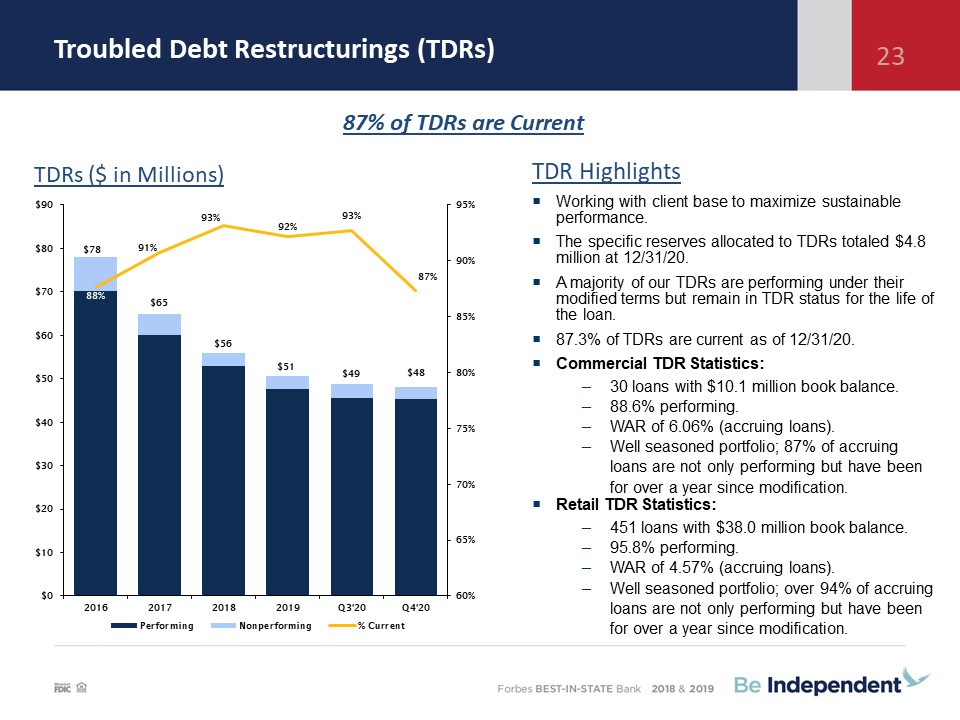
Troubled Debt Restructurings (TDRs) TDR HighlightsWorking with client base to maximize sustainable
performance.The specific reserves allocated to TDRs totaled $4.8 million at 12/31/20.A majority of our TDRs are performing under their modified terms but remain in TDR status for the life of the loan.87.3% of TDRs are current as of
12/31/20.Commercial TDR Statistics:30 loans with $10.1 million book balance.88.6% performing.WAR of 6.06% (accruing loans).Well seasoned portfolio; 87% of accruing loans are not only performing but have been for over a year since
modification.Retail TDR Statistics:451 loans with $38.0 million book balance.95.8% performing.WAR of 4.57% (accruing loans).Well seasoned portfolio; over 94% of accruing loans are not only performing but have been for over a year since
modification. TDRs ($ in Millions) 87% of TDRs are Current 23
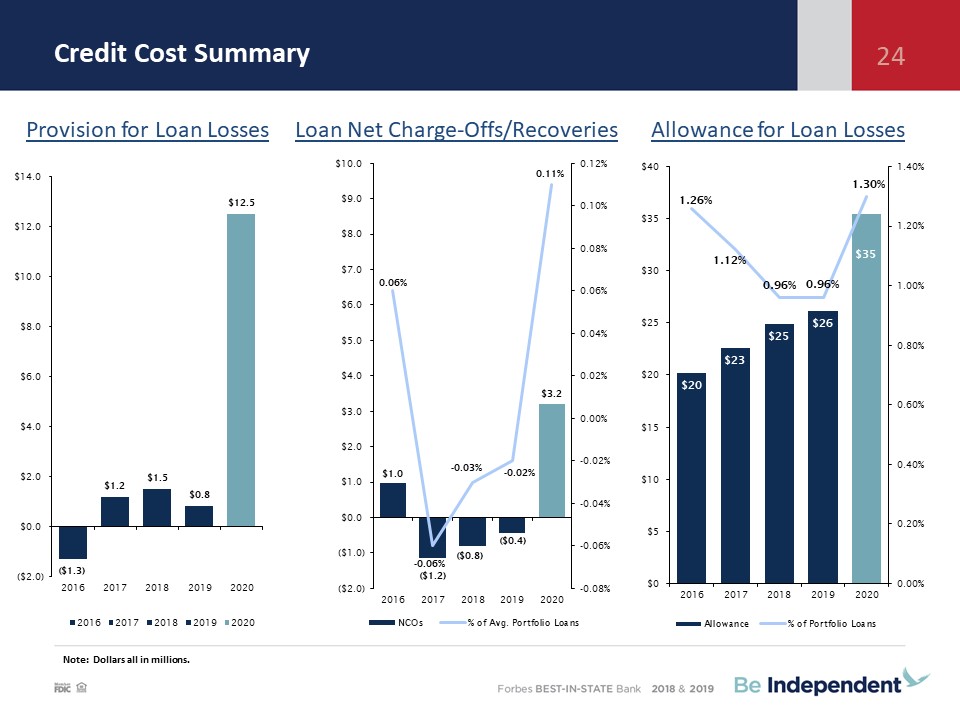
Note: Dollars all in millions. Provision for Loan Losses Loan Net Charge-Offs/Recoveries
Allowance for Loan Losses Credit Cost Summary 24
Incurred Loss Model vs CECL 25 Incurred vs. CECL ($ in Thousands) 12/31/20 “As If” ACL and percent
of loans calculated at midpoint of incremental range with additional $11.5 million at Day. The ACL to total loans ratio is approximately 1.80% excluding PPP loans. % Loans 0.96% 1.30% 1.72%(1) “As-if CECL” Illustrative Only Incurred
Loss Build We delayed adopting CECL under the CARES Act:Increased visibility into the economic (local, regional, national) impact of the COVID-19 pandemic. Unemployment forecast sources exhibiting wide disparity.Relationship between
unemployment and credit impacted by non-traditional factors, including “stay at home” executive orders, increased unemployment eligibility as well as supplemental unemployment benefits. Incurred Model:4Q’20 provision was a credit of $0.4
millionDecember 31, 2020 allowance for loan losses of $35.4 million or,1.30% of portfolio l
oans;1.38% of portfolio loans excluding PPP loans and remaining Traverse City State Bank acquired loans; and450% of non-performing loans.Qualitative/subjective allocation increased $0.5 million in 4Q’20 (and by $11.2 million for full-year
2020) due to impact of: increased economic shock to high risk industries, elevated unemployment claims and the level of retail forbearance requests.CECL:Expect to adopt CECL on January 1, 2021 as allowed under the CARES Act extension. CECL
day 1 impact range is $10.5 million to $12.5 million with $0.5 million to $1.5 million for unfunded commitments.Increase in the estimated day 1 adjustment range is due to certain discounted cash flow model enhancements.CECL Model
Details:Discounted cash flow model with fourteen loan segments.Probability of default and loss given default based on long-term average for commercial loans and regression for mortgage and installment loans.Regression uses one year forecast /
with immediate reversion to mean driven primarily by unemployment.Unemployment data: median of Bloomberg survey: 6.7% Q4, falls to 5.9% at the end of the one year forecast.Q factors: economic shock, forbearance activity, and loans in high
risk industries. Allocation of Incurred ALLL $26,148 $35,429 $46,929 (1) $9,281 $10,500 to $12,500 12/31/19 ALLL Reserve Build Under Incurred Loss 12/31/20 Incurred Loss Reserve "As If" Day
1 CECL Reserve 1/1/21 "As If" ACL
Incurred Loss Model vs CECL 25 Incurred vs. CECL ($ in Thousands) 12/31/20 “As If” ACL and
percent of loans calculated at midpoint of incremental range with additional $11.5 million at Day. The ACL to total loans ratio is approximately 1.80% excluding PPP loans. % Loans 0.96% 1.30% 1.72%(1) “As-if CECL” Illustrative
Only Incurred Loss Build We delayed adopting CECL under the CARES Act:Increased visibility into the economic (local, regional, national) impact of the COVID-19 pandemic. Unemployment forecast sources exhibiting wide
disparity.Relationship between unemployment and credit impacted by non-traditional factors, including “stay at home” executive orders, increased unemployment eligibility as well as supplemental unemployment benefits. Incurred
Model:4Q’20 provision was a credit of $0.4 millionDecember 31, 2020 allowance for loan losses of $35.4 million or,1.30% of portfolio loans;1.43% of portfolio loans excluding PPP loans and remaining Traverse City State Bank acquired
loans; and450% of non-performing loans.Qualitative/subjective allocation increased $0.5 million in 4Q’20 (and by $11.2 million for full-year 2020) due to impact of: increased economic shock to high risk industries, elevated
unemployment claims and the level of retail forbearance requests.CECL:Expect to adopt CECL on January 1, 2021 as allowed under the CARES Act extension. CECL day 1 impact range is $10.5 million to $12.5 million with $0.5 million to
$1.5 million for unfunded commitments.Increase in the estimated day 1 adjustment range is due to certain discounted cash flow model enhancements.CECL Model Details:Discounted cash flow model with fourteen loan segments.Probability of
default and loss given default based on long-term average for commercial loans and regression for mortgage and installment loans.Regression uses one year forecast / with immediate reversion to mean driven primarily by
unemployment.Unemployment data: median of Bloomberg survey: 6.7% Q4, falls to 5.9% at the end of the one year forecast.Q factors: economic shock, forbearance activity, and loans in high risk industries. Allocation of Incurred
ALLL $26,148 $35,429 $46,929 (1) $9,281 $10,500 to $12,500 12/31/19 ALLL Reserve Build Under Incurred Loss 12/31/20 Incurred Loss Reserve "As If" Day 1 CECL Reserve 1/1/21 "As If" ACL
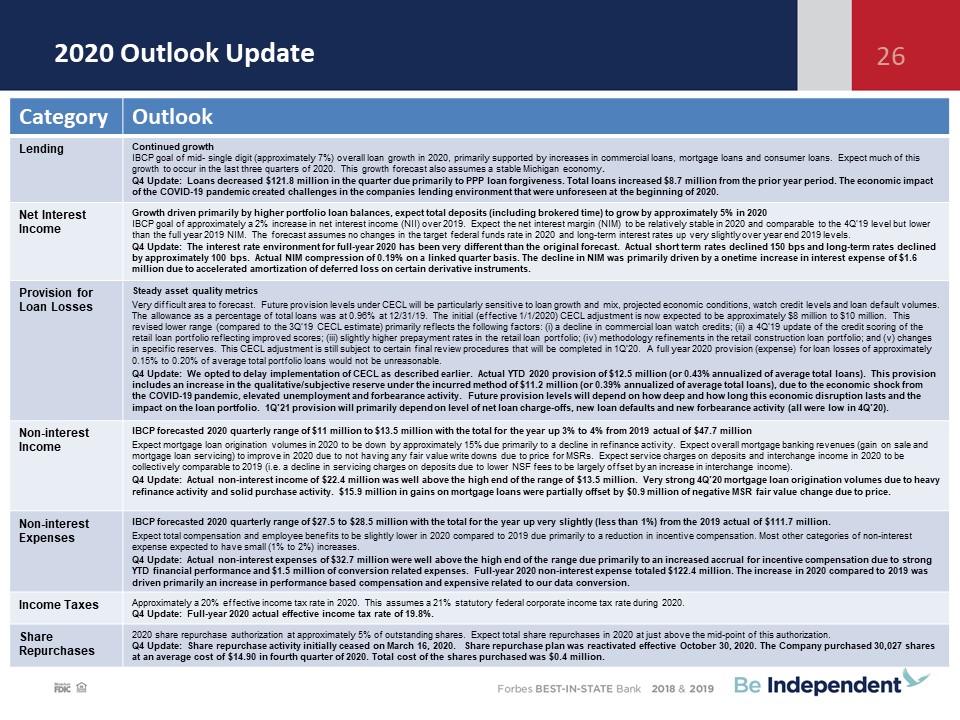
2020 Outlook Update Category Outlook Lending Continued growthIBCP goal of mid- single digit
(approximately 7%) overall loan growth in 2020, primarily supported by increases in commercial loans, mortgage loans and consumer loans. Expect much of this growth to occur in the last three quarters of 2020. This growth forecast also assumes
a stable Michigan economy.Q4 Update: Loans decreased $121.8 million in the quarter due primarily to PPP loan forgiveness. Total loans increased $8.7 million from the prior year period. The economic impact of the COVID-19 pandemic created
challenges in the companies lending environment that were unforeseen at the beginning of 2020. Net Interest Income Growth driven primarily by higher portfolio loan balances, expect total deposits (including brokered time) to grow by
approximately 5% in 2020 IBCP goal of approximately a 2% increase in net interest income (NII) over 2019. Expect the net interest margin (NIM) to be relatively stable in 2020 and comparable to the 4Q’19 level but lower than the full year 2019
NIM. The forecast assumes no changes in the target federal funds rate in 2020 and long-term interest rates up very slightly over year end 2019 levels. Q4 Update: The interest rate environment for full-year 2020 has been very different than
the original forecast. Actual short term rates declined 150 bps and long-term rates declined by approximately 100 bps. Actual NIM compression of 0.19% on a linked quarter basis. The decline in NIM was primarily driven by a onetime increase in
interest expense of $1.6 million due to accelerated amortization of deferred loss on certain derivative instruments. Provision for Loan Losses Steady asset quality metricsVery difficult area to forecast. Future provision levels under CECL
will be particularly sensitive to loan growth and mix, projected economic conditions, watch credit levels and loan default volumes. The allowance as a percentage of total loans was at 0.96% at 12/31/19. The initial (effective 1/1/2020) CECL
adjustment is now expected to be approximately $8 million to $10 million. This revised lower range (compared to the 3Q’19 CECL estimate) primarily reflects the following factors: (i) a decline in commercial loan watch credits; (ii) a 4Q’19
update of the credit scoring of the retail loan portfolio reflecting improved scores; (iii) slightly higher prepayment rates in the retail loan portfolio; (iv) methodology refinements in the retail construction loan portfolio; and (v) changes
in specific reserves. This CECL adjustment is still subject to certain final review procedures that will be completed in 1Q’20. A full year 2020 provision (expense) for loan losses of approximately 0.15% to 0.20% of average total portfolio
loans would not be unreasonable.Q4 Update: We opted to delay implementation of CECL as described earlier. Actual YTD 2020 provision of $12.5 million (or 0.43% annualized of average total loans). This provision includes an increase in the
qualitative/subjective reserve under the incurred method of $11.2 million (or 0.39% annualized of average total loans), due to the economic shock from the COVID-19 pandemic, elevated unemployment and forbearance activity. Future provision
levels will depend on how deep and how long this economic disruption lasts and the impact on the loan portfolio. 1Q’21 provision will primarily depend on level of net loan charge-offs, new loan defaults and new forbearance activity (all were
low in 4Q’20). Non-interest Income IBCP forecasted 2020 quarterly range of $11 million to $13.5 million with the total for the year up 3% to 4% from 2019 actual of $47.7 millionExpect mortgage loan origination volumes in 2020 to be down by
approximately 15% due primarily to a decline in refinance activity. Expect overall mortgage banking revenues (gain on sale and mortgage loan servicing) to improve in 2020 due to not having any fair value write downs due to price for MSRs.
Expect service charges on deposits and interchange income in 2020 to be collectively comparable to 2019 (i.e. a decline in servicing charges on deposits due to lower NSF fees to be largely offset by an increase in interchange income). Q4
Update: Actual non-interest income of $22.4 million was well above the high end of the range of $13.5 million. Very strong 4Q’20 mortgage loan origination volumes due to heavy refinance activity and solid purchase activity. $15.9 million in
gains on mortgage loans were partially offset by $0.9 million of negative MSR fair value change due to price. Non-interest Expenses IBCP forecasted 2020 quarterly range of $27.5 to $28.5 million with the total for the year up very slightly
(less than 1%) from the 2019 actual of $111.7 million.Expect total compensation and employee benefits to be slightly lower in 2020 compared to 2019 due primarily to a reduction in incentive compensation. Most other categories of non-interest
expense expected to have small (1% to 2%) increases.Q4 Update: Actual non-interest expenses of $32.7 million were well above the high end of the range due primarily to an increased accrual for incentive compensation due to strong YTD
financial performance and $1.5 million of conversion related expenses. Full-year 2020 non-interest expense totaled $122.4 million. The increase in 2020 compared to 2019 was driven primarily an increase in performance based compensation and
expensive related to our data conversion. Income Taxes Approximately a 20% effective income tax rate in 2020. This assumes a 21% statutory federal corporate income tax rate during 2020.Q4 Update: Full-year 2020 actual effective income tax
rate of 19.8%. Share Repurchases 2020 share repurchase authorization at approximately 5% of outstanding shares. Expect total share repurchases in 2020 at just above the mid-point of this authorization.Q4 Update: Share repurchase activity
initially ceased on March 16, 2020. Share repurchase plan was reactivated effective October 30, 2020. The Company purchased 30,027 shares at an average cost of $14.90 in fourth quarter of 2020. Total cost of the shares purchased was $0.4
million. 26
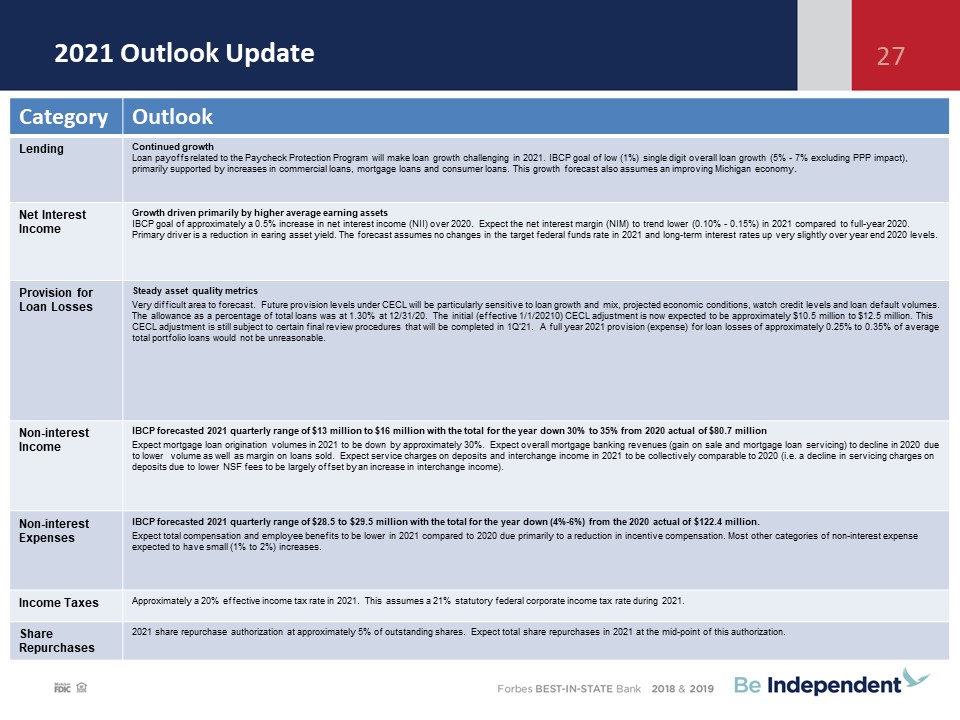
2021 Outlook Update Category Outlook Lending Continued growthLoan payoffs related to the Paycheck
Protection Program will make loan growth challenging in 2021. IBCP goal of low (1%) single digit overall loan growth (5% - 7% excluding PPP impact), primarily supported by increases in commercial loans, mortgage loans and consumer loans. This
growth forecast also assumes an improving Michigan economy. Net Interest Income Growth driven primarily by higher average earning assetsIBCP goal of approximately a 0.5% increase in net interest income (NII) over 2020. Expect the net
interest margin (NIM) to trend lower (0.10% - 0.15%) in 2021 compared to full-year 2020. Primary driver is a reduction in earing asset yield. The forecast assumes no changes in the target federal funds rate in 2021 and long-term interest
rates up very slightly over year end 2020 levels. Provision for Loan Losses Steady asset quality metricsVery difficult area to forecast. Future provision levels under CECL will be particularly sensitive to loan growth and mix, projected
economic conditions, watch credit levels and loan default volumes. The allowance as a percentage of total loans was at 1.30% at 12/31/20. The initial (effective 1/1/20210) CECL adjustment is now expected to be approximately $10.5 million to
$12.5 million. This CECL adjustment is still subject to certain final review procedures that will be completed in 1Q’21. A full year 2021 provision (expense) for loan losses of approximately 0.25% to 0.35% of average total portfolio loans
would not be unreasonable. Non-interest Income IBCP forecasted 2021 quarterly range of $13 million to $16 million with the total for the year down 30% to 35% from 2020 actual of $80.7 millionExpect mortgage loan origination volumes in 2021
to be down by approximately 30%. Expect overall mortgage banking revenues (gain on sale and mortgage loan servicing) to decline in 2020 due to lower volume as well as margin on loans sold. Expect service charges on deposits and interchange
income in 2021 to be collectively comparable to 2020 (i.e. a decline in servicing charges on deposits due to lower NSF fees to be largely offset by an increase in interchange income). Non-interest Expenses IBCP forecasted 2021 quarterly
range of $28.5 to $29.5 million with the total for the year down (4%-6%) from the 2020 actual of $122.4 million.Expect total compensation and employee benefits to be lower in 2021 compared to 2020 due primarily to a reduction in incentive
compensation. Most other categories of non-interest expense expected to have small (1% to 2%) increases. Income Taxes Approximately a 20% effective income tax rate in 2021. This assumes a 21% statutory federal corporate income tax rate
during 2021. Share Repurchases 2021 share repurchase authorization at approximately 5% of outstanding shares. Expect total share repurchases in 2021 at the mid-point of this authorization. 27
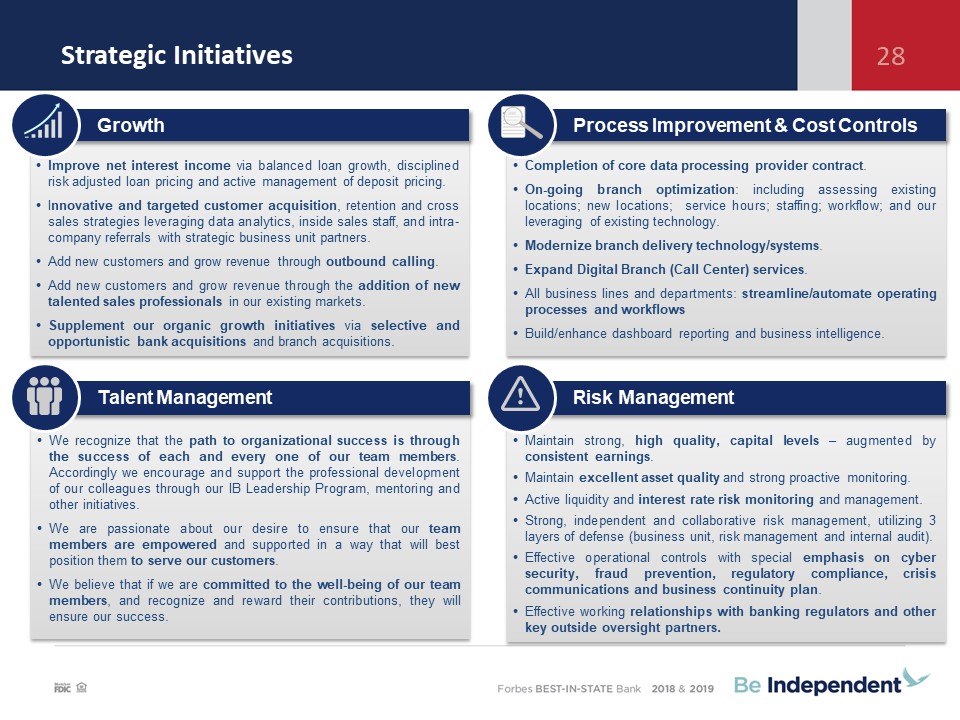
Strategic Initiatives 28 Improve net interest income via balanced loan growth, disciplined risk
adjusted loan pricing and active management of deposit pricing. Innovative and targeted customer acquisition, retention and cross sales strategies leveraging data analytics, inside sales staff, and intra-company referrals with strategic
business unit partners.Add new customers and grow revenue through outbound calling.Add new customers and grow revenue through the addition of new talented sales professionals in our existing markets. Supplement our organic growth initiatives
via selective and opportunistic bank acquisitions and branch acquisitions. Growth Completion of core data processing provider contract.On-going branch optimization: including assessing existing locations; new locations; service hours;
staffing; workflow; and our leveraging of existing technology. Modernize branch delivery technology/systems.Expand Digital Branch (Call Center) services.All business lines and departments: streamline/automate operating processes and workflows
Build/enhance dashboard reporting and business intelligence. Process Improvement & Cost Controls We recognize that the path to organizational success is through the success of each and every one of our team members. Accordingly we
encourage and support the professional development of our colleagues through our IB Leadership Program, mentoring and other initiatives. We are passionate about our desire to ensure that our team members are empowered and supported in a way
that will best position them to serve our customers. We believe that if we are committed to the well-being of our team members, and recognize and reward their contributions, they will ensure our success. Talent Management Maintain
strong, high quality, capital levels – augmented by consistent earnings. Maintain excellent asset quality and strong proactive monitoring.Active liquidity and interest rate risk monitoring and management.Strong, independent and collaborative
risk management, utilizing 3 layers of defense (business unit, risk management and internal audit). Effective operational controls with special emphasis on cyber security, fraud prevention, regulatory compliance, crisis communications and
business continuity plan.Effective working relationships with banking regulators and other key outside oversight partners. Risk Management
Q&A and Closing Remarks Question and Answer SessionClosing RemarksThank you for attending!NASDAQ:
IBCP 29