Attached files
| file | filename |
|---|---|
| EX-99.1 - EX-99.1 - First Western Financial Inc | myfw-20210128xex99d1.htm |
| 8-K - 8-K - First Western Financial Inc | myfw-20210128x8k.htm |
Exhibit 99.2
| First Western Financial, Inc. The First, Western-Based Private Trust Bank Fourth Quarter 2020 Conference Call |

| Safe Harbor 2 This presentation contains “forward-looking statements” within the meaning of Section 27A of the Securities Act of 1933, as amended, and Section 21E of the Securities Exchange Act of 1934, as amended. These forward-looking statements reflect the current views of First Western Financial, Inc.’s (“First Western”) management with respect to, among other things, future events and First Western’s financial performance. These statements are often, but not always, made through the use of words or phrases such as “may,” “should,” “could,” “predict,” “potential,” “believe,” “will likely result,” “expect,” “continue,” “will,” “anticipate,” “seek,” “estimate,” “intend,” “plan,” “project,” “future” “forecast,” “goal,” “target,” “would” and “outlook,” or the negative variations of those words or other comparable words of a future or forward-looking nature. These forward-looking statements are not historical facts, and are based on current expectations, estimates and projections about First Western’s industry, management’s beliefs and certain assumptions made by management, many of which, by their nature, are inherently uncertain and beyond First Western’s control. Accordingly, First Western cautions you that any such forward-looking statements are not guarantees of future performance and are subject to risks, assumptions and uncertainties that are difficult to predict. Although First Western believes that the expectations reflected in these forward-looking statements are reasonable as of the date made, actual results may prove to be materially different from the results expressed or implied by the forward-looking statements. Those following risks and uncertainties, among others, could cause actual results and future events to differ materially from those set forth or contemplated in the forward-looking statements: the COVID-19 pandemic and its effects; integration risks in connection with acquisitions; the risk of geographic concentration in Colorado, Arizona, Wyoming and California; the risk of changes in the economy affecting real estate values and liquidity; the risk in our ability to continue to originate residential real estate loans and sell such loans; risks specific to commercial loans and borrowers; the risk of claims and litigation pertaining to our fiduciary responsibilities; the risk of competition for investment managers and professionals; the risk of fluctuation in the value of our investment securities; the risk of changes in interest rates; and the risk of the adequacy of our allowance for loan losses and the risk in our ability to maintain a strong core deposit base or other low-cost funding sources. Additional information regarding these and other risks and uncertainties to which our business and future financial performance are subject is contained in our Annual Report on Form 10-K filed with the U.S. Securities and Exchange Commission (“SEC”) on March 12, 2020 and other documents we file with the SEC from time to time. All subsequent written and oral forward-looking statements attributable to First Western or persons acting on First Western’s behalf are expressly qualified in their entirety by this paragraph. Forward-looking statements speak only as of the date of this presentation. First Western undertakes no obligation to publicly update or otherwise revise any forward-looking statements, whether as a result of new information, future events or otherwise (except as required by law). Certain of the information contained herein may be derived from information provided by industry sources. The Company believes that such information is accurate and the sources from which it has been obtained are reliable; however, the Company cannot guaranty the accuracy of such information and has not independently verified such information. This presentation contains certain non-GAAP financial measures intended to supplement, not substitute for, comparable GAAP measures. Reconciliations of non-GAAP financial measures to GAAP financial measures are provided at the end of this presentation. Numbers in the presentation may not sum due to rounding. |
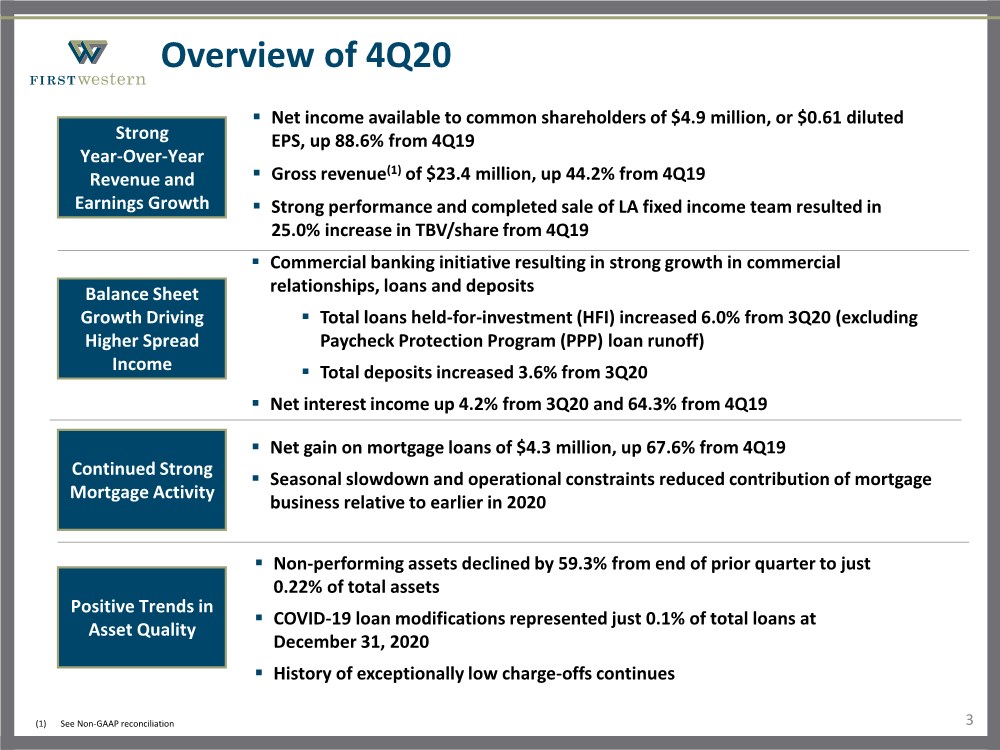
| Overview of 4Q20 Continued Strong Mortgage Activity Strong Year-Over-Year Revenue and Earnings Growth Balance Sheet Growth Driving Higher Spread Income ▪ Commercial banking initiative resulting in strong growth in commercial relationships, loans and deposits ▪ Total loans held-for-investment (HFI) increased 6.0% from 3Q20 (excluding Paycheck Protection Program (PPP) loan runoff) ▪ Total deposits increased 3.6% from 3Q20 ▪ Net interest income up 4.2% from 3Q20 and 64.3% from 4Q19 ▪ Non-performing assets declined by 59.3% from end of prior quarter to just 0.22% of total assets ▪ COVID-19 loan modifications represented just 0.1% of total loans at December 31, 2020 ▪ History of exceptionally low charge-offs continues Positive Trends in Asset Quality ▪ Net gain on mortgage loans of $4.3 million, up 67.6% from 4Q19 ▪ Seasonal slowdown and operational constraints reduced contribution of mortgage business relative to earlier in 2020 3 ▪ Net income available to common shareholders of $4.9 million, or $0.61 diluted EPS, up 88.6% from 4Q19 ▪ Gross revenue(1) of $23.4 million, up 44.2% from 4Q19 ▪ Strong performance and completed sale of LA fixed income team resulted in 25.0% increase in TBV/share from 4Q19 (1) See Non-GAAP reconciliation |
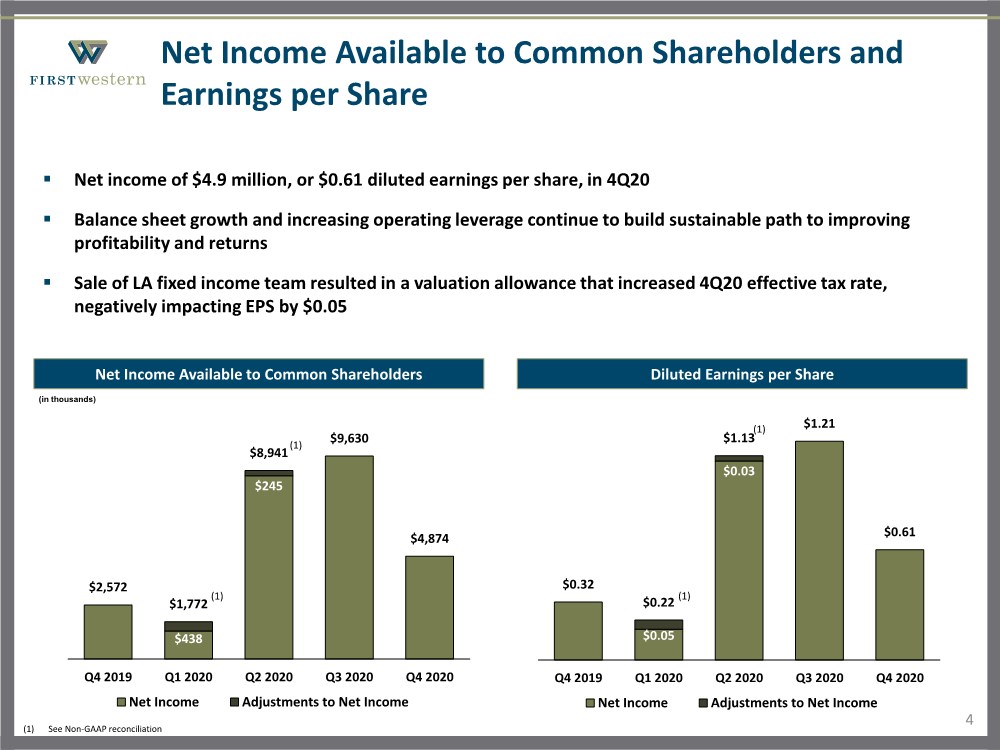
| Net Income Available to Common Shareholders and Earnings per Share 4 Net Income Available to Common Shareholders ▪ Net income of $4.9 million, or $0.61 diluted earnings per share, in 4Q20 ▪ Balance sheet growth and increasing operating leverage continue to build sustainable path to improving profitability and returns ▪ Sale of LA fixed income team resulted in a valuation allowance that increased 4Q20 effective tax rate, negatively impacting EPS by $0.05 Diluted Earnings per Share (in thousands) $438 $245 $2,572 $1,772 $8,941 $9,630 $4,874 Q4 2019 Q1 2020 Q2 2020 Q3 2020 Q4 2020 Net Income Adjustments to Net Income (1) (1) See Non-GAAP reconciliation (1) $0.05 $0.03 $0.32 $0.22 $1.13 $1.21 $0.61 Q4 2019 Q1 2020 Q2 2020 Q3 2020 Q4 2020 Net Income Adjustments to Net Income (1) (1) |
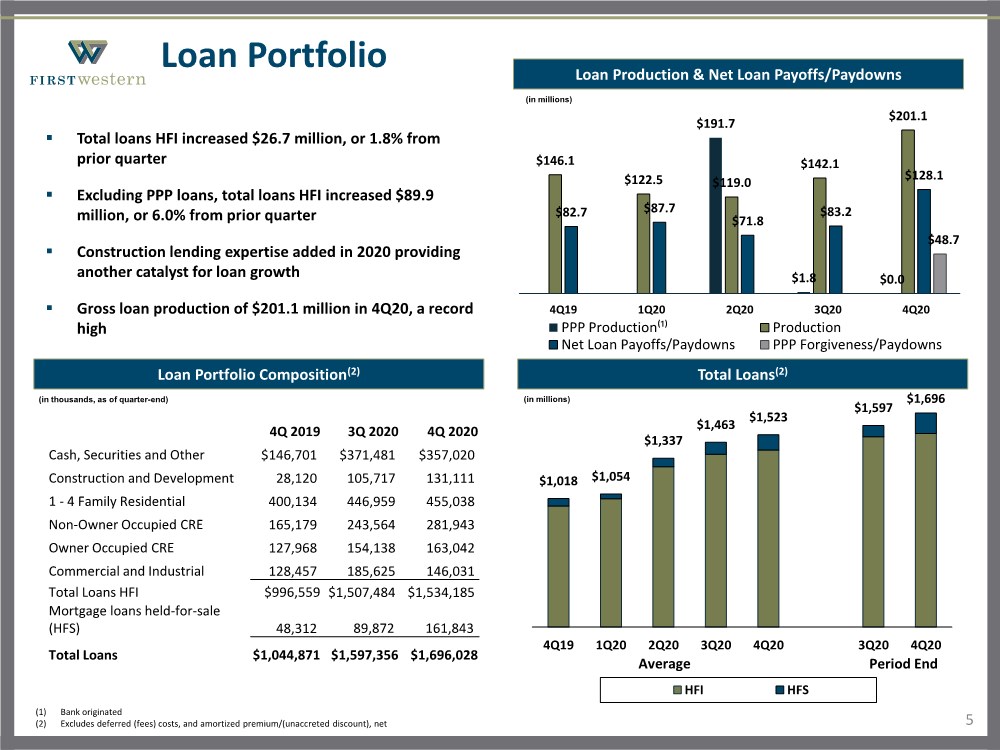
| $1,018 $1,054 $1,337 $1,463 $1,523 $1,597 $1,696 4Q19 1Q20 2Q20 3Q20 4Q20 3Q20 4Q20 HFI HFS Average Period End Loan Portfolio 5 Loan Portfolio Composition(2) ▪ Total loans HFI increased $26.7 million, or 1.8% from prior quarter ▪ Excluding PPP loans, total loans HFI increased $89.9 million, or 6.0% from prior quarter ▪ Construction lending expertise added in 2020 providing another catalyst for loan growth ▪ Gross loan production of $201.1 million in 4Q20, a record high (in thousands, as of quarter-end) Total Loans(2) (in millions) (1) Bank originated (2) Excludes deferred (fees) costs, and amortized premium/(unaccreted discount), net 4Q 2019 3Q 2020 4Q 2020 Cash, Securities and Other $146,701 $371,481 $357,020 Construction and Development 28,120 105,717 131,111 1 - 4 Family Residential 400,134 446,959 455,038 Non-Owner Occupied CRE 165,179 243,564 281,943 Owner Occupied CRE 127,968 154,138 163,042 Commercial and Industrial 128,457 185,625 146,031 Total Loans HFI $996,559 $1,507,484 $1,534,185 Mortgage loans held-for-sale (HFS) 48,312 89,872 161,843 Total Loans $1,044,871 $1,597,356 $1,696,028 Loan Production & Net Loan Payoffs/Paydowns $191.7 $1.8 $0.0 $146.1 $122.5 $119.0 $142.1 $201.1 $82.7 $87.7 $71.8 $83.2 $128.1 $48.7 4Q19 1Q20 2Q20 3Q20 4Q20 PPP Production⁽¹⁾ Production Net Loan Payoffs/Paydowns PPP Forgiveness/Paydowns (in millions) |
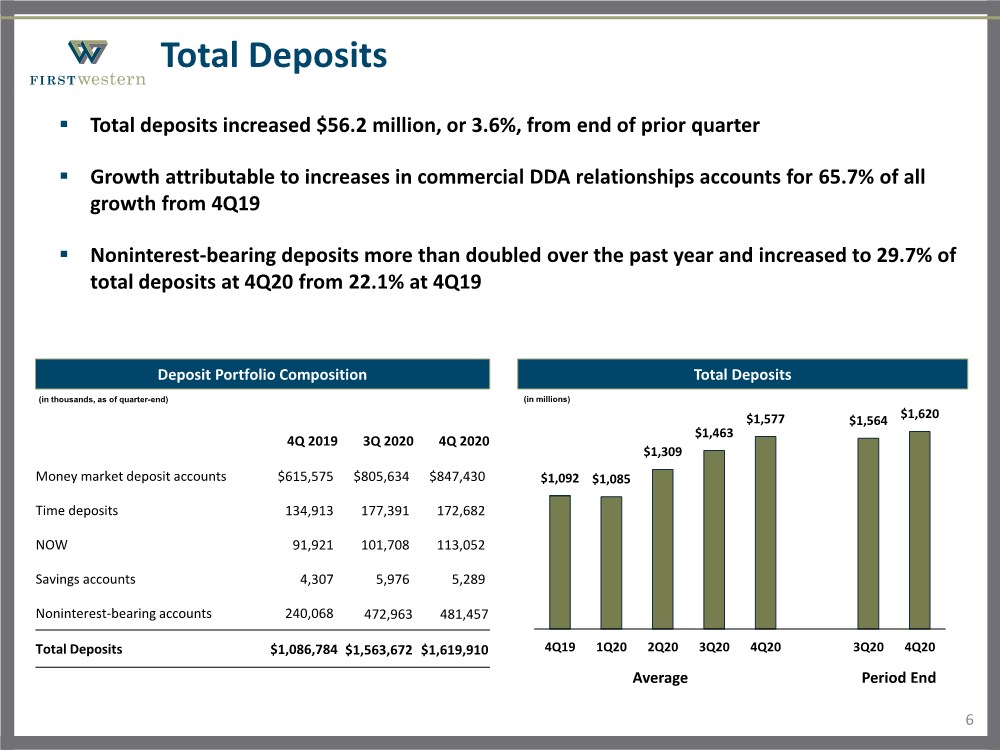
| $1,092 $1,085 $1,309 $1,463 $1,577 $1,564 $1,620 4Q19 1Q20 2Q20 3Q20 4Q20 3Q20 4Q20 Average Period End Total Deposits 6 Deposit Portfolio Composition ▪ Total deposits increased $56.2 million, or 3.6%, from end of prior quarter ▪ Growth attributable to increases in commercial DDA relationships accounts for 65.7% of all growth from 4Q19 ▪ Noninterest-bearing deposits more than doubled over the past year and increased to 29.7% of total deposits at 4Q20 from 22.1% at 4Q19 4Q 2019 3Q 2020 4Q 2020 Money market deposit accounts $615,575 $805,634 $847,430 Time deposits 134,913 177,391 172,682 NOW 91,921 101,708 113,052 Savings accounts 4,307 5,976 5,289 Noninterest-bearing accounts 240,068 472,963 481,457 Total Deposits $1,086,784 $1,563,672 $1,619,910 (in thousands, as of quarter-end) Total Deposits (in millions) |
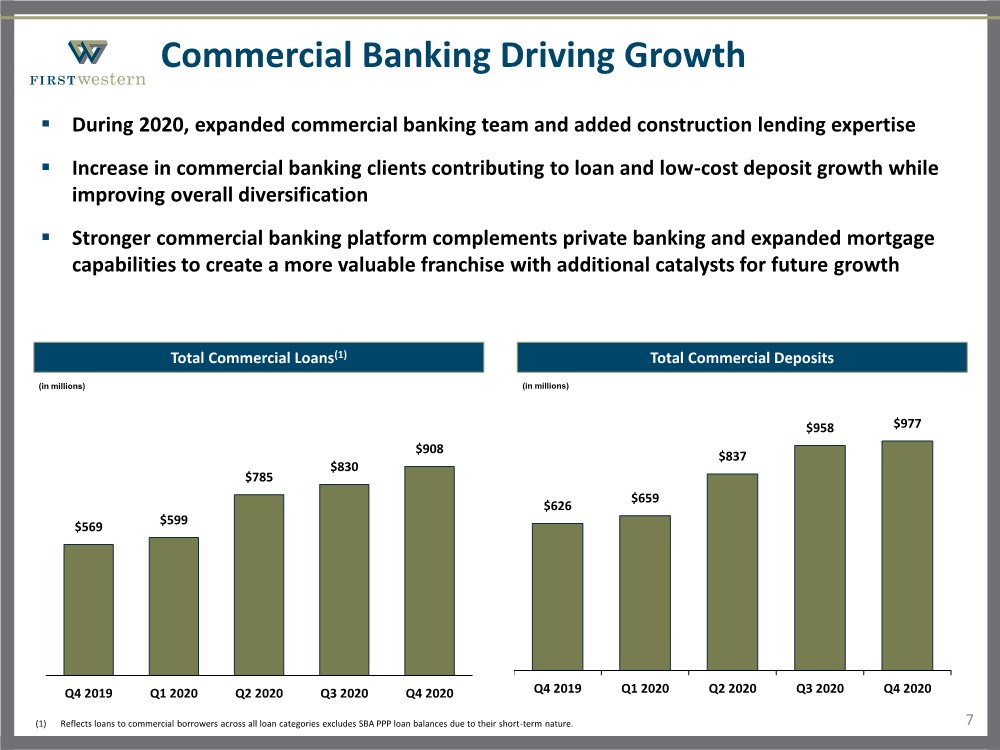
| $626 $659 $837 $958 $977 Q4 2019 Q1 2020 Q2 2020 Q3 2020 Q4 2020 Commercial Banking Driving Growth 7 Total Commercial Loans(1) Total Commercial Deposits (in millions) (in millions) $569 $599 $785 $830 $908 Q4 2019 Q1 2020 Q2 2020 Q3 2020 Q4 2020 ▪ During 2020, expanded commercial banking team and added construction lending expertise ▪ Increase in commercial banking clients contributing to loan and low-cost deposit growth while improving overall diversification ▪ Stronger commercial banking platform complements private banking and expanded mortgage capabilities to create a more valuable franchise with additional catalysts for future growth (1) Reflects loans to commercial borrowers across all loan categories excludes SBA PPP loan balances due to their short-term nature. |
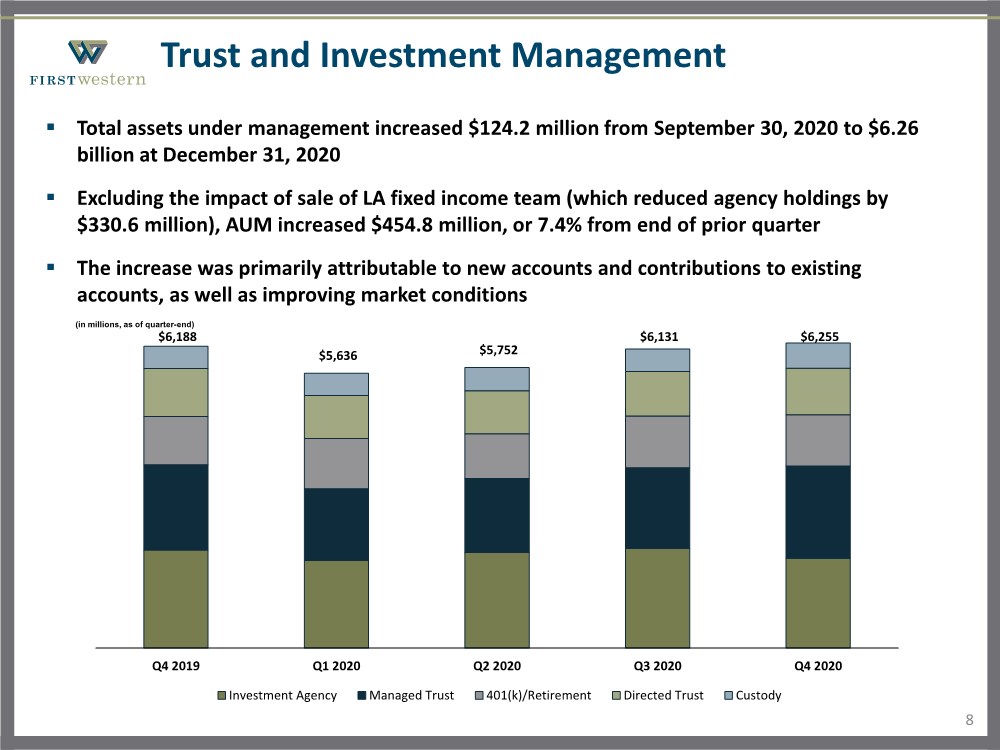
| Trust and Investment Management ▪ Total assets under management increased $124.2 million from September 30, 2020 to $6.26 billion at December 31, 2020 ▪ Excluding the impact of sale of LA fixed income team (which reduced agency holdings by $330.6 million), AUM increased $454.8 million, or 7.4% from end of prior quarter ▪ The increase was primarily attributable to new accounts and contributions to existing accounts, as well as improving market conditions $6,188 $5,636 $5,752 $6,131 $6,255 Q4 2019 Q1 2020 Q2 2020 Q3 2020 Q4 2020 Investment Agency Managed Trust 401(k)/Retirement Directed Trust Custody (in millions, as of quarter-end) 8 |
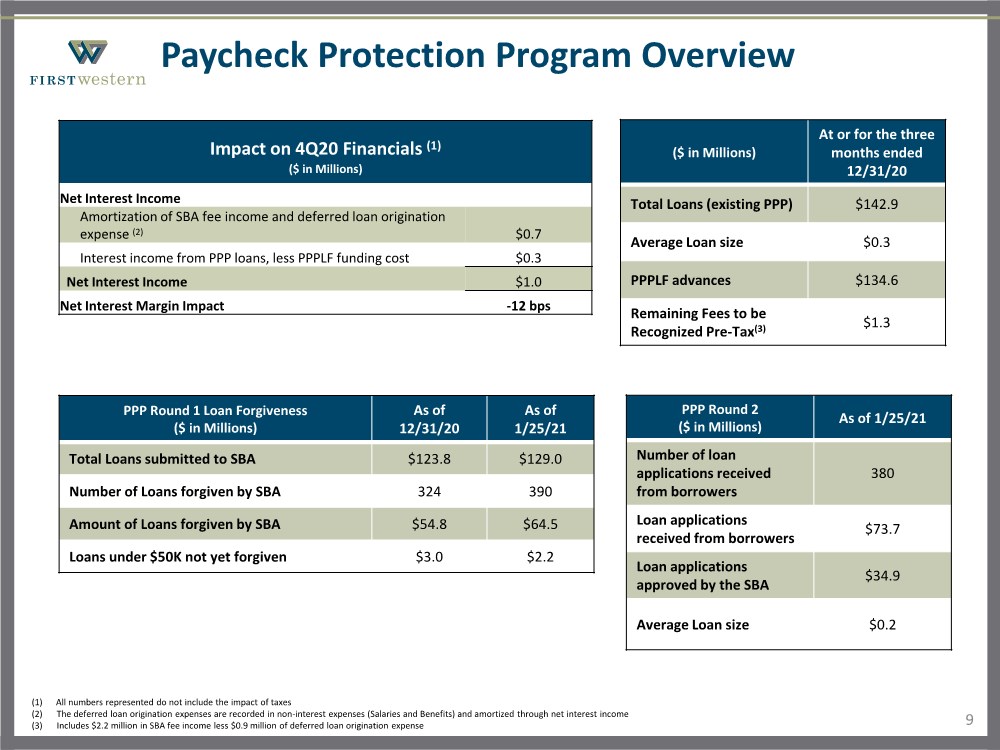
| Paycheck Protection Program Overview 9 (1) All numbers represented do not include the impact of taxes (2) The deferred loan origination expenses are recorded in non-interest expenses (Salaries and Benefits) and amortized through net interest income (3) Includes $2.2 million in SBA fee income less $0.9 million of deferred loan origination expense Impact on 4Q20 Financials (1) ($ in Millions) Net Interest Income Amortization of SBA fee income and deferred loan origination expense (2) $0.7 Interest income from PPP loans, less PPPLF funding cost $0.3 Net Interest Income $1.0 Net Interest Margin Impact -12 bps PPP Round 1 Loan Forgiveness ($ in Millions) As of 12/31/20 As of 1/25/21 Total Loans submitted to SBA $123.8 $129.0 Number of Loans forgiven by SBA 324 390 Amount of Loans forgiven by SBA $54.8 $64.5 Loans under $50K not yet forgiven $3.0 $2.2 ($ in Millions) At or for the three months ended 12/31/20 Total Loans (existing PPP) $142.9 Average Loan size $0.3 PPPLF advances $134.6 Remaining Fees to be Recognized Pre-Tax(3) $1.3 PPP Round 2 ($ in Millions) As of 1/25/21 Number of loan applications received from borrowers 380 Loan applications received from borrowers $73.7 Loan applications approved by the SBA $34.9 Average Loan size $0.2 |
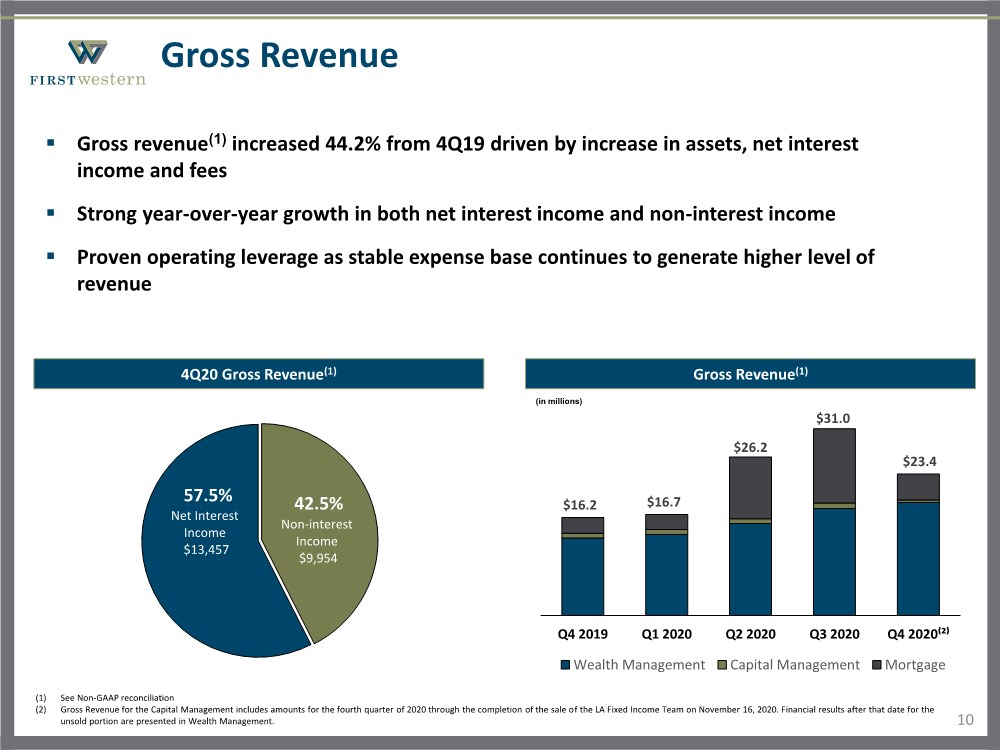
| Non-interest Income $9,954 Net Interest Income $13,457 42.5% 57.5% Gross Revenue 10 (1) See Non-GAAP reconciliation (2) Gross Revenue for the Capital Management includes amounts for the fourth quarter of 2020 through the completion of the sale of the LA Fixed Income Team on November 16, 2020. Financial results after that date for the unsold portion are presented in Wealth Management. 4Q20 Gross Revenue(1) ▪ Gross revenue(1) increased 44.2% from 4Q19 driven by increase in assets, net interest income and fees ▪ Strong year-over-year growth in both net interest income and non-interest income ▪ Proven operating leverage as stable expense base continues to generate higher level of revenue Gross Revenue(1) $16.2 $16.7 $26.2 $31.0 $23.4 Q4 2019 Q1 2020 Q2 2020 Q3 2020 Q4 2020⁽²⁾ Wealth Management Capital Management Mortgage (in millions) |
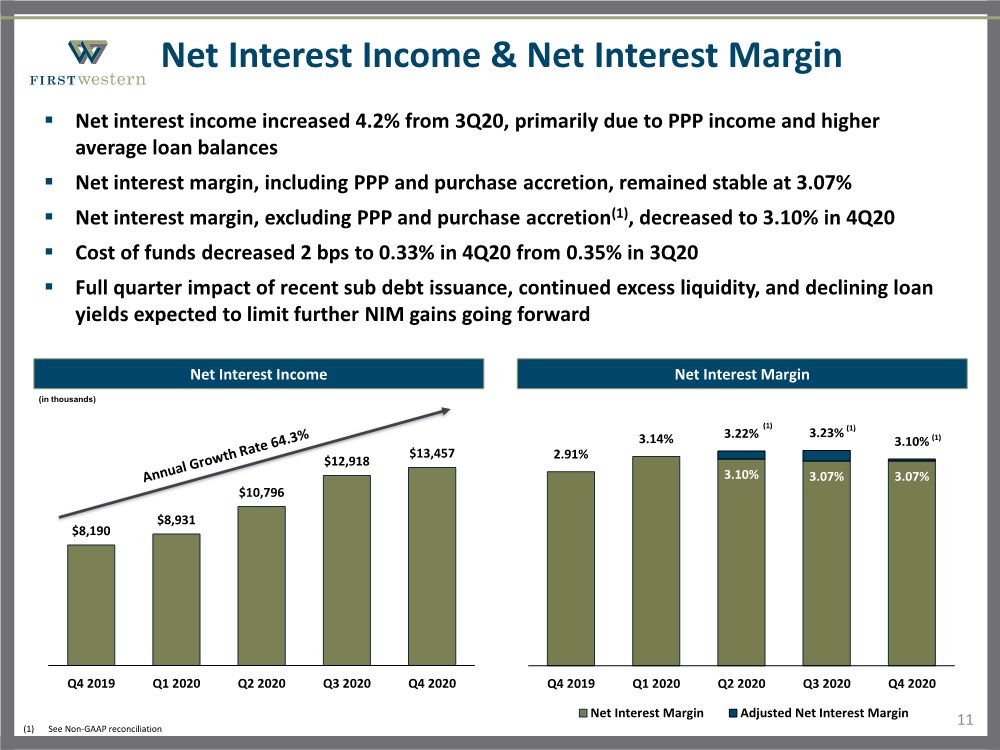
| Net Interest Income & Net Interest Margin 11 Net Interest Income ▪ Net interest income increased 4.2% from 3Q20, primarily due to PPP income and higher average loan balances ▪ Net interest margin, including PPP and purchase accretion, remained stable at 3.07% ▪ Net interest margin, excluding PPP and purchase accretion(1), decreased to 3.10% in 4Q20 ▪ Cost of funds decreased 2 bps to 0.33% in 4Q20 from 0.35% in 3Q20 ▪ Full quarter impact of recent sub debt issuance, continued excess liquidity, and declining loan yields expected to limit further NIM gains going forward Net Interest Margin 3.10% 3.07% 3.07% 2.91% 3.14% 3.22% 3.23% 3.10% Q4 2019 Q1 2020 Q2 2020 Q3 2020 Q4 2020 Net Interest Margin Adjusted Net Interest Margin (1) $8,190 $8,931 $10,796 $12,918 $13,457 Q4 2019 Q1 2020 Q2 2020 Q3 2020 Q4 2020 (in thousands) (1) See Non-GAAP reconciliation (1) (1) |
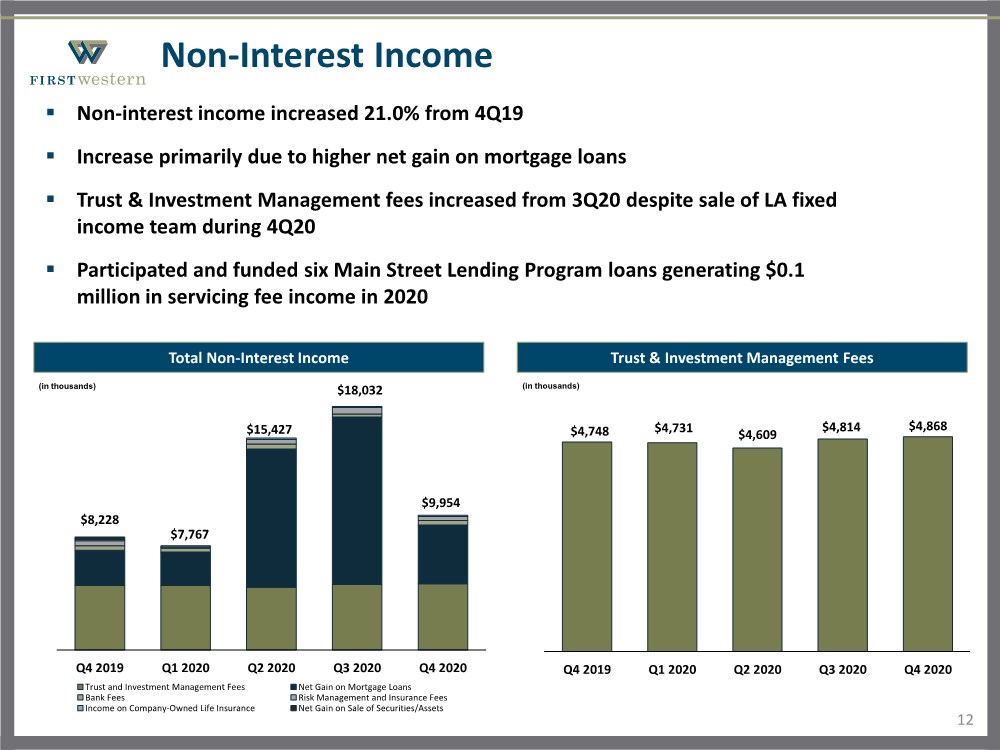
| $4,748 $4,731 $4,609 $4,814 $4,868 Q4 2019 Q1 2020 Q2 2020 Q3 2020 Q4 2020 Non-Interest Income 12 Total Non-Interest Income ▪ Non-interest income increased 21.0% from 4Q19 ▪ Increase primarily due to higher net gain on mortgage loans ▪ Trust & Investment Management fees increased from 3Q20 despite sale of LA fixed income team during 4Q20 ▪ Participated and funded six Main Street Lending Program loans generating $0.1 million in servicing fee income in 2020 Trust & Investment Management Fees $8,228 $7,767 $15,427 $18,032 $9,954 Q4 2019 Q1 2020 Q2 2020 Q3 2020 Q4 2020 Trust and Investment Management Fees Net Gain on Mortgage Loans Bank Fees Risk Management and Insurance Fees Income on Company-Owned Life Insurance Net Gain on Sale of Securities/Assets (in thousands) (in thousands) |
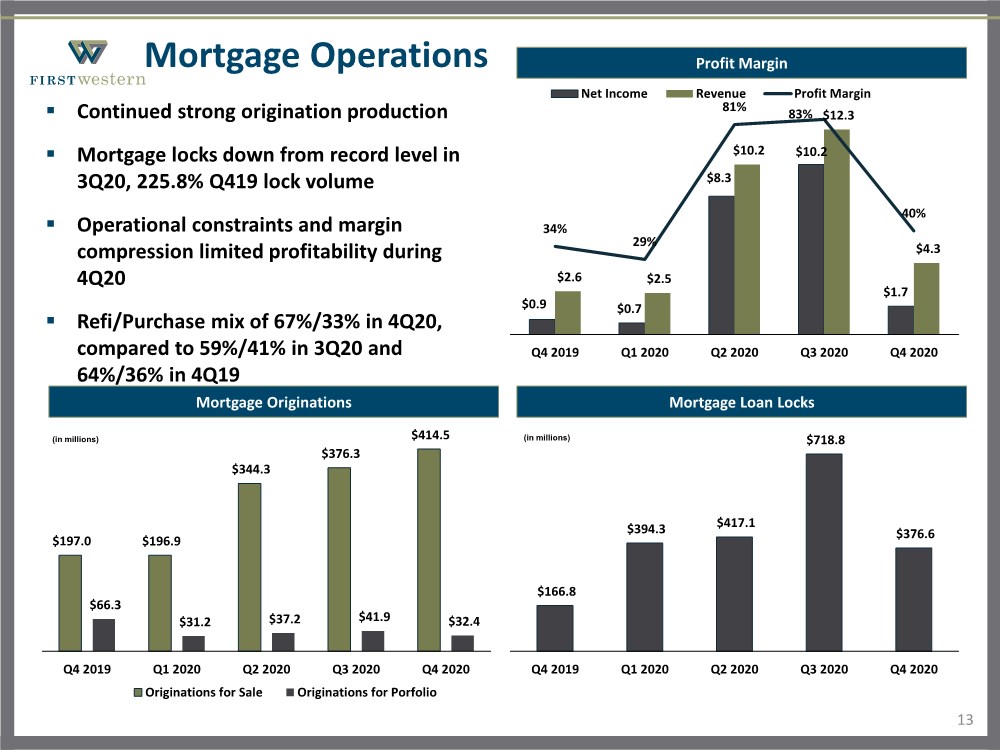
| Mortgage Operations 13 ▪ Continued strong origination production ▪ Mortgage locks down from record level in 3Q20, 225.8% Q419 lock volume ▪ Operational constraints and margin compression limited profitability during 4Q20 ▪ Refi/Purchase mix of 67%/33% in 4Q20, compared to 59%/41% in 3Q20 and 64%/36% in 4Q19 (in millions) $197.0 $196.9 $344.3 $376.3 $414.5 $66.3 $31.2 $37.2 $41.9 $32.4 Q4 2019 Q1 2020 Q2 2020 Q3 2020 Q4 2020 Originations for Sale Originations for Porfolio Mortgage Originations $166.8 $394.3 $417.1 $718.8 $376.6 Q4 2019 Q1 2020 Q2 2020 Q3 2020 Q4 2020 Mortgage Loan Locks (in millions) $0.9 $0.7 $8.3 $10.2 $1.7 $2.6 $2.5 $10.2 $12.3 $4.3 34% 29% 81% 83% 40% Q4 2019 Q1 2020 Q2 2020 Q3 2020 Q4 2020 Net Income Revenue Profit Margin Profit Margin |
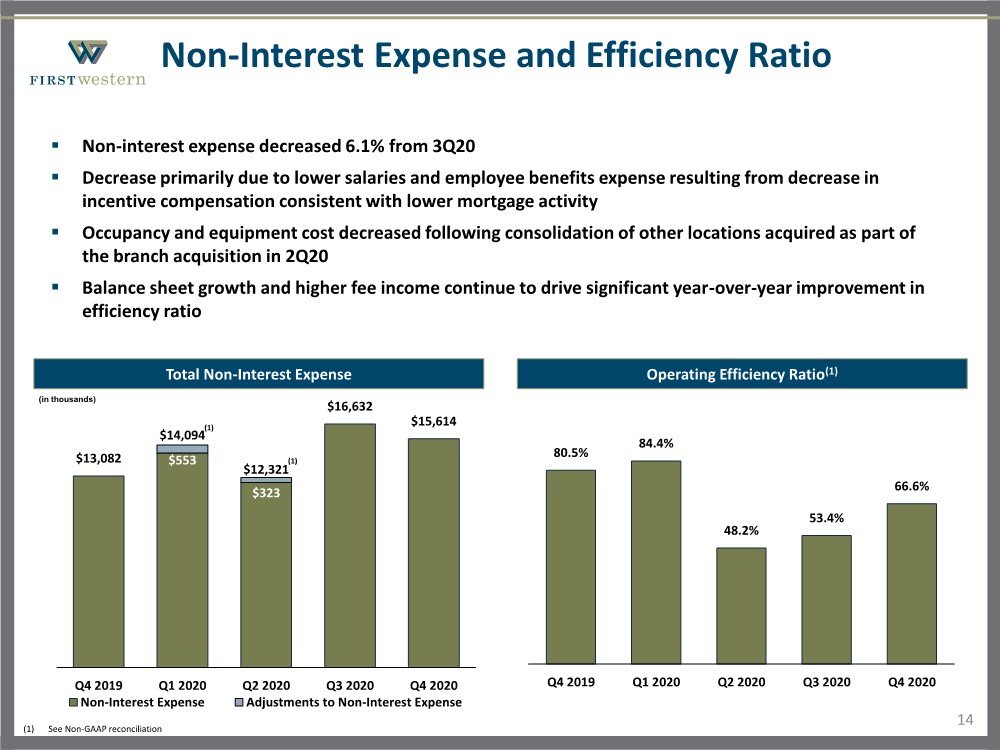
| Non-Interest Expense and Efficiency Ratio 14 Total Non-Interest Expense ▪ Non-interest expense decreased 6.1% from 3Q20 ▪ Decrease primarily due to lower salaries and employee benefits expense resulting from decrease in incentive compensation consistent with lower mortgage activity ▪ Occupancy and equipment cost decreased following consolidation of other locations acquired as part of the branch acquisition in 2Q20 ▪ Balance sheet growth and higher fee income continue to drive significant year-over-year improvement in efficiency ratio Operating Efficiency Ratio(1) 80.5% 84.4% 48.2% 53.4% 66.6% Q4 2019 Q1 2020 Q2 2020 Q3 2020 Q4 2020 $553 $323 $13,082 $14,094 $12,321 $16,632 $15,614 Q4 2019 Q1 2020 Q2 2020 Q3 2020 Q4 2020 Non-Interest Expense Adjustments to Non-Interest Expense (in thousands) (1) See Non-GAAP reconciliation (1) (1) |
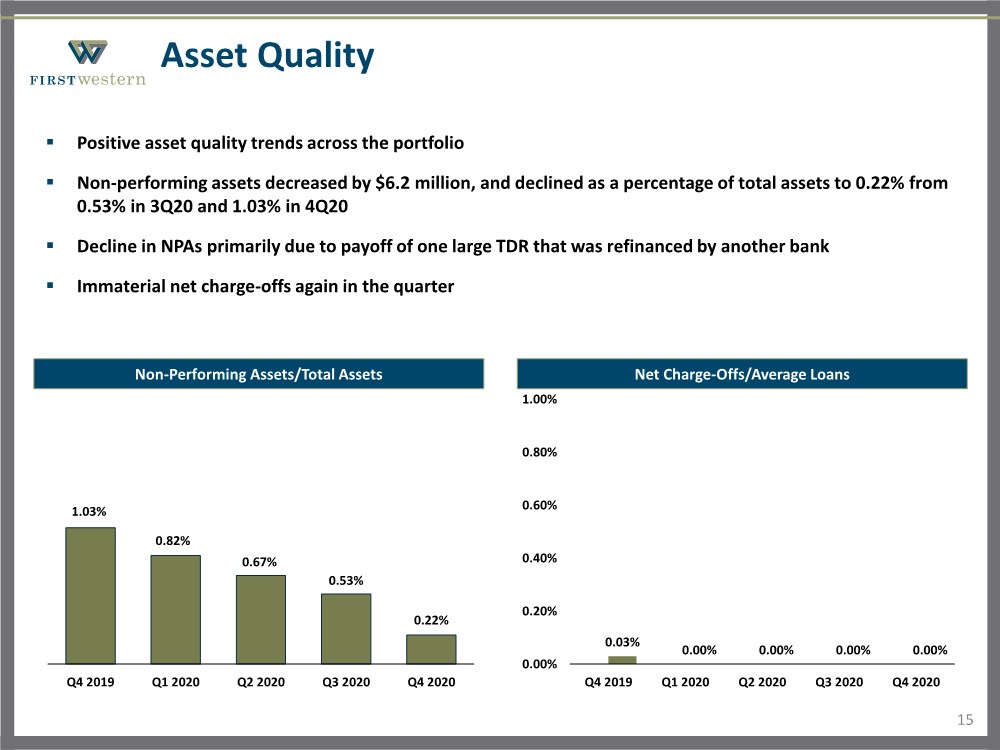
| Asset Quality 15 Non-Performing Assets/Total Assets ▪ Positive asset quality trends across the portfolio ▪ Non-performing assets decreased by $6.2 million, and declined as a percentage of total assets to 0.22% from 0.53% in 3Q20 and 1.03% in 4Q20 ▪ Decline in NPAs primarily due to payoff of one large TDR that was refinanced by another bank ▪ Immaterial net charge-offs again in the quarter Net Charge-Offs/Average Loans 0.03% 0.00% 0.00% 0.00% 0.00% 0.00% 0.20% 0.40% 0.60% 0.80% 1.00% Q4 2019 Q1 2020 Q2 2020 Q3 2020 Q4 2020 1.03% 0.82% 0.67% 0.53% 0.22% Q4 2019 Q1 2020 Q2 2020 Q3 2020 Q4 2020 |
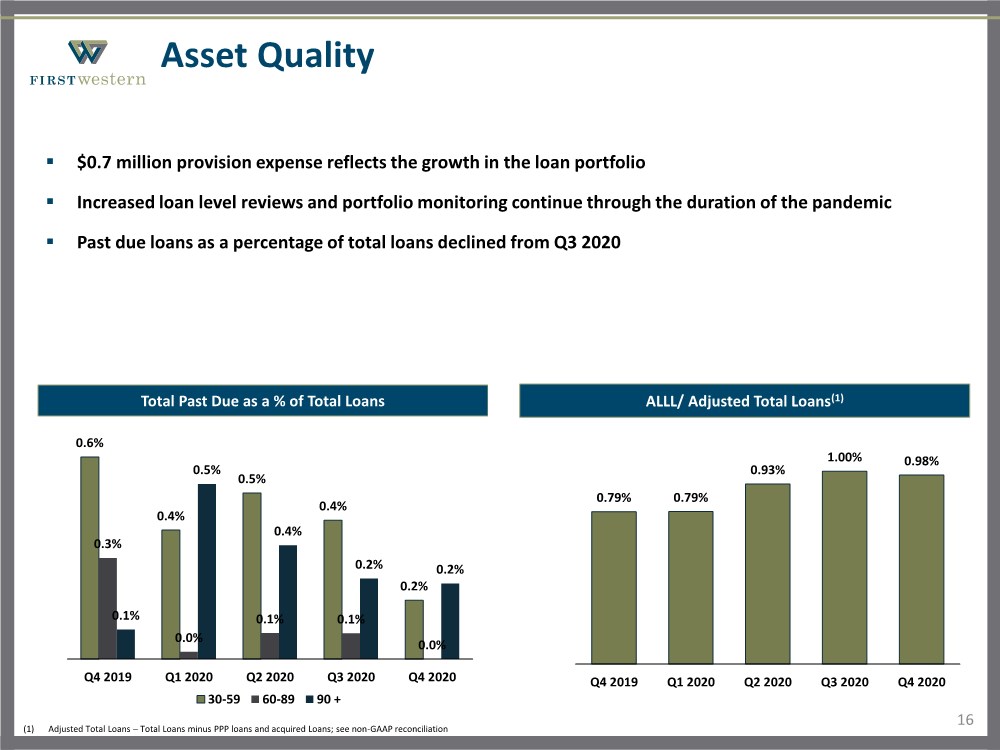
| Asset Quality 16 ▪ $0.7 million provision expense reflects the growth in the loan portfolio ▪ Increased loan level reviews and portfolio monitoring continue through the duration of the pandemic ▪ Past due loans as a percentage of total loans declined from Q3 2020 ALLL/ Adjusted Total Loans(1) 0.79% 0.79% 0.93% 1.00% 0.98% Q4 2019 Q1 2020 Q2 2020 Q3 2020 Q4 2020 0.6% 0.4% 0.5% 0.4% 0.2% 0.3% 0.0% 0.1% 0.1% 0.0% 0.1% 0.5% 0.4% 0.2% 0.2% Q4 2019 Q1 2020 Q2 2020 Q3 2020 Q4 2020 30-59 60-89 90 + Total Past Due as a % of Total Loans (1) Adjusted Total Loans – Total Loans minus PPP loans and acquired Loans; see non-GAAP reconciliation |
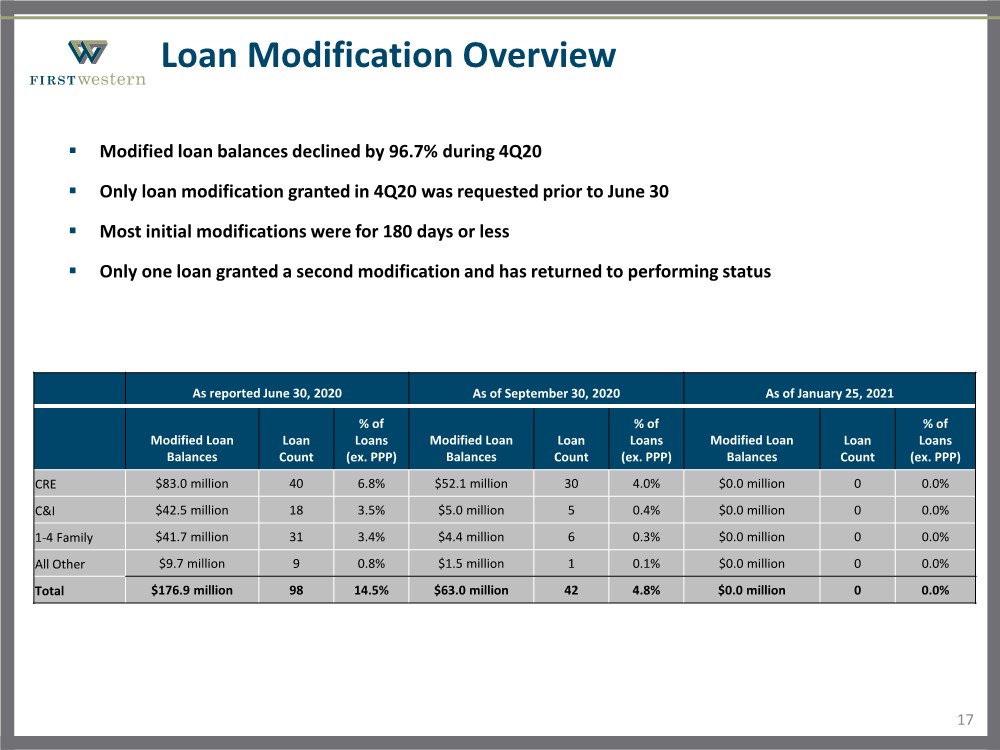
| Loan Modification Overview 17 ▪ Modified loan balances declined by 96.7% during 4Q20 ▪ Only loan modification granted in 4Q20 was requested prior to June 30 ▪ Most initial modifications were for 180 days or less ▪ Only one loan granted a second modification and has returned to performing status As reported June 30, 2020 As of September 30, 2020 As of January 25, 2021 Modified Loan Balances Loan Count % of Loans (ex. PPP) Modified Loan Balances Loan Count % of Loans (ex. PPP) Modified Loan Balances Loan Count % of Loans (ex. PPP) CRE $83.0 million 40 6.8% $52.1 million 30 4.0% $0.0 million 0 0.0% C&I $42.5 million 18 3.5% $5.0 million 5 0.4% $0.0 million 0 0.0% 1-4 Family $41.7 million 31 3.4% $4.4 million 6 0.3% $0.0 million 0 0.0% All Other $9.7 million 9 0.8% $1.5 million 1 0.1% $0.0 million 0 0.0% Total $176.9 million 98 14.5% $63.0 million 42 4.8% $0.0 million 0 0.0% |
| 2021 Outlook and Priorities 18 ▪ Strong capital generation in 2020 provides support for continued organic and acquisition-related growth ▪ Progress made in strengthening commercial banking capabilities in 2020 creates strong foundation for 2021 growth ▪ Continue expanding commercial banking platform ➢ Capitalize on growing reputation as well as a differentiated commercial bank to attract additional talent ➢ Use 2nd PPP program to develop new commercial relationships ▪ Add MLOs and operations staff to mortgage business to support continued higher production levels ▪ Continue growing newer offices to move them closer to target profitability ▪ Manage expenses while investing in technology to improve efficiencies, productivity, and client experience ▪ Evaluating additional acquisition opportunities that can add value and accelerate growth ▪ Continue making progress in building First Western into a high performing institution |
| Appendix |

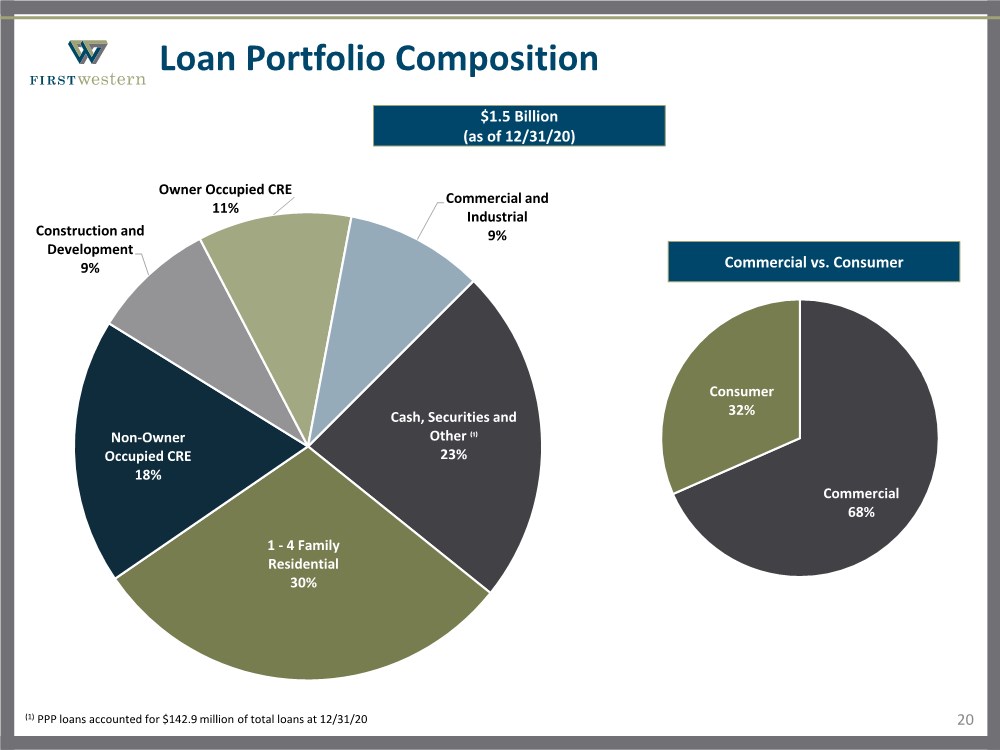
| Loan Portfolio Composition 20 Cash, Securities and Other ⁽¹⁾ 23% 1 - 4 Family Residential 30% Non-Owner Occupied CRE 18% Construction and Development 9% Owner Occupied CRE 11% Commercial and Industrial 9% Commercial 68% Consumer 32% $1.5 Billion (as of 12/31/20) Commercial vs. Consumer (1) PPP loans accounted for $142.9 million of total loans at 12/31/20 |
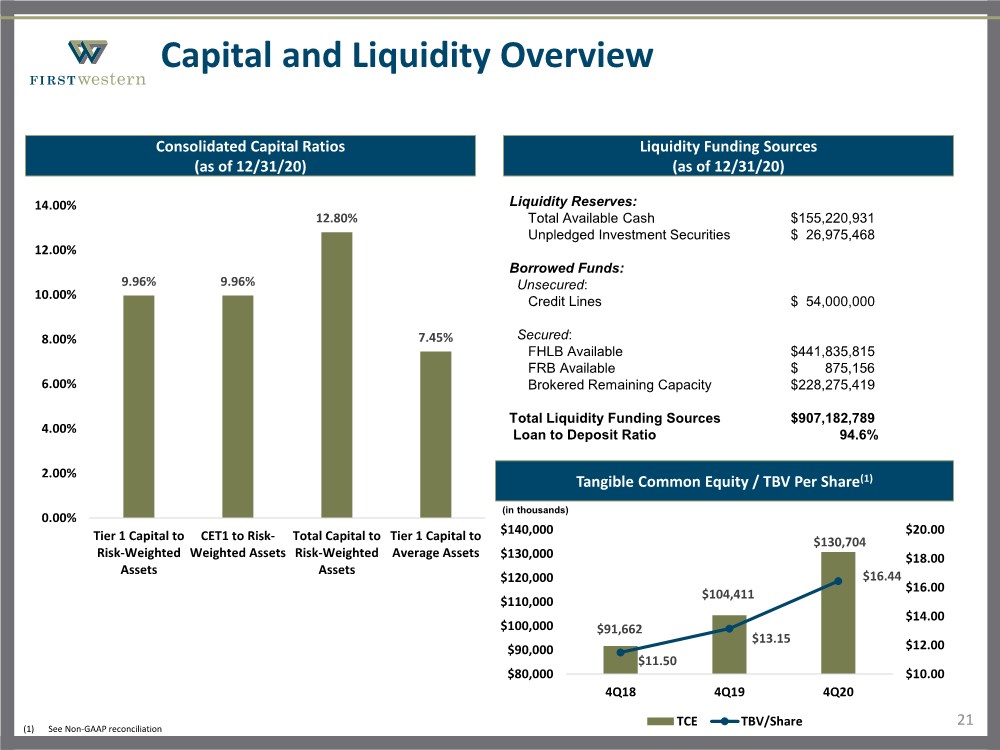
| Capital and Liquidity Overview 21 Liquidity Funding Sources (as of 12/31/20) Liquidity Reserves: Total Available Cash $155,220,931 Unpledged Investment Securities $ 26,975,468 Borrowed Funds: Unsecured: Credit Lines $ 54,000,000 Secured: FHLB Available $441,835,815 FRB Available $ 875,156 Brokered Remaining Capacity $228,275,419 Total Liquidity Funding Sources $907,182,789 Loan to Deposit Ratio 94.6% Consolidated Capital Ratios (as of 12/31/20) 9.96% 9.96% 12.80% 7.45% 0.00% 2.00% 4.00% 6.00% 8.00% 10.00% 12.00% 14.00% Tier 1 Capital to Risk-Weighted Assets CET1 to Risk- Weighted Assets Total Capital to Risk-Weighted Assets Tier 1 Capital to Average Assets Tangible Common Equity / TBV Per Share(1) (in thousands) $91,662 $104,411 $130,704 $11.50 $13.15 $16.44 $10.00 $12.00 $14.00 $16.00 $18.00 $20.00 $80,000 $90,000 $100,000 $110,000 $120,000 $130,000 $140,000 4Q18 4Q19 4Q20 TCE TBV/Share (1) See Non-GAAP reconciliation |
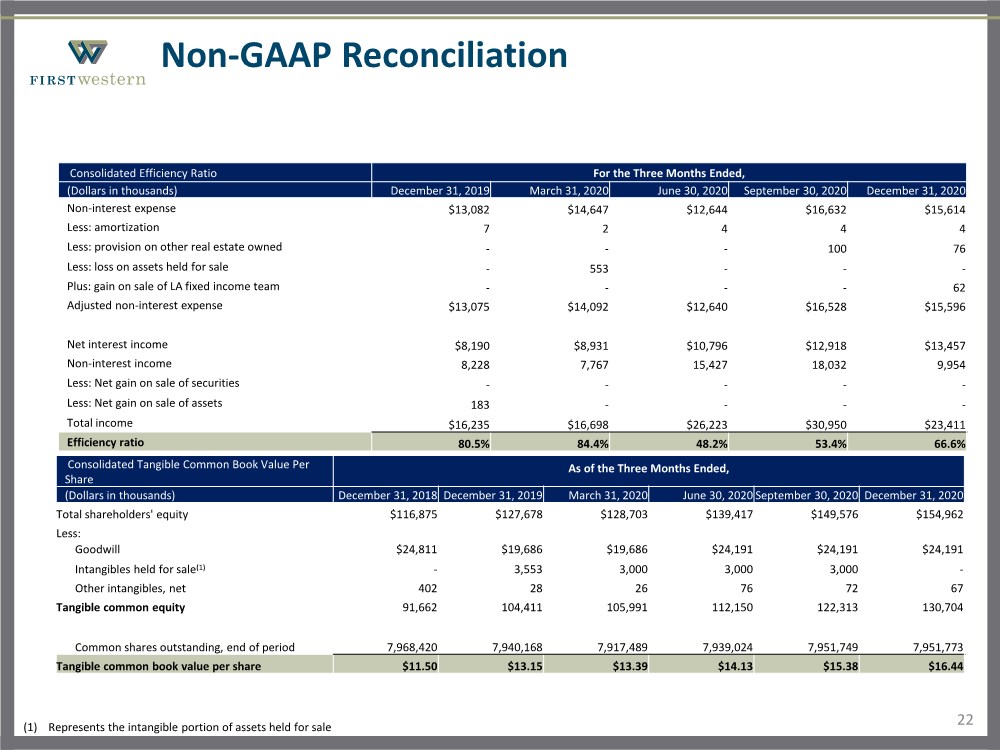
| 22 Non-GAAP Reconciliation Consolidated Efficiency Ratio For the Three Months Ended, (Dollars in thousands) December 31, 2019 March 31, 2020 June 30, 2020 September 30, 2020 December 31, 2020 Non-interest expense $13,082 $14,647 $12,644 $16,632 $15,614 Less: amortization 7 2 4 4 4 Less: provision on other real estate owned --- 100 76 Less: loss on assets held for sale - 553 --- Plus: gain on sale of LA fixed income team ---- 62 Adjusted non-interest expense $13,075 $14,092 $12,640 $16,528 $15,596 Net interest income $8,190 $8,931 $10,796 $12,918 $13,457 Non-interest income 8,228 7,767 15,427 18,032 9,954 Less: Net gain on sale of securities ----- Less: Net gain on sale of assets 183 ---- Total income $16,235 $16,698 $26,223 $30,950 $23,411 Efficiency ratio 80.5% 84.4% 48.2% 53.4% 66.6% Consolidated Tangible Common Book Value Per Share As of the Three Months Ended, (Dollars in thousands) December 31, 2018 December 31, 2019 March 31, 2020 June 30, 2020 September 30, 2020 December 31, 2020 Total shareholders' equity $116,875 $127,678 $128,703 $139,417 $149,576 $154,962 Less: Goodwill $24,811 $19,686 $19,686 $24,191 $24,191 $24,191 Intangibles held for sale(1) - 3,553 3,000 3,000 3,000 - Other intangibles, net 402 28 26 76 72 67 Tangible common equity 91,662 104,411 105,991 112,150 122,313 130,704 Common shares outstanding, end of period 7,968,420 7,940,168 7,917,489 7,939,024 7,951,749 7,951,773 Tangible common book value per share $11.50 $13.15 $13.39 $14.13 $15.38 $16.44 (1) Represents the intangible portion of assets held for sale |
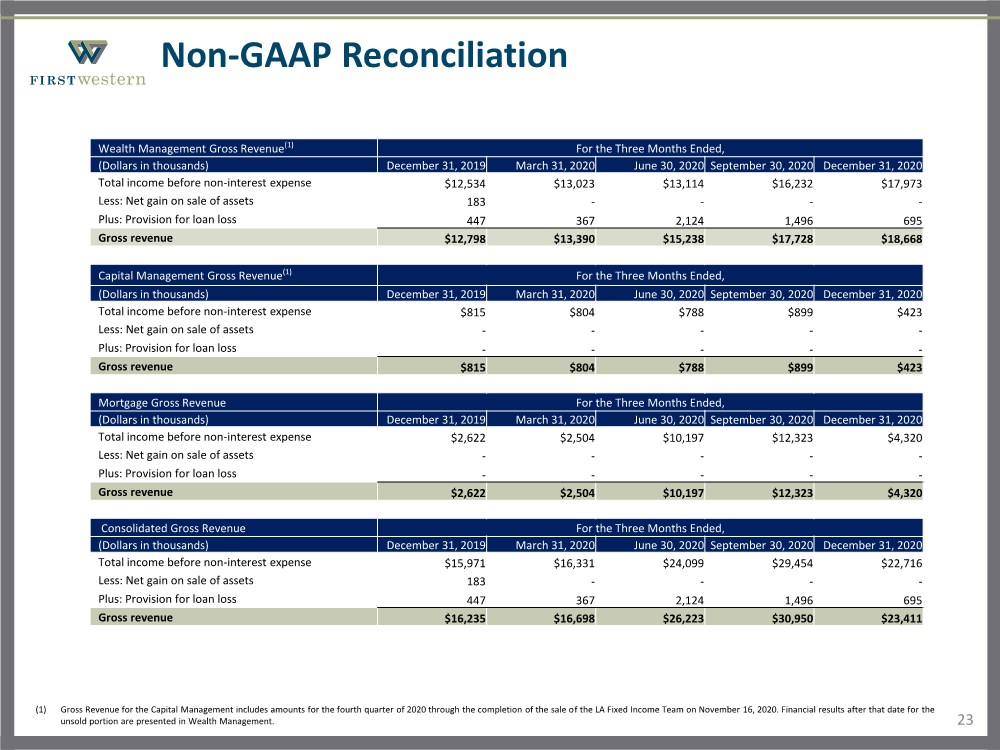
| 23 Non-GAAP Reconciliation Wealth Management Gross Revenue(1) For the Three Months Ended, (Dollars in thousands) December 31, 2019 March 31, 2020 June 30, 2020 September 30, 2020 December 31, 2020 Total income before non-interest expense $12,534 $13,023 $13,114 $16,232 $17,973 Less: Net gain on sale of assets 183 ---- Plus: Provision for loan loss 447 367 2,124 1,496 695 Gross revenue $12,798 $13,390 $15,238 $17,728 $18,668 Capital Management Gross Revenue(1) For the Three Months Ended, (Dollars in thousands) December 31, 2019 March 31, 2020 June 30, 2020 September 30, 2020 December 31, 2020 Total income before non-interest expense $815 $804 $788 $899 $423 Less: Net gain on sale of assets ----- Plus: Provision for loan loss ----- Gross revenue $815 $804 $788 $899 $423 Mortgage Gross Revenue For the Three Months Ended, (Dollars in thousands) December 31, 2019 March 31, 2020 June 30, 2020 September 30, 2020 December 31, 2020 Total income before non-interest expense $2,622 $2,504 $10,197 $12,323 $4,320 Less: Net gain on sale of assets ----- Plus: Provision for loan loss ----- Gross revenue $2,622 $2,504 $10,197 $12,323 $4,320 Consolidated Gross Revenue For the Three Months Ended, (Dollars in thousands) December 31, 2019 March 31, 2020 June 30, 2020 September 30, 2020 December 31, 2020 Total income before non-interest expense $15,971 $16,331 $24,099 $29,454 $22,716 Less: Net gain on sale of assets 183 ---- Plus: Provision for loan loss 447 367 2,124 1,496 695 Gross revenue $16,235 $16,698 $26,223 $30,950 $23,411 (1) Gross Revenue for the Capital Management includes amounts for the fourth quarter of 2020 through the completion of the sale of the LA Fixed Income Team on November 16, 2020. Financial results after that date for the unsold portion are presented in Wealth Management. |
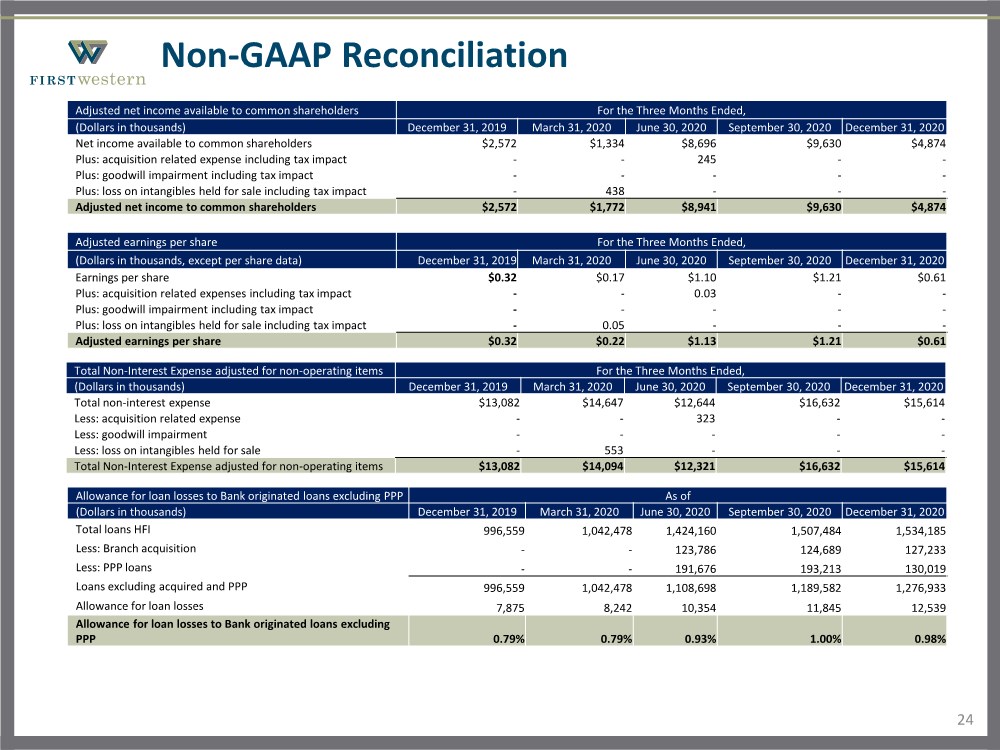
| 24 Non-GAAP Reconciliation Adjusted net income available to common shareholders For the Three Months Ended, (Dollars in thousands) December 31, 2019 March 31, 2020 June 30, 2020 September 30, 2020 December 31, 2020 Net income available to common shareholders $2,572 $1,334 $8,696 $9,630 $4,874 Plus: acquisition related expense including tax impact -- 245 -- Plus: goodwill impairment including tax impact ----- Plus: loss on intangibles held for sale including tax impact - 438 --- Adjusted net income to common shareholders $2,572 $1,772 $8,941 $9,630 $4,874 Adjusted earnings per share For the Three Months Ended, (Dollars in thousands, except per share data) December 31, 2019 March 31, 2020 June 30, 2020 September 30, 2020 December 31, 2020 Earnings per share $0.32 $0.17 $1.10 $1.21 $0.61 Plus: acquisition related expenses including tax impact -- 0.03 -- Plus: goodwill impairment including tax impact ----- Plus: loss on intangibles held for sale including tax impact - 0.05 --- Adjusted earnings per share $0.32 $0.22 $1.13 $1.21 $0.61 Allowance for loan losses to Bank originated loans excluding PPP As of (Dollars in thousands) December 31, 2019 March 31, 2020 June 30, 2020 September 30, 2020 December 31, 2020 Total loans HFI 996,559 1,042,478 1,424,160 1,507,484 1,534,185 Less: Branch acquisition -- 123,786 124,689 127,233 Less: PPP loans -- 191,676 193,213 130,019 Loans excluding acquired and PPP 996,559 1,042,478 1,108,698 1,189,582 1,276,933 Allowance for loan losses 7,875 8,242 10,354 11,845 12,539 Allowance for loan losses to Bank originated loans excluding PPP 0.79% 0.79% 0.93% 1.00% 0.98% Total Non-Interest Expense adjusted for non-operating items For the Three Months Ended, (Dollars in thousands) December 31, 2019 March 31, 2020 June 30, 2020 September 30, 2020 December 31, 2020 Total non-interest expense $13,082 $14,647 $12,644 $16,632 $15,614 Less: acquisition related expense -- 323 -- Less: goodwill impairment ----- Less: loss on intangibles held for sale - 553 --- Total Non-Interest Expense adjusted for non-operating items $13,082 $14,094 $12,321 $16,632 $15,614 |
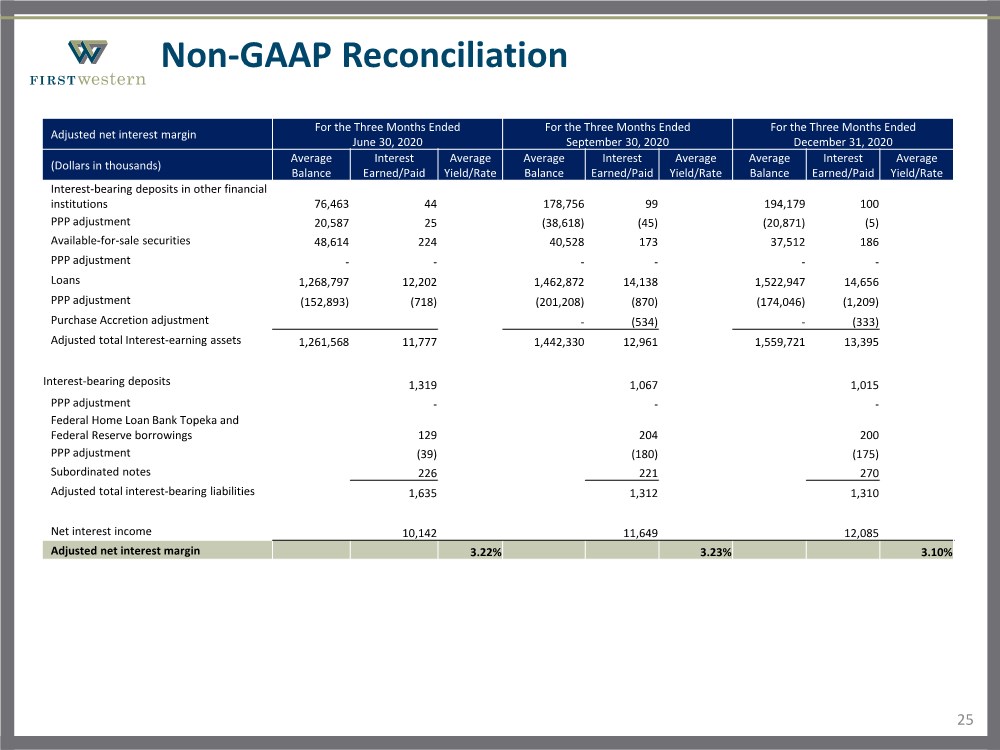
| 25 Non-GAAP Reconciliation Adjusted net interest margin For the Three Months Ended June 30, 2020 For the Three Months Ended September 30, 2020 For the Three Months Ended December 31, 2020 (Dollars in thousands) Average Balance Interest Earned/Paid Average Yield/Rate Average Balance Interest Earned/Paid Average Yield/Rate Average Balance Interest Earned/Paid Average Yield/Rate Interest-bearing deposits in other financial institutions 76,463 44 178,756 99 194,179 100 PPP adjustment 20,587 25 (38,618) (45) (20,871) (5) Available-for-sale securities 48,614 224 September 40,528 173 37,512 186 PPP adjustment ------ Loans 1,268,797 12,202 1,462,872 14,138 1,522,947 14,656 PPP adjustment (152,893) (718) (201,208) (870) (174,046) (1,209) Purchase Accretion adjustment -(534) -(333) Adjusted total Interest-earning assets 1,261,568 11,777 1,442,330 12,961 1,559,721 13,395 Interest-bearing deposits 1,319 1,067 1,015 PPP adjustment --- Federal Home Loan Bank Topeka and Federal Reserve borrowings 129 204 200 PPP adjustment (39) (180) (175) Subordinated notes 226 221 270 Adjusted total interest-bearing liabilities 1,635 1,312 1,310 Net interest income 10,142 11,649 12,085 Adjusted net interest margin 3.22% 3.23% 3.10% |