Attached files
| file | filename |
|---|---|
| 8-K - 8-K - CBTX, Inc. | cbtx-20210127x8k.htm |
Exhibit 99.1
| CBTX, Inc. Investor Presentation Fourth Quarter 2020 NASDAQ: CBTX |
| 2 SAFE HARBOR STATEMENT AND NON-GAAP FINANCIAL MEASURES NON-GAAP FINANCIAL MEASURES This presentation contains certain non-GAAP (generally accepted accounting principles) financial measures, including tangible equity, tangible assets, tangible book value per share, tangible equity to tangible assets, return on average tangible equity, and pre-provision net revenue. The non-GAAP financial measures that CBTX, Inc.(the “Company”) discusses in this presentation should not be considered in isolation or as a substitute for the most directly comparable or other financial measures calculated in accordance with GAAP.A reconciliation of the non-GAAP financial measures used in this presentation to the most directly comparable GAAP measures is provided at the end of this presentation. FORWARD-LOOKING STATEMENTS This presentation may contain certain forward-looking statements within the meaning of the securities laws that are based on various facts and derived utilizing important assumptions, current expectations, estimates and projections about the Company and its subsidiary. Forward-looking statements include information regarding the Company’s future financial performance, business and growth strategy, projected plans and objectives, as well as projections of macroeconomic and industry trends, which are inherently unreliable due to the multiple factors that impact economic trends, and any such variations may be material. Statements preceded by, followed by or that otherwise include the words “believes,” “expects,” “anticipates,” “intends,” “projects,” “estimates,” “plans” and similar expressions or future or conditional verbs such as “will,” “should,” “would,” “may” and “could” are generally forward-looking in nature and not historical facts, although not all forward-looking statements include the foregoing. Further, certain factors that could affect our future results and cause actual results to differ materially from those expressed in the forward-looking statements include, but are not limited to: whether the Company can manage the economic risks related to the impact of COVID-19 and the sustained instability in the oil and gas industry (including risks related to its customers’ credit quality, deferrals and modifications to loans, the Company’s ability to borrow, and the impact of a resultant recession generally), and other hazards such as natural disasters and adverse weather, acts of war or terrorism, other pandemics, an outbreak of hostilities or other international or domestic calamities and the governmental or military response thereto, and other matters beyond the Company’s control; the geographic concentration of our markets in Beaumont and Houston, Texas; whether the Company can manage changes and the continued health or availability of management personnel; the amount of nonperforming and classified assets that the Company holds and the efforts to resolve the nonperforming assets; deterioration of the Company’s asset quality; interest rate risks associated with the Company’s business; business and economic conditions generally and in the financial services industry, nationally and within the Company’s primary markets; volatility and direction of oil prices, including risks related to the instability of oil prices, and the strength of the energy industry, generally and within Texas; the composition of the Company’s loan portfolio, including the identity of its borrowers and the concentration of loans in specialized industries, especially the creditworthiness of energy company and commercial real estate borrowers; changes in the value of collateral securing the loans; the Company’s ability to maintain important deposit customer relationships and the Company’s reputation; the Company’s ability to maintain effective internal control over financial reporting; the Company’s ability to pursue available remedies in the event of a loan default for loans under the Paycheck Protection Program, or PPP, and the risk of holding the PPP loans at unfavorable interest rates as compared to the loans to customers that we would have otherwise lent to; the volatility and direction of market interest rates; liquidity risks associated with the Company’s business; systems failures, interruptions or breaches involving the Company’s information technology and telecommunications systems or third-party servicers; the failure of certain third party vendors to perform; the initiation and outcome of litigation and other legal proceedings against the Company or to which it may become subject; operational risks associated with the Company’s business; the costs, effects and results of regulatory examinations, investigations, including the ongoing investigation by the Financial Crimes Enforcement Network, or FinCEN, of the U.S. Department of Treasury, or reviews or the ability to obtain the required regulatory approvals; the Company’s ability to meet the requirements of its Formal Agreement with the Office of the Comptroller of the Currency, and the risk that such Formal Agreement may have a negative impact on the Company’s financial performance and results of operations; changes in the laws, rules, regulations, interpretations or policies relating to financial institution, accounting, tax, trade, monetary and fiscal matters; governmental or regulatory responses to the COVID-19 pandemic and newly enacted fiscal stimulus that impact the Company’s loan portfolio and forbearance practice; and other governmental interventions in the U.S. financial system that may impact how the Company achieves its performance goals. Additionally, many of these risks and uncertainties are currently elevated by and may or will continue to be elevated by the COVID-19 pandemic. The foregoing factors should not be construed as exhaustive and should be read together with the other cautionary statements included in the Company’s Annual Report on Form 10-K, filed with the Securities and Exchange Commission, or SEC, and other reports and statements that the Company has filed with the SEC. If one or more events related to these or other risks or uncertainties materialize, or if the Company’s underlying assumptions prove to be incorrect, actual results may differ materially from what it anticipates. Accordingly, you should not place undue reliance on any such forward- looking statements. Any forward-looking statement speaks only as of the date on which it is made, and the Company does not undertake any obligation to publicly update or review any forward- looking statement, whether as a result of new information, future developments or otherwise. New factors emerge from time to time, and it is not possible for the Company to predict which will arise. In addition, the Company cannot assess the impact of each factor on its business or the extent to which any factor, or combination of factors, may cause actual results to differ materially from those contained in any forward-looking statements. Copies of the SEC filings for the Company are available for download free of charge from www.communitybankoftx.com under the Investor Relations tab. All forward-looking statements, expressed or implied, included in this communication are expressly qualified in their entirety by this cautionary statement. This cautionary statement should also be considered in connection with any subsequent written or oral forward-looking statements that the Company or persons acting on the Company’s behalf may issue. Annualized, pro forma, projected and estimated numbers are used for illustrative purpose only, are not forecasts and may not reflect actual results. |
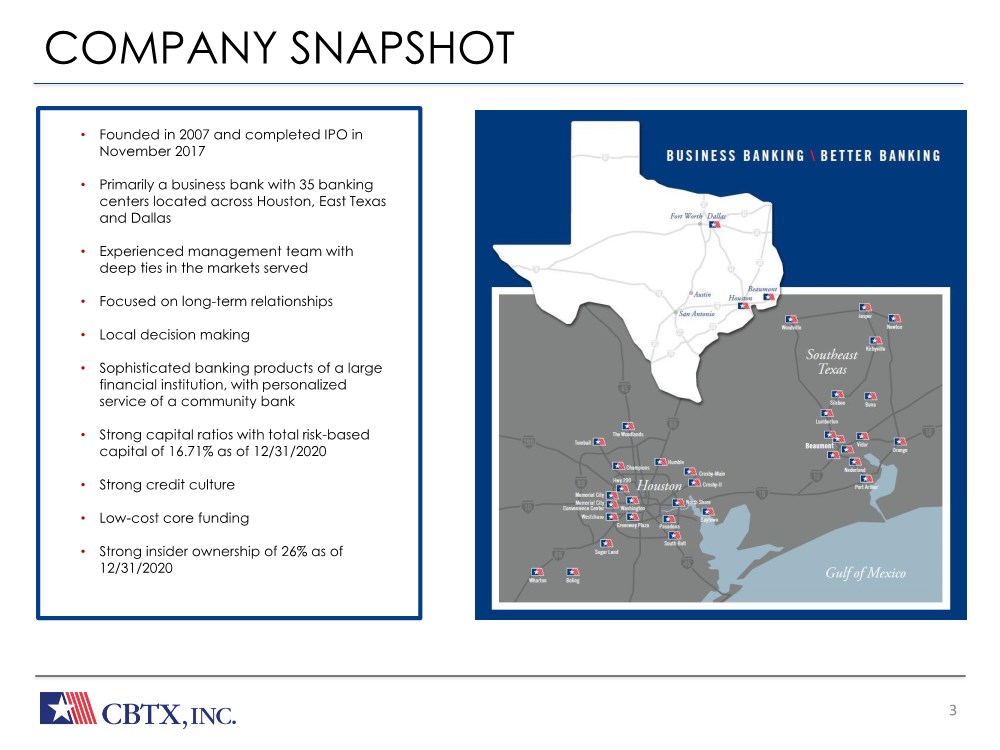
| The Bank Built or Business 3 • Gross loans increased from March by $269.4 million due to originations of $336.1 million of PPP loans during Q2 offset by paydowns/payoffs • Total commercial loans (1) were 86.7% of total loans at June 30, 2020 • At June 30, 2020, 76.4% of loans are Houston-based • Focused on lending to professionals and local small- and mid-sized businesses • At June 30, 2020, 6.1% of gross loans were related to oil and gas. See page 13. • Key emphasis on developing core relationships • Well-diversified loan portfolio • Founded in 2007 and completed IPO in November 2017 • Primarily a business bank with 35 banking centers located across Houston, East Texas and Dallas • Experienced management team with deep ties in the markets served • Focused on long-term relationships • Local decision making • Sophisticated banking products of a large financial institution, with personalized service of a community bank • Strong capital ratios with total risk-based capital of 16.71% as of 12/31/2020 • Strong credit culture • Low-cost core funding • Strong insider ownership of 26% as of 12/31/2020 COMPANY SNAPSHOT |
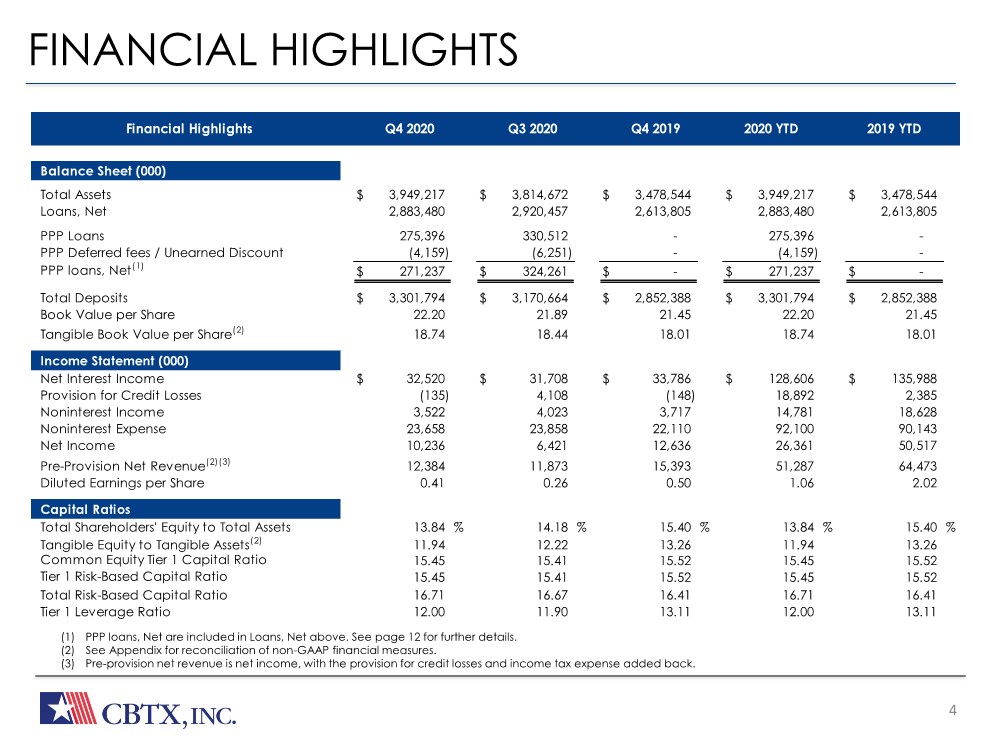
| 4 FINANCIAL HIGHLIGHTS (1) PPP loans, Net are included in Loans, Net above. See page 12 for further details. (2) See Appendix for reconciliation of non-GAAP financial measures. (3) Pre-provision net revenue is net income, with the provision for credit losses and income tax expense added back. Financial Highlights Q4 2020 Q3 2020 Q4 2019 2019 YTD 2020 YTD Balance Sheet (000) Total Assets $ 3,949,217 $ 3,814,672 $ 3,478,544 $ 3,949,217 $ 3,478,544 Loans, Net 2,883,480 2,920,457 2,613,805 2,883,480 2,613,805 PPP Loans 275,396 330,512 - 275,396 - PPP Deferred fees / Unearned Discount (4,159) (6,251) - (4,159) - PPP loans, Net(1) $ 271,237 $ 324,261 $ - $ 271,237 $ - Total Deposits $ 3,301,794 $ 3,170,664 $ 2,852,388 $ 3,301,794 $ 2,852,388 Book Value per Share 22.20 21.89 21.45 22.20 21.45 Tangible Book Value per Share(2) 18.74 18.44 18.01 18.74 18.01 Income Statement (000) Net Interest Income $ 32,520 $ 31,708 $ 33,786 $ 128,606 $ 135,988 Provision for Credit Losses (135) 4,108 (148) 18,892 2,385 Noninterest Income 3,522 4,023 3,717 14,781 18,628 Noninterest Expense 23,658 23,858 22,110 92,100 90,143 Net Income 10,236 6,421 12,636 26,361 50,517 Pre-Provision Net Revenue(2)(3) 12,384 11,873 15,393 51,287 64,473 Diluted Earnings per Share 0.41 0.26 0.50 1.06 2.02 Capital Ratios Total Shareholders' Equity to Total Assets 13.84 % 14.18 % 15.40 % 13.84 % 15.40 % Tangible Equity to Tangible Assets(2) 11.94 12.22 13.26 11.94 13.26 Common Equity Tier 1 Capital Ratio 15.45 15.41 15.52 15.45 15.52 Tier 1 Risk-Based Capital Ratio 15.45 15.41 15.52 15.45 15.52 Total Risk-Based Capital Ratio 16.71 16.67 16.41 16.71 16.41 Tier 1 Leverage Ratio 12.00 11.90 13.11 12.00 13.11 |
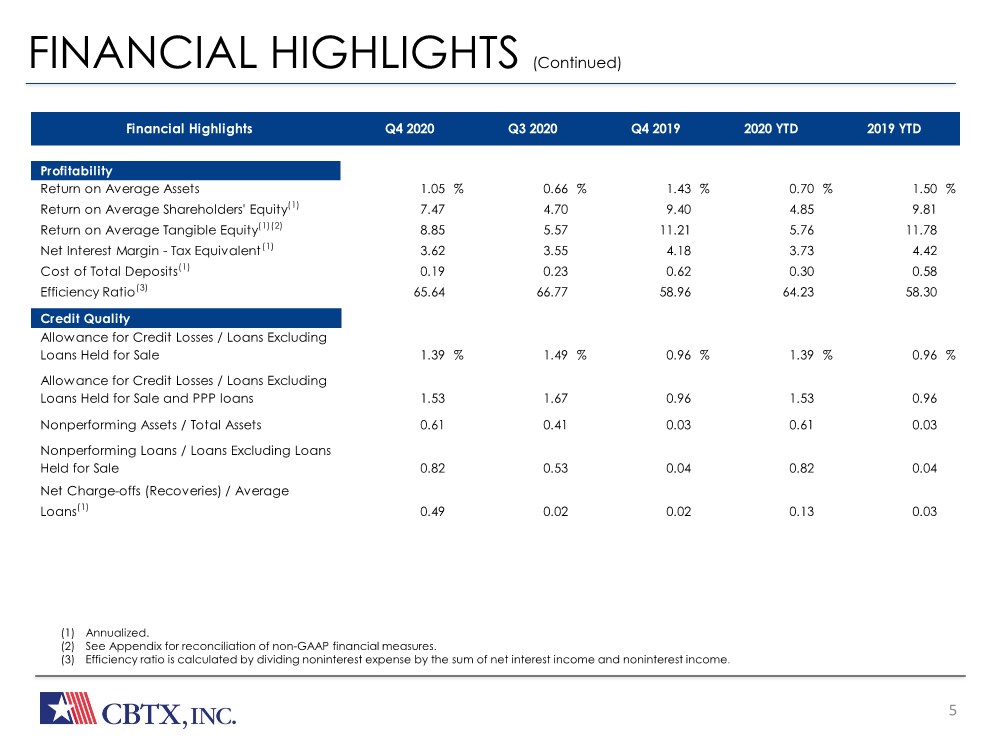
| 5 FINANCIAL HIGHLIGHTS (Continued) (1) Annualized. (2) See Appendix for reconciliation of non-GAAP financial measures. (3) Efficiency ratio is calculated by dividing noninterest expense by the sum of net interest income and noninterest income. Financial Highlights Q4 2020 Q3 2020 Q4 2019 2020 YTD 2019 YTD Profitability Return on Average Assets 1.05 % 0.66 % 1.43 % 0.70 % 1.50 % Return on Average Shareholders' Equity(1) 7.47 4.70 9.40 4.85 9.81 Return on Average Tangible Equity(1)(2) 8.85 5.57 11.21 5.76 11.78 Net Interest Margin - Tax Equivalent(1) 3.62 3.55 4.18 3.73 4.42 Cost of Total Deposits(1) 0.19 0.23 0.62 0.30 0.58 Efficiency Ratio(3) 65.64 66.77 58.96 64.23 58.30 Credit Quality Allowance for Credit Losses / Loans Excluding Loans Held for Sale 1.39 % 1.49 % 0.96 % 1.39 % 0.96 % Allowance for Credit Losses / Loans Excluding Loans Held for Sale and PPP loans 1.53 1.67 0.96 1.53 0.96 Nonperforming Assets / Total Assets 0.61 0.41 0.03 0.61 0.03 Nonperforming Loans / Loans Excluding Loans Held for Sale 0.82 0.53 0.04 0.82 0.04 Net Charge-offs (Recoveries) / Average Loans(1) 0.49 0.02 0.02 0.13 0.03 |
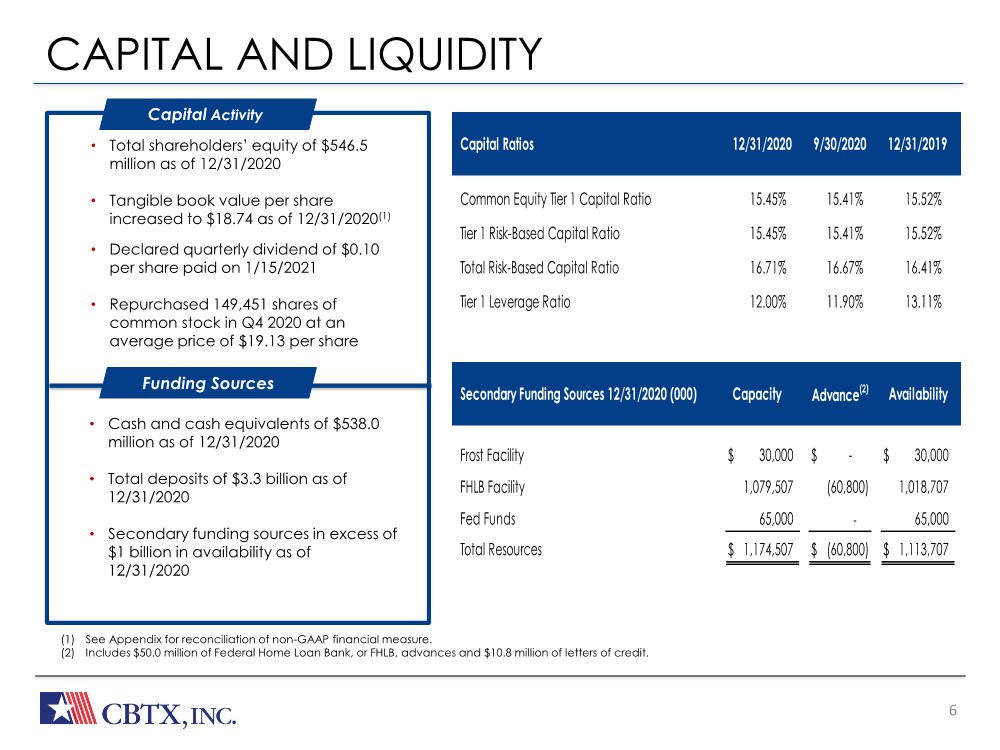
| The Bank Built or Business CAPITAL AND LIQUIDITY 6 REVENUE GROWH • Stable net interest margin (NIM) • Asset sensitive, with 54% variable rate loans as of March 31, 2020 • Increasing revenue and improving efficiency ratio (2) (1) See Appendix for reconciliation of non-GAAP financial measure. (2) Includes $50.0 million of Federal Home Loan Bank, or FHLB, advances and $10.8 million of letters of credit. • Total shareholders’ equity of $546.5 million as of 12/31/2020 • Tangible book value per share increased to $18.74 as of 12/31/2020(1) • Declared quarterly dividend of $0.10 per share paid on 1/15/2021 • Repurchased 149,451 shares of common stock in Q4 2020 at an average price of $19.13 per share Capital Activity • Cash and cash equivalents of $538.0 million as of 12/31/2020 • Total deposits of $3.3 billion as of 12/31/2020 • Secondary funding sources in excess of $1 billion in availability as of 12/31/2020 Funding Sources Secondary Funding Sources 12/31/2020 (000) Frost Facility $ 30,000 $ - $ 30,000 FHLB Facility 1,079,507 (60,800) 1,018,707 Fed Funds 65,000 - 65,000 Total Resources $ 1,174,507 $ (60,800) $ 1,113,707 Capacity Advance(2) Availability Capital Ratios Common Equity Tier 1 Capital Ratio 15.45% 15.41% 15.52% Tier 1 Risk-Based Capital Ratio 15.45% 15.41% 15.52% Total Risk-Based Capital Ratio 16.71% 16.67% 16.41% Tier 1 Leverage Ratio 12.00% 11.90% 13.11% 12/31/2020 9/30/2020 12/31/2019 |
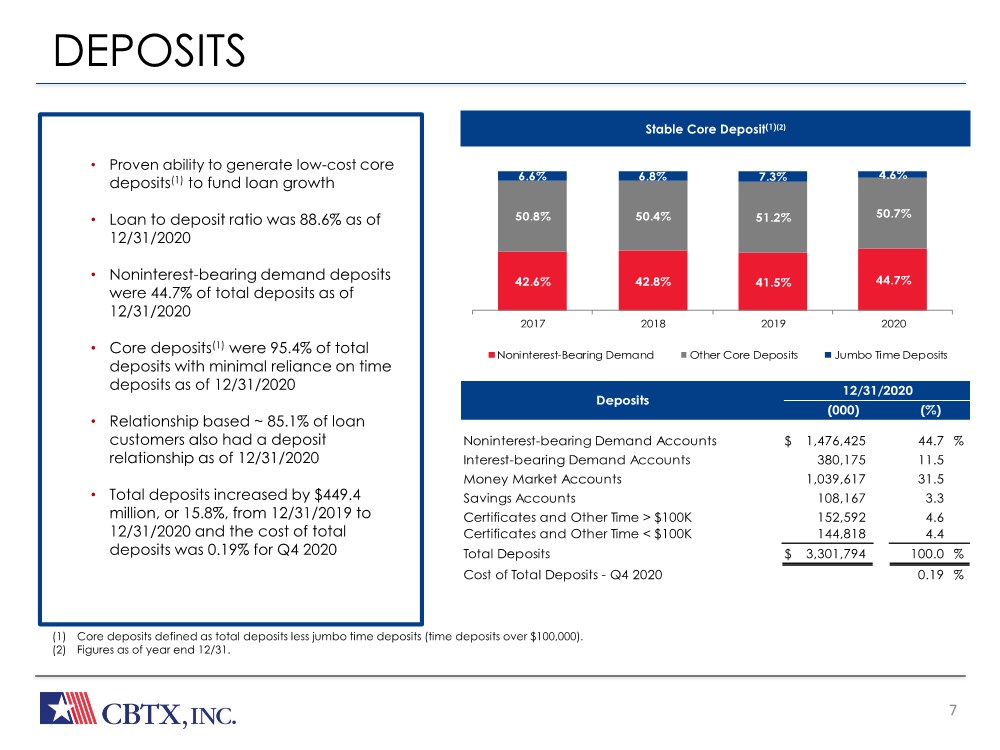
| The Bank Built or Business 7 Stable Core Deposit(1)(2) (1) Core deposits defined as total deposits less jumbo time deposits (time deposits over $100,000). (2) Figures as of year end 12/31. DEPOSITS • Gross loans increased from March by $269.4 million due to originations of $336.1 million of PPP loans during Q2 offset by paydowns/payoffs • Total commercial loans (1) were 86.7% of total loans at June 30, 2020 • At June 30, 2020, 76.4% of loans are Houston-based • Focused on lending to professionals and local small- and mid-sized businesses • At June 30, 2020, 6.1% of gross loans were related to oil and gas. See page 13. • Key emphasis on developing core relationships • Well-diversified loan portfolio • Proven ability to generate low-cost core deposits(1) to fund loan growth • Loan to deposit ratio was 88.6% as of 12/31/2020 • Noninterest-bearing demand deposits were 44.7% of total deposits as of 12/31/2020 • Core deposits(1) were 95.4% of total deposits with minimal reliance on time deposits as of 12/31/2020 • Relationship based ~ 85.1% of loan customers also had a deposit relationship as of 12/31/2020 • Total deposits increased by $449.4 million, or 15.8%, from 12/31/2019 to 12/31/2020 and the cost of total deposits was 0.19% for Q4 2020 (%) (000) Deposits 12/31/2020 42.6% 42.8% 41.5% 44.7% 50.8% 50.4% 51.2% 50.7% 6.6% 6.8% 7.3% 4.6% 2017 2018 2019 2020 Noninterest-Bearing Demand Other Core Deposits Jumbo Time Deposits Noninterest-bearing Demand Accounts $ 1,476,425 44.7 % Interest-bearing Demand Accounts 380,175 11.5 Money Market Accounts 1,039,617 31.5 Savings Accounts 108,167 3.3 Certificates and Other Time > $100K 152,592 4.6 Certificates and Other Time < $100K 144,818 4.4 Total Deposits $ 3,301,794 100.0 % Cost of Total Deposits - Q4 2020 0.19 % |
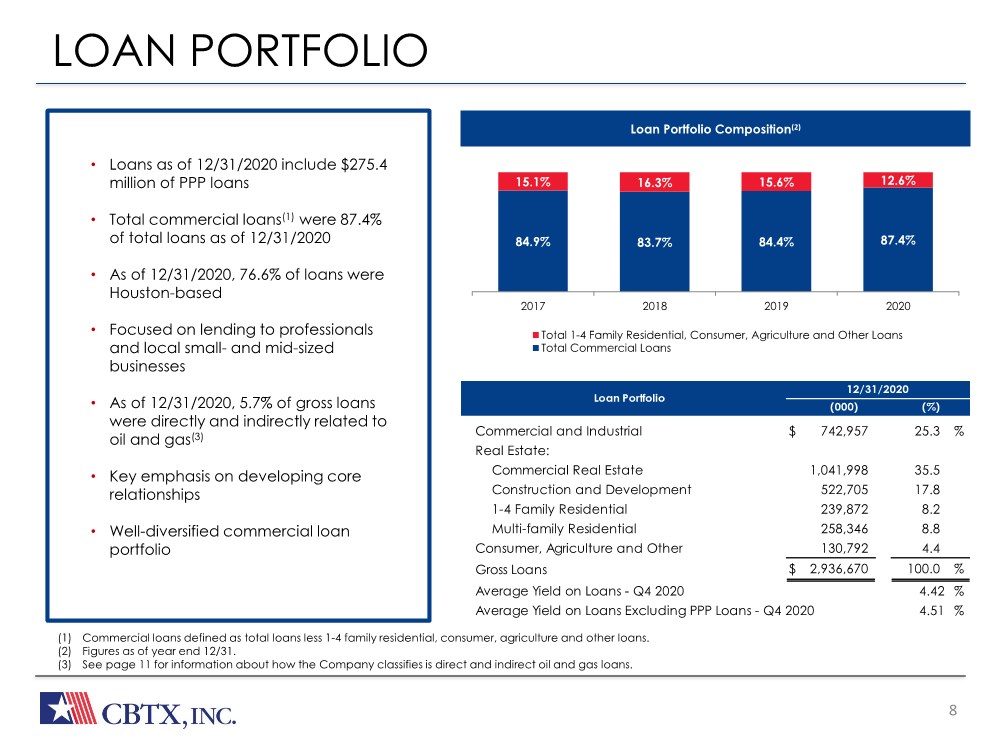
| The Bank Built or Business 8 Loan Portfolio Composition(2) (1) Commercial loans defined as total loans less 1-4 family residential, consumer, agriculture and other loans. (2) Figures as of year end 12/31. (3) See page 11 for information about how the Company classifies is direct and indirect oil and gas loans. LOAN PORTFOLIO • Gross loans increased from March by $269.4 million due to originations of $336.1 million of PPP loans during Q2 offset by paydowns/payoffs • Total commercial loans (1) were 86.7% of total loans at June 30, 2020 • At June 30, 2020, 76.4% of loans are Houston-based • Focused on lending to professionals and local small- and mid-sized businesses • At June 30, 2020, 6.1% of gross loans were related to oil and gas. See page 13. • Key emphasis on developing core relationships • Well-diversified loan portfolio • Loans as of 12/31/2020 include $275.4 million of PPP loans • Total commercial loans(1) were 87.4% of total loans as of 12/31/2020 • As of 12/31/2020, 76.6% of loans were Houston-based • Focused on lending to professionals and local small- and mid-sized businesses • As of 12/31/2020, 5.7% of gross loans were directly and indirectly related to oil and gas(3) • Key emphasis on developing core relationships • Well-diversified commercial loan portfolio 84.9% 83.7% 84.4% 87.4% 15.1% 16.3% 15.6% 12.6% 2017 2018 2019 2020 Total 1-4 Family Residential, Consumer, Agriculture and Other Loans Total Commercial Loans (%) Loan Portfolio (000) 12/31/2020 Commercial and Industrial $ 742,957 25.3 % Real Estate: Commercial Real Estate 1,041,998 35.5 Construction and Development 522,705 17.8 1-4 Family Residential 239,872 8.2 Multi-family Residential 258,346 8.8 Consumer, Agriculture and Other 130,792 4.4 Gross Loans $ 2,936,670 100.0 % Average Yield on Loans - Q4 2020 4.42 % Average Yield on Loans Excluding PPP Loans - Q4 2020 4.51 % |
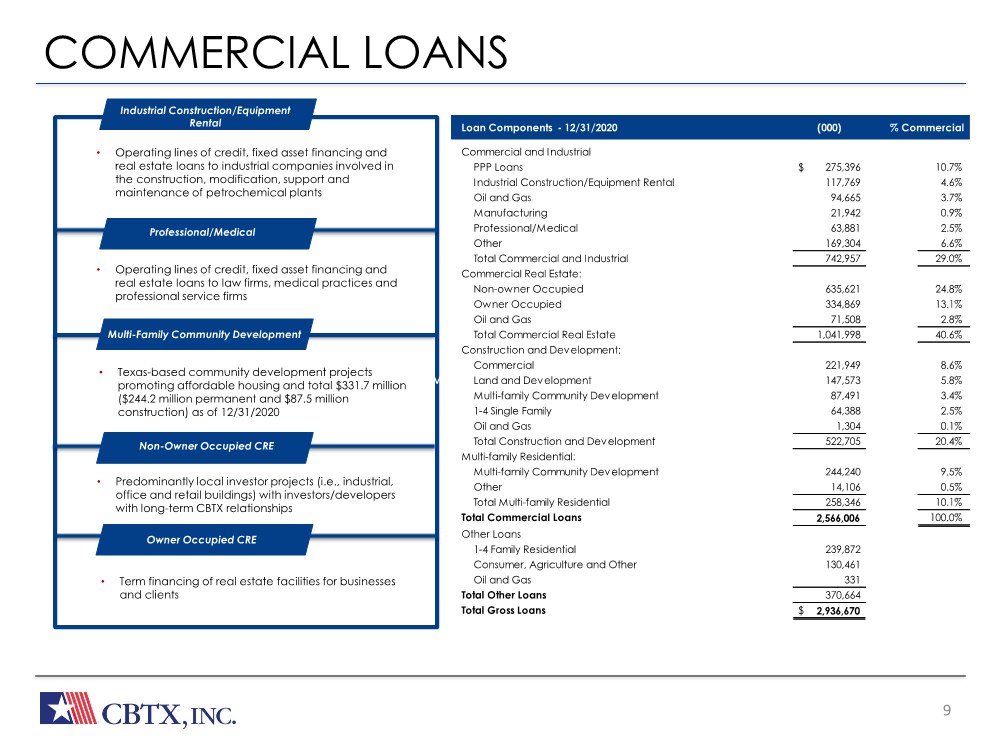
| The Bank Built or Business COMMERCIAL LOANS 9 Multi-family ($418M) • Operating lines of credit, fixed asset financing and real estate loans to industrial companies involved in the construction, modification, support and maintenance of petrochemical plants Industrial Construction/Equipment Rental Multi-Family Community Development • Operating lines of credit, fixed asset financing and real estate loans to law firms, medical practices and professional service firms • Texas-based community development projects promoting affordable housing and total $331.7 million ($244.2 million permanent and $87.5 million construction) as of 12/31/2020 • Predominantly local investor projects (i.e., industrial, office and retail buildings) with investors/developers with long-term CBTX relationships • Term financing of real estate facilities for businesses and clients Professional/Medical Non-Owner Occupied CRE Owner Occupied CRE Loan Components - 12/31/2020 T Commercial and Industrial PPP Loans $ 275,396 10.7% Industrial Construction/Equipment Rental 117,769 4.6% Oil and Gas 94,665 3.7% Manufacturing 21,942 0.9% Professional/Medical 63,881 2.5% Other 169,304 6.6% Total Commercial and Industrial 742,957 29.0% Commercial Real Estate: Non-owner Occupied 635,621 24.8% Owner Occupied 334,869 13.1% Oil and Gas 71,508 2.8% Total Commercial Real Estate 1,041,998 40.6% Construction and Development: Commercial 221,949 8.6% Land and Development 147,573 5.8% Multi-family Community Development 87,491 3.4% 1-4 Single Family 64,388 2.5% Oil and Gas 1,304 0.1% Total Construction and Development 522,705 20.4% Multi-family Residential: Multi-family Community Development 244,240 9.5% Other 14,106 0.5% Total Multi-family Residential 258,346 10.1% Total Commercial Loans 2,566,006 100.0% Other Loans 1-4 Family Residential 239,872 Consumer, Agriculture and Other 130,461 Oil and Gas 331 Total Other Loans 370,664 Total Gross Loans $ 2,936,670 (000) % Commercial |
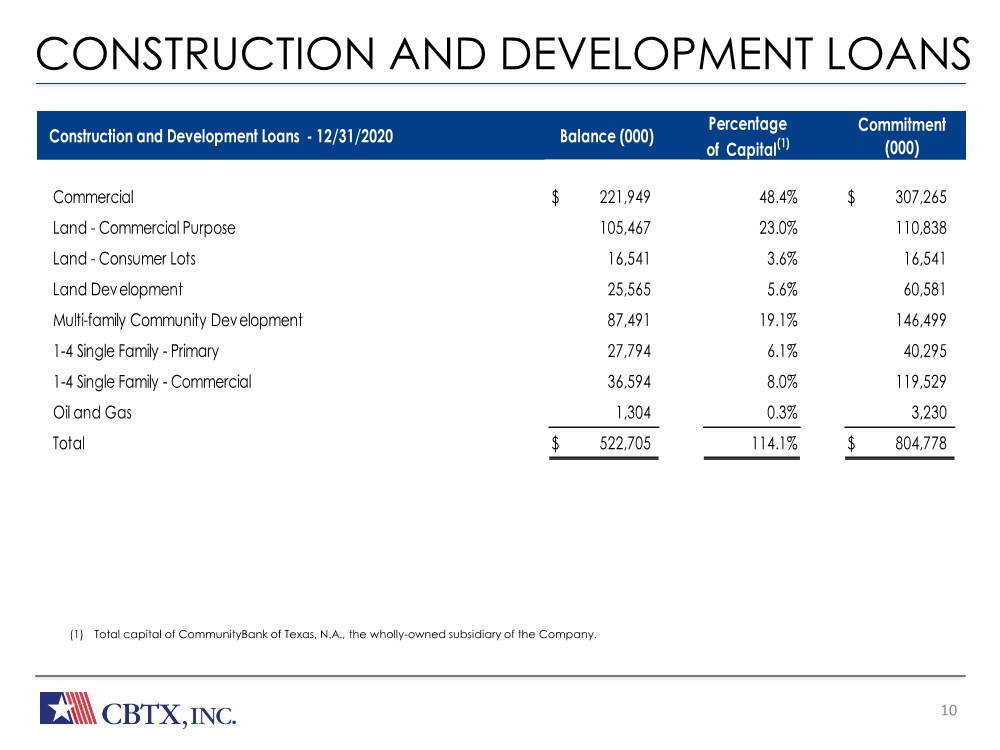
| The Bank Built or Business CONSTRUCTION AND DEVELOPMENT LOANS 10 (1) Total capital of CommunityBank of Texas, N.A., the wholly-owned subsidiary of the Company. Construction and Development Loans - 12/31/2020 Balance (000) Percentage of Capital(1) Commitment (000) Commercial $ 221,949 48.4% $ 307,265 Land - Commercial Purpose 105,467 23.0% 110,838 Land - Consumer Lots 16,541 3.6% 16,541 Land Development 25,565 5.6% 60,581 Multi-family Community Development 87,491 19.1% 146,499 1-4 Single Family - Primary 27,794 6.1% 40,295 1-4 Single Family - Commercial 36,594 8.0% 119,529 Oil and Gas 1,304 0.3% 3,230 Total $ 522,705 114.1% $ 804,778 |
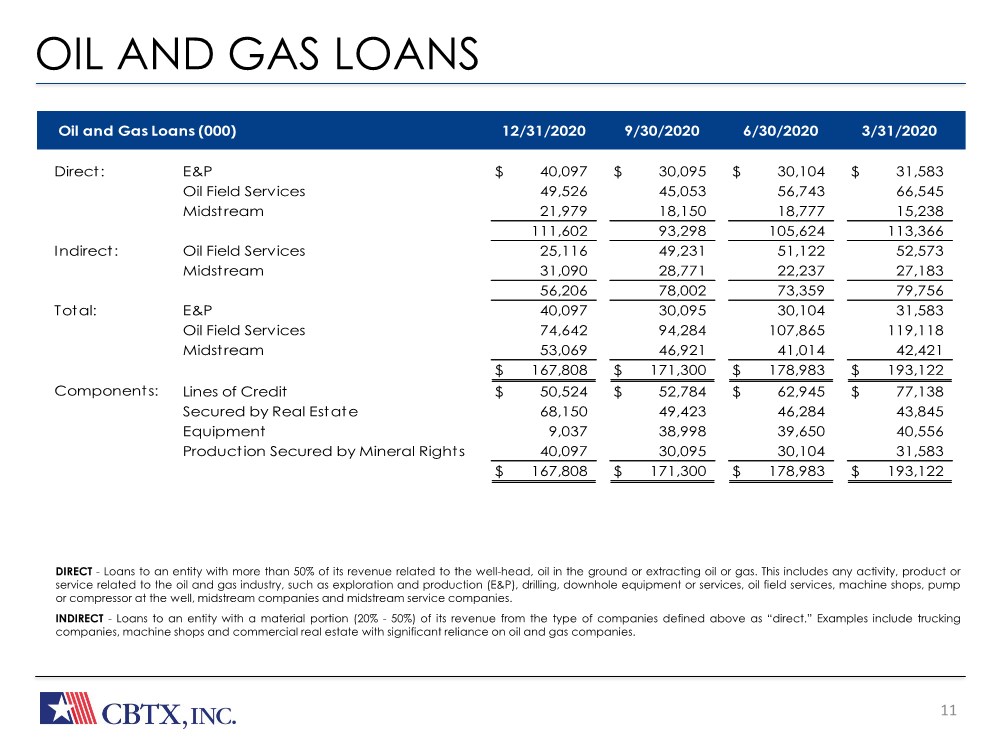
| The Bank Built or Business OIL AND GAS LOANS 11 • DIRECT - Loans to an entity with more than 50% of its revenue related to the well-head, oil in the ground or extracting oil or gas. This includes any activity, product or service related to the oil and gas industry, such as exploration and production (E&P), drilling, downhole equipment or services, oil field services, machine shops, pump or compressor at the well, midstream companies and midstream service companies. • INDIRECT - Loans to an entity with a material portion (20%- 50%) of its revenue from the type of companies defined above as “direct.” Examples include trucking companies, machine shops and commercial real estate with significant reliance on oil and gas companies. Direct: E&P $ 40,097 $ 30,095 $ 30,104 $ 31,583 Oil Field Services 49,526 45,053 56,743 66,545 Midstream 21,979 18,150 18,777 15,238 111,602 93,298 105,624 113,366 Indirect: Oil Field Services 25,116 49,231 51,122 52,573 Midstream 31,090 28,771 22,237 27,183 56,206 78,002 73,359 79,756 Total: E&P 40,097 30,095 30,104 31,583 Oil Field Services 74,642 94,284 107,865 119,118 Midstream 53,069 46,921 41,014 42,421 $ 167,808 $ 171,300 $ 178,983 $ 193,122 Components: Lines of Credit $ 50,524 $ 52,784 $ 62,945 $ 77,138 Secured by Real Estate 68,150 49,423 46,284 43,845 Equipment 9,037 38,998 39,650 40,556 Production Secured by Mineral Rights 40,097 30,095 30,104 31,583 $ 167,808 $ 171,300 $ 178,983 $ 193,122 Oil and Gas Loans (000) 12/31/2020 9/30/2020 6/30/2020 3/31/2020 |
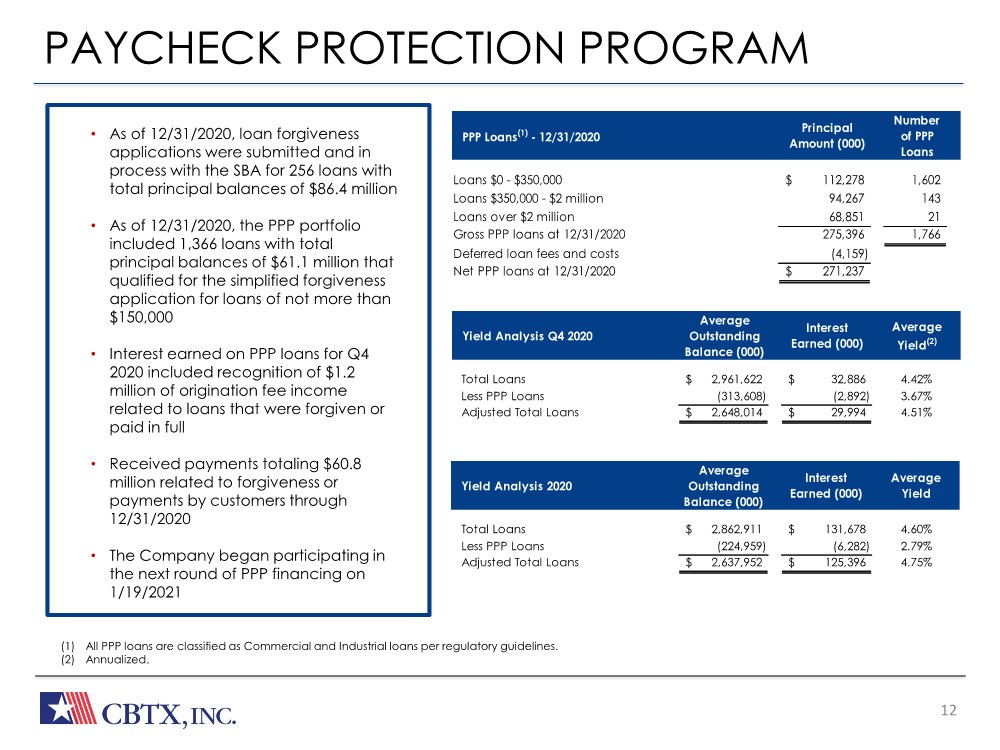
| 12 PAYCHECK PROTECTION PROGRAM (1) All PPP loans are classified as Commercial and Industrial loans per regulatory guidelines. (2) Annualized. • As of 12/31/2020, loan forgiveness applications were submitted and in process with the SBA for 256 loans with total principal balances of $86.4 million • As of 12/31/2020, the PPP portfolio included 1,366 loans with total principal balances of $61.1 million that qualified for the simplified forgiveness application for loans of not more than $150,000 • Interest earned on PPP loans for Q4 2020 included recognition of $1.2 million of origination fee income related to loans that were forgiven or paid in full • Received payments totaling $60.8 million related to forgiveness or payments by customers through 12/31/2020 • The Company began participating in the next round of PPP financing on 1/19/2021 Total Loans 2,961,622 $ 32,886 $ 4.42% Less PPP Loans (313,608) (2,892) 3.67% Adjusted Total Loans 2,648,014 $ 29,994 $ 4.51% Total Loans 2,862,911 $ 131,678 $ 4.60% Less PPP Loans (224,959) (6,282) 2.79% Adjusted Total Loans 2,637,952 $ 125,396 $ 4.75% Yield Analysis 2020 Average Outstanding Balance (000) Interest Earned (000) Average Yield Yield Analysis Q4 2020 Average Outstanding Balance (000) Interest Earned (000) Average Yield(2) PPP Loans(1) - 12/31/2020 Principal Amount (000) Number of PPP Loans Loans $0 - $350,000 112,278 $ 1,602 Loans $350,000 - $2 million 94,267 143 Loans over $2 million 68,851 21 Gross PPP loans at 12/31/2020 275,396 1,766 Deferred loan fees and costs (4,159) Net PPP loans at 12/31/2020 271,237 $ |
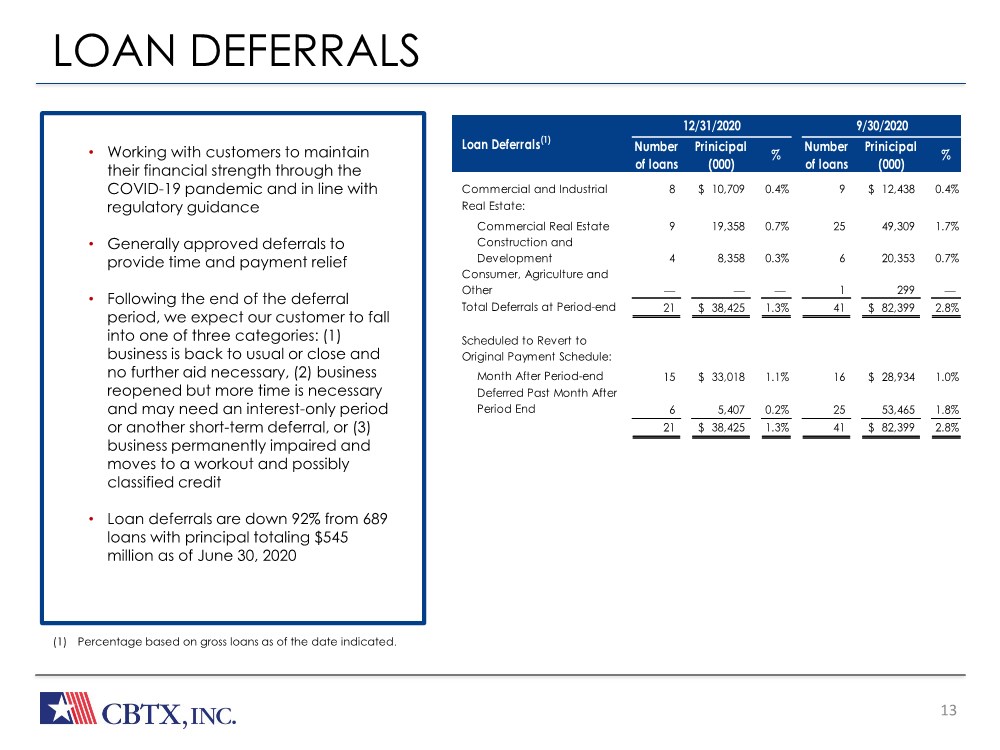
| The Bank Built or Business 13 LOAN DEFERRALS • Working with customers to maintain their financial strength through the COVID-19 pandemic and in line with regulatory guidance • Generally approved deferrals to provide time and payment relief • Following the end of the deferral period, we expect our customer to fall into one of three categories: (1) business is back to usual or close and no further aid necessary, (2) business reopened but more time is necessary and may need an interest-only period or another short-term deferral, or (3) business permanently impaired and moves to a workout and possibly classified credit • Loan deferrals are down 92% from 689 loans with principal totaling $545 million as of June 30, 2020 (1) Percentage based on gross loans as of the date indicated. Number of loans Prinicipal (000) % Number of loans Prinicipal (000) % Loan Deferrals(1) 12/31/2020 9/30/2020 Commercial and Industrial 8 10,709 $ 0.4% 9 12,438 $ 0.4% Real Estate: Commercial Real Estate 9 19,358 0.7% 25 49,309 1.7% Construction and Development 4 8,358 0.3% 6 20,353 0.7% Consumer, Agriculture and Other — — — 1 299 — Total Deferrals at Period-end 21 38,425 $ 1.3% 41 82,399 $ 2.8% Scheduled to Revert to Original Payment Schedule: Month After Period-end 15 33,018 $ 1.1% 16 28,934 $ 1.0% Deferred Past Month After Period End 6 5,407 0.2% 25 53,465 1.8% 21 38,425 $ 1.3% 41 82,399 $ 2.8% |
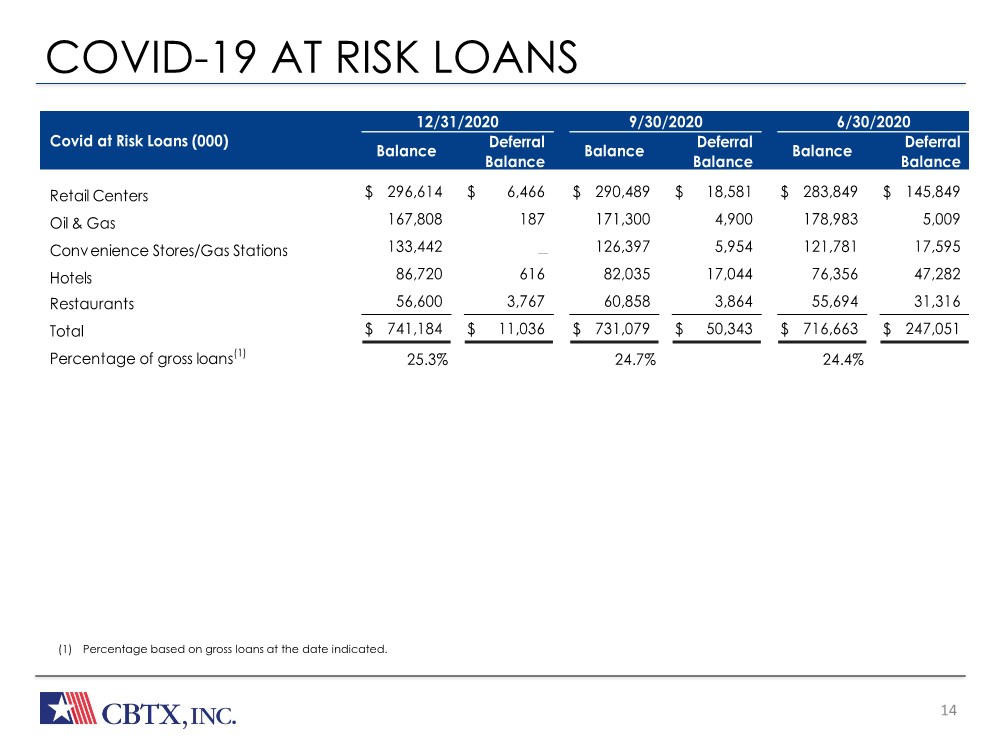
| The Bank Built or Business COVID-19 AT RISK LOANS 14 • Participating in the Paycheck Protection Program offered under the Cares Act •____ PPP loans outstanding, with average loan size of ___ • SBA origination fees of $11.2 M through 6/30/2020. • Processing additional applications (1) Percentage based on gross loans at the date indicated. Deferral Balance Deferral Balance Deferral Balance Retail Centers $ 296,614 $ 6,466 $ 290,489 $ 18,581 $ 283,849 $ 145,849 Oil & Gas 167,808 187 171,300 4,900 178,983 5,009 Convenience Stores/Gas Stations 133,442 — 126,397 5,954 121,781 17,595 Hotels 86,720 616 82,035 17,044 76,356 47,282 Restaurants 56,600 3,767 60,858 3,864 55,694 31,316 Total $ 741,184 $ 11,036 $ 731,079 $ 50,343 $ 716,663 $ 247,051 Percentage of gross loans(1) 25.3% 24.7% 24.4% 6/30/2020 Balance Covid at Risk Loans (000) Balance Balance 12/31/2020 9/30/2020 |
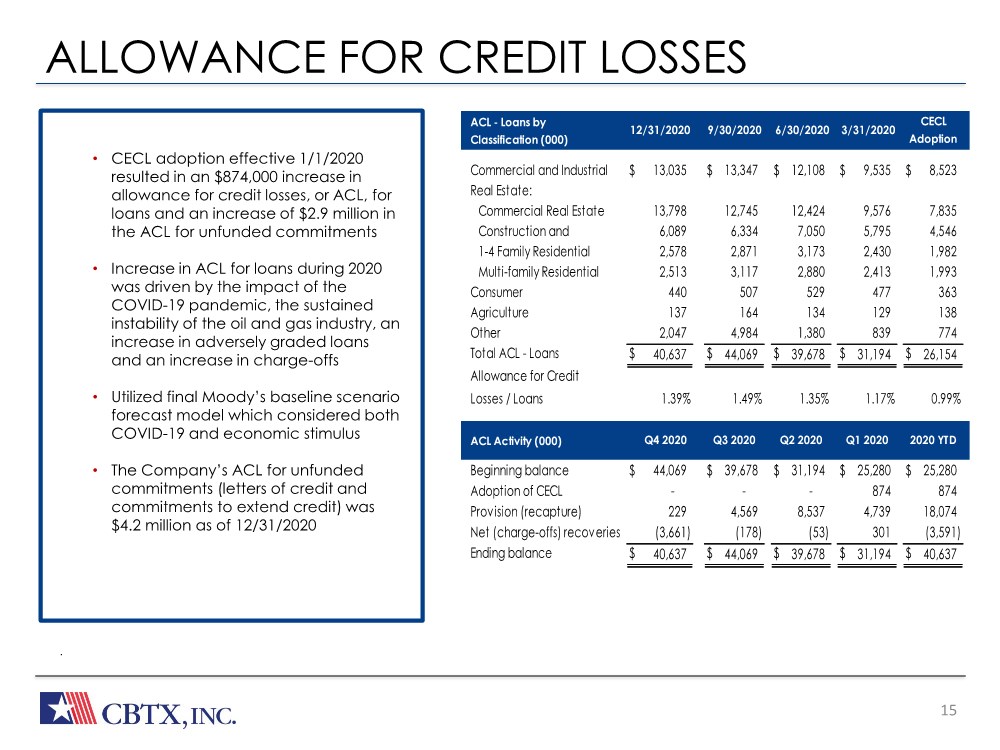
| The Bank Built or Business ALLOWANCE FOR CREDIT LOSSES 15 • Participating in the Paycheck Protection Program offered under the Cares Act •____ PPP loans outstanding, with average loan size of ___ at June 30, 2020 • SBA origination fees of $11.2 M through 6/30/2020. • Processing additional applications . • CECL adoption effective 1/1/2020 resulted in an $874,000 increase in allowance for credit losses, or ACL, for loans and an increase of $2.9 million in the ACL for unfunded commitments • Increase in ACL for loans during 2020 was driven by the impact of the COVID-19 pandemic, the sustained instability of the oil and gas industry, an increase in adversely graded loans and an increase in charge-offs • Utilized final Moody’s baseline scenario forecast model which considered both COVID-19 and economic stimulus • The Company’s ACL for unfunded commitments (letters of credit and commitments to extend credit) was $4.2 million as of 12/31/2020 ACL - Loans by Classification (000) 12/31/2020 9/30/2020 6/30/2020 CECL Adoption 3/31/2020 ACL Activity (000) Q3 2020 Q2 2020 2020 YTD Q1 2020 Q4 2020 Commercial and Industrial $ 13,035 $ 13,347 $ 12,108 $ 9,535 $ 8,523 Real Estate: Commercial Real Estate 13,798 12,745 12,424 9,576 7,835 Construction and 6,089 6,334 7,050 5,795 4,546 1-4 Family Residential 2,578 2,871 3,173 2,430 1,982 Multi-family Residential 2,513 3,117 2,880 2,413 1,993 Consumer 440 507 529 477 363 Agriculture 137 164 134 129 138 Other 2,047 4,984 1,380 839 774 Total ACL - Loans $ 40,637 $ 44,069 $ 39,678 $ 31,194 $ 26,154 Allowance for Credit Losses / Loans 1.39% 1.49% 1.35% 1.17% 0.99% Beginning balance $ 44,069 $ 39,678 $ 31,194 $ 25,280 $ 25,280 Adoption of CECL - - - 874 874 Provision (recapture) 229 4,569 8,537 4,739 18,074 Net (charge-offs) recoveries (3,661) (178) (53) 301 (3,591) Ending balance $ 40,637 $ 44,069 $ 39,678 $ 31,194 $ 40,637 |
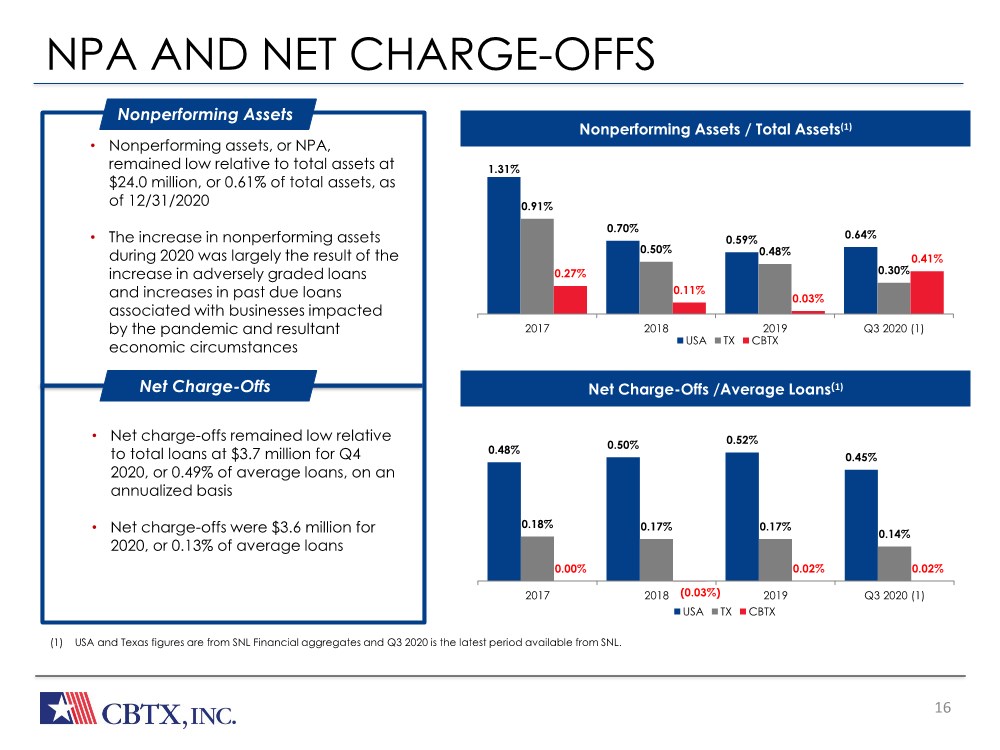
| The Bank Built or Business NPA AND NET CHARGE-OFFS 16 REVENUE • Net interest margin (NIM) remained strong, impacted by lower interest rates and lower yielding PPP loans • Average loan yield (excluding PPP loans) of 4.75% for Q2 2020 • • Average loan yield on PPP loans of 2.28% • Cost of interest bearing liabilities of 0.52% • Asset sensitive, with 49.5% variable rate loans as of June 30, 2020 • Approximately 77% of variable rate loan portfolio had floors EFFICIENCY EFFORTS • Investments in people, technology and systems • Infrastructure capable of supporting a much larger bank • Resulting scalability should allow for growth without significant expenses (1) USA and Texas figures are from SNL Financial aggregates and Q3 2020 is the latest period available from SNL. • Nonperforming assets, or NPA, remained low relative to total assets at $24.0 million, or 0.61% of total assets, as of 12/31/2020 • The increase in nonperforming assets during 2020 was largely the result of the increase in adversely graded loans and increases in past due loans associated with businesses impacted by the pandemic and resultant economic circumstances Nonperforming Assets • Net charge-offs remained low relative to total loans at $3.7 million for Q4 2020, or 0.49% of average loans, on an annualized basis • Net charge-offs were $3.6 million for 2020, or 0.13% of average loans Net Charge-Offs Nonperforming Assets / Total Assets(1) Net Charge-Offs /Average Loans(1) 1.31% 0.70% 0.59% 0.64% 0.91% 0.50% 0.48% 0.30% 0.27% 0.11% 0.03% 0.41% 2017 2018 2019 Q3 2020 (1) USA TX CBTX 0.48% 0.50% 0.52% 0.45% 0.18% 0.17% 0.17% 0.14% 0.00% (0.03%) 0.02% 0.02% 2017 2018 2019 Q3 2020 (1) USA TX CBTX |
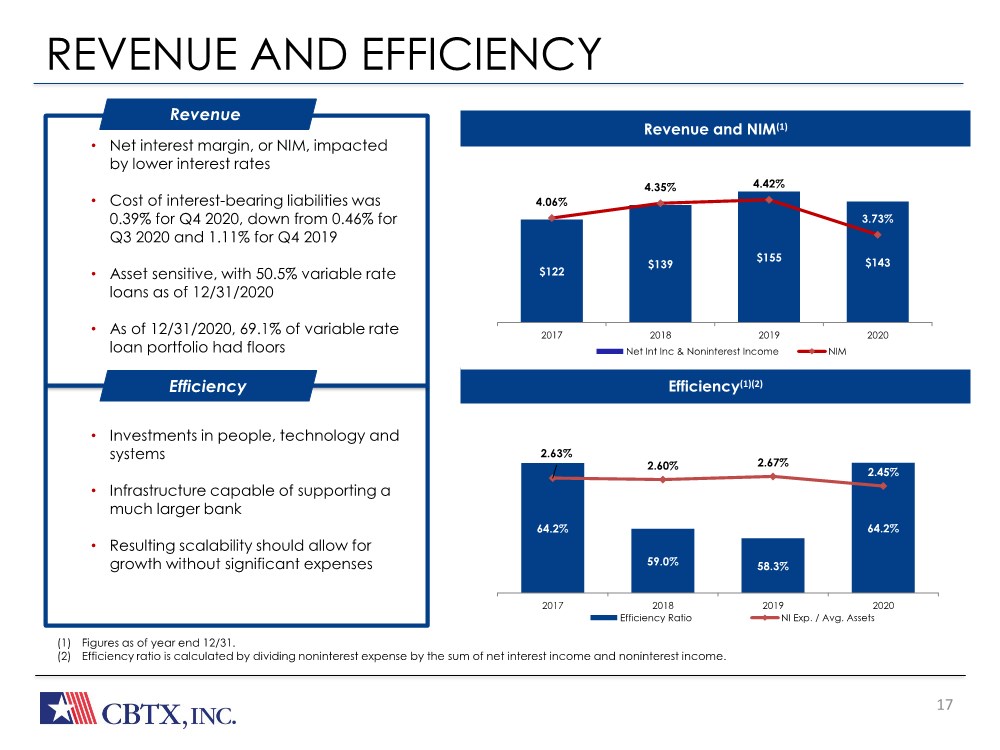
| The Bank Built or Business REVENUE AND EFFICIENCY 17 REVENUE • Net interest margin (NIM) remained strong, impacted by lower interest rates and lower yielding PPP loans • Average loan yield (excluding PPP loans) of 4.75% for Q2 2020 • • Average loan yield on PPP loans of 2.28% • Cost of interest bearing liabilities of 0.52% • Asset sensitive, with 49.5% variable rate loans as of June 30, 2020 • Approximately 77% of variable rate loan portfolio had floors EFFICIENCY EFFORTS • Investments in people, technology and systems • Infrastructure capable of supporting a much larger bank • Resulting scalability should allow for growth without significant expenses (1) Figures as of year end 12/31. (2) Efficiency ratio is calculated by dividing noninterest expense by the sum of net interest income and noninterest income. • Net interest margin, or NIM, impacted by lower interest rates • Cost of interest-bearing liabilities was 0.39% for Q4 2020, down from 0.46% for Q3 2020 and 1.11% for Q4 2019 • Asset sensitive, with 50.5% variable rate loans as of 12/31/2020 • As of 12/31/2020, 69.1% of variable rate loan portfolio had floors Revenue • Investments in people, technology and systems • Infrastructure capable of supporting a much larger bank • Resulting scalability should allow for growth without significant expenses Efficiency Revenue and NIM(1) Efficiency(1)(2) $122 $139 $155 $143 4.06% 4.35% 4.42% 3.73% 2.00% 2.50% 3.00% 3.50% 4.00% 4.50% 5.00% $0 $20 $40 $60 $80 $100 $120 $140 $160 2017 2018 2019 2020 Net Int Inc & Noninterest Income NIM 64.2% 59.0% 58.3% 64.2% 2.63% 2.60% 2.67% 2.45% 2017 2018 2019 0.00% 0.50% 1.00% 1.50% 2.00% 2.50% 3.00% 3.50% 54% 56% 58% 60% 62% 64% 66% 2017 2018 2019 2020 Axis Title Axis Title Axis Title Efficiency Ratio NI Exp. / Avg. Assets |
| 18 At CommunityBank of Texas, we’re committed to building strong, honest relationships. We strive to keep our clients’ and partners’ needs at the forefront of everything we do. And we measure our success by the success we help create for them. OUR VISION Here to Serve. OUR POSITIONING To experienced business owners, CommunityBank of Texas is the financial partner that delivers a better banking experience. OUR PERSONALITY Resourceful, Trustworthy, Friendly, Responsive, Strong At CommunityBank of Texas, we believe in a powerful and multi-faceted statement, one that drills straight to the heart of our reason for being, while clearly illuminating the mission that our many employees pursue each day: Here to serve. Here to serve is a commitment to building strong and honest relationships, a clarion call to remember that in everything we do, our highest purpose is to transform our extensive financial expertise into success for our clients. Relationships are the bedrock of our business – both internally and externally – and there is a stewardship in the word serve that promises that, in these relationships, we will be caring, humble and precise. That we will keep the needs of our clients at the forefront of our minds at all times and measure our performance by the success we create for each other. The other critical component of our brand vision is the word here, which serves several important roles. Here is a promise that we will be there for our clients and answer the call when they need us the most. We will be Dependable. Honest. Trustworthy. And we will remember that every time is the right time to put our clients’ needs first. Here is also a pledge to be visible and present in the communities we serve. It adds weight to the first and most key component of our name: Community. We are not some faceless financial institution located high above the rank and file, safely sheltered in an ivory tower. We are right here, serving the cities and communities in which we live. Day-in and day-out. We sponsor civic events, donate back to our neighbors in need, and spend the time to really get to know our clients on a personal level. In the face of an increasingly digital and impersonal world, we are proudly present in the lives of our clients and our communities. |
| APPENDIX |
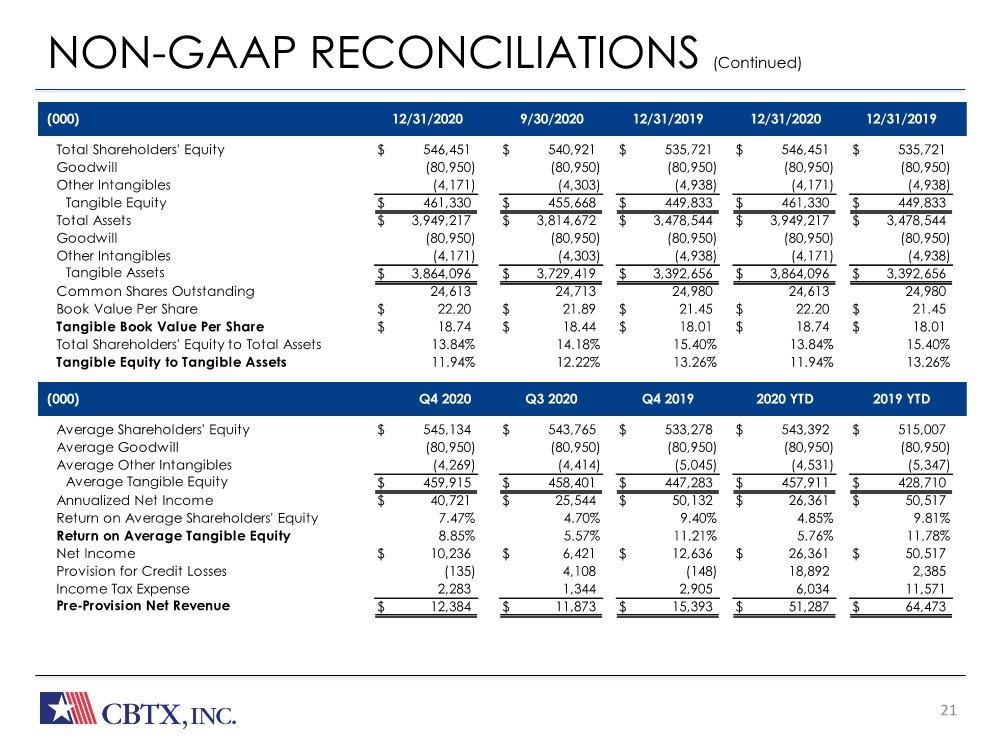
| 20 NON-GAAP RECONCILIATIONS Our management uses certain non-GAAP financial measures to evaluate performance. We have included in this presentation information related to these non-GAAP financial measures for the applicable periods presented. The following tables reconcile, as of the dates set forth below:(1) book value per share to tangible book value per share;(2) total shareholders’ equity to total assets to tangible equity to tangible assets;(3) return on average shareholders’ equity to return on average tangible equity; and (4) net income to pre-provision net revenue. The most directly comparable GAAP financial measure for tangible book value per share is book value per share and the most directly comparable GAAP financial measure for tangible equity to tangible assets is total shareholders’ equity to total assets. The most directly comparable GAAP financial measure for return on average tangible equity is return on average shareholders’ equity. The most directly comparable GAAP financial measure for pre-provision net revenue is net income. |
| 21 NON-GAAP RECONCILIATIONS (Continued) (000) 12/31/2020 12/31/2020 12/31/2019 12/31/2019 9/30/2020 (000) 2019 YTD Q4 2020 2020 YTD Q3 2020 Q4 2019 Total Shareholders' Equity $ 546,451 $ 540,921 $ 535,721 $ 546,451 $ 535,721 Goodwill (80,950) (80,950) (80,950) (80,950) (80,950) Other Intangibles (4,171) (4,303) (4,938) (4,171) (4,938) Tangible Equity $ 461,330 $ 455,668 $ 449,833 $ 461,330 $ 449,833 Total Assets $ 3,949,217 $ 3,814,672 $ 3,478,544 $ 3,949,217 $ 3,478,544 Goodwill (80,950) (80,950) (80,950) (80,950) (80,950) Other Intangibles (4,171) (4,303) (4,938) (4,171) (4,938) Tangible Assets $ 3,864,096 $ 3,729,419 $ 3,392,656 $ 3,864,096 $ 3,392,656 Common Shares Outstanding 24,613 24,713 24,980 24,613 24,980 Book Value Per Share $ 22.20 $ 21.89 $ 21.45 $ 22.20 $ 21.45 Tangible Book Value Per Share $ 18.74 $ 18.44 $ 18.01 $ 18.74 $ 18.01 Total Shareholders' Equity to Total Assets 13.84% 14.18% 15.40% 13.84% 15.40% Tangible Equity to Tangible Assets 11.94% 12.22% 13.26% 11.94% 13.26% Average Shareholders' Equity $ 545,134 $ 543,765 $ 533,278 $ 543,392 $ 515,007 Average Goodwill (80,950) (80,950) (80,950) (80,950) (80,950) Average Other Intangibles (4,269) (4,414) (5,045) (4,531) (5,347) Average Tangible Equity $ 459,915 $ 458,401 $ 447,283 $ 457,911 $ 428,710 Annualized Net Income $ 40,721 $ 25,544 $ 50,132 $ 26,361 $ 50,517 Return on Average Shareholders' Equity 7.47% 4.70% 9.40% 4.85% 9.81% Return on Average Tangible Equity 8.85% 5.57% 11.21% 5.76% 11.78% Net Income $ 10,236 $ 6,421 $ 12,636 $ 26,361 $ 50,517 Provision for Credit Losses (135) 4,108 (148) 18,892 2,385 Income Tax Expense 2,283 1,344 2,905 6,034 11,571 Pre-Provision Net Revenue $ 12,384 $ 11,873 $ 15,393 $ 51,287 $ 64,473 |