Attached files
| file | filename |
|---|---|
| 8-K - 8-K - WSFS FINANCIAL CORP | wsfs-20210125.htm |
| EX-99.1 - EX-99.1 - WSFS FINANCIAL CORP | exhibit991earningsrelease1.htm |
1 WSFS Financial Corporation 4Q 2020 Earnings Supplement1 January 25, 2021 1 4Q 2020 Earnings Release Supplement is for the purpose and use in conjunction with our Earnings Release furnished as Exhibit 99.1 to our Form 8-K on January 25, 2021 Exhibit 99.2
2 Forward Looking Statements: This presentation contains estimates, predictions, opinions, projections and other "forward-looking statements" as that phrase is defined in the Private Securities Litigation Reform Act of 1995. Such statements include, without limitation, references to the Company's predictions or expectations of future business or financial performance as well as its goals and objectives for future operations, financial and business trends, business prospects, and management's outlook or expectations for earnings, revenues, expenses, capital levels, liquidity levels, asset quality or other future financial or business performance, strategies or expectations. The words “believe,” “expect,” “anticipate,” “plan,” “estimate,” “target,” “project” and similar expressions, among others, generally identify forward-looking statements. Such forward-looking statements are based on various assumptions (some of which may be beyond the Company's control) and are subject to significant risks and uncertainties (which change over time) and other factors, including the uncertain effects of the COVID-19 pandemic and actions taken in response thereto on our business, results of operations, capital and liquidity, which could cause actual results to differ materially from those currently anticipated. Such risks and uncertainties are discussed in detail in the Company's Form 10-K for the year ended December 31, 2019, Form 10-Q for the quarter ended March 31, 2020, Form 10-Q for the quarter ended June 30, 2020, Form 10-Q for the quarter ended September 30, 2020, and other documents filed by the Company with the Securities and Exchange Commission from time to time. We caution readers not to place undue reliance on any such forward-looking statements, which speak only as of the date on which they are made, and the Company disclaims any duty to revise or update any forward-looking statement, whether written or oral, that may be made from time to time by or on behalf of the Company for any reason, except as specifically required by law. As used in this presentation, the terms "WSFS", "the Company", "registrant", "we", "us", and "our" mean WSFS Financial Corporation and its subsidiaries, on a consolidated basis, unless the context indicates otherwise. Non-GAAP Financial Measures: This presentation contains financial measures determined by methods other than in accordance with accounting principles generally accepted in the United States (“GAAP”). These non-GAAP measures include core earnings per share (“EPS”), core net income, core return on equity (“ROE”), core efficiency ratio, pre-provision net revenue (“PPNR”), core PPNR, PPNR to average assets ratio, core PPNR to average assets ratio, core return on assets (“ROA”), core Net Interest Margin (“NIM”), return on tangible common equity (“ROTCE”), core ROTCE, core fee income and core fee income as a percentage of total core net revenue. The Company’s management believes that these non-GAAP measures provide a greater understanding of ongoing operations, enhance comparability of results of operations with prior periods and show the effects of significant gains and charges in the periods presented. The Company’s management believes that investors may use these non-GAAP measures to analyze the Company’s financial performance without the impact of unusual items or events that may obscure trends in the Company’s underlying performance. This non-GAAP data should be considered in addition to results prepared in accordance with GAAP, and is not a substitute for, or superior to, GAAP results. For a reconciliation of these non-GAAP measures to their comparable GAAP measures, see the Appendix. Forward Looking Statements & Non-GAAP
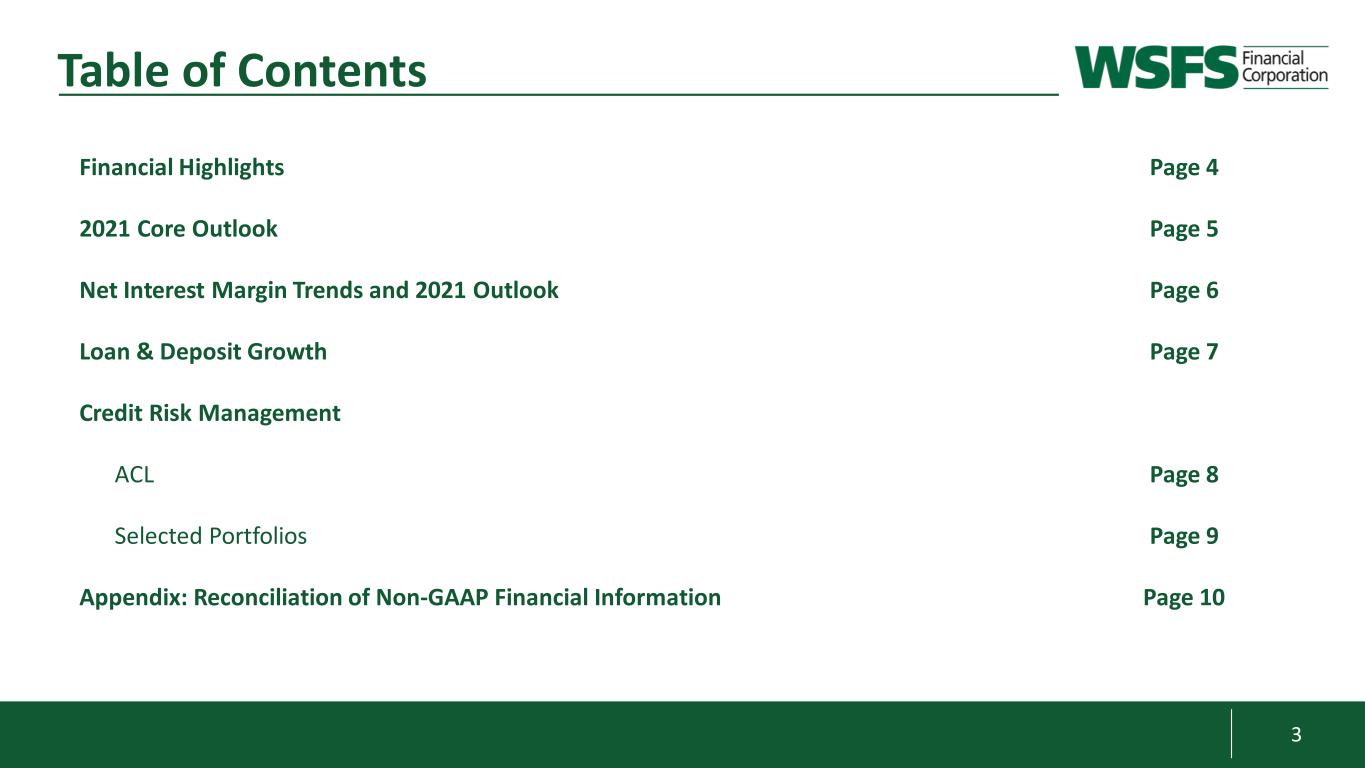
3 Table of Contents Financial Highlights Page 4 2021 Core Outlook Page 5 Net Interest Margin Trends and 2021 Outlook Page 6 Loan & Deposit Growth Page 7 Credit Risk Management ACL Page 8 Selected Portfolios Page 9 Appendix: Reconciliation of Non-GAAP Financial Information Page 10
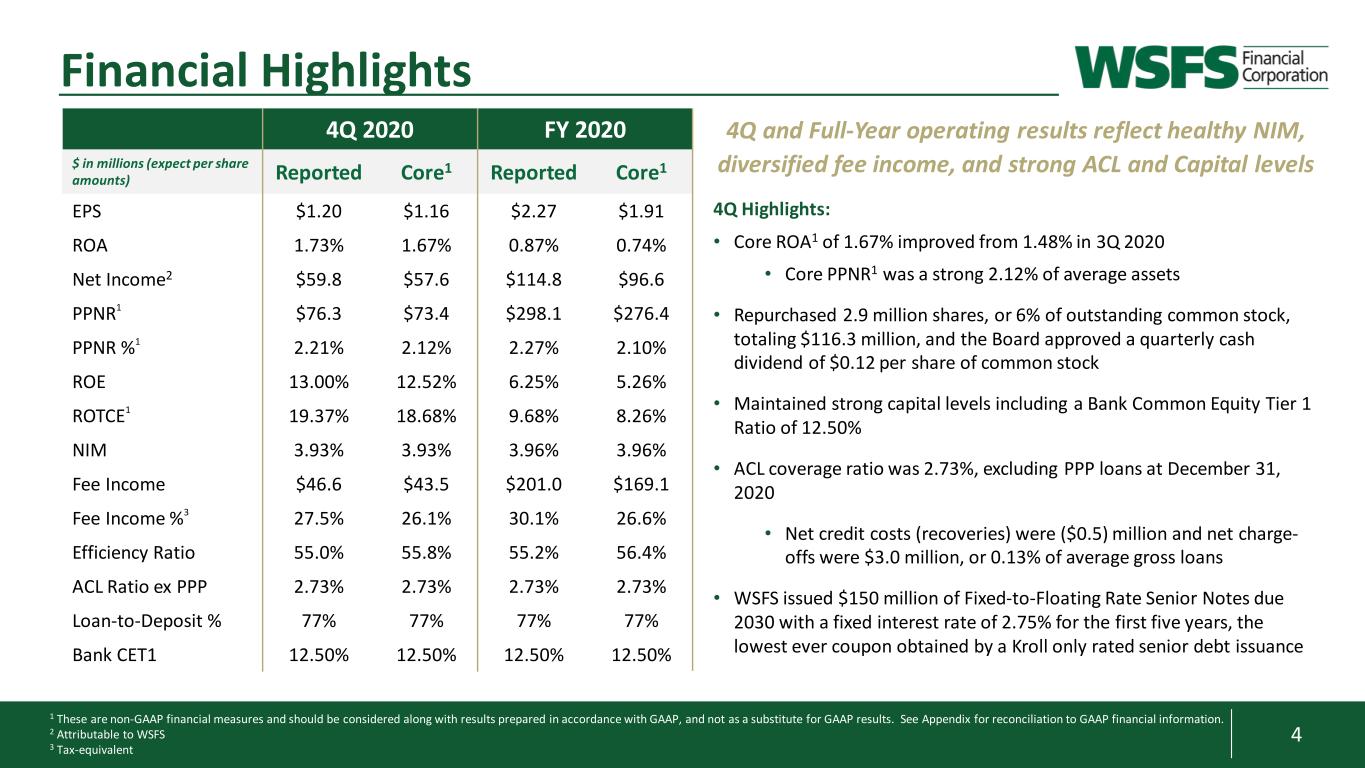
4 1 These are non-GAAP financial measures and should be considered along with results prepared in accordance with GAAP, and not as a substitute for GAAP results. See Appendix for reconciliation to GAAP financial information. 2 Attributable to WSFS 3 Tax-equivalent Financial Highlights 4Q 2020 FY 2020 $ in millions (expect per share amounts) Reported Core1 Reported Core1 EPS $1.20 $1.16 $2.27 $1.91 ROA 1.73% 1.67% 0.87% 0.74% Net Income2 $59.8 $57.6 $114.8 $96.6 PPNR1 $76.3 $73.4 $298.1 $276.4 PPNR %1 2.21% 2.12% 2.27% 2.10% ROE 13.00% 12.52% 6.25% 5.26% ROTCE1 19.37% 18.68% 9.68% 8.26% NIM 3.93% 3.93% 3.96% 3.96% Fee Income $46.6 $43.5 $201.0 $169.1 Fee Income %3 27.5% 26.1% 30.1% 26.6% Efficiency Ratio 55.0% 55.8% 55.2% 56.4% ACL Ratio ex PPP 2.73% 2.73% 2.73% 2.73% Loan-to-Deposit % 77% 77% 77% 77% Bank CET1 12.50% 12.50% 12.50% 12.50% 4Q and Full-Year operating results reflect healthy NIM, diversified fee income, and strong ACL and Capital levels 4Q Highlights: • Core ROA1 of 1.67% improved from 1.48% in 3Q 2020 • Core PPNR1 was a strong 2.12% of average assets • Repurchased 2.9 million shares, or 6% of outstanding common stock, totaling $116.3 million, and the Board approved a quarterly cash dividend of $0.12 per share of common stock • Maintained strong capital levels including a Bank Common Equity Tier 1 Ratio of 12.50% • ACL coverage ratio was 2.73%, excluding PPP loans at December 31, 2020 • Net credit costs (recoveries) were ($0.5) million and net charge- offs were $3.0 million, or 0.13% of average gross loans • WSFS issued $150 million of Fixed-to-Floating Rate Senior Notes due 2030 with a fixed interest rate of 2.75% for the first five years, the lowest ever coupon obtained by a Kroll only rated senior debt issuance
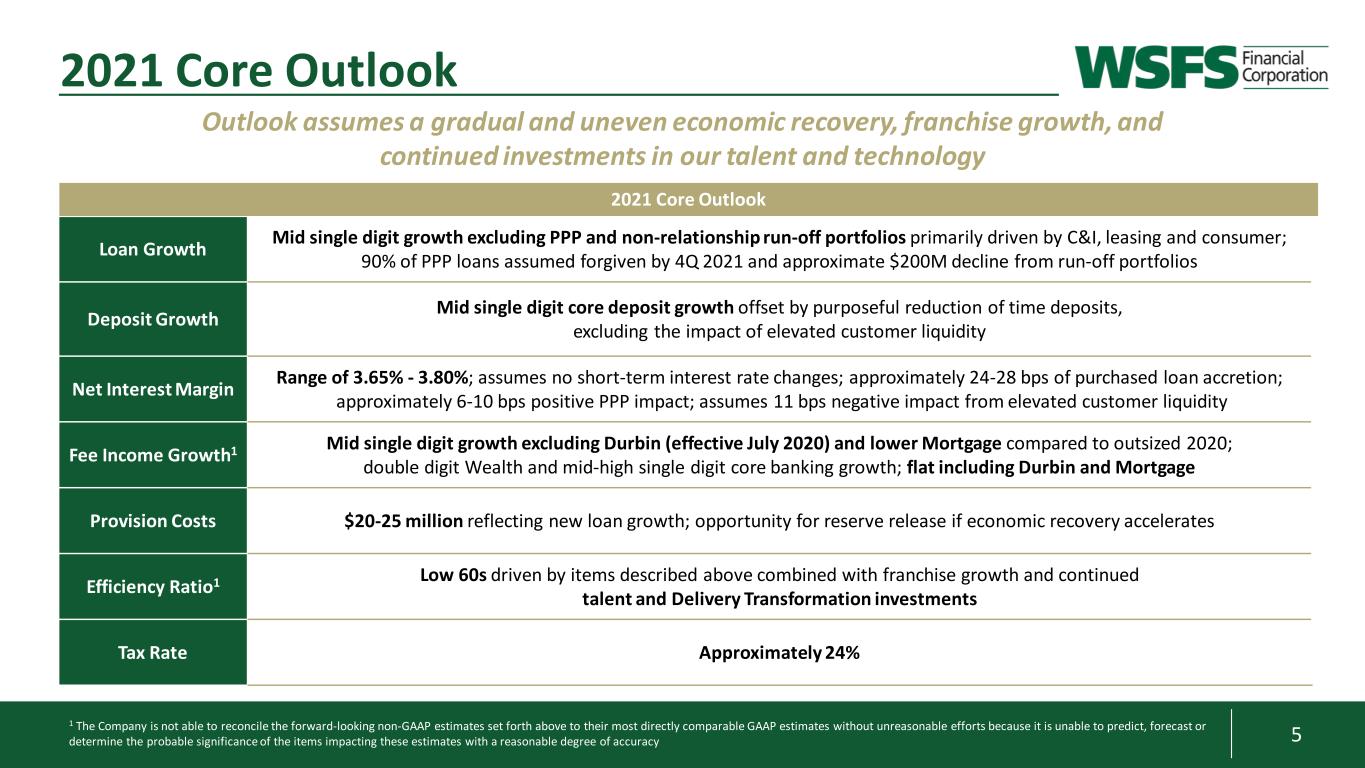
5 3 2021 Core Outlook Loan Growth Mid single digit growth excluding PPP and non-relationship run-off portfolios primarily driven by C&I, leasing and consumer; 90% of PPP loans assumed forgiven by 4Q 2021 and approximate $200M decline from run-off portfolios Deposit Growth Mid single digit core deposit growth offset by purposeful reduction of time deposits, excluding the impact of elevated customer liquidity Net Interest Margin Range of 3.65% - 3.80%; assumes no short-term interest rate changes; approximately 24-28 bps of purchased loan accretion; approximately 6-10 bps positive PPP impact; assumes 11 bps negative impact from elevated customer liquidity Fee Income Growth1 Mid single digit growth excluding Durbin (effective July 2020) and lower Mortgage compared to outsized 2020; double digit Wealth and mid-high single digit core banking growth; flat including Durbin and Mortgage Provision Costs $20-25 million reflecting new loan growth; opportunity for reserve release if economic recovery accelerates Efficiency Ratio1 Low 60s driven by items described above combined with franchise growth and continued talent and Delivery Transformation investments Tax Rate Approximately 24% 2021 Core Outlook Outlook assumes a gradual and uneven economic recovery, franchise growth, and continued investments in our talent and technology 1 The Company is not able to reconcile the forward-looking non-GAAP estimates set forth above to their most directly comparable GAAP estimates without unreasonable efforts because it is unable to predict, forecast or determine the probable significance of the items impacting these estimates with a reasonable degree of accuracy
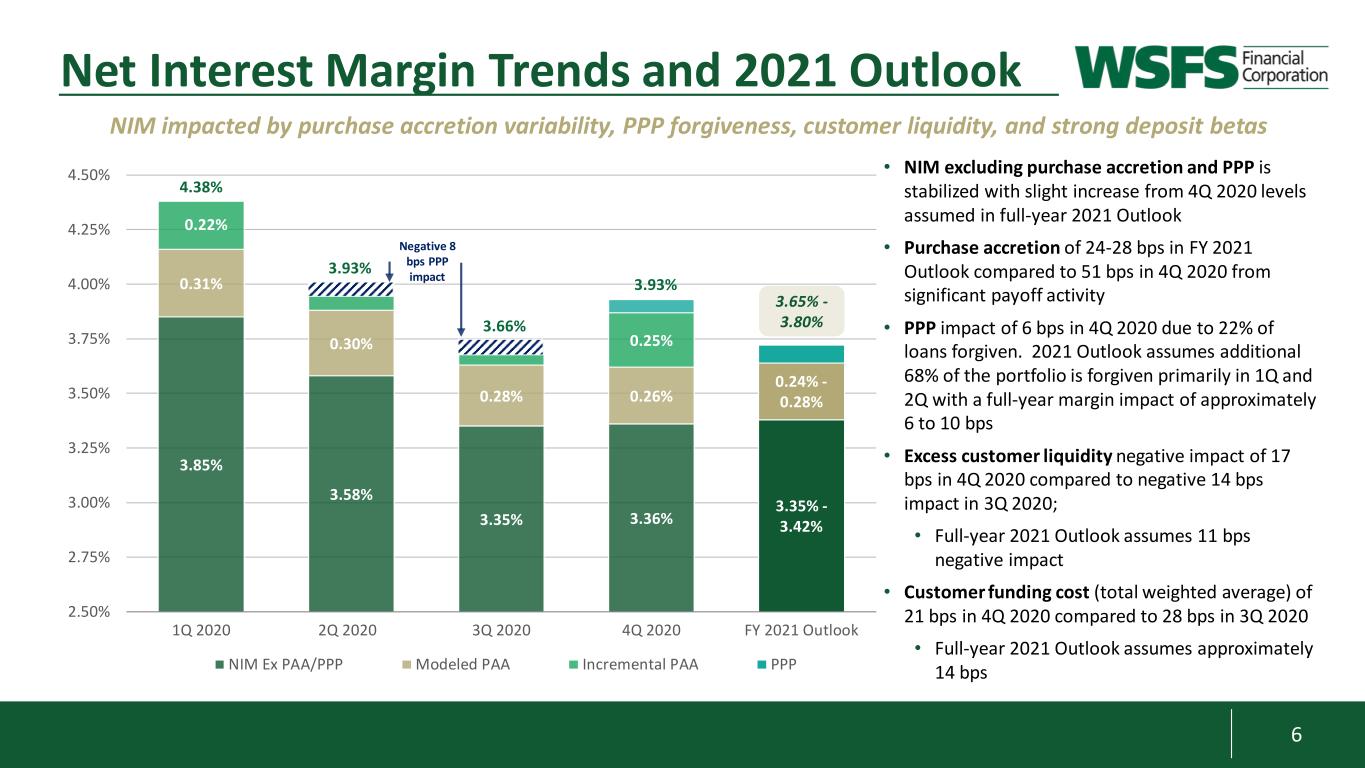
6 3.85% 3.58% 3.35% 3.36% 3.35% - 3.42% 0.31% 0.30% 0.28% 0.26% 0.24% - 0.28% 0.22% 0.25% 2.50% 2.75% 3.00% 3.25% 3.50% 3.75% 4.00% 4.25% 4.50% 1Q 2020 2Q 2020 3Q 2020 4Q 2020 FY 2021 Outlook NIM Ex PAA/PPP Modeled PAA Incremental PAA PPP 0.1 4.38% 3.93% 3.66% Negative 8 bps PPP impact Net Interest Margin Trends and 2021 Outlook NIM impacted by purchase accretion variability, PPP forgiveness, customer liquidity, and strong deposit betas 3.65% - 3.80% 3.93% • NIM excluding purchase accretion and PPP is stabilized with slight increase from 4Q 2020 levels assumed in full-year 2021 Outlook • Purchase accretion of 24-28 bps in FY 2021 Outlook compared to 51 bps in 4Q 2020 from significant payoff activity • PPP impact of 6 bps in 4Q 2020 due to 22% of loans forgiven. 2021 Outlook assumes additional 68% of the portfolio is forgiven primarily in 1Q and 2Q with a full-year margin impact of approximately 6 to 10 bps • Excess customer liquidity negative impact of 17 bps in 4Q 2020 compared to negative 14 bps impact in 3Q 2020; • Full-year 2021 Outlook assumes 11 bps negative impact • Customer funding cost (total weighted average) of 21 bps in 4Q 2020 compared to 28 bps in 3Q 2020 • Full-year 2021 Outlook assumes approximately 14 bps
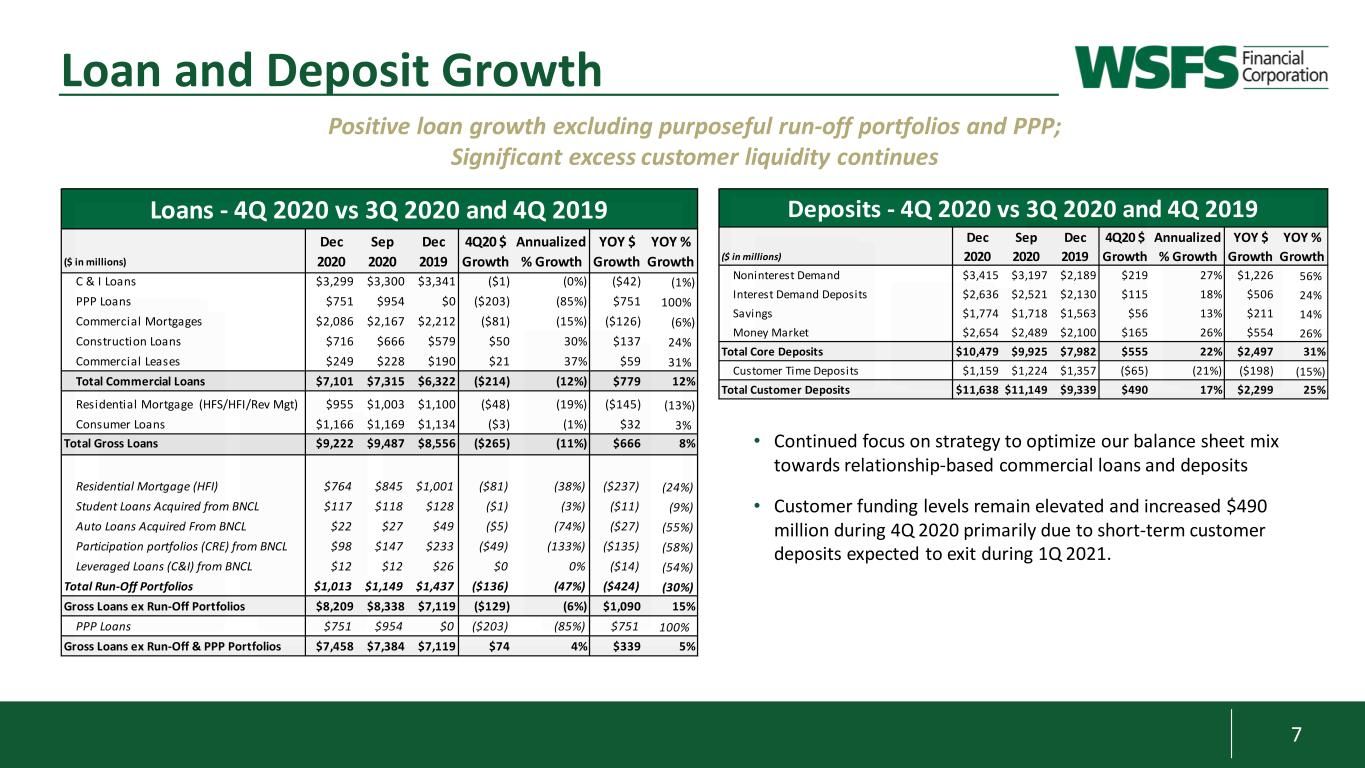
7 Loan and Deposit Growth Positive loan growth excluding purposeful run-off portfolios and PPP; Significant excess customer liquidity continues • Continued focus on strategy to optimize our balance sheet mix towards relationship-based commercial loans and deposits • Customer funding levels remain elevated and increased $490 million during 4Q 2020 primarily due to short-term customer deposits expected to exit during 1Q 2021. ($ in millions) Dec 2020 Sep 2020 Dec 2019 4Q20 $ Growth Annualized % Growth YOY $ Growth YOY % Growth C & I Loans $3,299 $3,300 $3,341 ($1) (0%) ($42) (1%) PPP Loans $751 $954 $0 ($203) (85%) $751 100% Commercial Mortgages $2,086 $2,167 $2,212 ($81) (15%) ($126) (6%) Construction Loans $716 $666 $579 $50 30% $137 24% Commercial Leases $249 $228 $190 $21 37% $59 31% Total Commercial Loans $7,101 $7,315 $6,322 ($214) (12%) $779 12% Residential Mortgage (HFS/HFI/Rev Mgt) $955 $1,003 $1,100 ($48) (19%) ($145) (13%) Consumer Loans $1,166 $1,169 $1,134 ($3) (1%) $32 3% Total Gross Loans $9,222 $9,487 $8,556 ($265) (11%) $666 8% Residential Mortgage (HFI) $764 $845 $1,001 ($81) (38%) ($237) (24%) Student Loans Acquired from BNCL $117 $118 $128 ($1) (3%) ($11) (9%) Auto Loans Acquired From BNCL $22 $27 $49 ($5) (74%) ($27) (55%) Participation portfolios (CRE) from BNCL $98 $147 $233 ($49) (133%) ($135) (58%) Leveraged Loans (C&I) from BNCL $12 $12 $26 $0 0% ($14) (54%) Total Run-Off Portfolios $1,013 $1,149 $1,437 ($136) (47%) ($424) (30%) Gross Loans ex Run-Off Portfolios $8,209 $8,338 $7,119 ($129) (6%) $1,090 15% PPP Loans $751 $954 $0 ($203) (85%) $751 100% Gross Loans ex Run-Off & PPP Portfolios $7,458 $7,384 $7,119 $74 4% $339 5% Loans - 4Q 2020 vs 3Q 2020 and 4Q 2019 ($ in millions) Dec 2020 Sep 2020 Dec 2019 4Q20 $ Growth Annualized % Growth YOY $ Growth YOY % Growth Noninterest Demand $3,415 $3,197 $2,189 $219 27% $1,226 56% Interest Demand Deposits $2,636 $2,521 $2,130 $115 18% $506 24% Savings $1,774 $1,718 $1,563 $56 13% $211 14% Money Market $2,654 $2,489 $2,100 $165 26% $554 26% Total Core Deposits $10,479 $9,925 $7,982 $555 22% $2,497 31% Customer Time Deposits $1,159 $1,224 $1,357 ($65) (21%) ($198) (15%) Total Customer Deposits $11,638 $11,149 $9,339 $490 17% $2,299 25% Deposits - 4Q 2020 vs 3Q 2020 and 4Q 2019
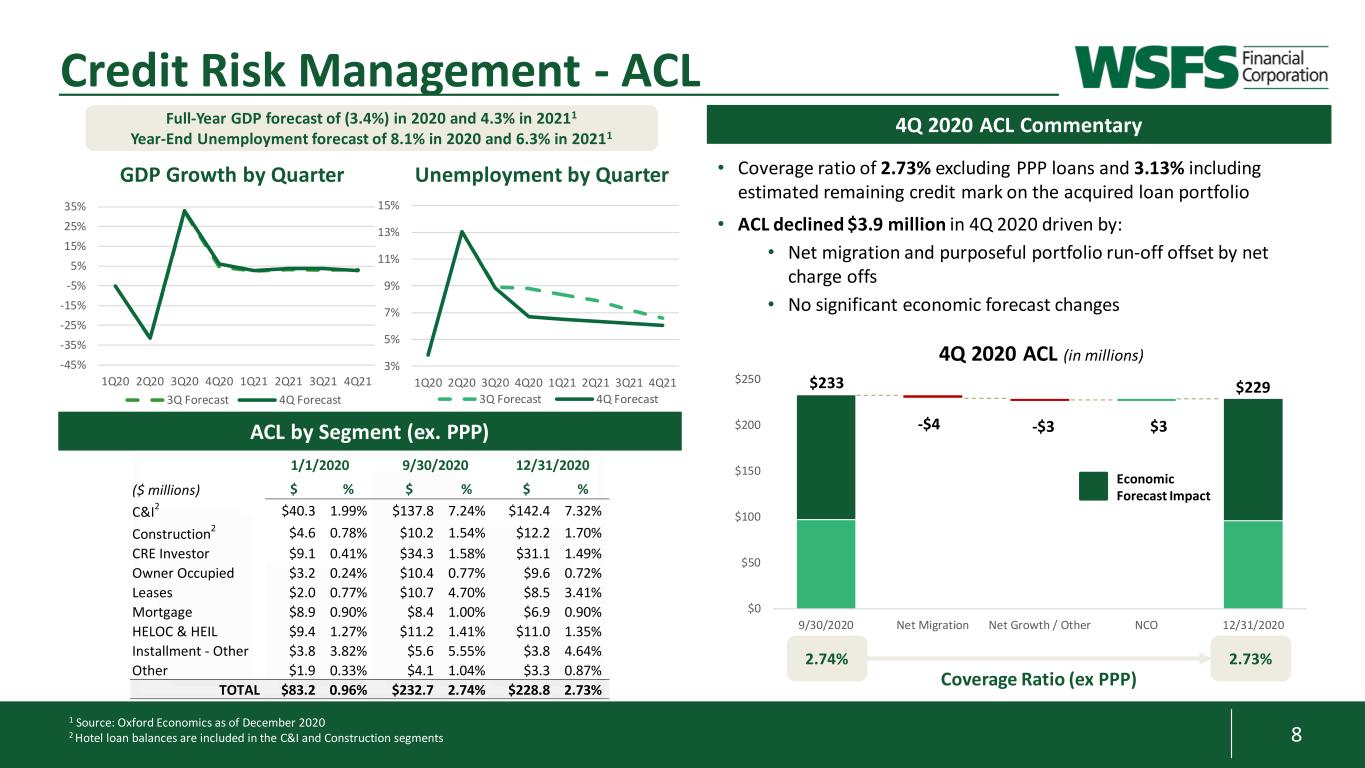
8 -45% -35% -25% -15% -5% 5% 15% 25% 35% 1Q20 2Q20 3Q20 4Q20 1Q21 2Q21 3Q21 4Q21 3Q Forecast 4Q Forecast Coverage Ratio (ex PPP) 1 Source: Oxford Economics as of December 2020 2 Hotel loan balances are included in the C&I and Construction segments Credit Risk Management - ACL ACL by Segment (ex. PPP) Full-Year GDP forecast of (3.4%) in 2020 and 4.3% in 20211 Year-End Unemployment forecast of 8.1% in 2020 and 6.3% in 20211 4Q 2020 ACL Commentary • Coverage ratio of 2.73% excluding PPP loans and 3.13% including estimated remaining credit mark on the acquired loan portfolio • ACL declined $3.9 million in 4Q 2020 driven by: • Net migration and purposeful portfolio run-off offset by net charge offs • No significant economic forecast changes 2.74% 2.73% GDP Growth by Quarter Unemployment by Quarter 4Q 2020 ACL (in millions) Economic Forecast Impact 3% 5% 7% 9% 11% 13% 15% 1Q20 2Q20 3Q20 4Q20 1Q21 2Q21 3Q21 4Q21 3Q Forecast 4Q Forecast ($ millions) $ % $ % $ % C&I2 $40.3 1.99% $137.8 7.24% $142.4 7.32% Construction2 $4.6 0.78% $10.2 1.54% $12.2 1.70% CRE Investor $9.1 0.41% $34.3 1.58% $31.1 1.49% Owner Occupied $3.2 0.24% $10.4 0.77% $9.6 0.72% Leases $2.0 0.77% $10.7 4.70% $8.5 3.41% Mortgage $8.9 0.90% $8.4 1.00% $6.9 0.90% HELOC & HEIL $9.4 1.27% $11.2 1.41% $11.0 1.35% Installment - Other $3.8 3.82% $5.6 5.55% $3.8 4.64% Other $1.9 0.33% $4.1 1.04% $3.3 0.87% TOTAL $83.2 0.96% $232.7 2.74% $228.8 2.73% 1/1/2020 9/30/2020 12/31/2020 $0 $50 $100 $150 $200 $250 9/30/2020 Net Migration Net Growth / Other NCO 12/31/2020 -$3 $233 $229 -$4 $3
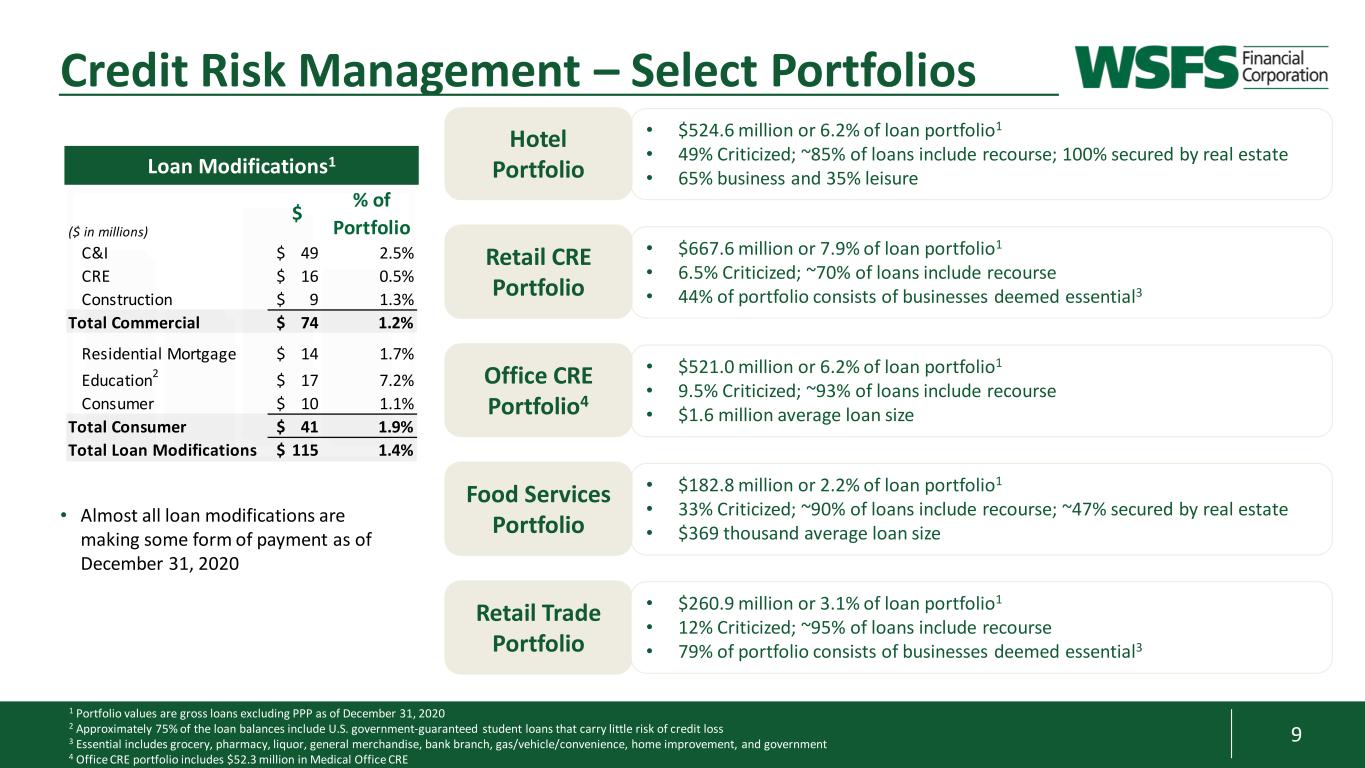
9 3 Credit Risk Management – Select Portfolios • Almost all loan modifications are making some form of payment as of December 31, 2020 • $524.6 million or 6.2% of loan portfolio1 • 49% Criticized; ~85% of loans include recourse; 100% secured by real estate • 65% business and 35% leisure • $667.6 million or 7.9% of loan portfolio1 • 6.5% Criticized; ~70% of loans include recourse • 44% of portfolio consists of businesses deemed essential3 • $182.8 million or 2.2% of loan portfolio1 • 33% Criticized; ~90% of loans include recourse; ~47% secured by real estate • $369 thousand average loan size • $521.0 million or 6.2% of loan portfolio1 • 9.5% Criticized; ~93% of loans include recourse • $1.6 million average loan size Hotel Portfolio Retail CRE Portfolio Office CRE Portfolio4 Food Services Portfolio Retail Trade Portfolio • $260.9 million or 3.1% of loan portfolio1 • 12% Criticized; ~95% of loans include recourse • 79% of portfolio consists of businesses deemed essential3 Loan Modifications1 1 Portfolio values are gross loans excluding PPP as of December 31, 2020 2 Approximately 75% of the loan balances include U.S. government-guaranteed student loans that carry little risk of credit loss 3 Essential includes grocery, pharmacy, liquor, general merchandise, bank branch, gas/vehicle/convenience, home improvement, and government 4 Office CRE portfolio includes $52.3 million in Medical Office CRE ($ in millions) $ % of Portfolio C&I 49$ 2.5% CRE 16$ 0.5% Construction 9$ 1.3% Total Commercial 74$ 1.2% Residential Mortgage 14$ 1.7% Education2 17$ 7.2% Consumer 10$ 1.1% Total Consumer 41$ 1.9% Total Loan Modifications 115$ 1.4%
10 Appendix: Non-GAAP Financial Information
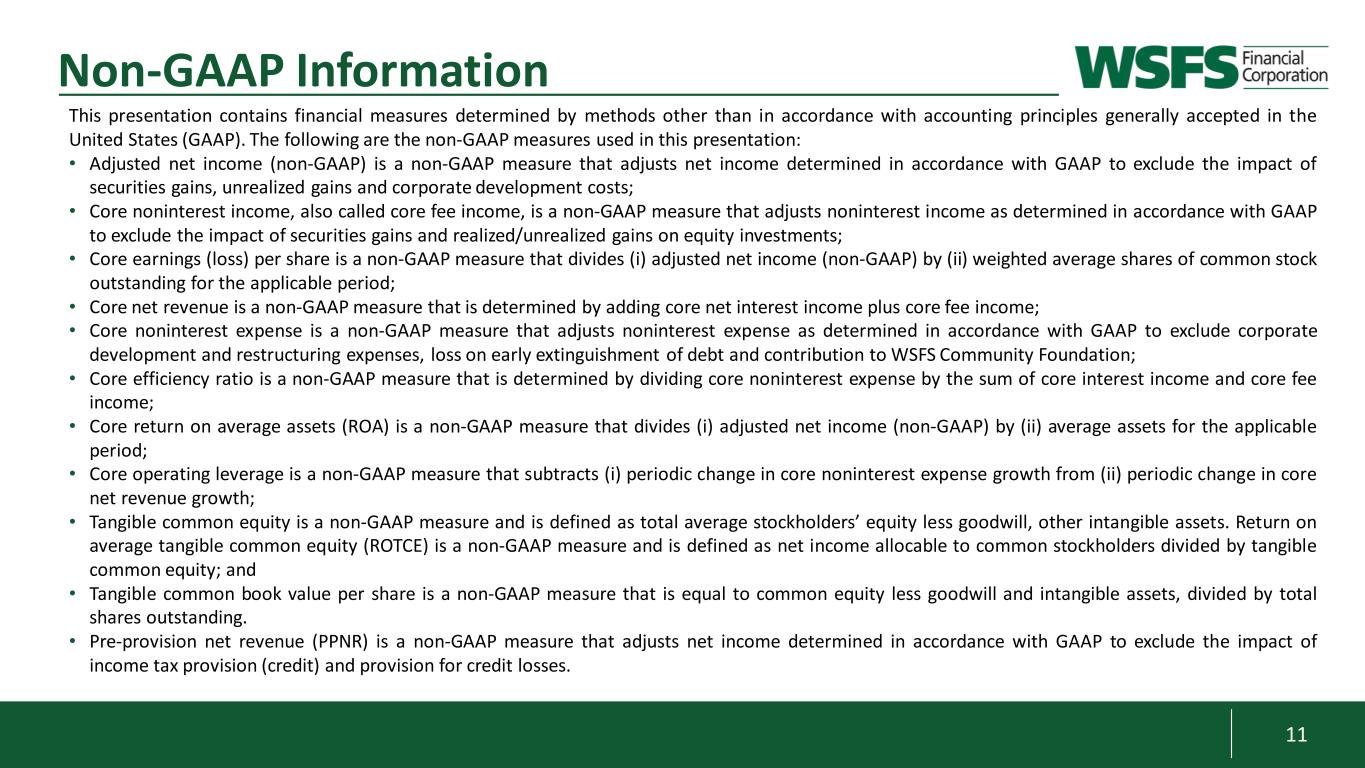
11 Non-GAAP Information This presentation contains financial measures determined by methods other than in accordance with accounting principles generally accepted in the United States (GAAP). The following are the non-GAAP measures used in this presentation: • Adjusted net income (non-GAAP) is a non-GAAP measure that adjusts net income determined in accordance with GAAP to exclude the impact of securities gains, unrealized gains and corporate development costs; • Core noninterest income, also called core fee income, is a non-GAAP measure that adjusts noninterest income as determined in accordance with GAAP to exclude the impact of securities gains and realized/unrealized gains on equity investments; • Core earnings (loss) per share is a non-GAAP measure that divides (i) adjusted net income (non-GAAP) by (ii) weighted average shares of common stock outstanding for the applicable period; • Core net revenue is a non-GAAP measure that is determined by adding core net interest income plus core fee income; • Core noninterest expense is a non-GAAP measure that adjusts noninterest expense as determined in accordance with GAAP to exclude corporate development and restructuring expenses, loss on early extinguishment of debt and contribution to WSFS Community Foundation; • Core efficiency ratio is a non-GAAP measure that is determined by dividing core noninterest expense by the sum of core interest income and core fee income; • Core return on average assets (ROA) is a non-GAAP measure that divides (i) adjusted net income (non-GAAP) by (ii) average assets for the applicable period; • Core operating leverage is a non-GAAP measure that subtracts (i) periodic change in core noninterest expense growth from (ii) periodic change in core net revenue growth; • Tangible common equity is a non-GAAP measure and is defined as total average stockholders’ equity less goodwill, other intangible assets. Return on average tangible common equity (ROTCE) is a non-GAAP measure and is defined as net income allocable to common stockholders divided by tangible common equity; and • Tangible common book value per share is a non-GAAP measure that is equal to common equity less goodwill and intangible assets, divided by total shares outstanding. • Pre-provision net revenue (PPNR) is a non-GAAP measure that adjusts net income determined in accordance with GAAP to exclude the impact of income tax provision (credit) and provision for credit losses.
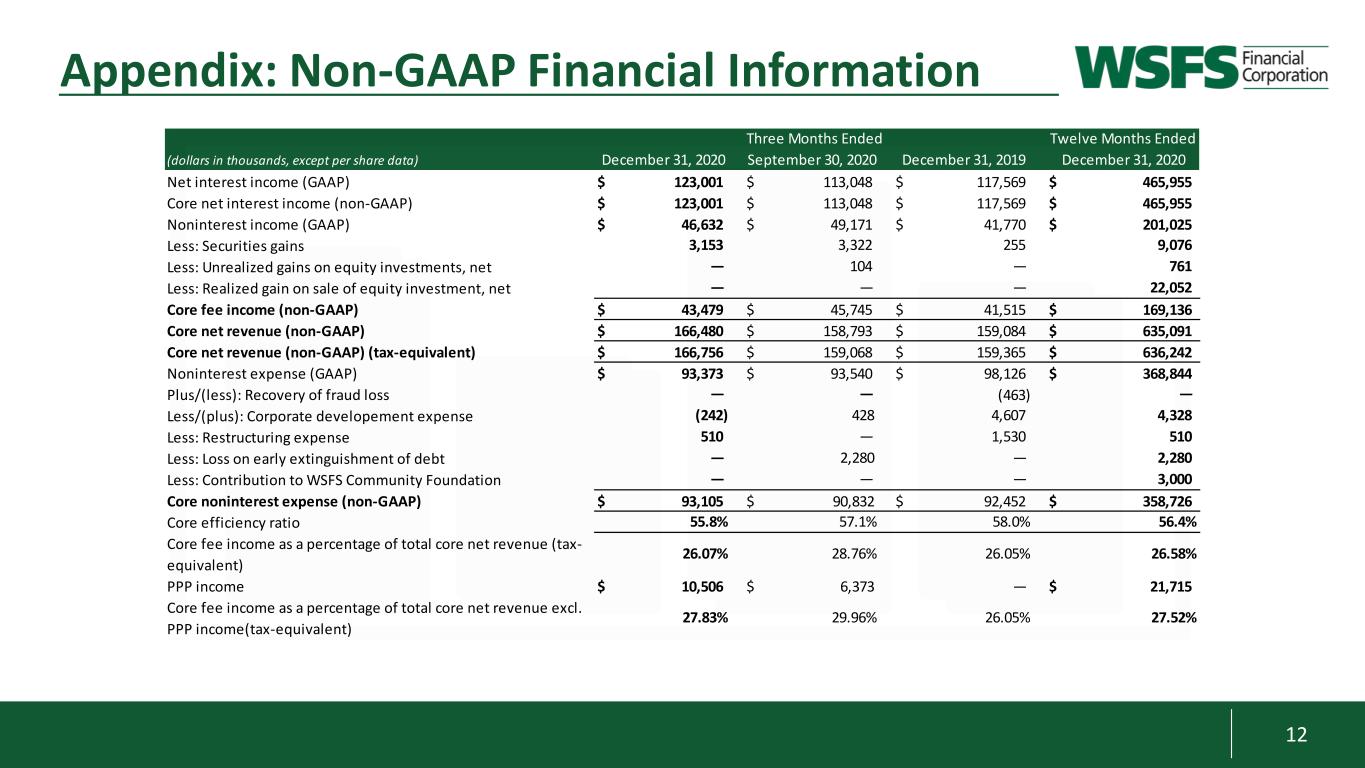
12 Appendix: Non-GAAP Financial Information (dollars in thousands, except per share data) Net interest income (GAAP) $ 123,001 $ 113,048 $ 117,569 $ 465,955 Core net interest income (non-GAAP) $ 123,001 $ 113,048 $ 117,569 $ 465,955 Noninterest income (GAAP) $ 46,632 $ 49,171 $ 41,770 $ 201,025 Less: Securities gains Less: Unrealized gains on equity investments, net Less: Realized gain on sale of equity investment, net Core fee income (non-GAAP) $ 43,479 $ 45,745 $ 41,515 $ 169,136 Core net revenue (non-GAAP) $ 166,480 $ 158,793 $ 159,084 $ 635,091 Core net revenue (non-GAAP) (tax-equivalent) $ 166,756 $ 159,068 $ 159,365 $ 636,242 Noninterest expense (GAAP) $ 93,373 $ 93,540 $ 98,126 $ 368,844 Plus/(less): Recovery of fraud loss (463) Less/(plus): Corporate developement expense Less: Restructuring expense Less: Loss on early extinguishment of debt Less: Contribution to WSFS Community Foundation Core noninterest expense (non-GAAP) $ 93,105 $ 90,832 $ 92,452 $ 358,726 Core efficiency ratio Core fee income as a percentage of total core net revenue (tax- equivalent) PPP income $ 10,506 $ 6,373 — $ 21,715 Core fee income as a percentage of total core net revenue excl. PPP income(tax-equivalent) Three Months Ended 27.83% 29.96% 26.05% 27.52% 55.8% 57.1% 58.0% 56.4% 26.07% 28.76% 26.05% 26.58% — 2,280 — 2,280 — — — 3,000 510 — 1,530 510 — — — (242) 428 4,607 4,328 — 104 — 761 — — — 22,052 3,153 3,322 255 9,076 Twelve Months Ended December 31, 2020 September 30, 2020 December 31, 2019 December 31, 2020
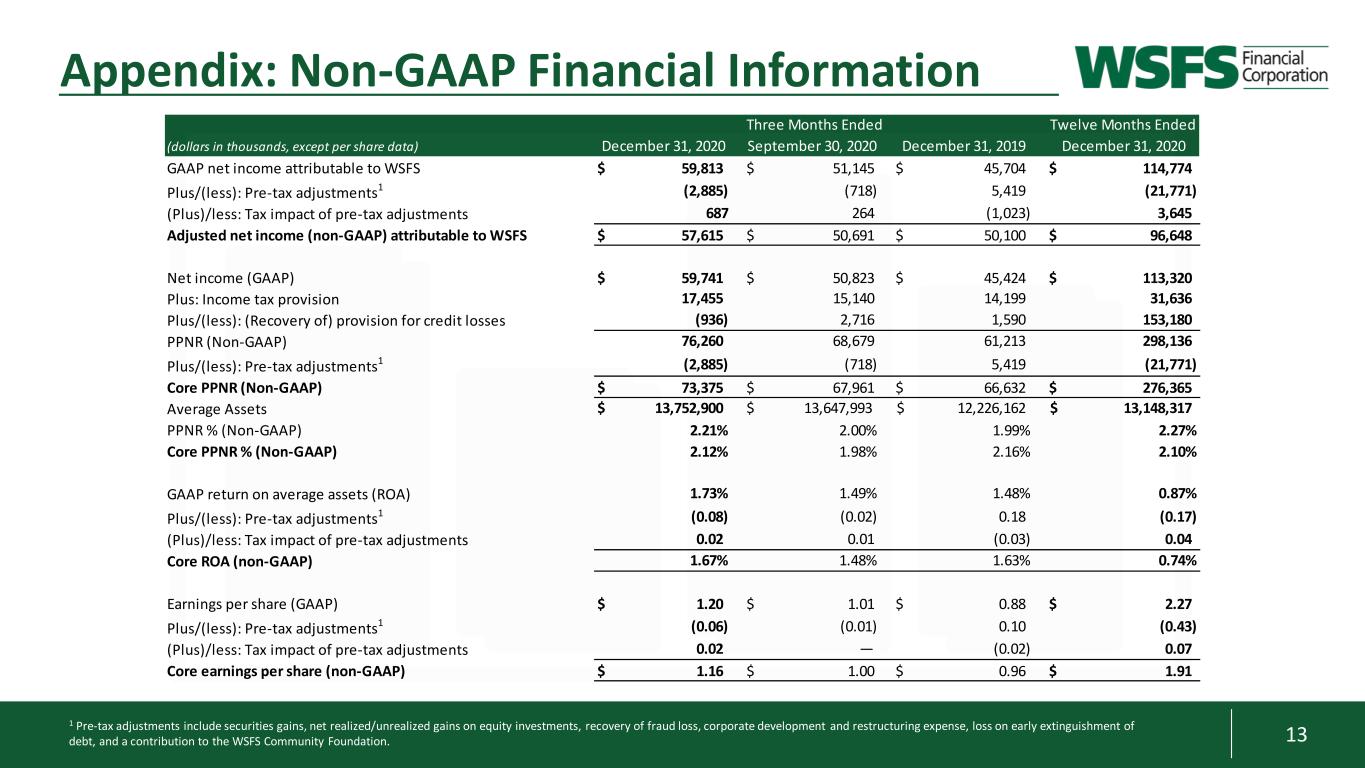
13 Appendix: Non-GAAP Financial Information 1 Pre-tax adjustments include securities gains, net realized/unrealized gains on equity investments, recovery of fraud loss, corporate development and restructuring expense, loss on early extinguishment of debt, and a contribution to the WSFS Community Foundation. (dollars in thousands, except per share data) GAAP net income attributable to WSFS $ 59,813 $ 51,145 $ 45,704 $ 114,774 Plus/(less): Pre-tax adjustments1 (Plus)/less: Tax impact of pre-tax adjustments Adjusted net income (non-GAAP) attributable to WSFS $ 57,615 $ 50,691 $ 50,100 $ 96,648 Net income (GAAP) $ 59,741 $ 50,823 $ 45,424 $ 113,320 Plus: Income tax provision Plus/(less): (Recovery of) provision for credit losses PPNR (Non-GAAP) Plus/(less): Pre-tax adjustments1 Core PPNR (Non-GAAP) $ 73,375 $ 67,961 $ 66,632 $ 276,365 Average Assets PPNR % (Non-GAAP) 2.21% 2.00% 1.99% 2.27% Core PPNR % (Non-GAAP) 2.12% 1.98% 2.16% 2.10% GAAP return on average assets (ROA) Plus/(less): Pre-tax adjustments1 (Plus)/less: Tax impact of pre-tax adjustments Core ROA (non-GAAP) Earnings per share (GAAP) $ 1.20 $ 1.01 $ 0.88 $ 2.27 Plus/(less): Pre-tax adjustments1 (Plus)/less: Tax impact of pre-tax adjustments Core earnings per share (non-GAAP) $ 1.16 $ 1.00 $ 0.96 $ 1.91 Three Months Ended (0.06) (0.01) 0.10 (0.43) 0.02 — (0.02) 0.07 0.02 0.01 (0.03) 0.04 1.67% 1.48% 1.63% 0.74% 1.73% 1.49% 1.48% 0.87% (0.08) (0.02) 0.18 (0.17) (2,885) (718) 5,419 (21,771) 13,752,900$ 13,647,993$ 12,226,162$ 13,148,317$ (936) 2,716 1,590 153,180 76,260 68,679 61,213 298,136 687 264 (1,023) 3,645 17,455 15,140 14,199 31,636 (2,885) (718) 5,419 (21,771) Twelve Months Ended December 31, 2020 September 30, 2020 December 31, 2019 December 31, 2020
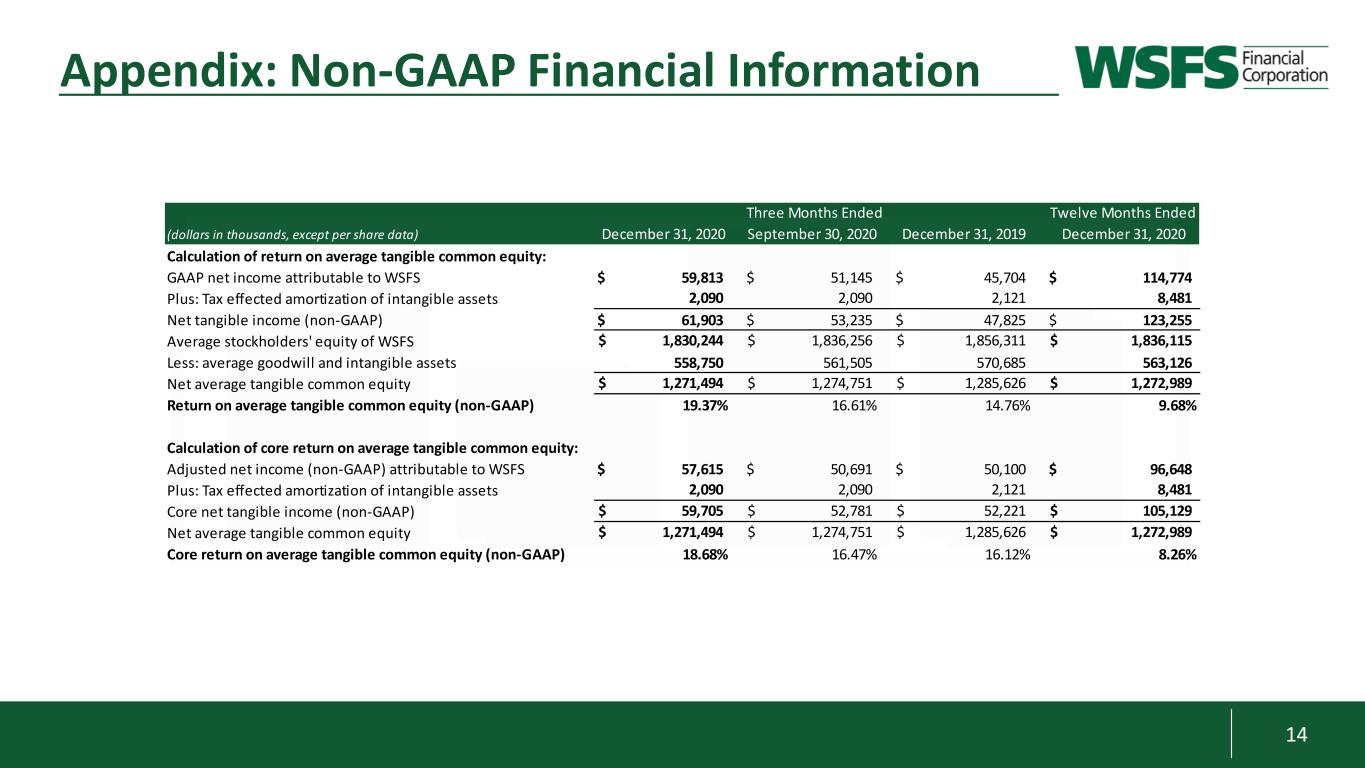
14 Appendix: Non-GAAP Financial Information (dollars in thousands, except per share data) Calculation of return on average tangible common equity: GAAP net income attributable to WSFS $ 59,813 $ 51,145 $ 45,704 $ 114,774 Plus: Tax effected amortization of intangible assets Net tangible income (non-GAAP) $ 61,903 $ 53,235 $ 47,825 $ 123,255 Average stockholders' equity of WSFS Less: average goodwill and intangible assets 558,750 561,505 570,685 563,126 Net average tangible common equity Return on average tangible common equity (non-GAAP) 19.37% 16.61% 14.76% 9.68% Calculation of core return on average tangible common equity: Adjusted net income (non-GAAP) attributable to WSFS $ 57,615 $ 50,691 $ 50,100 $ 96,648 Plus: Tax effected amortization of intangible assets Core net tangible income (non-GAAP) Net average tangible common equity Core return on average tangible common equity (non-GAAP) 18.68% 16.47% 16.12% 8.26% 1,271,494$ 1,274,751$ 1,285,626$ 1,272,989$ Three Months Ended 2,090 2,090 2,121 8,481 59,705$ 52,781$ 52,221$ 105,129$ 1,830,244$ 1,836,256$ 1,856,311$ 1,836,115$ 1,271,494$ 1,274,751$ 1,285,626$ 1,272,989$ 2,090 2,090 2,121 8,481 Twelve Months Ended December 31, 2020 September 30, 2020 December 31, 2019 December 31, 2020
