Attached files
| file | filename |
|---|---|
| EX-99.2 - EX-99.2 - DIAMOND OFFSHORE DRILLING, INC. | d284576dex992.htm |
| EX-10.1 - EX-10.1 - DIAMOND OFFSHORE DRILLING, INC. | d284576dex101.htm |
| 8-K - 8-K - DIAMOND OFFSHORE DRILLING, INC. | d284576d8k.htm |
Exhibit 99.1
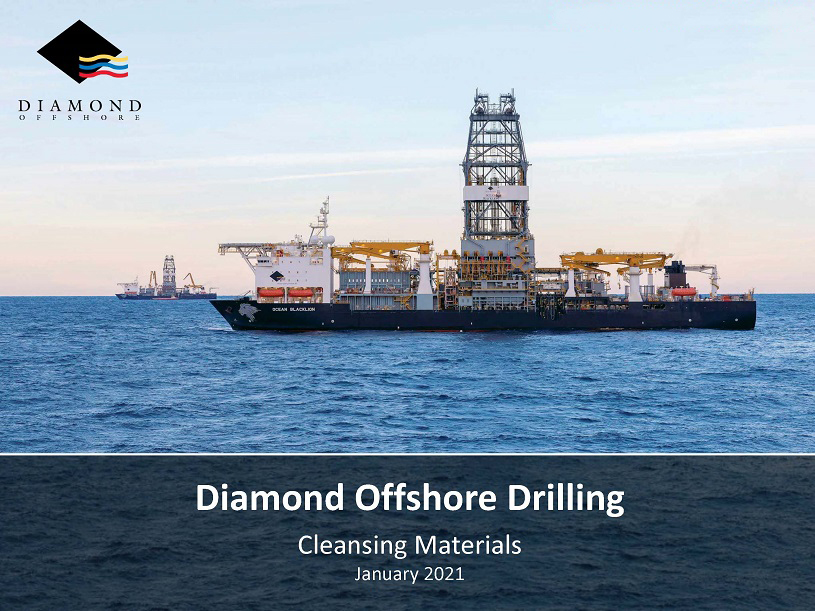
Diamond Offshore Drilling
Cleansing Materials
January 2021
Disclaimer
The statements in this presentation
that are not historical facts, including statements regarding future financial performance, are forward-looking statements within the meaning of the federal securities laws. Forward-looking statements are inherently uncertain and subject to a
variety of assumptions, risks and uncertainties that could cause actual results to differ materially from those currently anticipated or expected by management of Diamond Offshore Drilling, Inc. (the “Company”). These risks and
uncertainties include, among others, risks associated with worldwide demand for drilling services, level of activity in the oil and gas industry, renewing or replacing expired or terminated contracts, contract cancellations and terminations,
maintenance and realization of backlog, impairments and retirements, operating risks, regulatory initiatives and compliance with governmental regulations, litigation, rig reactivations, and various other factors, many of which are beyond the
Company’s control. A discussion of the risk factors and other considerations that could materially impact the Company’s overall business and financial performance can be found in the Company’s reports filed with the Securities and
Exchange Commission (the “SEC”) and readers of this report are urged to review these reports carefully. Given these risk factors, investors and analysts should not place undue reliance on forward-looking statements. Each forward-looking
statement speaks only as of the date of such statement, and the Company expressly disclaims any obligation or undertaking to release publicly any updates or revisions to any forward-looking statement to reflect any change in the Company’s
expectations with regard thereto or any change in events, conditions or circumstances on which any forward-looking statement is based.
The Company uses non-generally accepted accounting principles (“non-GAAP”) financial measures in this presentation. Generally, a non-GAAP
financial measure is a numerical measure of a company’s performance, financial position or cash flows that excludes or includes amounts that are not normally excluded or included in the most directly comparable measure calculated and presented
in accordance with GAAP. Management believes that an analysis of this data is meaningful to investors because it provides insight with respect to ongoing operating results of the Company and allows investors to better evaluate the financial results
of the Company. Non-GAAP financial measures should be considered to be a supplement to, and not as a substitute for, or superior to, financial measures prepared in accordance with GAAP.
Diamond Offshore | Management Presentation
1
Contents
1. Business Plan
2. Appendix
Diamond Offshore | Management Presentation
2
Key Model Assumptions
Dayrates:
Assumed dayrates utilize study from third-party research firm
Pricing expected to rebound
beginning in 2022 and strengthen through projection period
Utilization:
Utilization based on assumed working schedule determined by Diamond management, including anticipated rig reactivations, mobilization days, shipyard days, and
upgrades/surveys
90% marketed utilization for assumed contracts1
Operating
Expenses:
Average opex of approximately ~$155k per day for drillships and ~$100k per day for semis excluding cold-stacked periods2
Cold-stacked period opex averages ~$16k per day for temporarily stacked semis and ~$1k per day for long-term stacked rigs
Assumes modest opex increase in outer years
G&A, Shorebase, & Overhead:
Incorporates recent G&A and overhead cost reduction efforts
Assumes modest G&A
inflation in outer years
Existing Contracts:
• No change to existing
contracted terms
• Assumes $25 million client margin commitment booked in Q4 2020 and received in Q1 2021
Capital Expenditures:
• One semi assumed to complete reactivation in Q1 2021 ($3 million)
and one semi assumed to be reactivated in Q1 2022
($25 million)
•
$5 million to $8 million additional capex during special surveys, except for $20 million for the Ocean Patriot
• Approximately $59 million
of capex will be reimbursed by customers over 2020 and 2021
• $64 million of BOP recertification capex in 2023 and 2024
Other:
Potential exit financing not considered in forecast
$138 million of restructuring costs including $121 million of post-petition professional fees
Ocean Rover is cold-stacked prior to scrapping Q3 2021, Ocean America is cold-stacked prior to being sold in Q1 2021 for ~$3 million, Ocean Valiant is cold-stacked beginning
Q2 2020, and Ocean Valor begins cold-stack preparations in Q1 2021
Assumes PCbtH Contractual Services Agreement (“CSA”) is rejected and BOP services are
insourced.
(1) Hornet & Lion assumes 100% market utilization beyond current contracts through 2023.
(2) Excludes PCbtH lease fee, reimbursable expenses, shorebase, indirect rig overhead, and G&A costs.
Diamond Offshore | Management Presentation
3
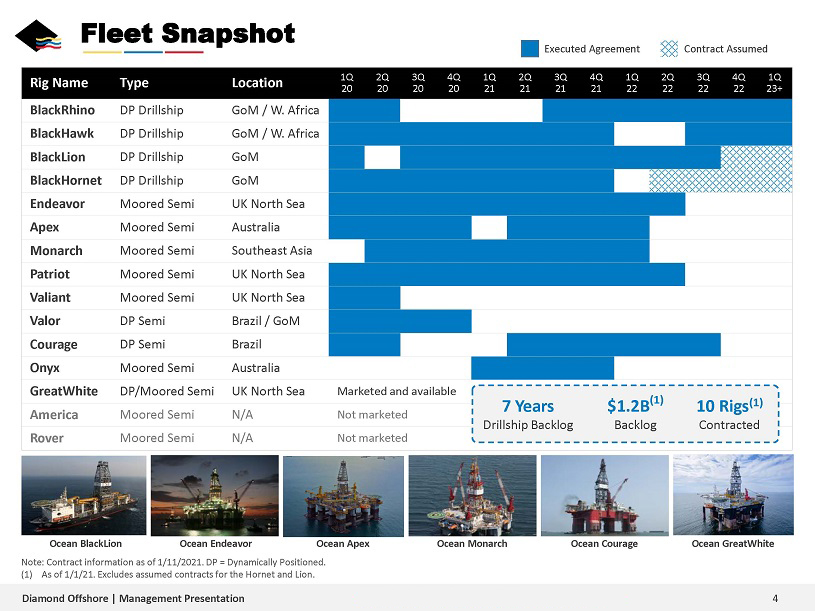
Fleet Snapshot
Executed Agreement Contract Assumed
Rig Name Type Location 1Q 2Q 3Q 4Q 1Q 2Q 3Q 4Q 1Q 2Q 3Q 4Q 1Q
20 20 20 20 21
21 21 21 22 22 22 22 23+
BlackRhino DP Drillship GoM / W. Africa BlackHawk DP Drillship GoM / W. Africa BlackLion DP Drillship GoM
BlackHornet DP Drillship GoM Endeavor Moored Semi UK North Sea Apex Moored Semi Australia Monarch Moored Semi Southeast Asia Patriot Moored Semi UK North Sea Valiant Moored Semi UK
North Sea Valor DP Semi Brazil / GoM Courage DP Semi Brazil Onyx
Moored Semi Australia
GreatWhite DP/Moored Semi UK North Sea Marketed and available (1)
7 Years $1.2B 10 Rigs(1)
America Moored Semi N/A Not marketed Drillship Backlog Backlog Contracted Rover Moored Semi N/A Not marketed
Ocean BlackLion Ocean Endeavor Ocean Apex Ocean Monarch Ocean Courage Ocean GreatWhite
Note:
Contract information as of 1/11/2021. DP = Dynamically Positioned. (1) As of 1/1/21. Excludes assumed contracts for the Hornet and Lion.
Diamond Offshore |
Management Presentation 4
Model Output
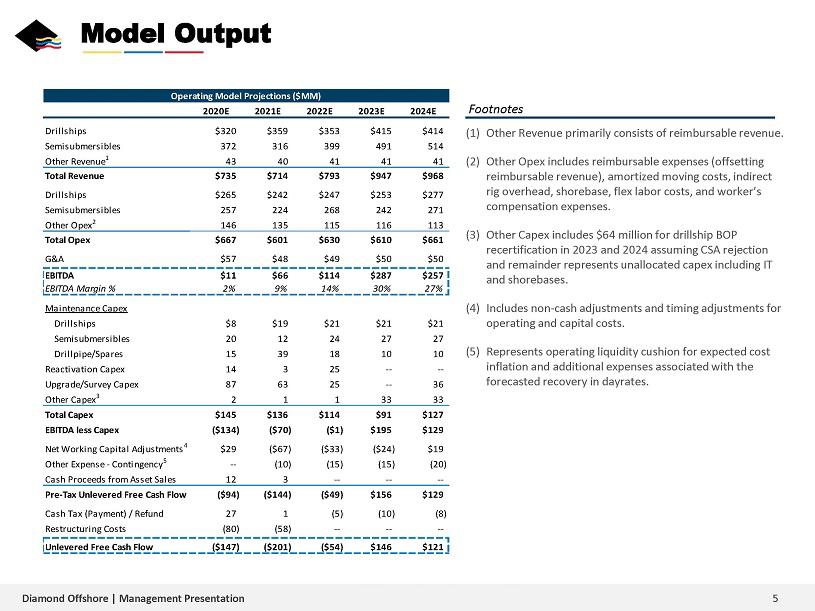
Operating Model Projections ($MM)
2020E 2021E 2022E 2023E 2024E
Drillships $320 $359 $353 $415 $414
Semisubmersibles 372 316 399 491 514 Other Revenue1 43 40 41 41 41
Total Revenue $735 $714 $793 $947 $968
Drillships $265 $242 $247 $253 $277 Semisubmersibles 257 224 268 242 271 Other Opex2 146 135 115 116 113
Total Opex $667 $601 $630 $610 $661
G&A $57 $48 $49 $50 $50
EBITDA $11 $66 $114 $287 $257
EBITDA Margin % 2% 9% 14% 30% 27%
Maintenance Capex
Drillships $8 $19 $21 $21 $21 Semisubmersibles 20 12 24 27 27
Drillpipe/Spares 15 39 18 10 10 Reactivation Capex 14 3 25 -—-Upgrade/Survey Capex 87 63 25 — 36 Other Capex3 2 1 1 33 33
Total Capex $145 $136 $114 $91
$127 EBITDA less Capex ($134) ($70) ($1) $195 $129
Net Working Capital Adjustments4 $29 ($67) ($33) ($24) $19 Other Expense—Contingency5 — (10) (15) (15)
(20) Cash Proceeds from Asset Sales 12 3 -——-
Pre-Tax Unlevered Free Cash Flow ($94) ($144) ($49) $156 $129
Cash Tax (Payment) / Refund 27 1 (5) (10) (8) Restructuring Costs (80) (58) -——-
Unlevered Free Cash Flow ($147) ($201) ($54) $146 $121
Footnotes
(1) Other Revenue primarily consists of reimbursable revenue.
(2) Other Opex includes
reimbursable expenses (offsetting reimbursable revenue), amortized moving costs, indirect rig overhead, shorebase, flex labor costs, and worker’s compensation expenses.
(3) Other Capex includes $64 million for drillship BOP recertification in 2023 and 2024 assuming CSA rejection and remainder represents unallocated capex including IT and
shorebases.
(4) Includes non-cash adjustments and timing adjustments for operating and capital costs.
(5) Represents operating liquidity cushion for expected cost inflation and additional expenses associated with the forecasted recovery in dayrates.
Diamond Offshore | Management Presentation
5
Agenda
1. Business Plan
2. Appendix
Diamond Offshore | Management Presentation
6
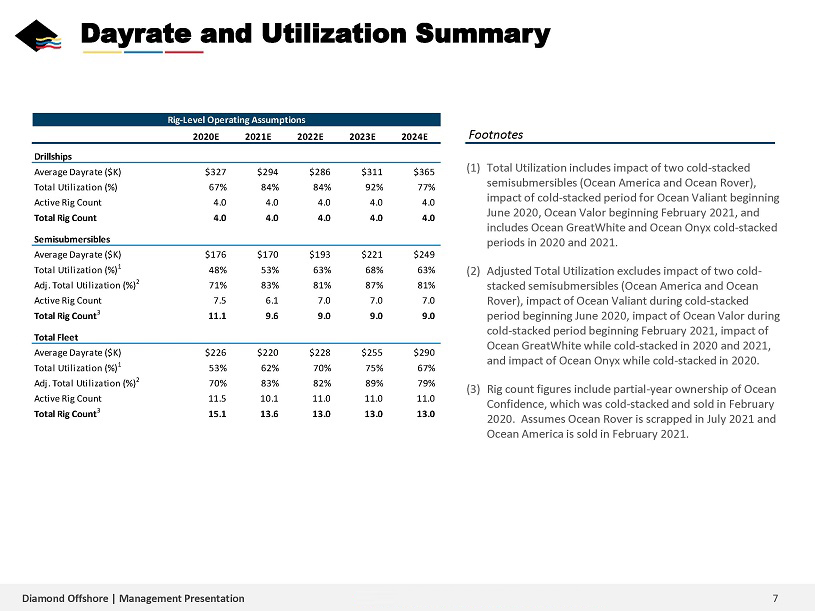
Dayrate and Utilization Summary
Rig-Level Operating Assumptions
2020E 2021E 2022E 2023E 2024E
Drillships
Average Dayrate ($K) $327 $294 $286 $311 $365 Total Utilization (%) 67% 84% 84% 92%
77% Active Rig Count 4.0 4.0 4.0 4.0 4.0
Total Rig Count 4.0 4.0 4.0 4.0 4.0
Semisubmersibles
Average Dayrate ($K) $176 $170 $193 $221 $249 Total
Utilization (%)1 48% 53% 63% 68% 63% Adj. Total Utilization (%)2 71% 83% 81% 87% 81% Active Rig Count 7.5 6.1 7.0 7.0 7.0
Total Rig Count3 11.1 9.6 9.0 9.0 9.0
Total Fleet
Average Dayrate ($K) $226 $220 $228 $255 $290 Total Utilization
(%)1 53% 62% 70% 75% 67% Adj. Total Utilization (%)2 70% 83% 82% 89% 79% Active Rig Count 11.5 10.1 11.0 11.0 11.0
Total Rig Count3 15.1 13.6 13.0 13.0 13.0
Footnotes
(1) Total Utilization includes impact of two cold-stacked
semisubmersibles (Ocean America and Ocean Rover), impact of cold-stacked period for Ocean Valiant beginning June 2020, Ocean Valor beginning February 2021, and includes Ocean GreatWhite and Ocean Onyx cold-stacked periods in 2020 and 2021.
(2) Adjusted Total Utilization excludes impact of two cold- stacked semisubmersibles (Ocean America and Ocean Rover), impact of Ocean Valiant during cold-stacked
period beginning June 2020, impact of Ocean Valor during cold-stacked period beginning February 2021, impact of Ocean GreatWhite while cold-stacked in 2020 and 2021, and impact of Ocean Onyx while cold-stacked in 2020.
(3) Rig count figures include partial-year ownership of Ocean Confidence, which was cold-stacked and sold in February 2020. Assumes Ocean Rover is scrapped in July 2021 and Ocean
America is sold in February 2021.
Diamond Offshore | Management Presentation
7
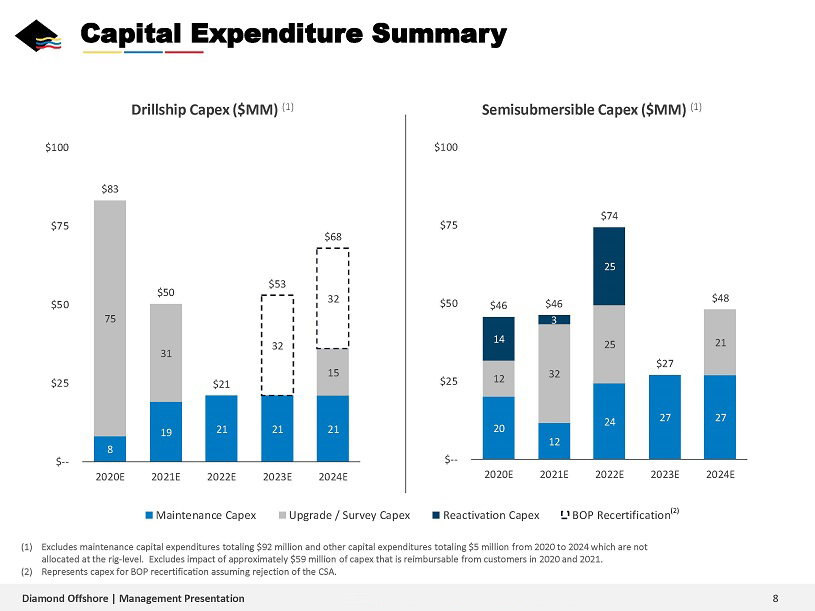
Capital Expenditure Summary
Drillship Capex
($MM) (1) Semisubmersible Capex ($MM) (1)
100 75 50 25
$— $—
$—
0 0 0 0 0 0 2020E 2021E 2022E 2023E ($32) 2024E ($32)
Maintenance
Capex Upgrade / Survey Capex Reactivation Capex BOP Recertification(2)
(1) Excludes maintenance capital expenditures totaling $92 million and other capital
expenditures totaling $5 million from 2020 to 2024 which are not allocated at the rig-level. Excludes impact of approximately $59 million of capex that is reimbursable from customers in 2020 and
2021.
(2) Represents capex for BOP recertification assuming rejection of the CSA.
Diamond Offshore | Management Presentation
8
