Attached files
| file | filename |
|---|---|
| EX-99.1 - EX-99.1 EARNINGS RELEASE - TEXAS CAPITAL BANCSHARES INC/TX | a1212021exhibit991.htm |
| 8-K - 8-K - TEXAS CAPITAL BANCSHARES INC/TX | tcbi-20210121.htm |

Q4-2020 Earnings January 21, 2021
2 Forward Looking Statements This communication contains “forward-looking statements” within the meaning of the Private Securities Litigation Reform Act of 1995 regarding our financial condition, results of operations, business plans and future performance. These statements are not historical in nature and can generally be identified by such words as “believe,” “expect,” “estimate,” “anticipate,” “plan,” “may,” “will,” “forecast,” “could,” “should,” “projects,” “targeted,,” “continue,,” “intend” and similar expressions. Because forward-looking statements relate to future results and occurrences, they are subject to inherent uncertainties, risks, and changes in circumstances that are difficult to predict. A number of factors, many of which are beyond our control, could cause actual results to differ materially from future results expressed or implied by such forward-looking statements. These factors include, but are not limited to, (1) the credit quality of our loan portfolio, (2) general economic conditions in the United States, globally and in our markets and the impact they may have on us and our customers,, including the continued impact on our customers from volatility in oil and gas prices, (3) the material risks and uncertainties for the U.S. and world economies, and for our business, resulting from the ongoing COVID-19 pandemic and any other pandemic, epidemic or health-related crisis, (4) expectations regarding rates of default and credit losses, (5) volatility in the mortgage industry, (6) our business strategies, (7) our expectations about future financial performance, future growth and earnings, (8) the appropriateness of our allowance for credit losses and provision for credit losses, (9) our ability to identify, attract and retain qualified employees, (10) the impact of changing regulatory requirements and legislative changes on our business, (11) increased competition from banking organizations and other financial service providers, (12) interest rate risk, (13) greater than expected costs or difficulties related to the integration of new lines of business, products or new service offerings, (14) technological changes, (15) the cost and effects of cyber incidents or other failures, interruptions or security breaches of our systems or those of third-party providers, and (16) our success at managing the risk and uncertainties involved in the foregoing items. In addition, statements about the potential effects of the COVID-19 pandemic on our business, financial condition, liquidity and results of operations may constitute forward-looking statements and are subject to the risk that the actual effects may differ, possibly materially, from what is reflected in those forward-looking statements due to factors and future developments that are uncertain, unpredictable and in many cases beyond our control, including the scope, duration and severity of the COVID-19 pandemic, actions taken by governmental authorities and other parties in response to the COVID-19 pandemic, the scale of distribution and public acceptance of any vaccines for COVID-19 and the effectiveness of such vaccines in stemming or stopping the spread of COVID-19, and the direct and indirect impact of the COVID-19 pandemic on our customers, clients, third parties and us. These and other factors that could cause results to differ materially from those described in the forward-looking statements, as well as a discussion of the risks and uncertainties that may affect our business, can be found in our Annual Report on Form 10-K, our Quarterly Reports on Form 10-Q and in other filings we make with the Securities and Exchange Commission. The information contained in this communication speaks only as of its date. Except to the extent required by applicable law or regulation, we disclaim any obligation to update such factors or to publicly announce the results of any revisions to any of the forward-looking statements included herein to reflect future events or developments.
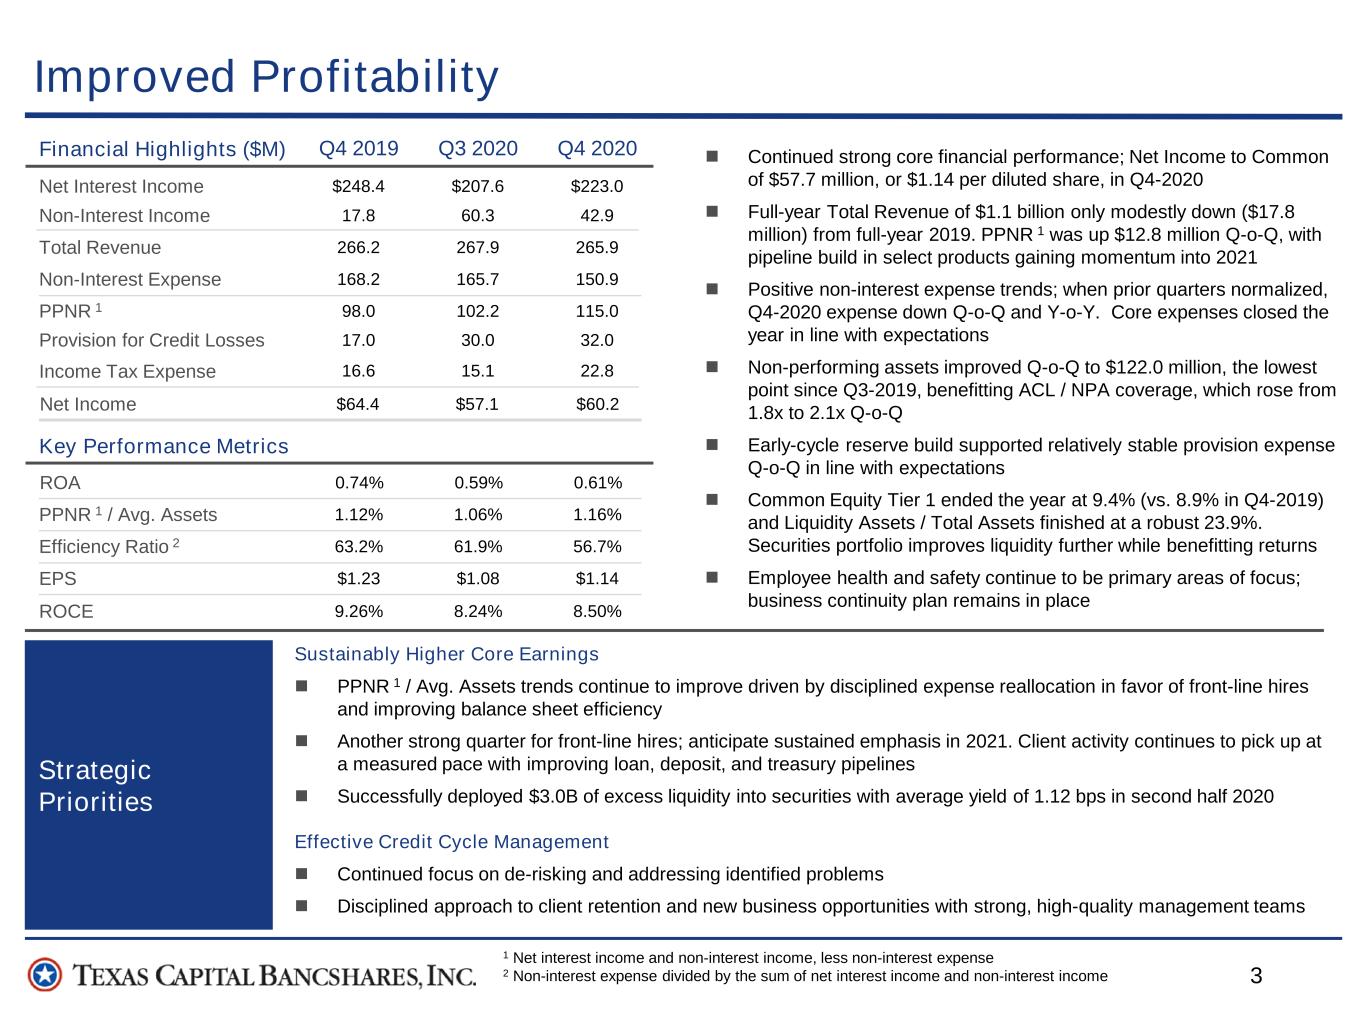
3 Improved Profitability Strategic Priorities Sustainably Higher Core Earnings PPNR 1 / Avg. Assets trends continue to improve driven by disciplined expense reallocation in favor of front-line hires and improving balance sheet efficiency Another strong quarter for front-line hires; anticipate sustained emphasis in 2021. Client activity continues to pick up at a measured pace with improving loan, deposit, and treasury pipelines Successfully deployed $3.0B of excess liquidity into securities with average yield of 1.12 bps in second half 2020 Effective Credit Cycle Management Continued focus on de-risking and addressing identified problems Disciplined approach to client retention and new business opportunities with strong, high-quality management teams Net Interest Income Financial Highlights ($M) Non-Interest Income Total Revenue Non-Interest Expense PPNR 1 Provision for Credit Losses Income Tax Expense PPNR 1 / Avg. Assets Efficiency Ratio 2 EPS ROA Key Performance Metrics $248.4 Q4 2019 Q3 2020 Q4 2020 17.8 266.2 168.2 98.0 16.6 $207.6 60.3 267.9 102.2 30.0 15.1 $223.0 42.9 265.9 115.0 32.0 22.8 1.12% 63.2% $1.23 9.26% 1.06% 61.9% $1.08 8.24% 1.16% 56.7% $1.14 8.50%ROCE 17.0 165.7 150.9 0.74% 0.59% 0.61% Net Income $64.4 $57.1 $60.2 1 Net interest income and non-interest income, less non-interest expense 2 Non-interest expense divided by the sum of net interest income and non-interest income Continued strong core financial performance; Net Income to Common of $57.7 million, or $1.14 per diluted share, in Q4-2020 Full-year Total Revenue of $1.1 billion only modestly down ($17.8 million) from full-year 2019. PPNR 1 was up $12.8 million Q-o-Q, with pipeline build in select products gaining momentum into 2021 Positive non-interest expense trends; when prior quarters normalized, Q4-2020 expense down Q-o-Q and Y-o-Y. Core expenses closed the year in line with expectations Non-performing assets improved Q-o-Q to $122.0 million, the lowest point since Q3-2019, benefitting ACL / NPA coverage, which rose from 1.8x to 2.1x Q-o-Q Early-cycle reserve build supported relatively stable provision expense Q-o-Q in line with expectations Common Equity Tier 1 ended the year at 9.4% (vs. 8.9% in Q4-2019) and Liquidity Assets / Total Assets finished at a robust 23.9%. Securities portfolio improves liquidity further while benefitting returns Employee health and safety continue to be primary areas of focus; business continuity plan remains in place

4 Commentary Credit Risk Management Highlights Credit Quality Q4 2019 Q3 2020 Q4 2020 0.79% 1.18% 0.71% 1.15% 1.84% 0.43% 1.04% 1.66% 0.33% ACL on Loans / Loans HFI ACL on Loans / Loans HFI excl MFLs NPAs / Earning Assets Criticized Composition | Year-over-Year 71% 37% 18% 41% 11% 22% Q4 2019 Q4 2020 Energy & Leveraged Real Estate All Other +11% +23% -34% $918M$584MQuarter-end Balances Positive mix shift of criticized assets YoY Composition has materially shifted from higher risk (enterprise value / commodity risk) categories to assets with more tangible secondary repayment valuation at improved LTVs De-risking strategies for the highest risk categories have proven effective Meaningful restructurings of Energy credits provided positive grade migration Loss risk in the category has accordingly improved The velocity of negative migration from “watch” to “special mention” continues to slow Non-accrual loans decreased for the fourth consecutive quarter Credit Trends Net charge-offs were primarily attributable to non- performing loans identified early and with proactive resolution Strong risk management resulting in upgrades, restructurings and payoffs at par offset negative migration largely attributable to CRE COVID-19 Update $90 million in deferrals at Q4-2020, compared to $166 million at Q3-2020 Deferral approvals are part of more holistic restructurings and amendments Economic View for CECL: Unemployment assumed to remain flat from current levels throughout 2021
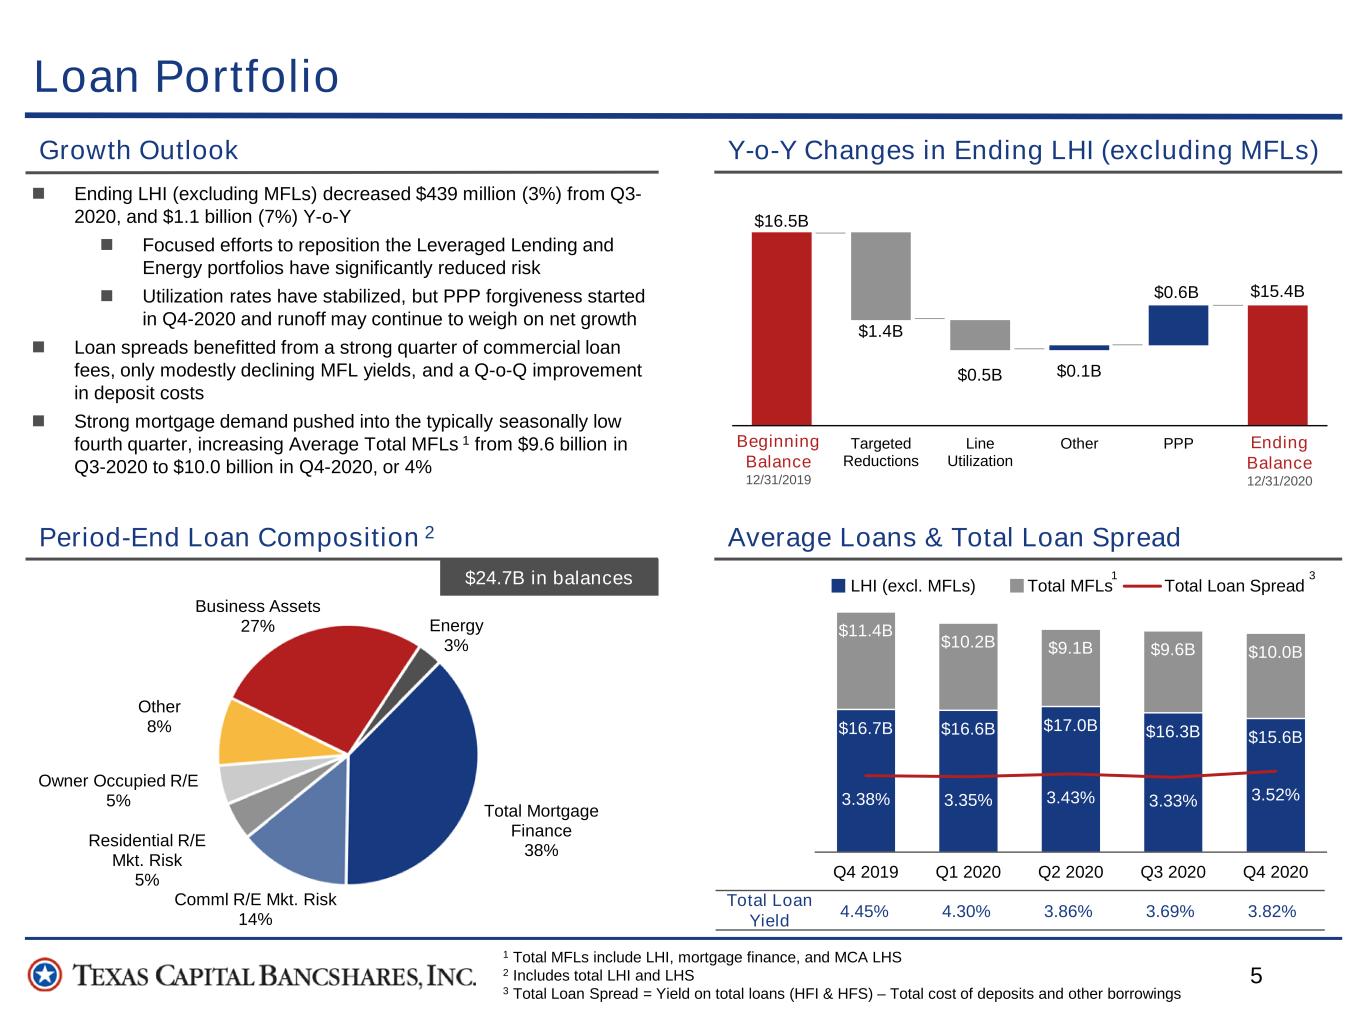
5 $16.5B $15.4B $1.4B $0.5B $0.1B $0.6B 12/31/2019 Targeted Reductions Line Utilization Other PPP 12/31/2020 $16.7B $16.6B $17.0B $16.3B $15.6B $11.4B $10.2B $9.1B $9.6B $10.0B 3.38% 3.35% 3.43% 3.33% 3.52% Q4 2019 Q1 2020 Q2 2020 Q3 2020 Q4 2020 LHI (excl. MFLs) Total MFLs Total Loan Spread 1 Total MFLs include LHI, mortgage finance, and MCA LHS 2 Includes total LHI and LHS 3 Total Loan Spread = Yield on total loans (HFI & HFS) – Total cost of deposits and other borrowings Loan Portfolio Growth Outlook Period-End Loan Composition 2 Average Loans & Total Loan Spread $24.7B in balances Ending LHI (excluding MFLs) decreased $439 million (3%) from Q3- 2020, and $1.1 billion (7%) Y-o-Y Focused efforts to reposition the Leveraged Lending and Energy portfolios have significantly reduced risk Utilization rates have stabilized, but PPP forgiveness started in Q4-2020 and runoff may continue to weigh on net growth Loan spreads benefitted from a strong quarter of commercial loan fees, only modestly declining MFL yields, and a Q-o-Q improvement in deposit costs Strong mortgage demand pushed into the typically seasonally low fourth quarter, increasing Average Total MFLs 1 from $9.6 billion in Q3-2020 to $10.0 billion in Q4-2020, or 4% 3 Total Loan Yield 3.86% 3.69% 3.82%4.45% 4.30% 1 Y-o-Y Changes in Ending LHI (excluding MFLs) Beginning Balance 12/31/2019 Ending Balance 12/31/2020 Business Assets 27% Energy 3% Total Mortgage Finance 38% Comml R/E Mkt. Risk 14% Residential R/E Mkt. Risk 5% Owner Occupied R/E 5% Other 8%

6 $14.7B $15.0B $17.0B $17.3B $16.7B $2.3B $2.7B $2.3B $2.3B $1.6B $9.4B $9.4B $10.8B $12.3B $12.7B Q4 2019 Q1 2020 Q2 2020 Q3 2020 Q4 2020 Interest-bearing core Interest-bearing brokered DDAs $26.5B $27.1B $30.2B $32.0B $31.0B $0.7B $0.3B $0.2B $0.2B 1.60% 1.04% 1.30% 0.22% Q4 2020 Q1 2021 Q2 2021 Q3 2021 Amount Maturing Rate $0.0B $3.0B 0.00% 0.46% Q4 2020 Q1 2021 0.99% 0.90% 0.42% 0.34% 0.29% 1.03% 0.92% 0.45% 0.38% 0.33% Q4 2019 Q1 2020 Q2 2020 Q3 2020 Q4 2020 Avg Cost of Deposits Total Funding Costs Brokered CD Maturities Deposits and Fundings Highlights Ending deposits declined $1.0 billion Q-o-Q, primarily in interest- bearing portfolios, but remain elevated as clients continued to maintain on-balance sheet cash Brokered deposit balances declined, as excess liquidity supported high-cost issuances to mature without replacement Focus remains on cost-effective deposit growth within verticals and core client relationships Though the pace of reduction is declining, funding costs continued to improve (5 bps Q-o-Q), as the mix trended towards lower-cost funding Price adjustments in higher-cost, indexed portfolios initiated late in Q4-2020 to drive reductions in excess liquidity Term FHLB balances secured in Q1-2020 will mature in Q1- 2021. FHLB borrowings will remain, but at lower rates Funding Costs Period-End Deposits Balances Q4-2020 and Upcoming Maturities Term FHLB Maturity 1 1 Term FHLB maturing in 1Q 2021. Short-term FHLB balances expected to continue, but at more favorable current-market rates

7 $584.1M $1,075.6M $918.4M 2.37% 4.27% 3.76% Q4 2019 Q3 2020 Q4 2020 Criticized Loans Criticized Loans % Total LHI $17.0M $30.0M $32.0M Q4 2019 Q3 2020 Q4 2020 $248.4M $207.6M $223.0M 2.95% 2.22% 2.32% Q4 2019 Q3 2020 Q4 2020 A strong Q-o-Q improvement in Total LHI yields (14 bps) was driven by fees, with net yields in the majority of portfolios demonstrating resiliency A $1.0 billion increase in average NIB deposits and maturing high-cost brokered CDs further improved total deposit costs (5 bps Q-o-Q) Successfully deployed $1.8 billion of excess liquidity into securities portfolio, further supporting revenue and NIM Commentary Q4-2020 Earnings Overview Net Interest Income & Margin Commentary Provision for Credit Losses Net Interest Margin Detail (bps) Criticized Loans N et In te re st In co m e C re di t E xp en se Q 3 20 20 Q 4 20 20 Lo an s (n et P P P ) Li qu id A ss et B al an ce s Li qu id A ss et Y ie ld s P P P L oa ns Y ie ld s O th er Fu nd in g C os ts -3.7 Criticized loans decreased Q-o-Q as a result of increased NCOs, payoffs, and upgrades NCOs increased Q-o-Q to $65.4 million, which is indicative of a maturing credit cycle. Future quarters are expected to remain elevated, however not at Q4-2020 levels Provision expense is expected to remain moderate compared to 1H20

8 $17.8M $60.3M $42.9M Q4 2019 Q3 2020 Q4 2020 $168.2M $165.7M $150.9M Q4 2019 Q3 2020 Q4 2020 $2.8M $2.9M $3.0M $2.3M $2.5M $2.7M $1.6M $0.5M $0.5M Q4 2019 Q3 2020 Q4 2020 Swap Fees Wealth Management Deposit Service Charges $6.7M $5.9M $6.2M $90.2M $84.1M $78.4M Q4 2019 Q3 2020 Q4 2020 Commentary Q4-2020 Earnings Overview Non-interest Income Commentary Non-interest Expense Fee Income Details Salary and Employee Benefits N on -in te re st in co m e N on -in te re st e xp en se A customer-focused approach has maintained Wealth Management relationships through a challenging environment; full year fees grew 13% from $8.8 million to $10.0 million Y-o-Y Swap Fees stable Q-o-Q; full-year fees $0.8 million higher Y-o-Y. A broader perspective inclusive of capital markets services is a focus in continuing core C&I initiatives Q-o-Q decline in Brokered Loan Fees (from lower volume) was partially offset by additional Servicing Income Normalized for Q2-2020 actions, full-year Salaries & Benefits expense was down from 2019 levels. Some gross savings already redirected to front line hires Core Comm & Tech expense (net of the Q3-2020 write-off) was flat Q-o-Q Q-o-Q increases in both MSR amortization expense ($1.9 million) and impairment expense ($1.4 million), driven by above average mortgage prepayment speeds from continued low interest rates

LOB Detail

10 $267M $328M $335M $98M $135M $48M Q4 2019 Q3 2020 Q4 2020 Mortgage Warehouse Mortgage Correspondent Lending +37.7% -64.5% +22.8% +2.3% Average Mortgage Warehouse Loans and Yields Loan Portfolio Detail – Mortgage Finance MWH + MCA Annualized Revenue Q4-2020 average MFLs (excluding MCA LHS) increased 5% Q-o-Q and 21% Y-o-Y, and MCA LHS declined Q-o-Q and Y-o-Y, as the Bank continued strategy to maximize revenue and risk-adjusted returns Near-term outlook suggests the portfolio will continue providing substantial risk-adjusted returns and acting as a counter-cyclical hedge to the traditional LHI portfolio, but trends are pivoting towards normalization Mortgage Finance’s relationship-driven pricing approach and “preferred provider” status continues to support yields (only 7 bp decrease Q-o-Q), allowing volume to offset potential declines in interest and drive higher non-interest fees Proven track-record of adjusting risk profile based on market liquidity; underlying portfolio quality remains the priority Commentary 0.0% 1.0% 2.0% 3.0% 4.0% 5.0% 6.0% $3.0B $4.0B $5.0B $6.0B $7.0B $8.0B $9.0B $10.0B Q4 2018 Q1 2019 Q2 2019 Q3 2019 Q4 2019 Q1 2020 Q2 2020 Q3 2020 Q4 2020 Mortgage Warehouse Yield 10YR 1M LIBOR

11 32% 14% 11% 9% 9% 9% 7% 9% Multi Family Office Senior Housing Hospitality Industrial Self Storage Retail Other 59% 7% 5% 3% 3% 3% 21% Texas California Colorado Florida Georgia Tennessee Other (all <3%) Loan Portfolio Detail – CRE History of proactive portfolio management evidenced by changes in growth rates thru-cycle and strong credit performance during periods of stress CRE managed as a line of business facilitating achievement of concentration objectives by product and geography. Underwriting focus on strong sponsors and developers with significant upfront cash equity Emphasis on equity and LTV at origination with recent appraisals demonstrating value support across collateral types Composition deliberately weighted towards lower risk multi-family ($1.2 billion in balances) with an emphasis on newly developed, Class A properties. Rent collection remains high Office and Industrial performance is stable with continued evidence of permanent market and/or sales appetite. Continuing to actively monitor Office for signs of emerging stress resulting from COVID- related restrictions Deferrals for COVID-impacted exposures are made in concert with loan restructures and modifications to support borrower performance longer term CRE 1 Portfolio Overview Portfolio Composition Net charge-off Performance 1 Excludes Specialized Residential Real Estate portfolio 2 Peers: ASB, BXS, BKU, BOKF, CBSH, CFR, FHN, FINN, FULT, HWC, ISBC, SNV, UMBF, WBS, WTFC $3.7B in balances 0.0% 0.5% 1.0% 1.5% 2.0% 2.5% 3.0% 3.5% 4.0% 4.5% 5.0% 20 07 20 08 20 09 20 10 20 11 20 12 20 13 20 14 20 15 20 16 20 17 20 18 20 19 Q 3 20 20 TCBI Peer Average 2

12 $211M $248M $324M $275M $142M 4.3% 8.8% 9.2% 11.7% 11.9% Q4 2019 Q1 2020 Q2 2020 Q3 2020 Q4 2020 Criticized Total ACL% $204M $188M $222M $254M $201M 8.1% 6.6% 6.2% 7.4% 5.5% Q4 2019 Q1 2020 Q2 2020 Q3 2020 Q4 2020 Criticized Total ACL% Loan Portfolio Detail – Leveraged & Energy Continued Criticized loan balance contraction driven by improved market activity resulting in payoffs, successful restructuring with upgrades, and resolution of previously disclosed problem credits Total Y-o-Y loan balances down ~45% from $1.4 billion to $0.8 billion Portfolio continues to trend towards improved granularity with lower inherent loss potential Company management actions taken through 2020 generally resulting in stabilized credit profiles. Recent commodity pricing improvements may provide further benefits ACL% at historical highs; no change to expectations for thru-cycle credit performance Diversified portfolio with some exposure to industries believed to be most impacted by COVID-19; others may be affected depending on their varying degrees of either reliance on consumer spending or supply chain risks Significant reduction in originations over the past 12 months, coupled with meaningful runoff, has reduced overall exposure by ~30%; remaining portfolio more reflective of desired exposure The decrease in Criticized reflects final resolution on borrowers impacted by COVID-19, repayments, and restructures resulting in upgrades Multi-period reduction in NPAs Energy $0.6B in balancesLeveraged Lending 9.1% 6.8%7.6%8.8% 11.4%NPAs % 1 1 Ratios calculated as a % of total energy or leveraged loans 1 5.2% 3.0%4.4%8.7% 6.4%NPAs % 2 1 $0.8B in balances
Conclusion
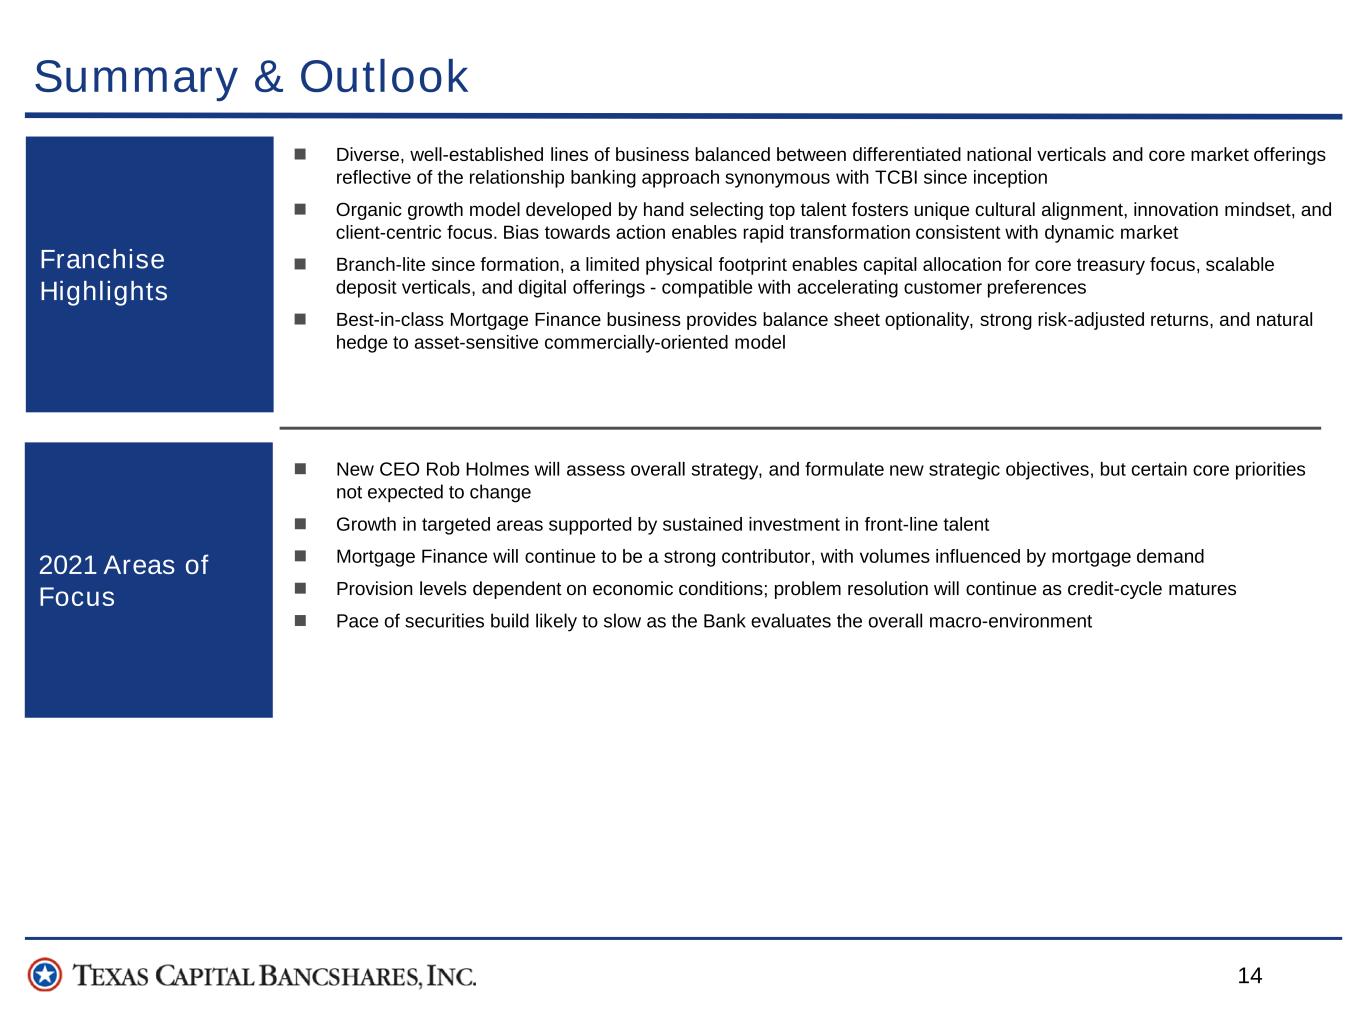
14 Summary & Outlook Diverse, well-established lines of business balanced between differentiated national verticals and core market offerings reflective of the relationship banking approach synonymous with TCBI since inception Organic growth model developed by hand selecting top talent fosters unique cultural alignment, innovation mindset, and client-centric focus. Bias towards action enables rapid transformation consistent with dynamic market Branch-lite since formation, a limited physical footprint enables capital allocation for core treasury focus, scalable deposit verticals, and digital offerings - compatible with accelerating customer preferences Best-in-class Mortgage Finance business provides balance sheet optionality, strong risk-adjusted returns, and natural hedge to asset-sensitive commercially-oriented model Franchise Highlights 2021 Areas of Focus New CEO Rob Holmes will assess overall strategy, and formulate new strategic objectives, but certain core priorities not expected to change Growth in targeted areas supported by sustained investment in front-line talent Mortgage Finance will continue to be a strong contributor, with volumes influenced by mortgage demand Provision levels dependent on economic conditions; problem resolution will continue as credit-cycle matures Pace of securities build likely to slow as the Bank evaluates the overall macro-environment
