Attached files
| file | filename |
|---|---|
| 8-K - FORM 8-K - Simulations Plus, Inc. | simulations_8k.htm |
Exhibit 99.1

Needham 23 rd Annual Virtual Growth Conference January 14, 2021 (NASDAQ:SLP)

With the exception of historical information, the matters discussed in this presentation are forward - looking statements that involve a number of risks and uncertainties . The actual results of the Company could differ significantly from those statements . Factors that could cause or contribute to such differences include, but are not limited to : continuing demand for the Company’s products, competitive factors, the Company’s ability to finance future growth, the Company’s ability to produce and market new products in a timely fashion, the Company’s ability to continue to attract and retain skilled personnel, and the Company’s ability to sustain or improve current levels of productivity . Further information on the Company’s risk factors is contained in the Company’s quarterly and annual reports and filed with the Securities and Exchange Commission . Safe Harbor Statement

□ Industry - leading provider of modeling and simulation solutions used by major pharmaceutical, biotech, chemical, consumer goods companies and regulatory agencies worldwide □ Innovative software and services to improve drug development from discovery to regulatory approval with supportive guidance from the FDA and ability to lower cost and time to market with a higher likelihood of success □ Solutions bridge machine learning and include pharmacokinetic - pharmacodynamic ( PKPD ), quantitative systems pharmacology & toxicology ( QSP/QST ), and physiologically based pharmacokinetic ( PBPK ) modeling □ 10+ year track record of consistent revenue and profitability growth and successful M&A strategy Company Overview 3

• Our solutions allow customers to model and predict results of chemical and biological tests required in the R&D process to improve success rates at multiple points in the process: − Computational AI models help scientists streamline and improve their processes − Machine learning improves the models with ever - growing data sets − Better informed clinical trial design and analyze clinical results − Identify potential safety liabilities earlier, avoiding costly clinical failures − Optimize efficacy and minimize toxicity by efficiently identifying dosing regimens Our Value Proposition Avg. cost of $1.4B and 10+ years to bring a drug to market 1,2 4 We’ve helped bring 40+ drugs to market and informed multiple development programs
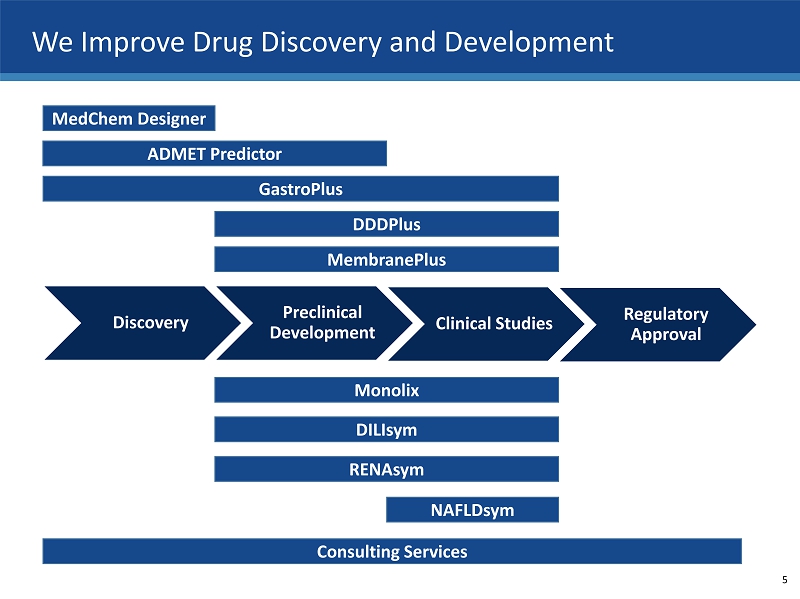
We Improve Drug Discovery and Development Discovery Preclinical Development Clinical Studies Regulatory Approval MedChem Designer ADMET Predictor GastroPlus DDDPlus MembranePlus DILIsym Monolix NAFLDsym Consulting Services RENAsym 5

PKPD Software Solutions Population PKPD Model to support dose regimen, risk exposure, clinical trial protocol design and analysis, drug label specifications and regulatory submission KIWI Monolix Suite Cloud - based data management application Datxplore PKanalix Mlxplore Monolix Simulx Exploration and visualization of data Non - compartmental and compartmental analysis Exploration and visualization of complex models Non - linear mixed effects (NME) modeling engine Clinical trial pharmacometrics simulations 6

QSP/QST Software Solutions Determine potential drug - induced liver injury hazard posed by individual drug candidates to support clinical trial optimization Additional QSP models NAFLDsym RENAsym DILIsym Assess the potential for drug - induced kidney injury of drug candidates to support clinical trial optimization and clinical trial decision making NASH model to predict efficacy for treatment modalities to support clinical trial optimization and clinical trial decision making IPFsym (Idiopathic pulmonary fibrosis) RADAsym (Acute radiation exposure) 7

PBPK Software Solutions and AI Data Mining Simulating IV, oral, oral cavity, ocular, inhalation, skin and IM absorption, PBPK, PBBM, PD modeling and drug - drug interactions MembranePlu s MedChem Designer DDDPlus ADMET Predictor GastroPlus QSAR modeling enabling rapid prediction of 140+ ADMET properties Used for lead generation and optimization Mechanistic simulation engine for the in vitro dissolution predictions to accelerate and optimize drug formulation Predict how fast a drug candidate will pass across the important physiological membrane barriers (GI, BBB) Chemical sketching tool with ADMET property predictions in connection with ADMET Predictor 8

• 70+ scientific PhD experts provide insightful solutions to improve the productivity of science - based drug development • Focusing on lead selection, pharmacology, ADMET and DMPK, dose regimen, efficacy and safety • Capabilities include: − Population PKPD data assembly, modeling, simulation, analysis and regulatory submission − PBPK modeling and simulation − Liver and kidney safety modeling and analysis − QSP/QST modeling support and analysis − AI drug candidate prioritization − Global regulatory strategies − Regulatory and scientific writing Services Solutions 9

Janssen Case Study: Accelerating Regulatory Interactions Virtual crossover trials to establish drug product specification after manufacturing changes • Janssen changed the manufacturing process to improve efficiencies with scale - up techniques post approval • FDA requested clinical study to confirm bioequivalence • Built and validated the baseline model in GastroPlus® using existing clinical data from previously approved lots • Assessed impact of formulation changes; defined drug product specifications • Performed virtual trial simulations in different populations to confirm bioequivalence • FDA accepted the GastroPlus® modeling results, clinical study request was waived 10

In Silico Methods Improve the Probability of Phase 3 Success Client Case Study: Strategic Use of Modeling & Simulation • Client with novel antibody for prophylactic use in competitive migraine market had Phase 3 development plan with predicted probability of success of <15% • Iteratively developed model throughout Phase 1 & Phase 2 • I mplemented model - based clinical trial simulation strategy to improve Phase 3 design • Phase 3 trials demonstrated safety and efficacy in preventing migraine • Months of development time and millions of dollars saved by avoiding failed Phase 3 trials, also reduced time to approval and market • Reduced unnecessary burden on patients by evaluating multiple alternatives in silico before running trials 11

Revenue Growth Drivers Increasing acceptance of modeling and simulation by FDA and drug industry High customer satisfaction with ~95% software contract renewal rate (by fees) Recently improved and expanded sales infrastructure Increasing opportunities for product and service cross - selling Synergistic acquisitions Steadily increasing industry R&D spend 19%+ Revenue CAGR 12

$14.9 $17.0 $18.5 $21.6 $9.2 $12.7 $15.5 $20.0 FY17 FY18 FY19 FY20 Software Services Consistent Year - over - Year Revenue Performance 19% CAGR (in millions) 22% Growth 13 $ 24.1 $ 29.7 $ 34.0 $ 41.6

FY20 Software and Services Mix 14 Software Products % of Total Revenues 34% 10% 4% 4% GastroPlus ADMET Predictor Monolix Suite* Other Software 10% 15% 23% PBPK QSP/ QST PKPD Services Offerings % of Total Revenues

• Expand product offerings through opportunistic acquisitions − Fill gaps in the current product offerings − Focus on immediately or near - term accretive opportunities − Fragmented industry amenable to consolidation • Further expand global sales reach − Increase sales effort to drive new customer growth in U.S., Europe and Asia − Expand client base in the small and mid - sized biotechnology space − Focus on cross - selling efforts to increase average revenue per customer • Increase R&D investment to enhance existing models and develop new tools to broaden product offerings Strategic Opportunities for Expansion and Growth 15

• Total Revenue Growth − Q1 performance: 14% y/y growth − Full - year target range: 15 - 20% y/y organic growth plus 3 - 5% from Lixoft • Software Revenue Growth − Q1 performance: 35% y/y growth − Full - year target range: 20 - 25% y/y growth • Services Revenue Growth − Q1 performance: 6% y/y decline − Full - year target range: 25 - 30% y/y growth • Q1 Profitability − Gross margin was 77%, up from 72% − Net income increased 21% y/y to $2.5 million − Diluted earnings per share increased 9% y/y to $0.12 • M&A Efforts − Continuing to explore opportunities and acquisitions would be incremental to revenue growth targets above Q1 FY21 Performance & FY21 Full Year Outlook 16

• Provider of innovative modeling and simulation software and consulting services focused on pharmaceutical and biotechnology companies − Solutions from early discovery through regulatory approval • Pure play in the in silico drug discovery space • Growing acceptance of technology by regulators and industry with supportive guidance issued by the FDA • Products have the potential to reduce drug development costs and time while improving success rates • Steady growth in pharmaceutical industry R&D expenditures provides expanding target market − ~$170B in 2020 growing around 3% per year 3 • Ten - year track record of consistent revenue and profitability growth − Recent revenue CAGR of 20%+ Investment Highlights 17

Financial Summary and Selected Financial Information Nasdaq SLP Q1 Cash and short - term investments $119M Q1 Borrowed Debt Outstanding $0 Market Capitalization (a/o 1/5/21) $1.5B Q1 Fully Diluted Shares Out 20.8M 30 - Day Average Daily Trading Volume (a/o 1/5/21) ~198K 18

19 Thank you! https://www.simulations - plus.com

1. J Health Econ . 2016 May;47:20 - 33. 2. Brochure: “Biopharmaceutical Research & Development: The Process Behind New Medicines” . PhRMA. 3. EvaluatePharma® World Preview 2017, Outlook to 2022, 10th Edition, June 2017, p. 19. References 20