Attached files
| file | filename |
|---|---|
| 8-K - 8-K - Boot Barn Holdings, Inc. | boot-20210108x8k.htm |
Exhibit 99.1
| 1 ICR Conference January 2021 |

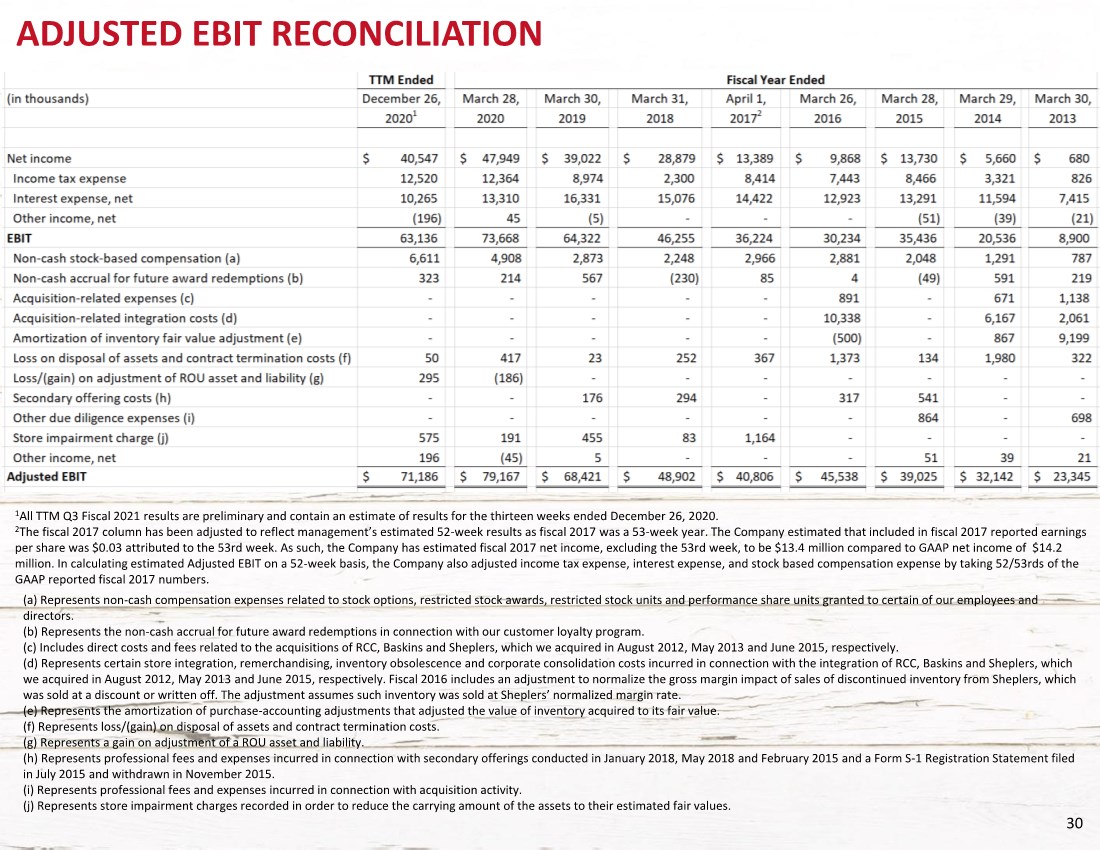
| 2 IMPORTANT INFORMATION Forward-Looking Statements This presentation contains forward-looking statements that are subject to risks and uncertainties. All statements other than statements of historical fact included in this presentation are forward- looking statements. You can identify forward-looking statements by the fact that they generally include words such as "anticipate," "estimate," "expect," "project," "plan,“ "intend," "believe," “outlook” and other words of similar meaning in connection with any discussion of the timing or nature of future operating or financial performance or other events but not all forward-looking statements contain these identifying words. These forward-looking statements are based on assumptions that the Company’s management has made in light of their industry experience and on their perceptions of historical trends, current conditions, expected future developments and other factors they believe are appropriate under the circumstances. As you consider this presentation, you should understand that these statements are not guarantees of performance or results. They involve risks, uncertainties (some of which are beyond the Company’s control) and assumptions. These risks, uncertainties and assumptions include, but are not limited to, the following: the effect of COVID-19 on our business operations, growth strategies, store traffic, employee availability, financial condition, liquidity and cash flow; decreases in consumer spending due to declines in consumer confidence, local economic conditions or changes in consumer preferences and the Company’s ability to effectively: execute on its growth strategy; maintain and enhance its strong brand image; compete effectively; maintain good relationships with its key suppliers; and improve and expand its exclusive product offerings. The Company discusses the foregoing risks and other risks in greater detail under the heading “Risk factors” in the periodic reports filed by the Company with the Securities and Exchange Commission. Although the Company believes that these forward-looking statements are based on reasonable assumptions, you should be aware that many factors could affect the Company’s actual financial results and cause them to differ materially from those anticipated in the forward-looking statements. Because of these factors, the Company cautions that you should not place undue reliance on any of these forward-looking statements. New risks and uncertainties arise from time to time, and it is impossible for the Company to predict those events or how they may affect the Company. Further, any forward-looking statement speaks only as of the date on which it is made. Except as required by law, the Company does not intend to update or revise the forward-looking statements in this presentation after the date of this presentation. Industry and Market Information Statements in this presentation concerning our industry and the markets in which we operate, including our general expectations and competitive position, business opportunity and market size, growth and share, are based on information from independent industry organizations and other third-party sources, data from our internal research and management estimates. Management estimates are derived from publicly available information and the information and data referred to above, and are based on assumptions and calculations made by us based upon our interpretation of such information and data. The information and data referred to above are imprecise and may prove to be inaccurate because the information cannot always be verified with complete certainty due to the limitations on the availability and reliability of raw data, the voluntary nature of the data gathering process and other limitations and uncertainties. As a result, please be aware that the data and statistical information in this presentation may differ from information provided by our competitors or from information found in current or future studies conducted by market research institutes, consultancy firms or independent sources. COVID-19 Impact The extent to which COVID-19 impacts our operations will depend on future developments, which are highly uncertain and difficult to predict, including, among others, the duration of the outbreak, new information that may emerge concerning the severity of COVID-19 and the actions, especially those taken by governmental authorities, to contain the pandemic or treat its impact. As events are rapidly changing, additional impacts may arise that we are not aware of currently. For more information about the risks, uncertainties, and other factors that could affect our future results, please see the risks described in our Annual Report on Form 10-K, our Quarterly Report on Form 10-Q and our subsequent filings with the Securities and Exchange Commission. Non-GAAP Financial Measures The Company presents Adjusted EBIT because it is an important financial measure that its management, board of directors and lenders use to assess the Company’s operating performance. However, Adjusted EBIT is a non-GAAP financial measure and should not be considered in isolation or as an alternative to net income or any other measure of financial performance calculated and presented in accordance with GAAP. The Company defines Adjusted EBIT as earnings before interest and income tax, adjusted to exclude non-cash stock-based compensation, the non-cash accrual for future award redemptions, acquisition-related expenses, acquisition-related integration costs, amortization of inventory fair value adjustment, loss on disposal of assets and contract termination costs, loss/(gain) on adjustment of ROU asset and liability, store impairment charges, secondary offering costs, and other due diligence expenses. In addition, for fiscal year 2017, which was a 53-week fiscal year, the Company has made further adjustments to account for the extra week. Since Adjusted EBIT is a non-GAAP financial measure, it is susceptible to varying calculations and the Company’s Adjusted EBIT may not be comparable to similarly titled measures of other companies, including companies in its industry. See the Appendix to this presentation for a reconciliation of Adjusted EBIT to Net Income. |
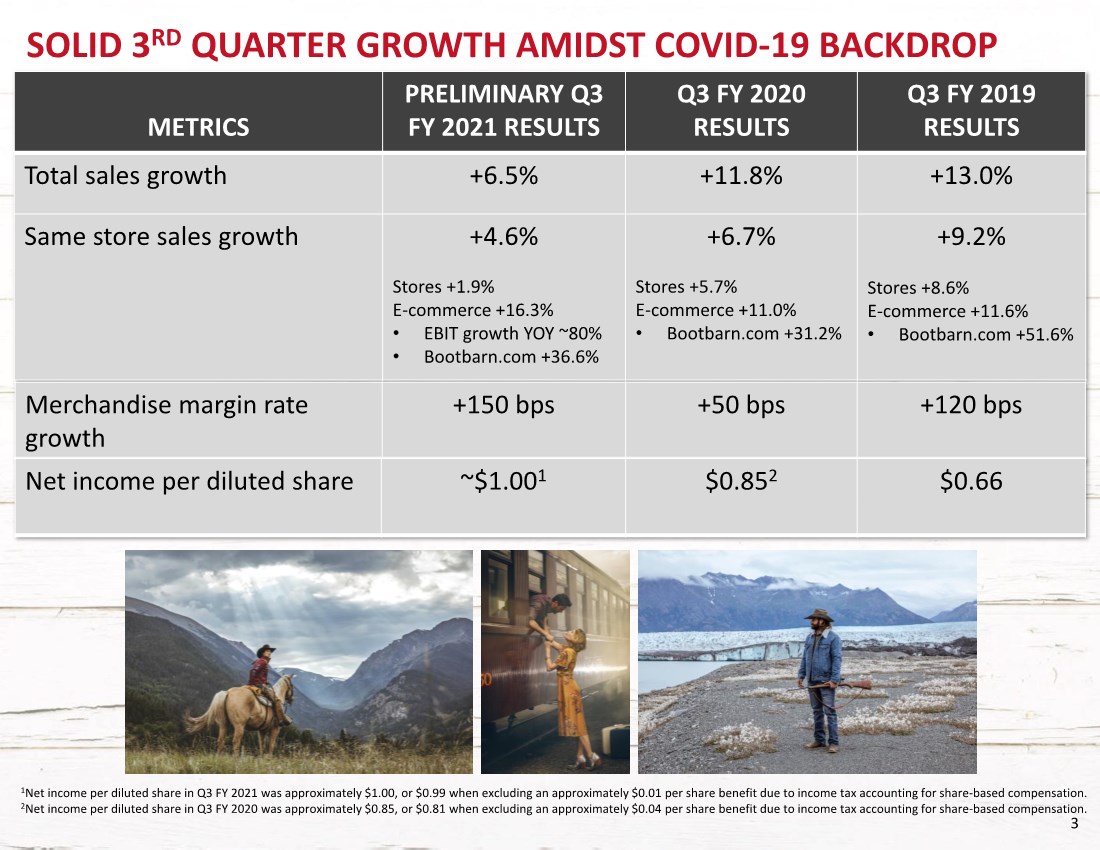
| 3 METRICS PRELIMINARY Q3 FY 2021 RESULTS Q3 FY 2020 RESULTS Q3 FY 2019 RESULTS Total sales growth +6.5% +11.8% +13.0% Same store sales growth +4.6% Stores +1.9% E-commerce +16.3% • EBIT growth YOY ~80% • Bootbarn.com +36.6% +6.7% Stores +5.7% E-commerce +11.0% • Bootbarn.com +31.2% +9.2% Stores +8.6% E-commerce +11.6% • Bootbarn.com +51.6% SOLID 3RD QUARTER GROWTH AMIDST COVID-19 BACKDROP 1Net income per diluted share in Q3 FY 2021 was approximately $1.00, or $0.99 when excluding an approximately $0.01 per share benefit due to income tax accounting for share-based compensation. 2Net income per diluted share in Q3 FY 2020 was approximately $0.85, or $0.81 when excluding an approximately $0.04 per share benefit due to income tax accounting for share-based compensation. Merchandise margin rate growth +150 bps +50 bps +120 bps Net income per diluted share ~$1.001 $0.852 $0.66 |
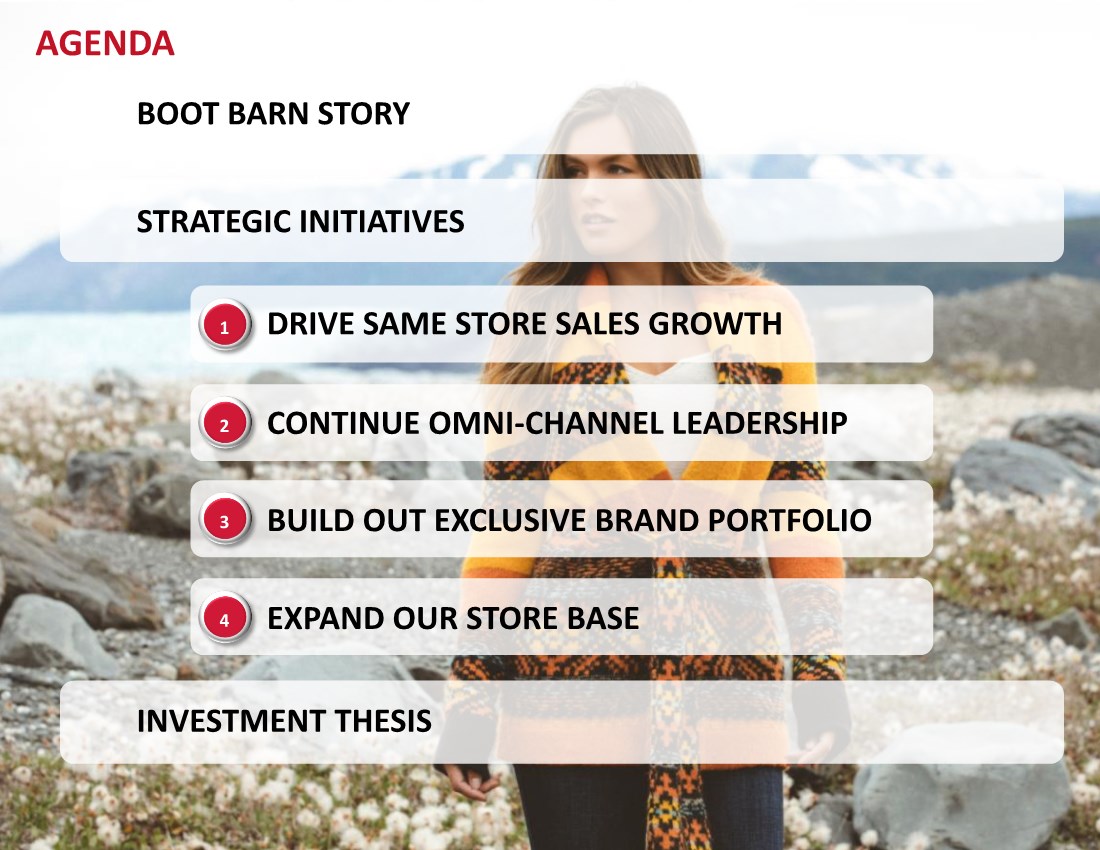
| 4 INVESTMENT THESIS STRATEGIC INITIATIVES CONTINUE OMNI-CHANNEL LEADERSHIP BUILD OUT EXCLUSIVE BRAND PORTFOLIO EXPAND OUR STORE BASE 1 2 3 4 BOOT BARN STORY AGENDA DRIVE SAME STORE SALES GROWTH |
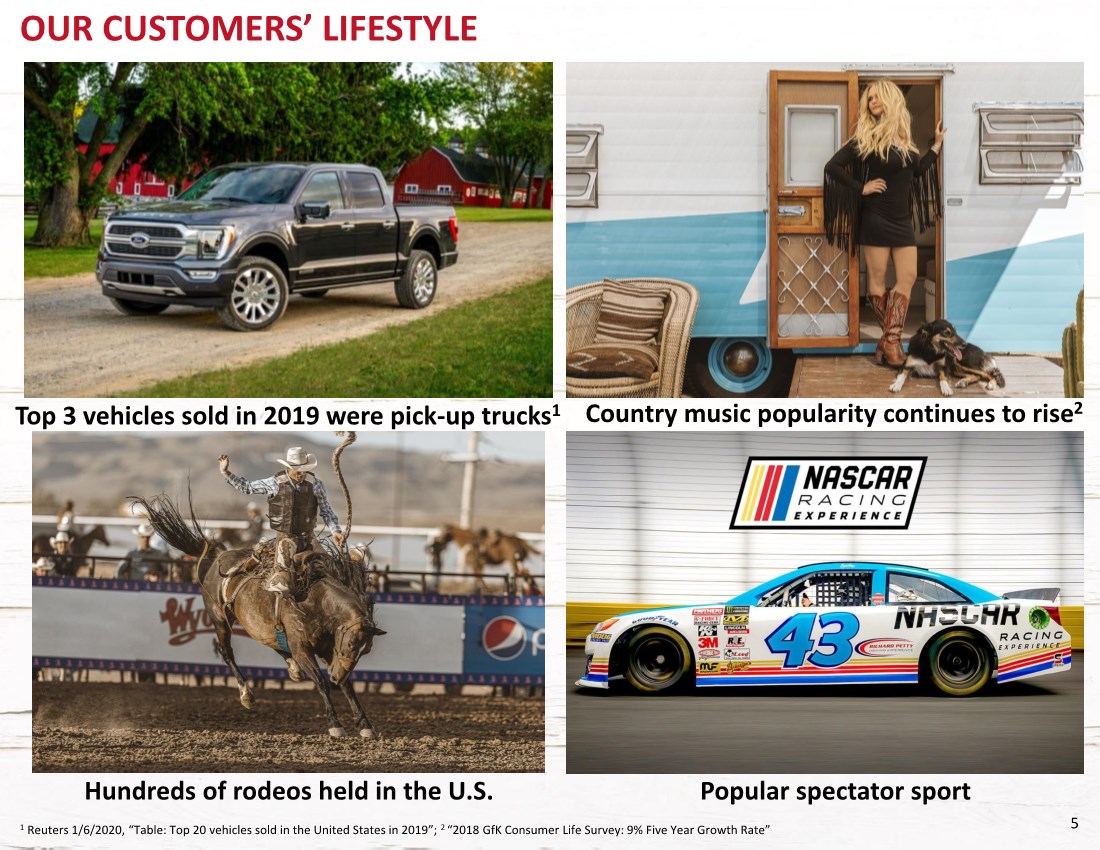
| 5 1 Reuters 1/6/2020, “Table: Top 20 vehicles sold in the United States in 2019”; 2 “2018 GfK Consumer Life Survey: 9% Five Year Growth Rate” OUR CUSTOMERS’ LIFESTYLE Country music popularity continues to rise2 Top 3 vehicles sold in 2019 were pick-up trucks1 Hundreds of rodeos held in the U.S. Popular spectator sport |
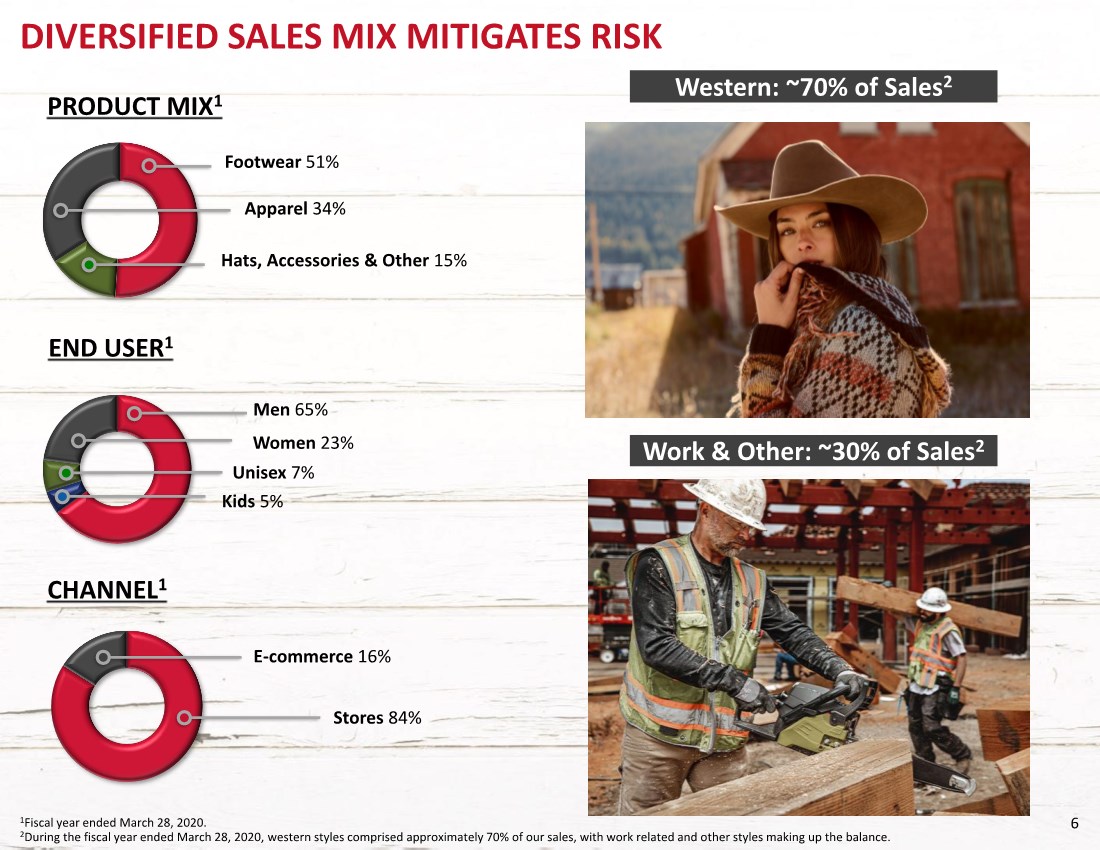
| 6 1Fiscal year ended March 28, 2020. 2During the fiscal year ended March 28, 2020, western styles comprised approximately 70% of our sales, with work related and other styles making up the balance. PRODUCT MIX1 DIVERSIFIED SALES MIX MITIGATES RISK END USER1 CHANNEL1 Footwear 51% Hats, Accessories & Other 15% Apparel 34% Women 23% Unisex 7% Men 65% Kids 5% E-commerce 16% Stores 84% Western: ~70% of Sales2 Work & Other: ~30% of Sales2 |
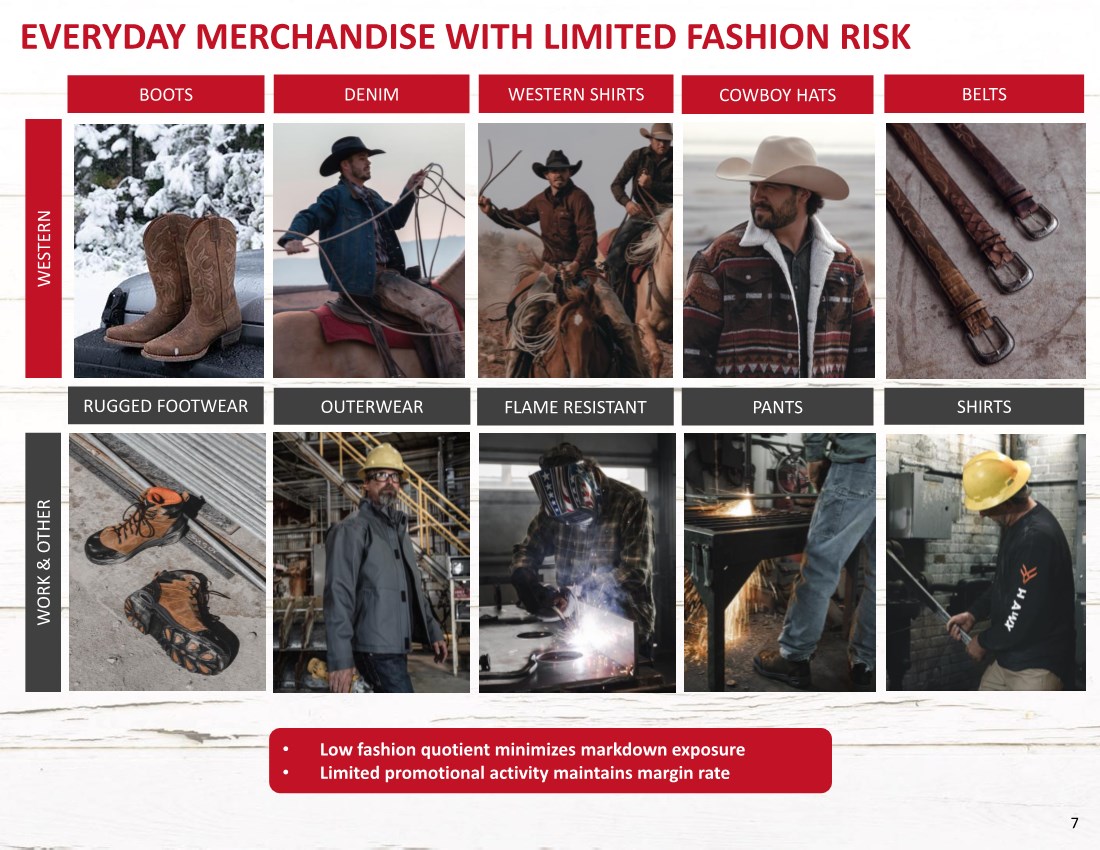
| 7 EVERYDAY MERCHANDISE WITH LIMITED FASHION RISK • Low fashion quotient minimizes markdown exposure • Limited promotional activity maintains margin rate RUGGED FOOTWEAR OUTERWEAR FLAME RESISTANT PANTS SHIRTS WORK & OTHER BOOTS DENIM WESTERN SHIRTS COWBOY HATS BELTS WESTERN |
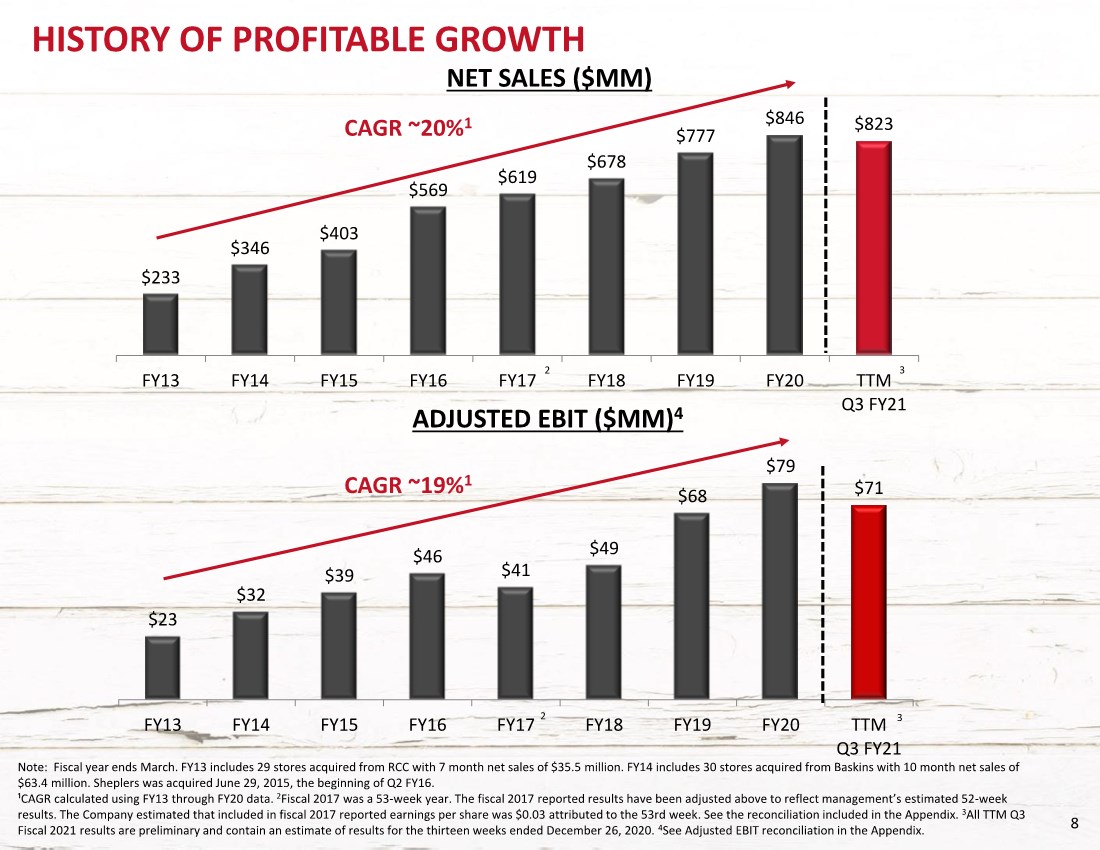
| 8 HISTORY OF PROFITABLE GROWTH Note: Fiscal year ends March. FY13 includes 29 stores acquired from RCC with 7 month net sales of $35.5 million. FY14 includes 30 stores acquired from Baskins with 10 month net sales of $63.4 million. Sheplers was acquired June 29, 2015, the beginning of Q2 FY16. ¹CAGR calculated using FY13 through FY20 data. 2Fiscal 2017 was a 53-week year. The fiscal 2017 reported results have been adjusted above to reflect management’s estimated 52-week results. The Company estimated that included in fiscal 2017 reported earnings per share was $0.03 attributed to the 53rd week. See the reconciliation included in the Appendix. 3All TTM Q3 Fiscal 2021 results are preliminary and contain an estimate of results for the thirteen weeks ended December 26, 2020. 4See Adjusted EBIT reconciliation in the Appendix. $233 $346 $403 $569 $619 $678 $777 $846 $823 FY13 FY14 FY15 FY16 FY17 FY18 FY19 FY20 TTM Q3 FY21 NET SALES ($MM) $23 $32 $39 $46 $41 $49 $68 $79 $71 FY13 FY14 FY15 FY16 FY17 FY18 FY19 FY20 TTM Q3 FY21 ADJUSTED EBIT ($MM)4 2 2 CAGR ~20%1 CAGR ~19%1 3 3 |
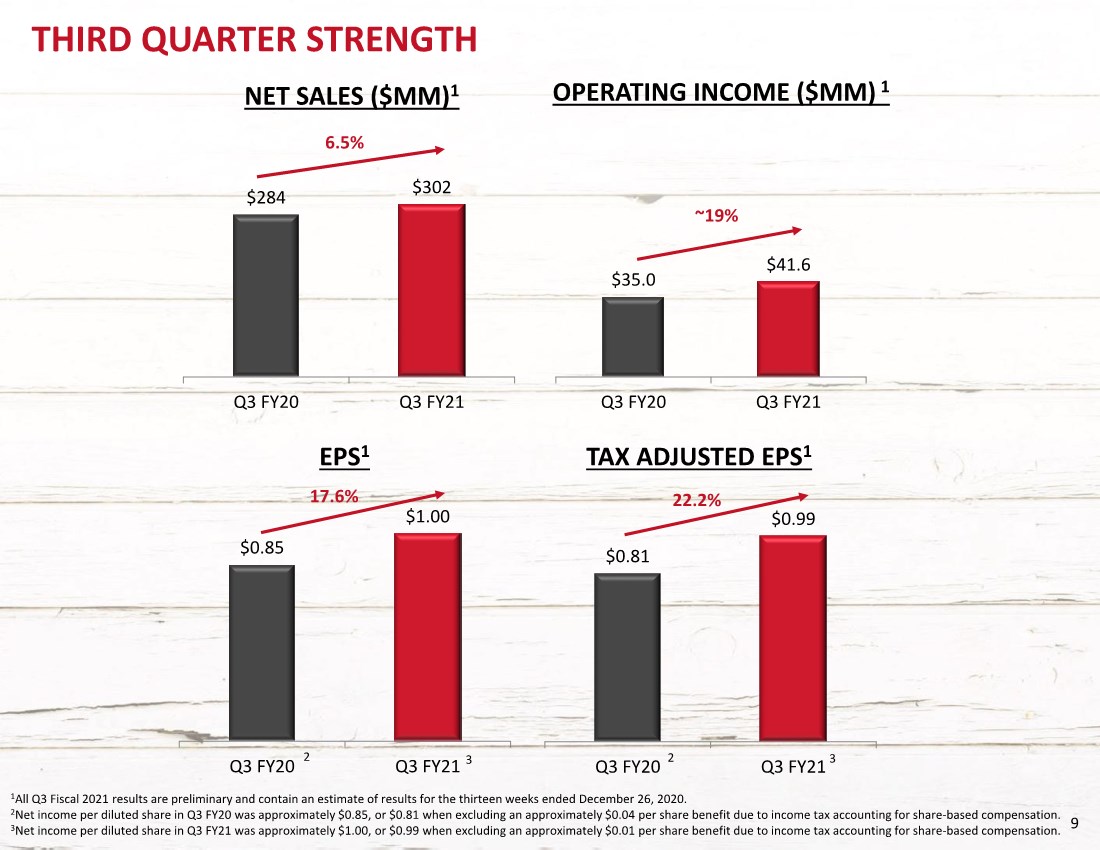
| 9 $0.85 $1.00 Q3 FY20 Q3 FY21 $284 $302 Q3 FY20 Q3 FY21 THIRD QUARTER STRENGTH NET SALES ($MM)1 OPERATING INCOME ($MM) 1 $35.0 $41.6 Q3 FY20 Q3 FY21 6.5% ~19% 1All Q3 Fiscal 2021 results are preliminary and contain an estimate of results for the thirteen weeks ended December 26, 2020. 2Net income per diluted share in Q3 FY20 was approximately $0.85, or $0.81 when excluding an approximately $0.04 per share benefit due to income tax accounting for share-based compensation. 3Net income per diluted share in Q3 FY21 was approximately $1.00, or $0.99 when excluding an approximately $0.01 per share benefit due to income tax accounting for share-based compensation. EPS1 2 3 TAX ADJUSTED EPS1 $0.81 $0.99 Q3 FY20 Q3 FY21 2 3 22.2% 17.6% |
| 10 10 STRATEGIC INITIATIVES CONTINUE OMNI-CHANNEL LEADERSHIP BUILD OUT EXCLUSIVE BRAND PORTFOLIO EXPAND OUR STORE BASE 1 2 3 4 DRIVE SAME STORE SALES GROWTH |
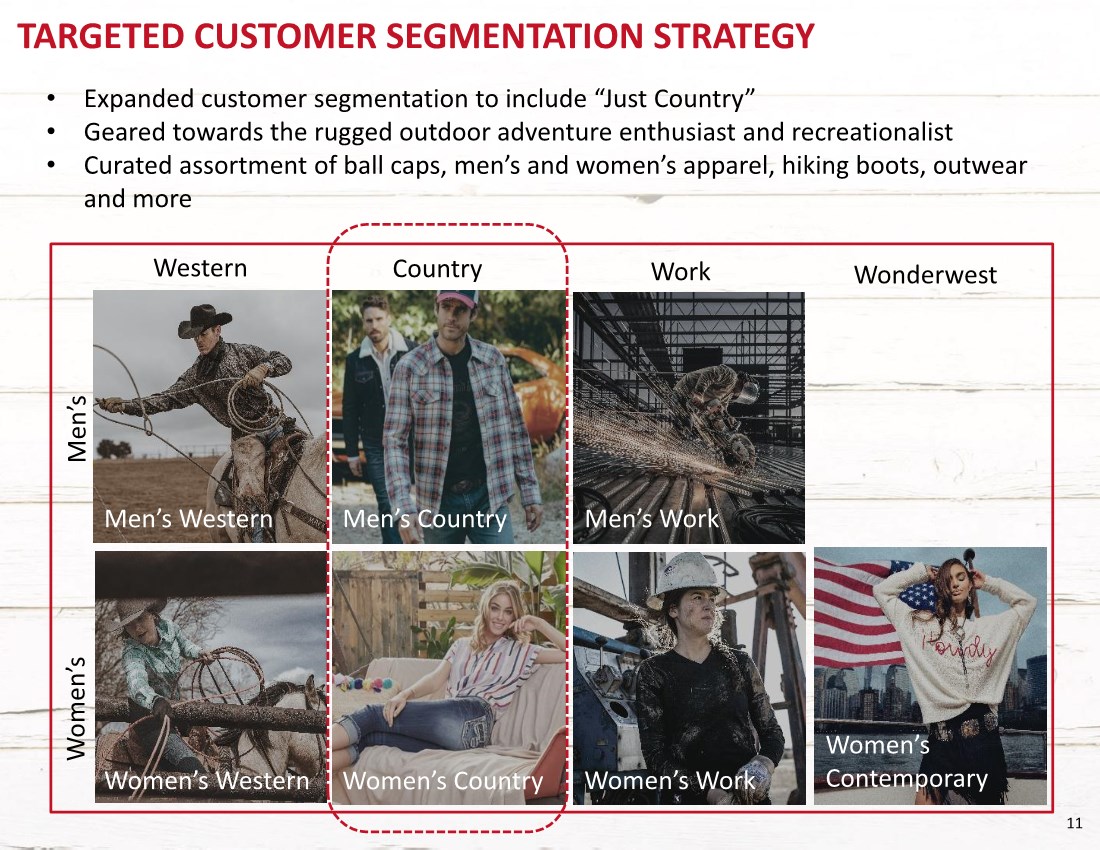
| 11 Western Work Wonderwest TARGETED CUSTOMER SEGMENTATION STRATEGY Western Work Wonderwest 11 Men’s Country Men’s Work Women’s Country Women’s Work Women’s Contemporary Men’s Western Women’s Western Country Women’s Men’s • Expanded customer segmentation to include “Just Country” • Geared towards the rugged outdoor adventure enthusiast and recreationalist • Curated assortment of ball caps, men’s and women’s apparel, hiking boots, outwear and more |
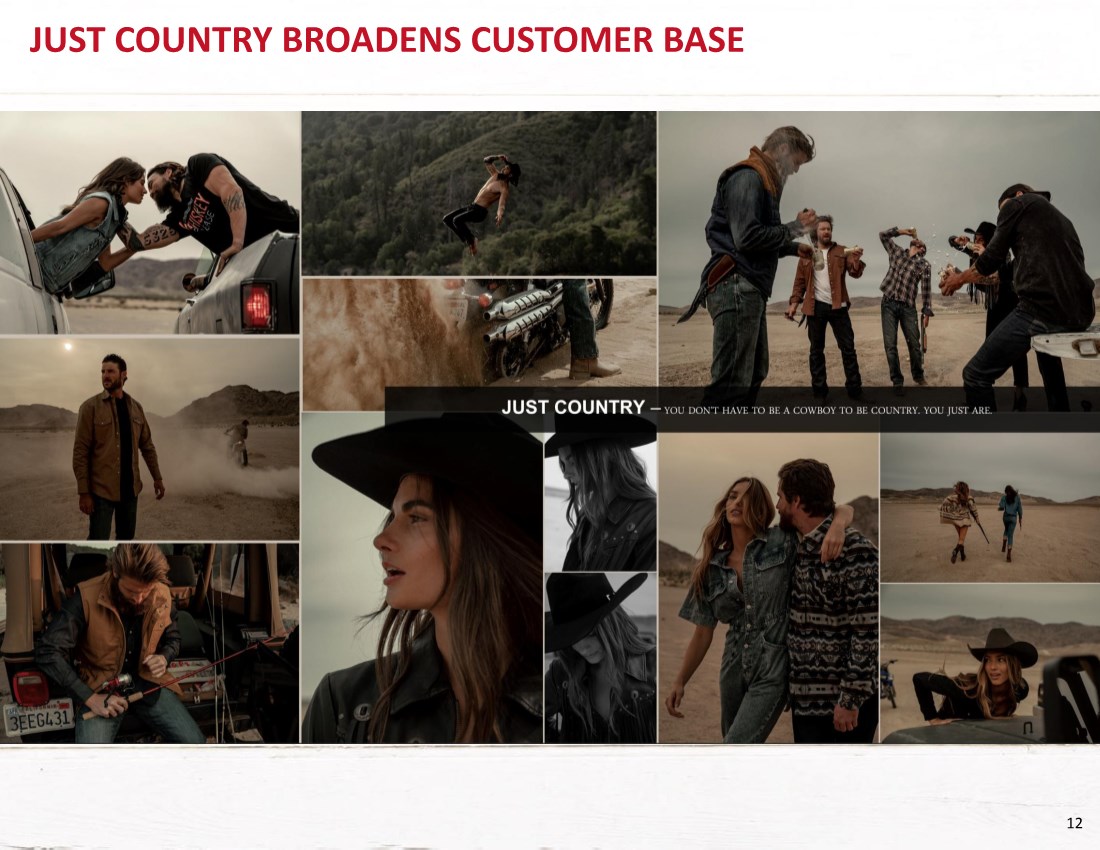
| 12 JUST COUNTRY BROADENS CUSTOMER BASE |
| 13 ENHANCED CREATIVE & MARKETING |
| 14 JUST COUNTRY MARKETING |

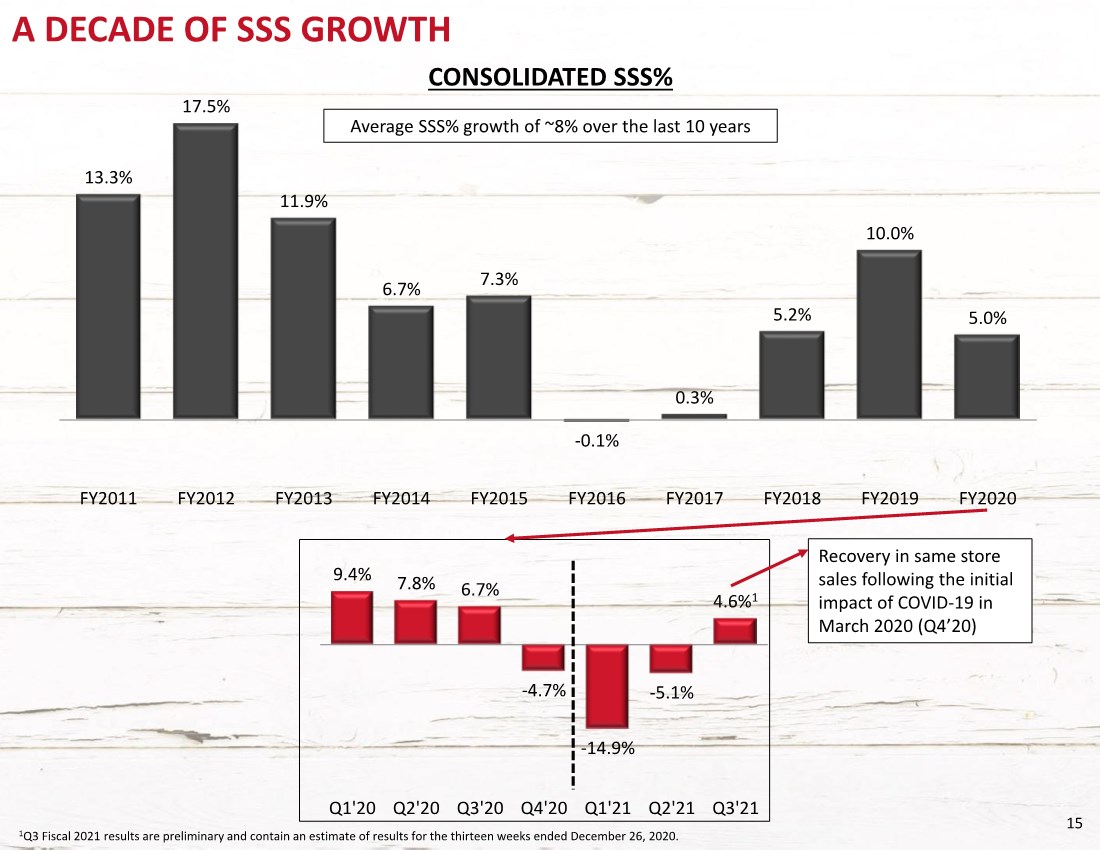
| 15 13.3% 17.5% 11.9% 6.7% 7.3% -0.1% 0.3% 5.2% 10.0% 5.0% FY2011 FY2012 FY2013 FY2014 FY2015 FY2016 FY2017 FY2018 FY2019 FY2020 A DECADE OF SSS GROWTH CONSOLIDATED SSS% 9.4% 7.8% 6.7% -4.7% -14.9% -5.1% 4.6%1 Q1'20 Q2'20 Q3'20 Q4'20 Q1'21 Q2'21 Q3'21 Recovery in same store sales following the initial impact of COVID-19 in March 2020 (Q4’20) Average SSS% growth of ~8% over the last 10 years 1Q3 Fiscal 2021 results are preliminary and contain an estimate of results for the thirteen weeks ended December 26, 2020. |
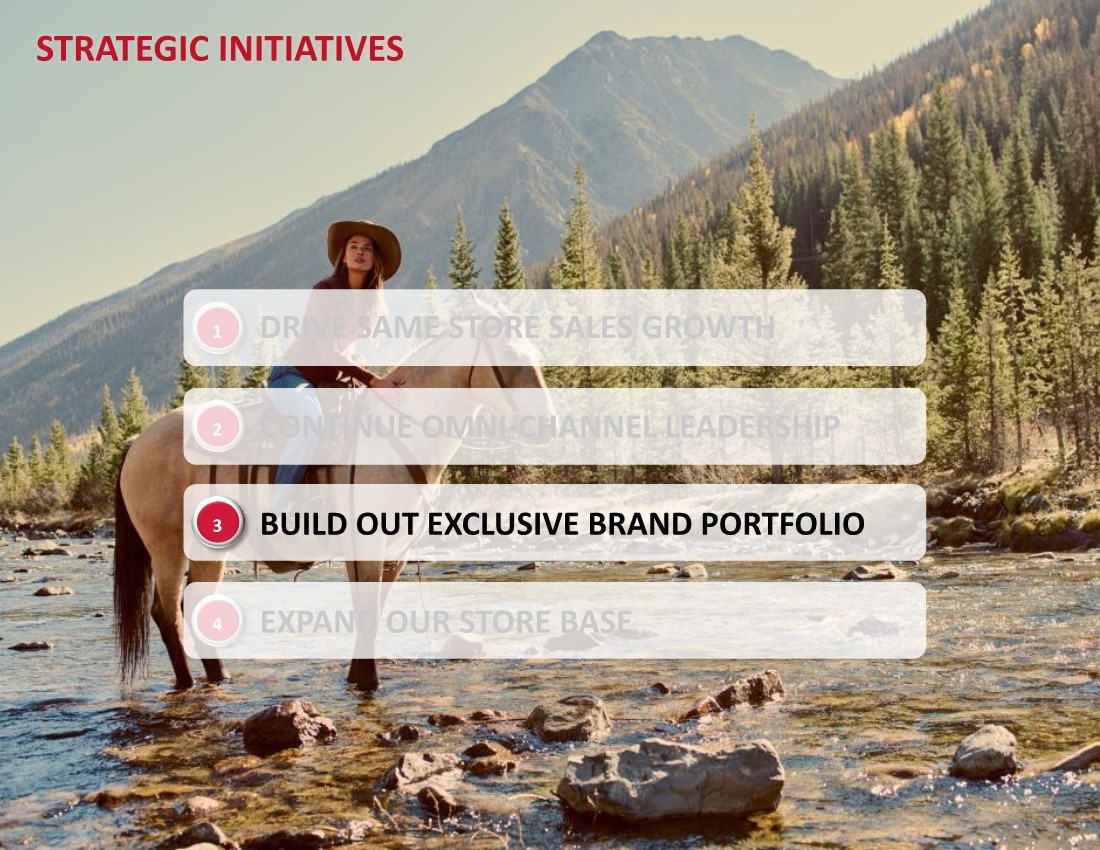
| 16 STRATEGIC INITIATIVES CONTINUE OMNI-CHANNEL LEADERSHIP EXPAND OUR STORE BASE 1 2 3 4 DRIVE SAME STORE SALES GROWTH BUILD OUT EXCLUSIVE BRAND PORTFOLIO |

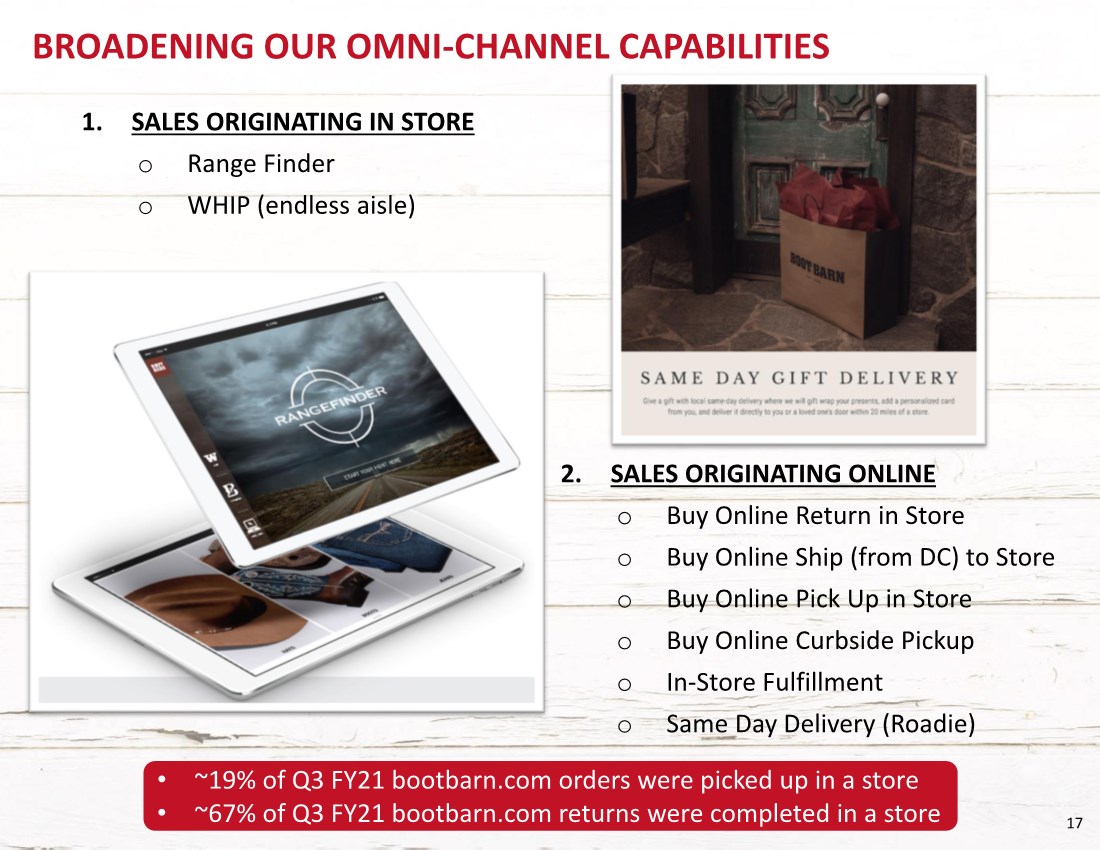
| 17 BROADENING OUR OMNI-CHANNEL CAPABILITIES 1. SALES ORIGINATING IN STORE o Range Finder o WHIP (endless aisle) 2. SALES ORIGINATING ONLINE o Buy Online Return in Store o Buy Online Ship (from DC) to Store o Buy Online Pick Up in Store o Buy Online Curbside Pickup o In-Store Fulfillment o Same Day Delivery (Roadie) • ~19% of Q3 FY21 bootbarn.com orders were picked up in a store • ~67% of Q3 FY21 bootbarn.com returns were completed in a store |
| 18 STRATEGIC INITIATIVES BUILD OUT EXCLUSIVE BRAND PORTFOLIO EXPAND OUR STORE BASE 1 2 3 4 DRIVE SAME STORE SALES GROWTH CONTINUE OMNI-CHANNEL LEADERSHIP |
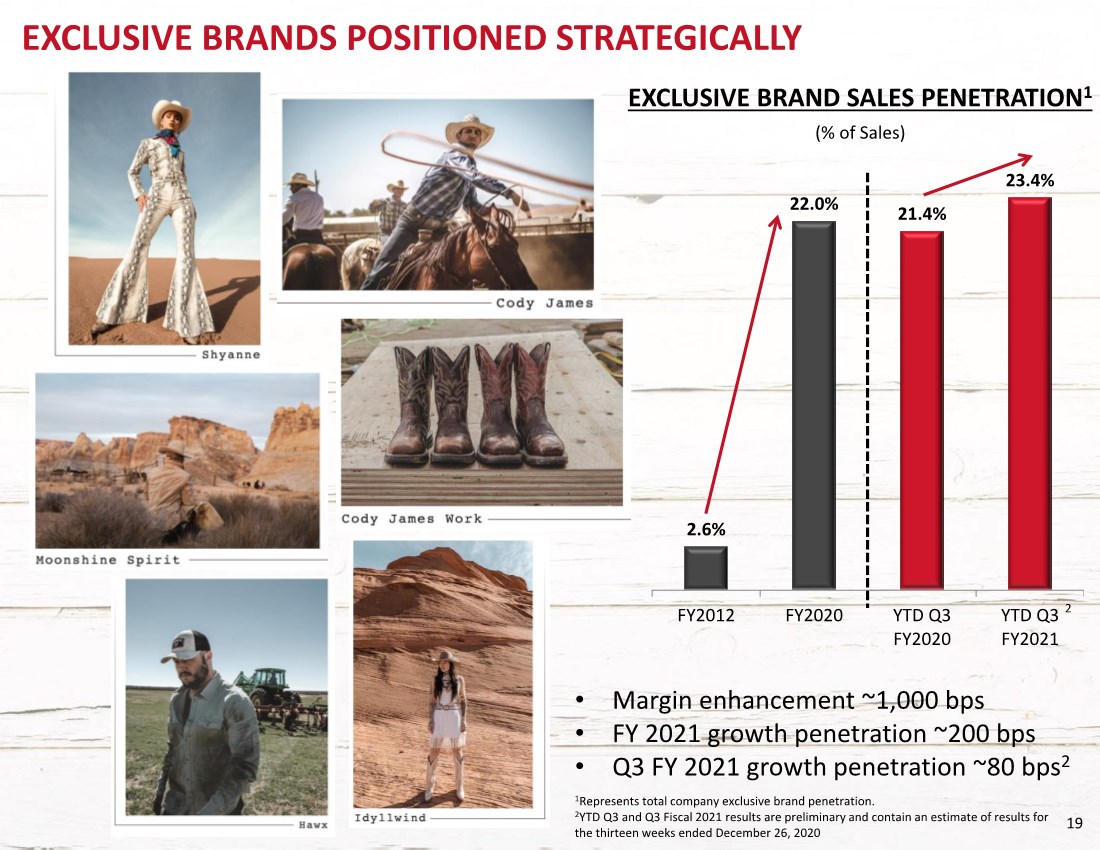
| 19 EXCLUSIVE BRANDS POSITIONED STRATEGICALLY 2.6% 22.0% 21.4% 23.4% FY2012 FY2020 YTD Q3 FY2020 YTD Q3 FY2021 (% of Sales) • Margin enhancement ~1,000 bps • FY 2021 growth penetration ~200 bps • Q3 FY 2021 growth penetration ~80 bps2 1Represents total company exclusive brand penetration. 2YTD Q3 and Q3 Fiscal 2021 results are preliminary and contain an estimate of results for the thirteen weeks ended December 26, 2020 EXCLUSIVE BRAND SALES PENETRATION1 2 |
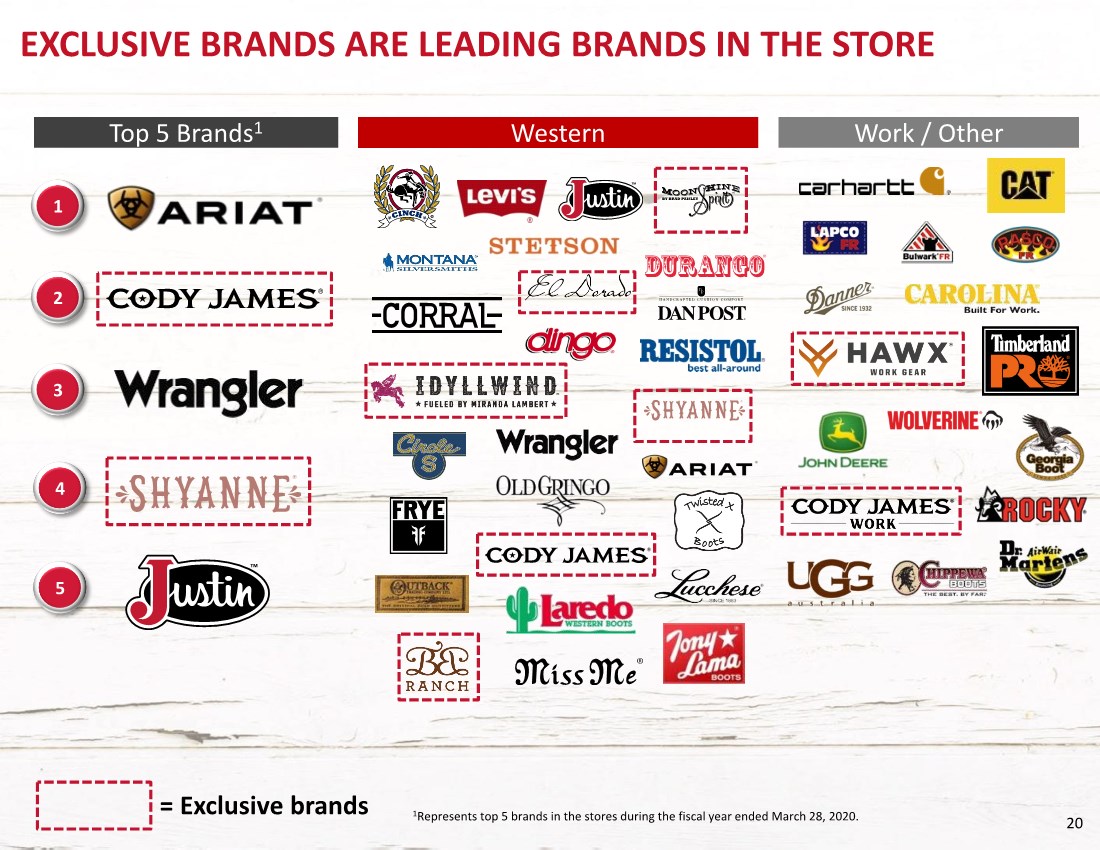
| 20 EXCLUSIVE BRANDS ARE LEADING BRANDS IN THE STORE Western Work / Other Top 5 Brands1 2 1 3 4 5 = Exclusive brands 1Represents top 5 brands in the stores during the fiscal year ended March 28, 2020. |
| 21 STRATEGIC INITIATIVES CONTINUE OMNI-CHANNEL LEADERSHIP BUILD OUT EXCLUSIVE BRAND PORTFOLIO EXPAND OUR STORE BASE 1 2 3 4 DRIVE SAME STORE SALES GROWTH |
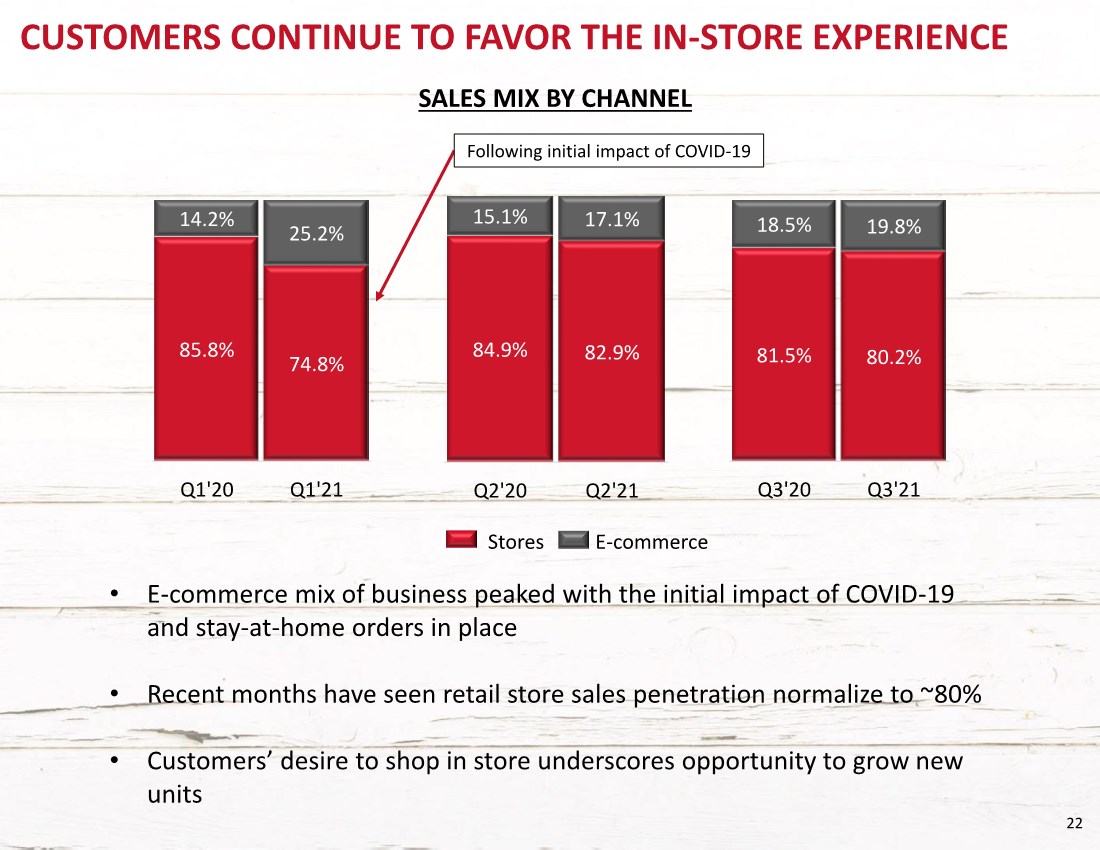
| 22 85.8% 74.8% 14.2% 25.2% Q1'20 Q1'21 CUSTOMERS CONTINUE TO FAVOR THE IN-STORE EXPERIENCE 84.9% 82.9% 15.1% 17.1% Q2'20 Q2'21 81.5% 80.2% 18.5% 19.8% Q3'20 Q3'21 SALES MIX BY CHANNEL Stores E-commerce Following initial impact of COVID-19 •E-commerce mix of business peaked with the initial impact of COVID-19 and stay-at-home orders in place • Recent months have seen retail store sales penetration normalize to ~80% • Customers’ desire to shop in store underscores opportunity to grow new units |
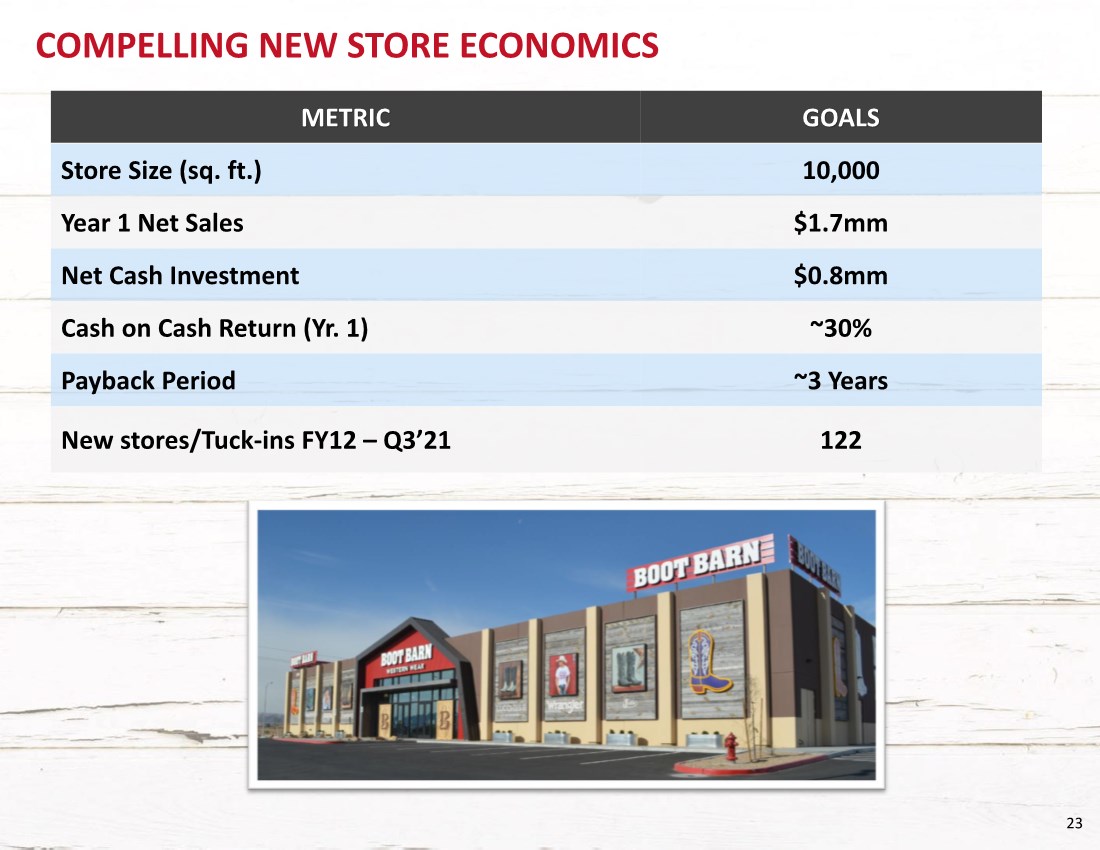
| 23 COMPELLING NEW STORE ECONOMICS METRIC GOALS Store Size (sq. ft.) 10,000 Year 1 Net Sales $1.7mm Net Cash Investment $0.8mm Cash on Cash Return (Yr. 1) ~30% Payback Period ~3 Years New stores/Tuck-ins FY12 – Q3’21 122 |
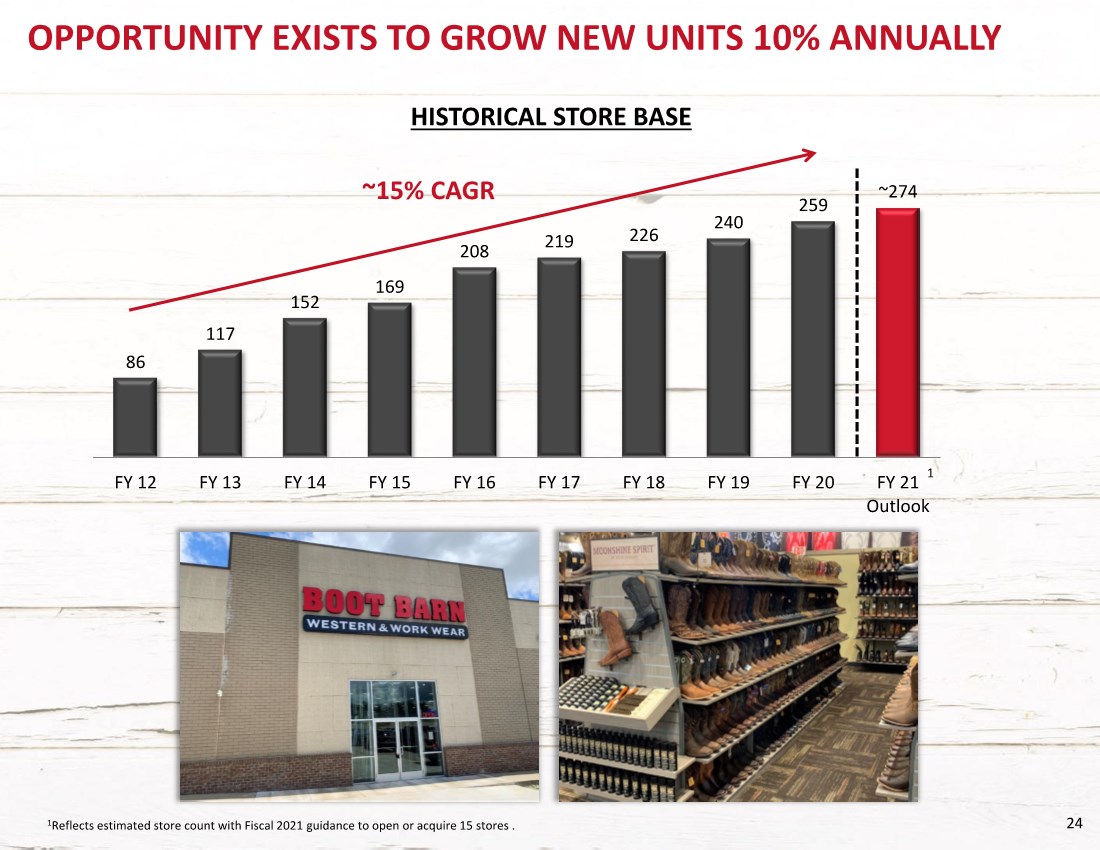
| 24 OPPORTUNITY EXISTS TO GROW NEW UNITS 10% ANNUALLY 86 117 152 169 208 219 226 240 259 ~274 FY 12 FY 13 FY 14 FY 15 FY 16 FY 17 FY 18 FY 19 FY 20 FY 21 Outlook HISTORICAL STORE BASE ~15% CAGR 1 1Reflects estimated store count with Fiscal 2021 guidance to open or acquire 15 stores . |
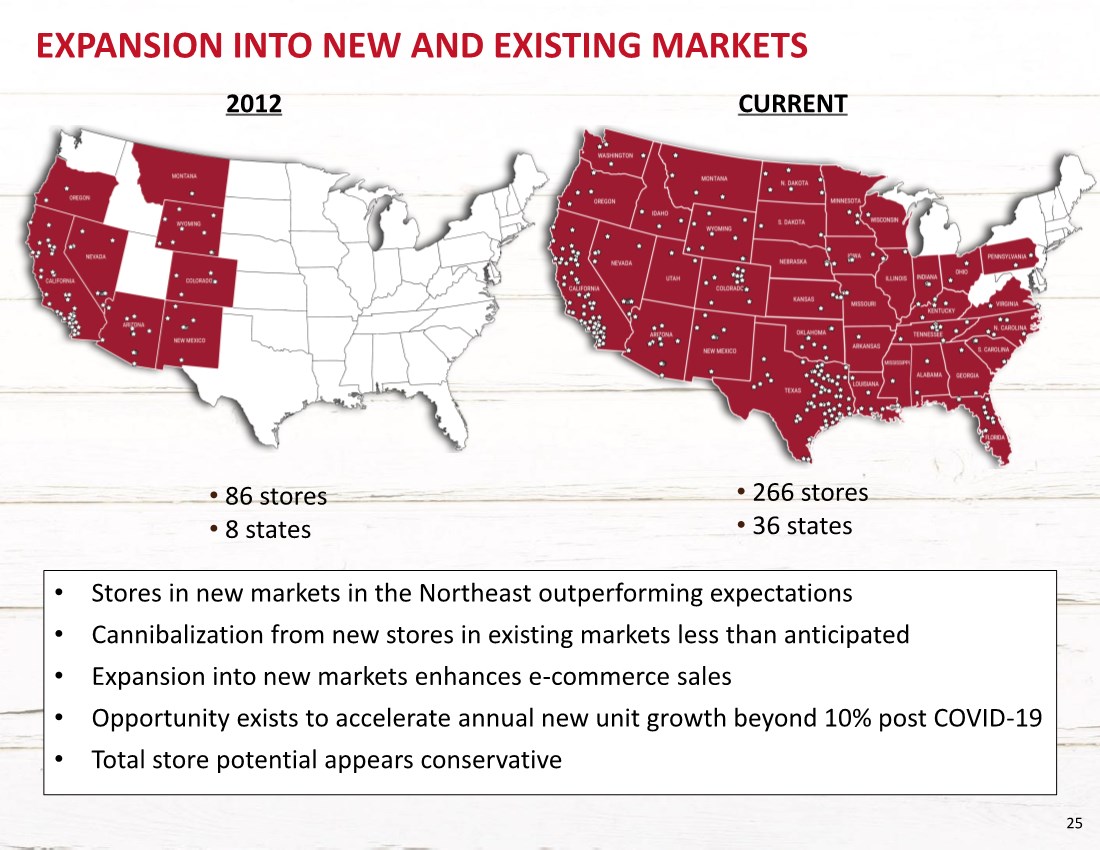
| 25 EXPANSION INTO NEW AND EXISTING MARKETS • 266 stores • 36 states CURRENT 2012 • 86 stores • 8 states • Stores in new markets in the Northeast outperforming expectations • Cannibalization from new stores in existing markets less than anticipated • Expansion into new markets enhances e-commerce sales • Opportunity exists to accelerate annual new unit growth beyond 10% post COVID-19 • Total store potential appears conservative |
| 26 INVESTMENT THESIS |

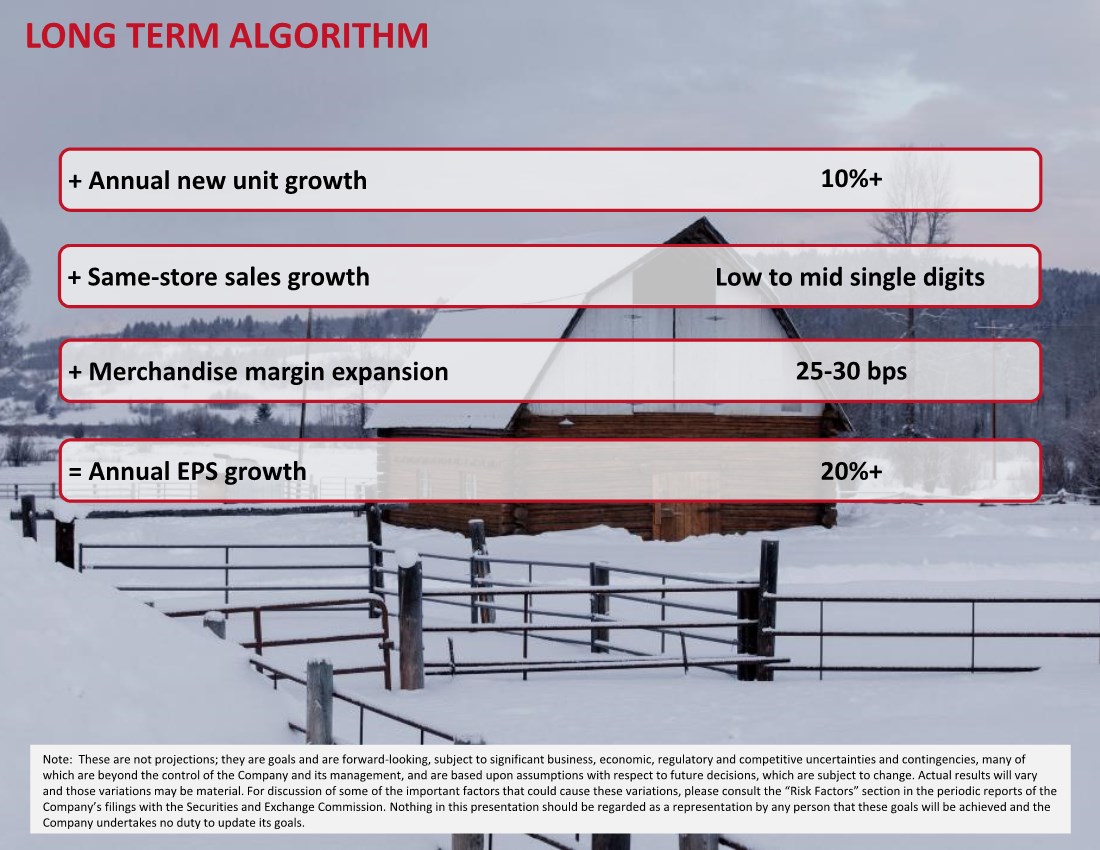
| 27 LONG TERM ALGORITHM + Same-store sales growth + Merchandise margin expansion = Annual EPS growth + Annual new unit growth 10%+ Low to mid single digits 25-30 bps 20%+ Note: These are not projections; they are goals and are forward-looking, subject to significant business, economic, regulatory and competitive uncertainties and contingencies, many of which are beyond the control of the Company and its management, and are based upon assumptions with respect to future decisions, which are subject to change. Actual results will vary and those variations may be material. For discussion of some of the important factors that could cause these variations, please consult the “Risk Factors” section in the periodic reports of the Company’s filings with the Securities and Exchange Commission. Nothing in this presentation should be regarded as a representation by any person that these goals will be achieved and the Company undertakes no duty to update its goals. |
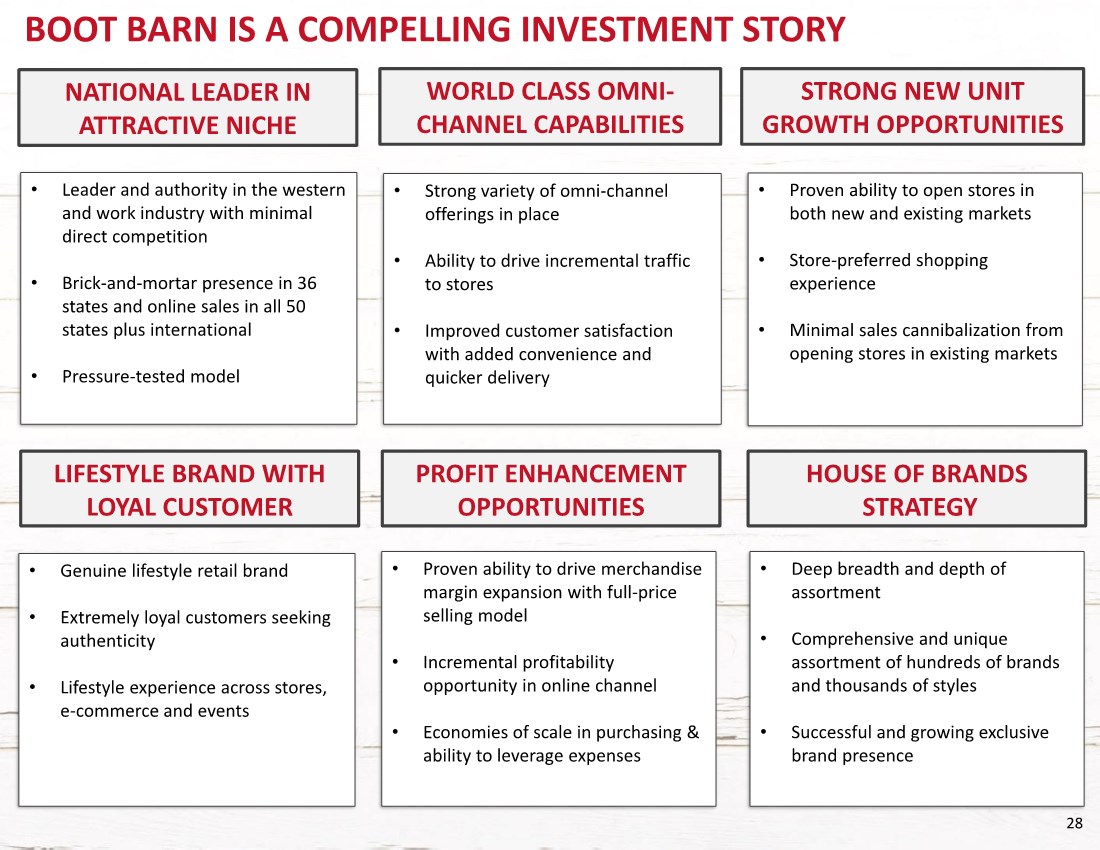
| 28 BOOT BARN IS A COMPELLING INVESTMENT STORY • Strong variety of omni-channel offerings in place • Ability to drive incremental traffic to stores • Improved customer satisfaction with added convenience and quicker delivery WORLD CLASS OMNI- CHANNEL CAPABILITIES NATIONAL LEADER IN ATTRACTIVE NICHE • Leader and authority in the western and work industry with minimal direct competition • Brick-and-mortar presence in 36 states and online sales in all 50 states plus international • Pressure-tested model • Proven ability to open stores in both new and existing markets • Store-preferred shopping experience • Minimal sales cannibalization from opening stores in existing markets STRONG NEW UNIT GROWTH OPPORTUNITIES LIFESTYLE BRAND WITH LOYAL CUSTOMER PROFIT ENHANCEMENT OPPORTUNITIES • Genuine lifestyle retail brand • Extremely loyal customers seeking authenticity • Lifestyle experience across stores, e-commerce and events HOUSE OF BRANDS STRATEGY • Proven ability to drive merchandise margin expansion with full-price selling model • Incremental profitability opportunity in online channel • Economies of scale in purchasing & ability to leverage expenses • Deep breadth and depth of assortment • Comprehensive and unique assortment of hundreds of brands and thousands of styles • Successful and growing exclusive brand presence |
| 29 APPENDIX |

| 30 ADJUSTED EBIT RECONCILIATION (a) Represents non-cash compensation expenses related to stock options, restricted stock awards, restricted stock units and performance share units granted to certain of our employees and directors. (b) Represents the non-cash accrual for future award redemptions in connection with our customer loyalty program. (c) Includes direct costs and fees related to the acquisitions of RCC, Baskins and Sheplers, which we acquired in August 2012, May 2013 and June 2015, respectively. (d) Represents certain store integration, remerchandising, inventory obsolescence and corporate consolidation costs incurred in connection with the integration of RCC, Baskins and Sheplers, which we acquired in August 2012, May 2013 and June 2015, respectively. Fiscal 2016 includes an adjustment to normalize the gross margin impact of sales of discontinued inventory from Sheplers, which was sold at a discount or written off. The adjustment assumes such inventory was sold at Sheplers’ normalized margin rate. (e) Represents the amortization of purchase-accounting adjustments that adjusted the value of inventory acquired to its fair value. (f) Represents loss/(gain) on disposal of assets and contract termination costs. (g) Represents a gain on adjustment of a ROU asset and liability. (h) Represents professional fees and expenses incurred in connection with secondary offerings conducted in January 2018, May 2018 and February 2015 and a Form S-1 Registration Statement filed in July 2015 and withdrawn in November 2015. (i) Represents professional fees and expenses incurred in connection with acquisition activity. (j) Represents store impairment charges recorded in order to reduce the carrying amount of the assets to their estimated fair values. 1All TTM Q3 Fiscal 2021 results are preliminary and contain an estimate of results for the thirteen weeks ended December 26, 2020. 2The fiscal 2017 column has been adjusted to reflect management’s estimated 52-week results as fiscal 2017 was a 53-week year. The Company estimated that included in fiscal 2017 reported earnings per share was $0.03 attributed to the 53rd week. As such, the Company has estimated fiscal 2017 net income, excluding the 53rd week, to be $13.4 million compared to GAAP net income of $14.2 million. In calculating estimated Adjusted EBIT on a 52-week basis, the Company also adjusted income tax expense, interest expense, and stock based compensation expense by taking 52/53rds of the GAAP reported fiscal 2017 numbers. |