Attached files
| file | filename |
|---|---|
| 8-K - 8-K - Thryv Holdings, Inc. | brhc10018630-8k.htm |
| EX-99.1 - EXHIBIT 99.1 - Thryv Holdings, Inc. | brhc10018630_ex99-1.htm |
Exhibit 99.2

InvestorPresentation January 2021
Important Disclosures 2 This Presentation (the "Presentation") is being furnished with respect to a
potential acquisition (the "Potential Transaction”) by Thryv Holdings, Inc. and its subsidiaries and/or affiliates (“Thryv” or the "Company") of Sensis Pty Limited and its subsidiaries. This Presentation has been assembled by the management of
the Company. The sole purpose of this Presentation is to provide background on the Company to potential investors. The Company expressly disclaims any liability to any recipient in connection with such information or any transaction with the
Company, including the Potential Transaction. This Presentation includes certain forward-looking statements, including, without limitation, statements concerning the Potential Transaction, the conditions of our industry and our operations,
performance, and financial condition, including, in particular, statements relating to our business, growth strategies, product development efforts, and future expenses. Forward-looking statements can be identified by words such as
‘‘anticipates,’’ ‘‘intends,’’ ‘‘plans,’’ ‘‘seeks,’’ ‘‘believes,’’ ‘‘estimates,’’ ‘‘expects,’’ and similar projections to future periods, or by the inclusion of forecasts or projections. Forward-looking statements are based on our current
expectations and assumptions regarding our business, the economy, and other future conditions. Because forward-looking statements relate to the future, by their nature, they are subject to inherent uncertainties and risks (some of which are
beyond the Company’s control) and changes in circumstances or other assumptions that may cause actual results or performance to be materially different from those expressed or implied by these forward-looking statements. Please see our
Quarterly Report on Form 10-Q for the quarterly period ended September 30, 2020 and our subsequent reports filed with the U.S. Securities and Exchange Commission for further description of such uncertainties and risks. Except as required by
law, we are under no obligation to, and expressly disclaim any obligation to, update or alter any forward-looking statements whether as a result of any such changes, new information, subsequent events or otherwise.Market data and industry
information used throughout this Presentation are based on management’s knowledge of the industry and the good faith estimates of management. We also relied, to the extent available, upon management’s review of independent industry surveys and
publications and other publicly available information prepared by a number of third party sources. All of the market data and industry information used in this Presentation involves a number of assumptions and limitations, and you are cautioned
not to give undue weight to such estimates. Although we believe that these sources are reliable, we cannot guarantee the accuracy or completeness of this information, and we have not independently verified this information. While we believe the
information included in this presentation is generally reliable, such information, which is derived in part from management’s estimates and beliefs, is inherently uncertain and imprecise. Projections, assumptions and estimates of our future
performance and the future performance of the industry in which we operate are necessarily subject to a high degree of uncertainty and risk due to a variety of factors. These factors could cause results to differ materially from those expressed
in our estimates and beliefs and in the estimates prepared by independent parties. You should not construe the contents of this Presentation as legal, tax, accounting or investment advice or a recommendation to take (or refrain from taking) any
particular action. You should consult your own counsel and tax and financial advisors as to legal and related matters concerning the matters described herein.None of Wells Fargo Securities, LLC, the Company, their respective affiliates or
respective employees, directors, officers, contractors, advisors, members, successors, representatives or agents makes any representation or warranty (expressed or implied) in respect of the accuracy, completeness or fair presentation of any
information or any conclusion contained herein, and none shall have any liability for any such representations contained in, or for any omissions from, this Presentation or any other written or oral communications transmitted to the recipient
in the course of its evaluation of the Company. The information contained in this Presentation should not be assumed to have been updated at any time subsequent to the date shown.This Presentation is not an offer to sell or the solicitation of
an offer to buy any securities, nor shall there be any sale of securities of Thryv Holdings, Inc. or Sensis Pty Limited in any jurisdiction in which the offer, solicitation or sale would be unlawful prior to the registration or qualification
under the securities laws of any such jurisdiction.In addition to financial measures prepared in accordance with U.S. generally accepted accounting principles (“GAAP”), this Presentation contains non-GAAP financial measures including: adjusted
EBITDA, adjusted EBITDA margin, and Free Cash Flow. The non-GAAP financial information is presented for supplemental informational purposes and is not intended to be considered in isolation or as a substitute for, or superior to, financial
information prepared and presented in accordance with GAAP. Please refer to the Appendix for reconciliations of the non-GAAP financial measures used in this Presentation to the most comparable GAAP financial measures.We believe that these
non-GAAP financial measures provide useful information about our financial performance, enhance the overall understanding of our past performance and future prospects and allow for greater transparency with respect to important metrics used by
our management for financial and operational decision-making. We believe that these measures provide an additional tool for investors to use in comparing our core financial performance over multiple periods with other companies in our industry.
However, it is important to note that the particular items we exclude from, or include in, our non-GAAP financial measures may differ from the items excluded from, or included in, similar non-GAAP financial measures used by other companies in
the same industry.

Management Team 3 Joe WalshCEO and President Gordon HenryChief Strategy Officer Paul Rouse Chief
Financial Officer KJ ChristopherAsst. VP - Investor Relations, Treasury & Tax

4 Agenda Key Investment Highlights 2 3 Financial Overview 4 Appendix 5 Thryv
Snapshot 1 Transaction Overview

5 Transaction Overview 1
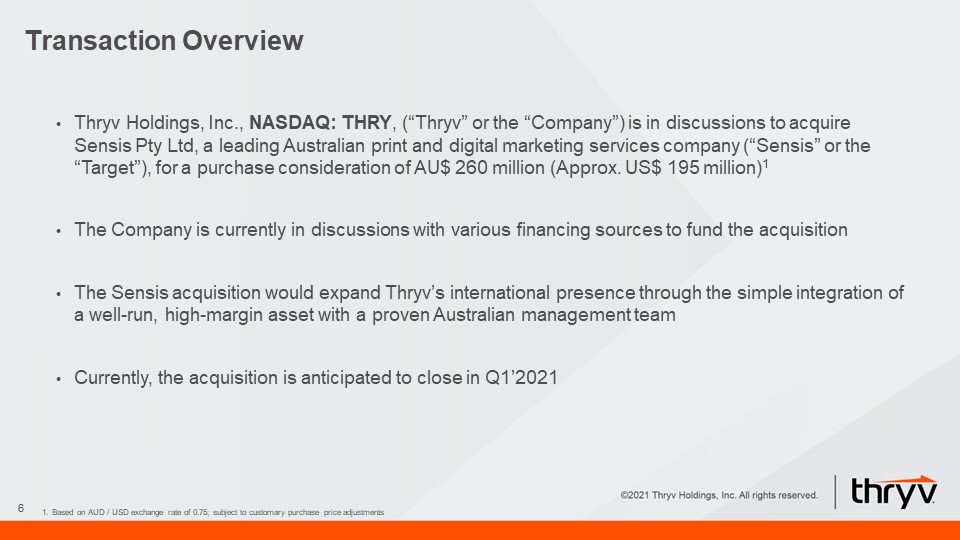
Transaction Overview 6 Thryv Holdings, Inc., NASDAQ: THRY, (“Thryv” or the “Company”) is in
discussions to acquire Sensis Pty Ltd, a leading Australian print and digital marketing services company (“Sensis” or the “Target”), for a purchase consideration of AU$ 260 million (Approx. US$ 195 million)1The Company is currently in
discussions with various financing sources to fund the acquisitionThe Sensis acquisition would expand Thryv’s international presence through the simple integration of a well-run, high-margin asset with a proven Australian management
teamCurrently, the acquisition is anticipated to close in Q1’2021 Based on AUD / USD exchange rate of 0.75; subject to customary purchase price adjustments
7 Thryv Snapshot 2

Thryv – Leading SMB Marketing Solutions Provider 8 Leading provider of local small and medium business
(“SMB”) marketing services and management softwareThe Company’s solutions include:Marketing Services: lead generation tools comprising branded print yellow pages, digital directories and a portfolio of search-based marketing solutions SaaS:
Small business management software platform that offers an all-inclusive, flexible operating solutionThryv is a nationwide platform, and has one of the largest physical sales forces in the country with long-standing relationships in thousands
of local communities LTM 9/30 Revenue by Business Coast-to-Coast Footprint 54%FCF conversion ~1,150Total Sales Related Employees 2 48States of operation Dallas, TXHQ ~2,350Employees 2 $1.2bnLTM Revenue $423mmLTM Adj.
EBITDA 1 35%LTM Adj. EBITDA Margin 1 ~350,000Clients Thryv Standalone Marketing ServicesSaaS Adjusted EBITDA and Adjusted EBITDA Margin are non-GAAP measures. See reconciliation of Adjusted EBITDA to its most directly comparable
GAAP measure in the AppendixAs of September 30, 2020Note: FCF conversion is UFCF as a % of Adj. EBITDA

2018 – Present A Strong History Of Value Creation 9 Merger formed one of the largest local marketing
solutions companies.Geographic focus on the Northeast, Midwest, Mountain and West regions. Current management joined Dex Media.Strategic focus on controlling variable costs and building digital marketing. Launched DexHub (now called Thryv
Platform) – a local business automation platform. Restructured balance sheet, emerged 1.5x levered. Note: On July 15, 2019, DexYP announced corporate name change to Thryv Holdings, Inc.Pro forma for acquisition of YP on June 30, 2017 2013
Super Media / DexOne Merger 2014 – 2015Management 2016Dex Hub 2017Acquisition Acquisition of YP Holdings.Acquisition created a nation-wide platform and unlocked hundreds in millions of dollars of cost synergies.YP Holdings substantially
integrated with significant cost synergies realized within 18 months. Highly FCF generative business.Thryv has generated over $1.2bn1 in cumulative FCF from 2017 thru Q3 2020Fully integrated acquisitions.Built and grew SaaS products and
services.~40% CAGR over last 4 yearsCurrent management team has led strong financial performance through business transition.Publicly listed equity on the NASDAQ Capital Market on October 1, 2020.

Full Suite Of Marketing Solutions Today 10 Note: LTM ending Q3 2020 net revenue and client counts.
Clients may purchase multiple products and therefore be counted multiple times Marketing Services SaaS ;/ Revenue: $127mm (11% of total)Clients: 44k Add-Ons Small business management software platform that offers an all-inclusive,
flexible operating solution Platform Add-ons such as integrated lead generation/management, SEO tools, and other services Print LTM Revenue: $508mm (42% of total)Clients: 285kPaid placement in official telco-branded print yellow page
directories tailored to each local market Internet Yellow Pages (IYP) LTM Revenue: $294mm (24% of total)Clients: 145kSubscription-based display ads and online local business listings services Search Engine Marketing (SEM)LTM Revenue: $184mm
(15% of total)Clients: 21kPaid placement in search engine results Presence/OtherLTM Revenue: $95mm (8% of total)Clients: 42kOnline Listings Management, Websites, Display Ads and Search Engine Optimization (SEO), along with Video and other
legacy digital products

Sustained Demand For Yellow Pages 11 1,786 active directories50+ million in total distribution190
pages on average per directory285k print clients3.8bn references, representing over 90% of industry total Only national branded print directory provider in USOfficially branded with telecommunication providersMain products are display ads,
in-column ads, listings and awareness (cover advertising)Current management has simplified the offering (reducing SKUs from 1,681 to 7), re-designed directories to be more appealing in each local market, and begun long-lifing the book to manage
churn/marginTargeted delivery through US mail and 3rd party vendorsOnly player of scale provides:Higher share of usageDeclining cost per leadImproved retentionHigher share of spend Key
Highlights Overview Revenue Cost Profits $9.43 $1.21 $8.22 (87%) Per Copy (9M 2020 Average) Customers predominantly sign 15 month contracts for ads in The Real Yellow Pages
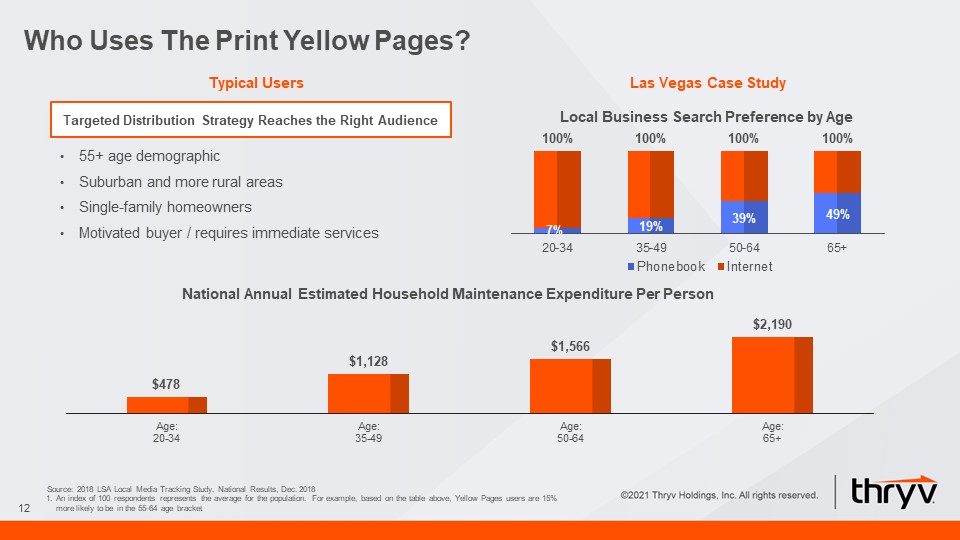
Las Vegas Case Study Who Uses The Print Yellow Pages? 12 55+ age demographicSuburban and more rural
areasSingle-family homeownersMotivated buyer / requires immediate services Typical Users Source: 2018 LSA Local Media Tracking Study, National Results, Dec. 2018An index of 100 respondents represents the average for the population. For
example, based on the table above, Yellow Pages users are 15% more likely to be in the 55-64 age bracket Targeted Distribution Strategy Reaches the Right Audience
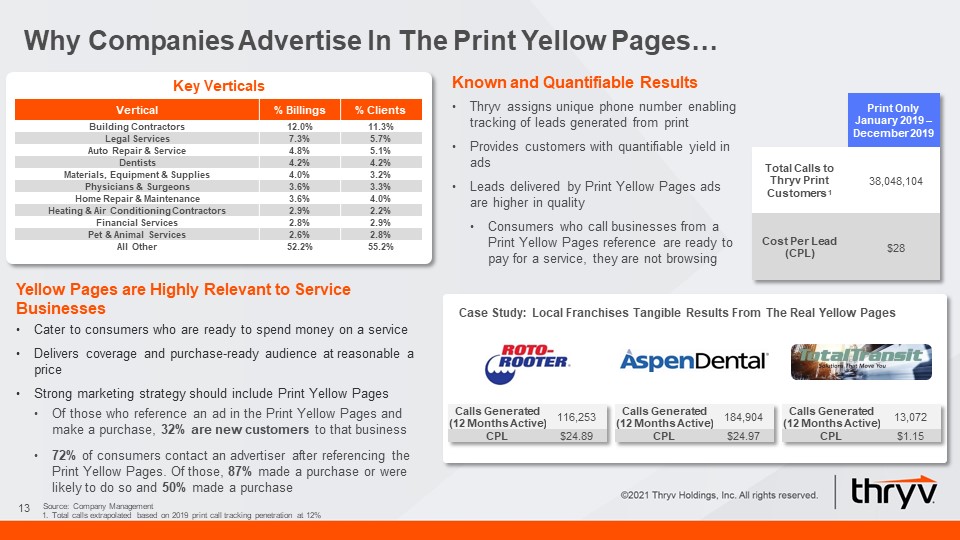
Yellow Pages are Highly Relevant to Service BusinessesCater to consumers who are ready to spend money on
a service Delivers coverage and purchase-ready audience at reasonable a priceStrong marketing strategy should include Print Yellow PagesOf those who reference an ad in the Print Yellow Pages and make a purchase, 32% are new customers to that
business72% of consumers contact an advertiser after referencing the Print Yellow Pages. Of those, 87% made a purchase or were likely to do so and 50% made a purchase Key Verticals Vertical % Billings % Clients Building
Contractors 12.0% 11.3% Legal Services 7.3% 5.7% Auto Repair & Service 4.8% 5.1% Dentists 4.2% 4.2% Materials, Equipment & Supplies 4.0% 3.2% Physicians & Surgeons 3.6% 3.3% Home Repair &
Maintenance 3.6% 4.0% Heating & Air Conditioning Contractors 2.9% 2.2% Financial Services 2.8% 2.9% Pet & Animal Services 2.6% 2.8% All Other 52.2% 55.2% Why Companies Advertise In The Print Yellow Pages… 13 Source:
Company ManagementTotal calls extrapolated based on 2019 print call tracking penetration at 12% Calls Generated(12 Months Active) 184,904 CPL $24.97 Calls Generated(12 Months Active) 13,072 CPL $1.15 Calls Generated(12 Months
Active) 116,253 CPL $24.89 Case Study: Local Franchises Tangible Results From The Real Yellow Pages Print OnlyJanuary 2019 – December 2019 Total Calls to Thryv Print Customers 1 38,048,104 Cost Per Lead(CPL) $28 Known and
Quantifiable Results Thryv assigns unique phone number enabling tracking of leads generated from printProvides customers with quantifiable yield in adsLeads delivered by Print Yellow Pages ads are higher in qualityConsumers who call businesses
from a Print Yellow Pages reference are ready to pay for a service, they are not browsing
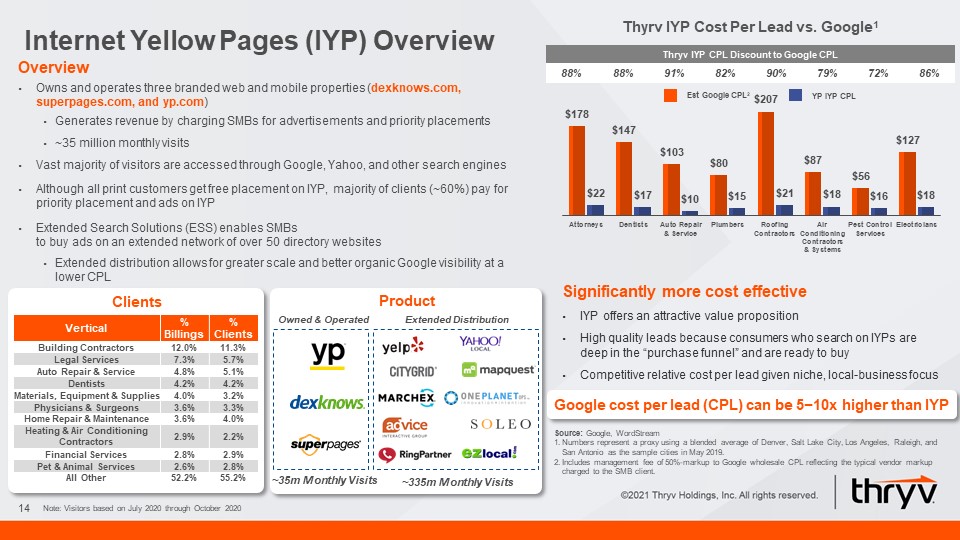
Internet Yellow Pages (IYP) Overview 14 Clients OverviewOwns and operates three branded web and
mobile properties (dexknows.com, superpages.com, and yp.com)Generates revenue by charging SMBs for advertisements and priority placements~35 million monthly visitsVast majority of visitors are accessed through Google, Yahoo, and other search
enginesAlthough all print customers get free placement on IYP, majority of clients (~60%) pay for priority placement and ads on IYPExtended Search Solutions (ESS) enables SMBs to buy ads on an extended network of over 50 directory
websitesExtended distribution allows for greater scale and better organic Google visibility at a lower CPL Vertical % Billings % Clients Building Contractors 12.0% 11.3% Legal Services 7.3% 5.7% Auto Repair &
Service 4.8% 5.1% Dentists 4.2% 4.2% Materials, Equipment & Supplies 4.0% 3.2% Physicians & Surgeons 3.6% 3.3% Home Repair & Maintenance 3.6% 4.0% Heating & Air Conditioning Contractors 2.9% 2.2% Financial
Services 2.8% 2.9% Pet & Animal Services 2.6% 2.8% All Other 52.2% 55.2% Note: Visitors based on July 2020 through October 2020 Product Extended Distribution Owned & Operated ~335m Monthly Visits ~35m Monthly
Visits Thyrv IYP Cost Per Lead vs. Google1 Thryv IYP CPL Discount to Google CPL 88% 88% 91% 82% 90% 79% 72% 86% Est Google CPL2 YP IYP CPL Significantly more cost effectiveIYP offers an attractive value
propositionHigh quality leads because consumers who search on IYPs are deep in the “purchase funnel” and are ready to buyCompetitive relative cost per lead given niche, local-business focus Google cost per lead (CPL) can be 5−10x higher than
IYP Source: Google, WordStreamNumbers represent a proxy using a blended average of Denver, Salt Lake City, Los Angeles, Raleigh, and San Antonio as the sample cities in May 2019.Includes management fee of 50%-markup to Google wholesale CPL
reflecting the typical vendor markup charged to the SMB client.

Organic Search Traffic How Does IYP Generate Value For SMBs? 15 SEM Spend (TAC 1) ESS Ad Spend
(TAC) SEM Driven IYP Traffic Organic Traffic Purchased Traffic Leads Marketplace Leads from ESS Spend Leads From YP.com Leads Leads TAC: Traffic Acquisition Costs Enhanced Visibility On Major Search Engines Direct Page
Views Partner Network In 2020, Thryv was Yelp’s largest channel partner
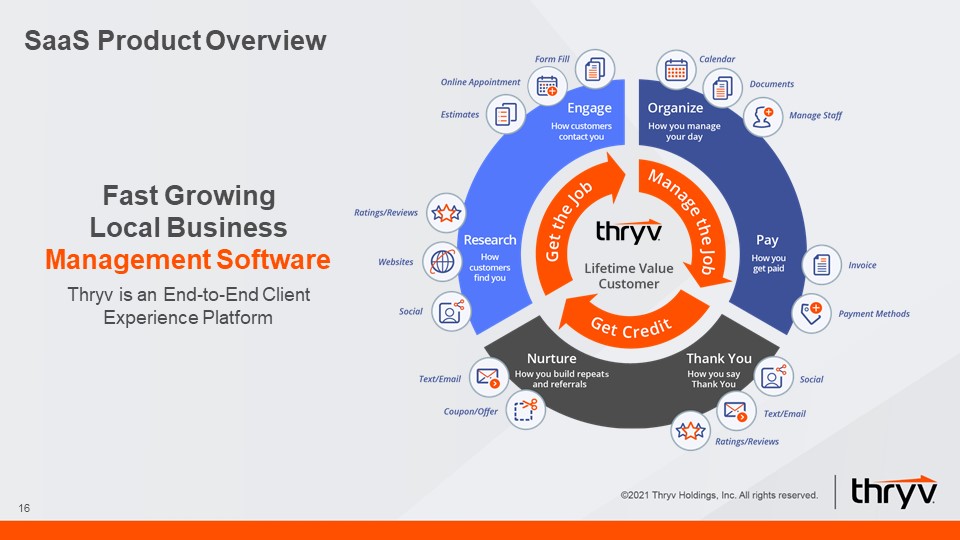
SaaS Product Overview 16 Fast Growing Local Business Management SoftwareThryv is an End-to-End Client
Experience Platform

Thryv vs. CompetitorsSaaS 17 We believe Thryv is the most comprehensive solution on the market and is
tailored to work effectively for a diverse set of industry verticals. Flexible technology stack leveraging proprietary code and best-of-breed 3rd party vendors

Thryv Is The Category Leader Of An Early Stage But Rapidly Developing Market 18 Add-ons range from $99
to $10,000+ Note: Average pricing shown
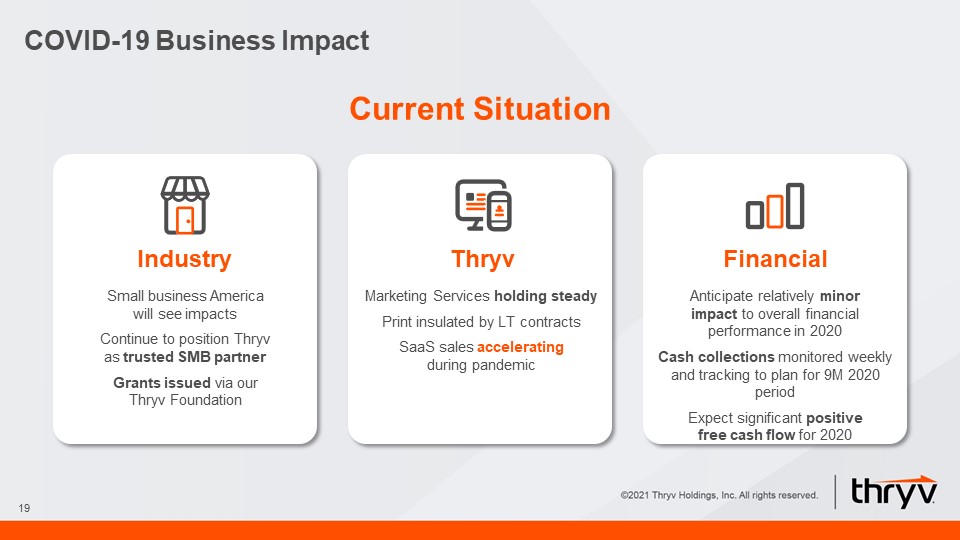
COVID-19 Business Impact 19 Financial Industry Current Situation Small business America will
see impactsContinue to position Thryv as trusted SMB partnerGrants issued via our Thryv Foundation Marketing Services holding steady Print insulated by LT contractsSaaS sales accelerating during pandemic Anticipate relatively minor impact to
overall financial performance in 2020Cash collections monitored weekly and tracking to plan for 9M 2020 periodExpect significant positive free cash flow for 2020 Thryv

20 Key Investment Highlights 3

21 Key Investment Highlights High Growth & Profitable Proprietary SaaS Platform Predictable Print
Industry With Significant Runway Despite Headwinds Strong Free Cash Flow Generation With History Of Deleveraging Attractive Accretive Acquisition Flexible Cost Structure Supports Sustainable Margins Experienced Management Team With Proven
Track Record Of Execution 1 2 3 4 5 6
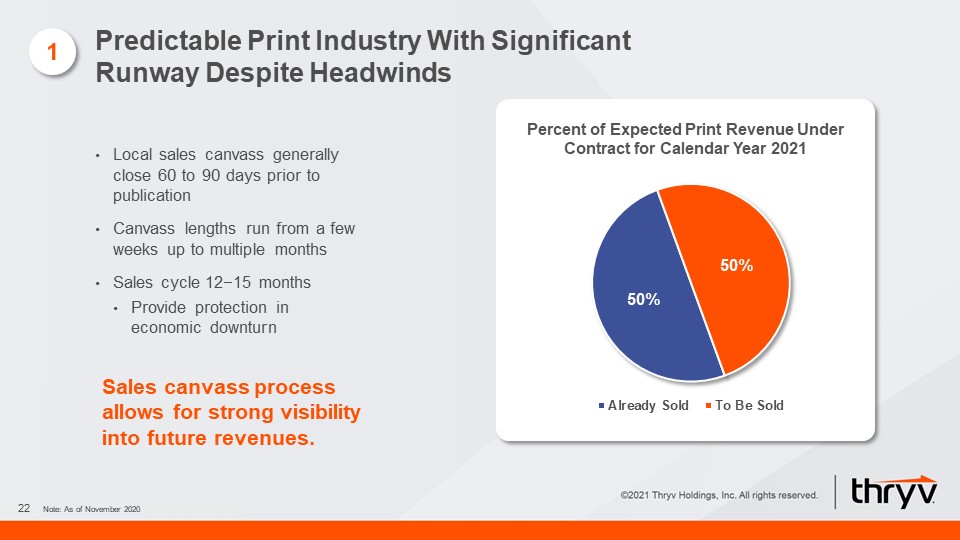
22 Local sales canvass generally close 60 to 90 days prior to publicationCanvass lengths run from a
few weeks up to multiple monthsSales cycle 12−15 monthsProvide protection in economic downturn Percent of Expected Print Revenue Under Contract for Calendar Year 2021 Note: As of November 2020 Predictable Print Industry With Significant
Runway Despite Headwinds 1 Sales canvass process allows for strong visibility into future revenues.
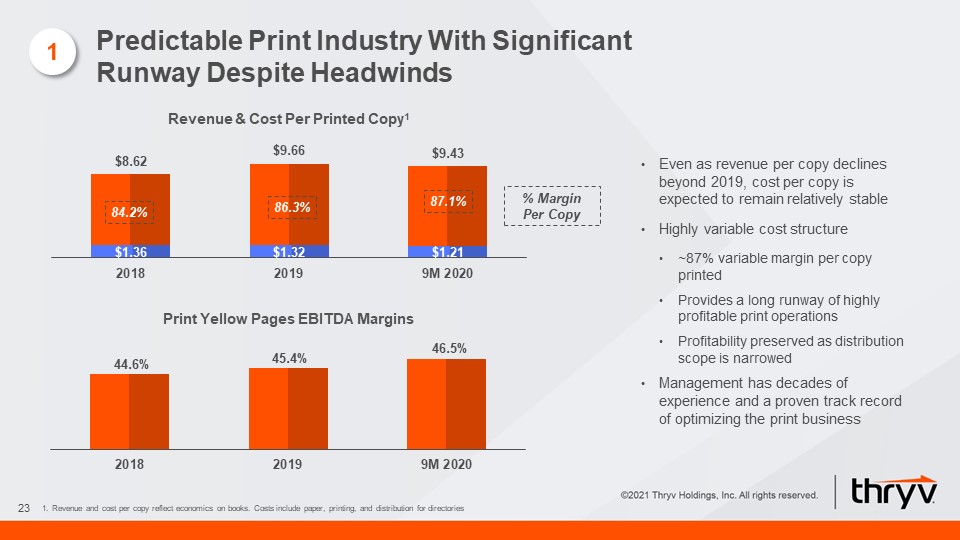
23 Even as revenue per copy declines beyond 2019, cost per copy is expected to remain relatively
stableHighly variable cost structure ~87% variable margin per copy printedProvides a long runway of highly profitable print operationsProfitability preserved as distribution scope is narrowedManagement has decades of experience and a proven
track record of optimizing the print business Revenue & Cost Per Printed Copy1 Revenue and cost per copy reflect economics on books. Costs include paper, printing, and distribution for directories Print Yellow Pages EBITDA
Margins 84.2% % Margin Per Copy 86.3% 87.1% Predictable Print Industry With Significant Runway Despite Headwinds 1

24 Flexible Cost Structure With Sustainable Margins Not adjusted for ASC 606Pro forma for YP
acquisition that occurred on June 30, 2017Note: For non-GAAP reconciliation please see AppendixSource: Public Filings, Moody’s Credit Reports, S&P Credit Reports 46.8% 39.9% Thryv has a highly variable cost structure which enables
management to balance profitability with investment in SaaSSince the YP acquisition, Thryv has been able to expand marginsManagement believes it can continue generating strong EBITDA margins for many years (even while investing in
SaaS)Competitors’ financial performance demonstrates that high margins are achievable in this industry even at much smaller scale (closest competitors generate higher margins despite being roughly one-fourth the size of Thryv)There is no
structural difference between Thryv’s business and competitors’ businesses (except SaaS)Thryv generates lower margins than certain peers (despite much greater scale) due to conscious investment in SaaS 1, 2 Thryv Historical Margin
Expansion Long Runway for Continued Strong Margins 2 EBITDA Margin 1, 2

25 Resilient Cash Flows Amidst Global Pandemic Despite the economic shutdown and uncertainty
caused by COVID-19, monthly free cash flow remained strong as a result of the geographic and industry diversity of the Company’s customer base and highly variable cost structureConsistent cash flow generation in the first nine months of 2020Two
months of negative cash flow due to timing of select annual contract payments, pension contributions, bonuses and quarterly interest payments paid in January 2020 and April 2020 2
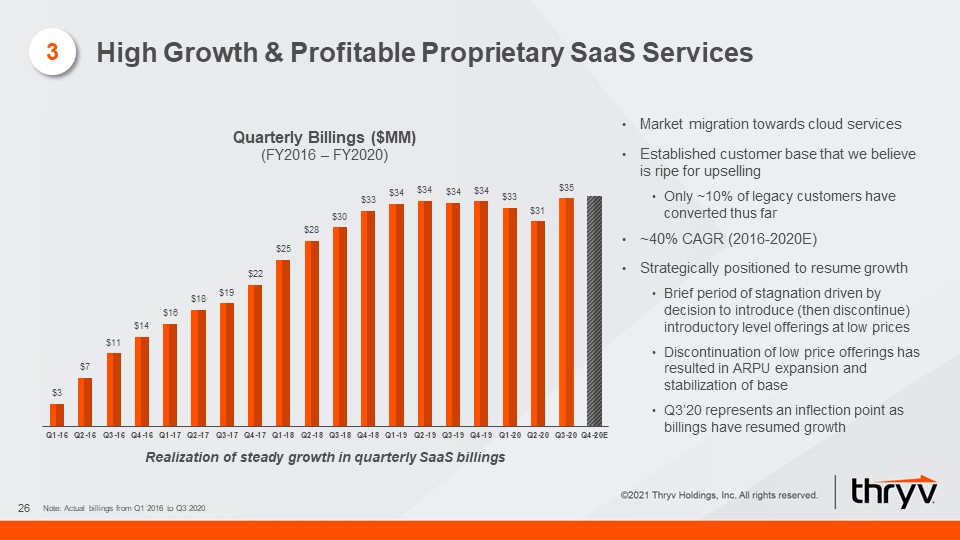
26 Realization of steady growth in quarterly SaaS billings Note: Actual billings from Q1 2016 to Q3
2020 Quarterly Billings ($MM) (FY2016 – FY2020) Market migration towards cloud servicesEstablished customer base that we believe is ripe for upsellingOnly ~10% of legacy customers have converted thus far~40% CAGR (2016-2020E)Strategically
positioned to resume growthBrief period of stagnation driven by decision to introduce (then discontinue) introductory level offerings at low pricesDiscontinuation of low price offerings has resulted in ARPU expansion and stabilization of
baseQ3’20 represents an inflection point as billings have resumed growth 3 High Growth & Profitable Proprietary SaaS Services

27 3 Mix shift towards upmarket SaaS clients driving higher engagement and lower churn High Growth
& Profitable Proprietary SaaS Services
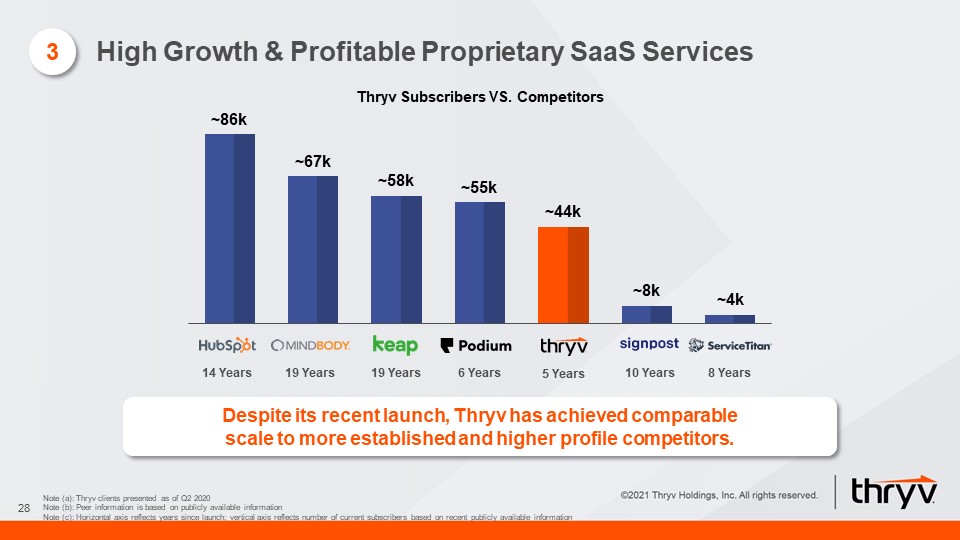
28 3 Despite its recent launch, Thryv has achieved comparable scale to more established and higher
profile competitors. Note (a): Thryv clients presented as of Q2 2020Note (b): Peer information is based on publicly available informationNote (c): Horizontal axis reflects years since launch; vertical axis reflects number of current
subscribers based on recent publicly available information High Growth & Profitable Proprietary SaaS Services 10 Years 8 Years 19 Years 5 Years 14 Years 19 Years 6 Years
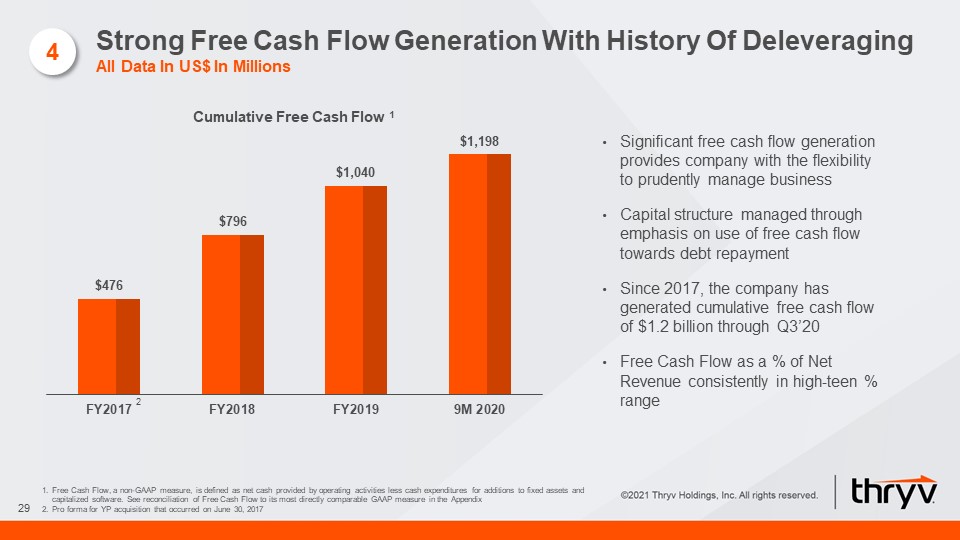
29 Significant free cash flow generation provides company with the flexibility to prudently manage
businessCapital structure managed through emphasis on use of free cash flow towards debt repaymentSince 2017, the company has generated cumulative free cash flow of $1.2 billion through Q3’20Free Cash Flow as a % of Net Revenue consistently in
high-teen % range Free Cash Flow, a non-GAAP measure, is defined as net cash provided by operating activities less cash expenditures for additions to fixed assets and capitalized software. See reconciliation of Free Cash Flow to its most
directly comparable GAAP measure in the AppendixPro forma for YP acquisition that occurred on June 30, 2017 4 Strong Free Cash Flow Generation With History Of DeleveragingAll Data In US$ In Millions 2

30 Thryv has repaid ~$1 billion of debt since 2016 Note: Net Leverage as defined in the Thryv Inc.
Credit Agreement 4 Stock buyback YP Acquisition ($453) ($411) Debt Payments Strong Free Cash Flow Generation With History Of Deleveraging Thryv has a history of responsibly using its excess balance sheet capacity to pursue strategic
actions for the benefit of its stakeholdersIn December 2016, entered into an ABL revolving credit facility to reduce cost of capitalIn June 2017, executed the transformative and highly synergistic acquisition of YP HoldingsIn December 2018,
recapitalized the balance sheet to fund a buyback of the Company’s equityWhenever the Company elects to bring leverage up in connection with a transaction, management’s focus is on deleveraging quickly thereafter

31 Annual Net RevenueAU$ 343 million (US$ 247 million) for fiscal year ended June
2020Adjusted EBITDAAU$ 161 million (US$ 116 million); margin 47% for fiscal year ended June 2020 (AU$ 162 million or US$ 107 million2 for LTM ended September 30, 2020) Sensis is a leading provider of digital and print directories,
digital marketing services, information management and data services to more than 130,000 businesses in Australia.Headquartered in Melbourne with 600 employees, and sales presence in all states and territories. Note: U.S. and Australia
equivalents as of 6/30/2020 (Converted to USD utilizing spot AUD / USD exchange rate of 0.72)Based on AUD / USD exchange rate of 0.75; subject to customary purchase price adjustmentsConverted to USD utilizing monthly average AUD / USD
exchange rate of 0.66 Proposed Transaction Transaction Structure & Considerations Total Value of AU$ 260 million (Approx. US$ 195 million), on a cash free, debt free basis1 Management John Allan (current CEO of Sensis) will
remain as country manager and report to Joe Walsh Remaining Process Milestones Finalization of purchase agreementCompletion of debt financing Company Overview 5 Attractive Accretive AcquisitionSensis Acquisition Overview

32 Source: FY June 2020 Financial Reports.Gross revenue (before deducting customer credits)Net of Yellow
Pages and White Pages Claims Products & Services:Approx. 6.4 million print directories in circulation into ~60% of Australian householdsDigital directory platforms with approx. 6 million unique visitors per monthPresence management tools
with 13,000 locationsData Solution business with over 250 customers and data on 13 million consumers Selected Highlights:Strong business overlapWhite Pages represents stickier customer base than Print Yellow PagesOpportunity to sell SaaS
products and platform internationally Revenue AU$166m AU$65m AU$111m ~ AU$7m AU$343m Parent Company Divisions Business Units Products & Services Total 2 1 5 Attractive Accretive Acquisition

33 Expands Thryv InternationallyProvides access to market of 130k SMBsLess
highly-penetrated market than U.S. Simple IntegrationSensis is already a well-run asset with mid 40’s% marginsEnglish-speaking countryAustralian business is substantially similar to Thryv’s Marketing Services business Favorable
purchase price of approximately 1.6x FY2020 EBITDA based on Audited Financials Initial cost savings of AU$10 millionSignificant revenue synergy opportunity from SaaS cross-sell (upside from Thryv’s investment case model that assumes
only modest benefits) 5 Attractive Accretive AcquisitionSensis Transaction Rationale
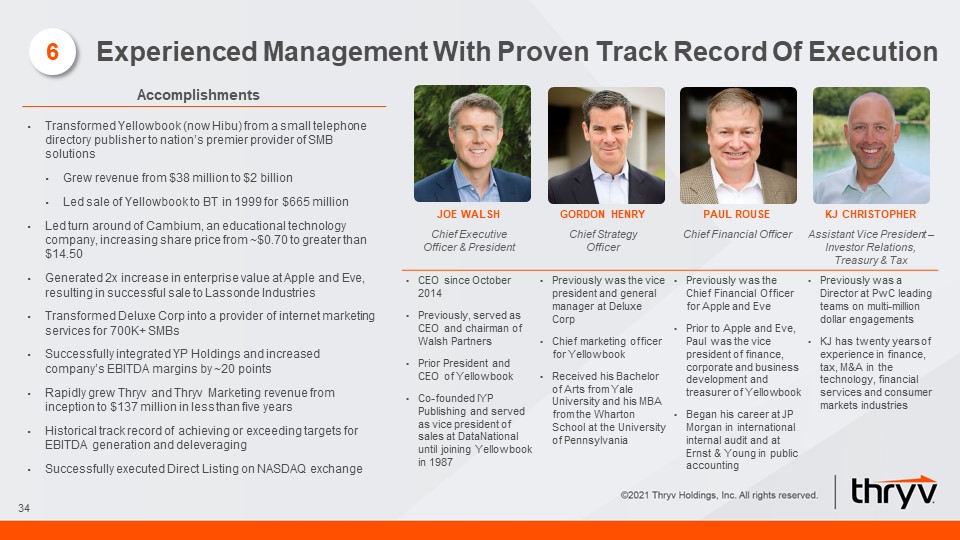
34 Transformed Yellowbook (now Hibu) from a small telephone directory publisher to nation’s premier
provider of SMB solutions Grew revenue from $38 million to $2 billionLed sale of Yellowbook to BT in 1999 for $665 millionLed turn around of Cambium, an educational technology company, increasing share price from ~$0.70 to greater than
$14.50Generated 2x increase in enterprise value at Apple and Eve, resulting in successful sale to Lassonde Industries Transformed Deluxe Corp into a provider of internet marketing services for 700K+ SMBsSuccessfully integrated YP Holdings and
increased company’s EBITDA margins by ~20 pointsRapidly grew Thryv and Thryv Marketing revenue from inception to $137 million in less than five yearsHistorical track record of achieving or exceeding targets for EBITDA generation and
deleveragingSuccessfully executed Direct Listing on NASDAQ exchange Joe walsh Gordon henry Paul rouse Kj christopher Chief Executive Officer & President Chief Strategy Officer Chief Financial Officer Assistant Vice President –
Investor Relations, Treasury & Tax CEO since October 2014Previously, served as CEO and chairman of Walsh PartnersPrior President and CEO of YellowbookCo-founded IYP Publishing and served as vice president of sales at DataNational until
joining Yellowbook in 1987 Previously was the vice president and general manager at Deluxe CorpChief marketing officer for YellowbookReceived his Bachelor of Arts from Yale University and his MBA from the Wharton School at the University of
Pennsylvania Previously was the Chief Financial Officer for Apple and EvePrior to Apple and Eve, Paul was the vice president of finance, corporate and business development and treasurer of YellowbookBegan his career at JP Morgan in
international internal audit and at Ernst & Young in public accounting Previously was a Director at PwC leading teams on multi-million dollar engagementsKJ has twenty years of experience in finance, tax, M&A in the technology,
financial services and consumer markets industries Accomplishments 6 Experienced Management With Proven Track Record Of Execution

35 Financial Overview 4

Thryv Historical Financials − Marketing Services Net RevenueAll Data In US$ In Millions 36 Marketing
Services segment declining due to industry headwinds in Print and increased competition in DigitalPrint remains strong within target demographicIYP is a highly profitable and unique digital asset, which management is working to stabilizeTraffic
has already rebounded and is posting year-over-year growth in September and October across the Thryv IYP platformsSEM is a highly competitive service with low margins. Thryv provides the service, but it is not an emphasis for managementFocus on
maintaining profitability, extracting maximum cash flow, and migrating users onto ThryvExpected to result in stickier and more recurring revenue streams
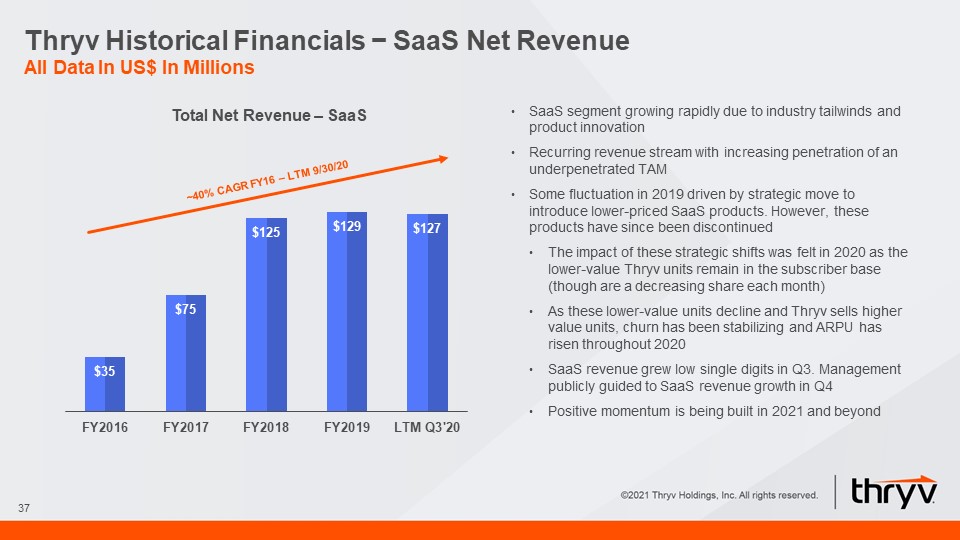
Thryv Historical Financials − SaaS Net RevenueAll Data In US$ In Millions 37 SaaS segment growing
rapidly due to industry tailwinds and product innovationRecurring revenue stream with increasing penetration of an underpenetrated TAMSome fluctuation in 2019 driven by strategic move to introduce lower-priced SaaS products. However, these
products have since been discontinuedThe impact of these strategic shifts was felt in 2020 as the lower-value Thryv units remain in the subscriber base (though are a decreasing share each month)As these lower-value units decline and Thryv sells
higher value units, churn has been stabilizing and ARPU has risen throughout 2020SaaS revenue grew low single digits in Q3. Management publicly guided to SaaS revenue growth in Q4Positive momentum is being built in 2021 and beyond ~40% CAGR
FY16 – LTM 9/30/20
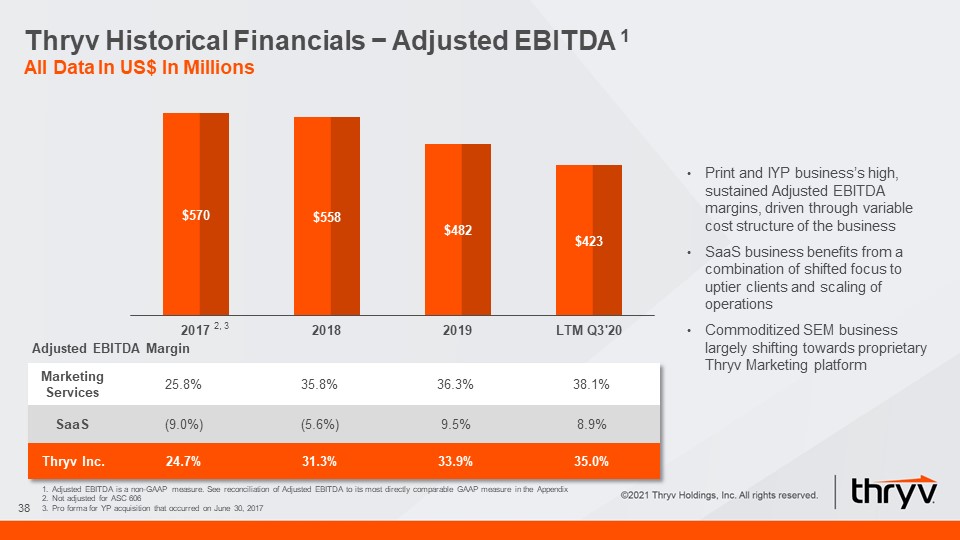
Thryv Historical Financials − Adjusted EBITDA 1All Data In US$ In Millions 38 Print and IYP business’s
high, sustained Adjusted EBITDA margins, driven through variable cost structure of the businessSaaS business benefits from a combination of shifted focus to uptier clients and scaling of operationsCommoditized SEM business largely shifting
towards proprietary Thryv Marketing platform Marketing Services 25.8% 35.8% 36.3% 38.1% SaaS (9.0%) (5.6%) 9.5% 8.9% Thryv Inc. 24.7% 31.3% 33.9% 35.0% Adjusted EBITDA Margin 2, 3 Adjusted EBITDA is a non-GAAP measure. See
reconciliation of Adjusted EBITDA to its most directly comparable GAAP measure in the AppendixNot adjusted for ASC 606Pro forma for YP acquisition that occurred on June 30, 2017

46.8% Sensis Financial Overview 39 Net Revenue Revenue trends in-line with industry, with White
Pages outperforming Print Yellow PagesHigher Adjusted EBITDA margins in-line with industry trendsLow capital expenditure supports significant free cash flow generation Note: FYE June 30. Net Revenues inclusive of Yellow Pages and White Pages
Claims and does not total gross segment revenues; Financial metrics converted to USD on a historical basisDigital Marketing Services includes SEM, SEO, Websites, Social Advertising and Digital DisplayAdjusted EBITDA is EBITDA excluding
redundancy costs, restructuring costs and sponsor related expenses. Adjusted EBITDA is a non-GAAP measure. See reconciliation of Adjusted EBITDA to its most directly comparable GAAP measure in the Appendix 1 2 $347 $282 $247

40 Appendix 5

Thryv Adjusted EBITDA ReconciliationAll Data In US$ In Millions 41 Not adjusted for ASC 606Pro forma
for YP acquisition that occurred on June 30, 2017

Thryv Key Credit SummaryAll Data In US$ In Millions 42 Not adjusted for ASC 606Includes pro forma
impact of YP acquisition that occurred on June 30, 2017Adj. EBITDA as a % of total net revenue
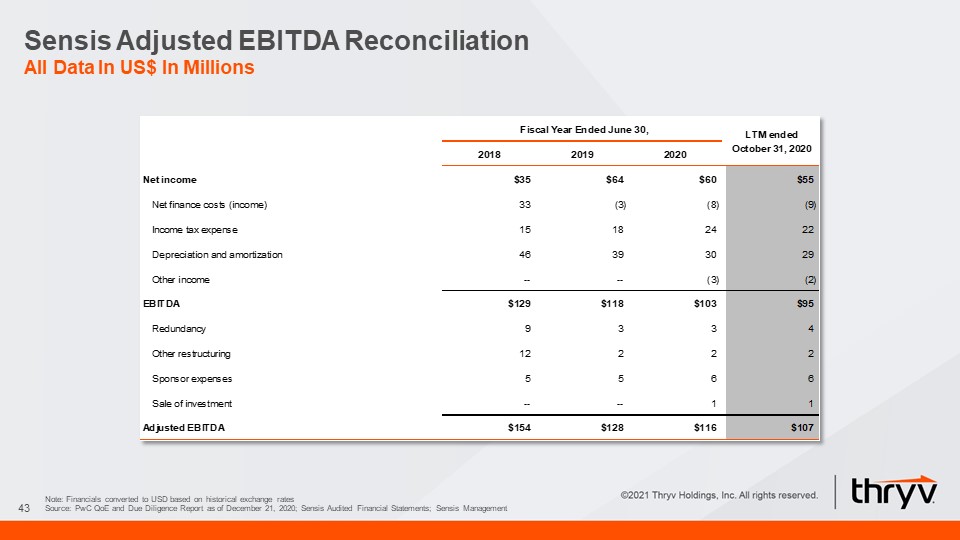
Sensis Adjusted EBITDA ReconciliationAll Data In US$ In Millions 43 Note: Financials converted to USD
based on historical exchange ratesSource: PwC QoE and Due Diligence Report as of December 21, 2020; Sensis Audited Financial Statements; Sensis Management

Sensis Key Credit SummaryAll Data In US$ In Millions 44 Note: Financials converted to USD based on
historical exchange ratesSource: PwC QoE and Due Diligence Report as of December 21, 2020; Sensis Audited Financial Statements; Sensis Management
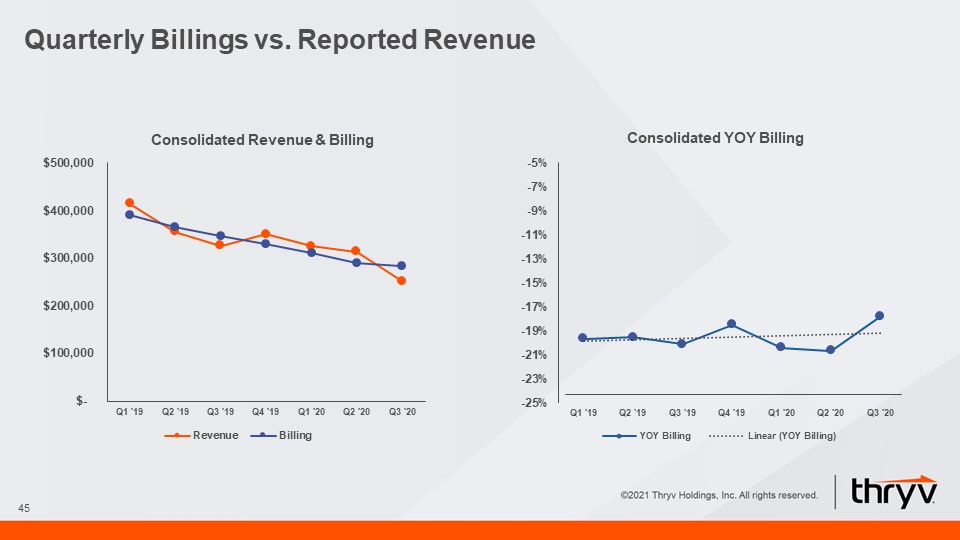
45 Quarterly Billings vs. Reported Revenue

Organizational Structure 46 Note: Pro forma for Sensis acquisition Thryv, Inc.(Delaware) Thryv
International Holding, LLC (Delaware) Thryv Holdings, Inc. (Delaware)(NASDAQ: THRY) Thryv Small Business Foundation(Delaware) Thryv Australia Pty Ltd (Australia) Thryv Parabolica Limited (Malta) 81.66% 18.34% Thryv International
Treasury Limited (Malta) Thryv Becketts Limited (Malta) Sole Member LEGEND Corporation/LLC/Partnership Disregarded Entity Wholly Owned (100%) Partially Owned (as specified) Sensis Pty Ltd(Australia)