Attached files
| file | filename |
|---|---|
| EX-99.1 - EX-99.1 - ENB Financial Corp | ex99-1.htm |
| EX-10.1 - EX-10.1 - ENB Financial Corp | ex10-1.htm |
| 8-K - 8-K - ENB Financial Corp | form8k-25209_enbf.htm |
Exhibit 99.2

December 2020 Subordinated Notes Offering Presentation OTCQX: ENBP CONFIDENTIAL
Notice to Recipients This confidential presentation (this “Presentation”) has been prepared solely for general informational purposes by ENB Finan cia l Corp (the “Company,” the “holding company,” “we” or “our”), and is being furnished solely for use by prospective participants in considering participa tio n in the proposed private offering (the “Offering”) of the Company’s subordinated notes (the “Securities”). No representation or warranty as to the accuracy, complet ene ss, or fairness of such information is being made by the Company or any other person, and neither the Company nor any other person shall have any liability for a ny information contained herein, or for any omissions from this Presentation or any other written or oral communications transmitted to the recipient by the Comp any or any other person in the course of the recipient’s evaluation of the Offering. The Securities have not been registered under the Securities Act of 1933, as amended, or any state securities laws, and may n ot be offered or sold absent registration or an exemption from registration under applicable federal and state securities laws. The Securities are not a d epo sit or bank account, and are not, and will not be, insured or guaranteed by the Federal Deposit Insurance Corporation (the “FDIC”) or any other federal or state go ver nment agency. Investment in the Securities has not been approved or disapproved by the U.S. Securities and Exchange Commission (the “SEC”), the FDIC, the Boa rd of Governors of the Federal Reserve System, the Pennsylvania Department of Banking and Securities, Office of the Comptroller of the Currency or any other federal or state regulatory authority, nor has any authority passed upon or endorsed the merits of the Offering or the accuracy or adequacy of this Prese nta tion. Any representation to the contrary is a criminal offense. The Company has authorized Performance Trust Capital Partners, LLC, to act as its sole placement agent in the Offering. The information contained herein is intended only as an outline that has been prepared to assist interested parties in making th eir own evaluations of the Company. It does not purport to be all - inclusive or to contain all of the information that a prospective participant may desire. Each rec ipient of the information and data contained herein should perform its own independent investigation and analysis of the Offering and the value of the Company. The information and data contained herein are not a substitute for a recipient’s independent evaluation and analysis. In making an investment decision, prospective participants must rely on their own examination of the Company, including the m eri ts and risks involved. Prospective participants are urged to consult with their own legal, tax, investment, regulatory and accounting advisers with respect to t he consequences of an investment in the Company. In the event that any portion of this Presentation is inconsistent with or contrary to any of the terms of the form of a note purchase agreement (the “Purchase Agreement”), the Purchase Agreement shall control. Except as otherwise indicated, this presentation speaks as of the date hereof. The delivery of this presentation shall not, under any circumstances, create any implication that there has been no change in the affairs of the C omp any after the date hereof. You will be given the opportunity to ask questions of and receive answers from Company representatives concerning the Company ’s business and the terms and conditions of the Offering, and the Company may provide you with additional relevant information that you may reasonably requ est to the extent the Company possesses such information or can obtain it without unreasonable effort or expense. Except for information provided in respon se to such requests, the Company has not authorized any other person to give you information that is not found in this Presentation. If such unauthorized info rma tion is obtained or provided, the Company cannot and does not assume responsibility for its accuracy, credibility, or validity. The Company is not providing you with any legal, business, investment, tax or other advice regarding an investment in the Sec uri ties. You should consult with your own advisors as needed to assist you in making your investment decision and to advise you whether you are legally permitted t o p urchase the Securities. 2
Offering Disclaimer This Presentation has been prepared by the Company solely for informational purposes based on information regarding our opera tio ns, as well as information from public sources. This Presentation is for information purposes only and is being furnished on a confidential basis to a limited number of persons who qualify as an acc red ited investor as defined in Rule 501(a)(1) - (3) and (7) of Regulation D adopted under the Securities Act of 1933, as amended or a qualified institutional buyer as such term is defined in SEC Rule 1 44A . This Presentation does not constitute an offer to sell, or a solicitation of an offer to buy, the Securities by a person in any jurisdiction in which it is unlawful for such person to make such offer or so licitation. The information in this Presentation is confidential and may not be reproduced or redistributed, passed on or divulged, directly or indirectly, to any other person. The Company reserves the ri ght to request the return of this Presentation at any time. Any offering of Securities may be made only by a Purchase Agreement and the information contained herein will be superseded i n i ts entirety by the Purchase Agreement. This Presentation does not contain all of the information you should consider before investing in Securities and should not be construed as accounting, inv estment, legal, regulatory or tax advice. Each potential investor should review the Purchase Agreement, make such investigation as it deems necessary to arrive at an independent evaluation of an inv est ment in the Securities and should consult its own legal counsel and financial, accounting, regulatory and tax advisors to determine the consequences of such an investment prior to making an inv est ment decision and should not rely on any information set forth in this Presentation. The Securities will be subject to significant limitations on their liquidity. Only potential investors who can be ar the risk of an unregistered illiquid investment should consider investment in the Securities described herein. This Presentation and oral statements made from time to time by the Company’s representatives may contain “forward - looking state ments" within the meaning of Section 27A of the Securities Act of 1933 that are subject to risks and uncertainties. You should not place undue reliance on those statements because they are su bje ct to numerous risks and uncertainties relating to the Company’s operations and business environment, all of which are difficult to predict and may be beyond our control. Forward - looking statem ents include information concerning the Company’s future results, interest rates and the interest rate environment, loan and deposit growth, loan performance, operations, employees and business strate gy. These statements often include words such as "may," "believe," "expect," "anticipate," "intend," “potential,” “opportunity,” “could,” “project,” “seek,” “should,” “will,” “would,” "plan," "es timate" or other similar expressions. Forward - looking statements are not a guarantee of future performance or results, are based on information available at the time the statements are made and involve known an d u nknown risks, uncertainties and other factors that could cause our actual results to differ materially from the information in the forward - looking statements and can change as a result of many po ssible events or factors, not all of which are known to us or in our control. These factors include but are not limited to: (i) prevailing local, regional, national, and international economic conditions an d the impact they may have on us and our customers and our assessment of that impact; (ii) changes in interest rates, loan demand and real estate values, any of which can materially affect originati on levels and gain on sale results in our business, as well as other aspects of our financial performance, including earnings on interest - bearing assets; (iii) the level of defaults, losses and prepayments on loa ns made by us, whether held in portfolio or sold in the whole loan secondary markets, which can materially affect charge - off levels and required credit loss reserve levels; (iv) changes in monetary and fis cal policies of the U.S. Government, including policies of the U.S. Treasury and the Board of Governors of the Federal Reserve System; (v) changes in the banking and other financial services regulatory env ironment; (vi) competition with national, regional and community financial institutions; (vii) failures of or interruptions in the communications and information systems on which we rely to conduct business; (viii) expected or potential impacts of public health crises (such as governmental, social and economic effects of the novel coronavirus (COVID - 19) pandemic); (ix) levels of unemployment in the C ompany’s market area; (x) the impact of the COVID - 19 pandemic on our business, including the impact of actions taken by governmental and regulatory authorities in response to such pandemic, suc h as the CARES Act and the programs established thereunder, and our participation in such programs; (xi) volatility and disruption in national and international financial markets; (xii) the eff ect of changes in accounting policies and practices as may be adopted by the regulatory agencies, as well as the Financial Accounting Standards Board, and other accounting standard setters; and (xiii) o ur success at managing the risks involved in the foregoing factors. All statements in this Presentation, including forward - looking statements, speak only as of the date they are made. Although the Company believes that these forward - looking statements are based on reasonable assumptions, beliefs and expectations, if a change occurs or our beliefs, assumptions and expectations were incorr ect , our business, financial condition, liquidity or results of operations may vary materially from those expressed in our forward - looking statements. New risks and uncertainties arise from time to time, an d we cannot predict these events or how they may affect the Company. The Company has no duty to, and does not intend to, update or revise the forward - looking statements after the date on which they are made. In light of these risks and uncertainties, you should keep in mind that any forward - looking statement made in this Presentation or elsewhere might not reflect our actual results and any such variation could be material. The Presentation may contain statistics and other data that, in some cases, have been obtained from or compiled from and made available by third party providers, including references to the Performance Trust PT Score developed by Performance Trust Capital Partners, LLC. However, the Company cannot guarantee the ac cur acy of such information and has not independently verified such information. The Company is not making any implied or express representation or warranty as to the accuracy or completeness o f t he information summarized herein or made available in connection with any further investigation of the Company. The Company expressly disclaims any liability which may be based on such informati on, errors therein or omissions therefrom. This Presentation contains certain pro forma and projected information, including projected pro forma information that reflec ts the Company's current expectations and assumptions. This pro forma information does not purport to present the results that the Company will actually realize and such variation could be material. 3

Table of Contents Executive Summary 5 I Management Team, Board of Directors & Ownership Information 14 II Assets Highlights 18 III Liabilities Highlights 28 IV Capital Highlights 32 V Income Statement Highlights 35 VI Appendix 42 VII 4

I. Executive Summary 5
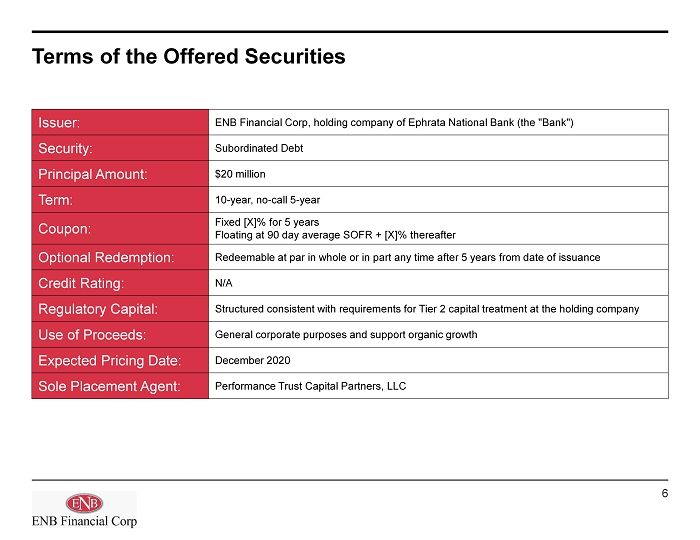
Terms of the Offered Securities Issuer: ENB Financial Corp , holding company of Ephrata National Bank (the "Bank") Security: Subordinated Debt Principal Amount : $20 million Term: 10 - year, no - call 5 - year Coupon: Fixed [X]% for 5 years Floating at 90 day average SOFR + [X]% thereafter Optional Redemption: Redeemable at par in whole or in part any time after 5 years from date of issuance Credit Rating: N/A Regulatory Capital: Structured consistent with requirements for Tier 2 capital treatment at the holding company Use of Proceeds: General corporate purposes and support organic growth Expected Pricing Date: December 2020 Sole Placement Agent: Performance Trust Capital Partners, LLC 6

Company Overview Source: S&P Global Market Intelligence; Company provided financial information (unaudited) Note: 2020YTD financials as of September 30, 2020 Branch Map Corporate Overview Ephrata National Bank Regulatory Financials Ephrata National Bank (14) (dollars shown in thousands) 2017 2018 2019 2020YTD Total Assets 1,033,282$ 1,097,256$ 1,171,070$ 1,316,278$ Total Loans 600,445$ 695,502$ 755,960$ 848,185$ Total Deposits 867,642$ 920,570$ 974,950$ 1,127,174$ Total Equity 98,184$ 101,311$ 115,065$ 124,155$ Loans / Deposits 69.20% 75.55% 77.54% 75.25% NPAs / Assets 0.18% 0.32% 0.34% 0.48% TCE / TA 9.50% 9.23% 9.83% 9.43% NIM (FTE) 3.46% 3.47% 3.54% 3.27% ROAA 0.64% 0.94% 1.02% 0.98% ROAE 6.61% 10.15% 10.45% 10.25% • Ephrata National Bank was founded in 1881 • ENB Financial Corp was formed on July 1, 2008 • ENB Financial Corp headquartered in Ephrata, PA • Operates 14 locations located in the Lancaster, Berks and Lebanon counties of south - central Pennsylvania • ENB Financial Corp is a single bank holding company and 100% owner of Ephrata National Bank • ENB Financial Corp files as a C - Corporation • PPP lending of $77.7 million 7

Markets Overview Source: S&P Global Market Intelligence; Federal Reserve Economic Data (FRED); United States Census Bureau; Realtor.com (1) Results from a national survey on consumer sentiment conducted by the University of Michigan Market Statistics Market Highlights FDIC Deposit Data as of June 30, 2020 2021-2026 Deposit Percent of 2021 Projected 2021-2026 Deposits Market Total 2021 Population Population 2021 Projected HHI In Market Market Share Franchise Population Change Change Median HHI Change MSA Branches ($000) Rank (%) (%) (Actual) (%) (%) ($) (%) County Lancaster 12 1,037,159.00 4.00 7.35 93.56 549,185 5.7% 1.7% 72,498 12.8% Berks 1 40,417.00 15.00 0.22 3.65 422,875 2.8% 1.0% 69,121 10.0% Lebanon 1 30,958.00 10.00 1.18 2.79 143,139 7.2% 2.3% 66,546 9.9% State Pennsylvannia 12,804,019 0.8% 0.2% 65,958 8.4% Nationwide Metrics 330,946,040 7.2% 2.9% 67,761 9.0% Shading represents statistics equal to or better than the national average Lancaster 5.8% Each county’s September unemployment rate was less than the national average of 7.9% Berks 7.5% Lebanon 6.5% Unemployment Rate Geography - 15,000 30,000 45,000 60,000 2013 2014 2015 2016 2017 2018 Combined County GDP ($ millions) ~ 70 - mile proximity to Philadelphia Pennsylvania Median HHI 54,000 60,000 66,000 72,000 2013 2014 2015 2016 2017 2018 2019 • Lancaster County’s October consumer sentiment score rose to 92.6 , ~11 points higher than the nationwide average of 81.2 • As of November 2020, each county experienced year - over - year growth in median listing price of homes • Lancaster County - 11.8% • Berks County - 8.4% • Lebanon County - 3.3% • Currently, Kellogg is constructing a $40 million, 905,000 square - foot distribution center in Lancaster County • Major industries across each county include: • Financial & Professional Services • Live Events & Entertainment Technology • Pharmaceutical Packaging & Distribution • Food Processing & Agribusiness (1 ) 8

Investment Highlights Source: S&P Global Market Intelligence; Note: This slide includes certain Unaudited Financial Information (1) See page 10 for pro forma capital structure information (2) Performance Trust PT Score™. PT Score is described in further detail on page 12 Experienced Management Team & Board • Senior management team has decades of experience in community banking and financial institution accounting: Jeffrey Stauffer (CEO & Chairman, 38 years), Scott Lied (CFO, 22 years), and Eric Williams (Chief Lending Officer, 41 years ) • Unique large shareholder in the J. Harry Hibshman educational trust (scholarship fund established by the former Ephrata Natio nal Bank president) Consistent Profitability • Consistent performance with average ROAA of 84bps between 2015 and 2019; Positive net income reported every year since 2000 t hro ugh September 30, 2020 • Net non - interest expense of 1.47% in Q3 2020; net non - interest expense / avg. assets below 2.15% in each of the past five years • Steady NIM with Q3 2020 cost of funds of 0.29% • Over 13x debt service coverage Strong Bank Capital Ratios • Subordinated debt raise is intended to provide optionality and further strength in light of potential downside economic data, am ong other corporate and strategic purposes Diversified Loan Portfolio & Sound Asset Quality • The Bank’s loan portfolio is well - diversified among asset concentrations and is currently pro - actively monitored for signs of st ress • 5 non - accrual loans totaling just $1.29MM; OREO/Assets of 0.00% • NPAs/Assets of manageable 48bps and average quarterly net charge - offs since 2015 of 1 bps ; Reserves / loans of 1.41% as of September 30, 2020 due to the conservative posture from the management team Steady Growth in Consistent Markets • Growth currently supported by consistent and steady economic trends within the Bank’s footprint in the Lancaster, Berks, and Lebanon counties • Diversified geography combines benefits of steady rural markets and the favorable economic conditions of affluent areas Balanced Risk Profile • Moderately asset sensitive interest rate profile • PT Score™ of 120(1) (out of 500+) as of 09/30/20 BEFORE the capital raise suggests low structural risk and a low overall risk score within the PT Score™ risk - reward spectrum; Pro Forma PT Score™ of 64 at 09/30/21 assuming $18.0MM down - streamed to the Bank as equity 9

Pro Forma Capital Structure & Regulatory Capital Ratios $119,553 $12,262 $119,553 $20,000 $12,262 Common Equity Tier 1 Capital New Sub Debt ALLL Actual Sub Debt Pro Forma Bank Level Pro Forma Regulatory Capital 09/30/20 Adj. 09/30/20 Common Equity Before Adjustments 124,155$ 18,000$ 142,155$ Less: Goodwill & Intangible Assets Net of DTLs – – – Less: Other Intangible Assets Net of DTLs – – – Less: AOCI - Unrealized Gains/Def Ben Plans 5,755 – 5,755 Common Equity Tier 1 Capital 118,400 18,000 136,400 Additional Tier 1 Capital – – – Total Tier 1 Capital 118,400$ 18,000$ 136,400$ Tier 2 Capital Instruments -$ -$ -$ ALLL Includable in Tier 2 Capital 12,249 – 12,249 Total Tier 2 Capital 12,249 – 12,249 Total Capital 130,649$ 18,000$ 148,649$ Average Total Assets 1,304,531 18,000 1,322,531 Less: Deductions from CET1 and Additional T1 – – – Less: Other Deductions from Leverage Ratio – – – Total Assets for Leverage Ratio 1,304,531 18,000 1,322,531 Total Risk-Weighted Assets 979,580 3,600 983,180 Common Equity Tier 1 Ratio 12.09% 13.87% Leverage Ratio 9.08% 10.31% Tier 1 Risk-Based Ratio 12.09% 13.87% Total Risk-Based Capital Ratio 13.34% 15.12% Actual Sub Debt Pro Forma Consolidated Pro Forma Regulatory Capital 09/30/20 Adj. 09/30/20 Common Equity Before Adjustments 125,308$ -$ 125,308$ Less: Goodwill & Intangible Assets Net of DTLs – – – Less: Other Intangible Assets Net of DTLs – – – Less: AOCI - Unrealized Gains/Def Ben Plans 5,755 – 5,755 Common Equity Tier 1 Capital 119,553 - 119,553 Additional Tier 1 Capital – – – Total Tier 1 Capital 119,553$ -$ 119,553$ Tier 2 Capital Instruments -$ 20,000$ 20,000$ ALLL Includable in Tier 2 Capital 12,262 – 12,262 Total Tier 2 Capital 12,262 20,000 32,262 Total Capital 131,813$ 20,000$ 151,815$ Average Total Consolidated Assets 1,304,531 20,000 1,324,531 Less: Deductions from CET1 and Additional T1 – – – Less: Other Deductions from Leverage Ratio – – – Total Assets for Leverage Ratio 1,304,531 20,000 1,324,531 Total Risk-Weighted Assets 980,580 4,000 984,580 Common Equity Tier 1 Ratio 12.19% 12.14% Leverage Ratio 9.16% 9.03% Tier 1 Risk-Based Ratio 12.19% 12.14% Total Risk-Based Capital Ratio 13.44% 15.42% Note: For illustrative purposes, Bank capital ratios assume $18.0 million in proceeds raised is available to be down - streamed to the Bank. Management currently anticipates that at least $2.0 million will be held at the holding company as an interest reserve. (1) Pro Forma At September 30, 2020 Source: S&P Global Market Intelligence; Company provided financial information (unaudited) Note : Invested proceeds from $20.0 million capital raise assumed to have 20% risk - weighting (1) Pro forma Bank equity assumes $18.0 million of $20.0 million in proceeds is down - streamed to the Bank 10

($ in thousands) 2020YTD Interest Coverage 2019 Annualized PF Consolidated Pre-Tax Earnings Consolidated Pre-Tax Income, Ex Budgeted Sub-Debt (1) 13,521 13,745 Debt Expense - - A Pre-Tax Earnings Before BHC Debt Interest Expense 13,521 13,745 BHC Debt Interest Expense B Total Interest Expense - Sub Debt at 4.50% & Other Debt Expense 900 900 C Total Interest Expense - Sub Debt at 4.75% & Other Debt Expense 950 950 D Total Interest Expense - Sub Debt at 5.00% & Other Debt Expense 1,000 1,000 Pro Forma Interest Coverage - A / B 15.0x 15.3x Pro Forma Interest Coverage - A / C 14.2x 14.5x Pro Forma Interest Coverage - A / D 13.5x 13.7x Bank Net Income Coverage of BHC Interest Expense Bank Net Income (2) 11,493 12,160 BHC Operating Expenses 211 294 E Bank Net Income Less BHC Operating Expenses 11,282 11,866 Pro Forma Interest Coverage - E / B 12.5x 13.2x Pro Forma Interest Coverage - E / C 11.9x 12.5x Pro Forma Interest Coverage - E / D 11.3x 11.9x Pro Forma Debt / Equity and Double Leverage 09/30/20 A 09/30/20 PF Consolidated Equity $116,688 $125,308 Newly Issued Subordinated Debt - $20,000 Debt / Equity - 16.0% Bank Equity (3) $124,155 $142,155 Double Leverage Ratio 106.4% 113.4% Source: Company documents, S&P Global Market Intelligence; Company provided financial information (unaudited) Note: Pro forma financials based upon: $294k of holding company operating expenses assumed for 2020 and annualized consolidat ed pre - tax income for the 9 months ended September 30, 2020. (1) Consolidated pre - tax income excludes new subordinated debt interest exp. (2) 2020E bank - level net income is based on annualized 2020YTD results as of September 30, 2020. (3) Pro forma Bank equity assumes $18.0 million of $20.0 million in proceeds is down - streamed to the Bank due to $2.0 million intere st reserve. Debt Service Coverage Ratio 11
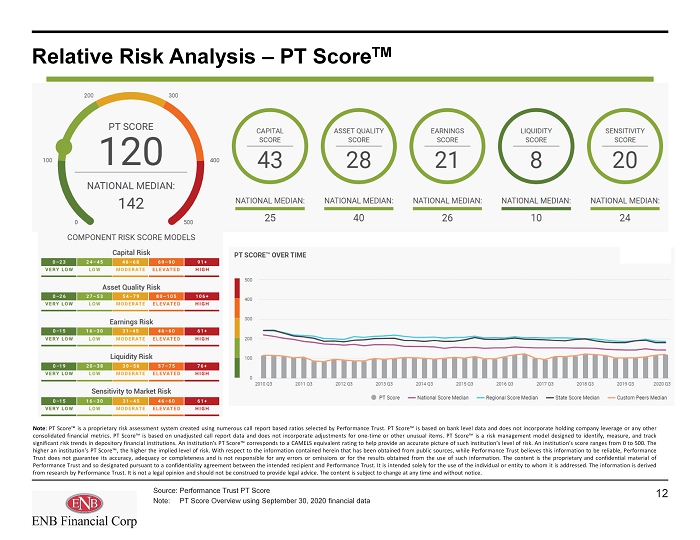
Relative Risk Analysis – PT Score TM Source: Performance Trust PT Score Note: PT Score Overview using September 30, 2020 financial data Note : PT Score™ is a proprietary risk assessment system created using numerous call report based ratios selected by Performance Trust . PT Score™ is based on bank level data and does not incorporate holding company leverage or any other consolidated financial metrics . PT Score™ is based on unadjusted call report data and does not incorporate adjustments for one - time or other unusual items . PT Score™ is a risk management model designed to identify, measure, and track significant risk trends in depository financial institutions . An institution’s PT Score™ corresponds to a CAMELS equivalent rating to help provide an accurate picture of such institution’s level of risk . An institution’s score ranges from 0 to 500 . The higher an institution’s PT Score™, the higher the implied level of risk . With respect to the information contained herein that has been obtained from public sources, while Performance Trust believes this information to be reliable, Performance Trust does not guarantee its accuracy, adequacy or completeness and is not responsible for any errors or omissions or for the results obtained from the use of such information . The content is the proprietary and confidential material of Performance Trust and so designated pursuant to a confidentiality agreement between the intended recipient and Performance Trust . It is intended solely for the use of the individual or entity to whom it is addressed . The information is derived from research by Performance Trust . It is not a legal opinion and should not be construed to provide legal advice . The content is subject to change at any time and without notice . 12
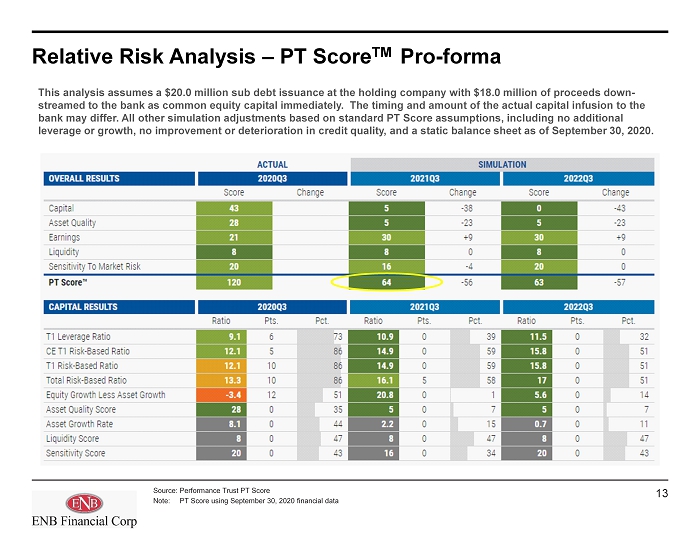
Relative Risk Analysis – PT Score TM Pro - forma Source: Performance Trust PT Score Note: PT Score using September 30, 2020 financial data This analysis assumes a $20.0 million sub debt issuance at the holding company with $18.0 million of proceeds down - streamed to the bank as common equity capital immediately. The timing and amount of the actual capital infusion to the bank may differ. All other simulation adjustments based on standard PT Score assumptions, including no additional leverage or growth, no improvement or deterioration in credit quality, and a static balance sheet as of September 30, 2020. 13

II. Management Team, Board of Directors & Ownership Information 14

Experienced Management Team Source: Company provided biographies Executive Years at ENB Years in Banking Biography Jeffrey Stauffer President, CEO and Chairman 38 38 Stauffer has had over 38 years of banking industry experience with Ephrata National Bank . Stauffer has held many roles at Ephrata National Bank to include Teller, Assistant Branch Manager, Commercial Loan Officer, AVP, Commercial Lending, VP, Commercial Lending, Senior Vice President and Senior Loan Officer . Stauffer graduated from the Central Atlantic Advanced School of Banking at Bucknell University and earned his Commercial Lending Diploma from The American Institute of Banking . Scott Lied EVP, Chief Financial Officer 22 30 Lied has had 22 year of experience with Ephrata National Bank . Lied has held executive roles for the last 16 years as Chief Financial Officer and his other roles have included VP Controller and SVP Controller . Lied holds a Bachelor of Science Degree in Accounting from Elizabethtown College . Lied has experience in accounting, audits, budgets, annual reporting and SEC reporting, corporate stock options and deferred compensation plans . Matthew Long EVP, Chief Operating Officer 5 23 Long has had 5 years of experience with Ephrata National Bank and 23 years in the banking industry . Long has held an executive role for the last year . Long has held critical roles at Ephrata National Bank to include Vice President of Cash Management and Director of Cash Management . Long holds a Bachelor of Science Degree in Financial Management from Grove City College and was an honors graduate from the Pennsylvania Banker’s Association Advanced School of Banking . Long has experience in Cash Management sales and operations implementation . Eric Williams EVP, Chief Lending Officer 4 41 Williams has had 41 years of extensive banking industry experience . Williams has held roles at Ephrata National Bank to include VP, Commercial Lending, Senior VP and Chief Lending Officer . Williams has held an executive role for the last year . Williams holds a Bachelor of Science Degree in Business Administration from Elizabethtown College and is a graduate of the ABA Stonier Graduate School of Banking . Williams has experience in commercial loans, commercial lending, asset recovery, retail loan and deposit products as well as investment and asset management services . 15
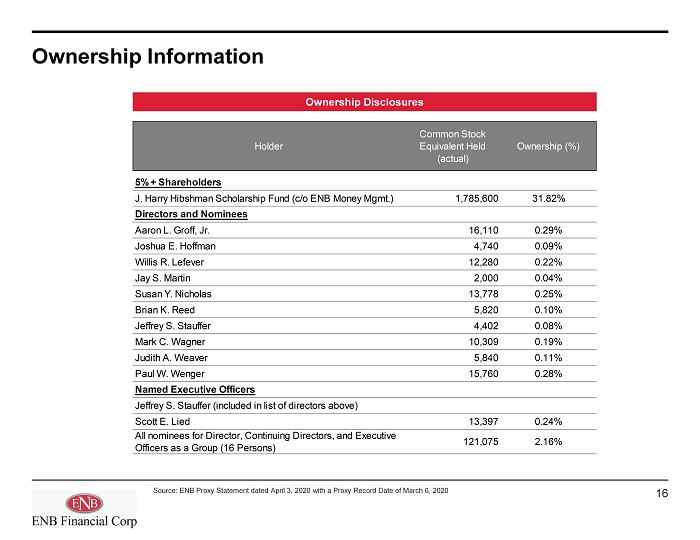
Ownership Information Source: ENB Proxy Statement dated April 3, 2020 with a Proxy Record Date of March 6, 2020 Holder Common Stock Equivalent Held (actual) Ownership (%) 5%+ Shareholders J. Harry Hibshman Scholarship Fund (c/o ENB Money Mgmt.) 1,785,600 31.82% Directors and Nominees Aaron L. Groff, Jr. 16,110 0.29% Joshua E. Hoffman 4,740 0.09% Willis R. Lefever 12,280 0.22% Jay S. Martin 2,000 0.04% Susan Y. Nicholas 13,778 0.25% Brian K. Reed 5,820 0.10% Jeffrey S. Stauffer 4,402 0.08% Mark C. Wagner 10,309 0.19% Judith A. Weaver 5,840 0.11% Paul W. Wenger 15,760 0.28% Named Executive Officers Jeffrey S. Stauffer (included in list of directors above) Scott E. Lied 13,397 0.24% All nominees for Director, Continuing Directors, and Executive Officers as a Group (16 Persons) 121,075 2.16% Ownership Disclosures 16

III. Assets Highlights 17

Balance Sheet Growth Source: S&P Global Market Intelligence Note: Financial data at bank - level Note: This slide includes certain Unaudited Financial Information Total Loans Total Assets ($ in millions) ($ in millions) $984 $1,033 $1,097 $1,171 $1,316 – $400 $800 $1,200 $1,600 2016Y 2017Y 2018Y 2019Y 2020Q3 $574 $600 $696 $756 $848 – $250 $500 $750 $1,000 2016Y 2017Y 2018Y 2019Y 2020Q3 $819 $868 $921 $975 $1,127 – $300 $600 $900 $1,200 2016Y 2017Y 2018Y 2019Y 2020Q3 $93 $98 $101 $115 $124 – $50 $100 $150 $200 2016Y 2017Y 2018Y 2019Y 2020Q3 Total Equity Total Deposits ($ in millions) ($ in millions) 18

Investment Portfolio Composition & Performance Source: S&P Global Market Intelligence Note: This slide includes certain Unaudited Financial Information ( 1) As of September 30, 2020 per Company filed 10 - Q report Portfolio Management Statistics Asset Class Breakdown • The management of the investment portfolio has focused on a combination of low - risk liquidity fixed income sectors combined with some higher earnings generating sectors that complement the bank’s overall balance sheet and interest rate risk profile • The investment portfolio consists largely of investment graded municipal bonds and agency residential MBS • Portfolio information (1) : • Tax - equivalent yield: 2.04% • Weighted average life: 4.70 Years RMBS 29.6% Govt & Agency Secs 2.3% State & Political Subdiv Secs 39.8% Other Securities 16.9% ABS 11.4% 19

$574 $600 $696 $756 $848 $- $200 $400 $600 $800 $1,000 2016Y 2017Y 2018Y 2019Y 2020Q3 Non Owner Occ. CRE , 4.2% C&I (excl. PPP) , 6.1% PPP , 7.7% Owner Occ. CRE , 10.3% 1 - 4 Family , 40.8% Constr & Land Dev , 2.6% Multifam , 1.6% Consumer , 0.6% Farm , 20.5% Ag. Prod. , 2.4% Other , 3.1% Loan Portfolio Diversification & Growth 09/30/20 Loan Composition – Regulatory Classification Loan Trends ($ in millions) 09/30/20 Regulatory Loan Composition (in $000s) Balance % of TRBC % of TRBC PF* 1-4 Family Residential $345,949 265% 233% Non-Owner Occupied CRE 35,856 27% 24% Owner Occupied CRE 87,252 67% 59% Commercial & Industrial 116,971 90% 79% Construction & Land Development 22,380 17% 15% Multifamily 13,444 10% 9% Consumer 5,200 4% 3% Farm Loans 174,150 133% 117% Ag Prod 20,494 16% 14% Other Loans 26,489 20% 18% Total Loans $848,185 Total CRE (Ex owner occupied) $71,680 55% 48% ─ As of 09/30/2020, the Bank had approved 1,010 PPP loans totaling $77.7 million Paycheck Protection Program (PPP) Update: Source: S&P Global Market Intelligence Note: This slide includes certain Unaudited Financial Information * PF = Assumes $20.0 million capital raise with $18.0 million of proceeds down - streamed to the Bank 20
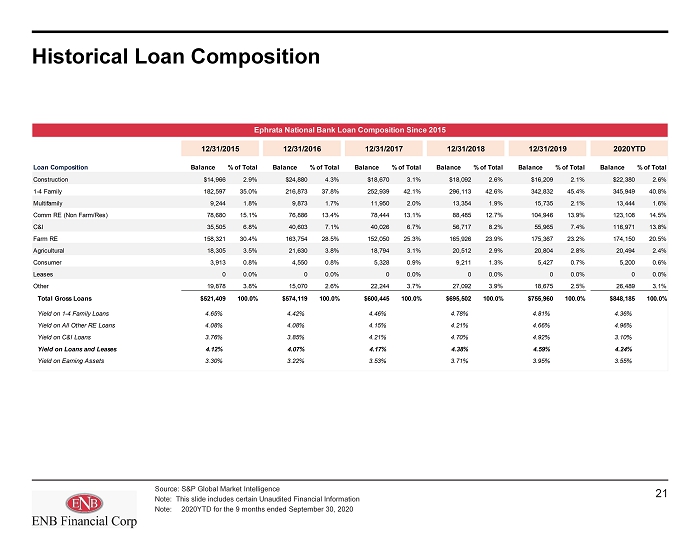
Historical Loan Composition Source: S&P Global Market Intelligence Note: This slide includes certain Unaudited Financial Information Note : 2020YTD for the 9 months ended September 30, 2020 Ephrata National Bank Loan Composition Since 2015 12/31/2015 12/31/2016 12/31/2017 12/31/2018 12/31/2019 2020YTD Loan Composition Balance % of Total Balance % of Total Balance % of Total Balance % of Total Balance % of Total Balance % of Total Construction $14,966 2.9% $24,880 4.3% $18,670 3.1% $18,092 2.6% $16,209 2.1% $22,380 2.6% 1-4 Family 182,597 35.0% 216,873 37.8% 252,939 42.1% 296,113 42.6% 342,832 45.4% 345,949 40.8% Multifamily 9,244 1.8% 9,873 1.7% 11,950 2.0% 13,354 1.9% 15,735 2.1% 13,444 1.6% Comm RE (Non Farm/Res) 78,680 15.1% 76,886 13.4% 78,444 13.1% 88,485 12.7% 104,946 13.9% 123,108 14.5% C&I 35,505 6.8% 40,603 7.1% 40,026 6.7% 56,717 8.2% 55,965 7.4% 116,971 13.8% Farm RE 158,321 30.4% 163,754 28.5% 152,050 25.3% 165,926 23.9% 175,367 23.2% 174,150 20.5% Agricultural 18,305 3.5% 21,630 3.8% 18,794 3.1% 20,512 2.9% 20,804 2.8% 20,494 2.4% Consumer 3,913 0.8% 4,550 0.8% 5,328 0.9% 9,211 1.3% 5,427 0.7% 5,200 0.6% Leases 0 0.0% 0 0.0% 0 0.0% 0 0.0% 0 0.0% 0 0.0% Other 19,878 3.8% 15,070 2.6% 22,244 3.7% 27,092 3.9% 18,675 2.5% 26,489 3.1% Total Gross Loans $521,409 100.0% $574,119 100.0% $600,445 100.0% $695,502 100.0% $755,960 100.0% $848,185 100.0% Yield on 1-4 Family Loans 4.65% 4.42% 4.46% 4.78% 4.81% 4.36% Yield on All Other RE Loans 4.08% 4.08% 4.15% 4.21% 4.66% 4.96% Yield on C&I Loans 3.76% 3.85% 4.21% 4.70% 4.92% 3.10% Yield on Loans and Leases 4.12% 4.07% 4.17% 4.38% 4.59% 4.24% Yield on Earning Assets 3.30% 3.22% 3.53% 3.71% 3.95% 3.55% 21
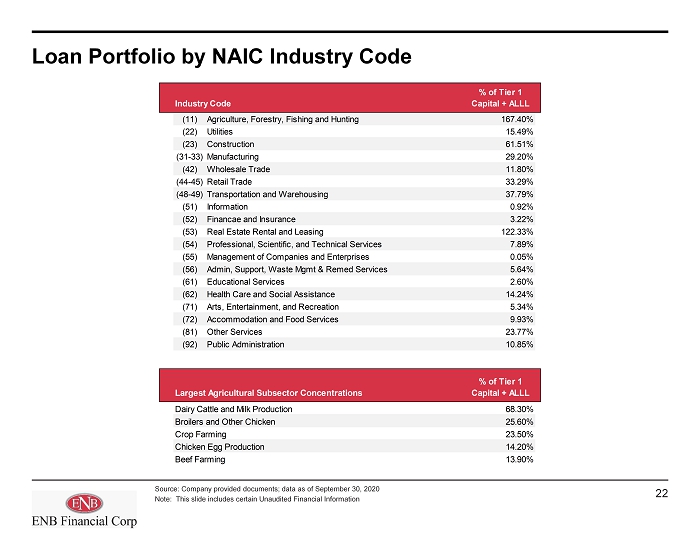
Loan Portfolio by NAIC Industry Code Source: Company provided documents; data as of September 30, 2020 Note: This slide includes certain Unaudited Financial Information % of Tier 1 Industry Code Capital + ALLL (11) Agriculture, Forestry, Fishing and Hunting 167.40% (22) Utilities 15.49% (23) Construction 61.51% (31-33)Manufacturing 29.20% (42) Wholesale Trade 11.80% (44-45)Retail Trade 33.29% (48-49)Transportation and Warehousing 37.79% (51) Information 0.92% (52) Financae and Insurance 3.22% (53) Real Estate Rental and Leasing 122.33% (54) Professional, Scientific, and Technical Services 7.89% (55) Management of Companies and Enterprises 0.05% (56) Admin, Support, Waste Mgmt & Remed Services 5.64% (61) Educational Services 2.60% (62) Health Care and Social Assistance 14.24% (71) Arts, Entertainment, and Recreation 5.34% (72) Accommodation and Food Services 9.93% (81) Other Services 23.77% (92) Public Administration 10.85% % of Tier 1 Largest Agricultural Subsector Concentrations Capital + ALLL Dairy Cattle and Milk Production 68.30% Broilers and Other Chicken 25.60% Crop Farming 23.50% Chicken Egg Production 14.20% Beef Farming 13.90% 22
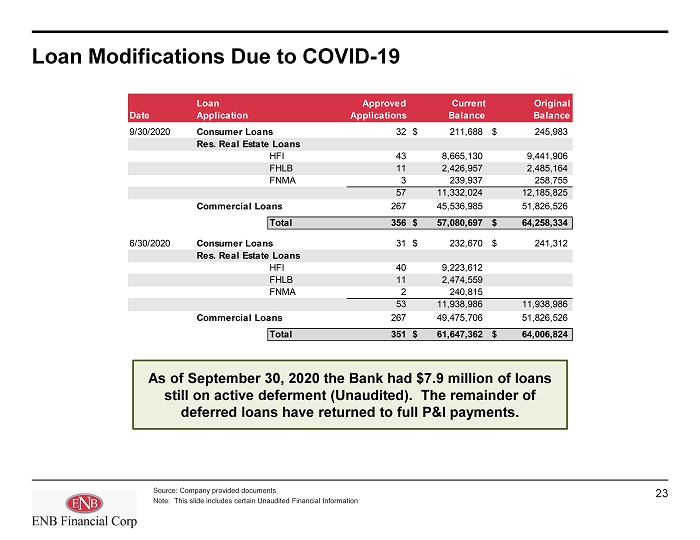
Loan Modifications Due to COVID - 19 Source: Company provided documents Note: This slide includes certain Unaudited Financial Information Date Loan Application Approved Applications Current Balance Original Balance 9/30/2020 Consumer Loans 32 211,688$ 245,983$ Res. Real Estate Loans HFI 43 8,665,130 9,441,906 FHLB 11 2,426,957 2,485,164 FNMA 3 239,937 258,755 57 11,332,024 12,185,825 Commercial Loans 267 45,536,985 51,826,526 Total 356 57,080,697$ 64,258,334$ 6/30/2020 Consumer Loans 31 232,670$ 241,312$ Res. Real Estate Loans HFI 40 9,223,612 FHLB 11 2,474,559 FNMA 2 240,815 53 11,938,986 11,938,986 Commercial Loans 267 49,475,706 51,826,526 Total 351 61,647,362$ 64,006,824$ As of September 30, 2020 the Bank had $7.9 million of loans still on active deferment (Unaudited ). The remainder of deferred loans have returned to full P&I payments. 23

Historical Net Charge - Offs & Non - Performing Assets Source: S&P Global Market Intelligence Note: 2020YTD through September 30, 2020 Note: This slide includes certain Unaudited Financial Information Net Chargeoffs / Average Loans (%) 2015 2016 2017 2018 2019 2020 YTD Ephrata National Bank 0.04 -0.03 0.05 0.04 0.00 0.00 PA Banks Aggregate 0.23 0.26 0.19 0.15 0.13 0.17 Ephrata National Bank vs. PA Banks (0.19) (0.29) (0.14) (0.11) (0.13) (0.17) NPAs / Assets (%) 2015 2016 2017 2018 2019 2020 YTD Ephrata National Bank 0.04 0.07 0.18 0.32 0.34 0.48 PA Banks Aggregate 0.84 0.82 0.72 0.69 0.72 0.78 Ephrata National Bank vs. PA Banks (0.80) (0.75) (0.54) (0.37) (0.38) (0.30) 24
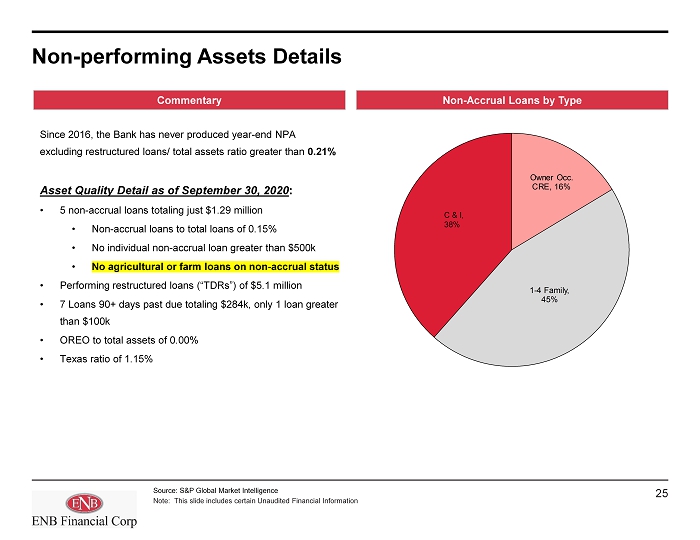
Non - performing Assets Details Source: S&P Global Market Intelligence Note: This slide includes certain Unaudited Financial Information Non - Accrual Loans by Type Commentary Since 2016, the Bank has never produced year - end NPA excluding restructured loans/ total assets ratio greater than 0.21% Asset Quality Detail as of September 30, 2020 : • 5 non - accrual loans totaling just $1.29 million • Non - accrual loans to total loans of 0.15% • No individual non - accrual loan greater than $500k • No agricultural or farm loans on non - accrual status • Performing restructured loans (“TDRs”) of $5.1 million • 7 Loans 90+ days past due totaling $284k, only 1 loan greater than $100k • OREO to total assets of 0.00% • Texas ratio of 1.15% Owner Occ. CRE , 16% 1 - 4 Family , 45% C & I, 38% 25
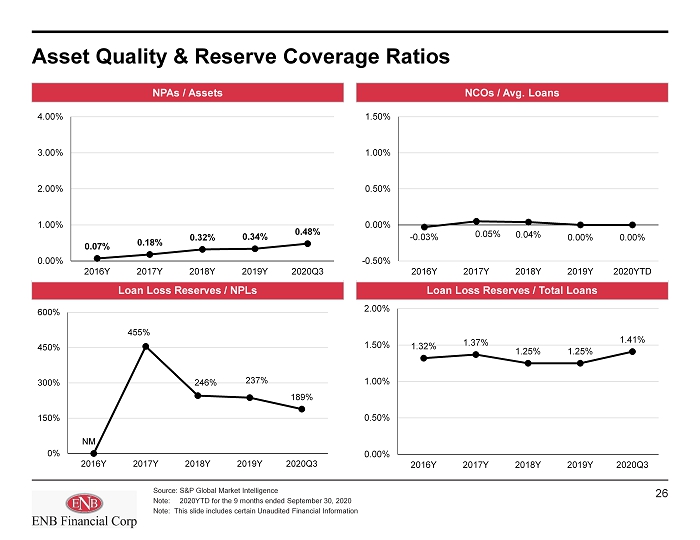
Asset Quality & Reserve Coverage Ratios Source: S&P Global Market Intelligence Note: 2020YTD for the 9 months ended September 30, 2020 Note: This slide includes certain Unaudited Financial Information Loan Loss Reserves / NPLs NCOs / Avg. Loans Loan Loss Reserves / Total Loans NPAs / Assets 0.07% 0.18% 0.32% 0.34% 0.48% 0.00% 1.00% 2.00% 3.00% 4.00% 2016Y 2017Y 2018Y 2019Y 2020Q3 - 0.03% 0.05% 0.04% 0.00% 0.00% -0.50% 0.00% 0.50% 1.00% 1.50% 2016Y 2017Y 2018Y 2019Y 2020YTD 1.32% 1.37% 1.25% 1.25% 1.41% 0.00% 0.50% 1.00% 1.50% 2.00% 2016Y 2017Y 2018Y 2019Y 2020Q3 NM 455% 246% 237% 189% 0% 150% 300% 450% 600% 2016Y 2017Y 2018Y 2019Y 2020Q3 26

IV. Liabilities Highlights 27

Deposit Growth & Composition Source: S&P Global Market Intelligence; Deposit composition as of September 30, 2020 Note: This slide includes certain Unaudited Financial Information Deposit Trends Deposit Composition Transaction Accts , 13.9% Money Market , 52.5% Other Savings , 22.7% CDs > $100k , 3.4% CDs < $100k , 7.4% $819 $868 $921 $975 $1,127 – $300 $600 $900 $1,200 2016Y 2017Y 2018Y 2019Y 2020Q3 ($ in millions) 28

Regional Deposit Information Source: S&P Global Market Intelligence; Deposit composition as of June 30, 2020 Note: This slide includes certain Unaudited Financial Information 1 3 2 Lancaster, PA 2020 2020 2020 2020 Deposits Market Rank Institution (ST) Branches ($000s) Share (%) 1 Fulton Financial Corp. (PA) 23 4,021,550 28.52% 2 Truist Financial Corp. (NC) 26 2,206,044 15.64% 3 PNC Financial Services Group (PA) 18 1,773,626 12.58% 4 ENB Financial Corp (PA) 12 1,037,159 7.35% 5 Wells Fargo & Co. (CA) 12 1,021,812 7.25% 6 Northwest Bancshares, Inc. (PA) 15 595,425 4.22% 7 M&T Bank Corp. (NY) 9 559,445 3.97% 8 Bank of Bird-in-Hand (PA) 4 453,151 3.21% 9 S&T Bancorp Inc. (PA) 3 388,175 2.75% 10 F.N.B. Corp. (PA) 4 374,534 2.66% Total For Institutions in Market 174 14,102,995 Berks, PA 2020 2020 2020 2020 Deposits Market Rank Institution (ST) Branches ($000s) Share (%) 1 Customers Bancorp Inc (PA) 4 6,183,569 34.09% 2 Banco Santander 8 4,276,455 23.58% 3 Wells Fargo & Co. (CA) 12 1,890,052 10.42% 4 Truist Financial Corp. (NC) 15 1,405,565 7.75% 5 Tompkins Financial Corporation (NY) 14 1,107,185 6.10% 6 Fulton Financial Corp. (PA) 9 880,538 4.85% 7 M&T Bank Corp. (NY) 14 819,265 4.52% 8 Citizens Financial Group Inc. (RI) 8 441,660 2.43% 9 F.N.B. Corp. (PA) 4 407,350 2.25% 10 Fleetwood Bank Corp. (PA) 7 272,557 1.50% 15 ENB Financial Corp (PA) 1 40,417 0.22% Total For Institutions In Market 108 18,139,375 Lebanon, PA 2020 2020 2020 2020 Deposits Market Rank Institution (ST) Branches ($000s) Share (%) 1 Fulton Financial Corp. (PA) 8 931,437 35.62% 2 Jonestown Bank and Trust Co. (PA) 10 508,755 19.45% 3 Wells Fargo & Co. (CA) 5 385,745 14.75% 4 Northwest Bancshares, Inc. (PA) 3 199,743 7.64% 5 Citizens Financial Services (PA) 3 185,451 7.09% 6 F.N.B. Corp. (PA) 2 140,602 5.38% 7 M&T Bank Corp. (NY) 1 90,241 3.45% 8 Truist Financial Corp. (NC) 2 66,769 2.55% 9 Banco Santander 1 60,897 2.33% 10 ENB Financial Corp (PA) 1 30,958 1.18% Total For Institutions in Market 37 2,615,168 29
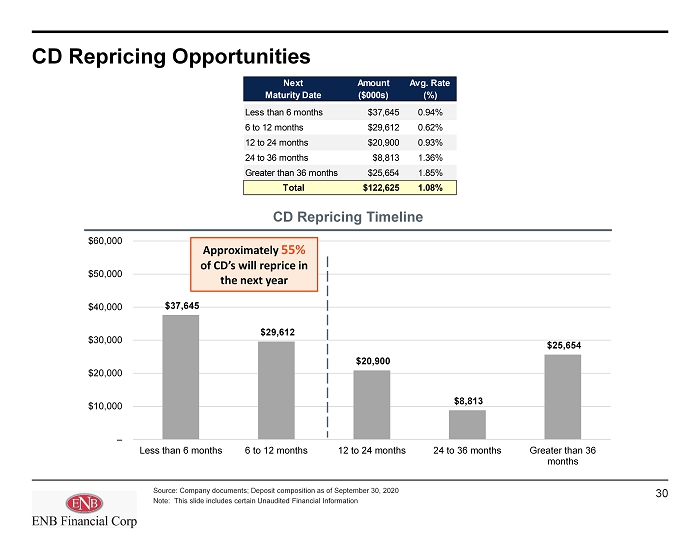
$37,645 $29,612 $20,900 $8,813 $25,654 – $10,000 $20,000 $30,000 $40,000 $50,000 $60,000 Less than 6 months 6 to 12 months 12 to 24 months 24 to 36 months Greater than 36 months CD Repricing Opportunities Source: Company documents; Deposit composition as of September 30, 2020 Note: This slide includes certain Unaudited Financial Information CD Repricing Timeline Approximately 55% of CD’s will reprice in the next year Next Amount Avg. Rate Maturity Date ($000s) (%) Less than 6 months $37,645 0.94% 6 to 12 months $29,612 0.62% 12 to 24 months $20,900 0.93% 24 to 36 months $8,813 1.36% Greater than 36 months $25,654 1.85% Total $122,625 1.08% 30

V. Capital Highlights 31
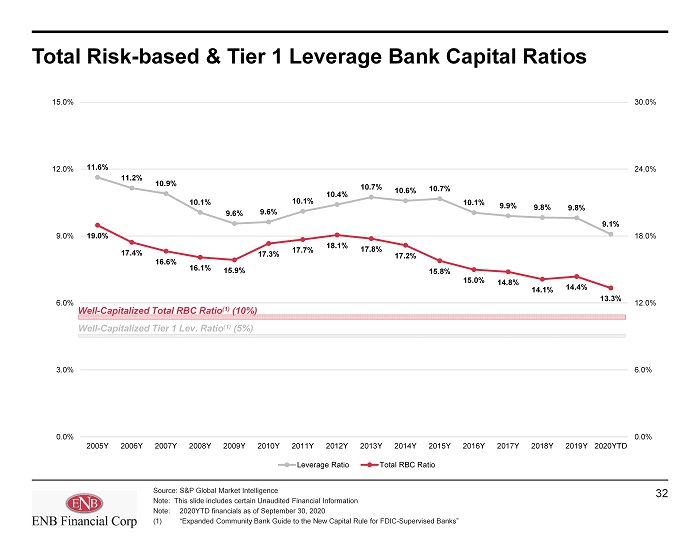
Total Risk - based & Tier 1 Leverage Bank Capital Ratios Source: S&P Global Market Intelligence Note: This slide includes certain Unaudited Financial Information Note : 2020YTD financials as of September 30, 2020 (1) “Expanded Community Bank Guide to the New Capital Rule for FDIC - Supervised Banks” 11.6% 11.2% 10.9% 10.1% 9.6% 9.6% 10.1% 10.4% 10.7% 10.6% 10.7% 10.1% 9.9% 9.8% 9.8% 9.1% 19.0% 17.4% 16.6% 16.1% 15.9% 17.3% 17.7% 18.1% 17.8% 17.2% 15.8% 15.0% 14.8% 14.1% 14.4% 13.3% 0.0% 6.0% 12.0% 18.0% 24.0% 30.0% 0.0% 3.0% 6.0% 9.0% 12.0% 15.0% 2005Y 2006Y 2007Y 2008Y 2009Y 2010Y 2011Y 2012Y 2013Y 2014Y 2015Y 2016Y 2017Y 2018Y 2019Y 2020YTD Leverage Ratio Total RBC Ratio Well - Capitalized Tier 1 Lev. Ratio (1) (5%) Well - Capitalized Total RBC Ratio (1) (10%) 32

Historical Regulatory Bank Capital Ratios Source: S&P Global Market Intelligence Note: This slide includes certain Unaudited Financial Information Note : 2020YTD financials as of September 30, 2020 (1) “Expanded Community Bank Guide to the New Capital Rule for FDIC - Supervised Banks” Tier 1 Risk Based Ratio CET1 Ratio Total Risk Based Ratio Tier 1 Leverage Ratio 9.90% 9.83% 9.81% 9.08% 0.00% 3.00% 6.00% 9.00% 12.00% 15.00% 2017Y 2018Y 2019Y 2020YTD 13.63% 13.03% 13.21% 12.09% 0.00% 4.00% 8.00% 12.00% 16.00% 20.00% 2017Y 2018Y 2019Y 2020YTD 13.63% 13.03% 13.21% 12.09% 0.00% 4.00% 8.00% 12.00% 16.00% 20.00% 2017Y 2018Y 2019Y 2020YTD 14.79% 14.13% 14.37% 13.34% 0.00% 4.00% 8.00% 12.00% 16.00% 20.00% 24.00% 2017Y 2018Y 2019Y 2020YTD Well - Capitalized Tier 1 Lev. Ratio (1) (5%) Well - Capitalized CET1 Ratio (1) (6.5%) Well - Capitalized Tier 1 Risk - Based Ratio (1) (8%) Well - Capitalized Total Risk - Based. Ratio (1) (10%) 33
VI. Income Statement Highlights 34
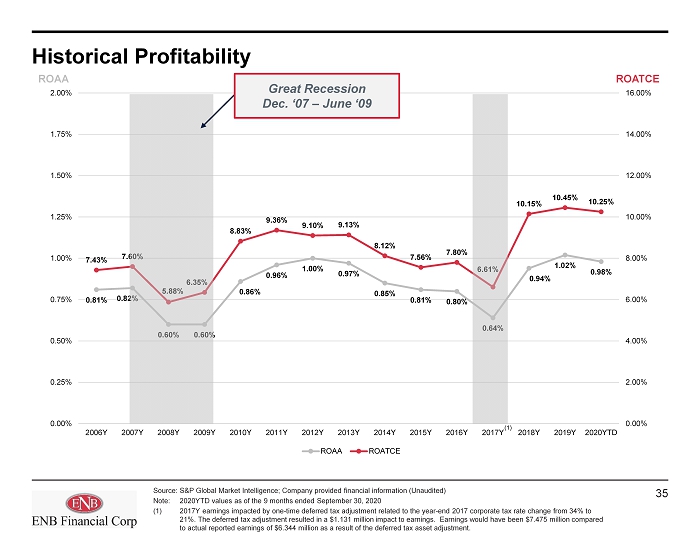
Historical Profitability 0.81% 0.82% 0.60% 0.60% 0.86% 0.96% 1.00% 0.97% 0.85% 0.81% 0.80% 0.64% 0.94% 1.02% 0.98% 7.43% 7.60% 5.88% 6.35% 8.83% 9.36% 9.10% 9.13% 8.12% 7.56% 7.80% 6.61% 10.15% 10.45% 10.25% 0.00% 2.00% 4.00% 6.00% 8.00% 10.00% 12.00% 14.00% 16.00% 0.00% 0.25% 0.50% 0.75% 1.00% 1.25% 1.50% 1.75% 2.00% 2006Y 2007Y 2008Y 2009Y 2010Y 2011Y 2012Y 2013Y 2014Y 2015Y 2016Y 2017Y 2018Y 2019Y 2020YTD ROAA ROATCE Source: S&P Global Market Intelligence; Company provided financial information (Unaudited) Note: 2020YTD values as of the 9 months ended September 30, 2020 (1) 2017Y earnings impacted by one - time deferred tax adjustment related to the year - end 2017 corporate tax rate change from 34% to 21%. The deferred tax adjustment resulted in a $1.131 million impact to earnings. Earnings would have been $7.475 million compared to actual reported earnings of $6.344 million as a result of the deferred tax asset adjustment. ROAA ROATCE Great Recession Dec. ‘07 – June ‘09 (1) 35
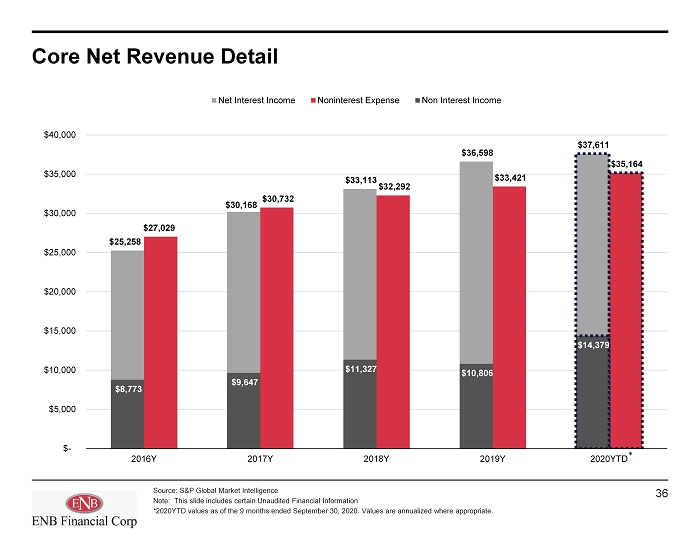
Core Net Revenue Detail Source: S&P Global Market Intelligence Note: This slide includes certain Unaudited Financial Information * 2020YTD values as of the 9 months ended September 30, 2020. Values are annualized where appropriate. $25,258 $30,168 $33,113 $36,598 $37,611 $27,029 $30,732 $32,292 $33,421 $35,164 $8,773 $9,647 $11,327 $10,806 $14,379 $- $5,000 $10,000 $15,000 $20,000 $25,000 $30,000 $35,000 $40,000 2016Y 2017Y 2018Y 2019Y 2020YTD Net Interest Income Noninterest Expense Non Interest Income * 36

4.11% 4.22% 4.41% 4.61% 4.26% 2.48% 3.18% 2.64% 2.66% 2.27% 0.40% 0.35% 0.38% 0.60% 0.38% 0.36% 0.32% 0.35% 0.50% 0.37% 0.00% 1.00% 2.00% 3.00% 4.00% 5.00% 2016Y 2017Y 2018Y 2019Y 2020YTD* Loan Yield Securities Yield (FTE) Cost of Int. Bearing Dep. Cost of Funds Net Interest Income & Net Interest Margin Source: S&P Global Market Intelligence Note: This slide includes certain Unaudited Financial Information Note : Tax - equivalent securities yield shown on page 20 is a more current yield for the third quarter of 2020 only. *2020YTD values as of the 9 months ended September 30, 2020. Values are annualized where appropriate . 09/30/20 YTD loan yield was 4.45% excluding the impact of PPP loans $25,258 $30,168 $33,113 $36,598 $37,611 3.13% 3.48% 3.47% 3.54% 3.27% 0.00% 1.50% 3.00% 4.50% 6.00% $- $10,000 $20,000 $30,000 $40,000 2016Y 2017Y 2018Y 2019Y 2020YTD* Net Interest Income NIM (FTE) ($ in thousands) Key Components of NII and NIM Net Interest Income (NII) and Net Interest Margin (NIM) 37

Profitability & Expense Controls 74.5% 72.7% 71.2% 69.3% 66.6% 2.87% 3.06% 3.06% 2.96% 2.82% 0.0% 1.0% 2.0% 3.0% 4.0% 5.0% 0.0% 20.0% 40.0% 60.0% 80.0% 100.0% 2016Y 2017Y 2018Y 2019Y 2020YTD Noninterest Expense / Avg. Assets Efficiency Ratio Efficiency Ratio (FTE) Noninterest Expense / Avg. Assets ROATCE & ROAA Efficiency Ratio 7.8% 6.6% 10.2% 10.5% 10.3% 0.8% 0.6% 0.9% 1.0% 1.0% 0.0% 0.3% 0.5% 0.8% 1.0% 1.3% 0.0% 4.0% 8.0% 12.0% 16.0% 20.0% 2016Y 2017Y 2018Y 2019Y 2020YTD ROAA ROATCE ROATCE ROAA • Stable noninterest expense / average assets and improving efficiency ratio • Improving profitability Source: S&P Global Market Intelligence Note: This slide includes certain Unaudited Financial Information Note : 2020YTD values as of the 9 months ended September 30, 2020 38

3.56% 3.57% 3.46% 3.41% 3.25% 3.17% 1.97% 1.83% 2.12% 2.16% 1.42% 1.47% 0.00% 0.50% 1.00% 1.50% 2.00% 2.50% 3.00% 3.50% 4.00% 2019Q2 2019Q3 2019Q4 2020Q1 2020Q2 2020Q3 Net Interest Margin (FTE) Net Noninterest Expense /AA Net Interest Margin vs. Net Non - interest Expense Source: S&P Global Market Intelligence Note: This slide includes certain Unaudited Financial Information Net NIE / AA = (Noninterest Expense – Noninterest Income) / Avg. Assets 39

Asset - liability Management Profile Source: Company provided documents (Unaudited) Note: Sensitivity profiles as of September 30, 2020 Net Interest Income Sensitivity Profile Interest Rate Scenario -75 -50 -25 Base 100 200 300 Net Interest Income Change - Next 12 Months -2.66% -1.61% -0.33% 0.00% 1.91% 3.45% 5.08% Economic Value Sensitivity Profile Interest Rate Scenario -75 -50 -25 Base 100 200 300 MVE Change -30.3% -20.3% -10.1% 0.0% 20.1% 30.9% 34.8% 40

VII. Appendix 41

Regulatory Financial Highlights Source: S&P Global Market Intelligence Note: This slide includes certain Unaudited Financial Information Note : Financial data shown at Bank level 12/31/2016 For the Years Ended: For the Quarters Ended: 9/30/2020 12/31/2016 12/31/2017 12/31/2018 12/31/2019 9/30/2019 12/31/2019 3/31/2020 6/30/2020 9/30/2020 CAGR Balance Sheet Total Assets ($000) 983,934 1,033,282 1,097,256 1,171,070 1,145,395 1,171,070 1,177,411 1,298,808 1,316,278 8.1% Total Net Loans ($000) 574,119 600,445 695,502 755,960 739,682 755,960 766,539 838,265 848,185 11.0% Total Deposits ($000) 818,804 867,642 920,570 974,950 947,180 974,950 983,096 1,108,534 1,127,174 8.9% Tangible Equity ($000) 93,255 98,184 101,311 115,065 114,775 115,065 115,605 120,798 124,155 Loans / Deposits (%) 70.1 69.2 75.6 77.5 78.1 77.5 78.0 75.6 75.3 (Cash + Securities)/ Assets (%) 35.9 36.0 31.1 30.3 30.2 30.3 29.7 31.0 31.2 TCE / TA (%) 9.5 9.5 9.2 9.8 10.0 9.8 9.8 9.3 9.4 Tier 1 Leverage Ratio (%) 10.1 9.9 9.8 9.8 10.0 9.8 9.8 9.2 9.1 Total Risk-Based Capital Ratio (%) 15.0 14.8 14.1 14.4 14.6 14.4 14.2 13.3 13.3 Profitability Net Income ($000) 7,524 6,418 9,896 11,493 2,958 2,775 2,440 3,666 3,014 ROAA (%) 0.80 0.64 0.94 1.02 1.04 0.96 0.83 1.16 0.92 ROAE (%) 7.80 6.61 10.15 10.45 10.47 9.66 8.46 12.41 9.84 ROATCE (%) 7.80 6.61 10.15 10.45 10.47 9.66 8.46 12.41 9.84 Net Interest Margin (%) 2.87 3.21 3.37 3.46 3.49 3.40 3.36 3.24 3.10 Efficiency Ratio (%) 74.5 72.7 71.2 69.3 65.3 73.4 74.6 61.1 64.9 Noninterest Inc/ Operating Rev (%) 25.8 24.2 25.5 22.8 23.8 23.6 22.8 28.1 31.4 Noninterest Exp/ AA (%) 2.9 3.1 3.1 3.0 2.9 3.1 3.1 2.6 2.8 Asset Quality (%) NPLs / Loans (%) 0.1 0.3 0.5 0.5 0.5 0.5 0.5 0.3 0.8 NPAs / Assets (%) 0.1 0.2 0.3 0.3 0.3 0.3 0.3 0.2 0.5 Texas Ratio (%) 1.1 2.1 3.6 3.9 2.9 3.9 3.2 2.4 4.9 Reserves / Loans (%) 1.32 1.37 1.25 1.25 1.28 1.25 1.28 1.28 1.41 NCOs / Avg Loans (%) (0.03) 0.05 0.04 - 0.06 (0.02) - - 0.01 42

Historical Consolidated Balance Sheet Source: S&P Global Market Intelligence; Company provided documents Note: This slide includes certain Unaudited Financial Information Year-Ended December 31, At September 30, (dollars shown in thousands) 2016 2017 2018 2019 2020 Assets Cash & Bal. Due from Dep. Inst. 45,632$ 53,073$ 41,365$ 41,053$ 44,326$ Fed Funds Sold & Reverse Repos – – – – – Cash and Cash Equivalents 45,632 53,073 41,365 41,053 44,326 Securities 313,483 325,455 306,347 322,096 373,408 Investment in Non-Consolidated Subs. - - - - - Gross Loans (HFI & HFS) 574,119 600,445 695,502 755,960 848,185 Loan Loss Reserve 7,562 8,240 8,666 9,447 11,996 Net Loans (HFI & HFS) 566,557 592,205 686,836 746,513 836,189 OREO - - - - - Intangible Assets - - - - - Servicing Rights 410 661 905 892 1,041 Premises & Fixed Assets 22,568 25,687 25,551 25,033 24,696 Other Assets 35,603 36,541 36,838 36,163 37,341 Total Assets 984,253 1,033,622 1,097,842 1,171,750 1,317,001 Liabilities Deposits 817,491$ 866,477$ 919,734$ 974,088$ 1,126,821$ Trust Preferred - - - - - Borrowings 69,586 65,850 73,256 78,072 61,510 Other Liabilites 2,237 1,536 2,050 2,902 3,362 Total Liabilities 889,314 933,863 995,040 1,055,062 1,191,693 Stockholders' Equity Common Equity 94,939 99,759 102,802 116,688 125,308 Total Stockholders' Equity 94,939 99,759 102,802 116,688 125,308 Total Liabilities and Stockholders' Equity 984,253$ 1,033,622$ 1,097,842$ 1,171,750$ 1,317,001$ 43
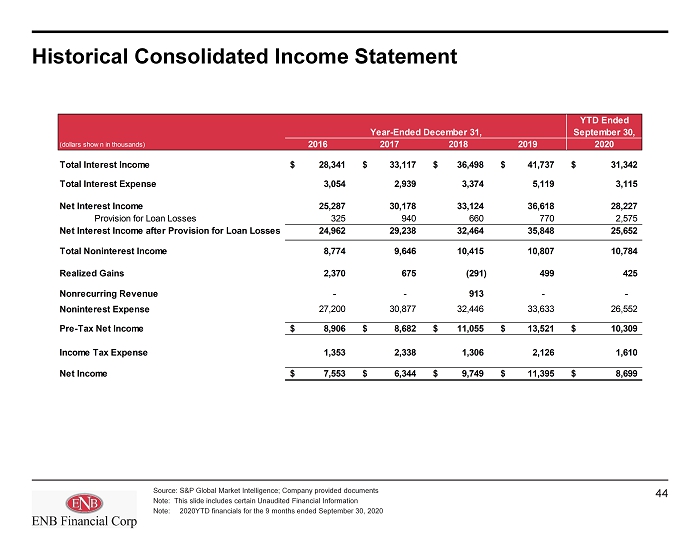
Historical Consolidated Income Statement Source : S&P Global Market Intelligence; Company provided documents Note: This slide includes certain Unaudited Financial Information Note : 2020YTD financials for the 9 months ended September 30, 2020 YTD Ended Year-Ended December 31, September 30, (dollars shown in thousands) 2016 2017 2018 2019 2020 Total Interest Income 28,341$ 33,117$ 36,498$ 41,737$ 31,342$ Total Interest Expense 3,054 2,939 3,374 5,119 3,115 Net Interest Income 25,287 30,178 33,124 36,618 28,227 Provision for Loan Losses 325 940 660 770 2,575 Net Interest Income after Provision for Loan Losses 24,962 29,238 32,464 35,848 25,652 Total Noninterest Income 8,774 9,646 10,415 10,807 10,784 Realized Gains 2,370 675 (291) 499 425 Nonrecurring Revenue - - 913 - - Noninterest Expense 27,200 30,877 32,446 33,633 26,552 Pre-Tax Net Income 8,906$ 8,682$ 11,055$ 13,521$ 10,309$ Income Tax Expense 1,353 2,338 1,306 2,126 1,610 Net Income 7,553$ 6,344$ 9,749$ 11,395$ 8,699$ 44