Attached files
| file | filename |
|---|---|
| 8-K - FORM 8-K - Apollo Medical Holdings, Inc. | tm2038253d1_8k.htm |
Exhibit 99.1

A Leader in Integrated Healthcare Management and Delivery Powered by Technology. Built by Doctors. For Patients. December 2020 NASDAQ: AMEH
Forward - Looking Statements This presentation contains forward - looking statements within the meaning of the Private Securities Litigation Reform Act of 1995 , Section 27A of the Securities Act and Section 21E of the Exchange Act. Forward - looking statements include any statements about the Company's bu siness, financial condition, operating results, plans, objectives, expectations and intentions, expansion plans, integration of acquired compan ies and any projections of earnings, revenue, EBITDA, Adjusted EBITDA or other financial items, such as the Company's projected capitation and future li qui dity, and may be identified by the use of forward - looking terms such as “anticipate,” “could,” “can,” “may,” “might,” “potential,” “predict,” “sh ould,” “estimate,” “expect,” “project,” “believe,” “plan,” “envision,” “intend,” “continue,” “target,” “seek,” “will,” “would,” and the negative of such t erm s, other variations on such terms or other similar or comparable words, phrases or terminology. Forward - looking statements reflect current views with respec t to future events and financial performance and therefore cannot be guaranteed. Such statements are based on the current expectations and certa in assumptions of the Company's management, and some or all of such expectations and assumptions may not materialize or may vary significantly from actual results. Actual results may also vary materially from forward - looking statements due to risks, uncertainties and other factors, known and unknown, including the risk factors described from time to time in the Company’s reports to the U.S. Securities and Exchange Commission (the “SE C”) , including without limitation the risk factors discussed in the Company's Annual Report on Form 10 - K filed with the SEC on March 16, 2020 and subse quent Quarterly Reports on Form 10 - Q. Because the factors referred to above could cause actual results or outcomes to differ materially from those expressed or imp lie d in any forward - looking statements, you should not place undue reliance on any such forward - looking statements. Any forward - looking statements s peak only as of the date of this presentation and, unless legally required, the Company does not undertake any obligation to update any forwa rd - looking statement, as a result of new information, future events or otherwise. 2 www.apollomed.net
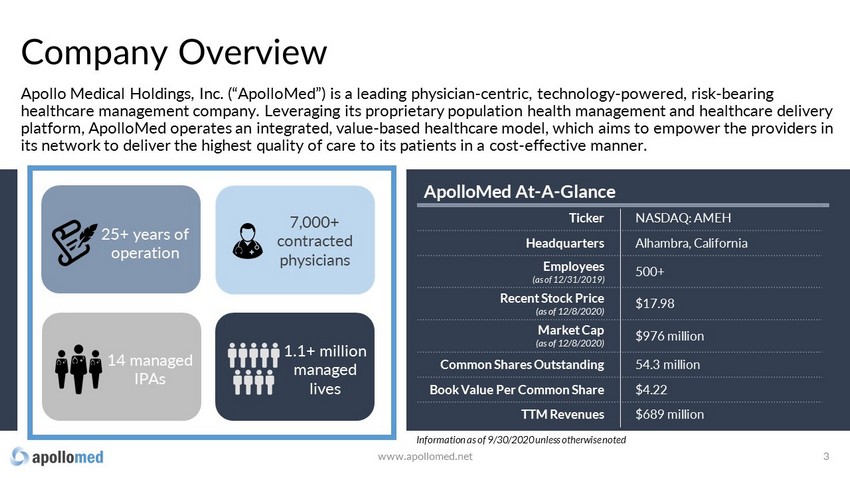
Company Overview Apollo Medical Holdings, Inc. (“ApolloMed”) is a leading physician-centric, technology-powered, risk-bearing healthcare management company. Leveraging its proprietary population health management and healthcare delivery platform, ApolloMed operates an integrated, value-based healthcare model, which aims to empower the providers in its network to deliver the highest quality of care to its patients in a cost-effective manner. 3 ApolloMed At-A-Glance Ticker NASDAQ: AMEH Headquarters Alhambra, California Employees (as of 12/31/2019) 500+ Recent Stock Price (as of 12/8/2020) $17.98 Market Cap (as of 12/8/2020) $976 million Common Shares Outstanding 54.3 million Book Value Per Common Share $4.22 TTM Revenues $689 million 7,000+ contracted physicians 14 managed IPAs 1.1+ million managed lives 25+ years of operation Information as of 9/30/2020 unless otherwise noted www.apollomed.net
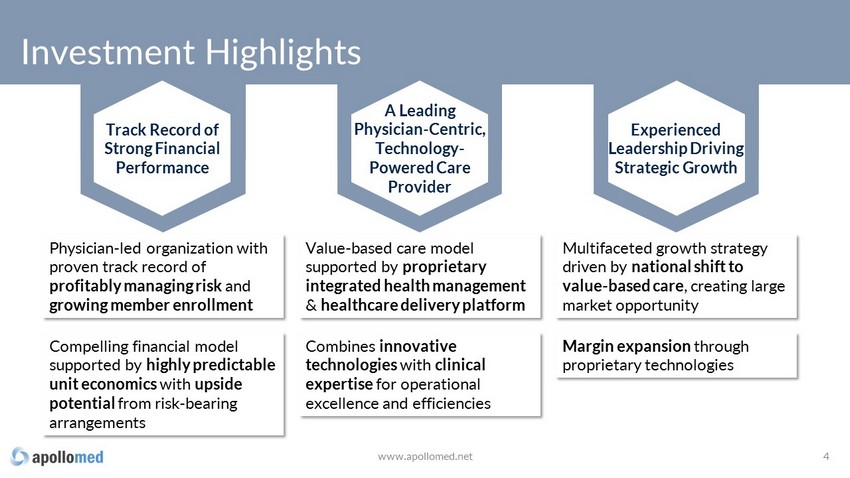
Investment Highlights Multifaceted growth strategy driven by national shift to value - based care , creating large market opportunity Margin expansion through proprietary technologies 4 www.apollomed.net Value - based care model supported by proprietary integrated health management & healthcare delivery platform Combines innovative technologies with clinical expertise for operational excellence and efficiencies Physician - led organization with proven track record of profitably managing risk and growing member enrollment Compelling financial model supported by highly predictable unit economics with upside potential from risk - bearing arrangements Track Record of Strong Financial Performance A Leading Physician - Centric, Technology - Powered Care Provider Experienced Leadership Driving Strategic Growth
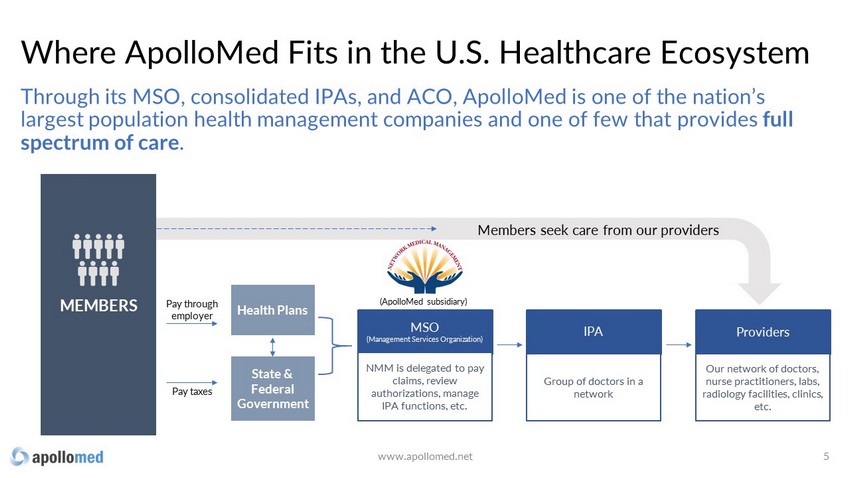
Where ApolloMed Fits in the U.S. Healthcare Ecosystem 5 Through its MSO, consolidated IPAs, and ACO, ApolloMed is one of the nation’s largest population health management companies and one of few that provides full spectrum of care . MEMBERS Health Plans State & Federal Government Pay taxes Pay through employer MSO (Management Services Organization) IPA Providers NMM is delegated to pay claims, review authorizations, manage IPA functions, etc. Group of doctors in a network Our network of doctors, nurse practitioners, labs, radiology facilities, clinics, etc. (ApolloMed subsidiary) Members seek care from our providers www.apollomed.net
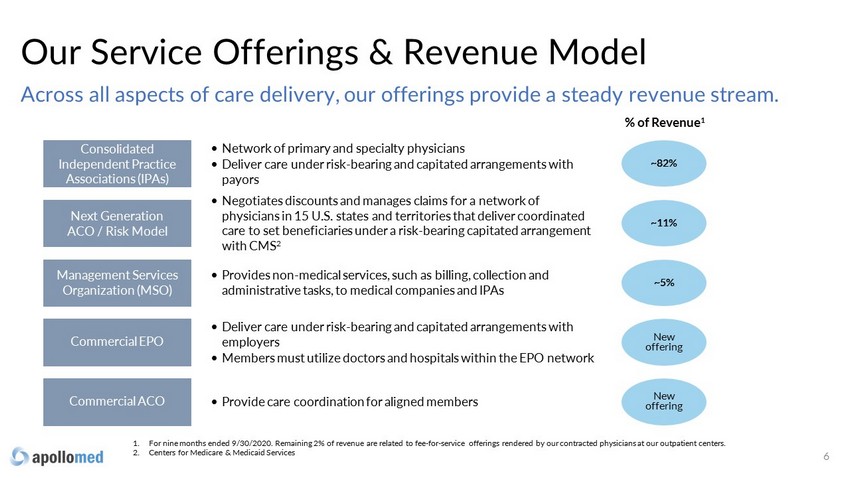
Across all aspects of care delivery, our offerings provide a steady revenue stream. Our Service Offerings & Revenue Model 6 Consolidated Independent Practice Associations (IPAs) Next Generation ACO / Risk Model Management Services Organization (MSO) Commercial EPO Commercial ACO • Network of primary and specialty physicians • Deliver care under risk - bearing and capitated arrangements with payors • Negotiates discounts and manages claims for a network of physicians in 15 U.S. states and territories that deliver coordinated care to set beneficiaries under a risk - bearing capitated arrangement with CMS 2 • Provides non - medical services, such as billing, collection and administrative tasks, to medical companies and IPAs • Deliver care under risk - bearing and capitated arrangements with employers • Members must utilize doctors and hospitals within the EPO network • Provide care coordination for aligned members ~82% ~11% ~5% New offering New offering % of Revenue 1 1. For nine months ended 9/30/2020. Remaining 2% of revenue are related to fee - for - service offerings rendered by our contracted phy sicians at our outpatient centers. 2. Centers for Medicare & Medicaid Services
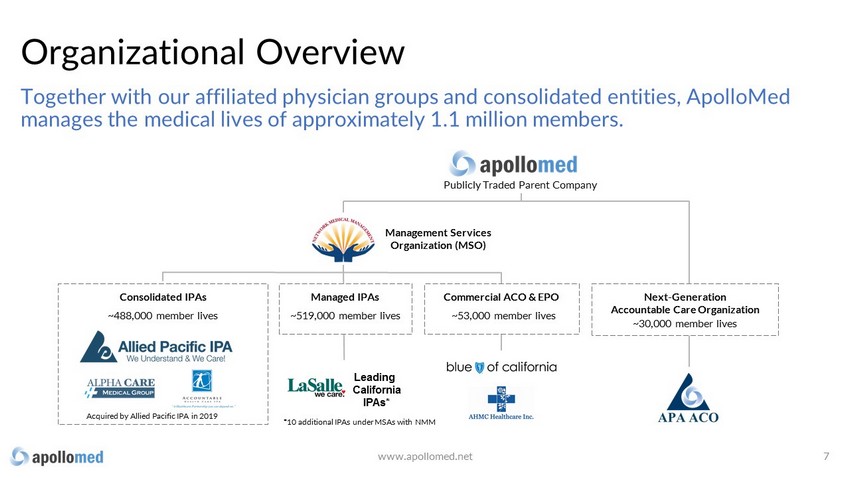
Together with our affiliated physician groups and consolidated entities, ApolloMed manages the medical lives of approximately 1.1 million members. Consolidated IPAs ~ 488 ,000 member lives Publicly Traded Parent Company M anagement S ervices O rganization (MSO) Leading California IPAs * Managed IPAs ~5 19 ,000 member lives Next - Generation Accountable Care Organization ~ 30 ,000 member lives Commercial ACO & EPO ~ 53,000 member lives Acquired by Allied Pacific IPA in 2019 *10 additional IPAs under MSAs with NMM Organizational Overview 7 www.apollomed.net
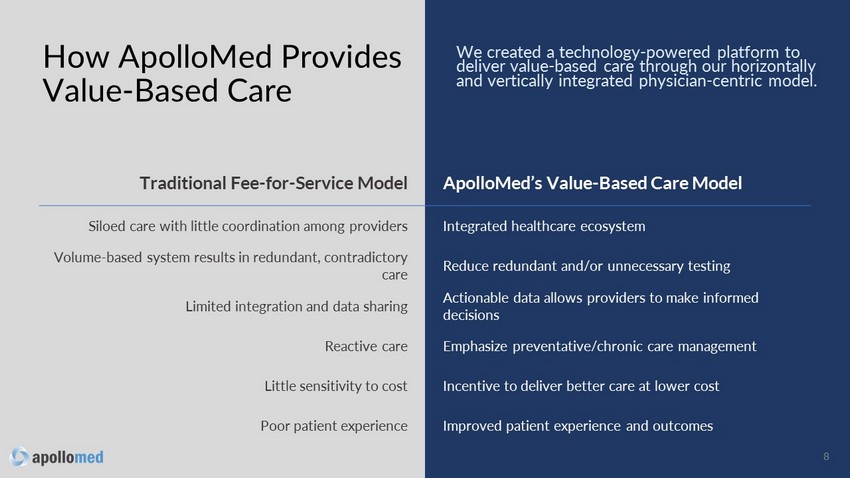
We created a technology - powered platform to deliver value - based care through our horizontally and vertically integrated physician - centric model. How ApolloMed Provides Value - Based Care 8 Traditional Fee - for - Service Model ApolloMed’s Value - Based Care Model Siloed care with little coordination among providers Integrated healthcare ecosystem Volume - based system results in redundant, contradictory care Reduce redundant and/or unnecessary testing Limited integration and data sharing Actionable data allows providers to make informed decisions Reactive care Emphasize preventative/chronic care management Little sensitivity to cost Incentive to deliver better care at lower cost Poor patient experience Improved patient experience and outcomes
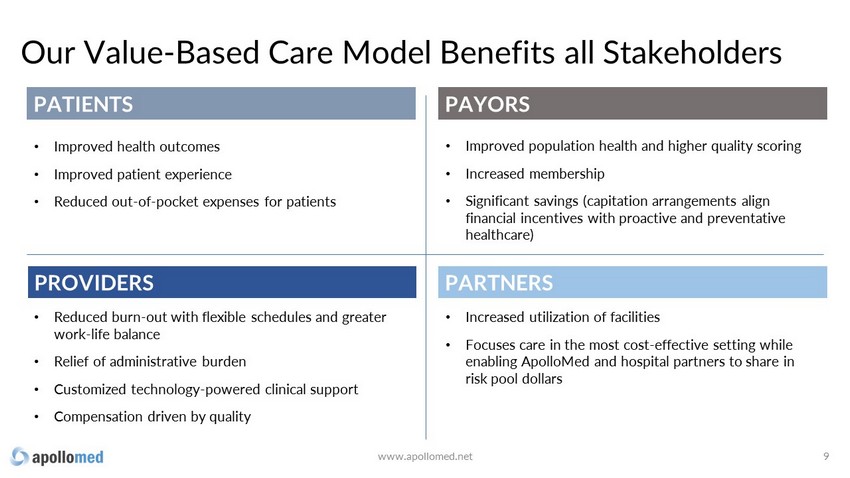
Our Value - Based Care Model Benefits all Stakeholders 9 • Improved health outcomes • Improved patient experience • Reduced out - of - pocket expenses for patients • Reduced burn - out with flexible schedules and greater work - life balance • Relief of administrative burden • Customized technology - powered clinical support • Compensation driven by quality • Increased utilization of facilities • Focuses care in the most cost - effective setting while enabling ApolloMed and hospital partners to share in risk pool dollars PATIENTS PAYORS PROVIDERS PARTNERS • Improved population health and higher quality scoring • Increased membership • Significant savings (capitation arrangements align financial incentives with proactive and preventative healthcare) www.apollomed.net
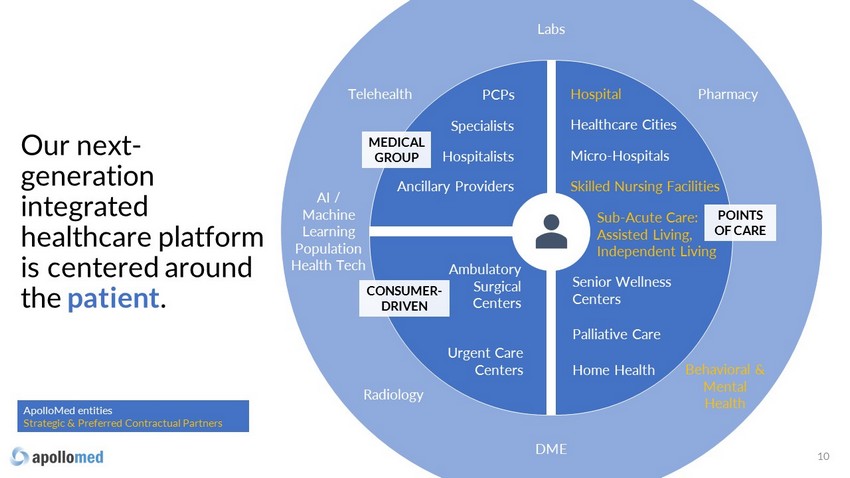
Our next - generation integrated healthcare platform is centered around the patient . 10 Hospital Healthcare Cities Micro - Hospitals Skilled Nursing Facilities Sub - Acute Care: Assisted Living, Independent Living Senior Wellness Centers Palliative Care Home Health PCPs Specialists Hospitalists Ancillary Providers Ambulatory Surgical Centers Urgent Care Centers ApolloMed entities Strategic & Preferred Contractual Partners Labs Radiology Pharmacy DME MEDICAL GROUP CONSUMER - DRIVEN POINTS OF CARE Behavioral & Mental Health Telehealth AI / Machine Learning Population Health Tech
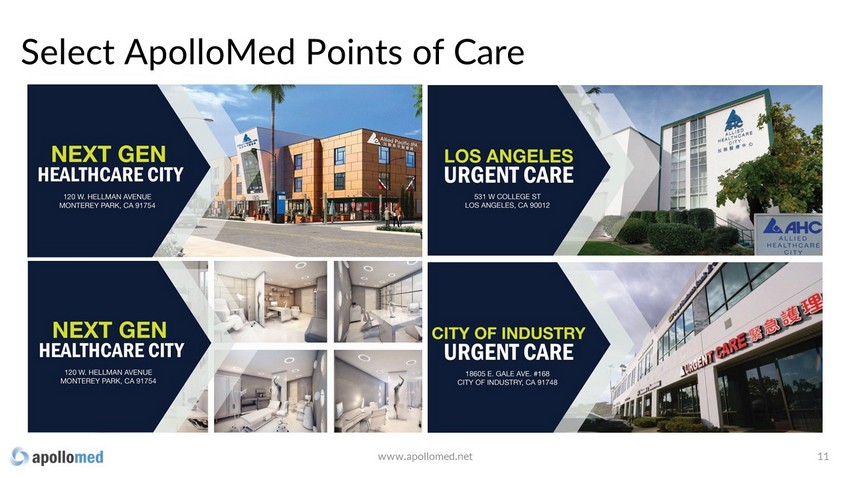
Select ApolloMed Points of Care 11 www.apollomed.net
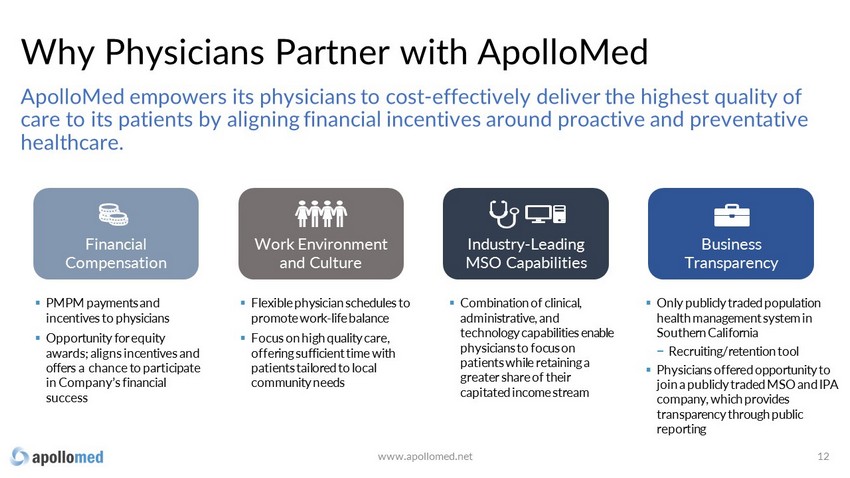
Business Transparency ApolloMed empowers its physicians to cost - effectively deliver the highest quality of care to its patients by aligning financial incentives around proactive and preventative healthcare. Why Physicians Partner with ApolloMed 12 ▪ Combination of clinical, administrative, and technology capabilities enable physicians to focus on patients while retaining a greater share of their capitated income stream ▪ Flexible physician schedules to promote work - life balance ▪ Focus on high quality care, offering sufficient time with patients tailored to local community needs ▪ PMPM payments and incentives to physicians ▪ Opportunity for equity awards; aligns incentives and offers a chance to participate in Company’s financial success ▪ Only publicly traded population health management system in Southern California − Recruiting/retention tool ▪ Physicians offered opportunity to join a publicly traded MSO and IPA company, which provides transparency through public reporting Financial Compensation Work Environment and Culture Industry - Leading MSO Capabilities www.apollomed.net
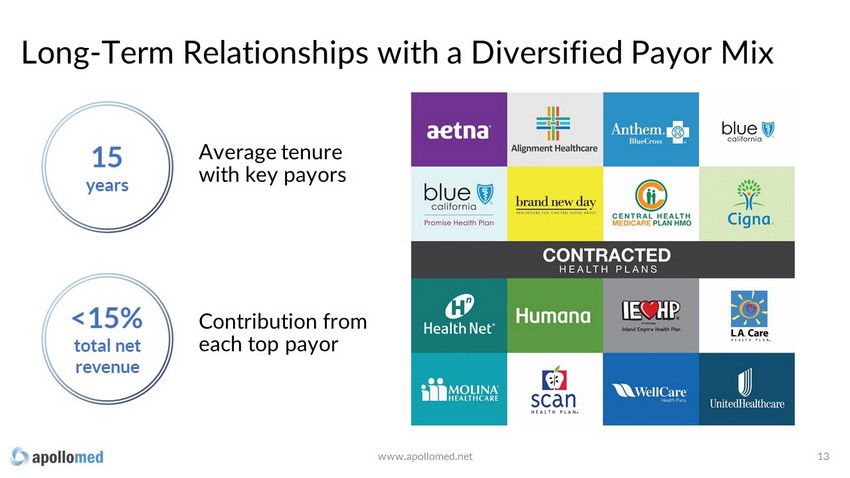
Long - Term Relationships with a Diversified Payor Mix Average tenure with key payors 13 15 years Contribution from each top payor <15% total net revenue www.apollomed.net
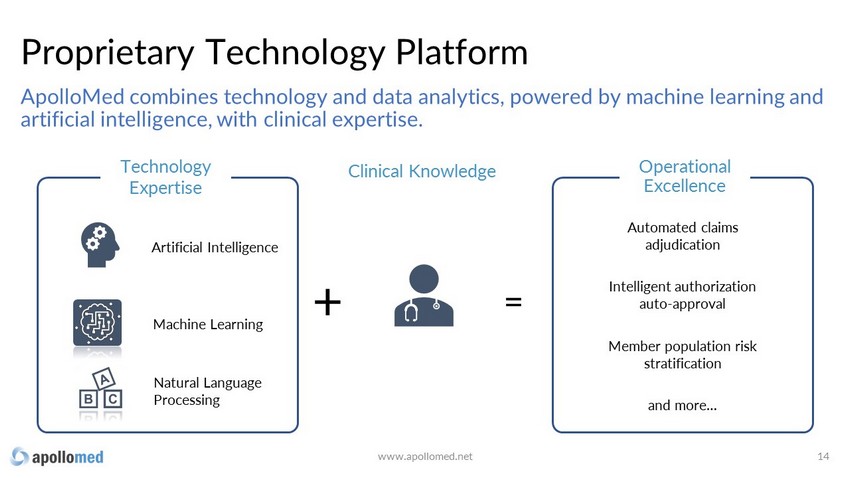
Proprietary Technology Platform 14 ApolloMed combines technology and data analytics, powered by machine learning and artificial intelligence, with clinical expertise. Technology Expertise + = Operational Excellence Clinical Knowledge Artificial Intelligence Machine Learning Natural Language Processing Automated claims adjudication Intelligent authorization auto - approval Member population risk stratification and more… www.apollomed.net
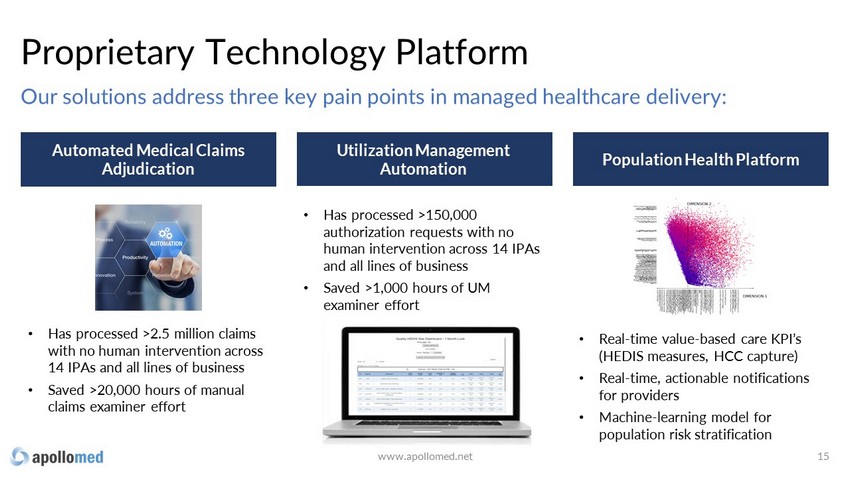
Proprietary Technology Platform 15 Our solutions address three key pain points in managed healthcare delivery: Automated Medical Claims Adjudication Utilization Management Automation Population Health Platform • Has processed >2.5 million claims with no human intervention across 14 IPAs and all lines of business • Saved >20,000 hours of manual claims examiner effort • Has processed >150,000 authorization requests with no human intervention across 14 IPAs and all lines of business • Saved >1,000 hours of UM examiner effort • Real - time value - based care KPI’s (HEDIS measures, HCC capture) • Real - time, actionable notifications for providers • Machine - learning model for population risk stratification www.apollomed.net

The Market Opportunity ApolloMed is at the intersection of provider services and healthcare technology. 16 www.apollomed.net
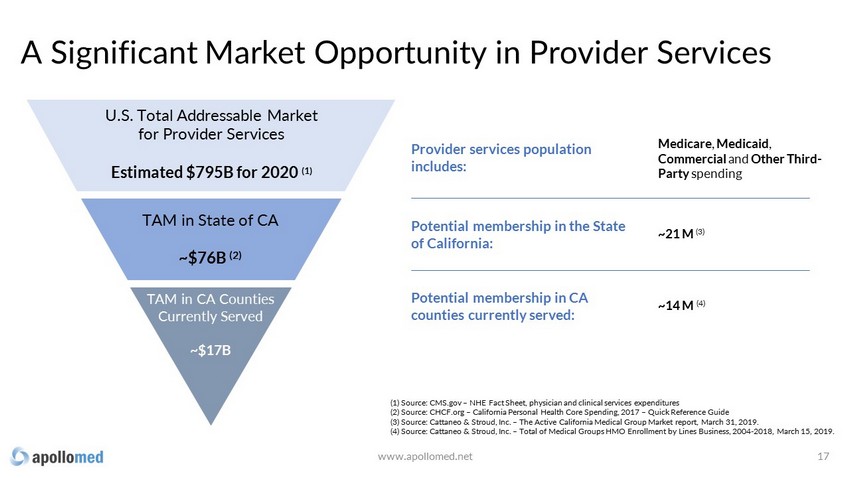
A Significant Market Opportunity in Provider Services 17 Provider services p opulation includes: (1) Source: CMS.gov – NHE Fact Sheet, physician and clinical services expenditures (2) Source: CHCF.org – California Personal Health Core Spending, 2017 – Quick Reference Guide (3) Source: Cattaneo & Stroud, Inc. – The Active California Medical Group Market report, March 31, 2019. (4) Source: Cattaneo & Stroud, Inc. – Total of Medical Groups HMO Enrollment by Lines Business, 2004 - 2018, March 15, 2019. U.S. Total Addressable Market for Provider Services Estimated $795B for 2020 (1) TAM in State of CA ~$76B (2) TAM in CA Counties Currently Served ~$17B Medicare , Medicaid , Commercial and Other Third - Party spending Potential membership in the State of California: Potential membership in CA counties currently served : ~21 M (3) ~14 M (4) www.apollomed.net
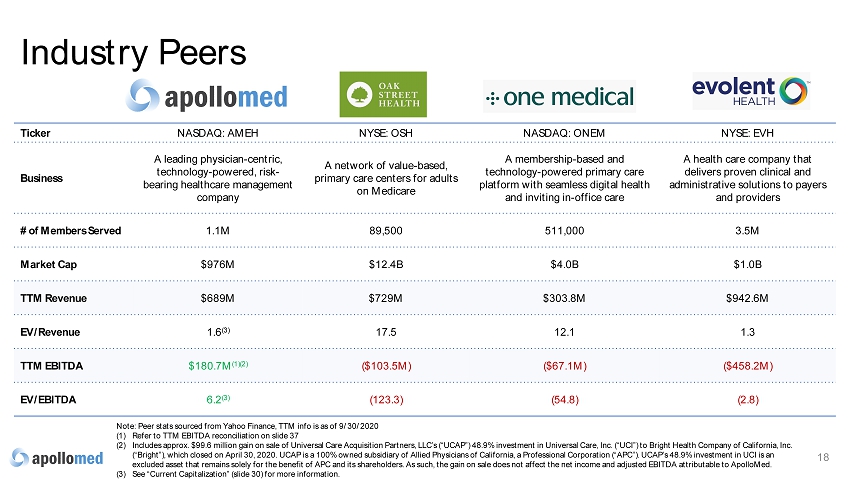
Ticker NASDAQ: AMEH NYSE: OSH NASDAQ: ONEM NYSE: EVH Business A leading physician - centric, technology - powered, risk - bearing healthcare management company A network of value - based, primary care centers for adults on Medicare A membership - based and technology - powered primary care platform with seamless digital health and inviting in - office care A health care company that delivers proven clinical and administrative solutions to payers and providers # of Members Served 1.1M 89,500 511,000 3.5M Market Cap $976M $12.4B $4.0B $1.0B TTM Revenue $689M $729M $303.8M $942.6M EV/Revenue 1.6 (3) 17.5 12.1 1.3 TTM EBITDA $180.7M (1)(2) ($103.5M) ($67.1M) ($458.2M) EV/EBITDA 6.2 (3) (123.3) (54.8) (2.8) Industry Peers 18 Note: Peer stats sourced from Yahoo Finance, TTM info is as of 9/30/2020 (1) Refer to TTM EBITDA reconciliation on slide 37 (2) Includes approx. $99.6 million gain on sale of Universal Care Acquisition Partners, LLC’s (“UCAP”) 48.9% investment in Univer sal Care, Inc. (“UCI”) to Bright Health Company of California, Inc. (“Bright”), which closed on April 30, 2020. UCAP is a 100% owned subsidiary of Allied Physicians of California, a Professiona l C orporation (“APC”). UCAP’s 48.9% investment in UCI is an excluded asset that remains solely for the benefit of APC and its shareholders. As such, the gain on sale does not affect the ne t income and adjusted EBITDA attributable to ApolloMed. (3) See “Current Capitalization” (slide 30) for more information.
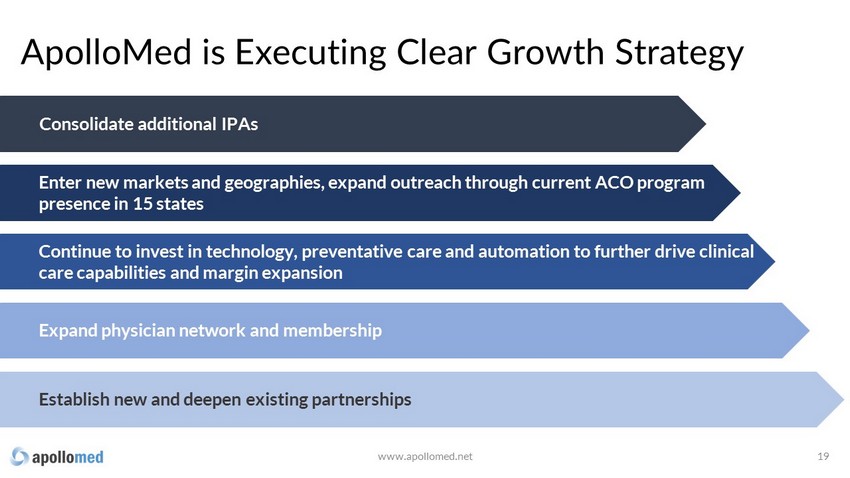
ApolloMed is Executing Clear Growth Strategy 19 www.apollomed.net Consolidate additional IPAs Enter new markets and geographies, expand outreach through current ACO program presence in 15 states Continue to invest in technology, preventative care and automation to further drive clinical care capabilities and margin expansion Expand physician network and membership Establish new and deepen existing partnerships
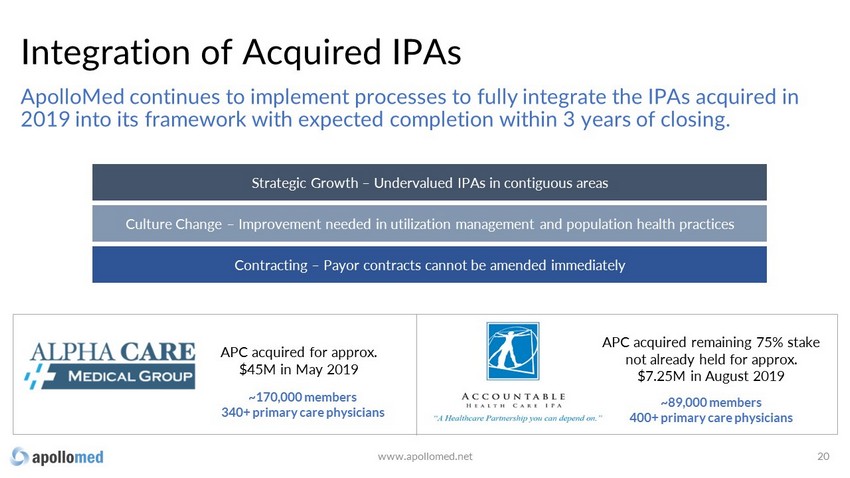
Integration of Acquired IPAs 20 APC acquired for approx. $45M in May 2019 APC acquired remaining 75% stake not already held for approx. $7.25M in August 2019 ApolloMed continues to implement processes to fully integrate the IPAs acquired in 2019 into its framework with expected completion within 3 years of closing. ~170,000 members 340+ primary care physicians ~89,000 members 400+ primary care physicians Strategic Growth – Undervalued IPAs in contiguous areas Culture Change – Improvement needed in utilization management and population health practices Contracting – Payor contracts cannot be amended immediately www.apollomed.net
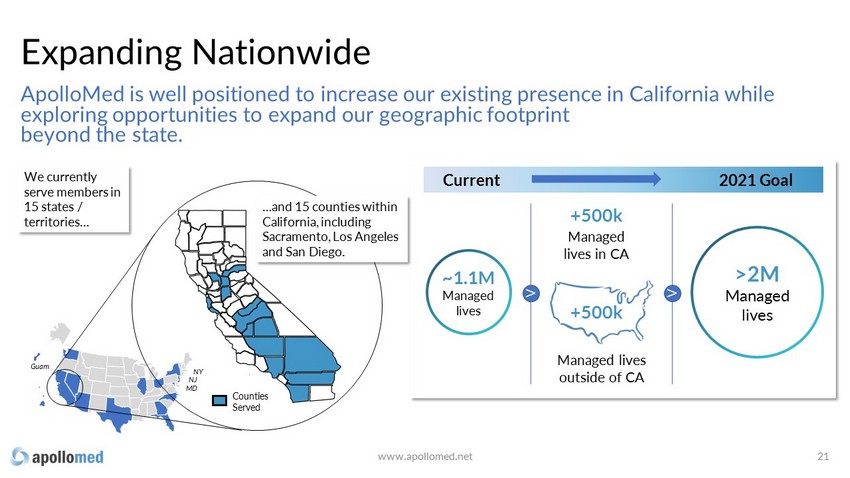
Expanding Nationwide 21 ApolloMed is well positioned to increase our existing presence in California while exploring opportunities to expand our geographic footprint beyond the state. Counties Served We currently serve members in 15 states / territories… Current 2021 Goal ~1.1M Managed lives +500k >2M Managed lives +500k Managed lives in CA Managed lives outside of CA V V Guam NY NJ MD …and 15 counties within California, including Sacramento, Los Angeles and San Diego. www.apollomed.net
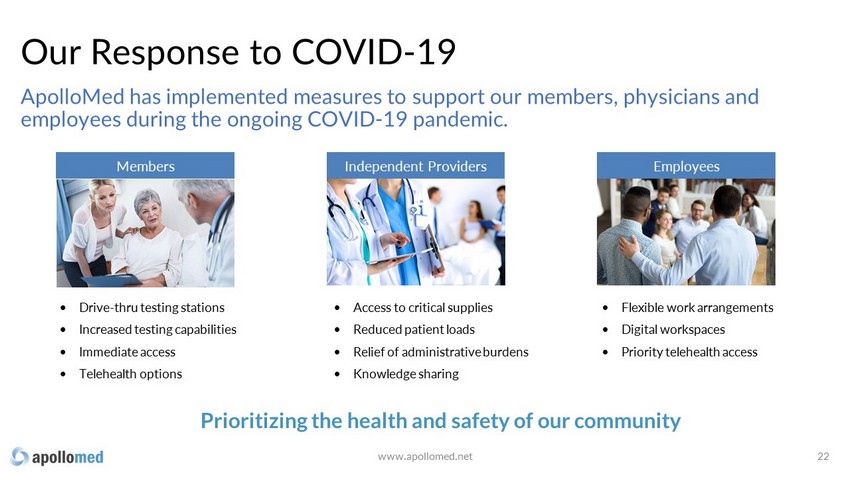
ApolloMed has implemented measures to support our members, physicians and employees during the ongoing COVID - 19 pandemic. Our Response to COVID - 19 22 Members Independent Providers Employees • Drive - t hru t esting s tations • Increased testing capabilities • Immediate access • Telehealth options • Access to critical supplies • Reduced patient loads • Relief of administrative burden s • Knowledge sharing • Flexible work arrangements • Digital workspaces • Priority telehealth access Prioritizing the health and safety of our community www.apollomed.net
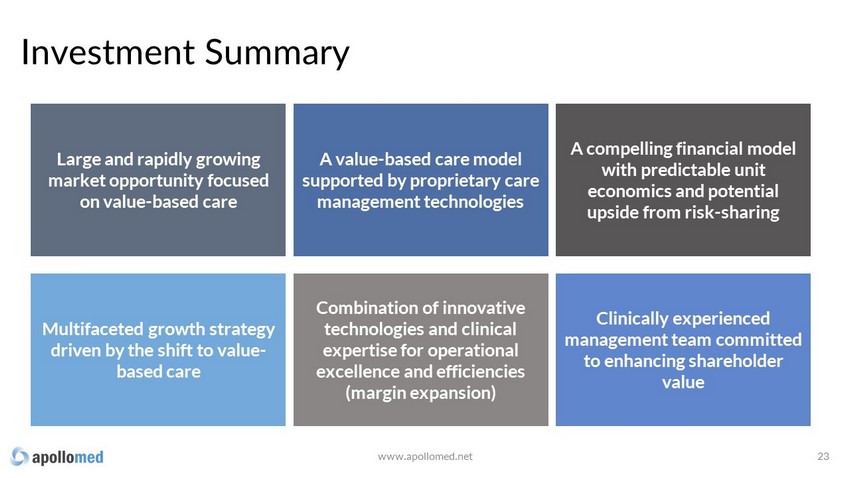
Investment Summary 23 Large and rapidly growing market opportunity focused on value - based care A value - based care model supported by proprietary care management technologies A compelling financial model with predictable unit economics and potential upside from risk - sharing Multifaceted growth strategy driven by the shift to value - based care Clinically experienced management team committed to enhancing shareholder value Combination of innovative technologies and clinical expertise for operational excellence and efficiencies (margin expansion) www.apollomed.net

Financial Overview A History of Profitable Growth 24 www.apollomed.net
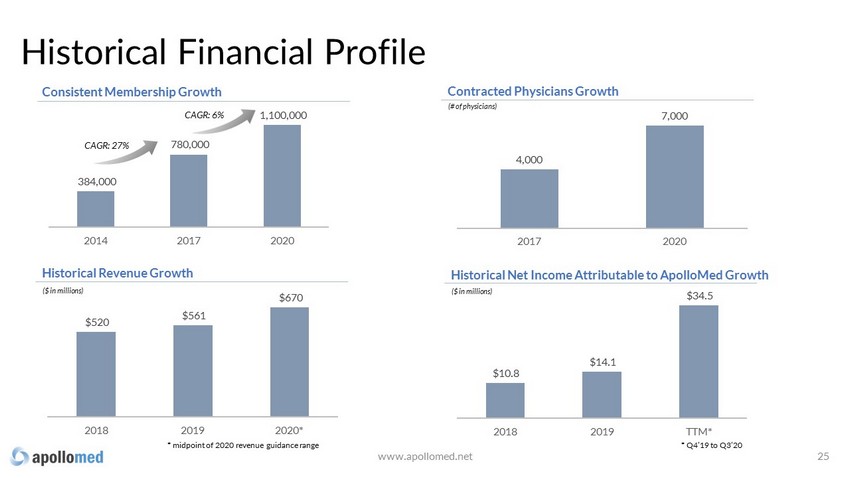
4,000 7,000 2017 2020 384,000 780,000 1,100,000 2014 2017 2020 CAGR: 27% $520 $561 $670 2018 2019 2020* Historical Financial Profile 25 Historical Revenue Growth Consistent Membership Growth Contracted Physicians Growth ($ in millions) (# of physicians) CAGR: 6% * midpoint of 2020 revenue guidance range $10.8 $14.1 $34.5 2018 2019 TTM* Historical Net Income Attributable to ApolloMed Growth ($ in millions) * Q4’19 to Q3’20 www.apollomed.net
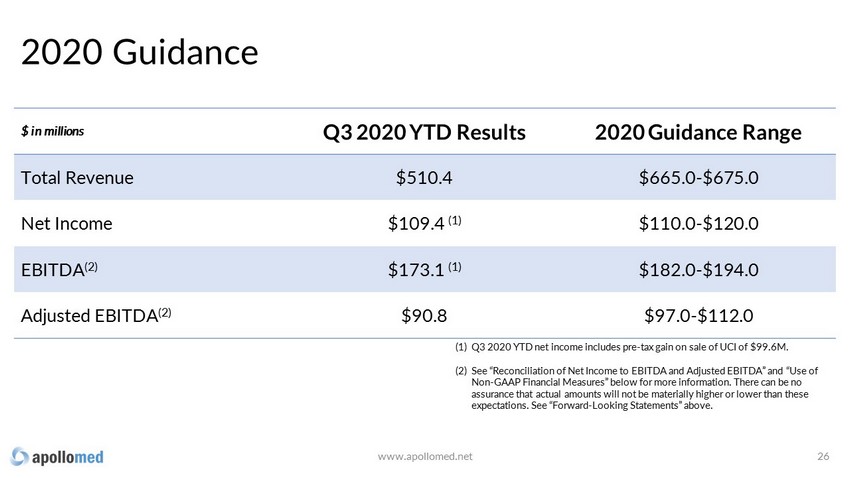
2020 Guidance $ in millions Q3 2020 YTD Results 2020 Guidance Range Total Revenue $510.4 $665.0 - $675.0 Net Income $109.4 (1) $110.0 - $120.0 EBITDA (2) $173.1 (1) $182.0 - $194.0 Adjusted EBITDA (2) $90.8 $97.0 - $112.0 26 (1) Q3 2020 YTD net income includes pre - tax gain on sale of UCI of $99.6M. (2) See “Reconciliation of Net Income to EBITDA and Adjusted EBITDA” and “Use of Non - GAAP Financial Measures” below for more information. There can be no assurance that actual amounts will not be materially higher or lower than these expectations. See “Forward - Looking Statements” above. www.apollomed.net
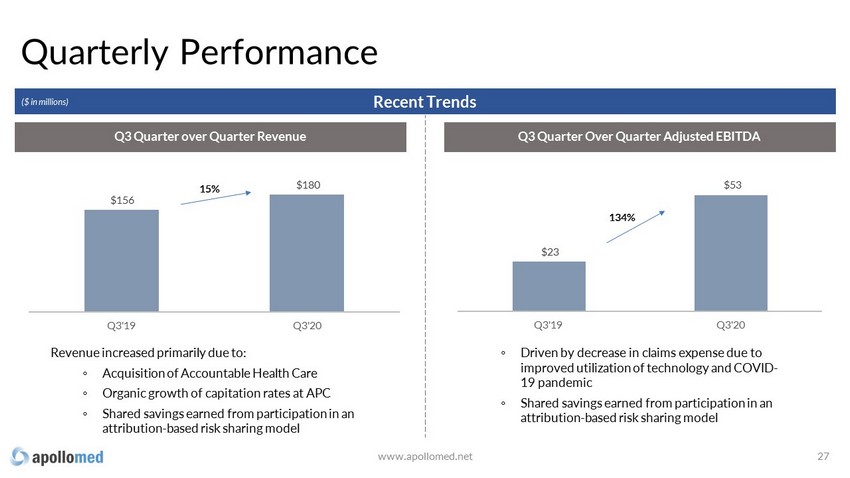
$23 $53 Q3'19 Q3'20 $156 $180 Q3'19 Q3'20 Quarterly Performance 27 Q3 Quarter over Quarter Revenue Q3 Quarter Over Quarter Adjusted EBITDA 15% 1 34% R evenue increased primarily due to : ◦ A cquisition of Accountable Health Car e ◦ Organic growth of capitation rates at APC ◦ Shared savings earned from participation in an attribution - based risk sharing model ◦ Driven by decrease in claims expense due to improved utilization of technology and COVID - 19 pandemic ◦ Shared savings earned from participation in an attribution - based risk sharing model Recent Trends ($ in millions) www.apollomed.net
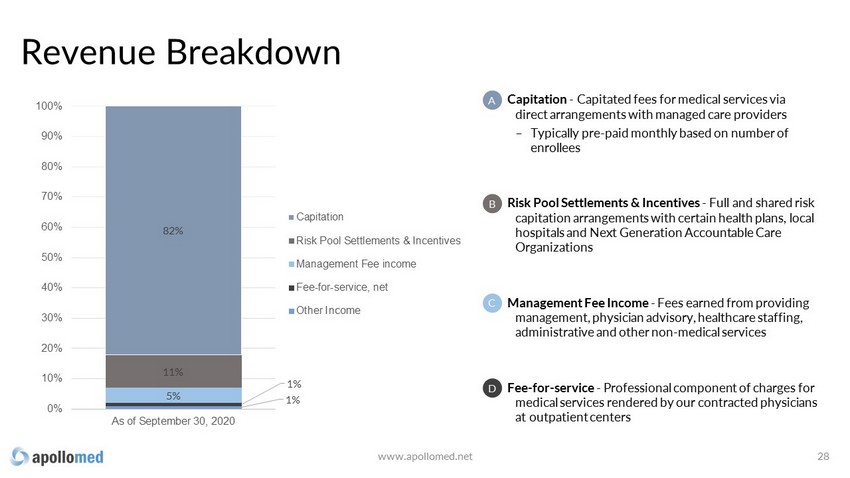
Capitation - Capitated fees for medical services via direct arrangements with managed care providers – Typically pre - paid monthly based on number of enrollees Risk Pool Settlements & Incentives - Full and shared risk capitation arrangements with certain health plans , local hospitals and Next Generation Accountable Care Organizations Management Fee Income - Fees earned from providing management, physician advisory, healthcare staffing, admin istrative and other non - medical services Fee - for - service - Professional component of charges for medical services rendered by our contracted physicians at outpatient centers 1% 1% 5% 11% 82% 0% 10% 20% 30% 40% 50% 60% 70% 80% 90% 100% As of September 30, 2020 Capitation Risk Pool Settlements & Incentives Management Fee income Fee-for-service, net Other Income Revenue Breakdown 28 A B C D www.apollomed.net
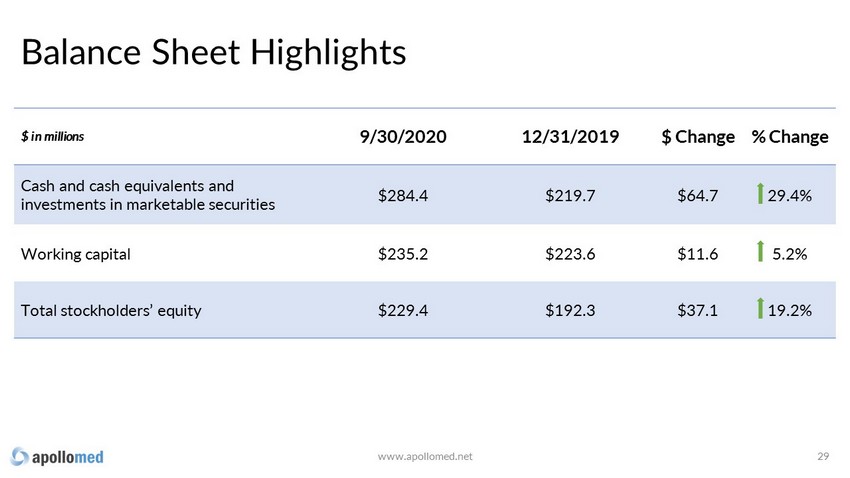
Balance Sheet Highlights 29 $ in millions 9/30/2020 12/31/2019 $ Change % Change Cash and cash equivalents and investments in marketable securities $284.4 $219.7 $64.7 29.4% Working capital $235.2 $223.6 $11.6 5.2% Total stockholders’ equity $229.4 $192.3 $37.1 19.2% www.apollomed.net
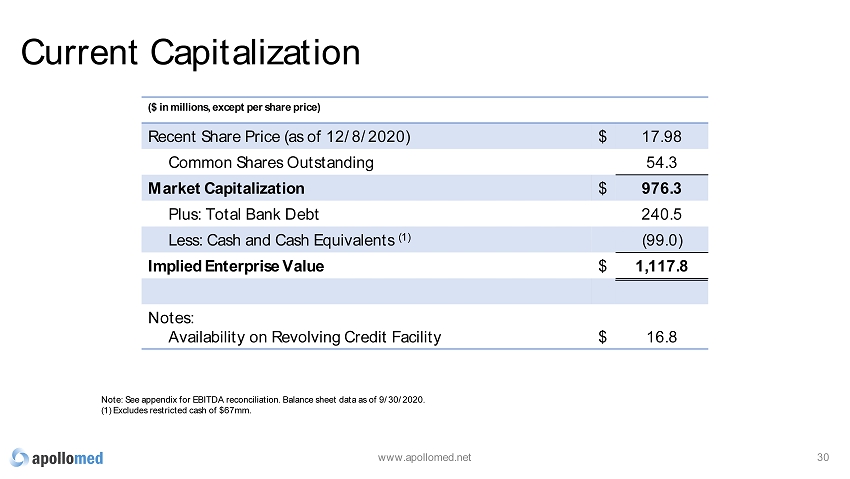
Current Capitalization 30 ($ millions, except for per share price) Note: See appendix for EBITDA reconciliation. Balance sheet data as of 9/30/2020. (1) Excludes restricted cash of $67mm. www.apollomed.net ($ in millions, except per share price) Recent Share Price (as of 12/8/2020) $ 17.98 Common Shares Outstanding 54.3 Market Capitalization $ 976.3 Plus: Total Bank Debt 240.5 Less: Cash and Cash Equivalents (1) (99.0) Implied Enterprise Value $ 1,117.8 Notes: Availability on Revolving Credit Facility $ 16.8
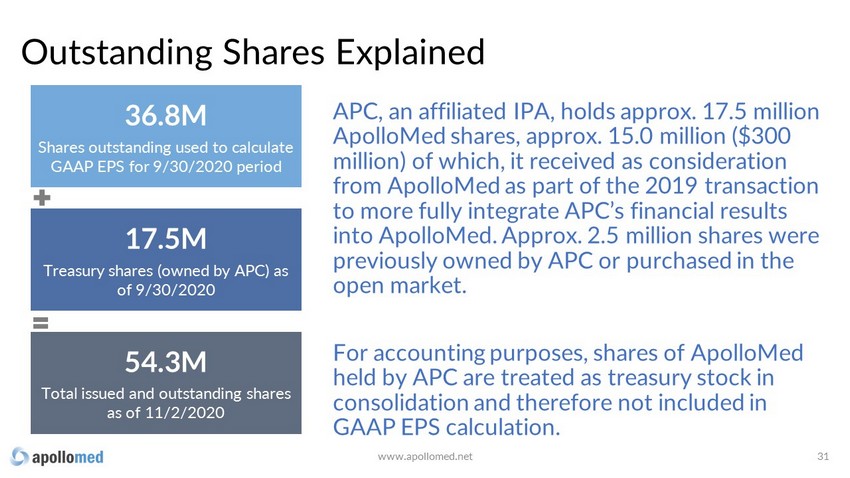
Outstanding Shares Explained www.apollomed.net 1 APC, an affiliated IPA, holds approx. 17.5 million ApolloMed shares, approx. 15.0 million ($300 million) of which, it received as consideration from ApolloMed as part of the 2019 transaction to more fully integrate APC’s financial results into ApolloMed. Approx. 2.5 million shares were previously owned by APC or purchased in the open market. For accounting purposes, shares of ApolloMed held by APC are treated as treasury stock in consolidation and therefore not included in GAAP EPS calculation. 54.3M Total issued and outstanding shares as of 11/2/2020 36.8M Shares outstanding used to calculate GAAP EPS for 9/30/2020 period 17.5M Treasury shares (owned by APC) as of 9/30/2020
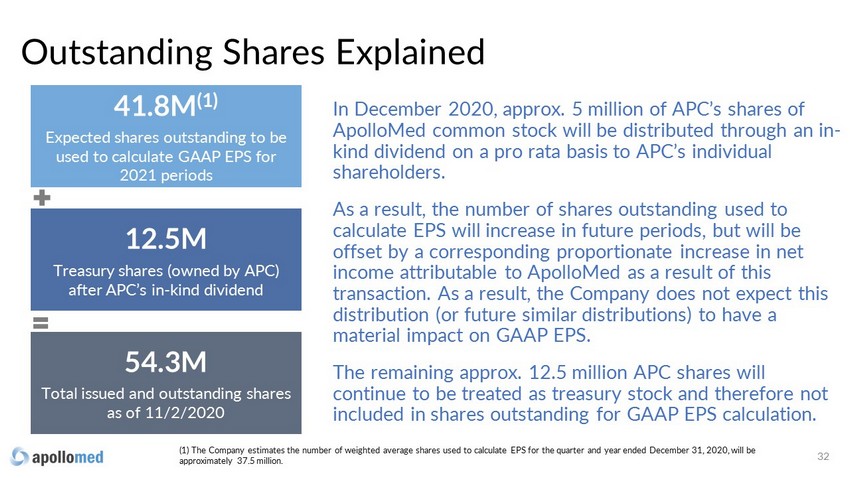
(1) The Company estimates the number of weighted average shares used to calculate EPS for the quarter and year ended December 31 , 2020, will be approximately 37.5 million. Outstanding Shares Explained 2 In December 2020, approx. 5 million of APC’s shares of ApolloMed common stock will be distributed through an in - kind dividend on a pro rata basis to APC’s individual shareholders. As a result, the number of shares outstanding used to calculate EPS will increase in future periods, but will be offset by a corresponding proportionate increase in net income attributable to ApolloMed as a result of this transaction. As a result, the Company does not expect this distribution (or future similar distributions) to have a material impact on GAAP EPS. The remaining approx. 12.5 million APC shares will continue to be treated as treasury stock and therefore not included in shares outstanding for GAAP EPS calculation. 54.3M Total issued and outstanding shares as of 11/2/2020 41.8M (1 ) Expected shares outstanding to be used to calculate GAAP EPS for 2021 periods 12.5M Treasury shares (owned by APC) after APC’s in - kind dividend

Appendix 33 www.apollomed.net
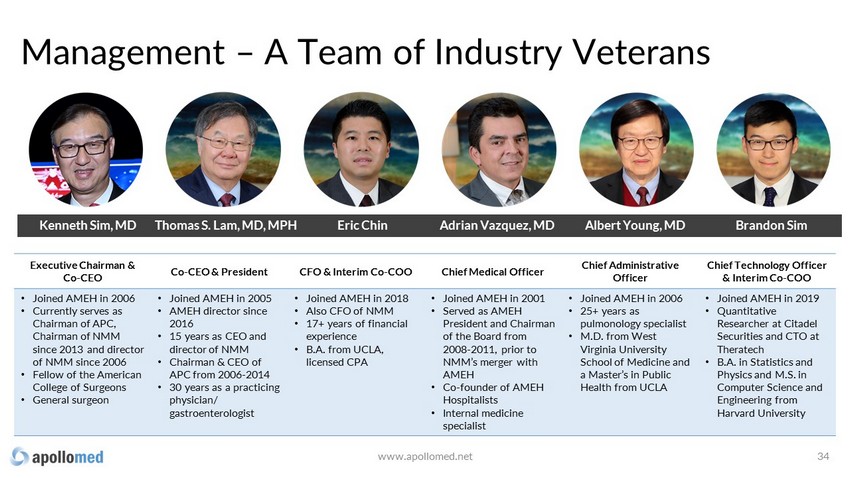
Management – A Team of Industry Veterans 34 Executive Chairman & Co - CEO Co - CEO & President CFO & Interim Co - COO Chief Medical Officer Chief Administrative Officer Chief Technology Officer & Interim Co - COO • Joined AMEH in 2006 • Currently serves as Chairman of APC, Chairman of NMM since 2013 and director of NMM since 2006 • Fellow of the American College of Surgeons • General surgeon • Joined AMEH in 2005 • AMEH director since 2016 • 15 years as CEO and director of NMM • Chairman & CEO of APC from 2006 - 2014 • 30 years as a practicing physician/ gastroenterologist • Joined AMEH in 2018 • Also CFO of NMM • 17+ years of financial experience • B.A. from UCLA, licensed CPA • Joined AMEH in 2001 • Served as AMEH President and Chairman of the Board from 2008 - 2011, prior to NMM’s merger with AMEH • Co - founder of AMEH Hospitalists • Internal medicine specialist • Joined AMEH in 2006 • 25+ years as pulmonology specialist • M.D. from West Virginia University School of Medicine and a Master’s in Public Health from UCLA • Joined AMEH in 2019 • Quantitative Researcher at Citadel Securities and CTO at Theratech • B.A. in Statistics and Physics and M.S. in Computer Science and Engineering from Harvard University Kenneth Sim, MD Eric Chin Adrian Vazquez, MD Albert Young, MD Brandon Sim Thomas S. Lam, MD, MPH www.apollomed.net
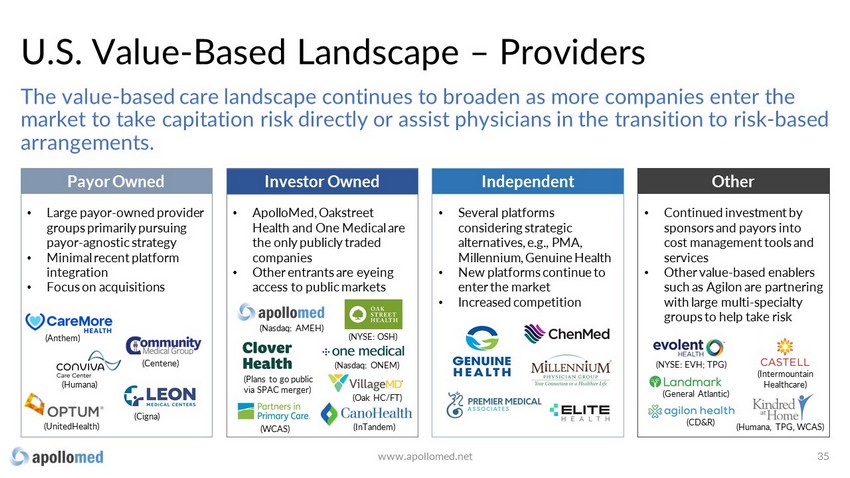
(Intermountain Healthcare) U.S. Value - Based Landscape – Providers 35 The value - based care landscape continues to broaden as more companies enter the market to take capitation risk directly or assist physicians in the transition to risk - based arrangements. Payor Owned Independent Other • Large payor - owned provider groups primarily pursuing payor - agnostic strategy • Minimal recent platform integration • Focus on acquisitions • ApolloMed, Oakstreet Health and One Medical are the only publicly traded companies • Other entrants are eyeing access to public markets • Several platforms considering strategic alternatives, e.g., PMA, Millennium, Genuine Health • New platforms continue to enter the market • Increased competition • Continued investment by sponsors and payors into cost management tools and services • Other value - based enablers such as Agilon are partnering with large multi - specialty groups to help take risk (UnitedHealth) (Cigna) (Humana) (Anthem) (Centene) (Nasdaq: AMEH) (NYSE: OSH) (Oak HC/FT) (WCAS) (InTandem) (Nasdaq: ONEM) (General Atlantic) (NYSE: EVH; TPG) (Humana, TPG, WCAS) (CD&R) Investor Owned (Plans to go public via SPAC merger) www.apollomed.net
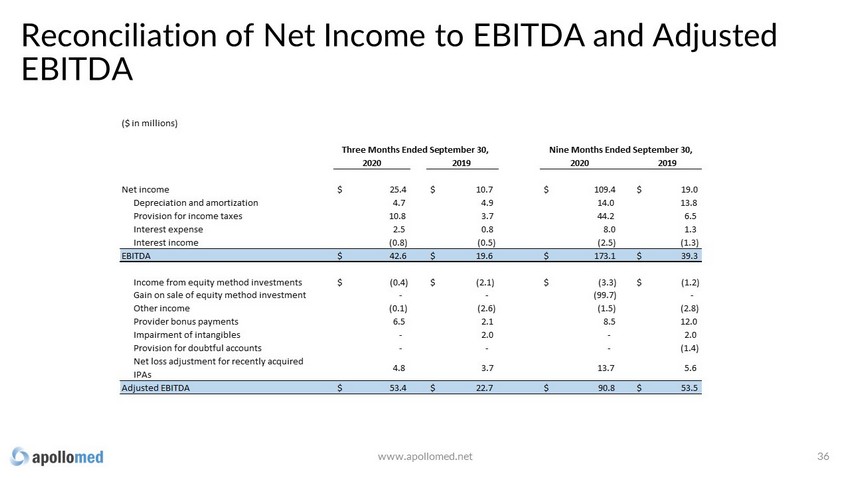
Reconciliation of Net Income to EBITDA and Adjusted EBITDA 36 2020 2019 2020 2019 Net income $ 25.4 $ 10.7 $ 109.4 $ 19.0 Depreciation and amortization 4.7 4.9 14.0 13.8 Provision for income taxes 10.8 3.7 44.2 6.5 Interest expense 2.5 0.8 8.0 1.3 Interest income (0.8) (0.5) (2.5) (1.3) EBITDA $ 42.6 $ 19.6 $ 173.1 $ 39.3 Income from equity method investments $ (0.4) $ (2.1) $ (3.3) $ (1.2) Gain on sale of equity method investment - - (99.7) - Other income (0.1) (2.6) (1.5) (2.8) Provider bonus payments 6.5 2.1 8.5 12.0 Impairment of intangibles - 2.0 - 2.0 Provision for doubtful accounts - - - (1.4) Net loss adjustment for recently acquired IPAs 4.8 3.7 13.7 5.6 Adjusted EBITDA $ 53.4 $ 22.7 $ 90.8 $ 53.5 ($ in millions) Three Months Ended September 30, Nine Months Ended September 30, www.apollomed.net
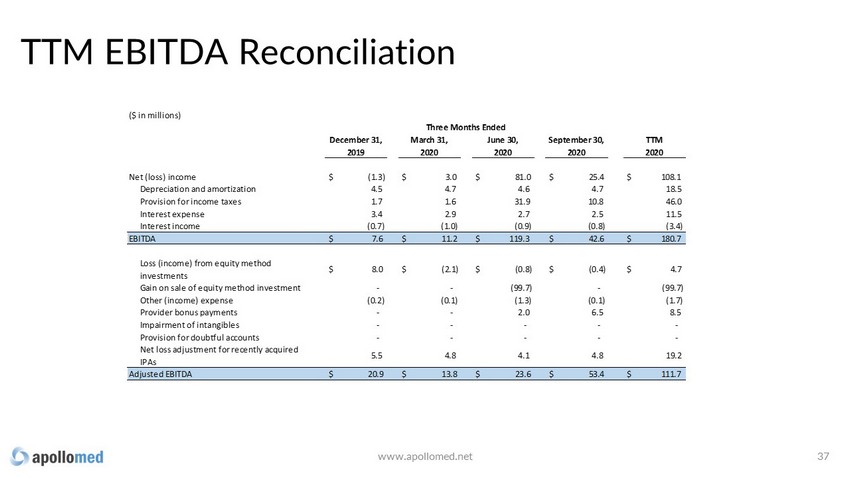
TTM EBITDA Reconciliation 37 December 31, March 31, June 30, September 30, TTM 2019 2020 2020 2020 2020 Net (loss) income $ (1.3) $ 3.0 $ 81.0 $ 25.4 $ 108.1 Depreciation and amortization 4.5 4.7 4.6 4.7 18.5 Provision for income taxes 1.7 1.6 31.9 10.8 46.0 Interest expense 3.4 2.9 2.7 2.5 11.5 Interest income (0.7) (1.0) (0.9) (0.8) (3.4) EBITDA $ 7.6 $ 11.2 $ 119.3 $ 42.6 $ 180.7 Loss (income) from equity method investments $ 8.0 $ (2.1) $ (0.8) $ (0.4) $ 4.7 Gain on sale of equity method investment - - (99.7) - (99.7) Other (income) expense (0.2) (0.1) (1.3) (0.1) (1.7) Provider bonus payments - - 2.0 6.5 8.5 Impairment of intangibles - - - - - Provision for doubtful accounts - - - - - Net loss adjustment for recently acquired IPAs 5.5 4.8 4.1 4.8 19.2 Adjusted EBITDA $ 20.9 $ 13.8 $ 23.6 $ 53.4 $ 111.7 ($ in millions) Three Months Ended www.apollomed.net
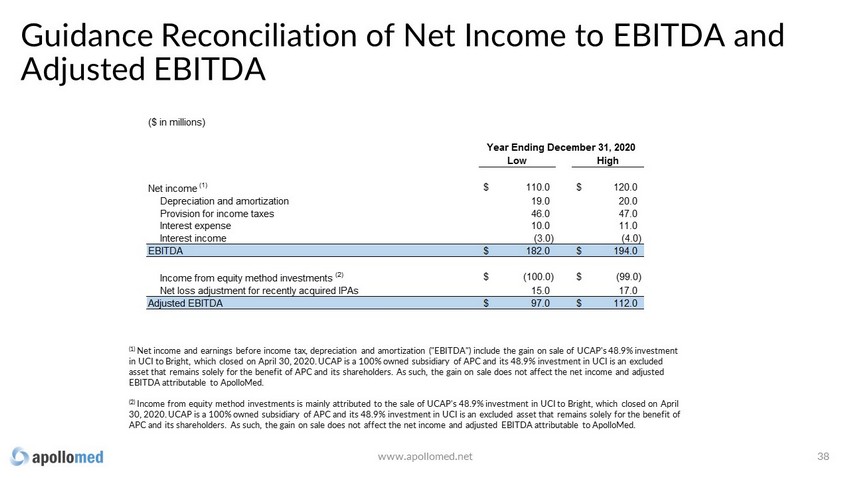
Guidance Reconciliation of Net Income to EBITDA and Adjusted EBITDA 38 Low High Net income (1) $ 110.0 $ 120.0 Depreciation and amortization 19.0 20.0 Provision for income taxes 46.0 47.0 Interest expense 10.0 11.0 Interest income (3.0) (4.0) EBITDA $ 182.0 $ 194.0 Income from equity method investments (2) $ (100.0) $ (99.0) Net loss adjustment for recently acquired IPAs 15.0 17.0 Adjusted EBITDA $ 97.0 $ 112.0 ($ in millions) Year Ending December 31, 2020 (1) Net income and earnings before income tax, depreciation and amortization ("EBITDA") include the gain on sale of UCAP's 48.9% inv estment in UCI to Bright, which closed on April 30, 2020. UCAP is a 100% owned subsidiary of APC and its 48.9% investment in UCI is a n e xcluded asset that remains solely for the benefit of APC and its shareholders. As such, the gain on sale does not affect the net inco me and adjusted EBITDA attributable to ApolloMed. (2) Income from equity method investments is mainly attributed to the sale of UCAP's 48.9% investment in UCI to Bright, which clo sed on April 30, 2020. UCAP is a 100% owned subsidiary of APC and its 48.9% investment in UCI is an excluded asset that remains solely for th e benefit of APC and its shareholders. As such, the gain on sale does not affect the net income and adjusted EBITDA attributable to Apollo Med . www.apollomed.net
Use of Non - GAAP Financial Measures This presentation contains the non - GAAP financial measures Earnings Before Interest, Taxes, Depreciation and Amortization (“EBIT DA”) and Adjusted EBITDA, of which the most directly comparable financial measure presented in accordance with GAAP is net (loss) income. These measures are not in acc ordance with, or are an alternative to, U.S. generally accepted accounting principles (“GAAP”), and may be different from other non - GAAP financial measures used by other com panies. ApolloMed uses Adjusted EBITDA as a supplemental performance measure of its operations, for financial and operational decision - making, and as a supplem ental means of evaluating period - to - period comparisons on a consistent basis. Adjusted EBITDA is calculated as earnings before interest, taxes, depreciation, and am ortization, excluding losses from equity method investments provide bonus payments, impairment of intangibles, provision of doubtful accounts and other income earned tha t is not related to ApolloMed's normal operations. Adjusted EBITDA also excludes non recurring items, including the effect on EBITDA of certain recently acquired IP As. ApolloMed believes the presentation of these non - GAAP financial measures provides investors with relevant and useful information as it allows investors to evaluate the operating performance of the business activities without having to account for differences recognized because of non - core and no n - recurring financial information. When GAAP financial measures are viewed in conjunction with non - GAAP financial measures, investors are provided with a more meaningfu l understanding of ApolloMed's ongoing operating performance. In addition, these non - GAAP financial measures are among those indicators ApolloMed uses as a bas is for evaluating operational performance, allocating resources and planning and forecasting future periods. Non - GAAP financial measures are not intended to b e considered in isolation, or as a substitute for, GAAP financial measures. To the extent this release contains historical or future non - GAAP financial measures, A polloMed has provided corresponding GAAP financial measures for comparative purposes. Reconciliation between certain GAAP and non - GAAP measures is provided above. 39 www.apollomed.net
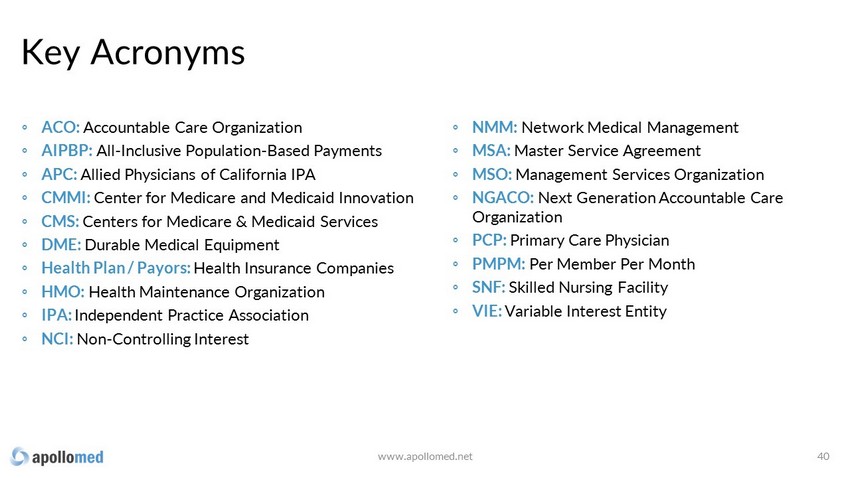
Key Acronyms 40 ◦ ACO: Accountable Care Organization ◦ AIPBP: All - Inclusive Population - Based Payments ◦ APC: Allied Physicians of California IPA ◦ CMMI: Center for Medicare and Medicaid Innovation ◦ CMS: Centers for Medicare & Medicaid Services ◦ DME: Durable Medical Equipment ◦ Health Plan / Payors: Health Insurance Companies ◦ HMO: Health Maintenance Organization ◦ IPA: Independent Practice Association ◦ NCI: Non - Controlling Interest ◦ NMM: Network Medical Management ◦ MSA: Master Service Agreement ◦ MSO: Management Services Organization ◦ NGACO: Next Generation Accountable Care Organization ◦ PCP: Primary Care Physician ◦ PMPM: Per Member Per Month ◦ SNF: Skilled Nursing Facility ◦ VIE: Variable Interest Entity www.apollomed.net

For inquiries, please contact: ApolloMed Investor Relations Carolyne Sohn, The Equity Group (626) 943 - 6491 (415) 568 - 2255 investors@apollomed.net csohn@equityny.com NASDAQ: AMEH 41 www.apollomed.net