Attached files
| file | filename |
|---|---|
| 8-K - FORM 8-K - KBS Growth & Income REIT, Inc. | kbsgi-updatednavwebina.htm |
Valuation and Portfolio Update Meeting December 15, 2020 Exhibit 99.1
W W W . K B S . C O M The information contained herein should be read in conjunction with, and is qualified by, the information in KBS Growth & Income Real Estate Investment Trust’s (the “Company or KBS Growth & Income REIT or KBS G&I REIT”) Annual Report on Form 10-K for the year ended December 31, 2019 (the “Annual Report”), and in the Company’s Quarterly Report on Form 10-Q for the period ended September 30, 2020 (the “Quarterly Report”), including the “Risk Factors” contained therein. For a full description of the limitations, methodologies and assumptions used to value KBS G&I REIT’s assets and liabilities in connection with the calculation of KBS G&I REIT’s estimated value per share, see KBS G&I REIT’s Current Report on Form 8-K dated December 7, 2020 (the “Valuation 8-K”). Important Disclosures 2 Certain statements contained herein may be deemed to be forward-looking statements within the meaning of the Federal Private Securities Litigation Reform Act of 1995. The Company intends that such forward-looking statements be subject to the safe harbors created by Section 21E of the Securities Exchange Act of 1934, as amended. These statements include statements regarding the intent, belief or current expectations of the Company and members of its management team, as well as the assumptions on which such statements are based, and generally are identified by the use of words such as “may,” “will,” “seeks,” “anticipates,” “believes,” “estimates,” “expects,” “plans,” “intends,” “should” or similar expressions. Readers are cautioned not to place undue reliance on these forward-looking statements, which speak only as of the date they are made. The Company undertakes no obligation to update or revise forward-looking statements to reflect changed assumptions, the occurrence of unanticipated events or changes to future operating results over time, unless required by law. Such statements are subject to known and unknown risks and uncertainties which could cause actual results to differ materially from those contemplated by such forward-looking statements. The Company makes no representation or warranty (express or implied) about the accuracy of any such forward-looking statements. These statements are based on a number of assumptions involving the judgment of management. Forward-Looking Statements
W W W . K B S . C O M Important Disclosures The COVID-19 pandemic, together with the resulting measures imposed to help control the spread of the virus, including quarantines, “shelter in place” and “stay at home” orders, travel restrictions on businesses and school closures, has had a negative impact on the economy and business activity globally. The COVID-19 pandemic is negatively impacting almost every industry, including the U.S. office real estate industry and the industries of the Company’s tenants, directly or indirectly. The extent to which the COVID-19 pandemic impacts the Company’s operations and those of its tenants, will depend on future developments, which are highly uncertain and cannot be predicted with confidence, including the scope, severity and duration of the pandemic, the actions taken to contain the pandemic or mitigate its impact, and the direct and indirect economic effects of the pandemic and containment measures, among others. If tenants default on their rent and vacate, the ability to re-lease this space is likely to be more difficult if the economic slowdown continues and any long-term impact of this situation, even after an economic rebound, remains unclear. Further, reductions in property values related to the impact of the COVID-19 pandemic may limit the Company’s ability to draw on the revolving commitment under its term loan due to covenants described in the loan agreement. The Company may fund distributions from any source including, without limitation, from offering proceeds or borrowings. Distributions paid through September 30, 2020 have been funded in part with cash flow from operating activities, from the proceeds from the sale of real estate and in part with debt financing, including advances from the Company’s advisor. In addition, distributions have been funded with cash resulting from the advisor’s waiver and deferral of its asset management fee. There are no guarantees that the Company will continue to pay distributions or that distributions at the current rate are sustainable. Actual events may cause the value and returns on the Company’s investments to be less than that used for purposes of the Company’s estimated NAV per share. With respect to the NAV per share, the appraisal methodology used for the appraised properties assumes the properties realize the projected net operating income and expected exit cap rates and that investors would be willing to invest in such properties at yields equal to the expected discount rates. Though the appraisals of the appraised properties, with respect to Duff & Phelps, and the valuation estimates used in calculating the estimated value per share, with respect to Duff & Phelps, the Company’s advisor and the Company, are the respective party’s best estimates as of September 30, 2020, the Company can give no assurance in this regard. Even small changes to these assumptions could result in significant differences in the appraised values of the appraised properties and the estimated value per share. These statements herein also depend on factors such as: future economic, competitive and market conditions; the Company’s ability to maintain occupancy levels and rental rates at its real estate properties; the Company’s ability to sell its real estate properties at the times and at the prices it expects; and other risks identified in Part I, Item IA of the Company’s Annual Report and in Part II, Item 1A of the Company’s Quarterly Report. Forward-Looking Statements 3

W W W . K B S . C O M The Impact of COVID-19 on Capital Markets and US Real Estate Investments 4
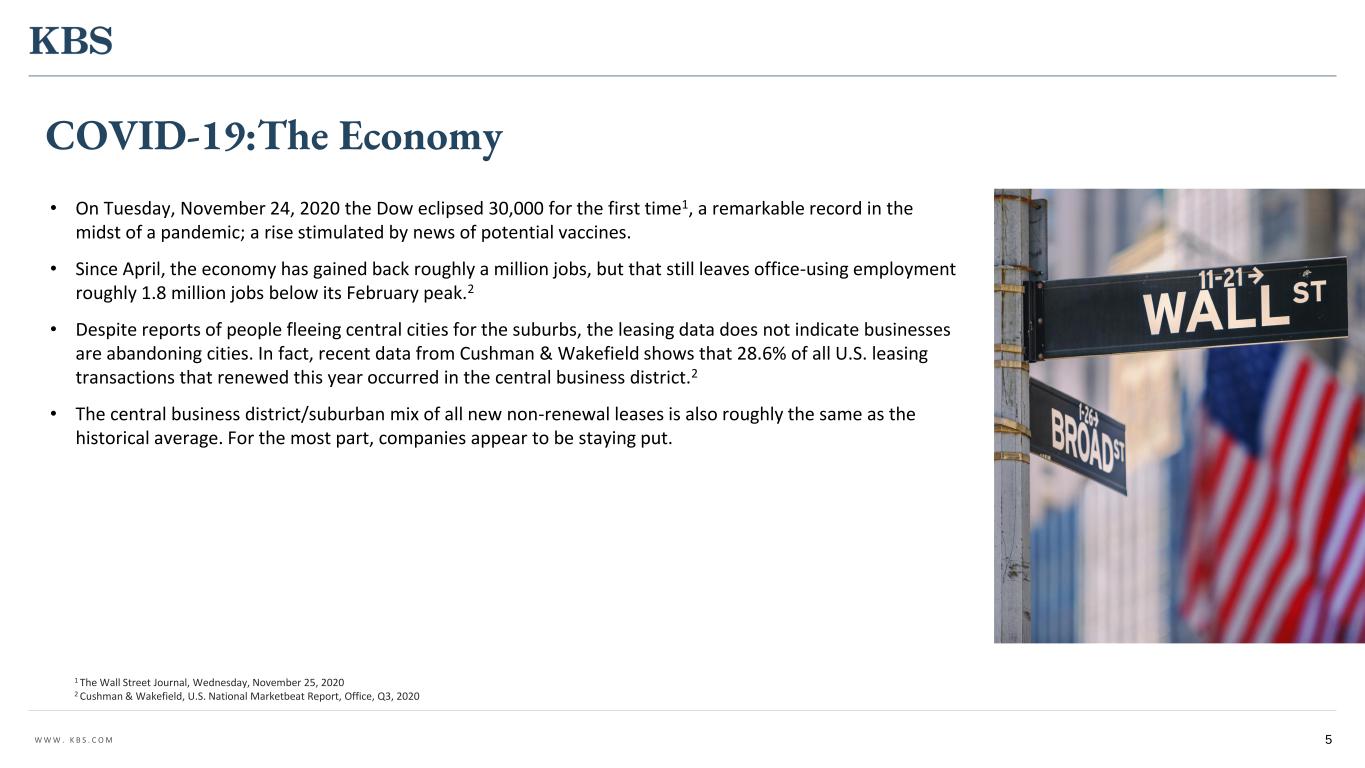
W W W . K B S . C O M • On Tuesday, November 24, 2020 the Dow eclipsed 30,000 for the first time1, a remarkable record in the midst of a pandemic; a rise stimulated by news of potential vaccines. • Since April, the economy has gained back roughly a million jobs, but that still leaves office-using employment roughly 1.8 million jobs below its February peak.2 • Despite reports of people fleeing central cities for the suburbs, the leasing data does not indicate businesses are abandoning cities. In fact, recent data from Cushman & Wakefield shows that 28.6% of all U.S. leasing transactions that renewed this year occurred in the central business district.2 • The central business district/suburban mix of all new non-renewal leases is also roughly the same as the historical average. For the most part, companies appear to be staying put. COVID-19:The Economy 1 The Wall Street Journal, Wednesday, November 25, 2020 2 Cushman & Wakefield, U.S. National Marketbeat Report, Office, Q3, 2020 5
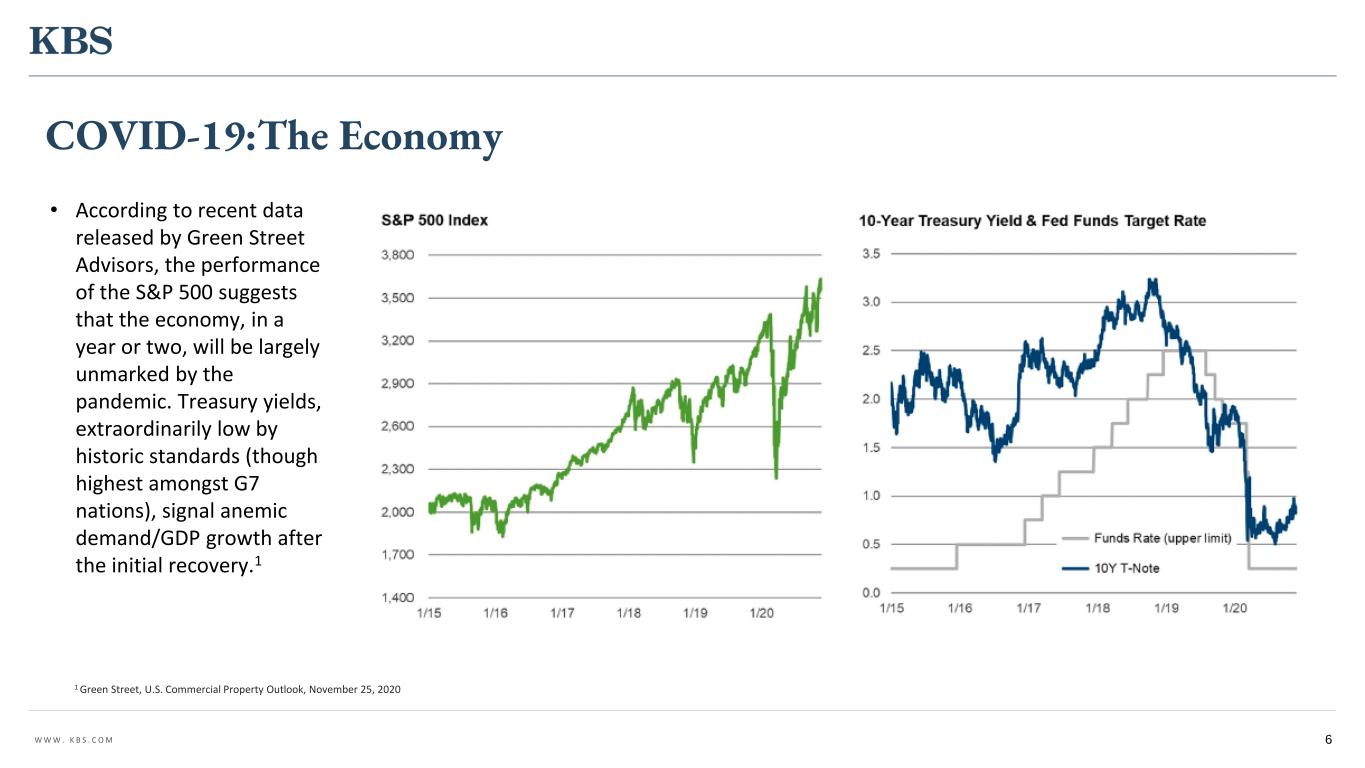
W W W . K B S . C O M • According to recent data released by Green Street Advisors, the performance of the S&P 500 suggests that the economy, in a year or two, will be largely unmarked by the pandemic. Treasury yields, extraordinarily low by historic standards (though highest amongst G7 nations), signal anemic demand/GDP growth after the initial recovery.1 COVID-19:The Economy 1 Green Street, U.S. Commercial Property Outlook, November 25, 2020 6
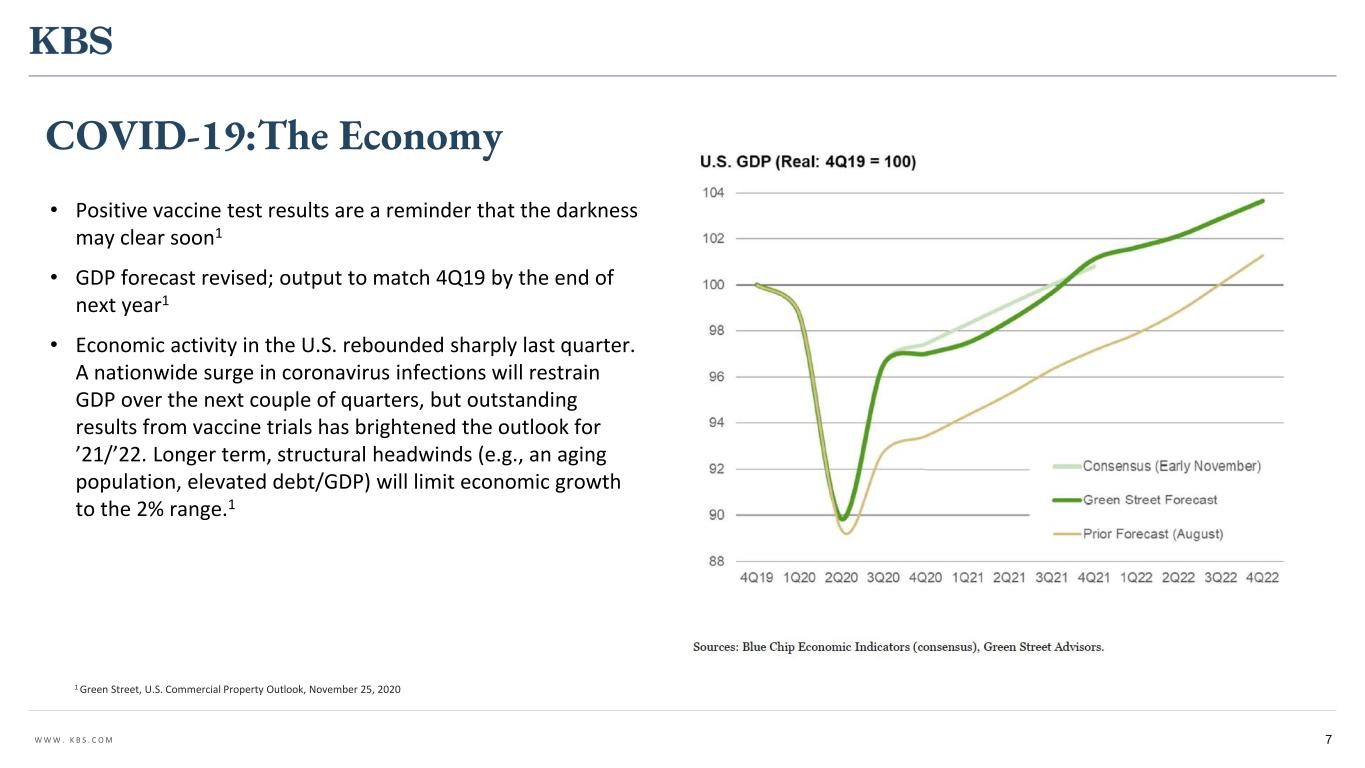
W W W . K B S . C O M • Positive vaccine test results are a reminder that the darkness may clear soon1 • GDP forecast revised; output to match 4Q19 by the end of next year1 • Economic activity in the U.S. rebounded sharply last quarter. A nationwide surge in coronavirus infections will restrain GDP over the next couple of quarters, but outstanding results from vaccine trials has brightened the outlook for ’21/’22. Longer term, structural headwinds (e.g., an aging population, elevated debt/GDP) will limit economic growth to the 2% range.1 COVID-19:The Economy 1 Green Street, U.S. Commercial Property Outlook, November 25, 2020 7
W W W . K B S . C O M • The continued demand for high-tech talent will help drive commercial real estate growth.1 • Office-using employment rebounded quickly in the third quarter of 2020 indicating future demand for physical workspaces. 2 • More than 30% of the private sector office-using jobs lost in the second quarter were recovered by the end of the third quarter.2 • Professional and business services drove the recovery of office-using employment during the third quarter. The Seattle and Dallas markets regained 94.1% and 71.8% of jobs in this sector.2 • Office-using job sectors, down 4.1% year-over-year, have continued to fare better than the labor market as a whole, down 6.1% year-over-year.3 • Newmark notes that office-using employment numbers have historically been a major factor in determining office returns, and the recent rebound in these numbers is a positive sign for the office market.2 8 COVID-19: Office Market Outlook 1 National Real Estate Investor, Oct. 26, 2020 2 GlobeSt.com, Office Jobs Recovering Faster Than Usual For a Recession, Nov. 30, 2020 3 Commercial Edge, National Office Report, November 2020
W W W . K B S . C O M COVID-19: What We are Seeing • We were the first large real estate firm to roll-out the Maptician space planning software to help tenants manage COVID risk. This has been well received. • We have implemented enhanced air-quality filtration and air-cleaning mechanisms to ensure air quality in our buildings continues to be clean and safe for all tenants. • According to Colliers, the number of coworking spaces is expected to double or triple nationwide in the next five years. The resurgence comes as more tenants give their employees additional options for working closer to home. 1 • Over the past seven months approximately 72.0 million square feet of sublease space has become available in the market which may have a negative effect on rental rates.2 • The good news for existing property owners like KBS is that supply is relatively constrained. This is more of a demand-driven downturn than an oversupply-driven market.3 9 1Commercial Observer, Number of Coworking Spaces to Double or Triple Nationwide in the Next Five Years, Nov. 24, 2020 2Commercial Edge, National Office Report, November 2020 3 Cushman & Wakefield, U.S. National Marketbeat Report, Office, Q3, 2020
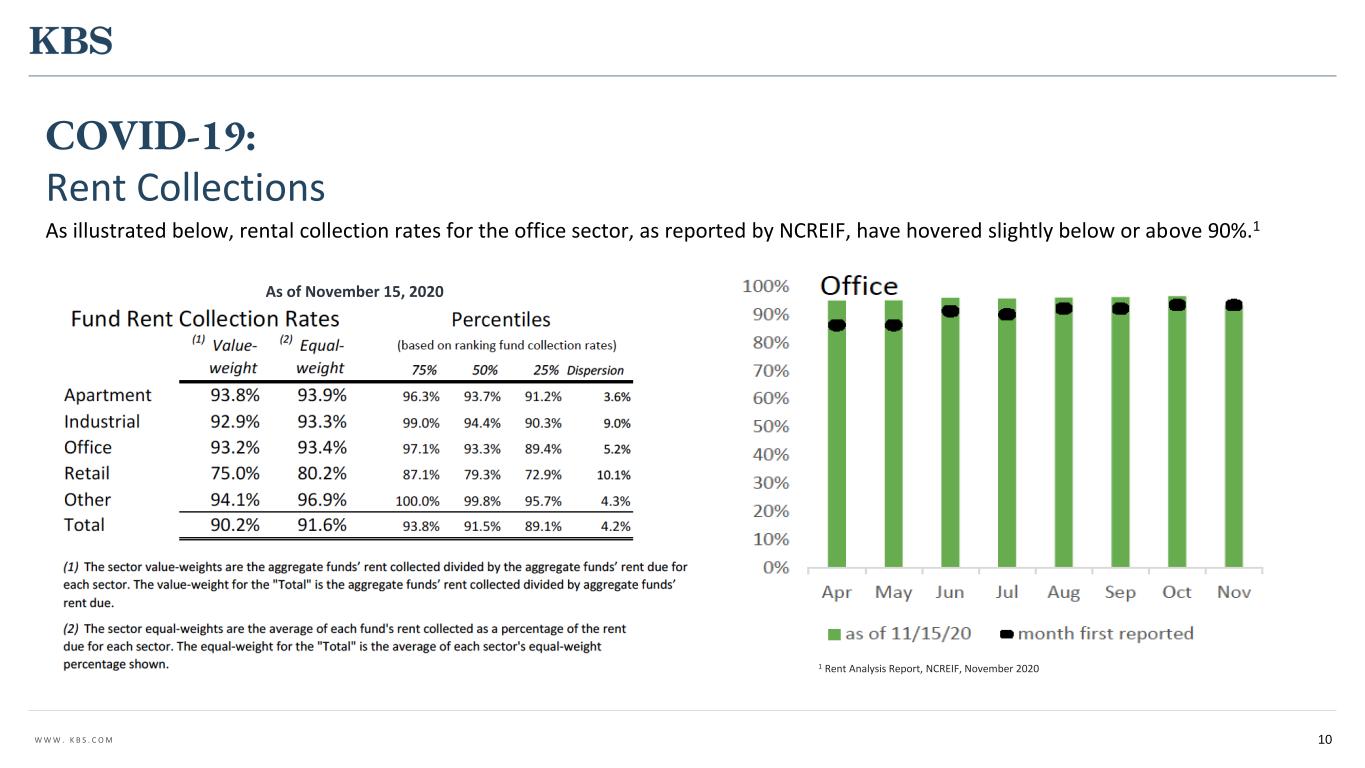
W W W . K B S . C O M As illustrated below, rental collection rates for the office sector, as reported by NCREIF, have hovered slightly below or above 90%.1 10 COVID-19: Rent Collections 1 Rent Analysis Report, NCREIF, November 2020 As of November 15, 2020
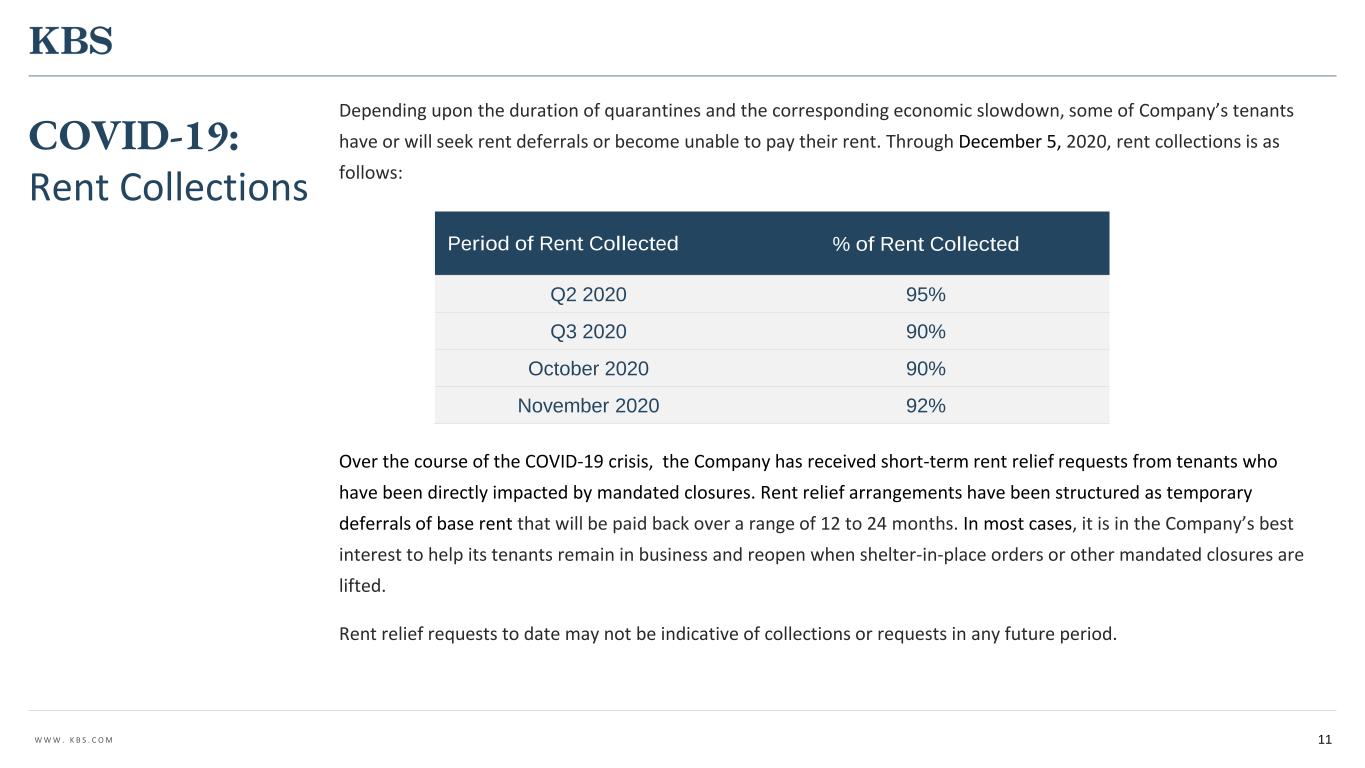
W W W . K B S . C O M Depending upon the duration of quarantines and the corresponding economic slowdown, some of Company’s tenants have or will seek rent deferrals or become unable to pay their rent. Through December 5, 2020, rent collections is as follows: Over the course of the COVID-19 crisis, the Company has received short-term rent relief requests from tenants who have been directly impacted by mandated closures. Rent relief arrangements have been structured as temporary deferrals of base rent that will be paid back over a range of 12 to 24 months. In most cases, it is in the Company’s best interest to help its tenants remain in business and reopen when shelter-in-place orders or other mandated closures are lifted. Rent relief requests to date may not be indicative of collections or requests in any future period. 11 Period of Rent Collected % of Rent Collected Q2 2020 95% Q3 2020 90% October 2020 90% November 2020 92% COVID-19: Rent Collections
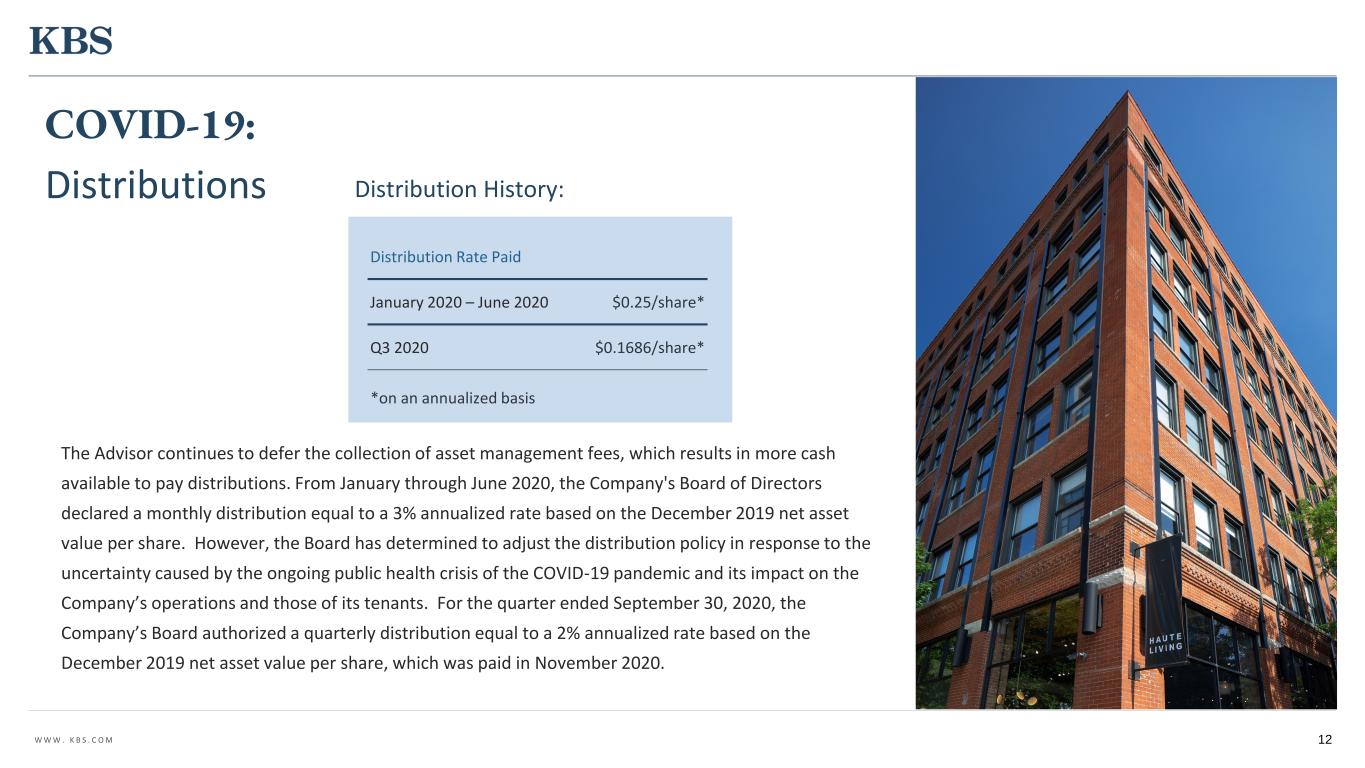
W W W . K B S . C O M 12 Distributions The Advisor continues to defer the collection of asset management fees, which results in more cash available to pay distributions. From January through June 2020, the Company's Board of Directors declared a monthly distribution equal to a 3% annualized rate based on the December 2019 net asset value per share. However, the Board has determined to adjust the distribution policy in response to the uncertainty caused by the ongoing public health crisis of the COVID-19 pandemic and its impact on the Company’s operations and those of its tenants. For the quarter ended September 30, 2020, the Company’s Board authorized a quarterly distribution equal to a 2% annualized rate based on the December 2019 net asset value per share, which was paid in November 2020. COVID-19: Distribution History: *on an annualized basis Distribution Rate Paid January 2020 – June 2020 $0.25/share* Q3 2020 $0.1686/share*
Portfolio Highlights 13
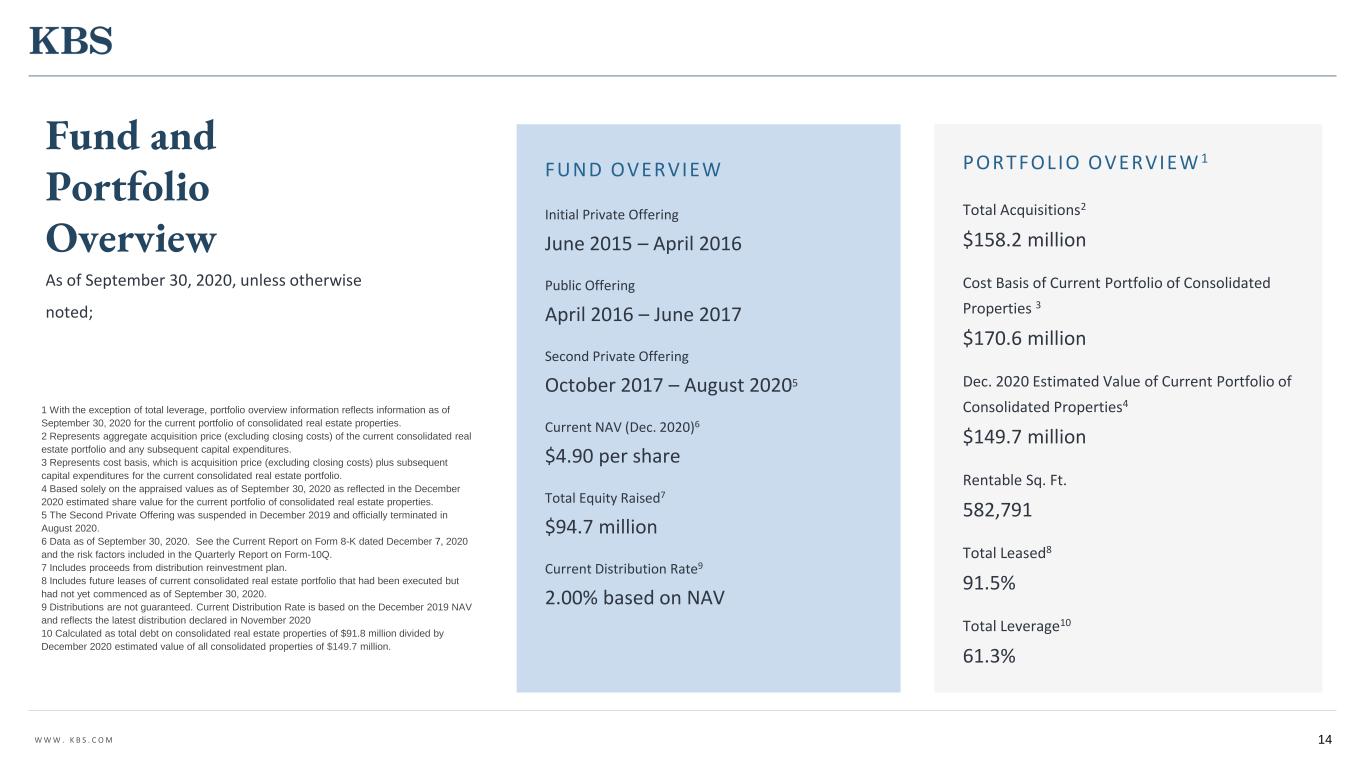
W W W . K B S . C O M FUND OVERVIEW Initial Private Offering June 2015 – April 2016 Public Offering April 2016 – June 2017 Second Private Offering October 2017 – August 20205 Current NAV (Dec. 2020)6 $4.90 per share Total Equity Raised7 $94.7 million Current Distribution Rate9 2.00% based on NAV 1 With the exception of total leverage, portfolio overview information reflects information as of September 30, 2020 for the current portfolio of consolidated real estate properties. 2 Represents aggregate acquisition price (excluding closing costs) of the current consolidated real estate portfolio and any subsequent capital expenditures. 3 Represents cost basis, which is acquisition price (excluding closing costs) plus subsequent capital expenditures for the current consolidated real estate portfolio. 4 Based solely on the appraised values as of September 30, 2020 as reflected in the December 2020 estimated share value for the current portfolio of consolidated real estate properties. 5 The Second Private Offering was suspended in December 2019 and officially terminated in August 2020. 6 Data as of September 30, 2020. See the Current Report on Form 8-K dated December 7, 2020 and the risk factors included in the Quarterly Report on Form-10Q. 7 Includes proceeds from distribution reinvestment plan. 8 Includes future leases of current consolidated real estate portfolio that had been executed but had not yet commenced as of September 30, 2020. 9 Distributions are not guaranteed. Current Distribution Rate is based on the December 2019 NAV and reflects the latest distribution declared in November 2020 10 Calculated as total debt on consolidated real estate properties of $91.8 million divided by December 2020 estimated value of all consolidated properties of $149.7 million. PORTFOLIO OVERVIEW 1 Total Acquisitions2 $158.2 million Cost Basis of Current Portfolio of Consolidated Properties 3 $170.6 million Dec. 2020 Estimated Value of Current Portfolio of Consolidated Properties4 $149.7 million Rentable Sq. Ft. 582,791 Total Leased8 91.5% Total Leverage10 61.3% 14 Fund and Portfolio Overview As of September 30, 2020, unless otherwise noted;
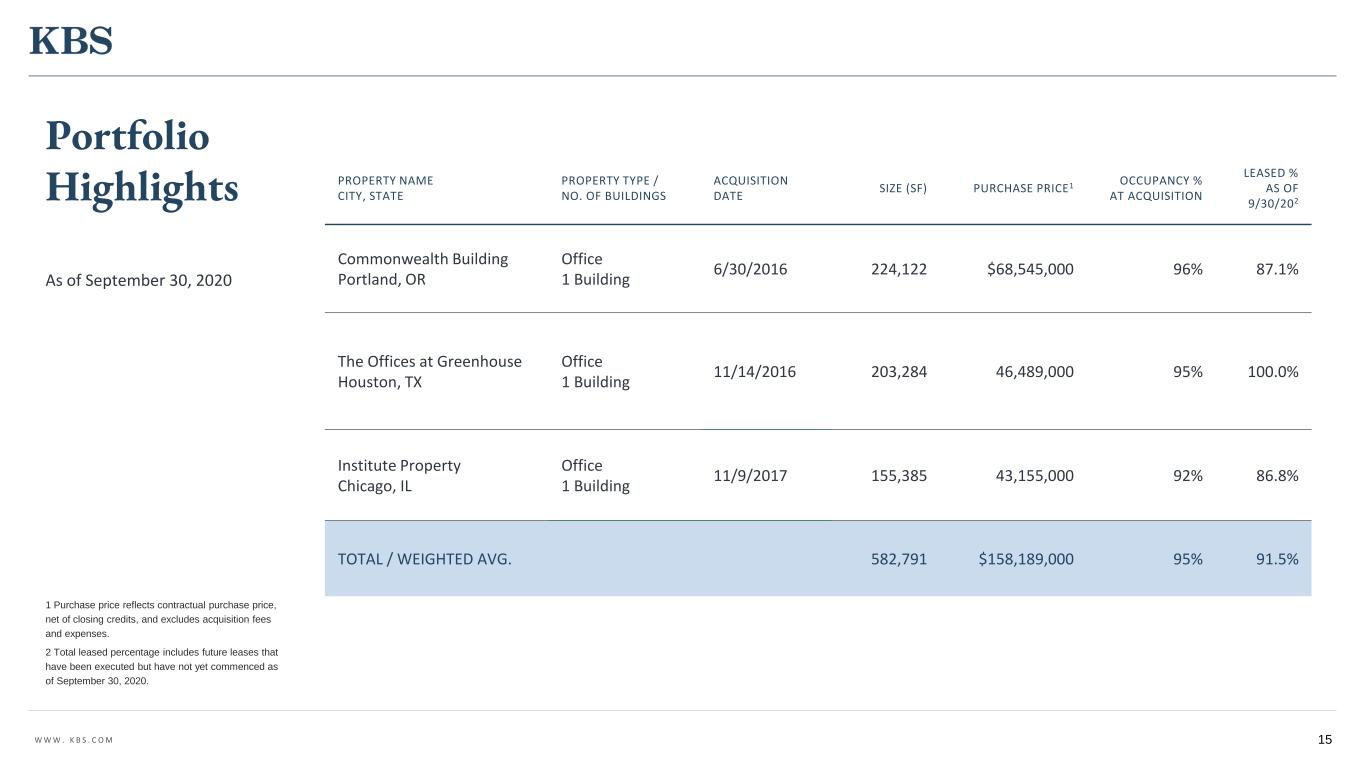
W W W . K B S . C O M PROPERTY NAME CITY, STATE PROPERTY TYPE / NO. OF BUILDINGS ACQUISITION DATE SIZE (SF) PURCHASE PRICE1 OCCUPANCY % AT ACQUISITION LEASED % AS OF 9/30/202 Commonwealth Building Portland, OR Office 1 Building 6/30/2016 224,122 $68,545,000 96% 87.1% The Offices at Greenhouse Houston, TX Office 1 Building 11/14/2016 203,284 46,489,000 95% 100.0% Institute Property Chicago, IL Office 1 Building 11/9/2017 155,385 43,155,000 92% 86.8% TOTAL / WEIGHTED AVG. 582,791 $158,189,000 95% 91.5% 15 Portfolio Highlights 1 Purchase price reflects contractual purchase price, net of closing credits, and excludes acquisition fees and expenses. 2 Total leased percentage includes future leases that have been executed but have not yet commenced as of September 30, 2020. As of September 30, 2020
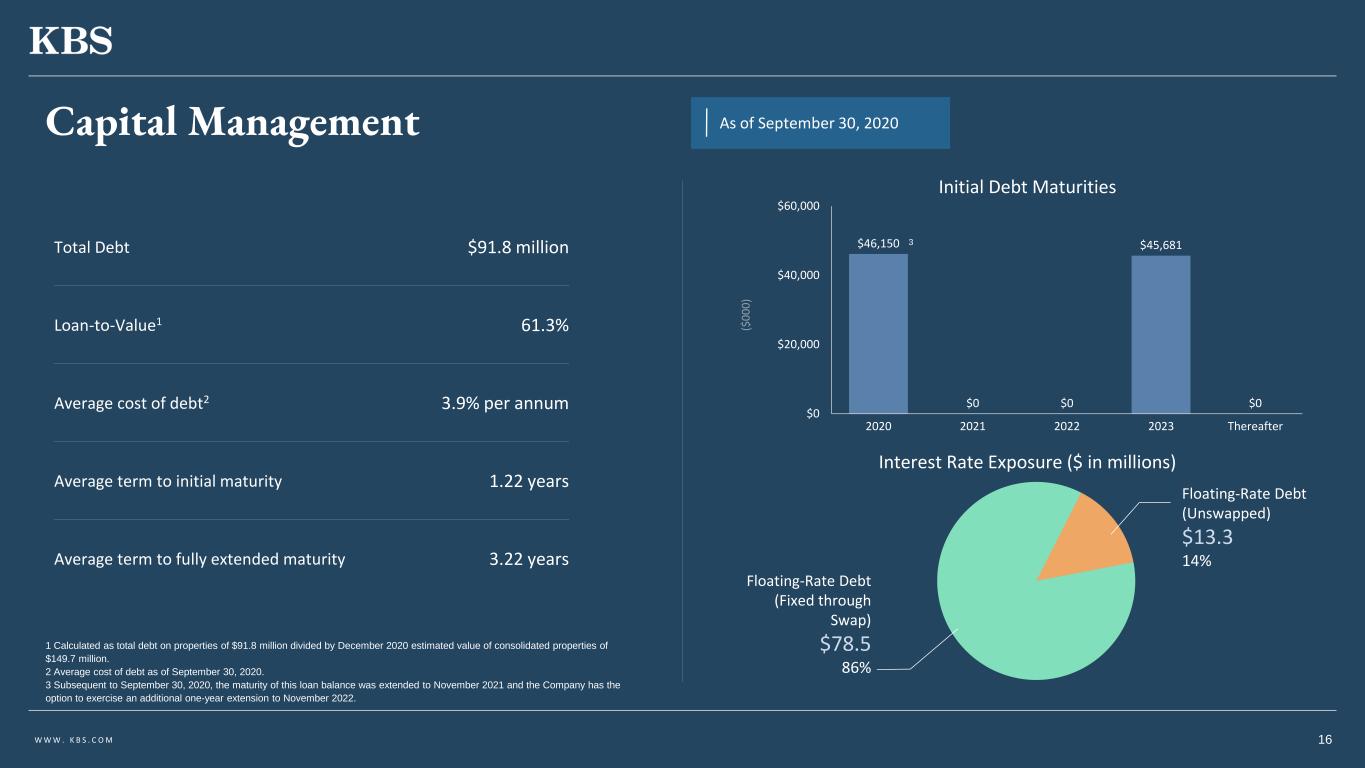
W W W . K B S . C O M $46,150 $0 $0 $45,681 $0 $0 $20,000 $40,000 $60,000 2020 2021 2022 2023 Thereafter 3 Capital Management Initial Debt Maturities 1 Calculated as total debt on properties of $91.8 million divided by December 2020 estimated value of consolidated properties of $149.7 million. 2 Average cost of debt as of September 30, 2020. 3 Subsequent to September 30, 2020, the maturity of this loan balance was extended to November 2021 and the Company has the option to exercise an additional one-year extension to November 2022. Total Debt $91.8 million Loan-to-Value1 61.3% Average cost of debt2 3.9% per annum Average term to initial maturity 1.22 years Average term to fully extended maturity 3.22 years Interest Rate Exposure ($ in millions) 16 As of September 30, 2020 Floating-Rate Debt (Unswapped) $13.3 14% Floating-Rate Debt (Fixed through Swap) $78.5 86%
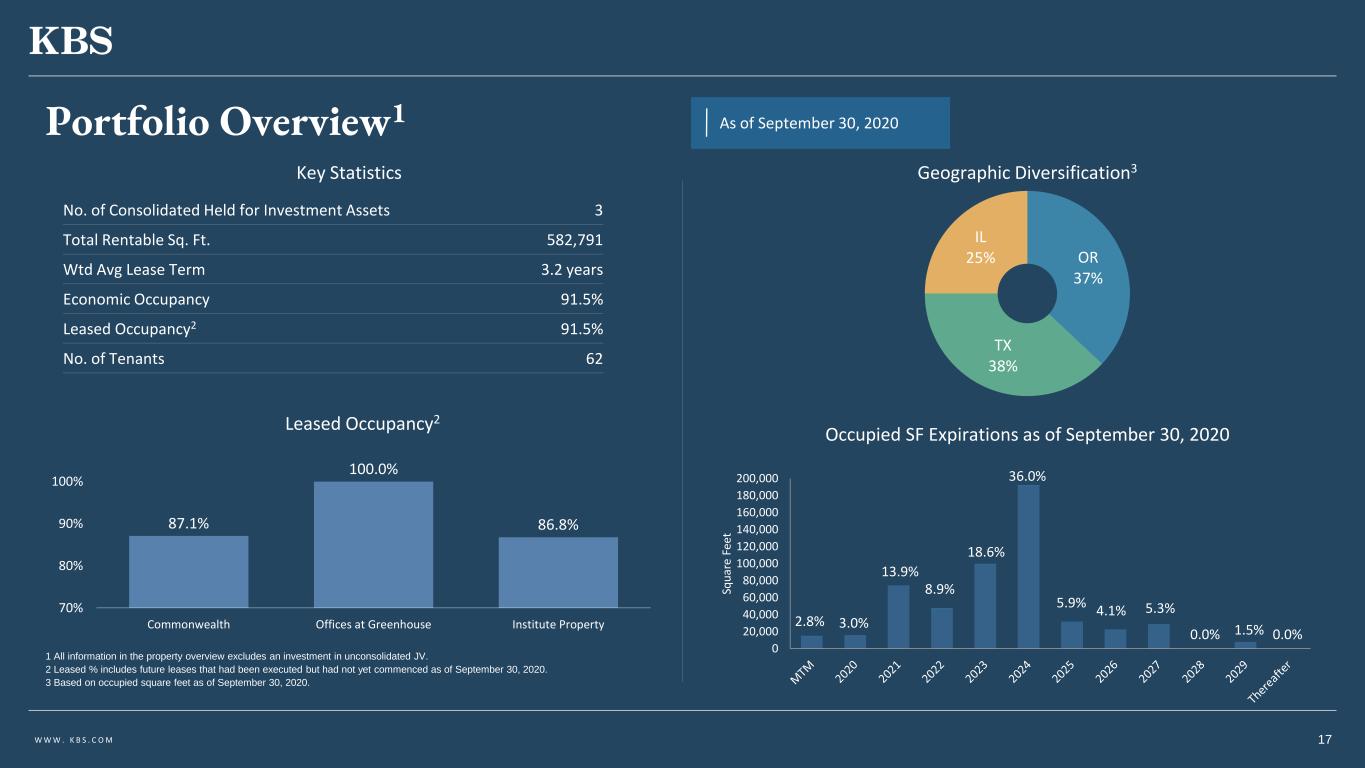
W W W . K B S . C O M Portfolio Overview1 Geographic Diversification3 1 All information in the property overview excludes an investment in unconsolidated JV. 2 Leased % includes future leases that had been executed but had not yet commenced as of September 30, 2020. 3 Based on occupied square feet as of September 30, 2020. No. of Consolidated Held for Investment Assets 3 Total Rentable Sq. Ft. 582,791 Wtd Avg Lease Term 3.2 years Economic Occupancy 91.5% Leased Occupancy2 91.5% No. of Tenants 62 Occupied SF Expirations as of September 30, 2020 Key Statistics Leased Occupancy2 2.8% 3.0% 13.9% 8.9% 18.6% 36.0% 5.9% 4.1% 5.3% 0.0% 1.5% 0.0% 0 20,000 40,000 60,000 80,000 100,000 120,000 140,000 160,000 180,000 200,000 S q u a re F e e t 17 As of September 30, 2020 OR 37% TX 38% IL 25% 87.1% 100.0% 86.8% 70% 80% 90% 100% Commonwealth Offices at Greenhouse Institute Property
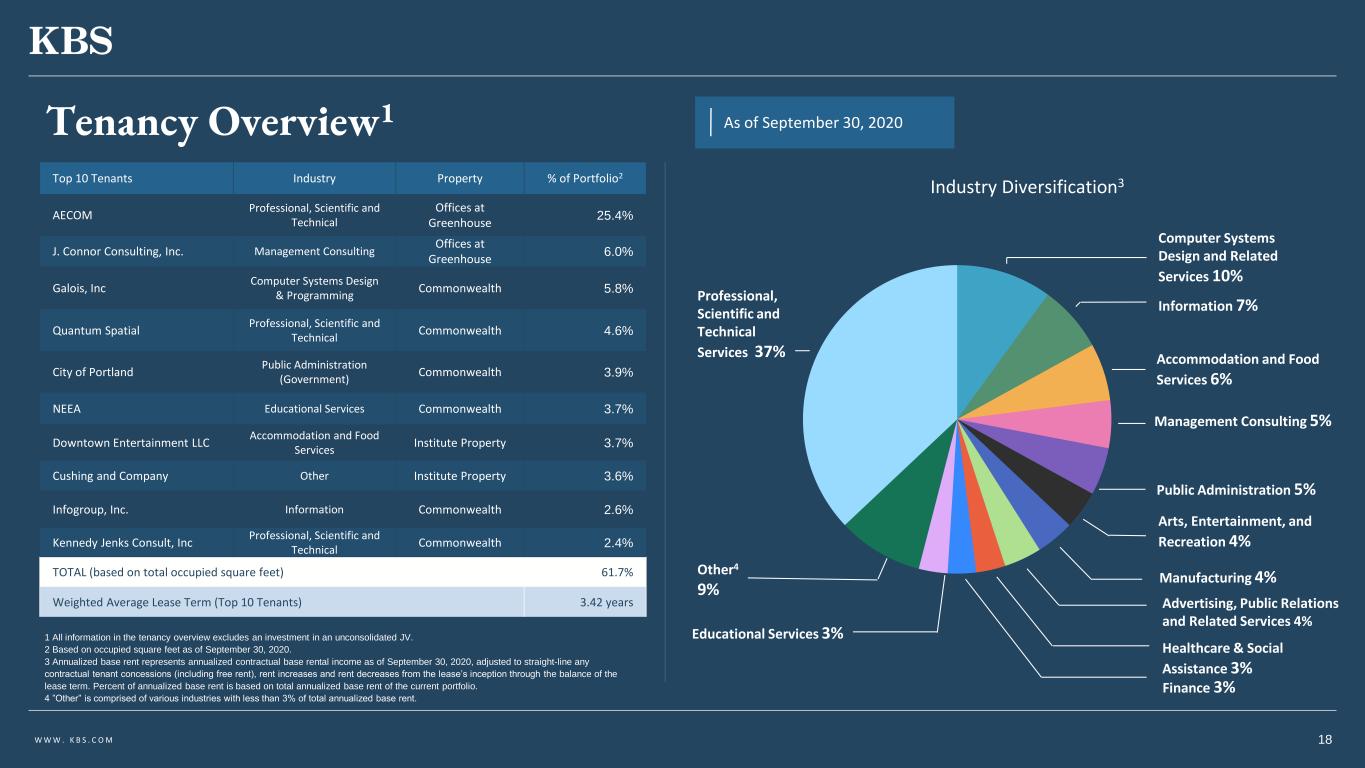
W W W . K B S . C O M Tenancy Overview1 Industry Diversification3 Top 10 Tenants Industry Property % of Portfolio2 AECOM Professional, Scientific and Technical Offices at Greenhouse 25.4% J. Connor Consulting, Inc. Management Consulting Offices at Greenhouse 6.0% Galois, Inc Computer Systems Design & Programming Commonwealth 5.8% Quantum Spatial Professional, Scientific and Technical Commonwealth 4.6% City of Portland Public Administration (Government) Commonwealth 3.9% NEEA Educational Services Commonwealth 3.7% Downtown Entertainment LLC Accommodation and Food Services Institute Property 3.7% Cushing and Company Other Institute Property 3.6% Infogroup, Inc. Information Commonwealth 2.6% Kennedy Jenks Consult, Inc Professional, Scientific and Technical Commonwealth 2.4% TOTAL (based on total occupied square feet) 61.7% Weighted Average Lease Term (Top 10 Tenants) 3.42 years 18 As of September 30, 2020 1 All information in the tenancy overview excludes an investment in an unconsolidated JV. 2 Based on occupied square feet as of September 30, 2020. 3 Annualized base rent represents annualized contractual base rental income as of September 30, 2020, adjusted to straight-line any contractual tenant concessions (including free rent), rent increases and rent decreases from the lease’s inception through the balance of the lease term. Percent of annualized base rent is based on total annualized base rent of the current portfolio. 4 ”Other” is comprised of various industries with less than 3% of total annualized base rent. Management Consulting 5% Accommodation and Food Services 6% Finance 3% Public Administration 5% Arts, Entertainment, and Recreation 4% Professional, Scientific and Technical Services 37% Information 7% Computer Systems Design and Related Services 10% Healthcare & Social Assistance 3% Manufacturing 4% Other4 9% Educational Services 3% Advertising, Public Relations and Related Services 4%
December 2020 Estimated Value Per Share 19 19
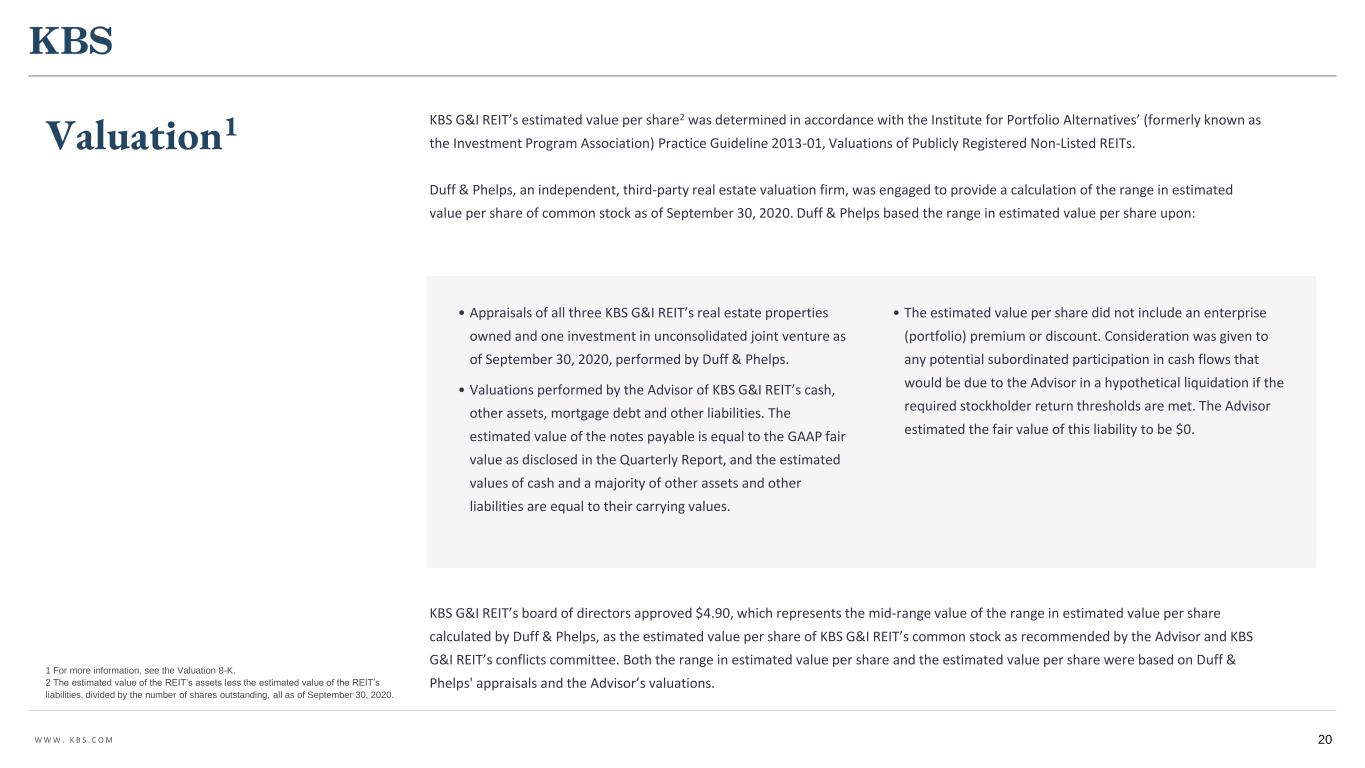
W W W . K B S . C O M • Appraisals of all three KBS G&I REIT’s real estate properties owned and one investment in unconsolidated joint venture as of September 30, 2020, performed by Duff & Phelps. • Valuations performed by the Advisor of KBS G&I REIT’s cash, other assets, mortgage debt and other liabilities. The estimated value of the notes payable is equal to the GAAP fair value as disclosed in the Quarterly Report, and the estimated values of cash and a majority of other assets and other liabilities are equal to their carrying values. KBS G&I REIT’s estimated value per share2 was determined in accordance with the Institute for Portfolio Alternatives’ (formerly known as the Investment Program Association) Practice Guideline 2013-01, Valuations of Publicly Registered Non-Listed REITs. Duff & Phelps, an independent, third-party real estate valuation firm, was engaged to provide a calculation of the range in estimated value per share of common stock as of September 30, 2020. Duff & Phelps based the range in estimated value per share upon: • The estimated value per share did not include an enterprise (portfolio) premium or discount. Consideration was given to any potential subordinated participation in cash flows that would be due to the Advisor in a hypothetical liquidation if the required stockholder return thresholds are met. The Advisor estimated the fair value of this liability to be $0. 20 Valuation1 1 For more information, see the Valuation 8-K. 2 The estimated value of the REIT’s assets less the estimated value of the REIT’s liabilities, divided by the number of shares outstanding, all as of September 30, 2020. KBS G&I REIT’s board of directors approved $4.90, which represents the mid-range value of the range in estimated value per share calculated by Duff & Phelps, as the estimated value per share of KBS G&I REIT’s common stock as recommended by the Advisor and KBS G&I REIT’s conflicts committee. Both the range in estimated value per share and the estimated value per share were based on Duff & Phelps' appraisals and the Advisor’s valuations.
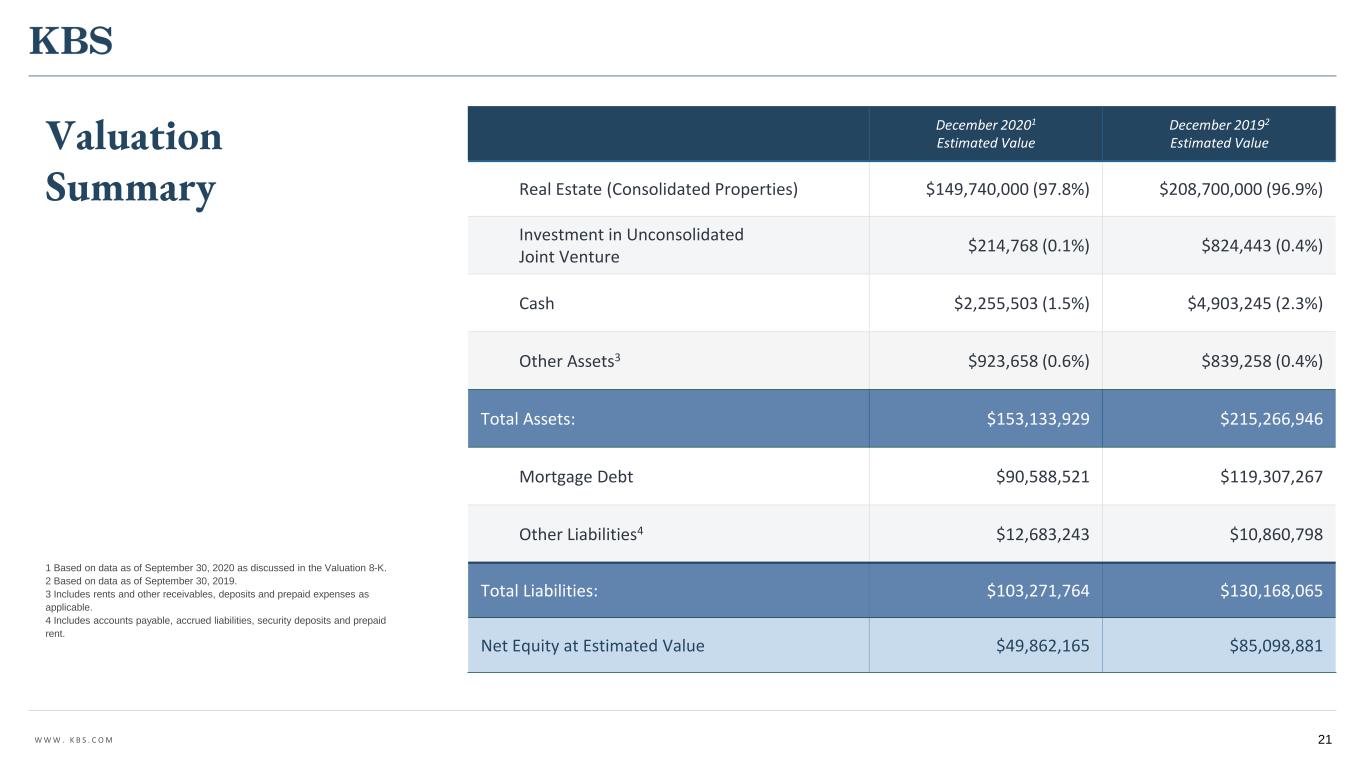
W W W . K B S . C O M 21 Valuation Summary 1 Based on data as of September 30, 2020 as discussed in the Valuation 8-K. 2 Based on data as of September 30, 2019. 3 Includes rents and other receivables, deposits and prepaid expenses as applicable. 4 Includes accounts payable, accrued liabilities, security deposits and prepaid rent. December 20201 Estimated Value December 20192 Estimated Value Real Estate (Consolidated Properties) $149,740,000 (97.8%) $208,700,000 (96.9%) Investment in Unconsolidated Joint Venture $214,768 (0.1%) $824,443 (0.4%) Cash $2,255,503 (1.5%) $4,903,245 (2.3%) Other Assets3 $923,658 (0.6%) $839,258 (0.4%) Total Assets: $153,133,929 $215,266,946 Mortgage Debt $90,588,521 $119,307,267 Other Liabilities4 $12,683,243 $10,860,798 Total Liabilities: $103,271,764 $130,168,065 Net Equity at Estimated Value $49,862,165 $85,098,881
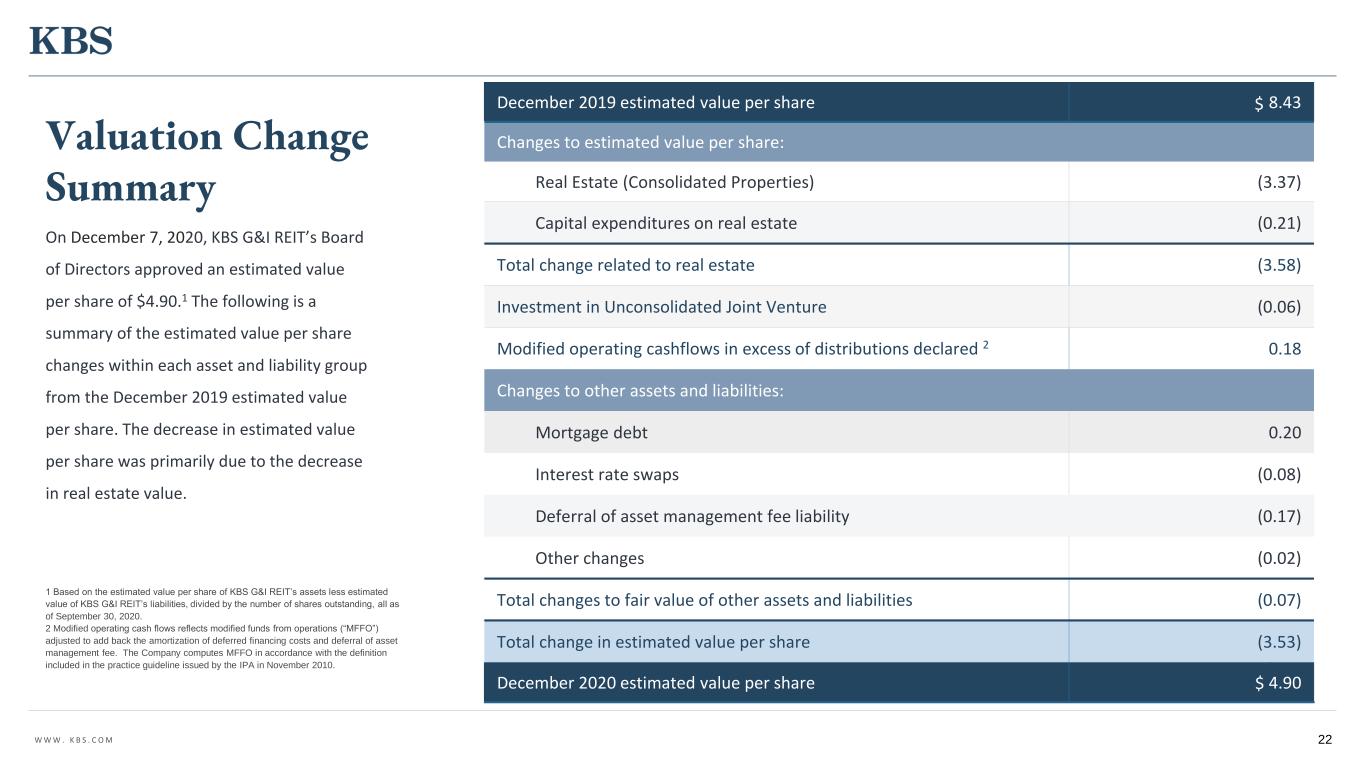
W W W . K B S . C O M 22 Valuation Change Summary 1 Based on the estimated value per share of KBS G&I REIT’s assets less estimated value of KBS G&I REIT’s liabilities, divided by the number of shares outstanding, all as of September 30, 2020. 2 Modified operating cash flows reflects modified funds from operations (“MFFO”) adjusted to add back the amortization of deferred financing costs and deferral of asset management fee. The Company computes MFFO in accordance with the definition included in the practice guideline issued by the IPA in November 2010. December 2019 estimated value per share 8.43 Changes to estimated value per share: Real Estate (Consolidated Properties) (3.37) Capital expenditures on real estate (0.21) Total change related to real estate (3.58) Investment in Unconsolidated Joint Venture (0.06) Modified operating cashflows in excess of distributions declared 2 0.18 Changes to other assets and liabilities: Mortgage debt 0.20 Interest rate swaps (0.08) Deferral of asset management fee liability (0.17) Other changes (0.02) Total changes to fair value of other assets and liabilities (0.07) Total change in estimated value per share (3.53) December 2020 estimated value per share 4.90 On December 7, 2020, KBS G&I REIT’s Board of Directors approved an estimated value per share of $4.90.1 The following is a summary of the estimated value per share changes within each asset and liability group from the December 2019 estimated value per share. The decrease in estimated value per share was primarily due to the decrease in real estate value. $ $ $
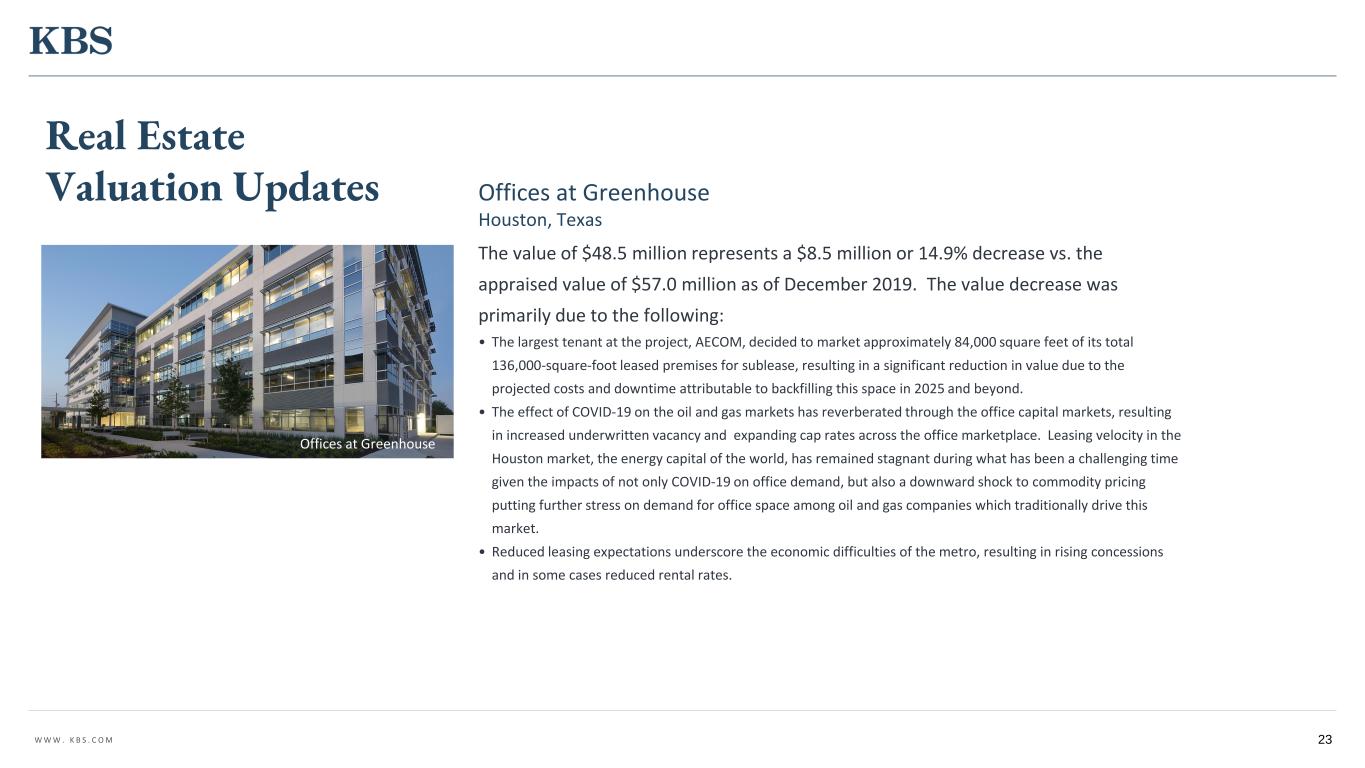
W W W . K B S . C O M 23 Real Estate Valuation Updates The value of $48.5 million represents a $8.5 million or 14.9% decrease vs. the appraised value of $57.0 million as of December 2019. The value decrease was primarily due to the following: • The largest tenant at the project, AECOM, decided to market approximately 84,000 square feet of its total 136,000-square-foot leased premises for sublease, resulting in a significant reduction in value due to the projected costs and downtime attributable to backfilling this space in 2025 and beyond. • The effect of COVID-19 on the oil and gas markets has reverberated through the office capital markets, resulting in increased underwritten vacancy and expanding cap rates across the office marketplace. Leasing velocity in the Houston market, the energy capital of the world, has remained stagnant during what has been a challenging time given the impacts of not only COVID-19 on office demand, but also a downward shock to commodity pricing putting further stress on demand for office space among oil and gas companies which traditionally drive this market. • Reduced leasing expectations underscore the economic difficulties of the metro, resulting in rising concessions and in some cases reduced rental rates. Offices at Greenhouse Houston, Texas Offices at Greenhouse
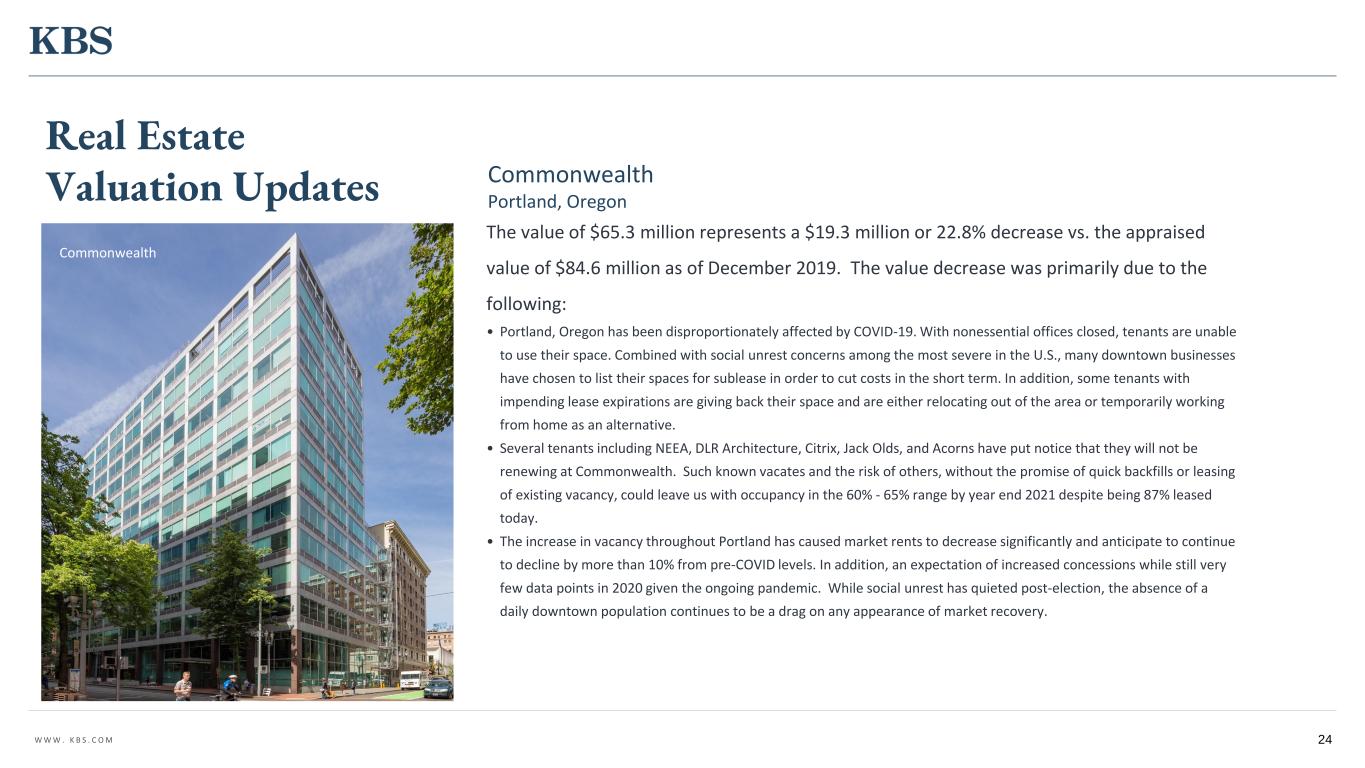
W W W . K B S . C O M 24 Real Estate Valuation Updates The value of $65.3 million represents a $19.3 million or 22.8% decrease vs. the appraised value of $84.6 million as of December 2019. The value decrease was primarily due to the following: • Portland, Oregon has been disproportionately affected by COVID-19. With nonessential offices closed, tenants are unable to use their space. Combined with social unrest concerns among the most severe in the U.S., many downtown businesses have chosen to list their spaces for sublease in order to cut costs in the short term. In addition, some tenants with impending lease expirations are giving back their space and are either relocating out of the area or temporarily working from home as an alternative. • Several tenants including NEEA, DLR Architecture, Citrix, Jack Olds, and Acorns have put notice that they will not be renewing at Commonwealth. Such known vacates and the risk of others, without the promise of quick backfills or leasing of existing vacancy, could leave us with occupancy in the 60% - 65% range by year end 2021 despite being 87% leased today. • The increase in vacancy throughout Portland has caused market rents to decrease significantly and anticipate to continue to decline by more than 10% from pre-COVID levels. In addition, an expectation of increased concessions while still very few data points in 2020 given the ongoing pandemic. While social unrest has quieted post-election, the absence of a daily downtown population continues to be a drag on any appearance of market recovery. Commonwealth Portland, Oregon Commonwealth Commonwealth
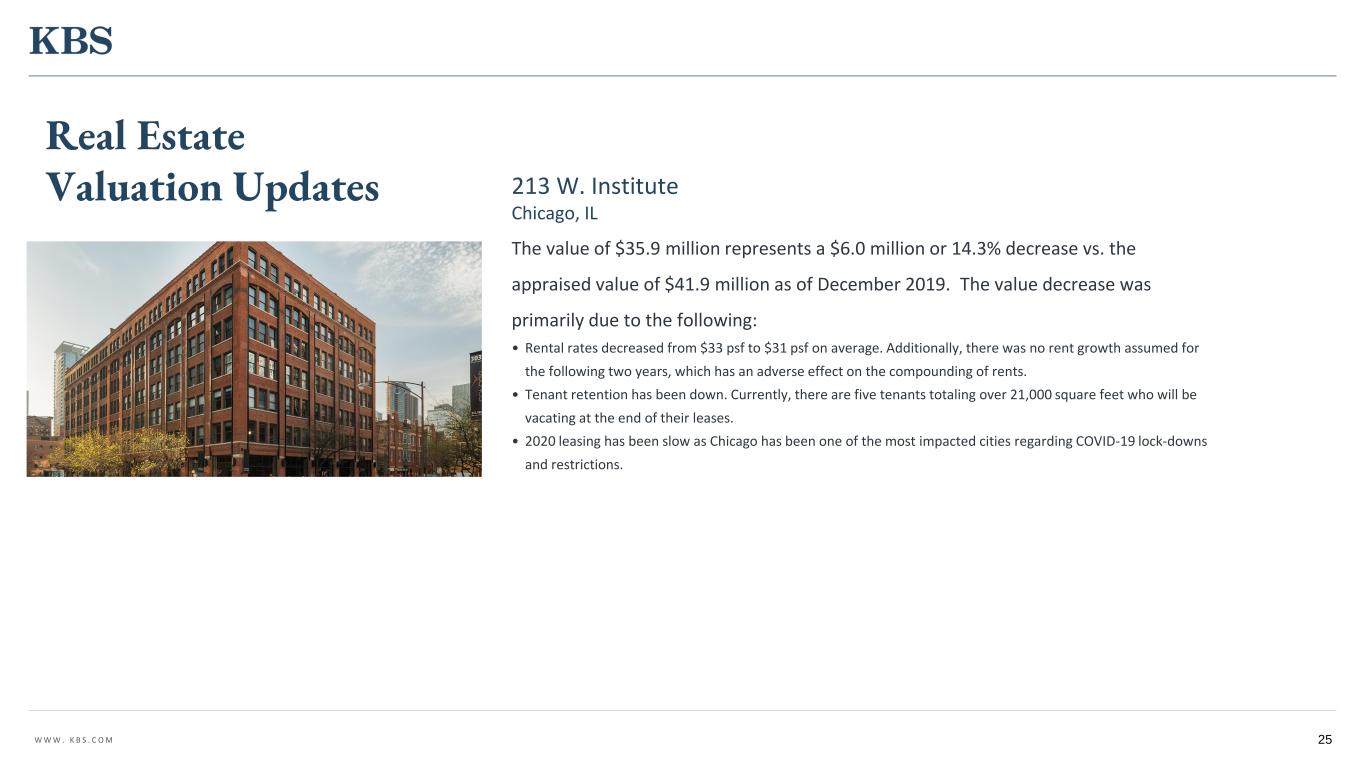
W W W . K B S . C O M 25 Real Estate Valuation Updates The value of $35.9 million represents a $6.0 million or 14.3% decrease vs. the appraised value of $41.9 million as of December 2019. The value decrease was primarily due to the following: • Rental rates decreased from $33 psf to $31 psf on average. Additionally, there was no rent growth assumed for the following two years, which has an adverse effect on the compounding of rents. • Tenant retention has been down. Currently, there are five tenants totaling over 21,000 square feet who will be vacating at the end of their leases. • 2020 leasing has been slow as Chicago has been one of the most impacted cities regarding COVID-19 lock-downs and restrictions. 213 W. Institute Chicago, IL 213 W. Institute
W W W . K B S . C O M Due to the minimal amount of capital raise in the REIT, which had been substantially impacted early on by regulatory changes, and the inability to significantly improve its size and scale in order to help offset the sizeable G&A costs of operating a non-traded REIT, the Board formed a special committee to evaluate strategic alternatives for the REIT. Based upon the special committee’s assessment and recommendation, in August of 2020, the special committee directed the Company’s advisor, with the assistance of the independent financial advisor of the special committee, to develop a plan of liquidation for approval by the board and submission to our stockholders. The Company initially expected to present a plan of liquidation for a vote of the stockholders of the Company within six months from its determination to pursue a liquidation strategy. However, as a result of the current adverse market conditions caused by the civil unrest and disruption in Portland and Chicago, where several of the Company’s properties are located, and the ongoing uncertainty and business disruptions related to the COVID-19 pandemic, the board believes it is in the best interest of the stockholders to delay any proposal to liquidate the Company. The Company remains committed to pursuing a liquidation strategy when market conditions improve. 26 Update on Strategic Alternatives
W W W . K B S . C O M 2021 Goals 27 Continue to evaluate the timing of our liquidation strategy Improve property cash flow through strategic leasing renewals with existing tenants and new leases for current vacant space Continue value enhancing capital projects to maintain the high level of occupancy
28 Q&A For additional questions, contact KBS Capital Markets Group Investor Relations (866) 527-4264
