Attached files
| file | filename |
|---|---|
| 8-K - 8-K - Trinseo S.A. | d97226d8k.htm |
| EX-99.1 - EX-99.1 - Trinseo S.A. | d97226dex991.htm |

Acquisition of Arkema’s PMMA Business December 14, 2020 Exhibit 99.2

Presenters & Disclosure Presenters Frank Bozich, President & CEO David Stasse, Executive Vice President & CFO Andy Myers, Director of Investor Relations Disclosure Rules Cautionary Note on Forward-Looking Statements. This presentation contains forward-looking statements including, without limitation, statements concerning plans, objectives, goals, projections, strategies, future events or performance, and underlying assumptions and other statements, which are not statements of historical facts or guarantees or assurances of future performance. Forward-looking statements may be identified by the use of words like “expect,” “anticipate,” “intend,” “forecast,” “outlook,” “will,” “may,” “might,” “see,” “tend,” “assume,” “potential,” “likely,” “target,” “plan,” “contemplate,” “seek,” “attempt,” “should,” “could,” “would” or expressions of similar meaning. Forward-looking statements reflect management’s evaluation of information currently available and are based on our current expectations and assumptions regarding the timing of the proposed acquisition of the Arkema MMA and PMMA business (the “Acquisition”); estimated and future results of operations, business strategies, competitive position, industry environment and potential growth opportunities and cost synergies relating to the Acquisition; the impact from the COVID-19 pandemic, our business, the economy and other future conditions. Because forward-looking statements relate to the future, they are subject to inherent uncertainties, risks and changes in circumstances that are difficult to predict. Factors that might cause such a difference include, but are not limited to, the occurrence of any event, change or other circumstances that could give rise to the termination of or failure to complete the Acquisition or the agreements and transactions contemplated thereby; our failure to meet the conditions to closing of the Acquisition, including those conditions related to antitrust, works council and other regulatory approvals; the failure to obtain the financing necessary, at terms acceptable to us, to fund the Acquisition; costs related to the proposed Acquisition and the impact of the substantial indebtedness to be incurred to finance the Acquisition; our ability, post-Acquisition, to meet our financial and strategic goals, due to, among other things, our ability to grow and manage growth profitability, maintain relationships with customers and retain key employees; the possibility that following the Acquisition we may be adversely affected by other economic, business, and/or competitive factors; our ability to successfully integrate the acquired businesses or generate expected cost savings and synergies from the Acquisition; the ongoing impact of the COVID-19 pandemic and those discussed in our Annual Report on Form 10-K, under Part I, Item 1A —“Risk Factors” and elsewhere in our other reports filed with the U.S. Securities and Exchange Commission. As a result of these or other factors, our actual results may differ materially from those contemplated by the forward-looking statements. Therefore, we caution you against relying on any of these forward-looking statements. The forward-looking statements included in this presentation are made only as of the date hereof. We undertake no obligation to publicly update or revise any forward-looking statement as a result of new information, future events or otherwise, except as otherwise required by law.
Use of non-GAAP measures In addition to using standard measures of performance and liquidity that are recognized in accordance with accounting principles generally accepted in the United States of America (“GAAP”), we use additional measures of income excluding certain GAAP items (“non-GAAP measures”) to explain Trinseo’s performance and liquidity, such as Adjusted Net Income, EBITDA, Adjusted EBITDA & Adjusted EBITDA margin, Adjusted EPS, Free Cash Flow, and Free Cash Flow Conversion. We believe these measures are useful for investors and management in evaluating business trends, performance, and liquidity each period. These measures are also used to manage our business and assess profitability, as well as to provide an appropriate basis to evaluate the effectiveness of our pricing strategies. Such measures are not recognized in accordance with GAAP and should not be viewed as an alternative to GAAP measures of performance and liquidity, as applicable. The definitions of each of these measures, further discussion of usefulness, and reconciliations of non-GAAP measures to GAAP measures are provided within the appendix herein. PMMA business financial information On December 14, 2020, Trinseo announced its entry into a binding offer with Arkema S.A. (“Arkema”), a leader in specialty chemicals, to acquire its polymethyl methacrylates (“PMMA”) and activated methyl methacrylates (“MMA”) businesses (together, referred to herein as the “PMMA business,” the “PMMA Acquisition,” or “PMMA”). The financial information of the PMMA business provided herein is unaudited and is derived from information provided to Trinseo by Arkema management in conjunction with ongoing due diligence procedures, with various Trinseo management adjustments also reflected. This information has not been conformed to the accounting principles (GAAP) and accounting policies followed by Trinseo. Further, the definitions of performance and liquidity measures of the PMMA business, such as EBITDA and Free Cash Flow, may not align with the definitions of Trinseo. As a result, it may be difficult to use these financial measures to compare the performance of the PMMA business and Trinseo’s performance. Disclosure (continued)
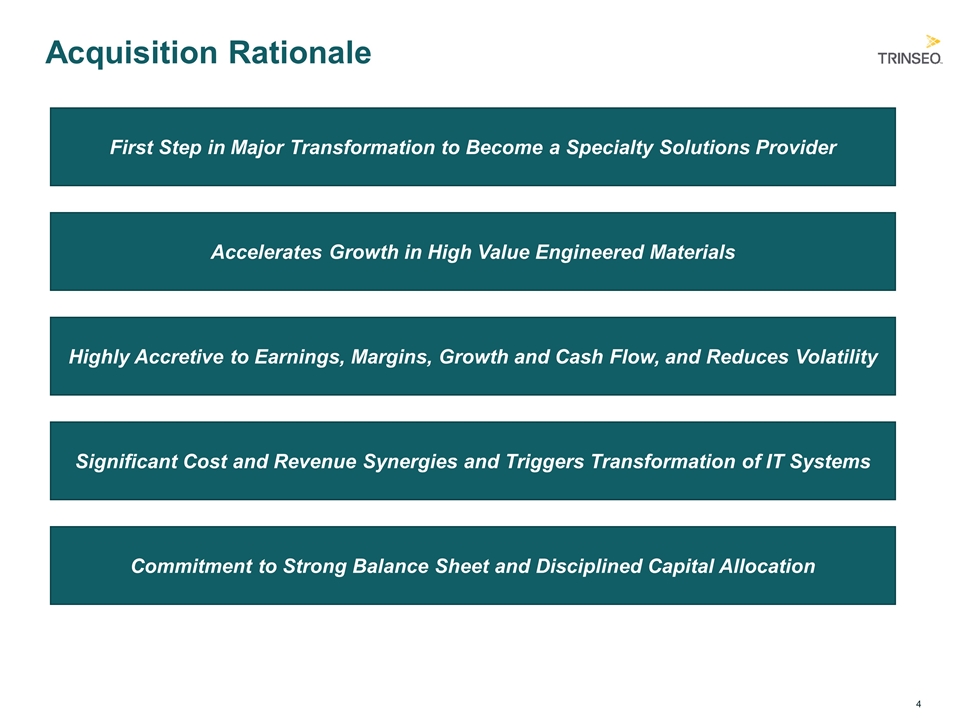
Acquisition Rationale First Step in Major Transformation to Become a Specialty Solutions Provider Accelerates Growth in High Value Engineered Materials Highly Accretive to Earnings, Margins, Growth and Cash Flow, and Reduces Volatility Significant Cost and Revenue Synergies and Triggers Transformation of IT Systems Commitment to Strong Balance Sheet and Disciplined Capital Allocation
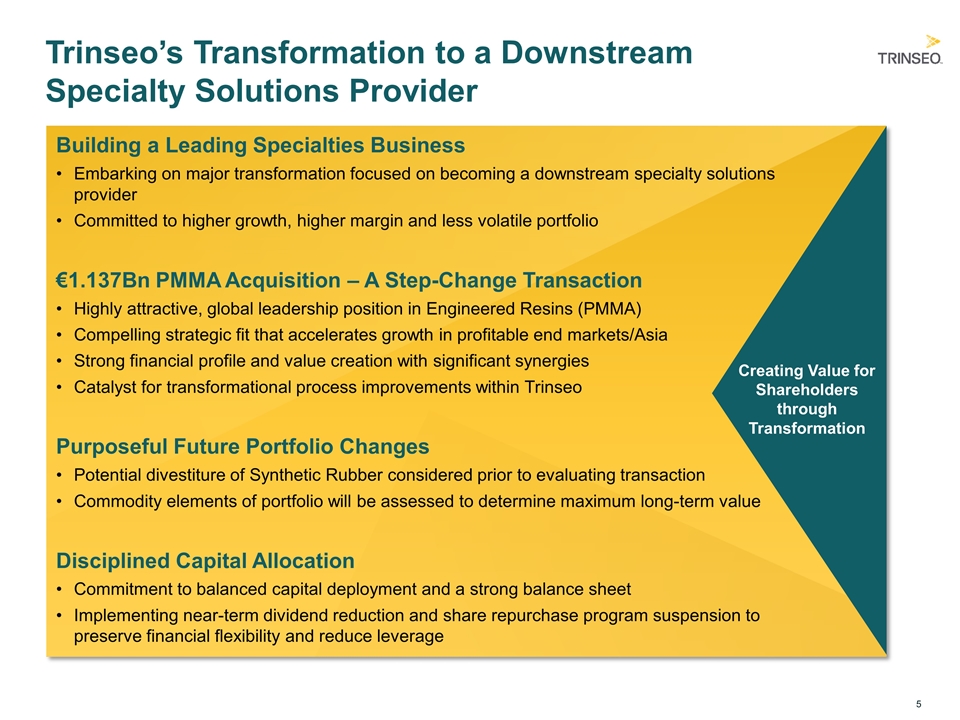
Trinseo’s Transformation to a Downstream Specialty Solutions Provider Building a Leading Specialties Business Embarking on major transformation focused on becoming a downstream specialty solutions provider Committed to higher growth, higher margin and less volatile portfolio €1.137Bn PMMA Acquisition – A Step-Change Transaction Highly attractive, global leadership position in Engineered Resins (PMMA) Compelling strategic fit that accelerates growth in profitable end markets/Asia Strong financial profile and value creation with significant synergies Catalyst for transformational process improvements within Trinseo Purposeful Future Portfolio Changes Potential divestiture of Synthetic Rubber considered prior to evaluating transaction Commodity elements of portfolio will be assessed to determine maximum long-term value Disciplined Capital Allocation Commitment to balanced capital deployment and a strong balance sheet Implementing near-term dividend reduction and share repurchase program suspension to preserve financial flexibility and reduce leverage Creating Value for Shareholders through Transformation
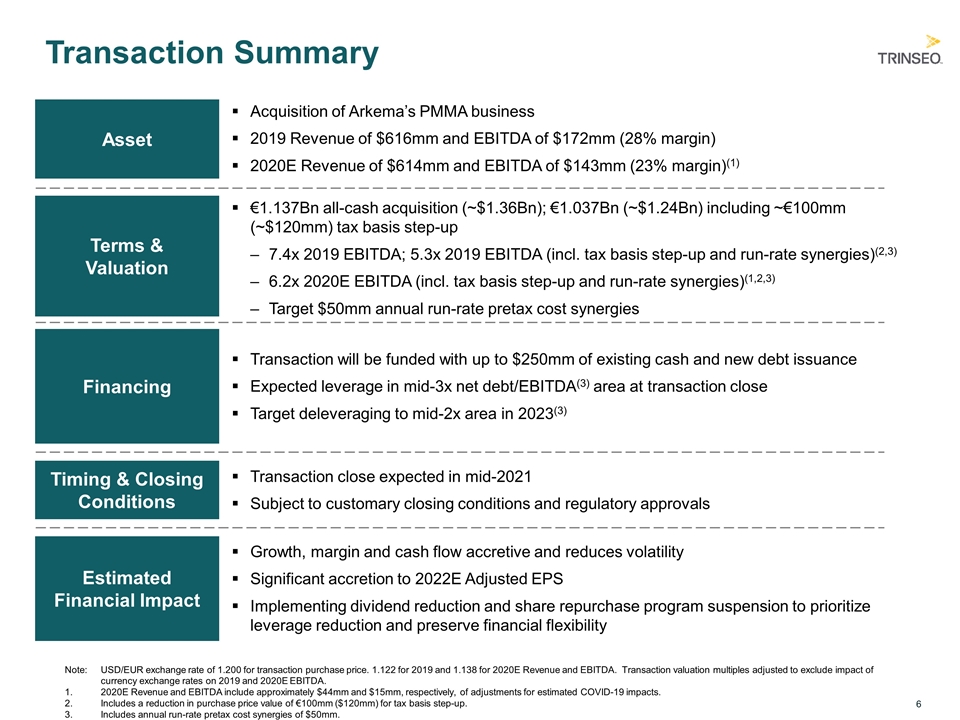
Transaction Summary Asset Terms & Valuation Financing Timing & Closing Conditions Estimated Financial Impact €1.137Bn all-cash acquisition (~$1.36Bn); €1.037Bn (~$1.24Bn) including ~€100mm (~$120mm) tax basis step-up 7.4x 2019 EBITDA; 5.3x 2019 EBITDA (incl. tax basis step-up and run-rate synergies)(2,3) 6.2x 2020E EBITDA (incl. tax basis step-up and run-rate synergies)(1,2,3) Target $50mm annual run-rate pretax cost synergies Transaction will be funded with up to $250mm of existing cash and new debt issuance Expected leverage in mid-3x net debt/EBITDA(3) area at transaction close Target deleveraging to mid-2x area in 2023(3) Transaction close expected in mid-2021 Subject to customary closing conditions and regulatory approvals Growth, margin and cash flow accretive and reduces volatility Significant accretion to 2022E Adjusted EPS Implementing dividend reduction and share repurchase program suspension to prioritize leverage reduction and preserve financial flexibility Acquisition of Arkema’s PMMA business 2019 Revenue of $616mm and EBITDA of $172mm (28% margin) 2020E Revenue of $614mm and EBITDA of $143mm (23% margin)(1) Note: USD/EUR exchange rate of 1.200 for transaction purchase price. 1.122 for 2019 and 1.138 for 2020E Revenue and EBITDA. Transaction valuation multiples adjusted to exclude impact of currency exchange rates on 2019 and 2020E EBITDA. 2020E Revenue and EBITDA include approximately $44mm and $15mm, respectively, of adjustments for estimated COVID-19 impacts. Includes a reduction in purchase price value of €100mm ($120mm) for tax basis step-up. Includes annual run-rate pretax cost synergies of $50mm.
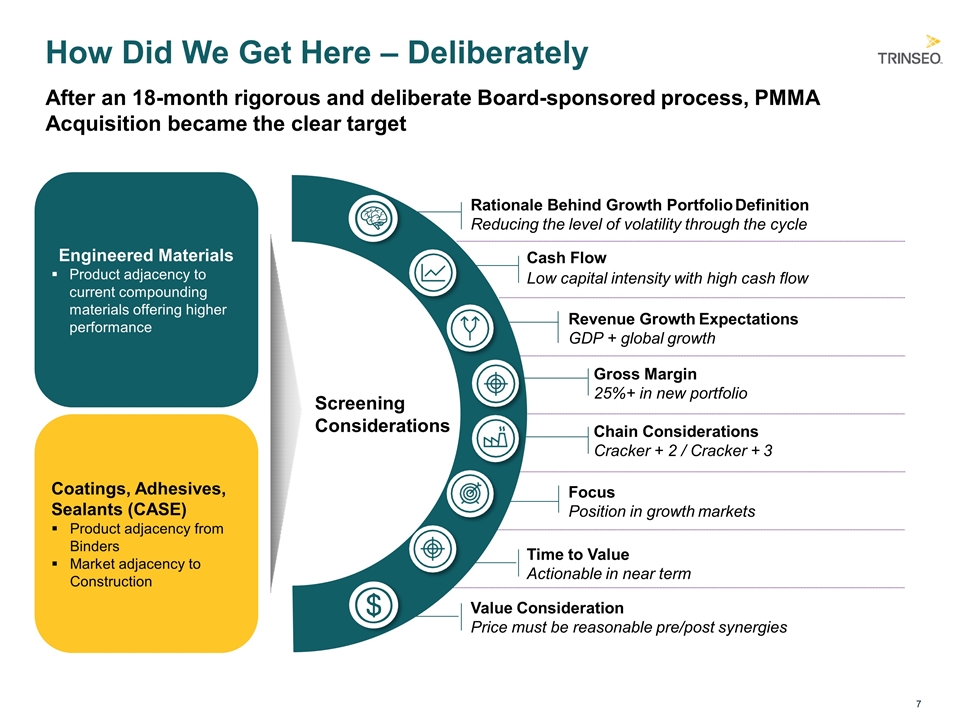
How Did We Get Here – Deliberately Engineered Materials Product adjacency to current compounding materials offering higher performance Coatings, Adhesives, Sealants (CASE) Product adjacency from Binders Market adjacency to Construction Screening Considerations Rationale Behind Growth Portfolio Definition Reducing the level of volatility through the cycle Gross Margin 25%+ in new portfolio Revenue Growth Expectations GDP + global growth Chain Considerations Cracker + 2 / Cracker + 3 Focus Position in growth markets Time to Value Actionable in near term After an 18-month rigorous and deliberate Board-sponsored process, PMMA Acquisition became the clear target Value Consideration Price must be reasonable pre/post synergies Cash Flow Low capital intensity with high cash flow
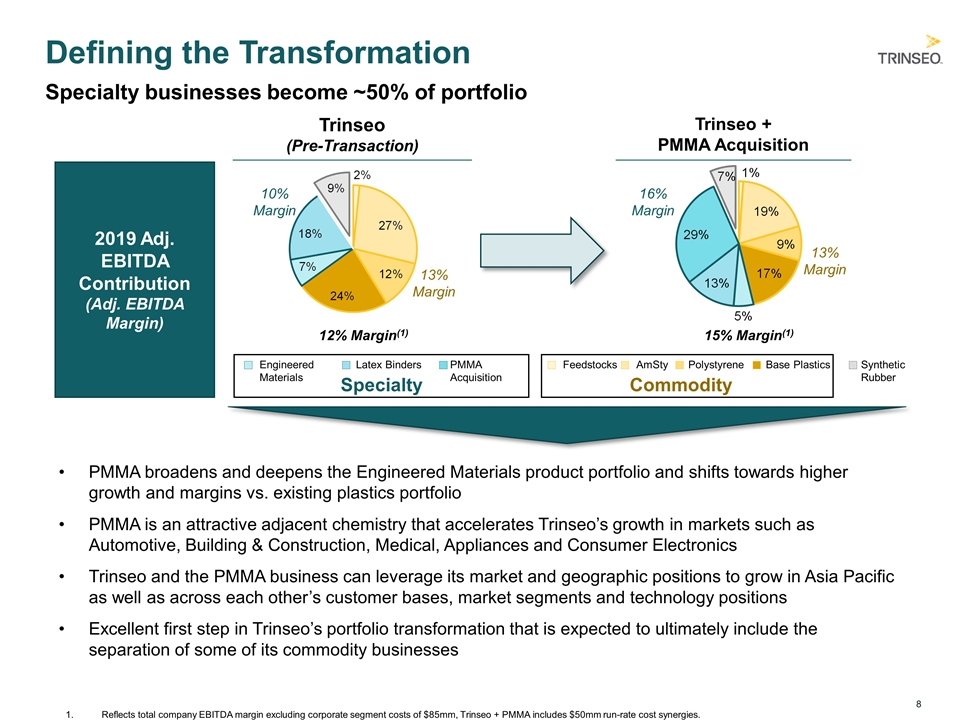
Defining the Transformation Specialty businesses become ~50% of portfolio 2019 Adj. EBITDA Contribution (Adj. EBITDA Margin) Trinseo (Pre-Transaction) 12% Margin(1) PMMA broadens and deepens the Engineered Materials product portfolio and shifts towards higher growth and margins vs. existing plastics portfolio PMMA is an attractive adjacent chemistry that accelerates Trinseo’s growth in markets such as Automotive, Building & Construction, Medical, Appliances and Consumer Electronics Trinseo and the PMMA business can leverage its market and geographic positions to grow in Asia Pacific as well as across each other’s customer bases, market segments and technology positions Excellent first step in Trinseo’s portfolio transformation that is expected to ultimately include the separation of some of its commodity businesses Reflects total company EBITDA margin excluding corporate segment costs of $85mm, Trinseo + PMMA includes $50mm run-rate cost synergies. Specialty Commodity Engineered Materials Latex Binders PMMA Acquisition Feedstocks Polystyrene Base Plastics Synthetic Rubber AmSty 15% Margin(1) Trinseo + PMMA Acquisition 10% Margin 13% Margin 16% Margin 13% Margin
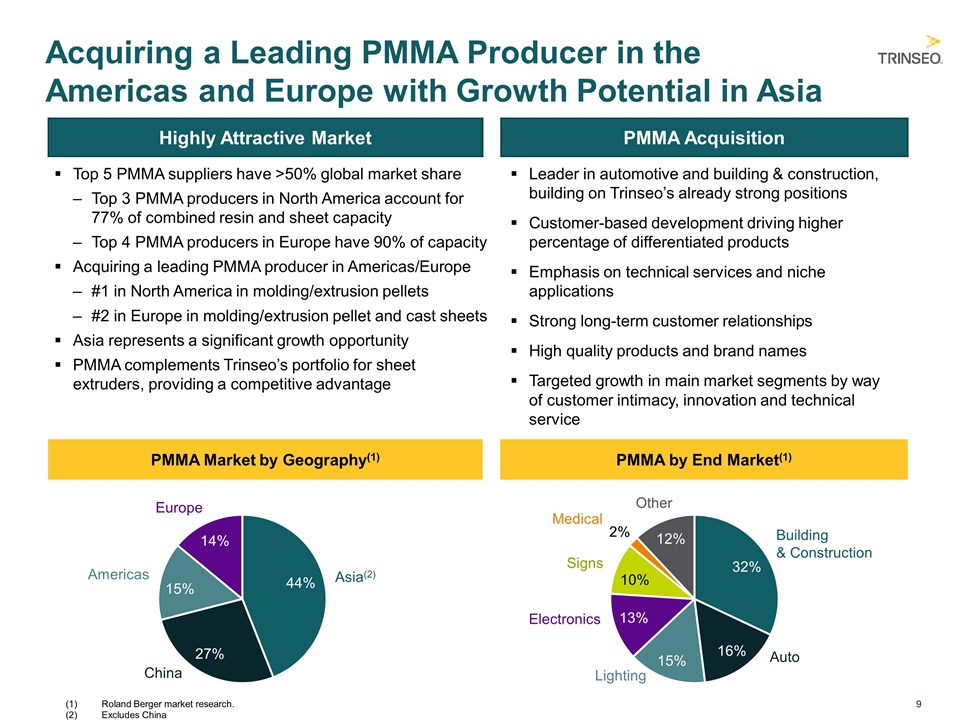
Acquiring a Leading PMMA Producer in the Americas and Europe with Growth Potential in Asia Highly Attractive Market PMMA Acquisition Top 5 PMMA suppliers have >50% global market share Top 3 PMMA producers in North America account for 77% of combined resin and sheet capacity Top 4 PMMA producers in Europe have 90% of capacity Acquiring a leading PMMA producer in Americas/Europe #1 in North America in molding/extrusion pellets #2 in Europe in molding/extrusion pellet and cast sheets Asia represents a significant growth opportunity PMMA complements Trinseo’s portfolio for sheet extruders, providing a competitive advantage Leader in automotive and building & construction, building on Trinseo’s already strong positions Customer-based development driving higher percentage of differentiated products Emphasis on technical services and niche applications Strong long-term customer relationships High quality products and brand names Targeted growth in main market segments by way of customer intimacy, innovation and technical service PMMA Market by Geography(1) PMMA by End Market(1) Building & Construction Auto Lighting Electronics Signs Medical Other Asia(2) China Americas Europe (1)Roland Berger market research. (2)Excludes China
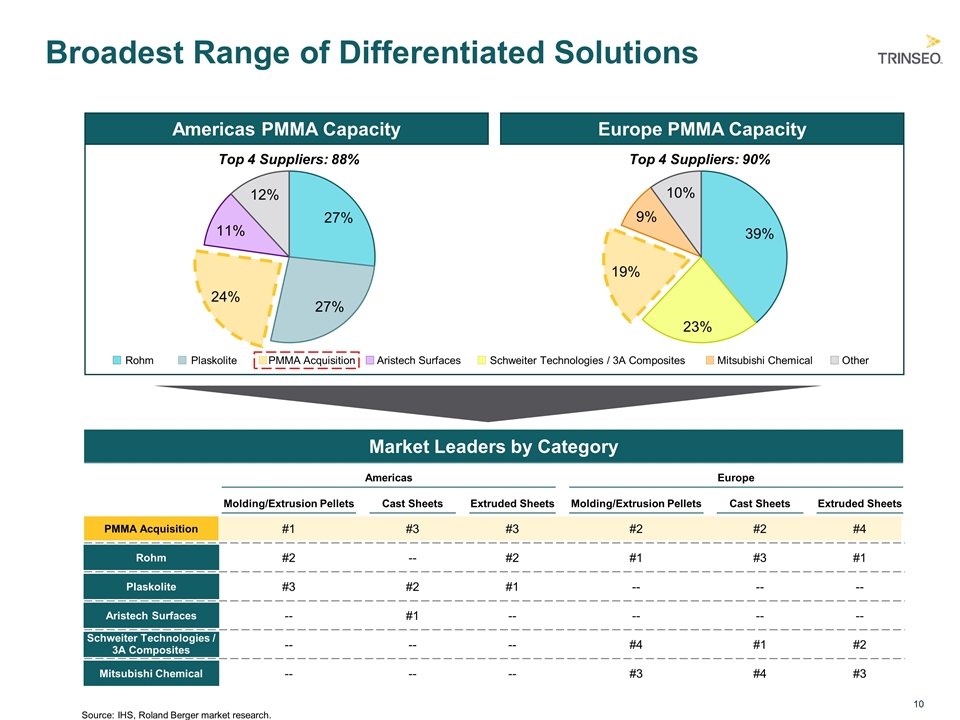
Broadest Range of Differentiated Solutions Americas PMMA Capacity Europe PMMA Capacity Rohm Plaskolite Mitsubishi Chemical Schweiter Technologies / 3A Composites Aristech Surfaces PMMA Acquisition Other Top 4 Suppliers: 88% Top 4 Suppliers: 90% Market Leaders by Category Molding/Extrusion Pellets #1 PMMA Acquisition Americas Rohm Plaskolite Aristech Surfaces Schweiter Technologies / 3A Composites Mitsubishi Chemical Extruded Sheets Cast Sheets Molding/Extrusion Pellets Extruded Sheets Cast Sheets Europe #3 #3 #2 #2 #4 #2 -- #2 #1 #3 #1 #3 #2 #1 -- -- -- -- #1 -- -- -- -- -- -- -- #4 #1 #2 -- -- -- #3 #4 #3 Source:IHS, Roland Berger market research.
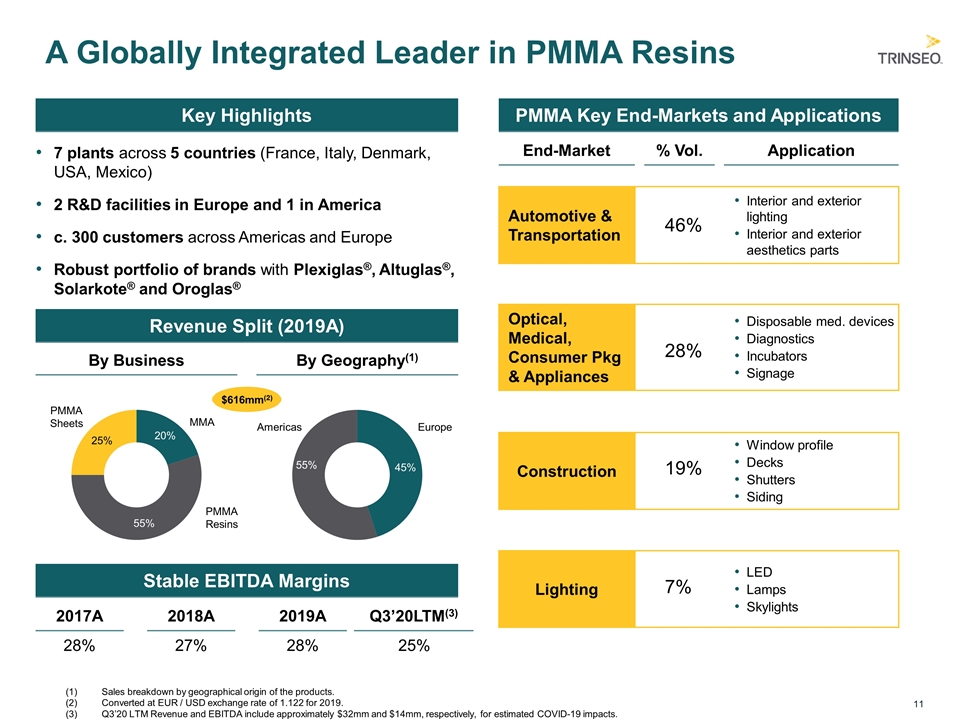
A Globally Integrated Leader in PMMA Resins $616mm(2) 7 plants across 5 countries (France, Italy, Denmark, USA, Mexico) 2 R&D facilities in Europe and 1 in America c. 300 customers across Americas and Europe Robust portfolio of brands with Plexiglas®, Altuglas®, Solarkote® and Oroglas® Key Highlights PMMA Key End-Markets and Applications Revenue Split (2019A) By Business By Geography(1) Sales breakdown by geographical origin of the products. Converted at EUR / USD exchange rate of 1.122 for 2019. Q3’20 LTM Revenue and EBITDA include approximately $32mm and $14mm, respectively, for estimated COVID-19 impacts. MMA PMMA Resins PMMA Sheets Europe Americas End-Market Application % Vol. Window profile Decks Shutters Siding Construction 19% Disposable med. devices Diagnostics Incubators Signage Optical, Medical, Consumer Pkg & Appliances 28% LED Lamps Skylights Lighting 7% Interior and exterior lighting Interior and exterior aesthetics parts Automotive & Transportation 46% Stable EBITDA Margins 2017A 28% 2018A 2019A Q3’20LTM(3) 27% 28% 25%
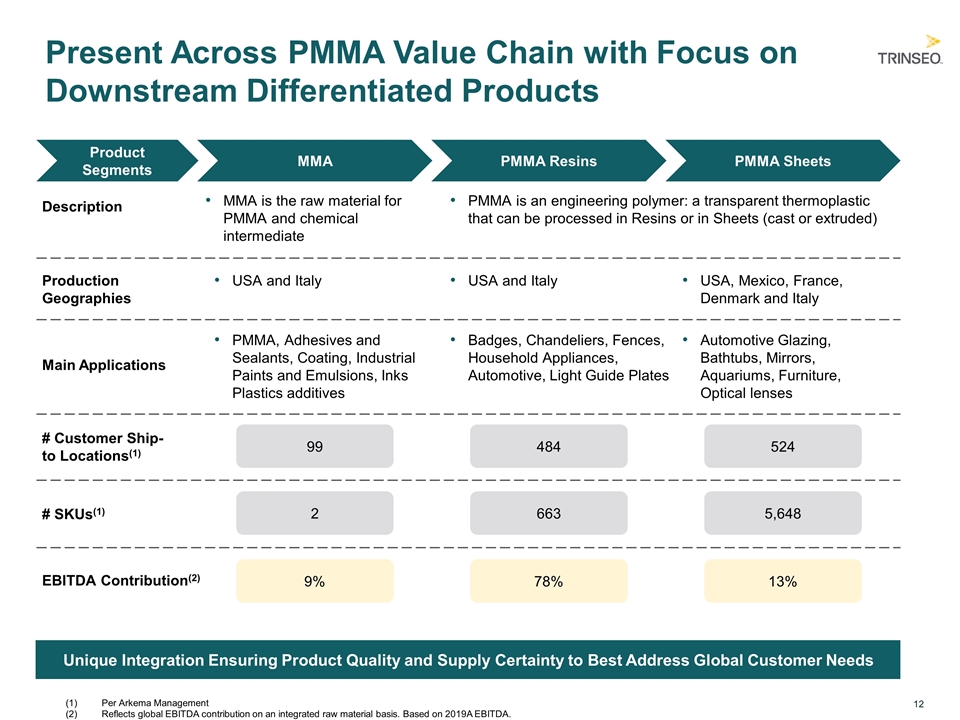
Present Across PMMA Value Chain with Focus on Downstream Differentiated Products Unique Integration Ensuring Product Quality and Supply Certainty to Best Address Global Customer Needs Product Segments MMA PMMA Resins PMMA Sheets Description MMA is the raw material for PMMA and chemical intermediate PMMA is an engineering polymer: a transparent thermoplastic that can be processed in Resins or in Sheets (cast or extruded) Production Geographies USA and Italy USA, Mexico, France, Denmark and Italy USA and Italy Main Applications PMMA, Adhesives and Sealants, Coating, Industrial Paints and Emulsions, Inks Plastics additives Badges, Chandeliers, Fences, Household Appliances, Automotive, Light Guide Plates Automotive Glazing, Bathtubs, Mirrors, Aquariums, Furniture, Optical lenses # Customer Ship-to Locations(1) 99 # SKUs(1) 484 524 2 663 5,648 EBITDA Contribution(2) 9% 78% 13% Per Arkema Management Reflects global EBITDA contribution on an integrated raw material basis. Based on 2019A EBITDA.
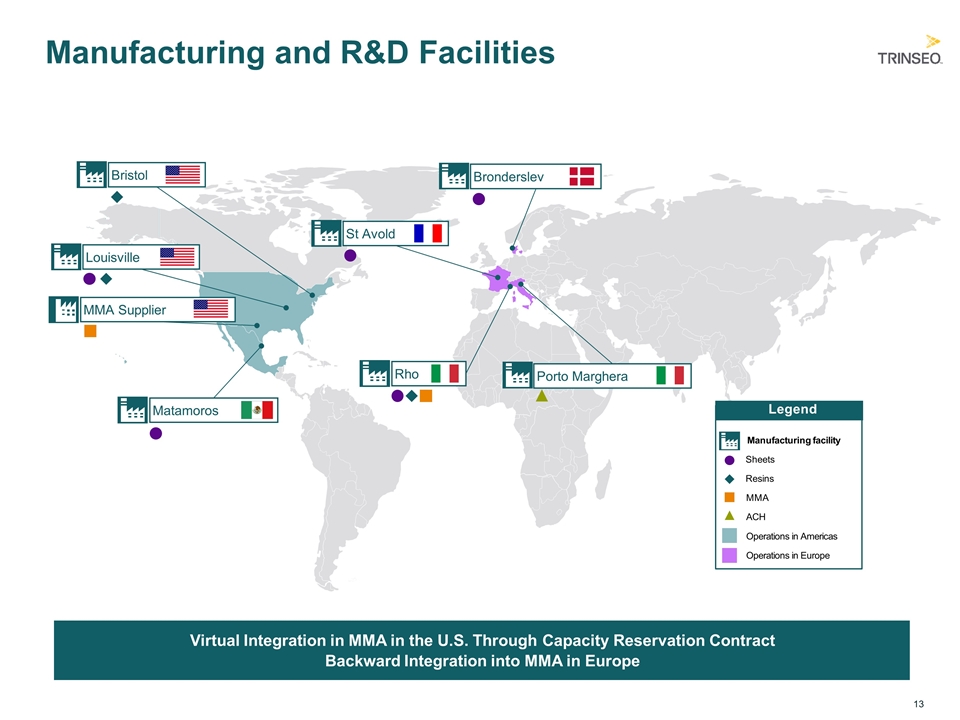
Manufacturing and R&D Facilities Virtual Integration in MMA in the U.S. Through Capacity Reservation Contract Backward Integration into MMA in Europe MMA Supplier Matamoros Louisville Bristol Bronderslev St Avold Porto Marghera Rho Manufacturing facility Sheets Resins MMA ACH Operations in Americas Operations in Europe Legend
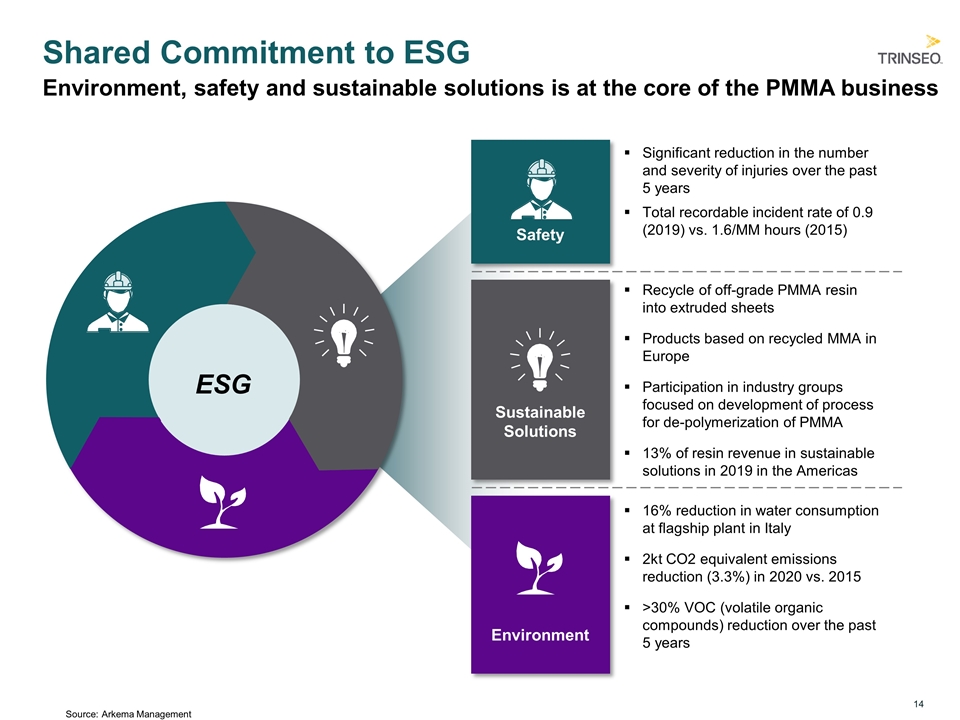
Environment Safety Significant reduction in the number and severity of injuries over the past 5 years Total recordable incident rate of 0.9 (2019) vs. 1.6/MM hours (2015) Shared Commitment to ESG Recycle of off-grade PMMA resin into extruded sheets Products based on recycled MMA in Europe Participation in industry groups focused on development of process for de-polymerization of PMMA 13% of resin revenue in sustainable solutions in 2019 in the Americas Sustainable Solutions 16% reduction in water consumption at flagship plant in Italy 2kt CO2 equivalent emissions reduction (3.3%) in 2020 vs. 2015 >30% VOC (volatile organic compounds) reduction over the past 5 years Environment, safety and sustainable solutions is at the core of the PMMA business ESG Source:Arkema Management
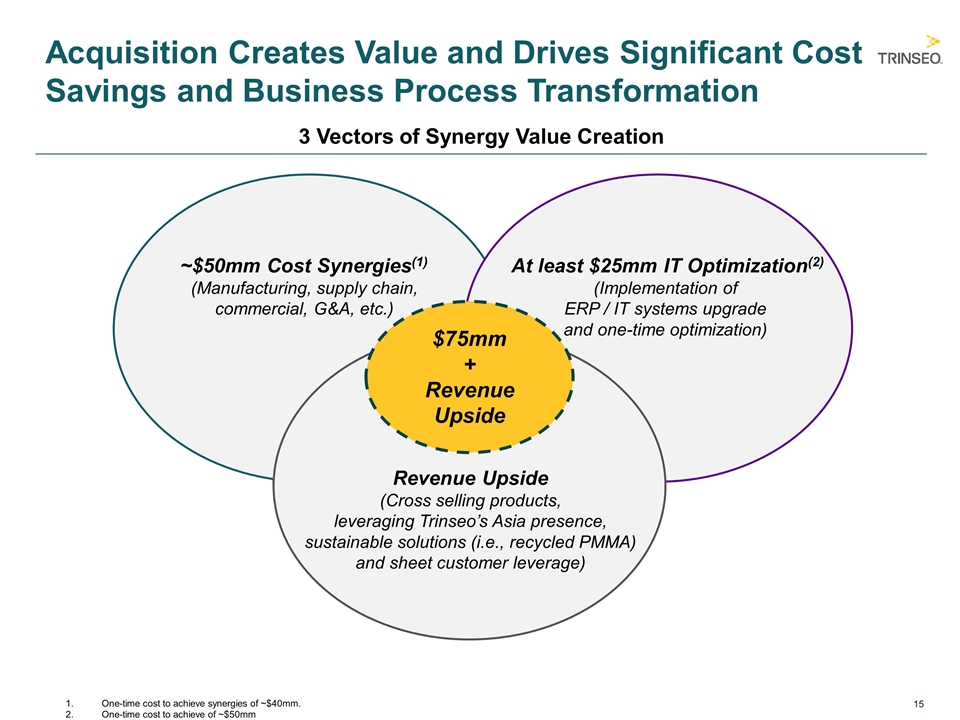
Acquisition Creates Value and Drives Significant Cost Savings and Business Process Transformation 3 Vectors of Synergy Value Creation ~$50mm Cost Synergies(1) (Manufacturing, supply chain, commercial, G&A, etc.) At least $25mm IT Optimization(2) (Implementation of ERP / IT systems upgrade and one-time optimization) Revenue Upside (Cross selling products, leveraging Trinseo’s Asia presence, sustainable solutions (i.e., recycled PMMA) and sheet customer leverage) $75mm + Revenue Upside One-time cost to achieve synergies of ~$40mm. One-time cost to achieve of ~$50mm
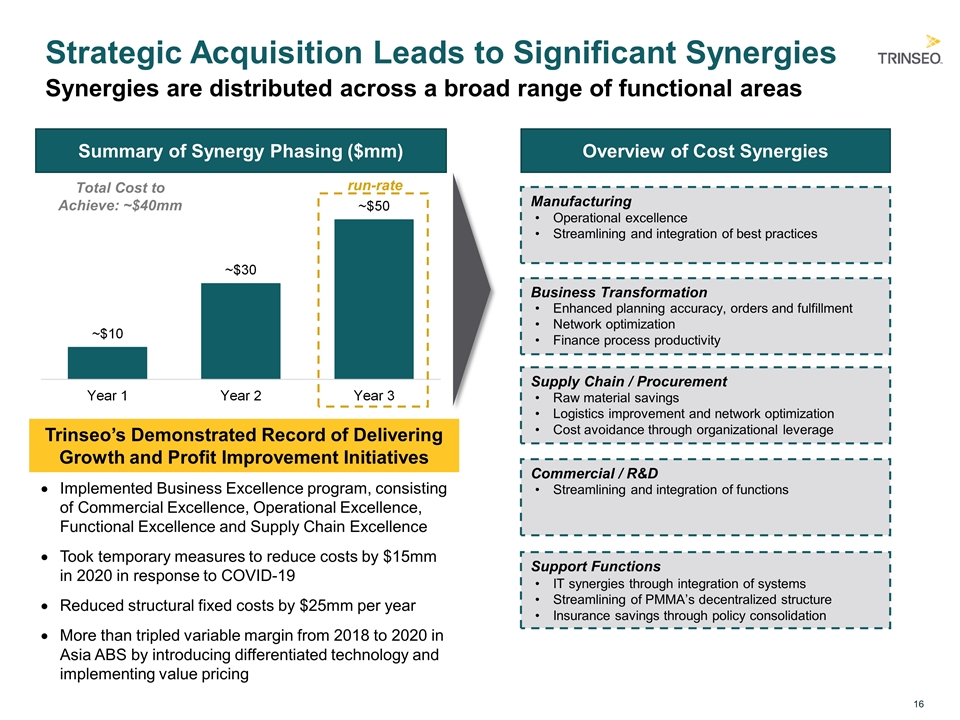
Strategic Acquisition Leads to Significant Synergies Summary of Synergy Phasing ($mm) Overview of Cost Synergies run-rate Manufacturing Business Transformation Supply Chain / Procurement Commercial / R&D Support Functions Operational excellence Streamlining and integration of best practices Enhanced planning accuracy, orders and fulfillment Network optimization Finance process productivity Raw material savings Logistics improvement and network optimization Cost avoidance through organizational leverage Streamlining and integration of functions IT synergies through integration of systems Streamlining of PMMA’s decentralized structure Insurance savings through policy consolidation Total Cost to Achieve: ~$40mm Synergies are distributed across a broad range of functional areas Trinseo’s Demonstrated Record of Delivering Growth and Profit Improvement Initiatives Implemented Business Excellence program, consisting of Commercial Excellence, Operational Excellence, Functional Excellence and Supply Chain Excellence Took temporary measures to reduce costs by $15mm in 2020 in response to COVID-19 Reduced structural fixed costs by $25mm per year More than tripled variable margin from 2018 to 2020 in Asia ABS by introducing differentiated technology and implementing value pricing
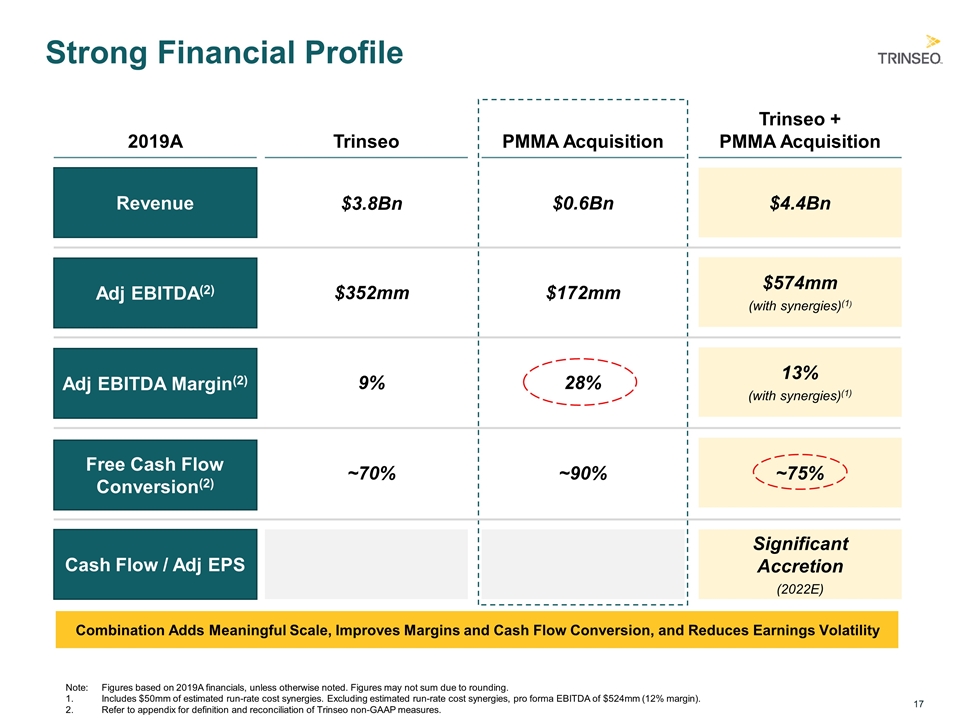
Strong Financial Profile Note:Figures based on 2019A financials, unless otherwise noted. Figures may not sum due to rounding. Includes $50mm of estimated run-rate cost synergies. Excluding estimated run-rate cost synergies, pro forma EBITDA of $524mm (12% margin). Refer to appendix for definition and reconciliation of Trinseo non-GAAP measures. Combination Adds Meaningful Scale, Improves Margins and Cash Flow Conversion, and Reduces Earnings Volatility 2019A Trinseo PMMA Acquisition Trinseo + PMMA Acquisition Revenue $3.8Bn $0.6Bn $4.4Bn Adj EBITDA(2) $352mm $172mm $574mm (with synergies)(1) Adj EBITDA Margin(2) 9% 28% 13% (with synergies)(1) Cash Flow / Adj EPS Significant Accretion (2022E) Free Cash Flow Conversion(2) ~70% ~90% ~75%
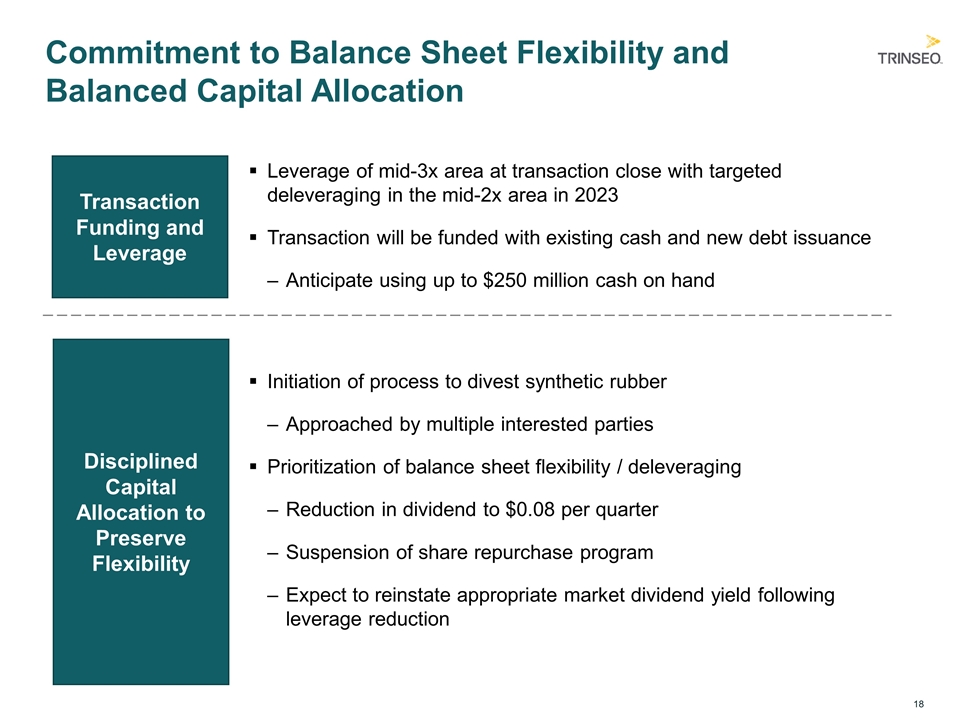
Commitment to Balance Sheet Flexibility and Balanced Capital Allocation Leverage of mid-3x area at transaction close with targeted deleveraging in the mid-2x area in 2023 Transaction will be funded with existing cash and new debt issuance Anticipate using up to $250 million cash on hand Transaction Funding and Leverage Disciplined Capital Allocation to Preserve Flexibility Initiation of process to divest synthetic rubber Approached by multiple interested parties Prioritization of balance sheet flexibility / deleveraging Reduction in dividend to $0.08 per quarter Suspension of share repurchase program Expect to reinstate appropriate market dividend yield following leverage reduction
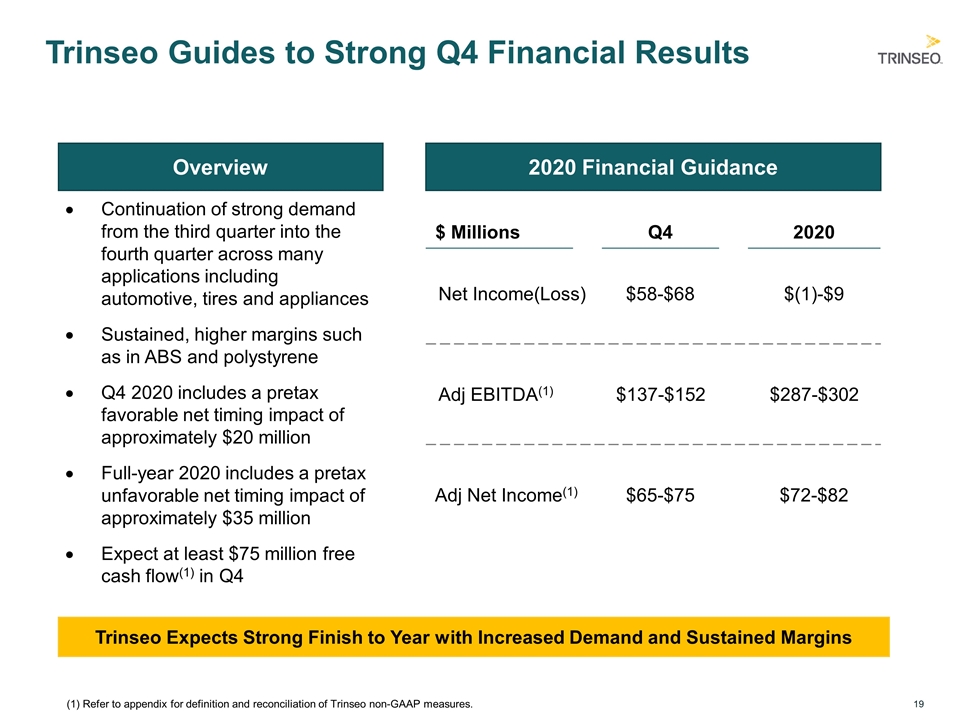
Trinseo Guides to Strong Q4 Financial Results Overview Continuation of strong demand from the third quarter into the fourth quarter across many applications including automotive, tires and appliances Sustained, higher margins such as in ABS and polystyrene Q4 2020 includes a pretax favorable net timing impact of approximately $20 million Full-year 2020 includes a pretax unfavorable net timing impact of approximately $35 million Expect at least $75 million free cash flow(1) in Q4 $ Millions 2020 Q4 Adj EBITDA(1) $137-$152 $287-$302 Adj Net Income(1) $72-$82 $65-$75 Trinseo Expects Strong Finish to Year with Increased Demand and Sustained Margins 2020 Financial Guidance Net Income(Loss) $58-$68 $(1)-$9 (1) Refer to appendix for definition and reconciliation of Trinseo non-GAAP measures.
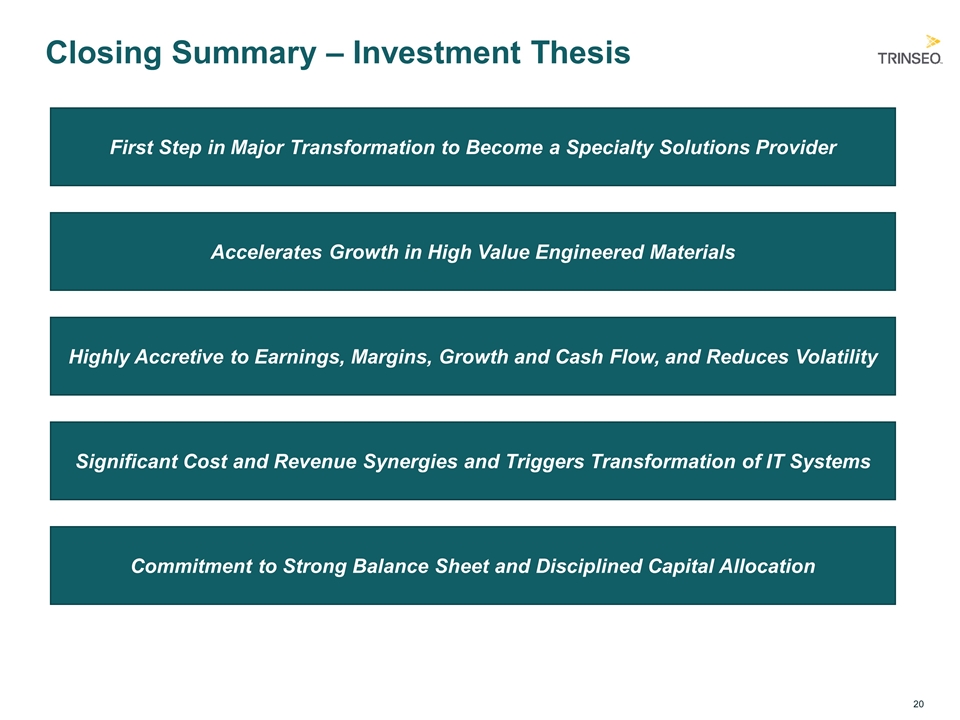
Closing Summary – Investment Thesis First Step in Major Transformation to Become a Specialty Solutions Provider Accelerates Growth in High Value Engineered Materials Highly Accretive to Earnings, Margins, Growth and Cash Flow, and Reduces Volatility Significant Cost and Revenue Synergies and Triggers Transformation of IT Systems Commitment to Strong Balance Sheet and Disciplined Capital Allocation

Appendix
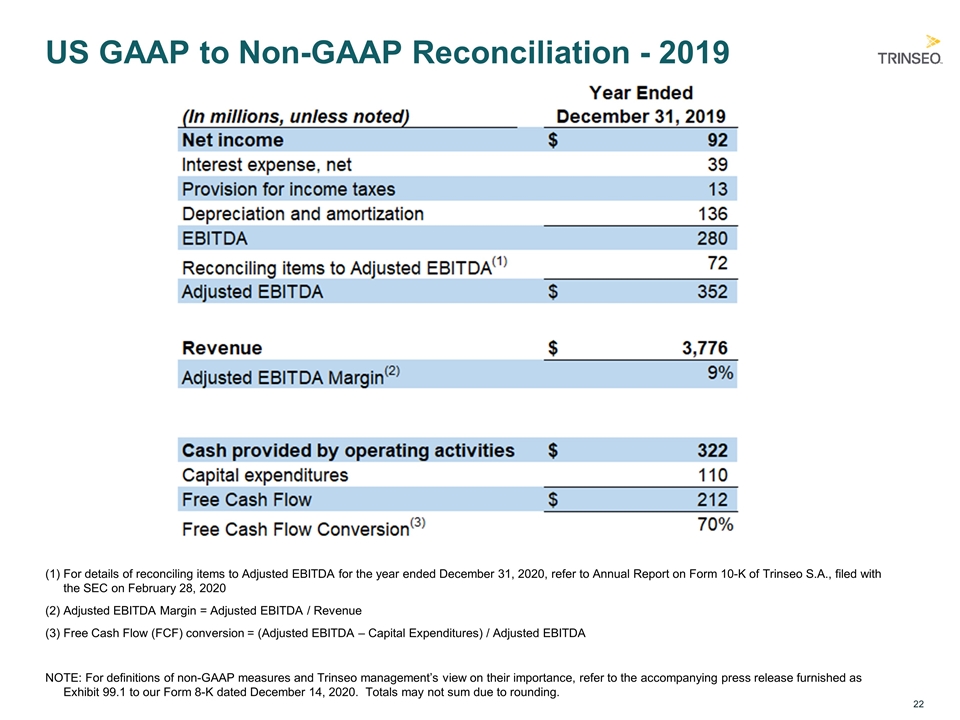
US GAAP to Non-GAAP Reconciliation - 2019 (1) For details of reconciling items to Adjusted EBITDA for the year ended December 31, 2020, refer to Annual Report on Form 10-K of Trinseo S.A., filed with the SEC on February 28, 2020 (2) Adjusted EBITDA Margin = Adjusted EBITDA / Revenue (3) Free Cash Flow (FCF) conversion = (Adjusted EBITDA – Capital Expenditures) / Adjusted EBITDA NOTE: For definitions of non-GAAP measures and Trinseo management’s view on their importance, refer to the accompanying press release furnished as Exhibit 99.1 to our Form 8-K dated December 14, 2020. Totals may not sum due to rounding.
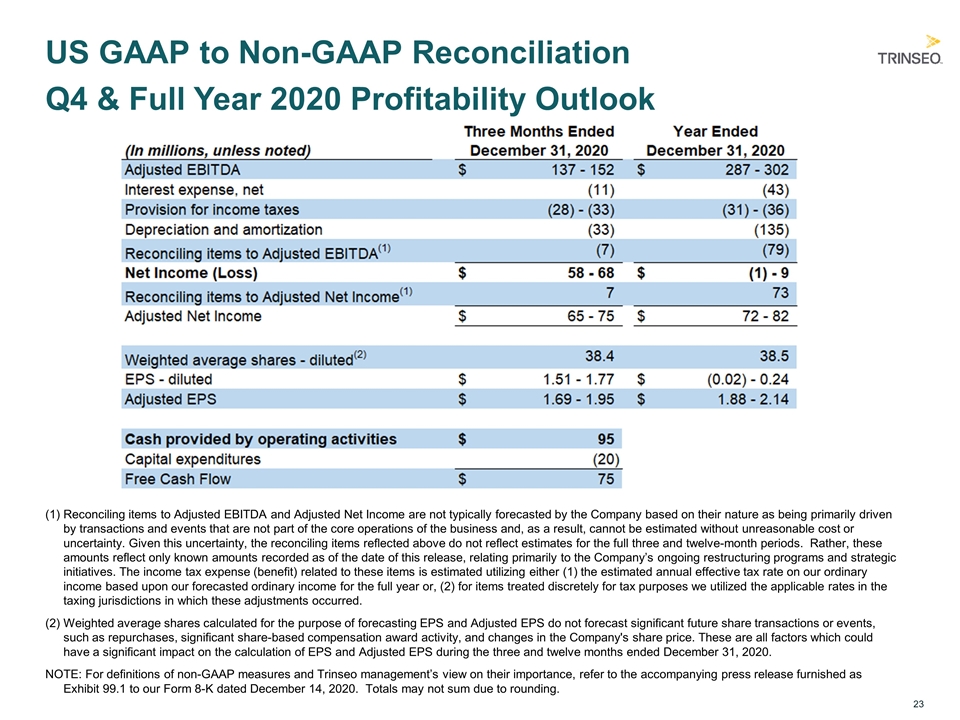
US GAAP to Non-GAAP Reconciliation Q4 & Full Year 2020 Profitability Outlook (1) Reconciling items to Adjusted EBITDA and Adjusted Net Income are not typically forecasted by the Company based on their nature as being primarily driven by transactions and events that are not part of the core operations of the business and, as a result, cannot be estimated without unreasonable cost or uncertainty. Given this uncertainty, the reconciling items reflected above do not reflect estimates for the full three and twelve-month periods. Rather, these amounts reflect only known amounts recorded as of the date of this release, relating primarily to the Company’s ongoing restructuring programs and strategic initiatives. The income tax expense (benefit) related to these items is estimated utilizing either (1) the estimated annual effective tax rate on our ordinary income based upon our forecasted ordinary income for the full year or, (2) for items treated discretely for tax purposes we utilized the applicable rates in the taxing jurisdictions in which these adjustments occurred. (2) Weighted average shares calculated for the purpose of forecasting EPS and Adjusted EPS do not forecast significant future share transactions or events, such as repurchases, significant share-based compensation award activity, and changes in the Company's share price. These are all factors which could have a significant impact on the calculation of EPS and Adjusted EPS during the three and twelve months ended December 31, 2020. NOTE: For definitions of non-GAAP measures and Trinseo management’s view on their importance, refer to the accompanying press release furnished as Exhibit 99.1 to our Form 8-K dated December 14, 2020. Totals may not sum due to rounding.
