Attached files
| file | filename |
|---|---|
| EX-99.1 - EXHIBIT 99.1 - HUNTINGTON BANCSHARES INC /MD/ | brhc10017933_ex99-1.htm |
| 8-K - 8-K - HUNTINGTON BANCSHARES INC /MD/ | brhc10017933_form8k.htm |
Exhibit 99.2

December 14, 2020 Delivering Value, Driving Long-Term Growth
Disclaimer CAUTION REGARDING FORWARD-LOOKING STATEMENTSThis communication may contain certain
forward-looking statements, including, but not limited to, certain plans, expectations, goals, projections, and statements about the benefits of the proposed transaction, the plans, objectives, expectations and intentions of Huntington and
TCF, the expected timing of completion of the transaction, and other statements that are not historical facts. Such statements are subject to numerous assumptions, risks, and uncertainties. Statements that do not describe historical or
current facts, including statements about beliefs and expectations, are forward-looking statements. Forward-looking statements may be identified by words such as expect, anticipate, believe, intend, estimate, plan, target, goal, or similar
expressions, or future or conditional verbs such as will, may, might, should, would, could, or similar variations. The forward-looking statements are intended to be subject to the safe harbor provided by Section 27A of the Securities Act of
1933, Section 21E of the Securities Exchange Act of 1934, and the Private Securities Litigation Reform Act of 1995.While there is no assurance that any list of risks and uncertainties or risk factors is complete, below are certain factors
which could cause actual results to differ materially from those contained or implied in the forward-looking statements: changes in general economic, political, or industry conditions; the magnitude and duration of the COVID-19 pandemic and
its impact on the global economy and financial market conditions and our business, results of operations, and financial condition; uncertainty in U.S. fiscal and monetary policy, including the interest rate policies of the Federal Reserve
Board; volatility and disruptions in global capital and credit markets; movements in interest rates; reform of LIBOR; competitive pressures on product pricing and services; success, impact, and timing of our business strategies, including
market acceptance of any new products or services including those implementing our “Fair Play” banking philosophy; the nature, extent, timing, and results of governmental actions, examinations, reviews, reforms, regulations, and
interpretations, including those related to the Dodd-Frank Wall Street Reform and Consumer Protection Act and the Basel III regulatory capital reforms, as well as those involving the OCC, Federal Reserve, FDIC, and CFPB; the occurrence of any
event, change or other circumstances that could give rise to the right of one or both of the parties to terminate the merger agreement between Huntington and TCF; the outcome of any legal proceedings that may be instituted against Huntington
or TCF; delays in completing the transaction; the failure to obtain necessary regulatory approvals (and the risk that such approvals may result in the imposition of conditions that could adversely affect the combined company or the expected
benefits of the transaction); the failure to obtain shareholder approvals or to satisfy any of the other conditions to the transaction on a timely basis or at all; the possibility that the anticipated benefits of the transaction are not
realized when expected or at all, including as a result of the impact of, or problems arising from, the integration of the two companies or as a result of the strength of the economy and competitive factors in the areas where Huntington and
TCF do business; the possibility that the transaction may be more expensive to complete than anticipated, including as a result of unexpected factors or events; diversion of management’s attention from ongoing business operations and
opportunities; potential adverse reactions or changes to business or employee relationships, including those resulting from the announcement or completion of the transaction; the ability to complete the transaction and integration of
Huntington and TCF successfully; the dilution caused by Huntington’s issuance of additional shares of its capital stock in connection with the transaction; and other factors that may affect the future results of Huntington and TCF.
Additional factors that could cause results to differ materially from those described above can be found in Huntington’s Annual Report on Form 10-K for the year ended December 31, 2019 and in its subsequent Quarterly Reports on Form 10-Q,
including for the quarter ended September 30, 2020, each of which is on file with the Securities and Exchange Commission (the “SEC”) and available in the “Investor Relations” section of Huntington’s website, http://www.huntington.com, under
the heading “Publications and Filings” and in other documents Huntington files with the SEC, and in TCF’s Annual Report on Form 10-K for the year ended December 31, 2019 and in its subsequent Quarterly Reports on Form 10-Q, including for the
quarter ended September 30, 2020, each of which is on file with the SEC and available on TCF’s investor relations website, ir.tcfbank.com, under the heading “Financial Information” and in other documents TCF files with the SEC.All
forward-looking statements speak only as of the date they are made and are based on information available at that time. Neither Huntington nor TCF assumes any obligation to update forward-looking statements to reflect circumstances or events
that occur after the date the forward-looking statements were made or to reflect the occurrence of unanticipated events except as required by federal securities laws. As forward-looking statements involve significant risks and uncertainties,
caution should be exercised against placing undue reliance on such statements.IMPORTANT ADDITIONAL INFORMATIONIn connection with the proposed transaction, Huntington will file with the SEC a Registration Statement on Form S-4 that will
include a Joint Proxy Statement of Huntington and TCF and a Prospectus of Huntington, as well as other relevant documents concerning the proposed transaction. The proposed transaction involving Huntington and TCF will be submitted to TCF’s
shareholders and Huntington’s shareholders for their consideration. This communication does not constitute an offer to sell or the solicitation of an offer to buy any securities or a solicitation of any vote or approval, nor shall there be
any sale of securities in any jurisdiction in which such offer, solicitation or sale would be unlawful prior to registration or qualification under the securities laws of any such jurisdiction. INVESTORS AND SHAREHOLDERS OF HUNTINGTON AND
SHAREHOLDERS OF TCF ARE URGED TO READ THE REGISTRATION STATEMENT AND THE JOINT PROXY STATEMENT/PROSPECTUS REGARDING THE TRANSACTION WHEN IT BECOMES AVAILABLE AND ANY OTHER RELEVANT DOCUMENTS FILED WITH THE SEC, AS WELL AS ANY AMENDMENTS OR
SUPPLEMENTS TO THOSE DOCUMENTS, BECAUSE THEY WILL CONTAIN IMPORTANT INFORMATION. Shareholders will be able to obtain a free copy of the definitive joint proxy statement/prospectus, as well as other filings containing information about
Huntington and TCF, without charge, at the SEC’s website http://www.sec.gov. Copies of the joint proxy statement/prospectus and the filings with the SEC that will be incorporated by reference in the joint proxy statement/prospectus can also
be obtained, without charge, by directing a request to Huntington Investor Relations, Huntington Bancshares Incorporated, Huntington Center, HC0935, 41 South High Street, Columbus, Ohio 43287, (800) 576-5007 or to TCF Investor Relations, TCF
Financial Corporation, 333 W. Fort Street, Suite 1800, Detroit, Michigan 48226, (866) 258-1807.PARTICIPANTS IN THE SOLICITATIONHuntington, TCF, and certain of their respective directors and executive officers may be deemed to be participants
in the solicitation of proxies from the shareholders of Huntington and TCF in connection with the proposed transaction under the rules of the SEC. Information regarding Huntington’s directors and executive officers is available in its
definitive proxy statement relating to its 2020 Annual Meeting of Shareholders, which was filed with the SEC on March 12, 2020, and other documents filed by Huntington with the SEC. Information regarding TCF’s directors and executive
officers is available in its definitive proxy statement relating to its 2020 Annual Meeting of Shareholders, which was filed with the SEC on March 25, 2020, and other documents filed by TCF with the SEC. Other information regarding the
participants in the proxy solicitation and a description of their direct and indirect interests, by security holdings or otherwise, will be contained in the joint proxy statement/prospectus and other relevant materials filed with the SEC.
Free copies of this document may be obtained as described in the preceding paragraph.USE OF NON-GAAP FINANCIAL MEASURESThis document contains GAAP financial measures and non-GAAP financial measures where management believes it to be helpful
in understanding Huntington’s results of operations or financial position. Where non-GAAP financial measures are used, the comparable GAAP financial measure, as well as the reconciliation to the comparable GAAP financial measure, can be found
in this document, conference call slides, or the Form 8-K related to this document, all of which can be found in the Investor Relations section of Huntington’s website, http://www.huntington.com. 2
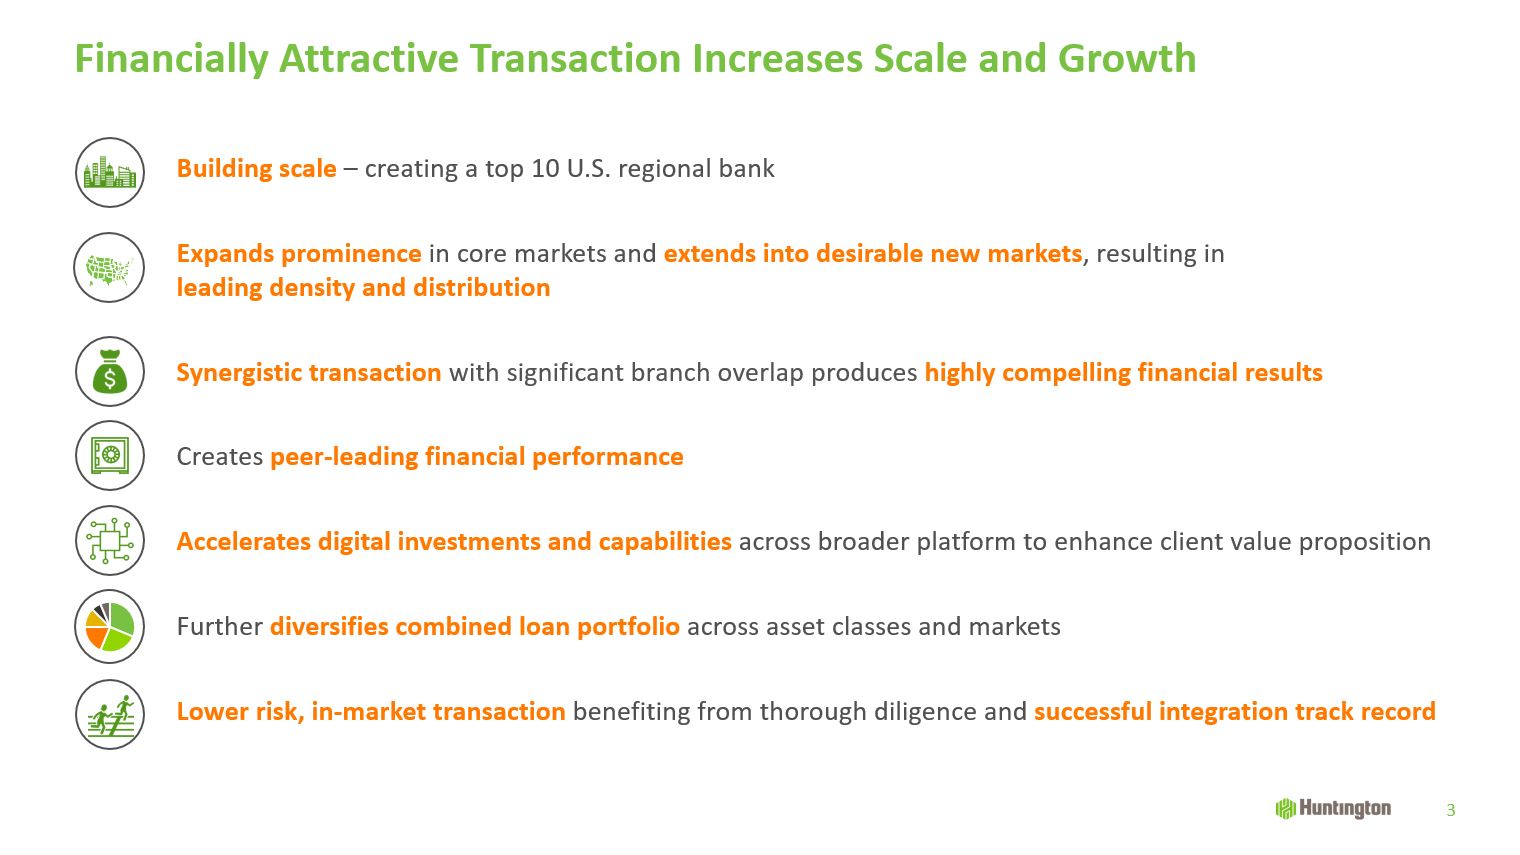
Financially Attractive Transaction Increases Scale and Growth Building scale – creating a top 10 U.S.
regional bankExpands prominence in core markets and extends into desirable new markets, resulting inleading density and distributionSynergistic transaction with significant branch overlap produces highly compelling financial resultsCreates
peer-leading financial performanceAccelerates digital investments and capabilities across broader platform to enhance client value propositionFurther diversifies combined loan portfolio across asset classes and marketsLower risk, in-market
transaction benefiting from thorough diligence and successful integration track
record 3
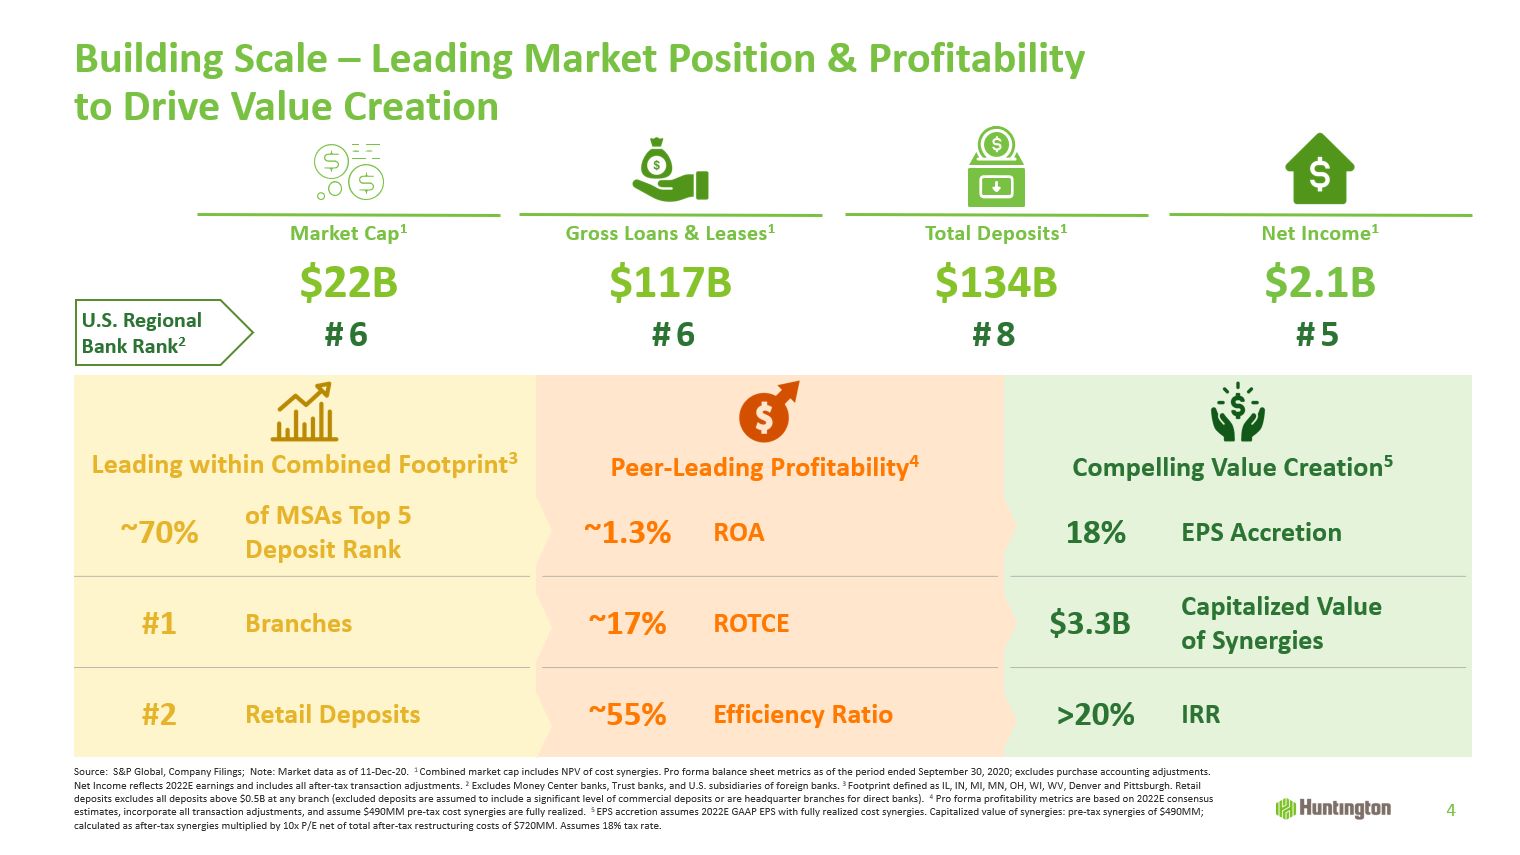
Building Scale – Leading Market Position & Profitability to Drive Value Creation
4 Peer-Leading Profitability4 Compelling Value Creation5 18% EPS Accretion $3.3B Capitalized Valueof Synergies >20% IRR ~1.3% ROA ~17% ROTCE ~55% Efficiency Ratio ~70% of MSAs Top 5Deposit Rank #1 Branches
#2 Retail Deposits Source: S&P Global, Company Filings; Note: Market data as of 11-Dec-20. 1 Combined market cap includes NPV of cost synergies. Pro forma balance sheet metrics as of the period ended September 30, 2020; excludes
purchase accounting adjustments.Net Income reflects 2022E earnings and includes all after-tax transaction adjustments. 2 Excludes Money Center banks, Trust banks, and U.S. subsidiaries of foreign banks. 3 Footprint defined as IL, IN, MI, MN,
OH, WI, WV, Denver and Pittsburgh. Retail deposits excludes all deposits above $0.5B at any branch (excluded deposits are assumed to include a significant level of commercial deposits or are headquarter branches for direct banks). 4 Pro forma
profitability metrics are based on 2022E consensus estimates, incorporate all transaction adjustments, and assume $490MM pre-tax cost synergies are fully realized. 5 EPS accretion assumes 2022E GAAP EPS with fully realized cost synergies.
Capitalized value of synergies: pre-tax synergies of $490MM; calculated as after-tax synergies multiplied by 10x P/E net of total after-tax restructuring costs of $720MM. Assumes 18% tax rate. Market Cap1 $22B Net Income1 $2.1B Gross
Loans & Leases1 $117B Total Deposits1 $134B #6 #5 U.S. RegionalBank Rank2 #8 #6 Leading within Combined Footprint3
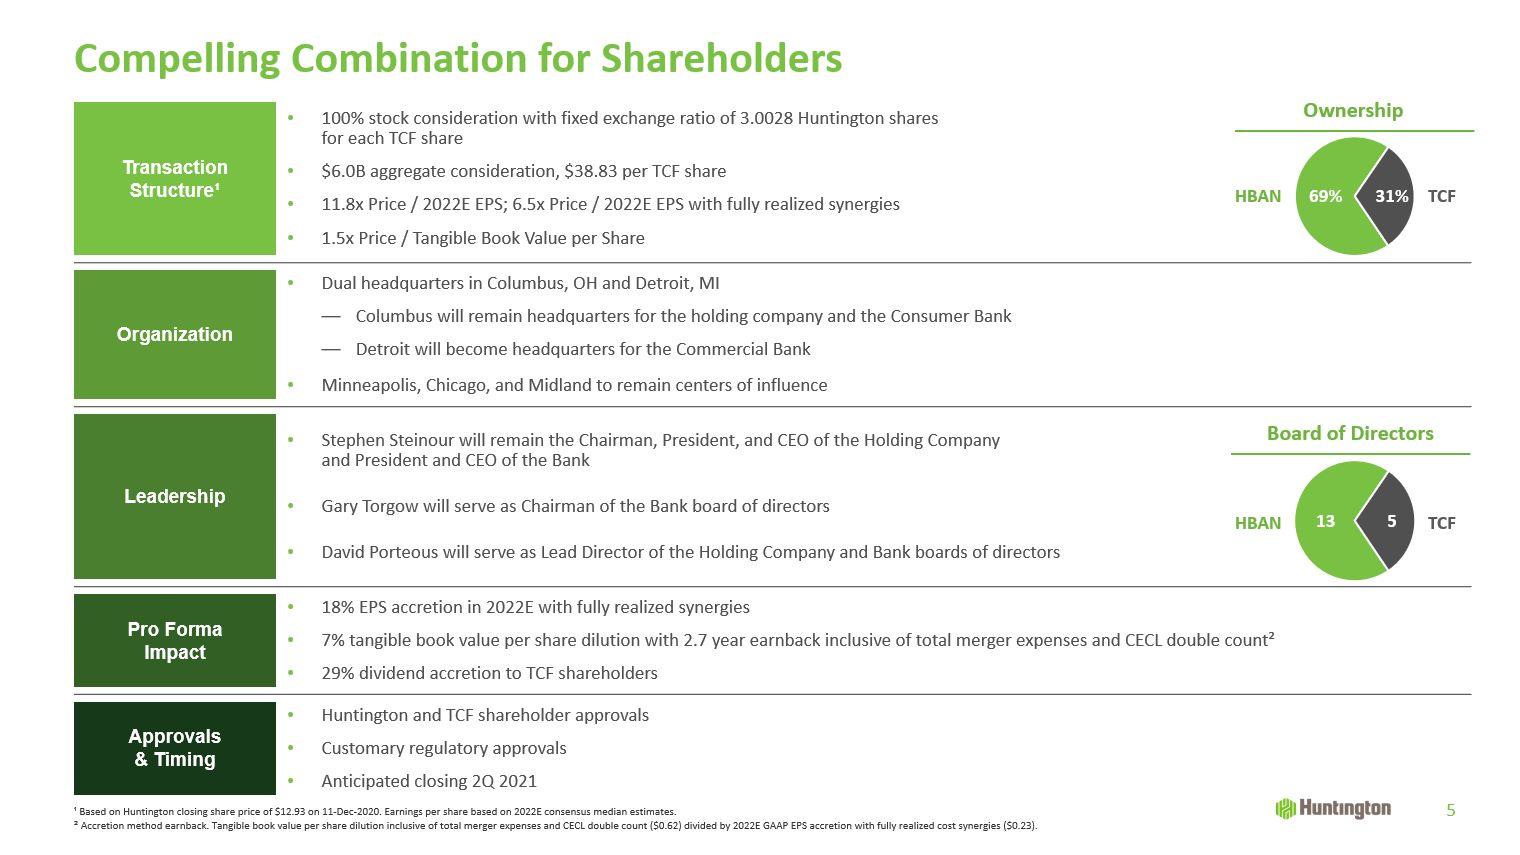
Compelling Combination for Shareholders 5 ¹ Based on Huntington closing share price of $12.93 on
11-Dec-2020. Earnings per share based on 2022E consensus median estimates.² Accretion method earnback. Tangible book value per share dilution inclusive of total merger expenses and CECL double count ($0.62) divided by 2022E GAAP EPS accretion
with fully realized cost synergies ($0.23). Transaction Structure¹ 100% stock consideration with fixed exchange ratio of 3.0028 Huntington shares for each TCF share$6.0B aggregate consideration, $38.83 per TCF share11.8x Price / 2022E EPS;
6.5x Price / 2022E EPS with fully realized synergies1.5x Price / Tangible Book Value per Share Organization Dual headquarters in Columbus, OH and Detroit, MIColumbus will remain headquarters for the holding company and the Consumer
BankDetroit will become headquarters for the Commercial BankMinneapolis, Chicago, and Midland to remain centers of influence Leadership Stephen Steinour will remain the Chairman, President, and CEO of the Holding Company and
President and CEO of the BankGary Torgow will serve as Chairman of the Bank board of directorsDavid Porteous will serve as Lead Director of the Holding Company and Bank boards of directors Pro FormaImpact 18% EPS accretion in 2022E
with fully realized synergies7% tangible book value per share dilution with 2.7 year earnback inclusive of total merger expenses and CECL double count²29% dividend accretion to TCF shareholders Approvals& Timing Huntington and
TCF shareholder approvalsCustomary regulatory approvals Anticipated closing 2Q 2021 Ownership 69% 31% HBAN TCF Board of Directors HBAN TCF 13 5
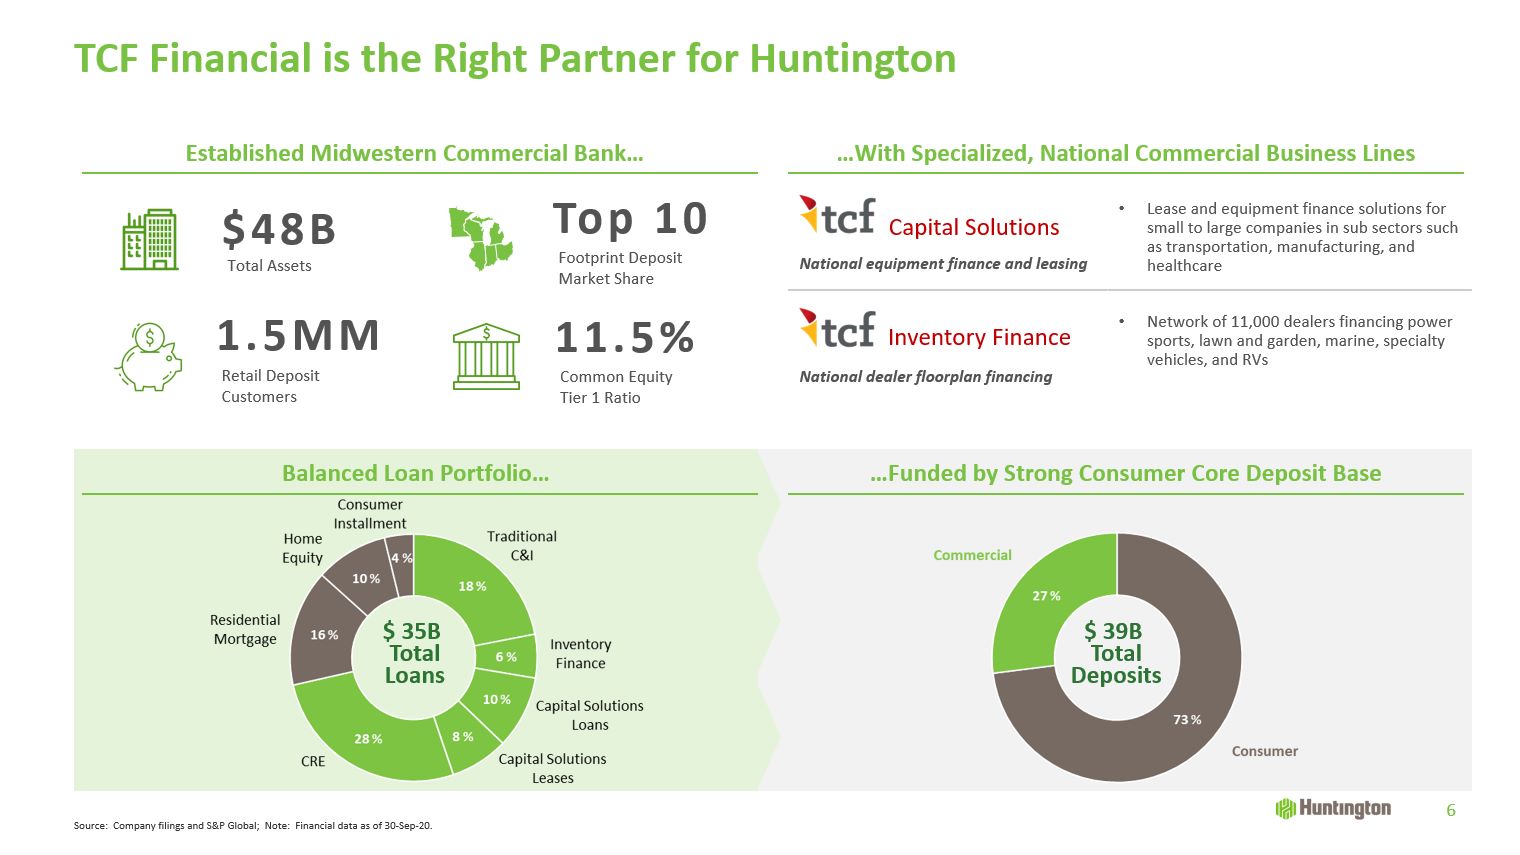
$ 35B TotalLoans TCF Financial is the Right Partner for Huntington 6 Established Midwestern
Commercial Bank… $48B Total Assets Top 10 Footprint DepositMarket Share 1.5MM Retail Deposit Customers …With Specialized, National Commercial Business Lines Balanced Loan Portfolio… …Funded by Strong Consumer Core Deposit
Base National equipment finance and leasing Lease and equipment finance solutions for small to large companies in sub sectors such as transportation, manufacturing, and healthcare National dealer floorplan financing Network of 11,000
dealers financing power sports, lawn and garden, marine, specialty vehicles, and RVs Source: Company filings and S&P Global; Note: Financial data as of 30-Sep-20. $ 39B TotalDeposits Inventory Finance Capital
Solutions 11.5% Common EquityTier 1 Ratio
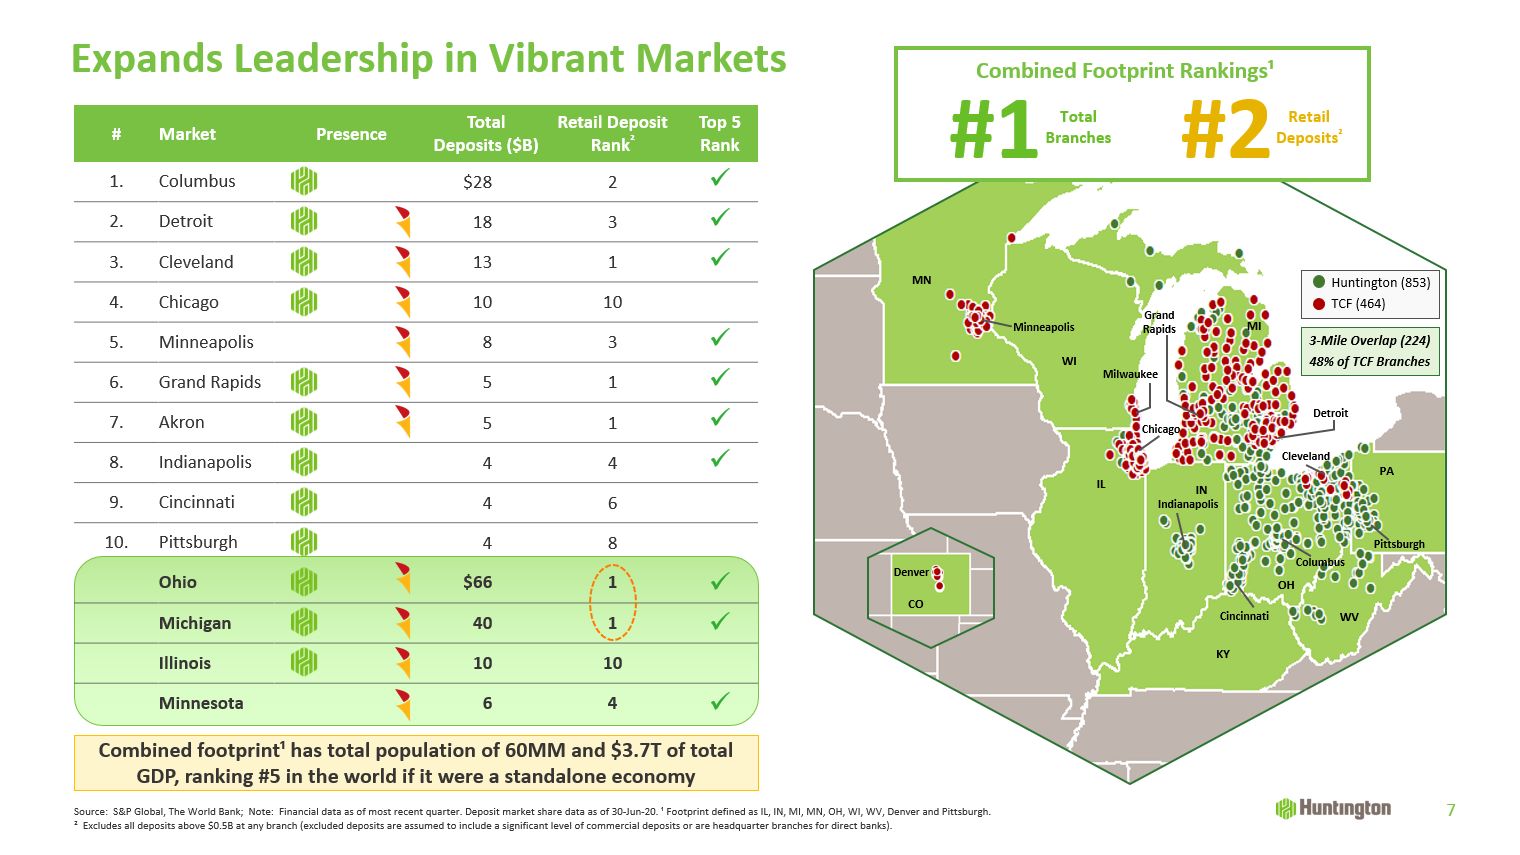
Milwaukee Chicago Detroit Cincinnati Columbus Cleveland Minneapolis IL IN OH PA MI WI MN Pittsburgh Indianapolis WV Grand
Rapids Denver CO KY 3-Mile Overlap (224)48% of TCF Branches # Market Presence TotalDeposits ($B) Retail Deposit Rank² Top 5 Rank 1. Columbus $28 2 2. Detroit 18 3 3. Cleveland 13
1 4. Chicago 10 10 5. Minneapolis 8 3 6. Grand Rapids 5 1 7. Akron 5 1 8. Indianapolis 4 4 9. Cincinnati 4 6 10. Pittsburgh 4
8 Ohio $66 1 Michigan 40 1 Illinois 10 10 Minnesota 6 4 Expands Leadership in Vibrant Markets 7 Source: S&P Global, The World Bank; Note: Financial data as of most recent quarter.
Deposit market share data as of 30-Jun-20. ¹ Footprint defined as IL, IN, MI, MN, OH, WI, WV, Denver and Pittsburgh. ² Excludes all deposits above $0.5B at any branch (excluded deposits are assumed to include a significant level of commercial
deposits or are headquarter branches for direct banks). Combined footprint¹ has total population of 60MM and $3.7T of total GDP, ranking #5 in the world if it were a standalone economy Combined Footprint
Rankings¹ #1 TotalBranches Retail Deposits² #2 Huntington (853)TCF (464)
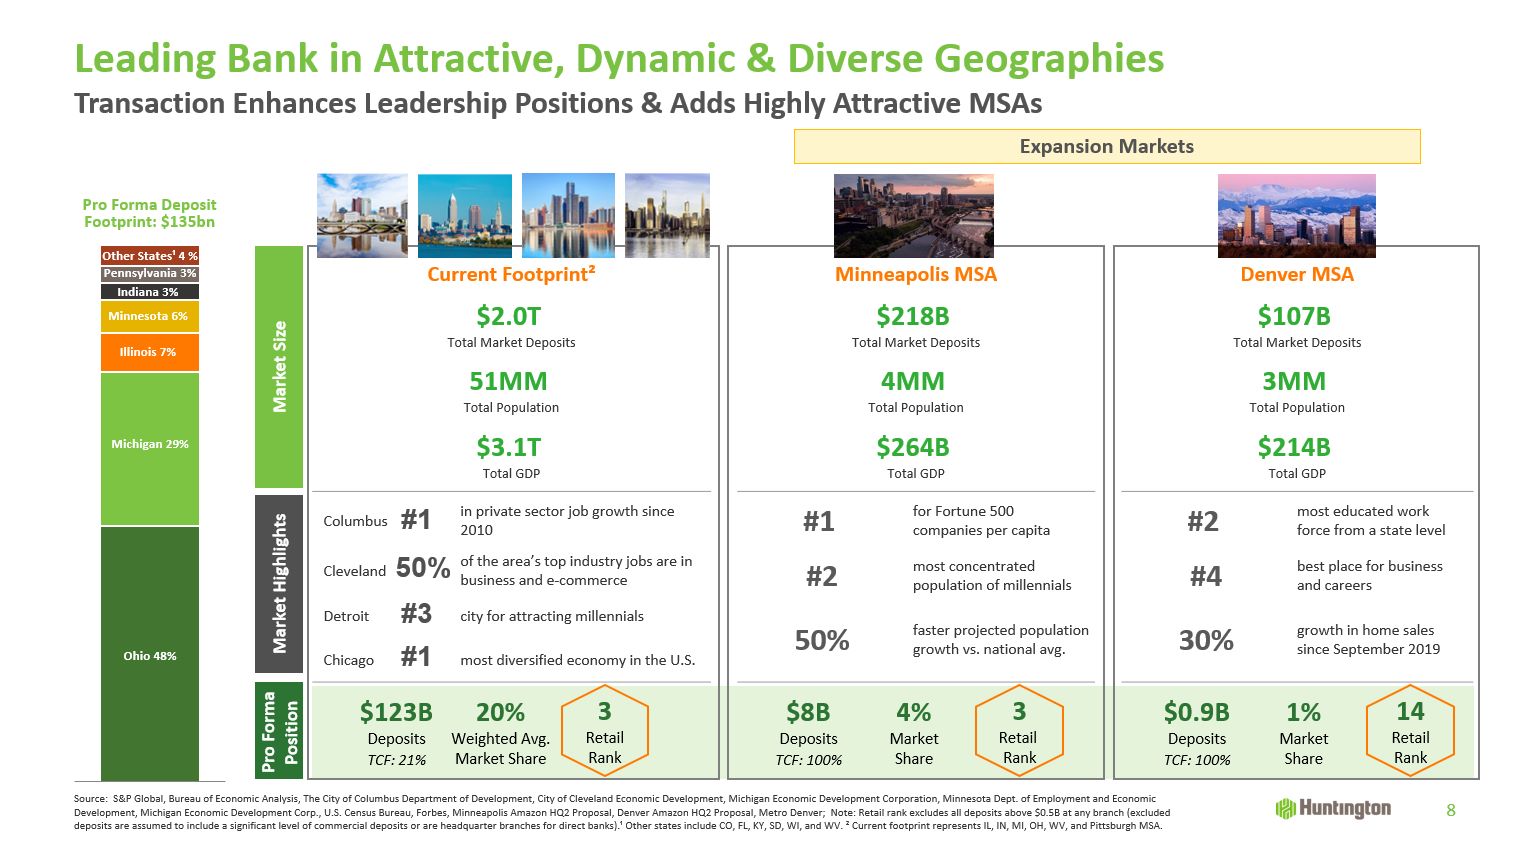
Market Size Current Footprint² Minneapolis MSA Denver MSA $2.0TTotal Market
Deposits $218BTotal Market Deposits $107BTotal Market Deposits 51MMTotal Population 4MMTotal Population 3MMTotal Population $3.1TTotal GDP $264BTotal GDP $214BTotal
GDP Market Highlights Columbus in private sector job growth since 2010 #1 for Fortune 500 companies per capita #2 most educated work force from a state level Cleveland of the area’s
top industry jobs are in business and e-commerce #2 most concentrated population of millennials #4 best place for business and careers Detroit city for attracting millennials 50% faster projected
population growth vs. national avg. 30% growth in home sales since September 2019 Chicago most diversified economy in the U.S. Pro Forma
Position $123BDepositsTCF: 21% 20%Weighted Avg.Market Share $0.9BDepositsTCF: 100% 1%MarketShare $8BDepositsTCF: 100% 4%MarketShare 3RetailRank 3Retail Rank 14RetailRank Leading Bank
in Attractive, Dynamic & Diverse Geographies Source: S&P Global, Bureau of Economic Analysis, The City of Columbus Department of Development, City of Cleveland Economic Development, Michigan Economic Development Corporation,
Minnesota Dept. of Employment and Economic Development, Michigan Economic Development Corp., U.S. Census Bureau, Forbes, Minneapolis Amazon HQ2 Proposal, Denver Amazon HQ2 Proposal, Metro Denver; Note: Retail rank excludes all deposits above
$0.5B at any branch (excluded deposits are assumed to include a significant level of commercial deposits or are headquarter branches for direct banks).¹ Other states include CO, FL, KY, SD, WI, and WV. ² Current footprint represents IL, IN,
MI, OH, WV, and Pittsburgh MSA. 8 Transaction Enhances Leadership Positions & Adds Highly Attractive MSAs #3 #1 #1 50% Other States¹ 4 % Pennsylvania 3% Indiana 3% Minnesota 6% Illinois 7% Michigan 29% Ohio 48% Expansion
Markets
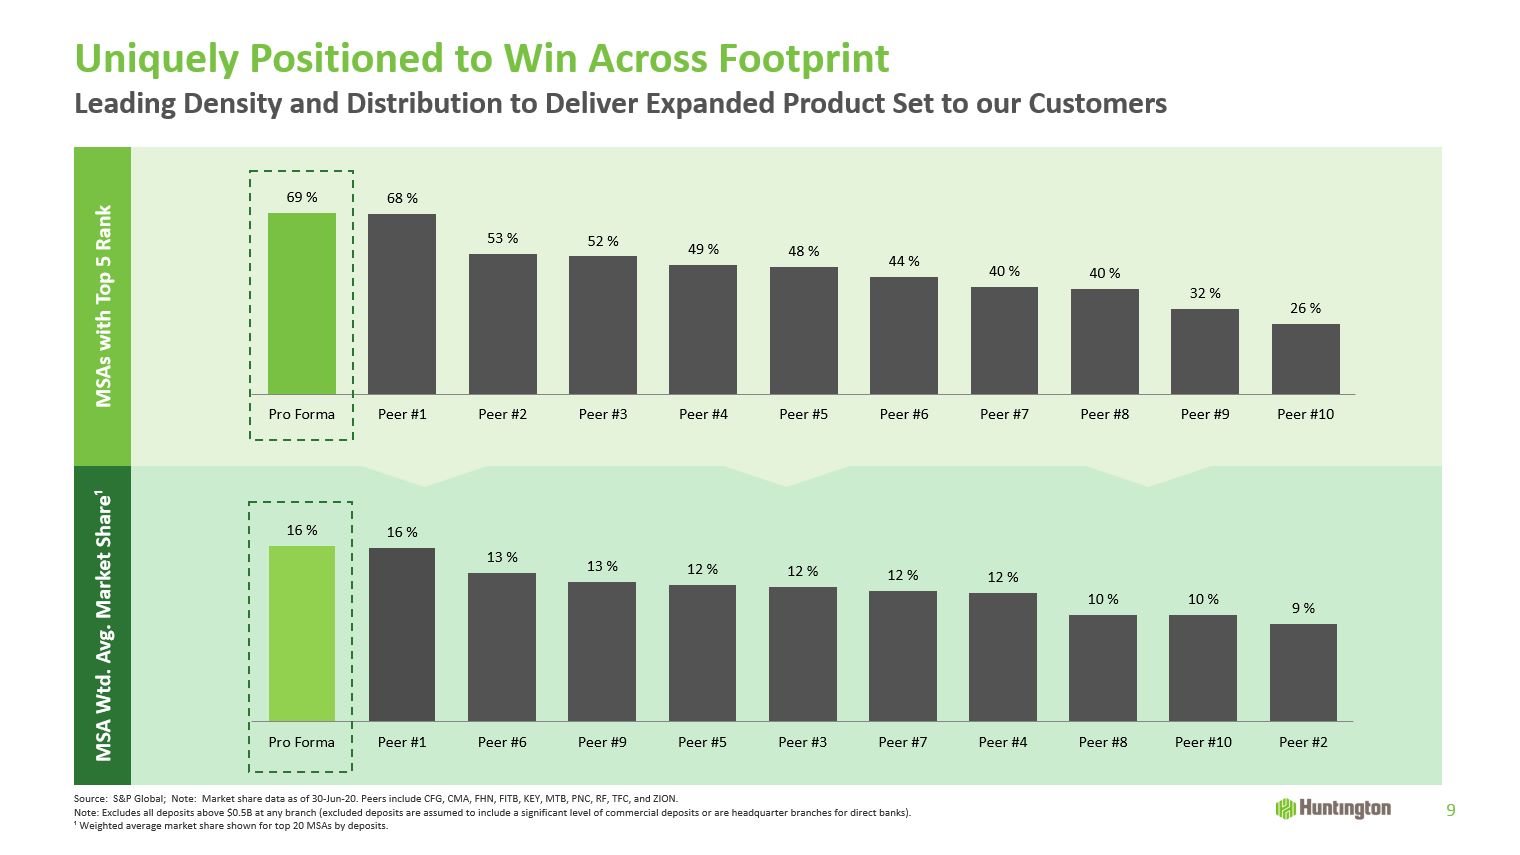
Uniquely Positioned to Win Across Footprint 9 Source: S&P Global; Note: Market share data as
of 30-Jun-20. Peers include CFG, CMA, FHN, FITB, KEY, MTB, PNC, RF, TFC, and ZION.Note: Excludes all deposits above $0.5B at any branch (excluded deposits are assumed to include a significant level of commercial deposits or are headquarter
branches for direct banks).¹ Weighted average market share shown for top 20 MSAs by deposits. MSAs with Top 5 Rank MSA Wtd. Avg. Market Share¹ Leading Density and Distribution to Deliver Expanded Product Set to our Customers
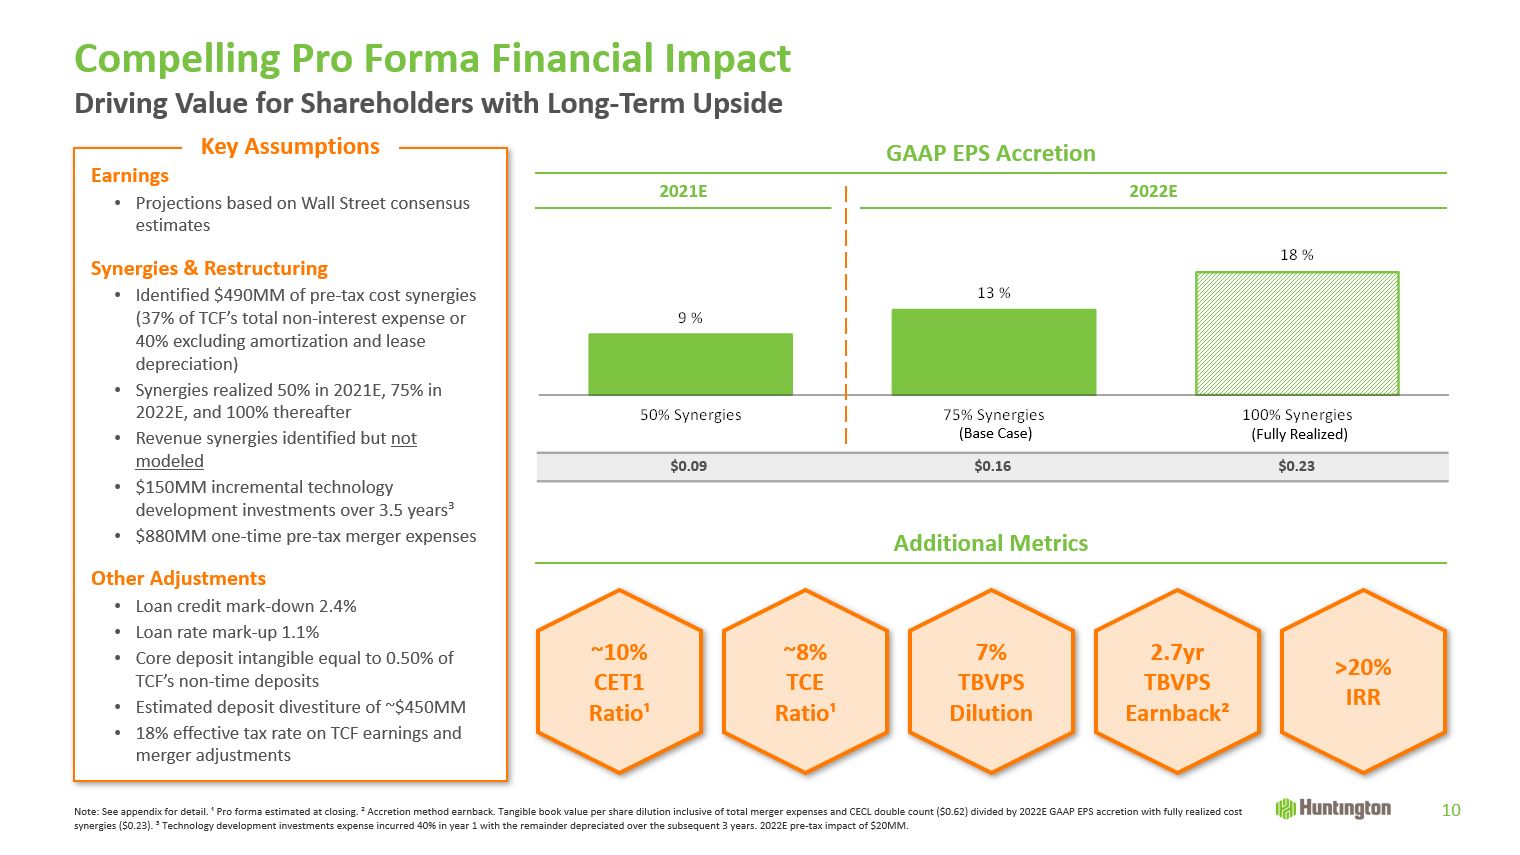
EarningsProjections based on Wall Street consensus estimatesSynergies & RestructuringIdentified
$490MM of pre-tax cost synergies (37% of TCF’s total non-interest expense or 40% excluding amortization and lease depreciation)Synergies realized 50% in 2021E, 75% in 2022E, and 100% thereafterRevenue synergies identified but not
modeled$150MM incremental technology development investments over 3.5 years³$880MM one-time pre-tax merger expensesOther AdjustmentsLoan credit mark-down 2.4%Loan rate mark-up 1.1%Core deposit intangible equal to 0.50% of TCF’s non-time
depositsEstimated deposit divestiture of ~$450MM18% effective tax rate on TCF earnings and merger adjustments Compelling Pro Forma Financial Impact 10 GAAP EPS Accretion Additional Metrics >20% IRR ~10% CET1 Ratio¹ Key
Assumptions Driving Value for Shareholders with Long-Term Upside 7%TBVPS Dilution 2.7yr TBVPS Earnback² $0.09 $0.16 $0.23 2021E 2022E Note: See appendix for detail. ¹ Pro forma estimated at closing. ² Accretion method earnback.
Tangible book value per share dilution inclusive of total merger expenses and CECL double count ($0.62) divided by 2022E GAAP EPS accretion with fully realized cost synergies ($0.23). ³ Technology development investments expense incurred 40%
in year 1 with the remainder depreciated over the subsequent 3 years. 2022E pre-tax impact of $20MM. ~8%TCERatio¹ (Base Case) (Fully Realized)
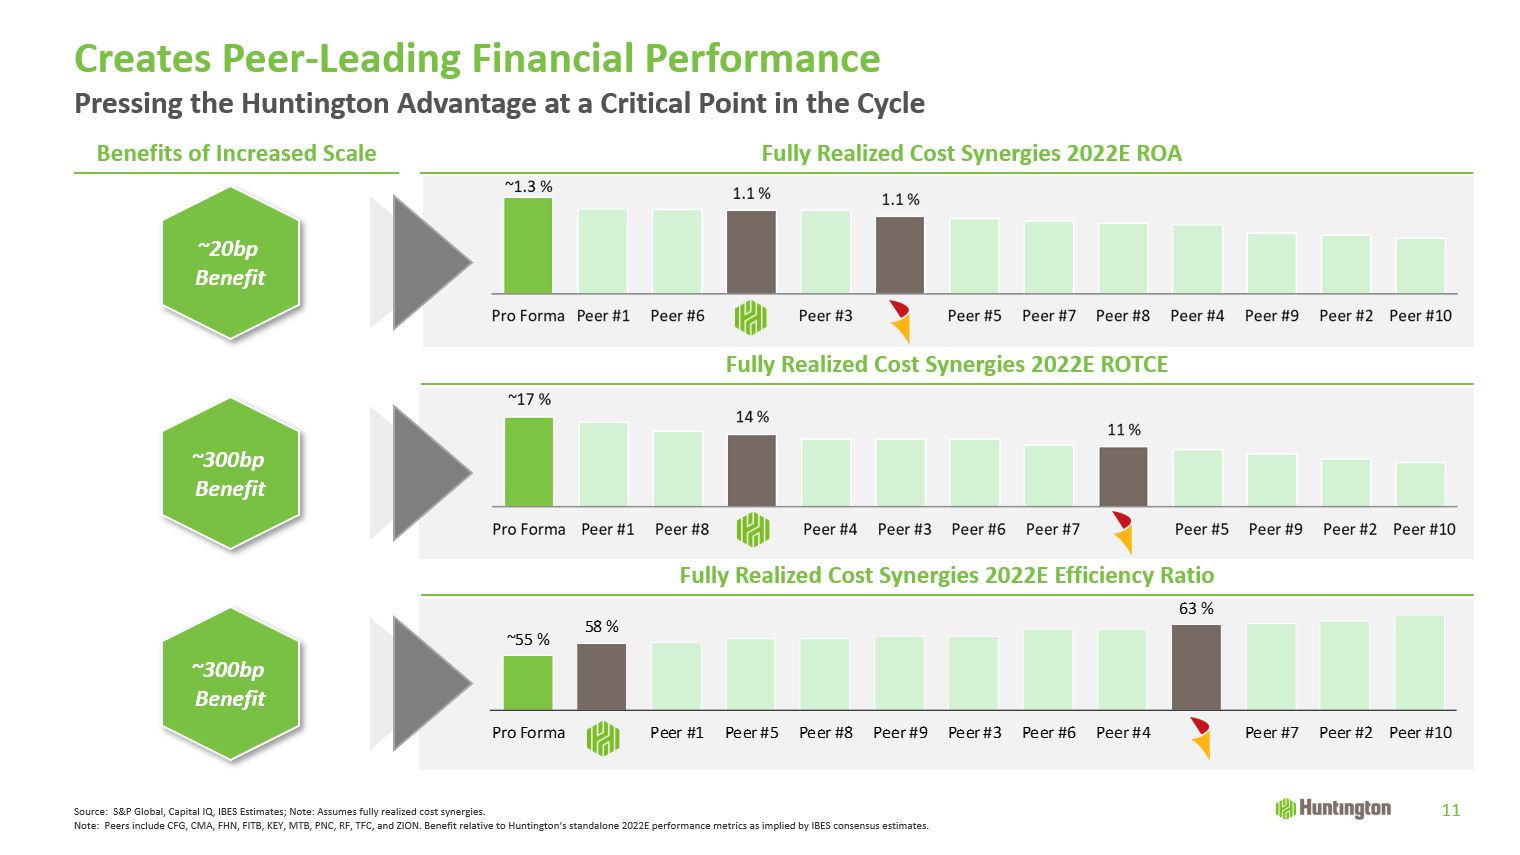
Fully Realized Cost Synergies 2022E Efficiency Ratio Fully Realized Cost Synergies 2022E
ROTCE Benefits of Increased Scale Creates Peer-Leading Financial Performance 11 ~20bp Benefit ~300bp Benefit ~300bp Benefit Source: S&P Global, Capital IQ, IBES Estimates; Note: Assumes fully realized cost synergies.Note:
Peers include CFG, CMA, FHN, FITB, KEY, MTB, PNC, RF, TFC, and ZION. Benefit relative to Huntington’s standalone 2022E performance metrics as implied by IBES consensus estimates. Fully Realized Cost Synergies 2022E ROA Pressing the
Huntington Advantage at a Critical Point in the Cycle
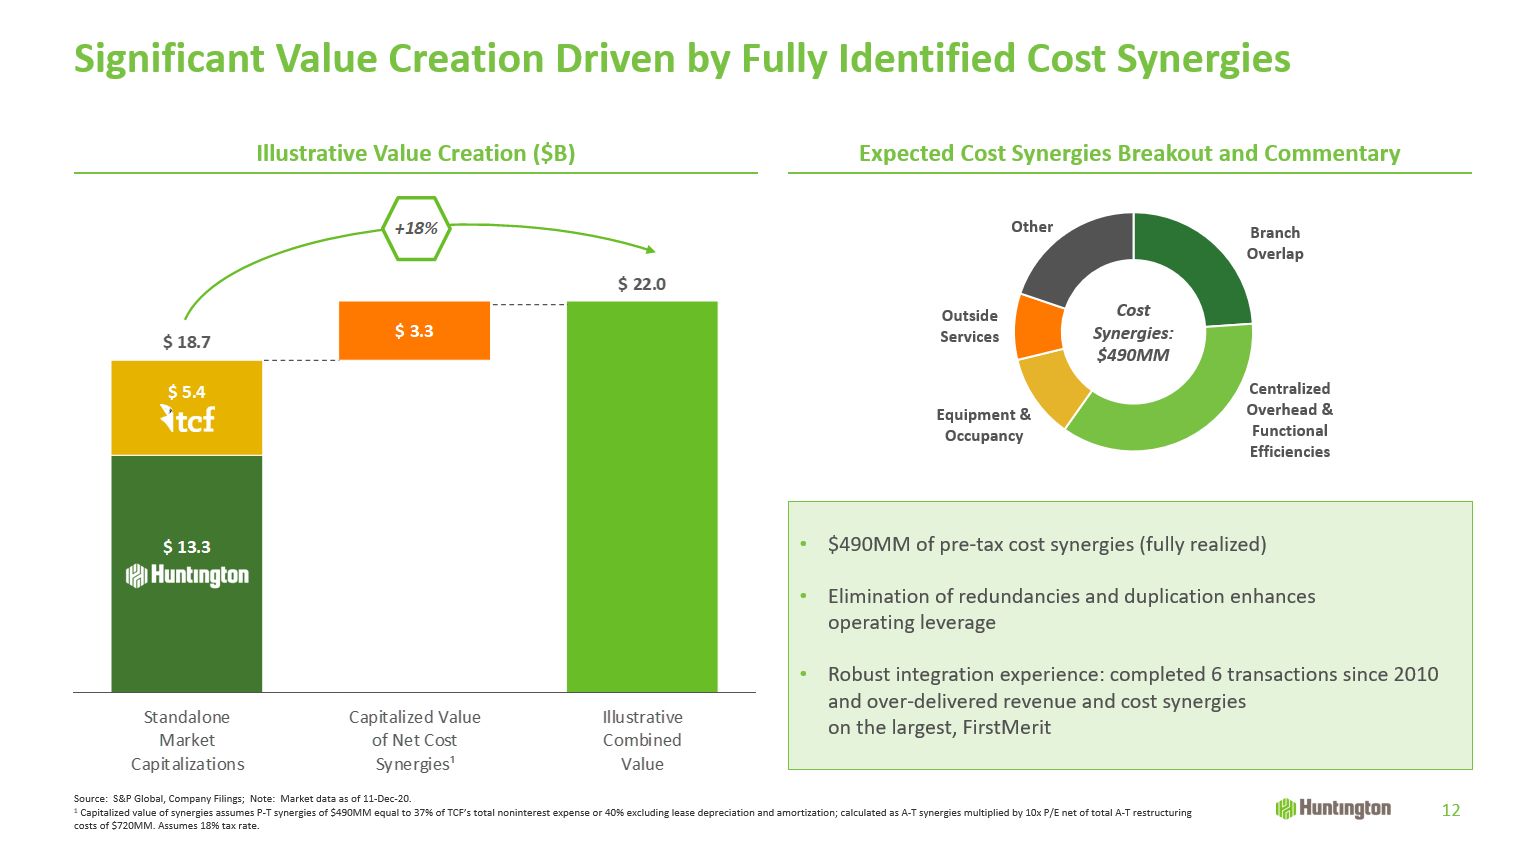
Significant Value Creation Driven by Fully Identified Cost Synergies $490MM of pre-tax cost synergies
(fully realized)Elimination of redundancies and duplication enhances operating leverageRobust integration experience: completed 6 transactions since 2010 and over-delivered revenue and cost synergies on the largest,
FirstMerit CostSynergies:$490MM Source: S&P Global, Company Filings; Note: Market data as of 11-Dec-20. 1 Capitalized value of synergies assumes P-T synergies of $490MM equal to 37% of TCF’s total noninterest expense or 40% excluding
lease depreciation and amortization; calculated as A-T synergies multiplied by 10x P/E net of total A-T restructuring costs of $720MM. Assumes 18% tax rate. Illustrative Value Creation ($B) Expected Cost Synergies Breakout and
Commentary 12
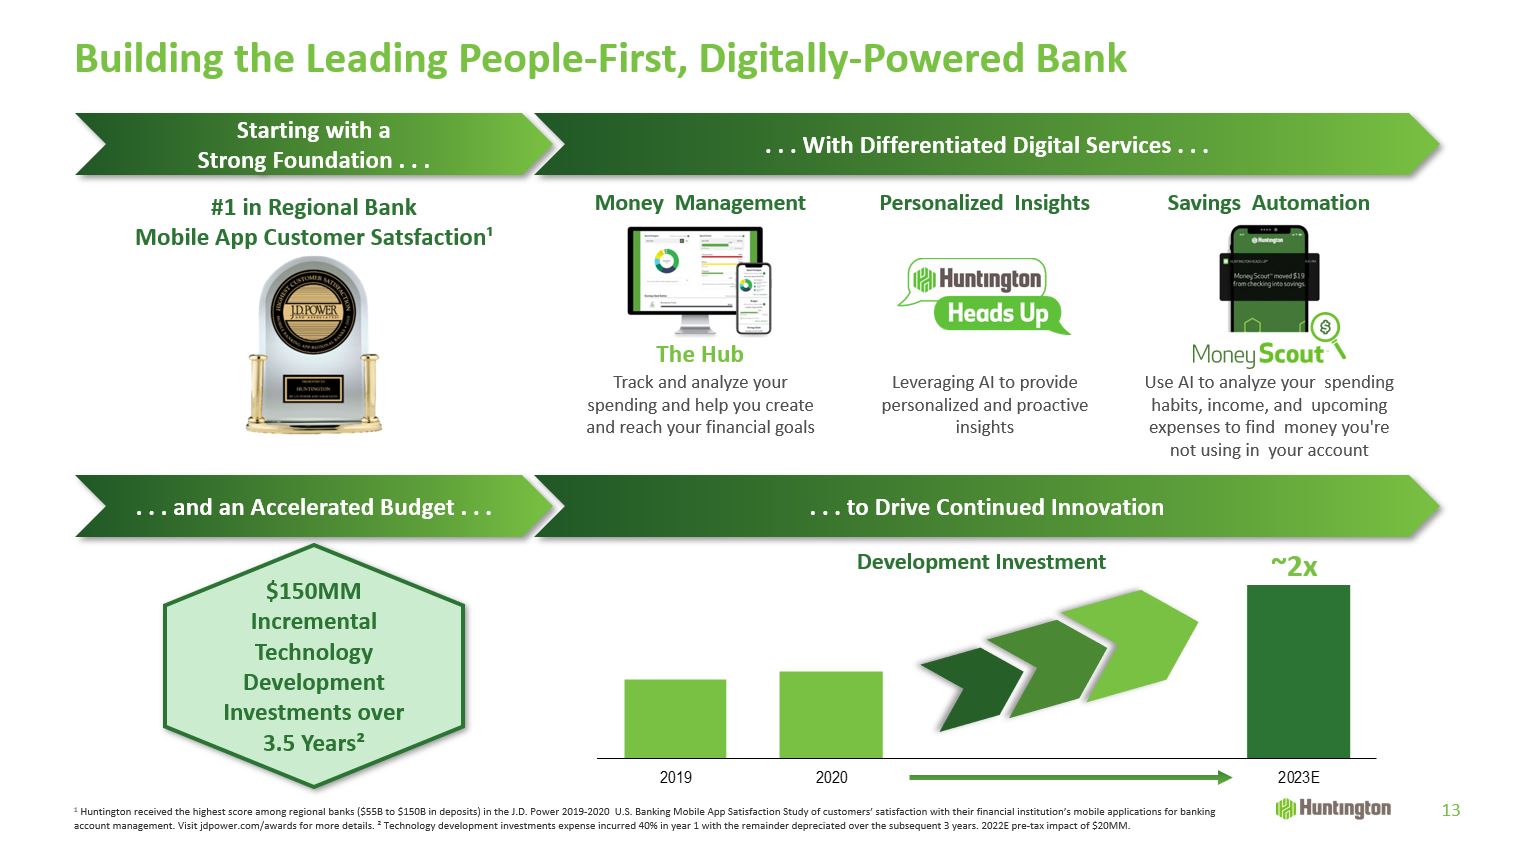
Building the Leading People-First, Digitally-Powered Bank 13 #1 in Regional Bank Mobile App Customer
Satsfaction¹ 1 Huntington received the highest score among regional banks ($55B to $150B in deposits) in the J.D. Power 2019‐2020 U.S. Banking Mobile App Satisfaction Study of customers’ satisfaction with their financial institution’s mobile
applications for banking account management. Visit jdpower.com/awards for more details. ² Technology development investments expense incurred 40% in year 1 with the remainder depreciated over the subsequent 3 years. 2022E pre-tax impact of
$20MM. Starting with a Strong Foundation . . . . . . With Differentiated Digital Services . . . . . . and an Accelerated Budget . . . . . . to Drive Continued Innovation Development Investment ~2x Money Management Track and
analyze your spending and help you create and reach your financial goals The Hub Personalized Insights Leveraging AI to provide personalized and proactive insights Savings Automation Use AI to analyze your spending habits,
income, and upcoming expenses to find money you’re not using in your account $150MMIncremental Technology Development Investments over3.5 Years²
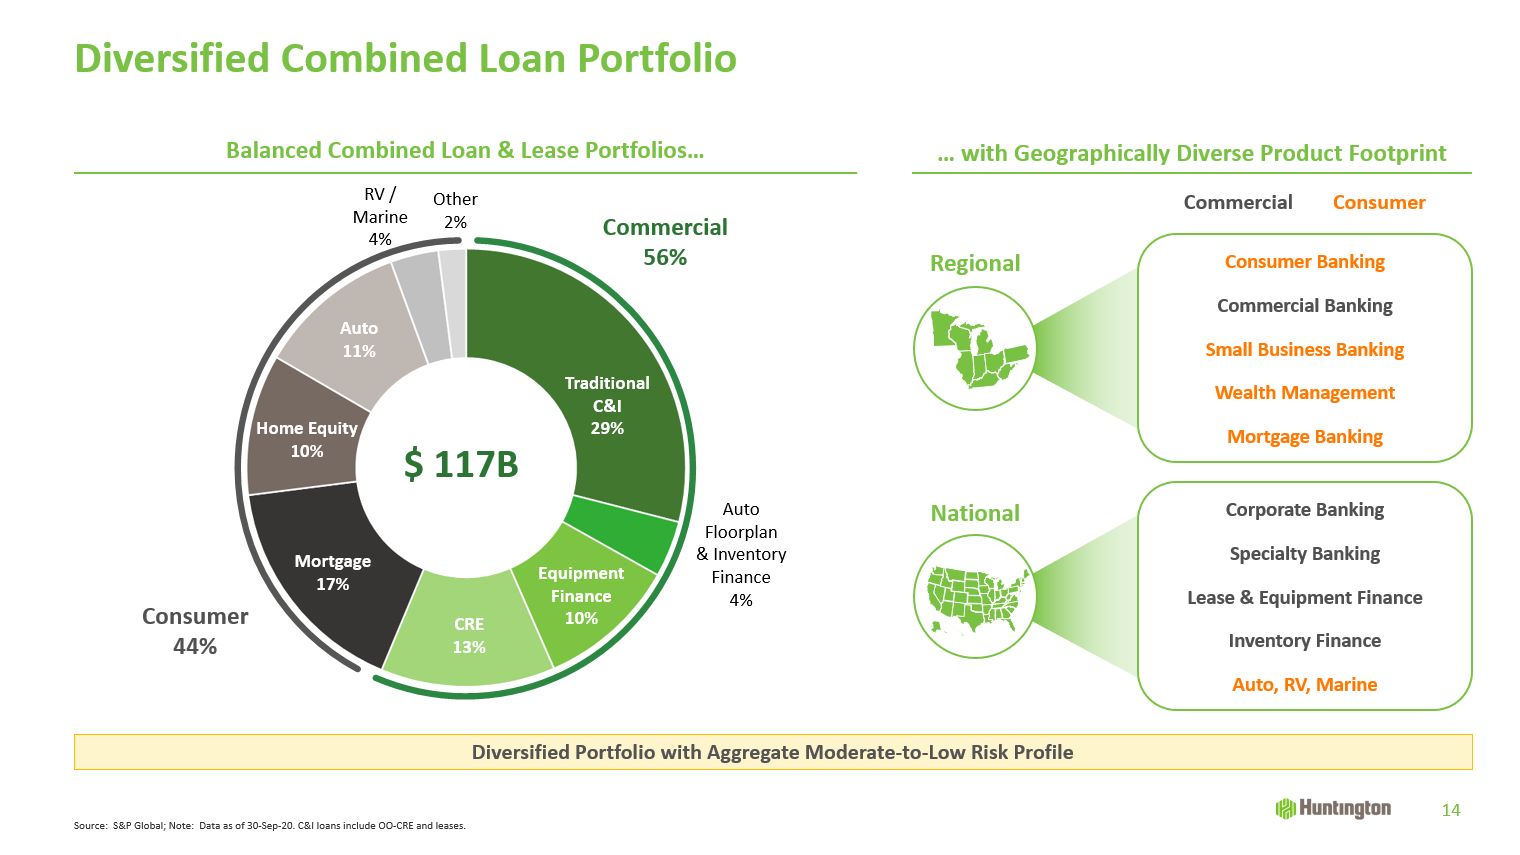
Diversified Combined Loan Portfolio 14 Diversified Portfolio with Aggregate Moderate-to-Low Risk
Profile $ 117B Source: S&P Global; Note: Data as of 30-Sep-20. C&I loans include OO-CRE and leases. Balanced Combined Loan & Lease Portfolios… … with Geographically Diverse Product
Footprint Commercial56% Consumer44% Consumer BankingCommercial BankingSmall
Business BankingWealth Management Mortgage Banking National Regional Commercial Consumer Corporate BankingSpecialty BankingLease & Equipment FinanceInventory FinanceAuto, RV,
Marine TraditionalC&I29% Auto Floorplan& Inventory Finance4% EquipmentFinance10% CRE13% Mortgage17% Home Equity10% Auto11% RV /Marine4% Other2%
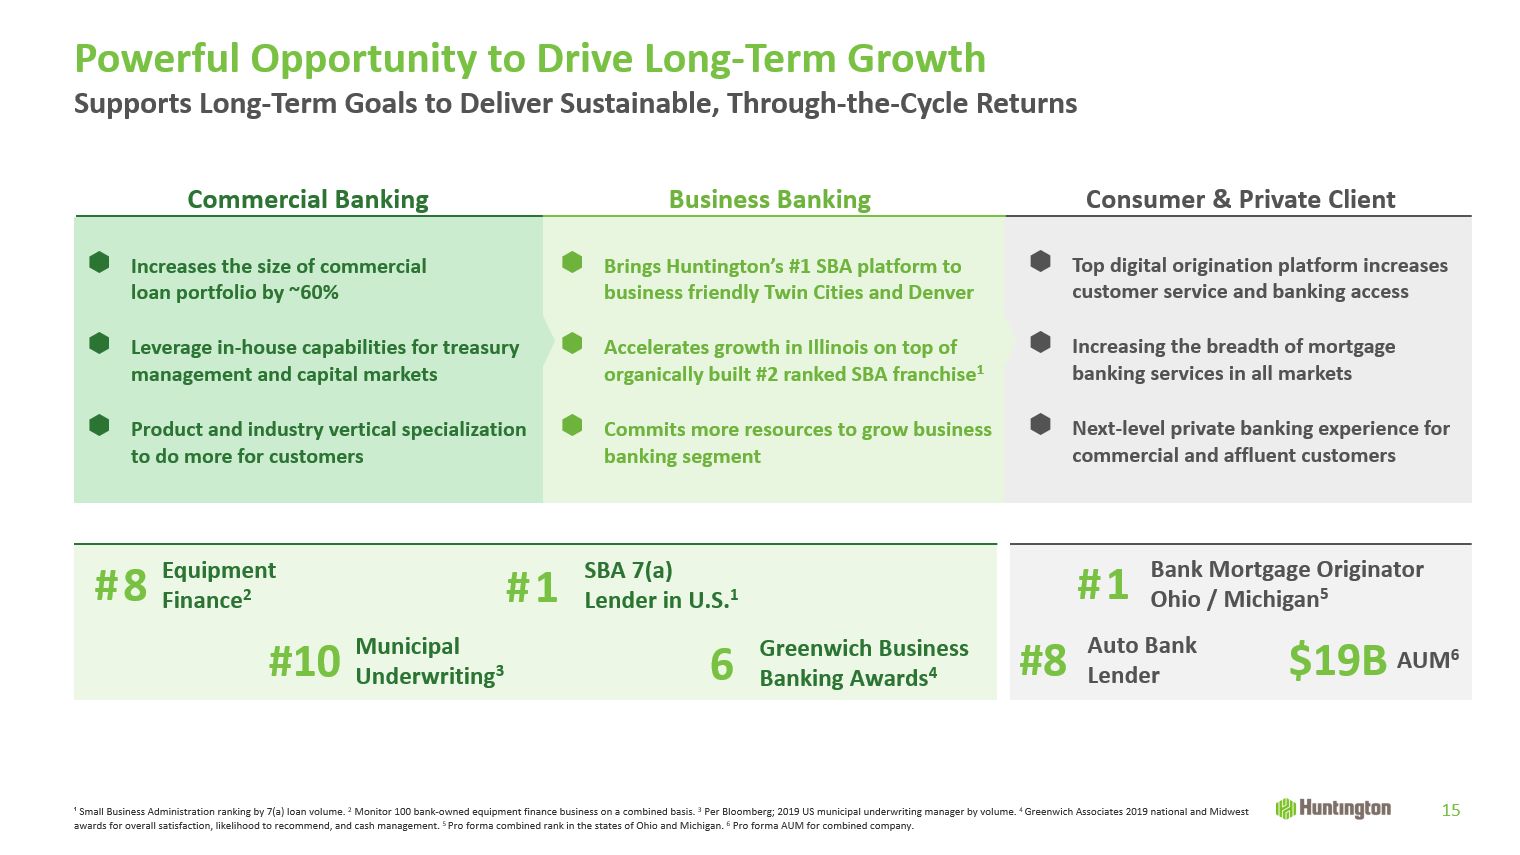
15 Top digital origination platform increases customer service and banking access Increasing
the breadth of mortgage banking services in all marketsNext-level private banking experience for commercial and affluent customers Brings Huntington’s #1 SBA platform to business friendly Twin Cities and DenverAccelerates growth in Illinois
on top of organically built #2 ranked SBA franchise1Commits more resources to grow business banking segment Increases the size of commercialloan portfolio by ~60%Leverage in-house capabilities for treasury management and capital
marketsProduct and industry vertical specialization to do more for customers ¹ Small Business Administration ranking by 7(a) loan volume. 2 Monitor 100 bank-owned equipment finance business on a combined basis. 3 Per Bloomberg; 2019 US
municipal underwriting manager by volume. 4 Greenwich Associates 2019 national and Midwest awards for overall satisfaction, likelihood to recommend, and cash management. 5 Pro forma combined rank in the states of Ohio and Michigan. 6 Pro
forma AUM for combined company. Powerful Opportunity to Drive Long-Term Growth Supports Long-Term Goals to Deliver Sustainable, Through-the-Cycle Returns Commercial Banking Business Banking Consumer & Private
Client #10 MunicipalUnderwriting3 #8 EquipmentFinance2 #1 SBA 7(a)Lender in U.S.1 6 Greenwich Business Banking Awards4 #1 Bank Mortgage OriginatorOhio / Michigan5 #8 Auto BankLender $19B AUM6
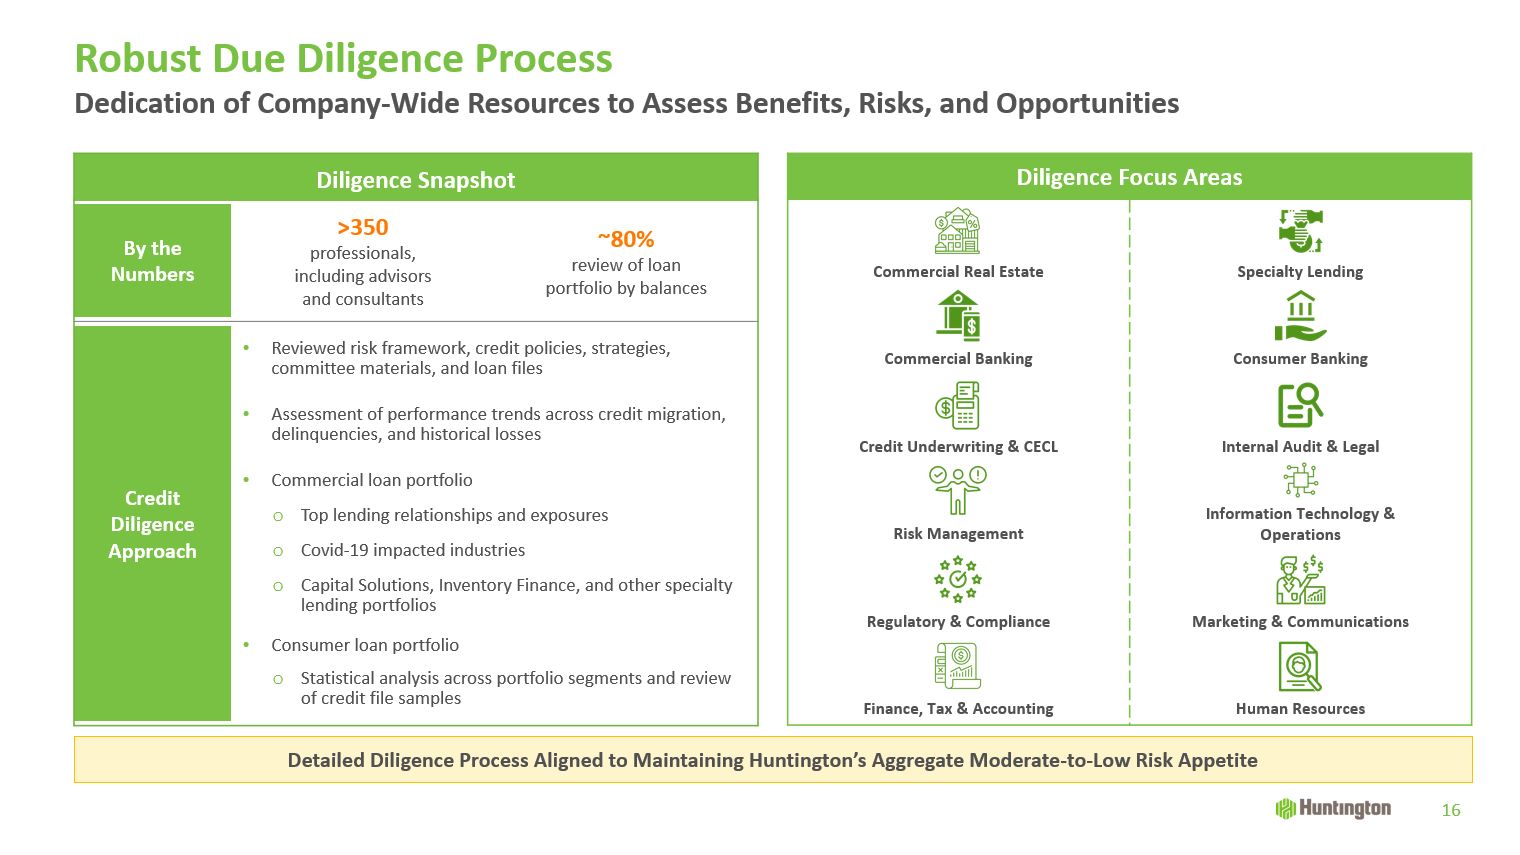
Diligence Snapshot By theNumbers >350professionals,including advisorsand
consultants ~80%review of loanportfolio by balances Credit Diligence Approach Reviewed risk framework, credit policies, strategies, committee materials, and loan filesAssessment of performance trends across credit migration,
delinquencies, and historical losses Commercial loan portfolioTop lending relationships and exposuresCovid-19 impacted industriesCapital Solutions, Inventory Finance, and other specialty lending portfoliosConsumer loan portfolioStatistical
analysis across portfolio segments and review of credit file samples Robust Due Diligence Process 16 Diligence Focus Areas Commercial Real Estate Specialty Lending Commercial Banking Consumer Banking Credit Underwriting
& CECL Internal Audit & Legal Risk Management Information Technology &Operations Regulatory & Compliance Marketing & Communications Finance, Tax & Accounting Human Resources Dedication of Company-Wide Resources
to Assess Benefits, Risks, and Opportunities Detailed Diligence Process Aligned to Maintaining Huntington’s Aggregate Moderate-to-Low Risk Appetite

Financially Attractive Transaction Increases Scale and Growth Building scale – creating a top 10 U.S.
regional bankExpands prominence in core markets and extends into desirable new markets, resulting inleading density and distributionSynergistic transaction with significant branch overlap produces highly compelling financial resultsCreates
peer-leading financial performanceAccelerates digital investments and capabilities across broader platform to enhance client value propositionFurther diversifies combined loan portfolio across asset classes and marketsLower risk, in-market
transaction benefiting from thorough diligence and successful integration track
record 17

Appendix
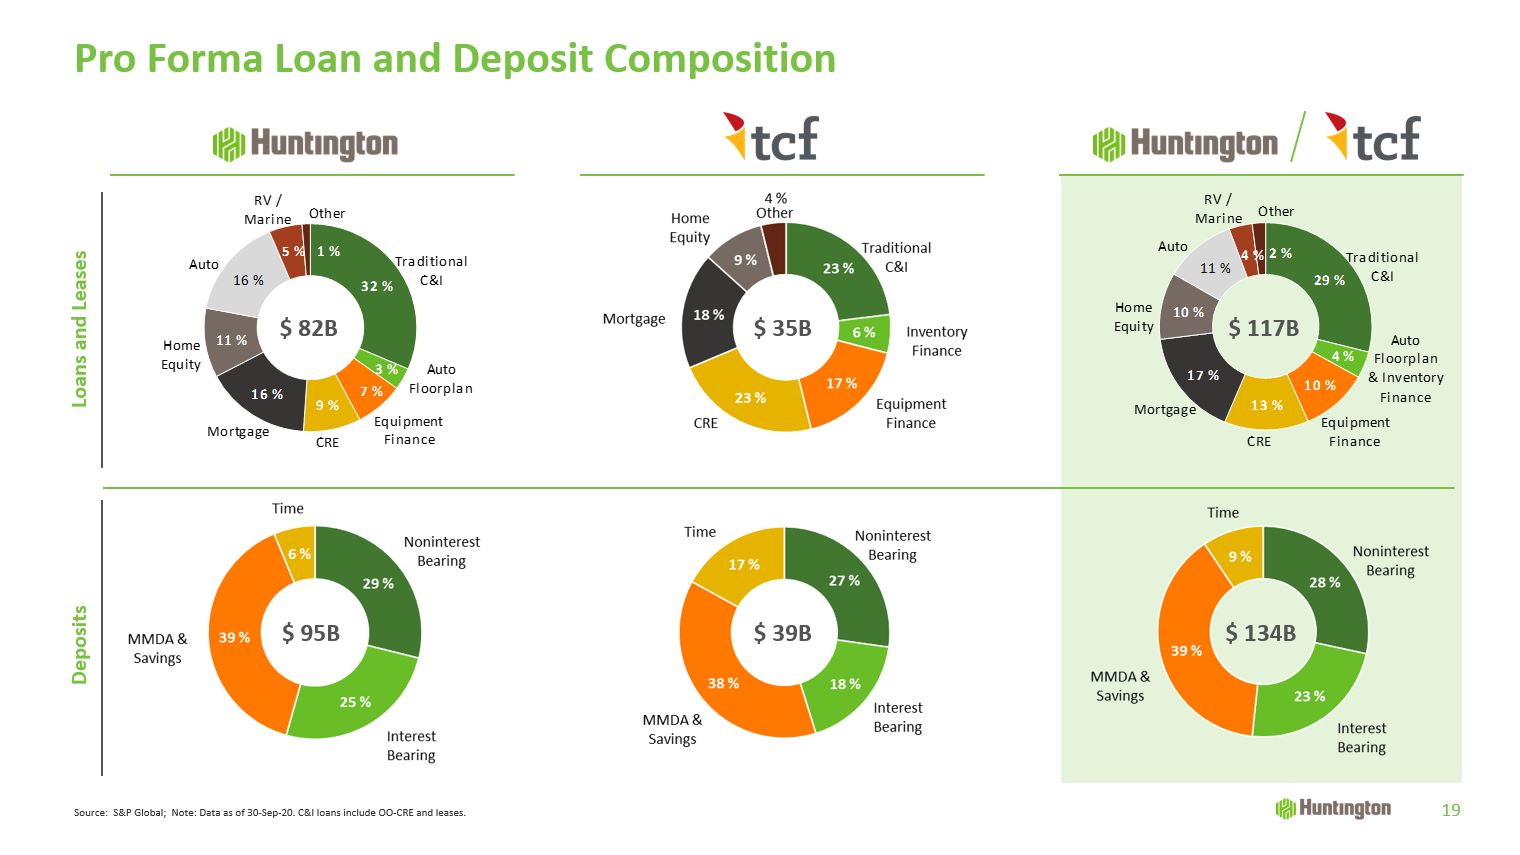
Pro Forma Loan and Deposit Composition Deposits Loans and Leases $ 82B $ 35B $ 117B $ 134B $
95B $ 39B Source: S&P Global; Note: Data as of 30-Sep-20. C&I loans include OO-CRE and leases. 19
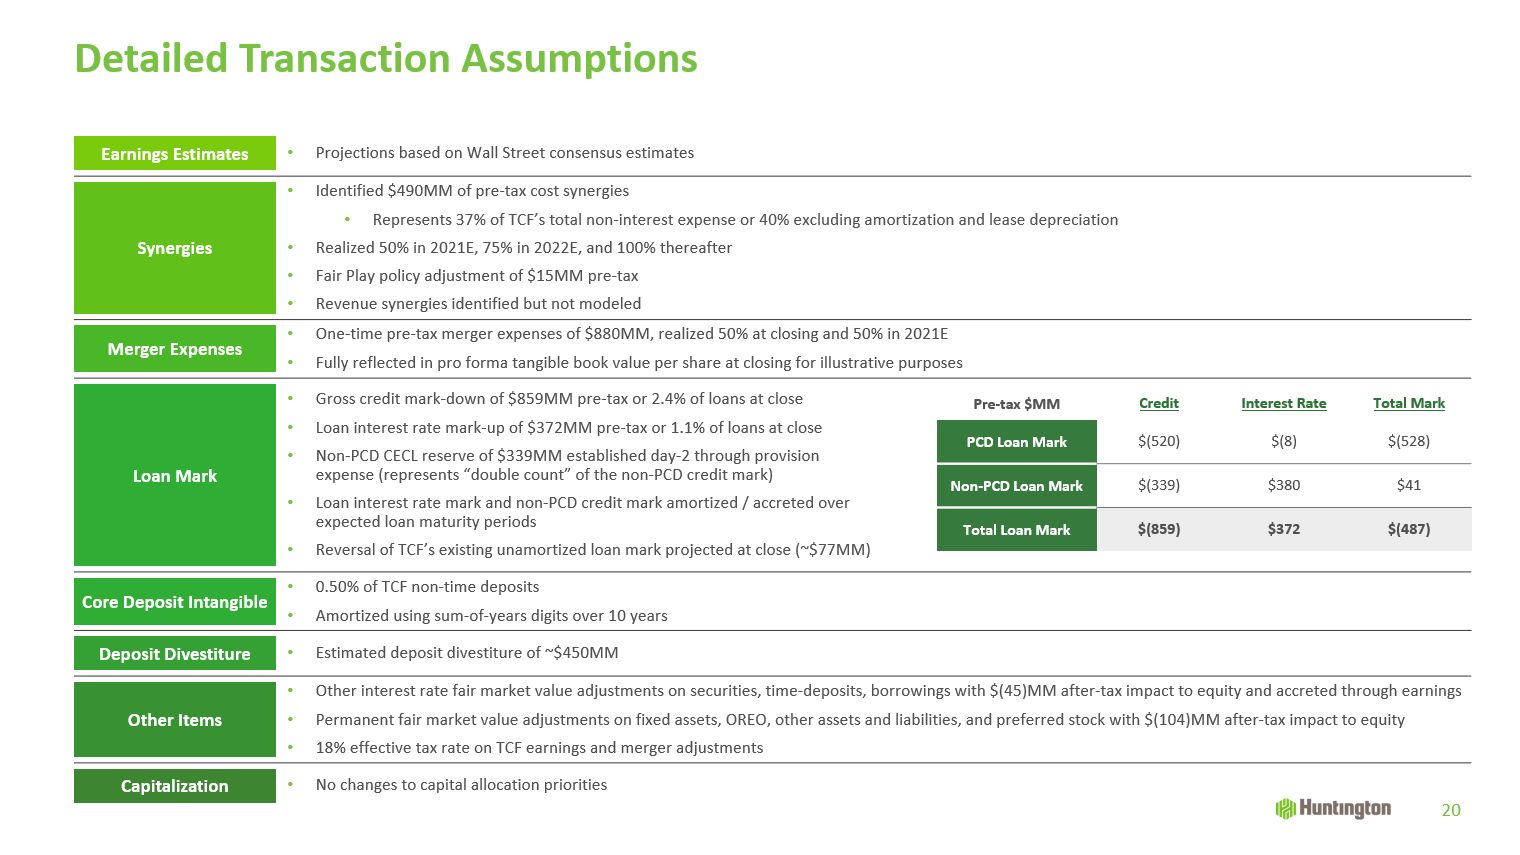
Earnings Estimates Projections based on Wall Street consensus estimates Synergies Identified
$490MM of pre-tax cost synergiesRepresents 37% of TCF’s total non-interest expense or 40% excluding amortization and lease depreciationRealized 50% in 2021E, 75% in 2022E, and 100% thereafterFair Play policy adjustment of $15MM pre-taxRevenue
synergies identified but not modeled Merger Expenses One-time pre-tax merger expenses of $880MM, realized 50% at closing and 50% in 2021EFully reflected in pro forma tangible book value per share at closing for illustrative
purposes Loan Mark Gross credit mark-down of $859MM pre-tax or 2.4% of loans at closeLoan interest rate mark-up of $372MM pre-tax or 1.1% of loans at closeNon-PCD CECL reserve of $339MM established day-2 through provision expense
(represents “double count” of the non-PCD credit mark)Loan interest rate mark and non-PCD credit mark amortized / accreted overexpected loan maturity periods Reversal of TCF’s existing unamortized loan mark projected at close (~$77MM)
Core Deposit Intangible 0.50% of TCF non-time depositsAmortized using sum-of-years digits over 10 years ] Deposit Divestiture Estimated deposit divestiture of ~$450MM Other Items Other interest rate fair market
value adjustments on securities, time-deposits, borrowings with $(45)MM after-tax impact to equity and accreted through earningsPermanent fair market value adjustments on fixed assets, OREO, other assets and liabilities, and preferred stock
with $(104)MM after-tax impact to equity18% effective tax rate on TCF earnings and merger adjustments Capitalization No changes to capital allocation priorities Detailed Transaction Assumptions Pre-tax $MM Credit Interest
Rate Total Mark PCD Loan Mark $(520) $(8) $(528) Non-PCD Loan Mark $(339) $380 $41 Total Loan Mark $(859) $372 $(487) 20
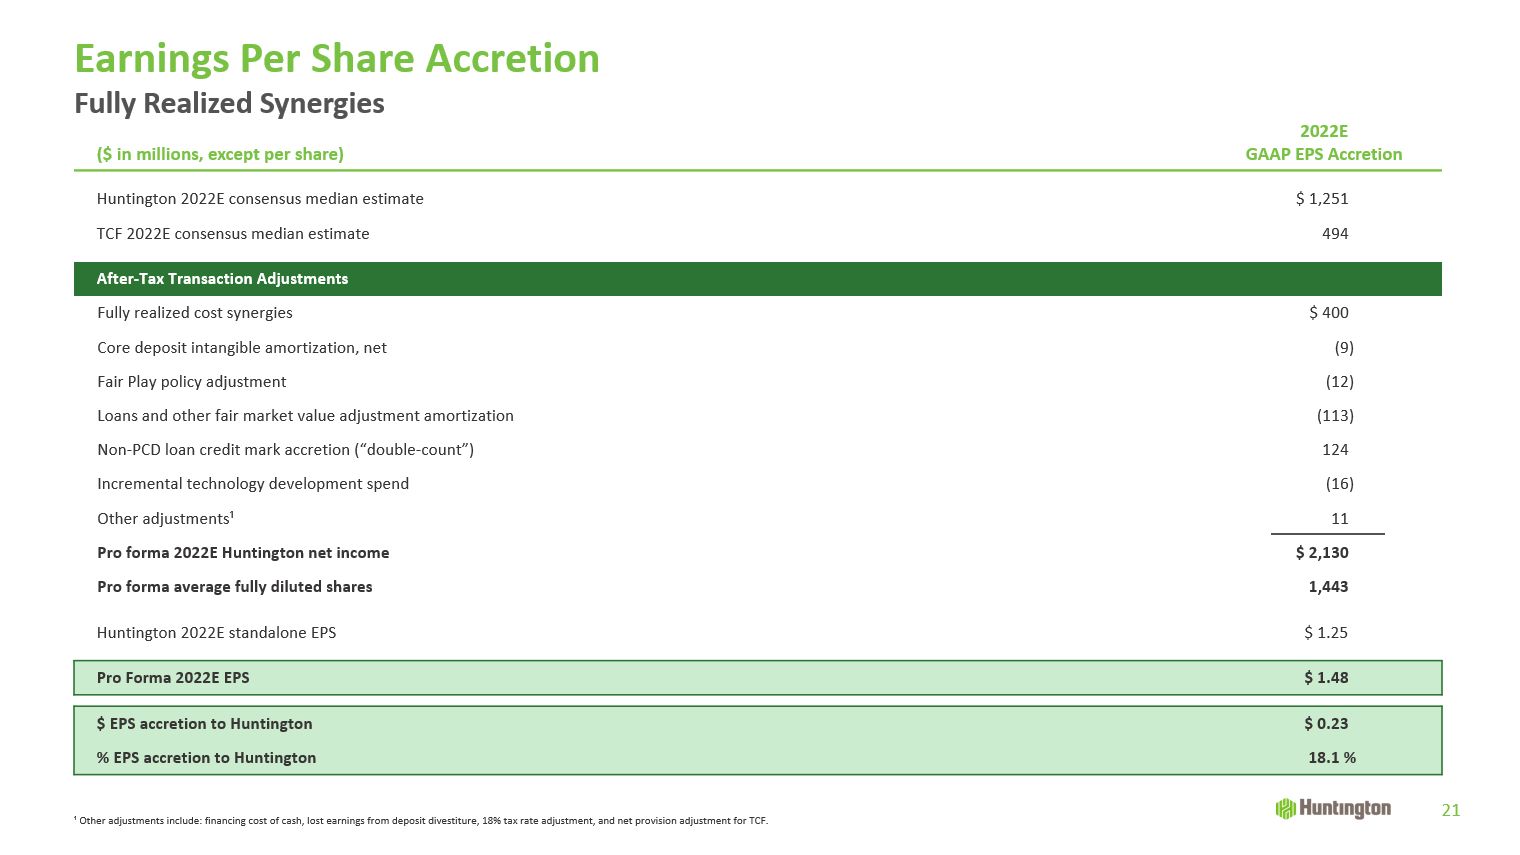
Earnings Per Share Accretion 21 ($ in millions, except per share) 2022EGAAP EPS
Accretion Huntington 2022E consensus median estimate $ 1,251 TCF 2022E consensus median estimate 494 After-Tax Transaction Adjustments Fully realized cost synergies $ 400 Core deposit intangible amortization, net
(9) Fair Play policy adjustment (12) Loans and other fair market value adjustment amortization (113) Non-PCD loan credit mark accretion (“double-count”) 124 Incremental technology development spend (16) Other adjustments¹
11 Pro forma 2022E Huntington net income $ 2,130 Pro forma average fully diluted shares 1,443 Huntington 2022E standalone EPS $ 1.25 Pro Forma 2022E EPS $ 1.48 $ EPS accretion to Huntington $ 0.23 % EPS
accretion to Huntington 18.1 % ¹ Other adjustments include: financing cost of cash, lost earnings from deposit divestiture, 18% tax rate adjustment, and net provision adjustment for TCF. Fully Realized Synergies
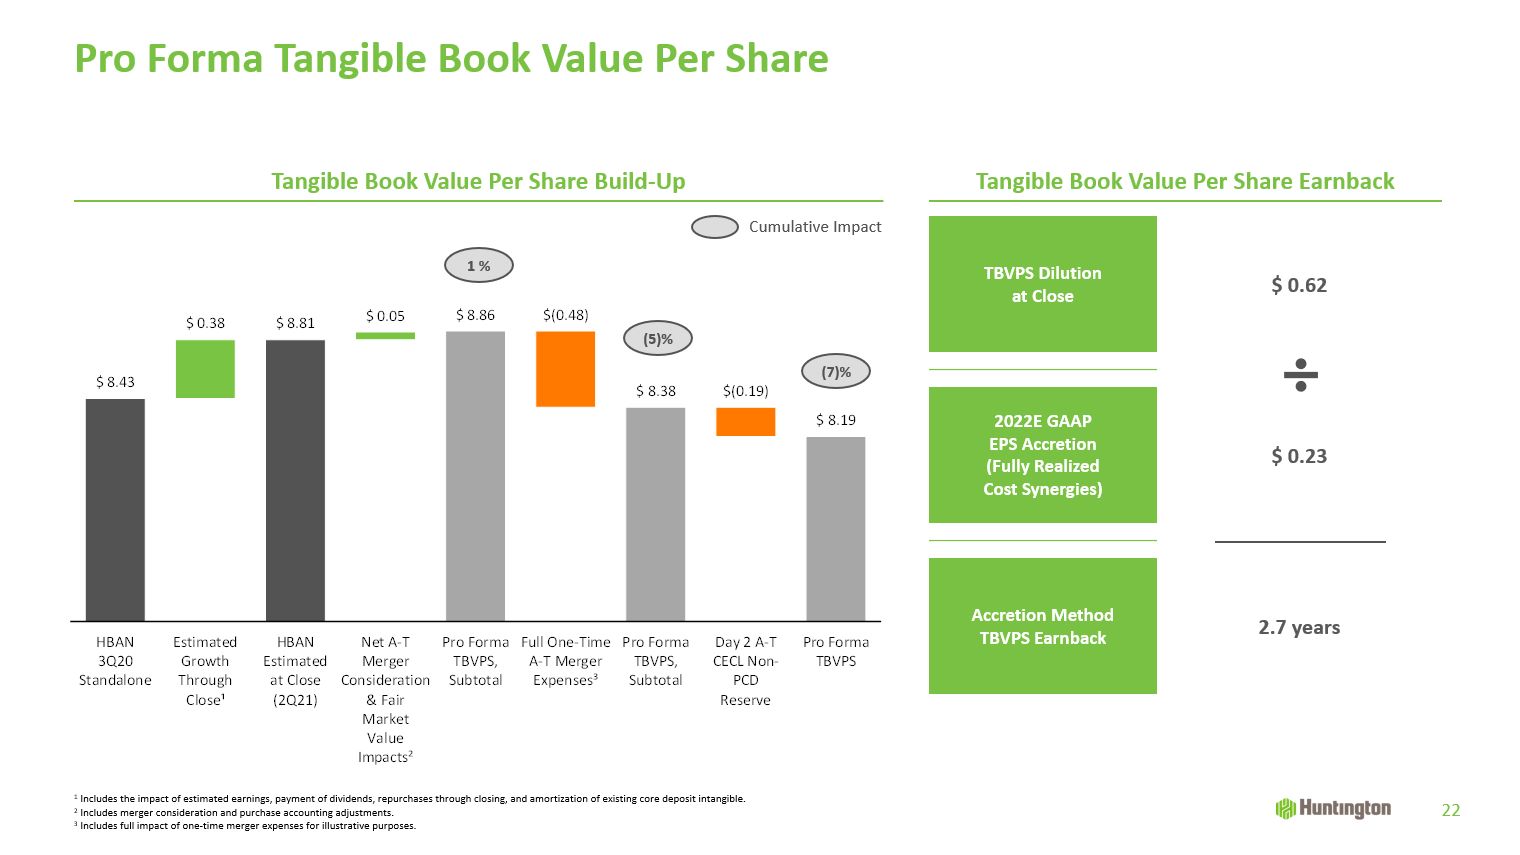
TBVPS Dilutionat Close $ 0.62 2022E GAAPEPS Accretion(Fully RealizedCost Synergies) $
0.23 Accretion MethodTBVPS Earnback 2.7 years Tangible Book Value Per Share Build-Up Pro Forma Tangible Book Value Per Share 22 1 Includes the impact of estimated earnings, payment of dividends, repurchases through closing,
and amortization of existing core deposit intangible.2 Includes merger consideration and purchase accounting adjustments.3 Includes full impact of one-time merger expenses for illustrative purposes. Tangible Book Value Per Share Earnback 1
% (5)% (7)% Cumulative Impact
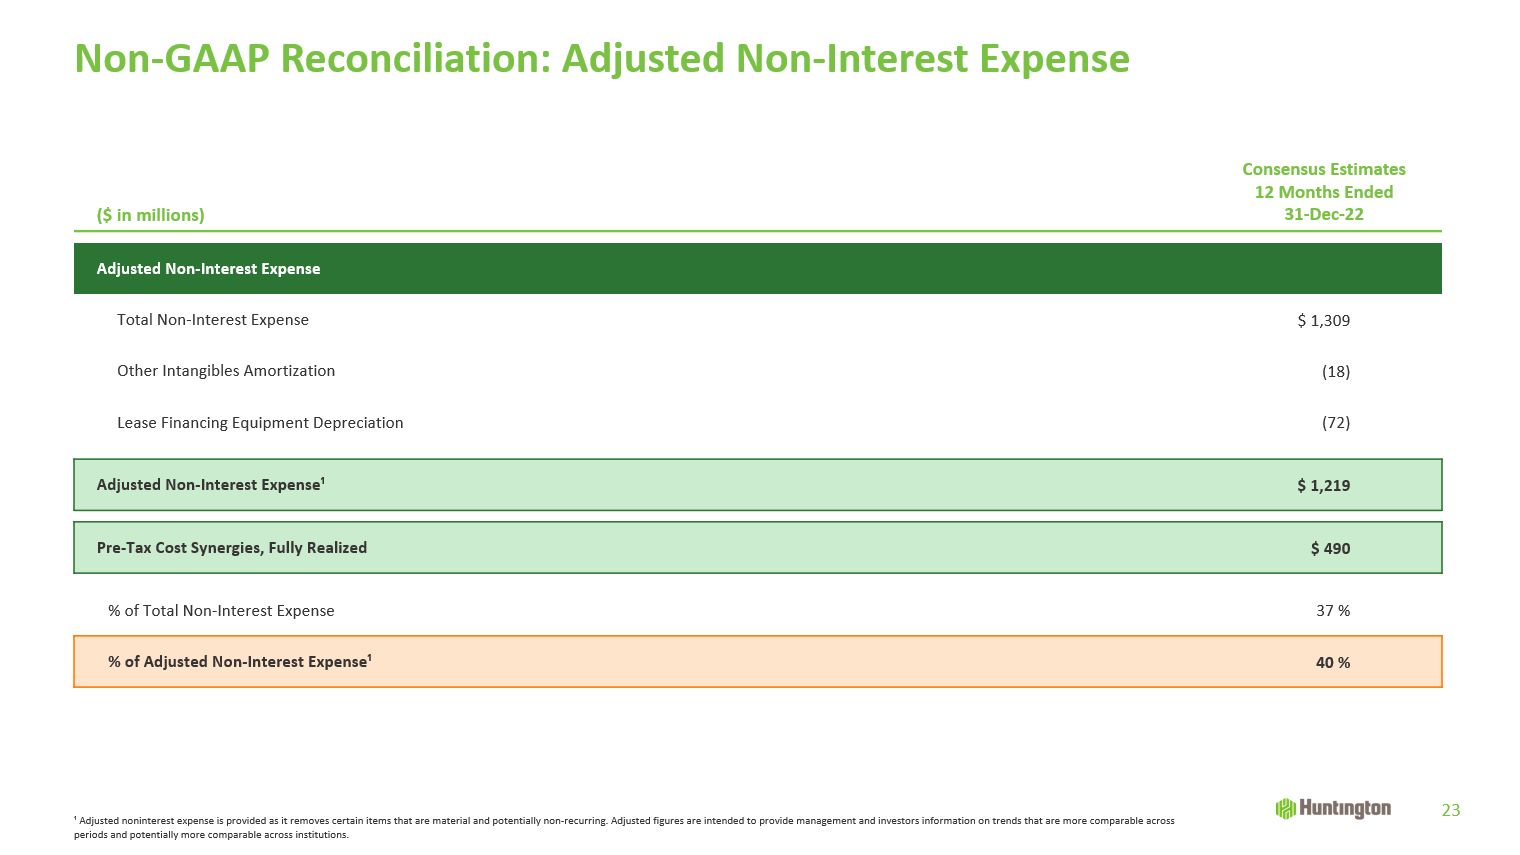
Non-GAAP Reconciliation: Adjusted Non-Interest Expense 23 ($ in millions) Consensus Estimates12
Months Ended31-Dec-22 Adjusted Non-Interest Expense Total Non-Interest Expense $ 1,309 Other Intangibles Amortization (18) Lease Financing Equipment Depreciation (72) Adjusted Non-Interest Expense¹ $ 1,219
Pre-Tax Cost Synergies, Fully Realized $ 490 % of Total Non-Interest Expense 37 % % of Adjusted Non-Interest Expense¹ 40 % ¹ Adjusted noninterest expense is provided as it removes certain items that are material and potentially
non-recurring. Adjusted figures are intended to provide management and investors information on trends that are more comparable across periods and potentially more comparable across institutions.