Attached files
| file | filename |
|---|---|
| 8-K - 8-K - BIO-RAD LABORATORIES, INC. | d28972d8k.htm |
| EX-99.2 - EX-99.2 - BIO-RAD LABORATORIES, INC. | d28972dex992.htm |

Exhibit 99.1 OUTLOOK: 2021 – 2023 Bio-Rad Laboratories, Inc. December 10, 2020 © 2020 Bio-Rad Laboratories, Inc. All rights reserved.Exhibit 99.1 OUTLOOK: 2021 – 2023 Bio-Rad Laboratories, Inc. December 10, 2020 © 2020 Bio-Rad Laboratories, Inc. All rights reserved.

FORWARD-LOOKING STATEMENTS & USE OF NON-GAAP REPORTING Forward-looking Statements. Some statements in this presentation may be forward-looking statements within the meaning of the Private Securities Litigation Reform Act of 1995, including, without limitation, statements regarding management’s goals, plans, and expectations, our future financial performance, investment in high-growth, emerging markets, new products and technologies, and other matters. Forward- looking statements generally can be identified by the use of forward-looking terminology such as, “anticipate,” “believe,” “expect,” “assume,” “continue,” “may,” “will,” “intend,” “estimate,” or similar expressions or the negative of those terms or expressions, although not all forward-looking statements contain these words. These statements are based on assumptions and expectations of future events that are subject to risks and uncertainties. Included in these forward-looking statements are statements regarding the impact of the COVID-19 pandemic on Bio-Rad’s results and operations and steps Bio-Rad is taking in response to the pandemic. Our actual results may differ materially from these plans and expectations, and the impact and duration of the COVID-19 pandemic is unknown. We cannot be certain that Bio-Rad’s responses to the pandemic will be successful, that the demand for Bio-Rad’s COVID-19 related products is sustainable, or that Bio-Rad will be able to meet this demand. Undue reliance should not placed on these forward-looking statements, and it is encouraged to review our SEC filings, where the risk factors in our business are discussed, in detail. The forward-looking statements contained in this presentation reflect our views and assumptions only as of the date of this presentation. The company does not undertake any obligation to publicly update any forward-looking statements nor does the company intend to update any forward-looking statements made in this presentation. Use of Non-GAAP Reporting and Currency-Neutral. In addition to the financial measures prepared in accordance with generally accepted accounting principles (GAAP), we use certain non-GAAP financial measures, including non-GAAP gross margin, non-GAAP adjusted EBITDA, and non-GAAP EPS, which exclude amortization of acquisition-related intangible assets, certain acquisition-related expenses and benefits, restructuring charges, asset impairment charges, valuation changes of equity-owned securities, gains and losses on equity-method investments, and significant legal-related charges or benefits and associated legal costs. Non-GAAP gross margin, non-GAAP adjusted EBITDA, and non-GAAP EPS also exclude certain other gains and losses that are either isolated or cannot be expected to occur again with any predictability, tax provisions/benefits related to the previous items, and significant discrete tax events. We exclude the above items because they are outside of our normal operations and/or, in certain cases, are difficult to forecast accurately for future periods. We utilize a number of different financial measures, both GAAP and non-GAAP, in analyzing and assessing the overall performance of our business, in making operating decisions, forecasting and planning for future periods, and determining payments under compensation programs. We consider the use of the non-GAAP measures to be helpful in assessing the performance of the ongoing operation of our business. We believe that disclosing non-GAAP financial measures provides useful supplemental data that, while not a substitute for financial measures prepared in accordance with GAAP, allows for greater transparency in the review of our financial and operational performance. We also believe that disclosing non-GAAP financial measures provides useful information to investors and others in understanding and evaluating our operating results and future prospects in the same manner as management and in comparing financial results across accounting periods and to those of peer companies. More specifically, management adjusts for the excluded items for the following reasons: Amortization of purchased intangible assets: we do not acquire businesses and assets on a predictable cycle. The amount of purchase price allocated to purchased intangible assets and the term of amortization can vary significantly and are unique to each acquisition or purchase. We believe that excluding amortization of purchased intangible assets allows the users of our financial statements to better review and understand the historic and current results of our operations, and also facilitates comparisons to peer companies. Acquisition-related expenses and benefits: we incur expenses or benefits with respect to certain items associated with our acquisitions, such as transaction costs, professional fees for assistance with the transaction; valuation or integration costs; changes in the fair value of contingent consideration, gain or loss on settlement of pre-existing relationships with the acquired entity; or adjustments to purchase price. We exclude such expenses or benefits as they are related to acquisitions and have no direct correlation to the operation of our on-going business. Restructuring, impairment charges and valuation changes in equity-owned securities and gains and losses on equity-method investments: we incur restructuring and impairment charges on individual or groups of employed assets and charges and benefits arising from valuation changes in equity-owned securities and gains and losses on equity-method investments, which arise from unforeseen circumstances and/or often occur outside of the ordinary course of our on-going business. Although these events are reflected in our GAAP financials, these unique transactions may limit the comparability of our on-going operations with prior and future periods. Significant litigation charges or benefits and legal costs: we may incur charges or benefits as well as legal costs in connection with litigation and other contingencies unrelated to our core operations. We exclude these charges or benefits, when significant, as well as legal costs associated with significant legal matters, because we do not believe they are reflective of on-going business and operating results. Income tax expense: we estimate the tax effect of the excluded items identified above to determine a non-GAAP annual effective tax rate applied to the pretax amount in order to calculate the non-GAAP provision for income taxes. We also adjust for items for which the nature and/or tax jurisdiction requires the application of a specific tax rate or treatment. From time to time in the future, there may be other items excluded if we believe that doing so is consistent with the goal of providing useful information to investors and management. Percentage sales growth in currency neutral amounts are calculated by translating prior period sales in each local currency using the current period’s monthly average foreign exchange rates for that currency and comparing that to current period sales. There are limitations in using non-GAAP financial measures because the non-GAAP financial measures are not prepared in accordance with generally accepted accounting principles and may be different from non-GAAP financial measures used by other companies. The non-GAAP financial measures are limited in value because they exclude certain items that may have a material impact on our reported financial results. The presentation of this additional information is not meant to be considered in isolation or as a substitute for the directly comparable financial measures prepared in accordance with GAAP in the United States. Non-GAAP adjusted EBITDA includes an annual dividend from our investment in Sartorius AG. Investors should review the reconciliation of the non-GAAP financial measures to their most directly comparable GAAP financial measures as provided in the tables accompanying this presentation. © 2020 Bio-Rad Laboratories, Inc. All rights reserved. 2FORWARD-LOOKING STATEMENTS & USE OF NON-GAAP REPORTING Forward-looking Statements. Some statements in this presentation may be forward-looking statements within the meaning of the Private Securities Litigation Reform Act of 1995, including, without limitation, statements regarding management’s goals, plans, and expectations, our future financial performance, investment in high-growth, emerging markets, new products and technologies, and other matters. Forward- looking statements generally can be identified by the use of forward-looking terminology such as, “anticipate,” “believe,” “expect,” “assume,” “continue,” “may,” “will,” “intend,” “estimate,” or similar expressions or the negative of those terms or expressions, although not all forward-looking statements contain these words. These statements are based on assumptions and expectations of future events that are subject to risks and uncertainties. Included in these forward-looking statements are statements regarding the impact of the COVID-19 pandemic on Bio-Rad’s results and operations and steps Bio-Rad is taking in response to the pandemic. Our actual results may differ materially from these plans and expectations, and the impact and duration of the COVID-19 pandemic is unknown. We cannot be certain that Bio-Rad’s responses to the pandemic will be successful, that the demand for Bio-Rad’s COVID-19 related products is sustainable, or that Bio-Rad will be able to meet this demand. Undue reliance should not placed on these forward-looking statements, and it is encouraged to review our SEC filings, where the risk factors in our business are discussed, in detail. The forward-looking statements contained in this presentation reflect our views and assumptions only as of the date of this presentation. The company does not undertake any obligation to publicly update any forward-looking statements nor does the company intend to update any forward-looking statements made in this presentation. Use of Non-GAAP Reporting and Currency-Neutral. In addition to the financial measures prepared in accordance with generally accepted accounting principles (GAAP), we use certain non-GAAP financial measures, including non-GAAP gross margin, non-GAAP adjusted EBITDA, and non-GAAP EPS, which exclude amortization of acquisition-related intangible assets, certain acquisition-related expenses and benefits, restructuring charges, asset impairment charges, valuation changes of equity-owned securities, gains and losses on equity-method investments, and significant legal-related charges or benefits and associated legal costs. Non-GAAP gross margin, non-GAAP adjusted EBITDA, and non-GAAP EPS also exclude certain other gains and losses that are either isolated or cannot be expected to occur again with any predictability, tax provisions/benefits related to the previous items, and significant discrete tax events. We exclude the above items because they are outside of our normal operations and/or, in certain cases, are difficult to forecast accurately for future periods. We utilize a number of different financial measures, both GAAP and non-GAAP, in analyzing and assessing the overall performance of our business, in making operating decisions, forecasting and planning for future periods, and determining payments under compensation programs. We consider the use of the non-GAAP measures to be helpful in assessing the performance of the ongoing operation of our business. We believe that disclosing non-GAAP financial measures provides useful supplemental data that, while not a substitute for financial measures prepared in accordance with GAAP, allows for greater transparency in the review of our financial and operational performance. We also believe that disclosing non-GAAP financial measures provides useful information to investors and others in understanding and evaluating our operating results and future prospects in the same manner as management and in comparing financial results across accounting periods and to those of peer companies. More specifically, management adjusts for the excluded items for the following reasons: Amortization of purchased intangible assets: we do not acquire businesses and assets on a predictable cycle. The amount of purchase price allocated to purchased intangible assets and the term of amortization can vary significantly and are unique to each acquisition or purchase. We believe that excluding amortization of purchased intangible assets allows the users of our financial statements to better review and understand the historic and current results of our operations, and also facilitates comparisons to peer companies. Acquisition-related expenses and benefits: we incur expenses or benefits with respect to certain items associated with our acquisitions, such as transaction costs, professional fees for assistance with the transaction; valuation or integration costs; changes in the fair value of contingent consideration, gain or loss on settlement of pre-existing relationships with the acquired entity; or adjustments to purchase price. We exclude such expenses or benefits as they are related to acquisitions and have no direct correlation to the operation of our on-going business. Restructuring, impairment charges and valuation changes in equity-owned securities and gains and losses on equity-method investments: we incur restructuring and impairment charges on individual or groups of employed assets and charges and benefits arising from valuation changes in equity-owned securities and gains and losses on equity-method investments, which arise from unforeseen circumstances and/or often occur outside of the ordinary course of our on-going business. Although these events are reflected in our GAAP financials, these unique transactions may limit the comparability of our on-going operations with prior and future periods. Significant litigation charges or benefits and legal costs: we may incur charges or benefits as well as legal costs in connection with litigation and other contingencies unrelated to our core operations. We exclude these charges or benefits, when significant, as well as legal costs associated with significant legal matters, because we do not believe they are reflective of on-going business and operating results. Income tax expense: we estimate the tax effect of the excluded items identified above to determine a non-GAAP annual effective tax rate applied to the pretax amount in order to calculate the non-GAAP provision for income taxes. We also adjust for items for which the nature and/or tax jurisdiction requires the application of a specific tax rate or treatment. From time to time in the future, there may be other items excluded if we believe that doing so is consistent with the goal of providing useful information to investors and management. Percentage sales growth in currency neutral amounts are calculated by translating prior period sales in each local currency using the current period’s monthly average foreign exchange rates for that currency and comparing that to current period sales. There are limitations in using non-GAAP financial measures because the non-GAAP financial measures are not prepared in accordance with generally accepted accounting principles and may be different from non-GAAP financial measures used by other companies. The non-GAAP financial measures are limited in value because they exclude certain items that may have a material impact on our reported financial results. The presentation of this additional information is not meant to be considered in isolation or as a substitute for the directly comparable financial measures prepared in accordance with GAAP in the United States. Non-GAAP adjusted EBITDA includes an annual dividend from our investment in Sartorius AG. Investors should review the reconciliation of the non-GAAP financial measures to their most directly comparable GAAP financial measures as provided in the tables accompanying this presentation. © 2020 Bio-Rad Laboratories, Inc. All rights reserved. 2

PROGRESS SINCE OUR LAST INVESTOR DAY 21.3% $2.45B Performance driven by: Cell biology markets 17.5% ddPCR™ products $2.31B $2.29B 16.2% Biopharma focus 15.2% Clinical diagnostics $2.16B Global ERP implementation Operating discipline * * 2017 2018 2019 2020 2017 2018 2019 2020 ** Reported Sales Adjusted EBITDA Margin *Assumes mid-point of 2020 guidance (provided on Oct 29, 2020) and includes COVID-19 related product sales of ~$235m **Non-GAAP adjusted EBITDA Margin includes an annual dividend from our investment in Sartorius AG © 2020 Bio-Rad Laboratories, Inc. All rights reserved. 3PROGRESS SINCE OUR LAST INVESTOR DAY 21.3% $2.45B Performance driven by: Cell biology markets 17.5% ddPCR™ products $2.31B $2.29B 16.2% Biopharma focus 15.2% Clinical diagnostics $2.16B Global ERP implementation Operating discipline * * 2017 2018 2019 2020 2017 2018 2019 2020 ** Reported Sales Adjusted EBITDA Margin *Assumes mid-point of 2020 guidance (provided on Oct 29, 2020) and includes COVID-19 related product sales of ~$235m **Non-GAAP adjusted EBITDA Margin includes an annual dividend from our investment in Sartorius AG © 2020 Bio-Rad Laboratories, Inc. All rights reserved. 3

TOTAL SHAREHOLDER RETURN 250 125% BIO 190 Equity performance, indexed to 100 (Jan 2018 to Dec 2020) S&P 500 36% S&P 500 130 35% HC 70 Jan 2018 Jun 2018 Nov 2018 Apr 2019 Sep 2019 Feb 2020 Jul 2020 Dec 2020 BIO S&P 500 S&P 500 HC Source: Bloomberg and Yahoo! Finance from Jan 2, 2018 to Dec 9, 2020 © 2020 Bio-Rad Laboratories, Inc. All rights reserved. 4TOTAL SHAREHOLDER RETURN 250 125% BIO 190 Equity performance, indexed to 100 (Jan 2018 to Dec 2020) S&P 500 36% S&P 500 130 35% HC 70 Jan 2018 Jun 2018 Nov 2018 Apr 2019 Sep 2019 Feb 2020 Jul 2020 Dec 2020 BIO S&P 500 S&P 500 HC Source: Bloomberg and Yahoo! Finance from Jan 2, 2018 to Dec 9, 2020 © 2020 Bio-Rad Laboratories, Inc. All rights reserved. 4
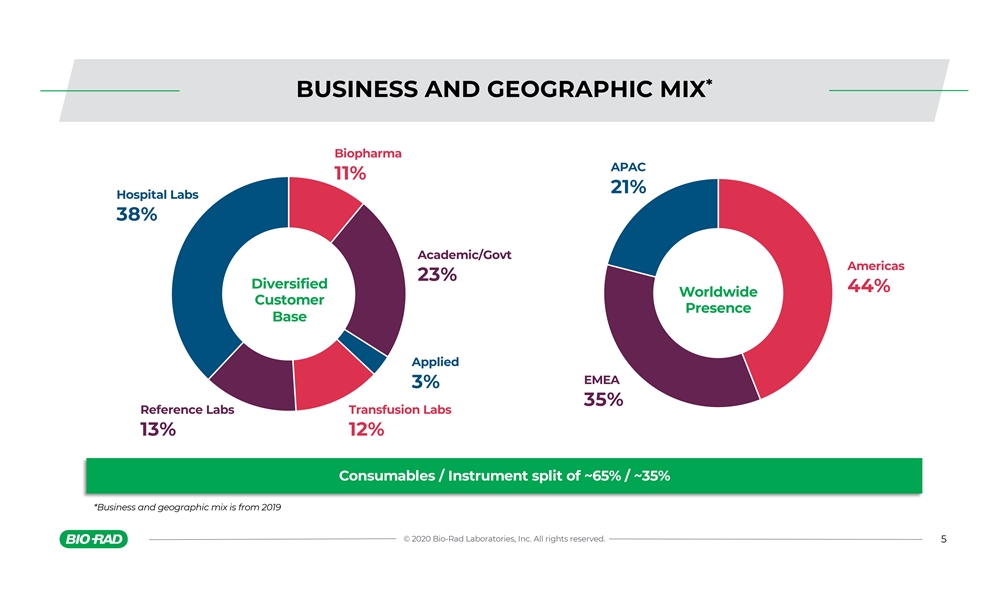
* BUSINESS AND GEOGRAPHIC MIX Biopharma APAC 11% 21% Hospital Labs 38% Academic/Govt Americas 23% Diversified 44% Worldwide Customer Presence Base Applied EMEA 3% 35% Reference Labs Transfusion Labs 13% 12% Consumables / Instrument split of ~65% / ~35% *Business and geographic mix is from 2019 © 2020 Bio-Rad Laboratories, Inc. All rights reserved. 5* BUSINESS AND GEOGRAPHIC MIX Biopharma APAC 11% 21% Hospital Labs 38% Academic/Govt Americas 23% Diversified 44% Worldwide Customer Presence Base Applied EMEA 3% 35% Reference Labs Transfusion Labs 13% 12% Consumables / Instrument split of ~65% / ~35% *Business and geographic mix is from 2019 © 2020 Bio-Rad Laboratories, Inc. All rights reserved. 5

BROAD PORTFOLIO Leading technologies Exciting opportunities Gene expression CFX Opus 96 and 384 qPCR Systems, Sequencing sample prep kits Protein quantitation Maintain leadership and launch of COVID-19 related assays Process media, Pre-packed columns containing Process Scale Resins used for Bioproduction protein purification in the manufacturing of biotherapeutics QXONE and QX200 Platforms, Gene Therapy QC assays, COVID-19 wastewater ddPCR™ opportunity, biopharma focus Scalable, and efficient approach to accurately analyze single cells and Single-cell multiomics: Celsee Genesis System, ZE5 Flow Cytometer Quality controls Grow core quality controls leadership, global and product portfolio expansion IH-500/IH-1000 Automated Blood Typing Platforms with new registrations and Immunohematology geographical expansion Donor screening business growth in the US and COVID-19 product portfolio Infectious diseases expansion D-100 System workflow advantages and total lab automation (TLA) Diabetes monitoring connectivity in HbA1c testing segment Autoimmune Bioplex 2200 menu expansion with COVID-19 assay © 2020 Bio-Rad Laboratories, Inc. All rights reserved. 6BROAD PORTFOLIO Leading technologies Exciting opportunities Gene expression CFX Opus 96 and 384 qPCR Systems, Sequencing sample prep kits Protein quantitation Maintain leadership and launch of COVID-19 related assays Process media, Pre-packed columns containing Process Scale Resins used for Bioproduction protein purification in the manufacturing of biotherapeutics QXONE and QX200 Platforms, Gene Therapy QC assays, COVID-19 wastewater ddPCR™ opportunity, biopharma focus Scalable, and efficient approach to accurately analyze single cells and Single-cell multiomics: Celsee Genesis System, ZE5 Flow Cytometer Quality controls Grow core quality controls leadership, global and product portfolio expansion IH-500/IH-1000 Automated Blood Typing Platforms with new registrations and Immunohematology geographical expansion Donor screening business growth in the US and COVID-19 product portfolio Infectious diseases expansion D-100 System workflow advantages and total lab automation (TLA) Diabetes monitoring connectivity in HbA1c testing segment Autoimmune Bioplex 2200 menu expansion with COVID-19 assay © 2020 Bio-Rad Laboratories, Inc. All rights reserved. 6

DRIVING GROWTH & MARGIN EXPANSION * 2020 2023 Drivers ddPCR™, single-cell, clinical diagnostics, ** $2.45 – $2.46B $2.75 – $2.85B Sales bioproduction, biopharma focus 56.5% – 57.0% 57.0% – 57.5% Gross margin Footprint optimization and better capacity utilization Adjusted *** 21.0% – 21.5% 23% – 24% SG&A leverage and productivity improvements EBITDA margin We aim to deliver EPS growth above that of sales growth *Our 2020 guidance, provided on Oct 29, 2020 **$2.45-$2.46B implied from 5.9% to 6.3% currency-neutral sales growth for 2020 and assumes a projected benefit from COVID-19 related product sales of ~$235m ***Assumes an exit run-rate of 20% adjusted EBITDA margin excluding the related COVID-19 impact ALL NUMBERS ON THIS SLIDE ARE NON-GAAP and Adjusted EBITDA margin includes an annual dividend from our investment in Sartorius AG © 2020 Bio-Rad Laboratories, Inc. All rights reserved. 7DRIVING GROWTH & MARGIN EXPANSION * 2020 2023 Drivers ddPCR™, single-cell, clinical diagnostics, ** $2.45 – $2.46B $2.75 – $2.85B Sales bioproduction, biopharma focus 56.5% – 57.0% 57.0% – 57.5% Gross margin Footprint optimization and better capacity utilization Adjusted *** 21.0% – 21.5% 23% – 24% SG&A leverage and productivity improvements EBITDA margin We aim to deliver EPS growth above that of sales growth *Our 2020 guidance, provided on Oct 29, 2020 **$2.45-$2.46B implied from 5.9% to 6.3% currency-neutral sales growth for 2020 and assumes a projected benefit from COVID-19 related product sales of ~$235m ***Assumes an exit run-rate of 20% adjusted EBITDA margin excluding the related COVID-19 impact ALL NUMBERS ON THIS SLIDE ARE NON-GAAP and Adjusted EBITDA margin includes an annual dividend from our investment in Sartorius AG © 2020 Bio-Rad Laboratories, Inc. All rights reserved. 7

OUTLOOK ASSUMPTIONS ü Stable pricing and macro-environment ü Current foreign exchange rates ü Risk-adjusted revenues from high-growth and emerging markets ü Continued market expansion with ddPCR™ and single-cell products ü Adjusted financial results, excluding special items and any M&A © 2020 Bio-Rad Laboratories, Inc. All rights reserved. 8OUTLOOK ASSUMPTIONS ü Stable pricing and macro-environment ü Current foreign exchange rates ü Risk-adjusted revenues from high-growth and emerging markets ü Continued market expansion with ddPCR™ and single-cell products ü Adjusted financial results, excluding special items and any M&A © 2020 Bio-Rad Laboratories, Inc. All rights reserved. 8

ELEVATING OUR SUSTAINABILTY POSITION Sustainability program objectives: SOCIAL CAPITAL ü Enhance long-term value for all stakeholders involved – employees, customers, Product Selling Practices & suppliers, investors, competitors, and the environment Access & Affordability Quality & Safety Product Labeling ü Develop strong positioning and proactive messaging of our Corporate Social LEADERSHIP & BUSINESS MODEL & INNOVATION Responsibility (CSR) & Environmental, Social, and Corporate Governance (ESG) GOVERNANCE values and goals Product Design Supply Chain Business Ethics & Lifecycle Management ü Challenge our teams to innovate with a mindset of sustainability Management ü Promote initiatives related to diversity, inclusion, and employee engagement Examples of our commitment in action: ü Improvement at supplier level packaging for small disposables shipped to Bio- Rad, resulting in increased units shipped per carton ü Decommissioning & replacement of older high energy use equipment/facilities with LED lighting, Photovoltaic, and Fuel Cell electrical generation capabilities ü Improving manufacturing processes to reduce ongoing water consumption ü Working with R&D to find suitable alternatives to replace some of our plastics We are focusing our efforts in the areas where we ü Reuse of industrial water for chillers reducing wastewater output can make the most significant impact © 2020 Bio-Rad Laboratories, Inc. All rights reserved. 9ELEVATING OUR SUSTAINABILTY POSITION Sustainability program objectives: SOCIAL CAPITAL ü Enhance long-term value for all stakeholders involved – employees, customers, Product Selling Practices & suppliers, investors, competitors, and the environment Access & Affordability Quality & Safety Product Labeling ü Develop strong positioning and proactive messaging of our Corporate Social LEADERSHIP & BUSINESS MODEL & INNOVATION Responsibility (CSR) & Environmental, Social, and Corporate Governance (ESG) GOVERNANCE values and goals Product Design Supply Chain Business Ethics & Lifecycle Management ü Challenge our teams to innovate with a mindset of sustainability Management ü Promote initiatives related to diversity, inclusion, and employee engagement Examples of our commitment in action: ü Improvement at supplier level packaging for small disposables shipped to Bio- Rad, resulting in increased units shipped per carton ü Decommissioning & replacement of older high energy use equipment/facilities with LED lighting, Photovoltaic, and Fuel Cell electrical generation capabilities ü Improving manufacturing processes to reduce ongoing water consumption ü Working with R&D to find suitable alternatives to replace some of our plastics We are focusing our efforts in the areas where we ü Reuse of industrial water for chillers reducing wastewater output can make the most significant impact © 2020 Bio-Rad Laboratories, Inc. All rights reserved. 9

Appendix © 2020 Bio-Rad Laboratories, Inc. All rights reserved.Appendix © 2020 Bio-Rad Laboratories, Inc. All rights reserved.

RECONCILIATION TO NON-GAAP Year Ended % of Year Ended % of Year Ended % of December 31, reported December 31, reported December 31, reported ($ and numbers in thousands) 2017 sales 2018 sales 2019 sales Reported Sales $ 2, 160,153 $ 2, 289,415 $ 2, 311,659 GAAP income (loss) from operations $ 119,250 5.5% $ (1 03,341) (4.5%) $ 229, 661 9.9% Amortization of purchased intangibles 29,869 26, 195 23, 153 Legal matters (6,738) 23, 352 6,841 Acquisition related (benefits) costs 9, 890 (2 ,989) (1 0,611) Restructuring costs 34, 368 8, 379 29, 469 Goodwill and long-lived assets impairment 11,506 292,513 - Non-GAAP income from operations $ 198, 145 9.2% $ 244, 109 10.7% $ 278, 513 12.0% Dividend from Sartorius AG 10, 861 14,029 15, 690 Depreciation and amortization 118, 813 111, 893 111,085 Non-GAAP adjusted EBITDA $ 327,819 15.2% $ 370,031 16.2% $ 405, 288 17.5% © 2020 Bio-Rad Laboratories, Inc. All rights reserved. 11RECONCILIATION TO NON-GAAP Year Ended % of Year Ended % of Year Ended % of December 31, reported December 31, reported December 31, reported ($ and numbers in thousands) 2017 sales 2018 sales 2019 sales Reported Sales $ 2, 160,153 $ 2, 289,415 $ 2, 311,659 GAAP income (loss) from operations $ 119,250 5.5% $ (1 03,341) (4.5%) $ 229, 661 9.9% Amortization of purchased intangibles 29,869 26, 195 23, 153 Legal matters (6,738) 23, 352 6,841 Acquisition related (benefits) costs 9, 890 (2 ,989) (1 0,611) Restructuring costs 34, 368 8, 379 29, 469 Goodwill and long-lived assets impairment 11,506 292,513 - Non-GAAP income from operations $ 198, 145 9.2% $ 244, 109 10.7% $ 278, 513 12.0% Dividend from Sartorius AG 10, 861 14,029 15, 690 Depreciation and amortization 118, 813 111, 893 111,085 Non-GAAP adjusted EBITDA $ 327,819 15.2% $ 370,031 16.2% $ 405, 288 17.5% © 2020 Bio-Rad Laboratories, Inc. All rights reserved. 11

© © 2 20 02 20 0 B Bi io o- -Ra Rad d L La abo bor ra at to or ri ie es s,, I In nc c.. A Al ll l r ri ig gh ht ts s r re es se er rv ve ed. d.© © 2 20 02 20 0 B Bi io o- -Ra Rad d L La abo bor ra at to or ri ie es s,, I In nc c.. A Al ll l r ri ig gh ht ts s r re es se er rv ve ed. d.